
Exhibit 99.1

This presentation includes certain financial measures that have not been prepared in a manner that complies with generally accepted accounting principles in the United States (“GAAP”), including EBITDA, Adjusted EBITDA, Pro Forma Net Revenue, Free Cash Flow, Station Operating Income and Pro Forma Station Operating Income (collectively, the “non-GAAP financial measures”). In addition, this presentation includes certain calculations provided for under the financial maintenance covenants contained in the Company’s senior credit facility. These non-GAAP financial measures are not measures of financial performance in accordance with GAAP and may exclude items that are significant in understanding and assessing the Company’s financial results. Therefore, these measures should not be considered in isolation or as an alternative to net income from operations, net revenue, cash flows from operations, earnings per fully-diluted share or other measures of profitability, liquidity or performance under GAAP. Management believes that these non-GAAP financial measures provide meaningful information to investors because they provide insight into how effectively we operate our business. You should be aware that these non-GAAP financial measures may not be comparable to similarly-titled measures used by other companies. See the Appendix for a reconciliation of each of the non-GAAP financial measures to the most directly comparable financial measure calculated and presented in accordance with GAAP. Statements in this presentation that are “forward-looking statements” are based upon current expectations and assumptions, and involve certain risks and uncertainties within the meaning of the U.S. Private Securities Litigation Reform Act of 1995. Words or expressions such as “believe,” “plan,” “intends,” “expects,” “expected,” “anticipates” or variations of such words and similar expressions are intended to identify such forward-looking statements. Key risks are described in our reports filed with the SEC including in our annual report on Form 10-K and quarterly reports on Form 10-Q. Readers should note that forward-looking statements are subject to change and to inherit risks and uncertainties and may be impacted by several facts including: external economic forces that could have a material adverse impact on our advertising revenues and results of operations; the ability of our radio stations to compete effectively in their respective markets for advertising revenues; our ability to respond to changes in technology, standards and services that affect the radio industry; audience acceptance of our content, particularly our radio programs; our substantial debt levels and the potential effect of restrictive debt covenants on our operational flexibility and ability to pay dividends; our dependence on federally issued licenses subject to extensive federal regulation; the risk that our FCC broadcasting licenses and/or goodwill could become impaired; the failure or destruction of the internet, satellite systems and transmitter facilities that we depend upon to distribute its programming; disruptions or security breaches of our information technology infrastructure; actions by the FCC or new legislation affecting the radio industry; the loss of key personnel; the fact that we are controlled by the Beasley family, which creates difficulties for any attempt to gain control of us; the effect of future sales of Class A common stock by the Beasley family or the former stockholders of Greater Media; and other economic, business, competitive, and regulatory factors affecting our businesses. Our actual performance and results could differ materially because of these factors and other factors discussed in the “Management’s Discussion and Analysis of Results of Operations and Financial Condition” in our SEC filings, including but not limited to our annual reports on Form 10-K or quarterly reports on Form 10-Q, copies of which can be obtained from the SEC, www.sec.gov, or our website, www.bbgi.com. All information in this presentation is as of February 28, 2018, and we undertake no obligation to update the information contained herein to actual results or changes to our expectations. FORWARD-LOOKING STATEMENTS AND NON-GAAP FINANCIAL MEASURES
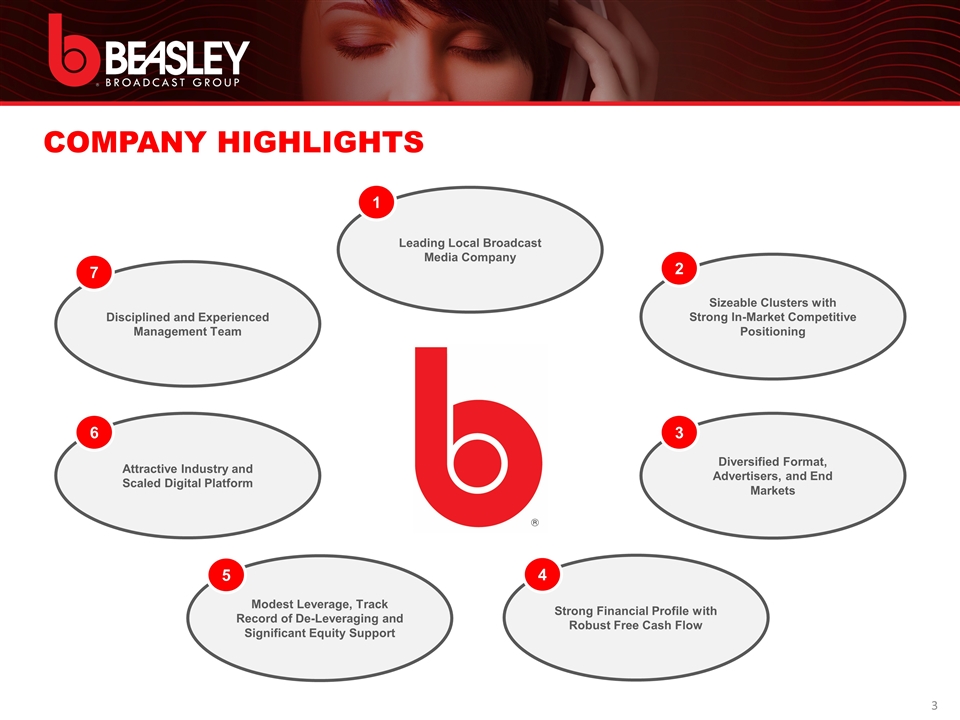
COMPANY HIGHLIGHTS Disciplined and Experienced Management Team 7 Leading Local Broadcast Media Company 1 Attractive Industry and Scaled Digital Platform 6 Diversified Format, Advertisers, and End Markets 3 Sizeable Clusters with Strong In-Market Competitive Positioning 2 Modest Leverage, Track Record of De-Leveraging and Significant Equity Support 5 Strong Financial Profile with Robust Free Cash Flow 4
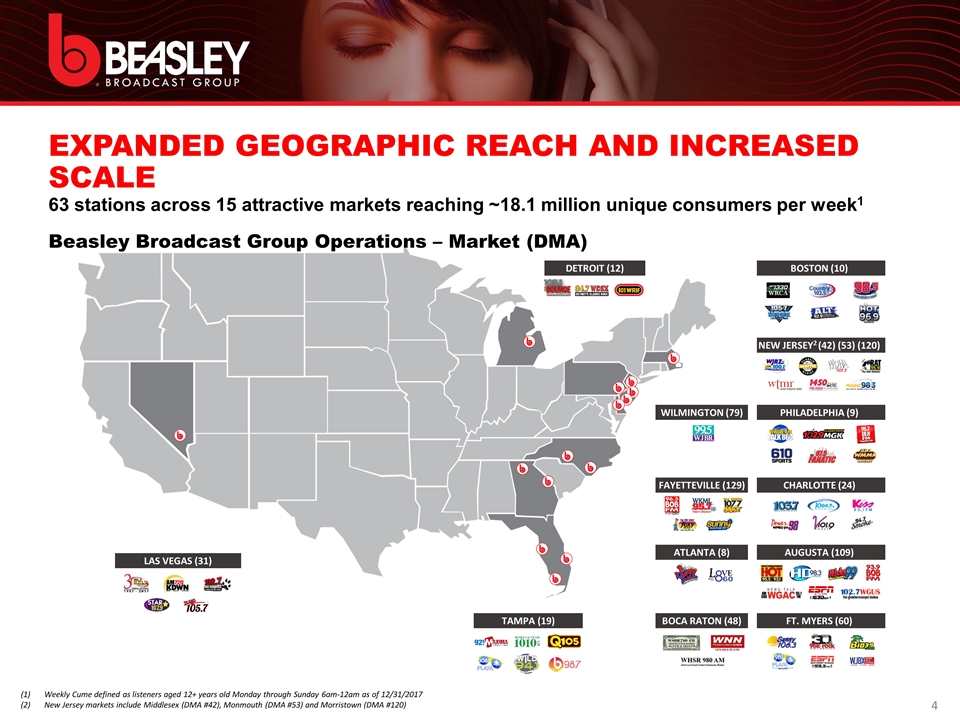
EXPANDED GEOGRAPHIC REACH AND INCREASED SCALE 63 stations across 15 attractive markets reaching ~18.1 million unique consumers per week1 ATLANTA (8) AUGUSTA (109) BOCA RATON (48) BOSTON (10) CHARLOTTE (24) FAYETTEVILLE (129) DETROIT (12) FT. MYERS (60) LAS VEGAS (31) NEW JERSEY2 (42) (53) (120) WILMINGTON (79) PHILADELPHIA (9) TAMPA (19) Weekly Cume defined as listeners aged 12+ years old Monday through Sunday 6am-12am as of 12/31/2017 New Jersey markets include Middlesex (DMA #42), Monmouth (DMA #53) and Morristown (DMA #120) Beasley Broadcast Group Operations – Market (DMA)
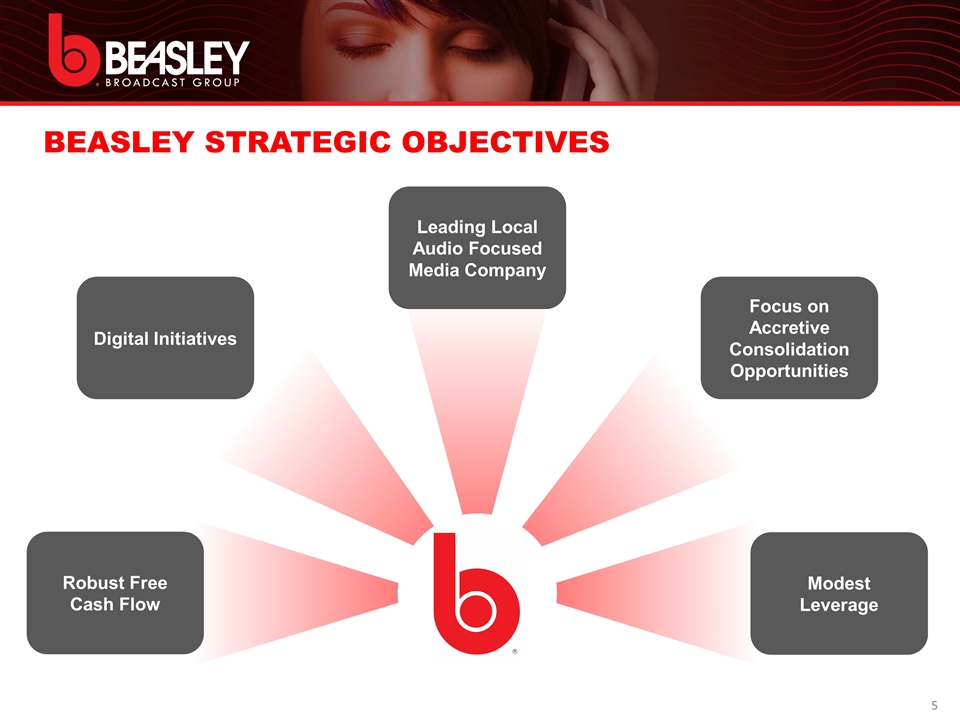
BEASLEY STRATEGIC OBJECTIVES Robust Free Cash Flow Digital Initiatives Modest Leverage Focus on Accretive Consolidation Opportunities Leading Local Audio Focused Media Company
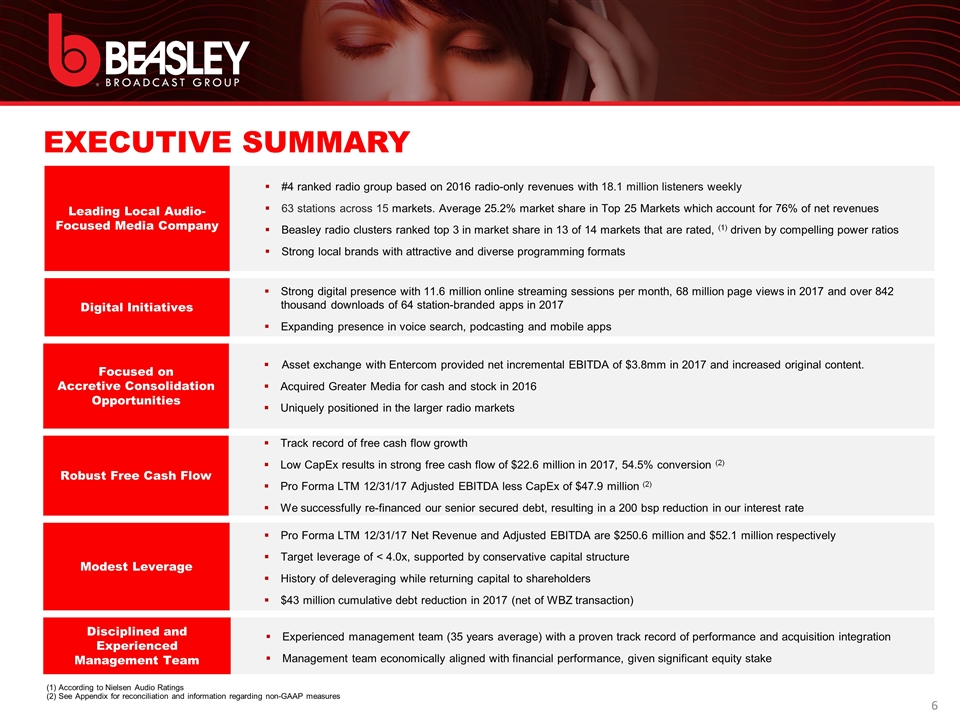
EXECUTIVE SUMMARY Leading Local Audio-Focused Media Company #4 ranked radio group based on 2016 radio-only revenues with 18.1 million listeners weekly 63 stations across 15 markets. Average 25.2% market share in Top 25 Markets which account for 76% of net revenues Beasley radio clusters ranked top 3 in market share in 13 of 14 markets that are rated, (1) driven by compelling power ratios Strong local brands with attractive and diverse programming formats Focused on Accretive Consolidation Opportunities Asset exchange with Entercom provided net incremental EBITDA of $3.8mm in 2017 and increased original content. Acquired Greater Media for cash and stock in 2016 Uniquely positioned in the larger radio markets Robust Free Cash Flow Track record of free cash flow growth Low CapEx results in strong free cash flow of $22.6 million in 2017, 54.5% conversion (2) Pro Forma LTM 12/31/17 Adjusted EBITDA less CapEx of $47.9 million (2) We successfully re-financed our senior secured debt, resulting in a 200 bsp reduction in our interest rate Modest Leverage Pro Forma LTM 12/31/17 Net Revenue and Adjusted EBITDA are $250.6 million and $52.1 million respectively Target leverage of < 4.0x, supported by conservative capital structure History of deleveraging while returning capital to shareholders $43 million cumulative debt reduction in 2017 (net of WBZ transaction) Disciplined and Experienced Management Team Experienced management team (35 years average) with a proven track record of performance and acquisition integration Management team economically aligned with financial performance, given significant equity stake Digital Initiatives Strong digital presence with 11.6 million online streaming sessions per month, 68 million page views in 2017 and over 842 thousand downloads of 64 station-branded apps in 2017 Expanding presence in voice search, podcasting and mobile apps (1) According to Nielsen Audio Ratings (2) See Appendix for reconciliation and information regarding non-GAAP measures
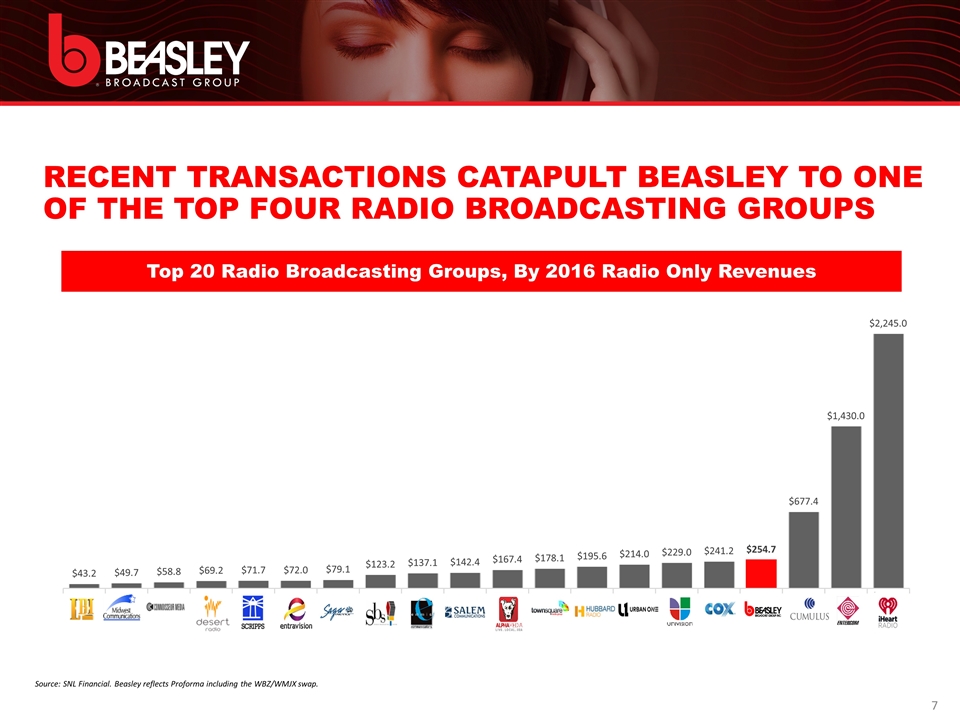
RECENT TRANSACTIONS CATAPULT BEASLEY TO ONE OF THE TOP FOUR RADIO BROADCASTING GROUPS Source: SNL Financial. Beasley reflects Proforma including the WBZ/WMJX swap.
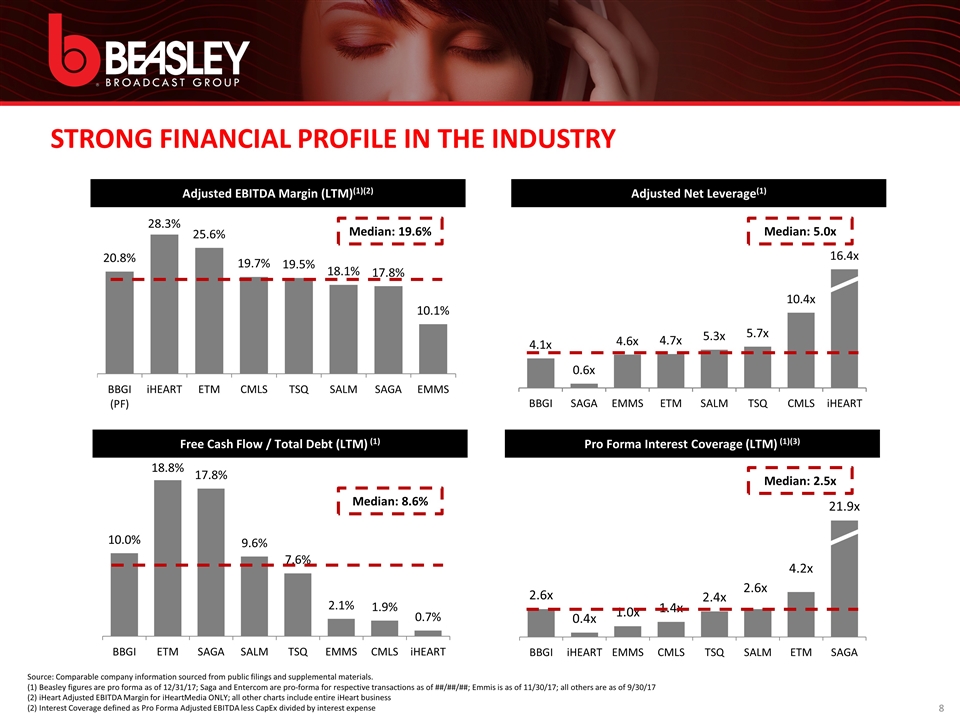
STRONG FINANCIAL PROFILE IN THE INDUSTRY Source: Comparable company information sourced from public filings and supplemental materials. (1) Beasley figures are pro forma as of 12/31/17; Saga and Entercom are pro-forma for respective transactions as of ##/##/##; Emmis is as of 11/30/17; all others are as of 9/30/17 (2) iHeart Adjusted EBITDA Margin for iHeartMedia ONLY; all other charts include entire iHeart business (2) Interest Coverage defined as Pro Forma Adjusted EBITDA less CapEx divided by interest expense Median: 2.5x Pro Forma Interest Coverage (LTM) (1)(3) Adjusted EBITDA Margin (LTM)(1)(2) Median: 19.6% Median: 8.6% Free Cash Flow / Total Debt (LTM) (1) Net Debt Adjusted Net Leverage(1) Median: 5.0x

ATTRACTIVE INDUSTRY FUNDAMENTALS Radio remains a highly relevant medium for local advertisers Source: Nielsen Total Audience Report Q2 2017. Source: Edison Research “Share of Ear” study Q3-Q4 2016/Q2 2017 persons 18+. Source: Nielsen Q2 2017 Total Audience Report. Figure based on users of radio. Source: Traffic firm INRIX 2017, 2016 ACS data. Source: Nielsen ROAS studies 2014-2016. Nielsen, RAB, USA Touchpoints. Engaged Audience / Greatest Reach Radio is the #1 reach medium in the U.S., reaching ~97% of American adults and 96% of Millennials monthly (1) Seamless High-Impact Cross Platform Marketing Solutions On-air, onsite, online and on-demand Continues to dominate audio listening Broadcast radio’s 51% share of listening is the highest of all other audio options, including SiriusXM (7.5%), streaming audio (15%) and owned music, i.e. CDs, Digital music files (15%) (2) Cost effective “call to action,” time-sensitive messaging Low cost for high reach is an attractive media option for many advertisers in the fragmented media landscape Radio listening remains steady in the face of increased audio competition The average adult spends 2 hours and 43 minutes/day with AM/FM radio (3) Large Accessible/Captive Commuter Audience The average commuter spends 42 hours/year stuck in traffic (3,4) 89% of those commuting by auto commute alone (3,4) 69% of all in-car audio is to AM/FM radio(3,4) AM/FM radio has an 89% share of all ad-supported in-car audio(3,4) Positive Payback to Advertiser’s Bottom Line Average payback per $1.00 investment is $10.00 across multiple ad verticals (5) Delivers the last message/Closest to the point of purchase Radio remains the most mobile of all media including “Mobile” as the majority mobile data usage occurs in-home. Two of radio’s key benefits are the ability of it’s messaging to target-in-time when the consumer is close to the point-of-purchase(6) Data/Analytics/Attribution Via Veritone, Analytic Owl and Nielsen’s Rhiza, we are now able to quantify and provide advertisers with proof-of-performance data in terms of web visits directly attributed to their campaign, web pages viewed and time spent on the site, instant quantification of DJ chatter/mentions, live endorsements and commercial impressions by gender and demo
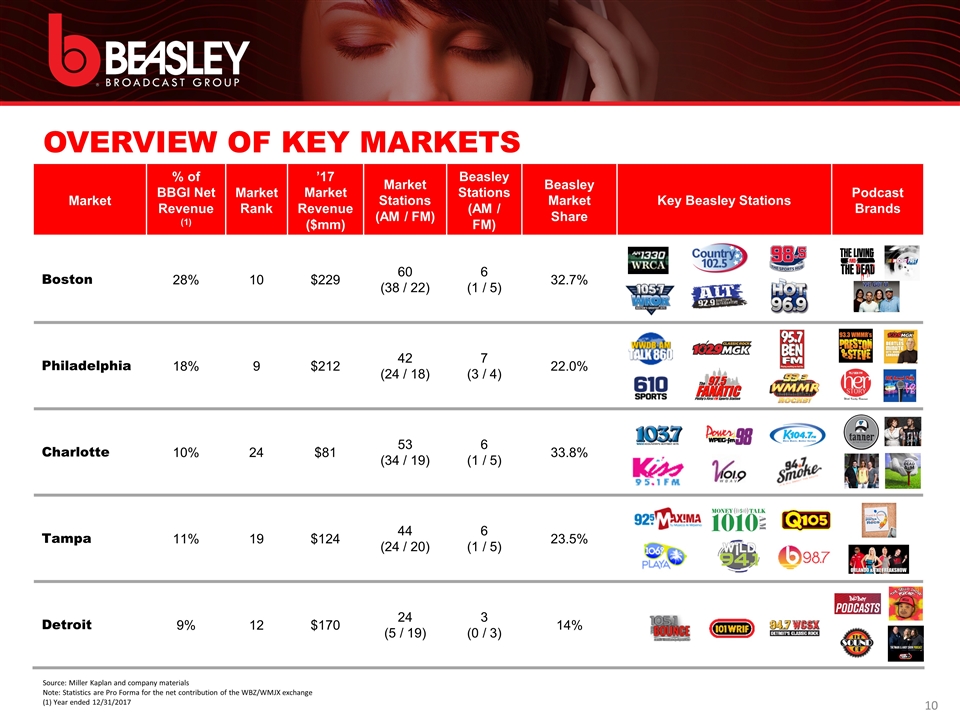
OVERVIEW OF KEY MARKETS Source: Miller Kaplan and company materials Note: Statistics are Pro Forma for the net contribution of the WBZ/WMJX exchange (1) Year ended 12/31/2017 Market % of BBGI Net Revenue (1) Market Rank ’17 Market Revenue ($mm) Market Stations (AM / FM) Beasley Stations (AM / FM) Beasley Market Share Key Beasley Stations Podcast Brands Boston 28% 10 $229 60 (38 / 22) 6 (1 / 5) 32.7% Philadelphia 18% 9 $212 42 (24 / 18) 7 (3 / 4) 22.0% Charlotte 10% 24 $81 53 (34 / 19) 6 (1 / 5) 33.8% Tampa 11% 19 $124 44 (24 / 20) 6 (1 / 5) 23.5% Detroit 9% 12 $170 24 (5 / 19) 3 (0 / 3) 14%

Online Presence and Streaming Ranked 7th among all radio broadcasters, with 11.6 million streaming sessions per month (three-month average) 68 million page views to 64 station websites in 2017; mobile devices account for ~75% of all website visits We are averaging 2.4 million unique visitors to our websites each month with more than 88 million listening hours in 2017 Mobile Apps Over 842,000 downloads of 64 station-branded apps in 2017 Approximately 132,000 listeners use a Beasley station app to access station streams each month We are working on new app features designed to inform, entertain and engage our audiences in ways that are personally relevant to them. We are now able to use non personally identifiable data to better understand consumer behaviors and deliver relevant, timely and action driven information to app users Social Media Engagement Stations have sold nearly $1 million in social media campaigns Stations had nearly 2 million social referrals from Facebook/Instagram to our websites Stations have been “liked” or “followed” more than 2.8 million times across three social media platforms (Facebook, Twitter and Instagram) In 2017, 5.9 million people engaged with our content on social media (six-month average) Podcasting We are averaging over 2.1 million podcast downloads per month from 93 podcasts Note: Pro forma includes the Boston swap of WBZ-FM, the divestiture of the Greenville-New Bern-Jacksonville market and WFNZ in Charlotte, NC. 11 11.6mm Streaming Sessions Per Month 842k Mobile App Downloads in 2017 68mm Station PageViews in 2017 BBGI Digital Platform Positioned for Growth Pro forma Beasley has an established digital presence with digital revenues of $13 million in 2017
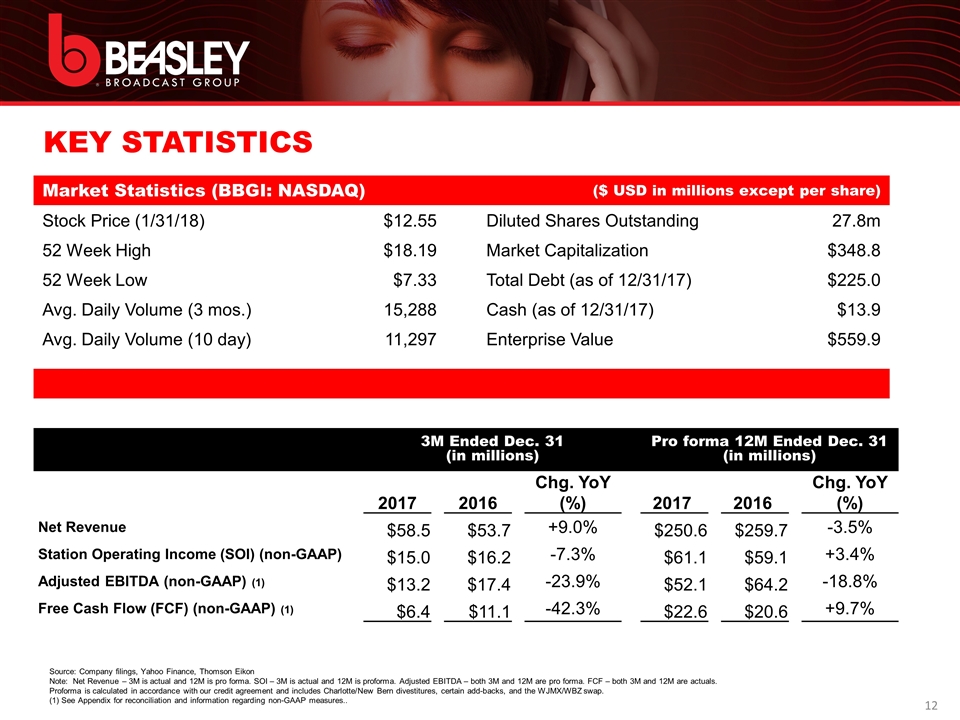
KEY STATISTICS Market Statistics (BBGI: NASDAQ) ($ USD in millions except per share) Stock Price (1/31/18) $12.55 Diluted Shares Outstanding 27.8m 52 Week High $18.19 Market Capitalization $348.8 52 Week Low $7.33 Total Debt (as of 12/31/17) $225.0 Avg. Daily Volume (3 mos.) 15,288 Cash (as of 12/31/17) $13.9 Avg. Daily Volume (10 day) 11,297 Enterprise Value $559.9 Source: Company filings, Yahoo Finance, Thomson Eikon Note: Net Revenue – 3M is actual and 12M is pro forma. SOI – 3M is actual and 12M is proforma. Adjusted EBITDA – both 3M and 12M are pro forma. FCF – both 3M and 12M are actuals. Proforma is calculated in accordance with our credit agreement and includes Charlotte/New Bern divestitures, certain add-backs, and the WJMX/WBZ swap. (1) See Appendix for reconciliation and information regarding non-GAAP measures.. 3M Ended Dec. 31 (in millions) Pro forma 12M Ended Dec. 31 (in millions) 2017 2016 Chg. YoY (%) 2017 2016 Chg. YoY (%) Net Revenue $58.5 $53.7 +9.0% $250.6 $259.7 -3.5% Station Operating Income (SOI) (non-GAAP) $15.0 $16.2 -7.3% $61.1 $59.1 +3.4% Adjusted EBITDA (non-GAAP) (1) $13.2 $17.4 -23.9% $52.1 $64.2 -18.8% Free Cash Flow (FCF) (non-GAAP) (1) $6.4 $11.1 -42.3% $22.6 $20.6 +9.7%
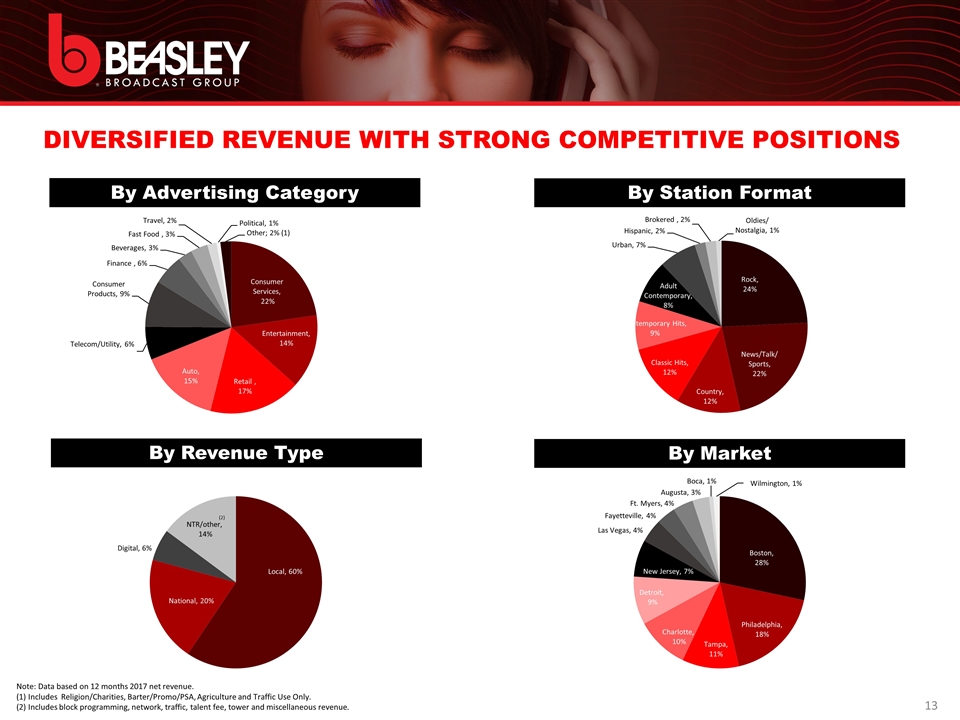
DIVERSIFIED REVENUE WITH STRONG COMPETITIVE POSITIONS Note: Data based on 12 months 2017 net revenue. (1) Includes Religion/Charities, Barter/Promo/PSA, Agriculture and Traffic Use Only. (2) Includes block programming, network, traffic, talent fee, tower and miscellaneous revenue. By Advertising Category By Revenue Type By Market By Station Format (2)
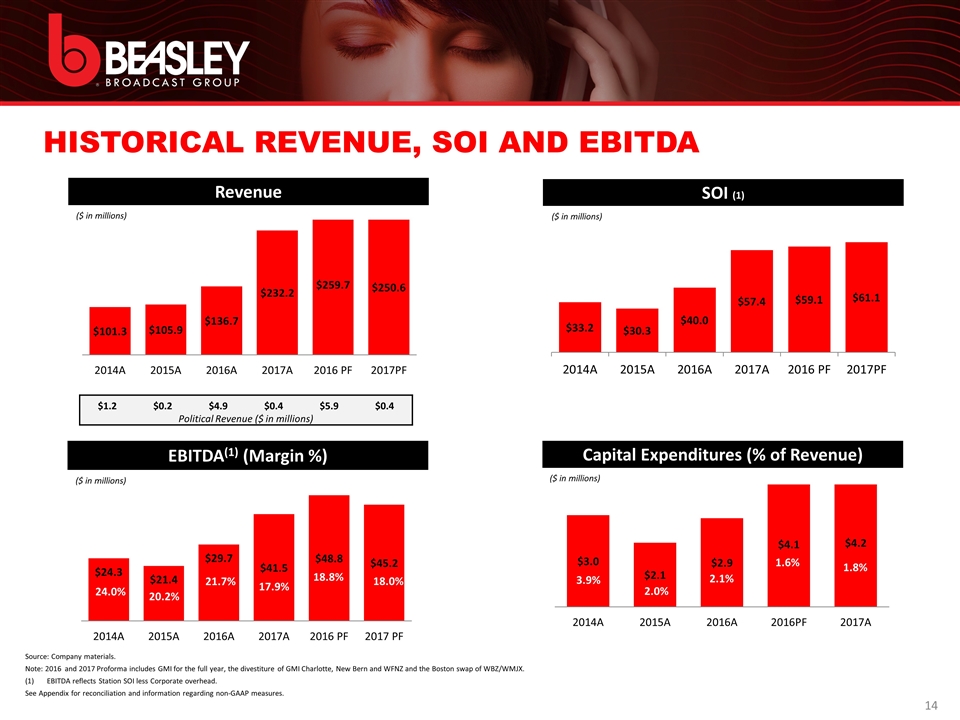
HISTORICAL REVENUE, SOI AND EBITDA $1.2 $0.2 $4.9 $0.4 $5.9 $0.4 Political Revenue ($ in millions) Revenue ($ in millions) SOI (1) ($ in millions) 30.3% 30.6% 28.6% 29.3% 22.2% 22.6% EBITDA(1) (Margin %) ($ in millions) 24.0% 20.2% 21.7% 17.9% 18.8% 18.0% Capital Expenditures (% of Revenue) ($ in millions) 2.0% 3.9% 2.1% 1.6% 1.8% Source: Company materials. Note: 2016 and 2017 Proforma includes GMI for the full year, the divestiture of GMI Charlotte, New Bern and WFNZ and the Boston swap of WBZ/WMJX. EBITDA reflects Station SOI less Corporate overhead. See Appendix for reconciliation and information regarding non-GAAP measures.
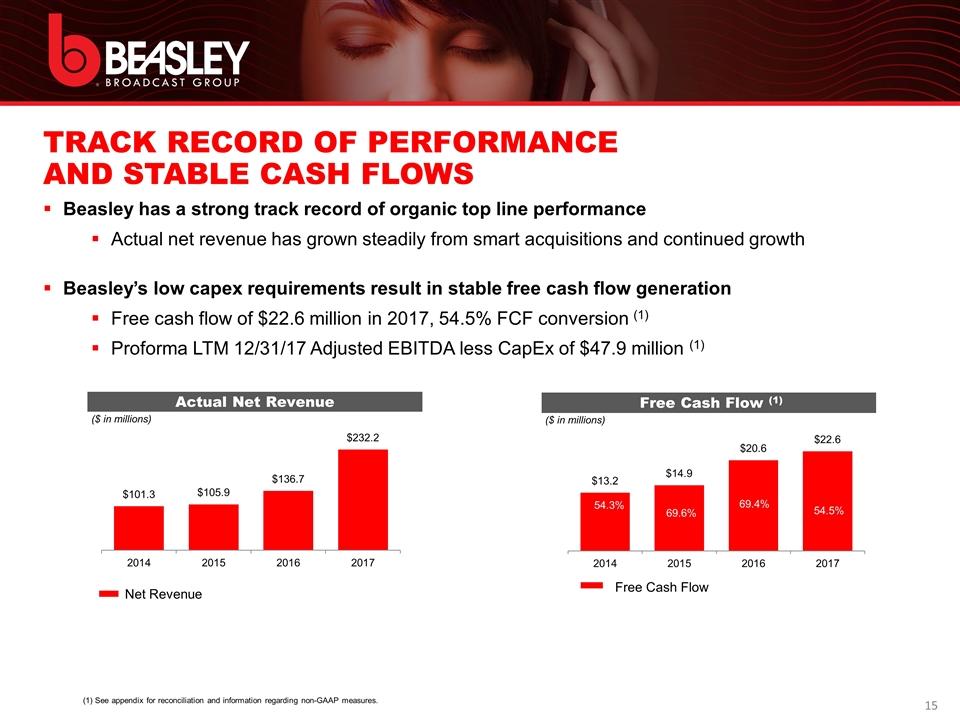
TRACK RECORD OF PERFORMANCE AND STABLE CASH FLOWS Beasley has a strong track record of organic top line performance Actual net revenue has grown steadily from smart acquisitions and continued growth Beasley’s low capex requirements result in stable free cash flow generation Free cash flow of $22.6 million in 2017, 54.5% FCF conversion (1) Proforma LTM 12/31/17 Adjusted EBITDA less CapEx of $47.9 million (1) Actual Net Revenue ($ in millions) Free Cash Flow (1) ($ in millions) Net Revenue (1) See appendix for reconciliation and information regarding non-GAAP measures. Free Cash Flow 54.5% 69.4% 69.6% 54.3%
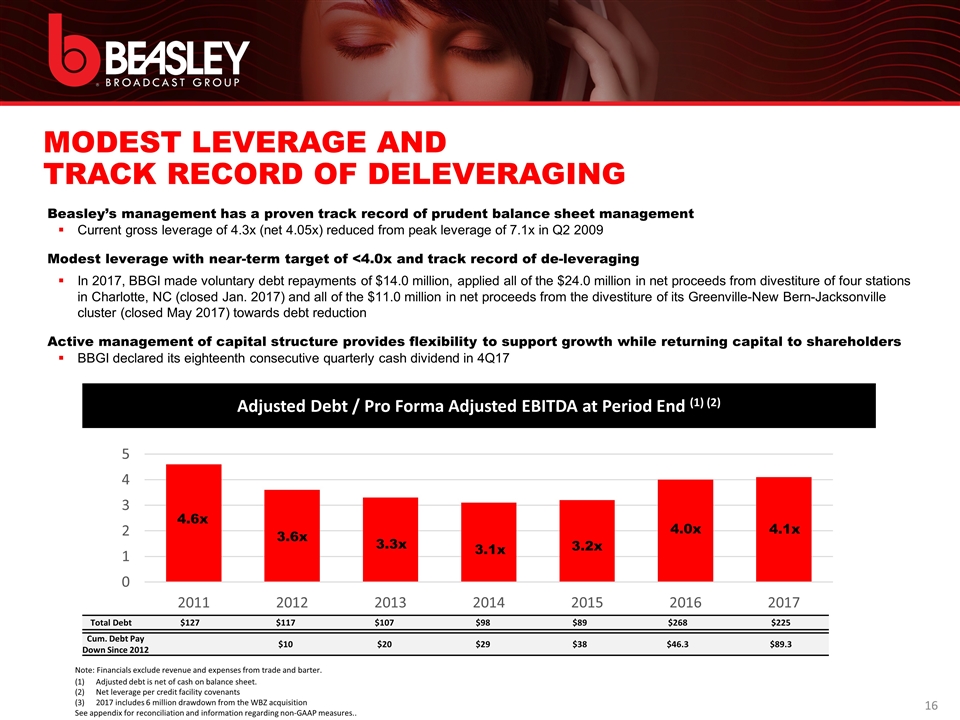
MODEST LEVERAGE AND TRACK RECORD OF DELEVERAGING Beasley’s management has a proven track record of prudent balance sheet management Current gross leverage of 4.3x (net 4.05x) reduced from peak leverage of 7.1x in Q2 2009 Modest leverage with near-term target of <4.0x and track record of de-leveraging In 2017, BBGI made voluntary debt repayments of $14.0 million, applied all of the $24.0 million in net proceeds from divestiture of four stations in Charlotte, NC (closed Jan. 2017) and all of the $11.0 million in net proceeds from the divestiture of its Greenville-New Bern-Jacksonville cluster (closed May 2017) towards debt reduction Active management of capital structure provides flexibility to support growth while returning capital to shareholders BBGI declared its eighteenth consecutive quarterly cash dividend in 4Q17 Adjusted Debt / Pro Forma Adjusted EBITDA at Period End (1) (2) Total Debt $127 $117 $107 $98 $89 $268 $225 Cum. Debt Pay Down Since 2012 $10 $20 $29 $38 $46.3 $89.3 Note: Financials exclude revenue and expenses from trade and barter. Adjusted debt is net of cash on balance sheet. Net leverage per credit facility covenants 2017 includes 6 million drawdown from the WBZ acquisition See appendix for reconciliation and information regarding non-GAAP measures.. 4.6x 3.6x 3.3x 3.1x 3.2x 4.0x 4.1x
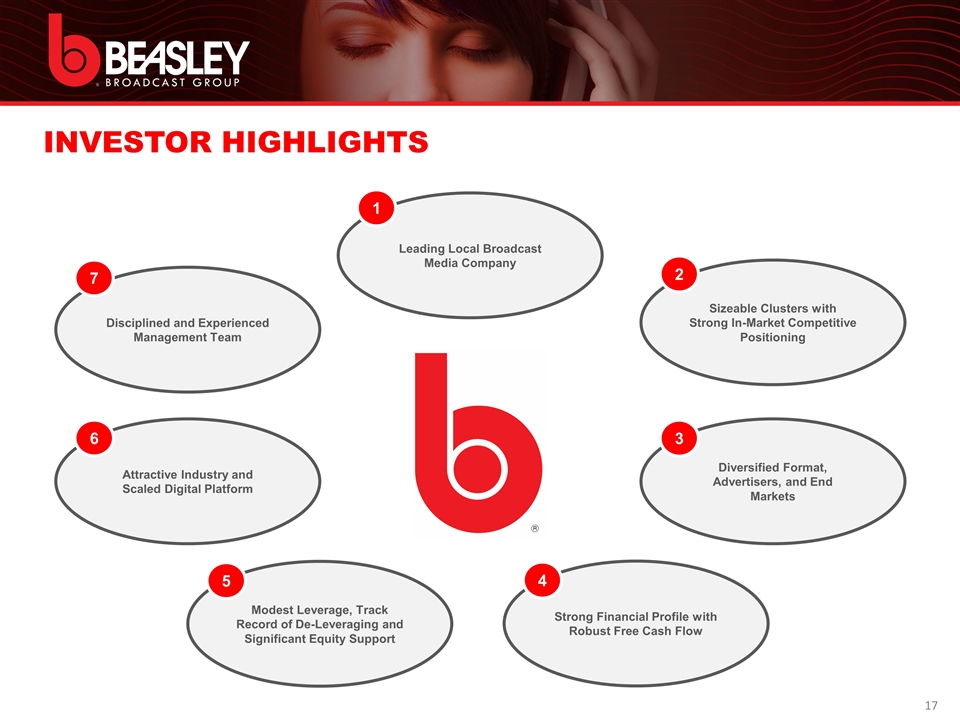
INVESTOR HIGHLIGHTS Disciplined and Experienced Management Team 7 Leading Local Broadcast Media Company 1 Attractive Industry and Scaled Digital Platform 6 Diversified Format, Advertisers, and End Markets 3 Sizeable Clusters with Strong In-Market Competitive Positioning 2 Modest Leverage, Track Record of De-Leveraging and Significant Equity Support 5 Strong Financial Profile with Robust Free Cash Flow 4

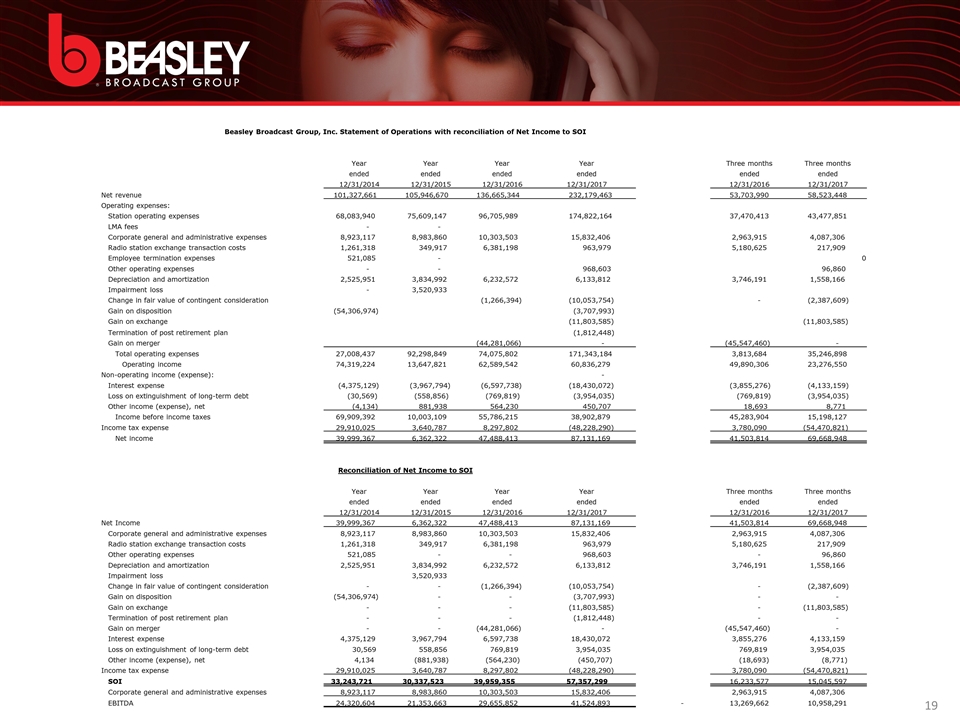
Beasley Broadcast Group, Inc. Statement of Operations with reconciliation of Net Income to SOI Year Year Year Year Three months Three months ended ended ended ended ended ended 12/31/2014 12/31/2015 12/31/2016 12/31/2017 12/31/2016 12/31/2017 Net revenue 101,327,661 105,946,670 136,665,344 232,179,463 53,703,990 58,523,448 Operating expenses: Station operating expenses 68,083,940 75,609,147 96,705,989 174,822,164 37,470,413 43,477,851 LMA fees - - Corporate general and administrative expenses 8,923,117 8,983,860 10,303,503 15,832,406 2,963,915 4,087,306 Radio station exchange transaction costs 1,261,318 349,917 6,381,198 963,979 5,180,625 217,909 Employee termination expenses 521,085 - 0 Other operating expenses - - 968,603 96,860 Depreciation and amortization 2,525,951 3,834,992 6,232,572 6,133,812 3,746,191 1,558,166 Impairment loss - 3,520,933 Change in fair value of contingent consideration (1,266,394) (10,053,754) - (2,387,609) Gain on disposition (54,306,974) (3,707,993) Gain on exchange (11,803,585) (11,803,585) Termination of post retirement plan (1,812,448) Gain on merger (44,281,066) - (45,547,460) - Total operating expenses 27,008,437 92,298,849 74,075,802 171,343,184 3,813,684 35,246,898 Operating income 74,319,224 13,647,821 62,589,542 60,836,279 49,890,306 23,276,550 Non-operating income (expense): - Interest expense (4,375,129) (3,967,794) (6,597,738) (18,430,072) (3,855,276) (4,133,159) Loss on extinguishment of long-term debt (30,569) (558,856) (769,819) (3,954,035) (769,819) (3,954,035) Other income (expense), net (4,134) 881,938 564,230 450,707 18,693 8,771 Income before income taxes 69,909,392 10,003,109 55,786,215 38,902,879 45,283,904 15,198,127 Income tax expense 29,910,025 3,640,787 8,297,802 (48,228,290) 3,780,090 (54,470,821) Net income 39,999,367 6,362,322 47,488,413 87,131,169 41,503,814 69,668,948 Reconciliation of Net Income to SOI Year Year Year Year Three months Three months ended ended ended ended ended ended 12/31/2014 12/31/2015 12/31/2016 12/31/2017 12/31/2016 12/31/2017 Net Income 39,999,367 6,362,322 47,488,413 87,131,169 41,503,814 69,668,948 Corporate general and administrative expenses 8,923,117 8,983,860 10,303,503 15,832,406 2,963,915 4,087,306 Radio station exchange transaction costs 1,261,318 349,917 6,381,198 963,979 5,180,625 217,909 Other operating expenses 521,085 - - 968,603 - 96,860 Depreciation and amortization 2,525,951 3,834,992 6,232,572 6,133,812 3,746,191 1,558,166 Impairment loss 3,520,933 Change in fair value of contingent consideration - - (1,266,394) (10,053,754) - (2,387,609) Gain on disposition (54,306,974) - - (3,707,993) - - Gain on exchange - - - (11,803,585) - (11,803,585) Termination of post retirement plan - - - (1,812,448) - - Gain on merger - - (44,281,066) - (45,547,460) - Interest expense 4,375,129 3,967,794 6,597,738 18,430,072 3,855,276 4,133,159 Loss on extinguishment of long-term debt 30,569 558,856 769,819 3,954,035 769,819 3,954,035 Other income (expense), net 4,134 (881,938) (564,230) (450,707) (18,693) (8,771) Income tax expense 29,910,025 3,640,787 8,297,802 (48,228,290) 3,780,090 (54,470,821) SOI 33,243,721 30,337,523 39,959,355 57,357,299 16,233,577 15,045,597 Corporate general and administrative expenses 8,923,117 8,983,860 10,303,503 15,832,406 2,963,915 4,087,306 EBITDA 24,320,604 21,353,663 29,655,852 41,524,893 - 13,269,662 10,958,291
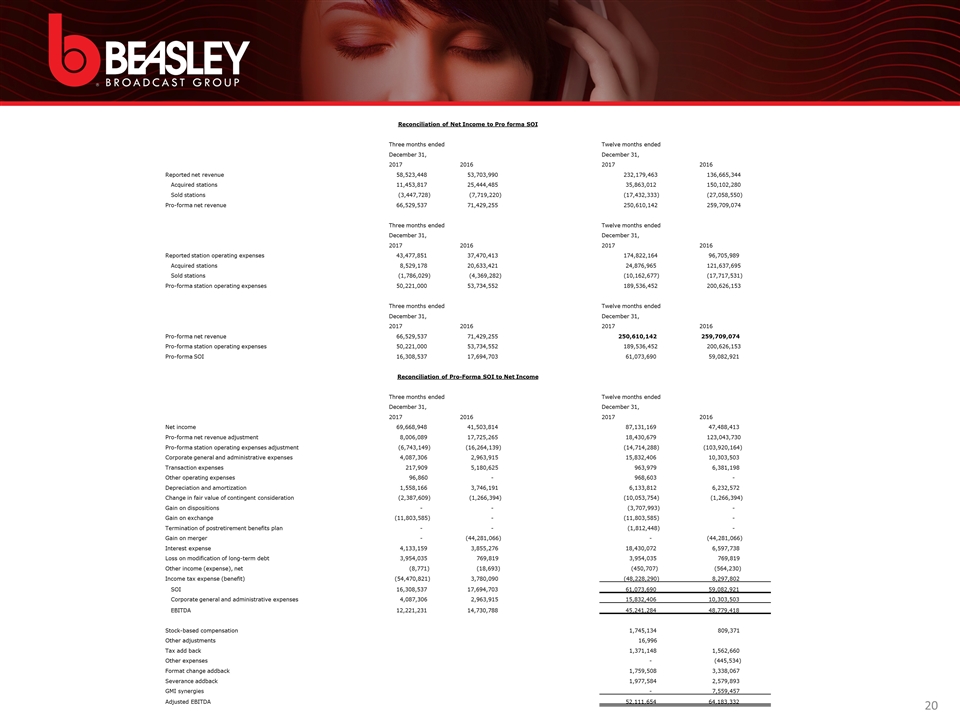
Reconciliation of Net Income to Pro forma SOI Three months ended Twelve months ended December 31, December 31, 2017 2016 2017 2016 Reported net revenue 58,523,448 53,703,990 232,179,463 136,665,344 Acquired stations 11,453,817 25,444,485 35,863,012 150,102,280 Sold stations (3,447,728) (7,719,220) (17,432,333) (27,058,550) Pro-forma net revenue 66,529,537 71,429,255 250,610,142 259,709,074 Three months ended Twelve months ended December 31, December 31, 2017 2016 2017 2016 Reported station operating expenses 43,477,851 37,470,413 174,822,164 96,705,989 Acquired stations 8,529,178 20,633,421 24,876,965 121,637,695 Sold stations (1,786,029) (4,369,282) (10,162,677) (17,717,531) Pro-forma station operating expenses 50,221,000 53,734,552 189,536,452 200,626,153 Three months ended Twelve months ended December 31, December 31, 2017 2016 2017 2016 Pro-forma net revenue 66,529,537 71,429,255 250,610,142 259,709,074 Pro-forma station operating expenses 50,221,000 53,734,552 189,536,452 200,626,153 Pro-forma SOI 16,308,537 17,694,703 61,073,690 59,082,921 Reconciliation of Pro-Forma SOI to Net Income Three months ended Twelve months ended December 31, December 31, 2017 2016 2017 2016 Net income 69,668,948 41,503,814 87,131,169 47,488,413 Pro-forma net revenue adjustment 8,006,089 17,725,265 18,430,679 123,043,730 Pro-forma station operating expenses adjustment (6,743,149) (16,264,139) (14,714,288) (103,920,164) Corporate general and administrative expenses 4,087,306 2,963,915 15,832,406 10,303,503 Transaction expenses 217,909 5,180,625 963,979 6,381,198 Other operating expenses 96,860 - 968,603 - Depreciation and amortization 1,558,166 3,746,191 6,133,812 6,232,572 Change in fair value of contingent consideration (2,387,609) (1,266,394) (10,053,754) (1,266,394) Gain on dispositions - - (3,707,993) - Gain on exchange (11,803,585) - (11,803,585) - Termination of postretirement benefits plan - - (1,812,448) - Gain on merger - (44,281,066) - (44,281,066) Interest expense 4,133,159 3,855,276 18,430,072 6,597,738 Loss on modification of long-term debt 3,954,035 769,819 3,954,035 769,819 Other income (expense), net (8,771) (18,693) (450,707) (564,230) Income tax expense (benefit) (54,470,821) 3,780,090 (48,228,290) 8,297,802 SOI 16,308,537 17,694,703 61,073,690 59,082,921 Corporate general and administrative expenses 4,087,306 2,963,915 15,832,406 10,303,503 EBITDA 12,221,231 14,730,788 45,241,284 48,779,418 Stock-based compensation 1,745,134 809,371 Other adjustments 16,996 Tax add back 1,371,148 1,562,660 Other expenses - (445,534) Format change addback 1,759,508 3,338,067 Severance addback 1,977,584 2,579,893 GMI synergies - 7,559,457 Adjusted EBITDA 52,111,654 64,183,332
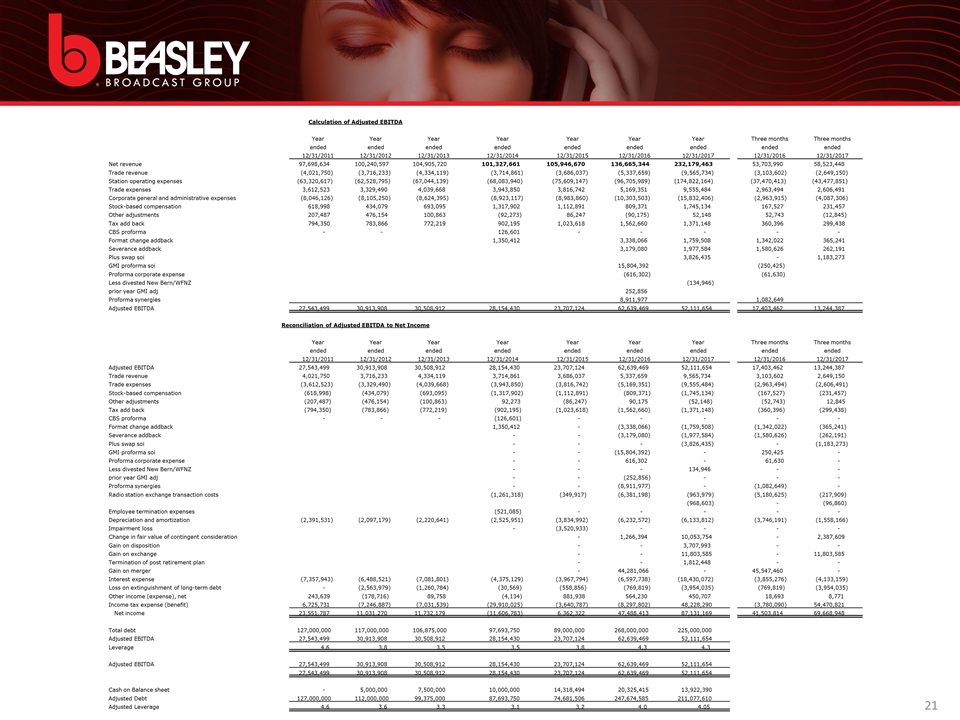
Calculation of Adjusted EBITDA Year Year Year Year Year Year Year Three months Three months ended ended ended ended ended ended ended ended ended 12/31/2011 12/31/2012 12/31/2013 12/31/2014 12/31/2015 12/31/2016 12/31/2017 12/31/2016 12/31/2017 Net revenue 97,698,634 100,240,597 104,905,720 101,327,661 105,946,670 136,665,344 232,179,463 53,703,990 58,523,448 Trade revenue (4,021,750) (3,716,233) (4,334,119) (3,714,861) (3,686,037) (5,337,659) (9,565,734) (3,103,602) (2,649,150) Station operating expenses (63,320,617) (62,528,795) (67,044,139) (68,083,940) (75,609,147) (96,705,989) (174,822,164) (37,470,413) (43,477,851) Trade expenses 3,612,523 3,329,490 4,039,668 3,943,850 3,816,742 5,169,351 9,555,484 2,963,494 2,606,491 Corporate general and administrative expenses (8,046,126) (8,105,250) (8,624,395) (8,923,117) (8,983,860) (10,303,503) (15,832,406) (2,963,915) (4,087,306) Stock-based compensation 618,998 434,079 693,095 1,317,902 1,112,891 809,371 1,745,134 167,527 231,457 Other adjustments 207,487 476,154 100,863 (92,273) 86,247 (90,175) 52,148 52,743 (12,845) Tax add back 794,350 783,866 772,219 902,195 1,023,618 1,562,660 1,371,148 360,396 299,438 CBS proforma - - 126,601 - - - - - Format change addback 1,350,412 3,338,066 1,759,508 1,342,022 365,241 Severance addback 3,179,080 1,977,584 1,580,626 262,191 Plus swap soi 3,826,435 - 1,183,273 GMI proforma soi 15,804,392 (250,425) Proforma corporate expense (616,302) (61,630) Less divested New Bern/WFNZ (134,946) prior year GMI adj 252,856 Proforma synergies 8,911,977 1,082,649 Adjusted EBITDA 27,543,499 30,913,908 30,508,912 28,154,430 23,707,124 62,639,469 52,111,654 17,403,462 13,244,387 Reconciliation of Adjusted EBITDA to Net Income Year Year Year Year Year Year Year Three months Three months ended ended ended ended ended ended ended ended ended 12/31/2011 12/31/2012 12/31/2013 12/31/2014 12/31/2015 12/31/2016 12/31/2017 12/31/2016 12/31/2017 Adjusted EBITDA 27,543,499 30,913,908 30,508,912 28,154,430 23,707,124 62,639,469 52,111,654 17,403,462 13,244,387 Trade revenue 4,021,750 3,716,233 4,334,119 3,714,861 3,686,037 5,337,659 9,565,734 3,103,602 2,649,150 Trade expenses (3,612,523) (3,329,490) (4,039,668) (3,943,850) (3,816,742) (5,169,351) (9,555,484) (2,963,494) (2,606,491) Stock-based compensation (618,998) (434,079) (693,095) (1,317,902) (1,112,891) (809,371) (1,745,134) (167,527) (231,457) Other adjustments (207,487) (476,154) (100,863) 92,273 (86,247) 90,175 (52,148) (52,743) 12,845 Tax add back (794,350) (783,866) (772,219) (902,195) (1,023,618) (1,562,660) (1,371,148) (360,396) (299,438) CBS proforma - - - (126,601) - - - - - Format change addback 1,350,412 - (3,338,066) (1,759,508) (1,342,022) (365,241) Severance addback - - (3,179,080) (1,977,584) (1,580,626) (262,191) Plus swap soi - - - (3,826,435) - (1,183,273) GMI proforma soi - - (15,804,392) - 250,425 - Proforma corporate expense - - 616,302 - 61,630 - Less divested New Bern/WFNZ - - - 134,946 - - prior year GMI adj - - (252,856) - - - Proforma synergies - - (8,911,977) - (1,082,649) - Radio station exchange transaction costs (1,261,318) (349,917) (6,381,198) (963,979) (5,180,625) (217,909) (968,603) - (96,860) Employee termination expenses (521,085) - - - - - Depreciation and amortization (2,391,531) (2,097,179) (2,220,641) (2,525,951) (3,834,992) (6,232,572) (6,133,812) (3,746,191) (1,558,166) Impairment loss - (3,520,933) - - - - Change in fair value of contingent consideration - 1,266,394 10,053,754 - 2,387,609 Gain on disposition - - 3,707,993 - - Gain on exchange - - 11,803,585 - 11,803,585 Termination of post retirement plan - - 1,812,448 - - Gain on merger - 44,281,066 - 45,547,460 - Interest expense (7,357,943) (6,488,521) (7,081,801) (4,375,129) (3,967,794) (6,597,738) (18,430,072) (3,855,276) (4,133,159) Loss on extinguishment of long-term debt - (2,563,979) (1,260,784) (30,569) (558,856) (769,819) (3,954,035) (769,819) (3,954,035) Other income (expense), net 243,639 (178,716) 89,758 (4,134) 881,938 564,230 450,707 18,693 8,771 Income tax expense (benefit) 6,725,731 (7,246,887) (7,031,539) (29,910,025) (3,640,787) (8,297,802) 48,228,290 (3,780,090) 54,470,821 Net income 23,551,787 11,031,270 11,732,179 (11,606,783) 6,362,322 47,488,413 87,131,169 41,503,814 69,668,948 Total debt 127,000,000 117,000,000 106,875,000 97,693,750 89,000,000 268,000,000 225,000,000 Adjusted EBITDA 27,543,499 30,913,908 30,508,912 28,154,430 23,707,124 62,639,469 52,111,654 Leverage 4.6 3.8 3.5 3.5 3.8 4.3 4.3 Adjusted EBITDA 27,543,499 30,913,908 30,508,912 28,154,430 23,707,124 62,639,469 52,111,654 27,543,499 30,913,908 30,508,912 28,154,430 23,707,124 62,639,469 52,111,654 Cash on Balance sheet - 5,000,000 7,500,000 10,000,000 14,318,494 20,325,415 13,922,390 Adjusted Debt 127,000,000 112,000,000 99,375,000 87,693,750 74,681,506 247,674,585 211,077,610 Adjusted Leverage 4.6 3.6 3.3 3.1 3.2 4.0 4.05
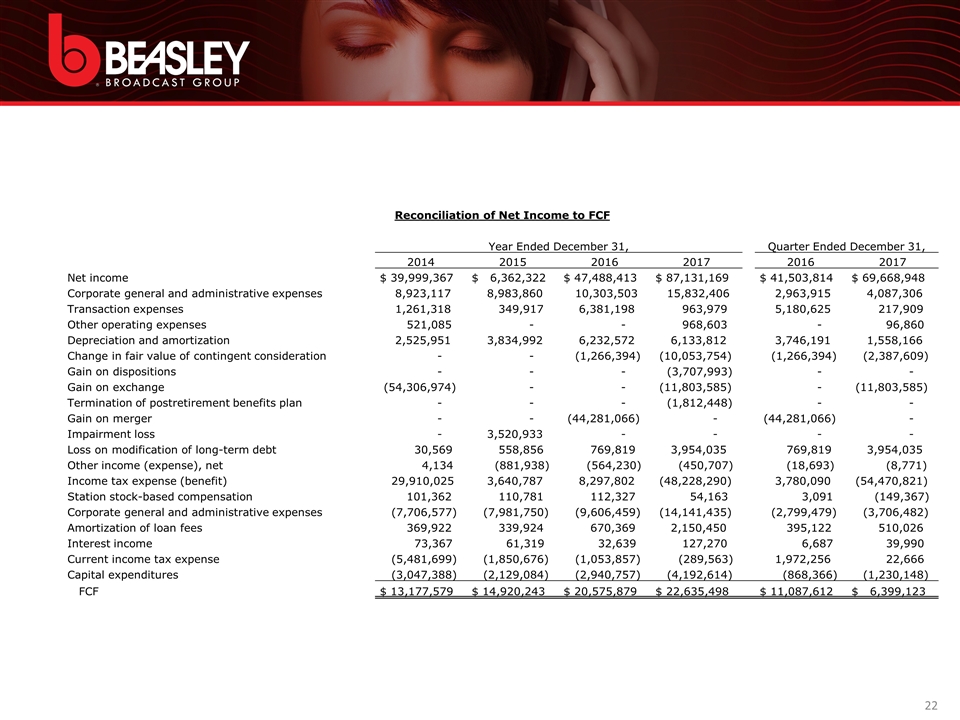
Reconciliation of Net Income to FCF Year Ended December 31, Quarter Ended December 31, 2014 2015 2016 2017 2016 2017 Net income $ 39,999,367 $ 6,362,322 $ 47,488,413 $ 87,131,169 $ 41,503,814 $ 69,668,948 Corporate general and administrative expenses 8,923,117 8,983,860 10,303,503 15,832,406 2,963,915 4,087,306 Transaction expenses 1,261,318 349,917 6,381,198 963,979 5,180,625 217,909 Other operating expenses 521,085 - - 968,603 - 96,860 Depreciation and amortization 2,525,951 3,834,992 6,232,572 6,133,812 3,746,191 1,558,166 Change in fair value of contingent consideration - - (1,266,394) (10,053,754) (1,266,394) (2,387,609) Gain on dispositions - - - (3,707,993) - - Gain on exchange (54,306,974) - - (11,803,585) - (11,803,585) Termination of postretirement benefits plan - - - (1,812,448) - - Gain on merger - - (44,281,066) - (44,281,066) - Impairment loss - 3,520,933 - - - - Loss on modification of long-term debt 30,569 558,856 769,819 3,954,035 769,819 3,954,035 Other income (expense), net 4,134 (881,938) (564,230) (450,707) (18,693) (8,771) Income tax expense (benefit) 29,910,025 3,640,787 8,297,802 (48,228,290) 3,780,090 (54,470,821) Station stock-based compensation 101,362 110,781 112,327 54,163 3,091 (149,367) Corporate general and administrative expenses (7,706,577) (7,981,750) (9,606,459) (14,141,435) (2,799,479) (3,706,482) Amortization of loan fees 369,922 339,924 670,369 2,150,450 395,122 510,026 Interest income 73,367 61,319 32,639 127,270 6,687 39,990 Current income tax expense (5,481,699) (1,850,676) (1,053,857) (289,563) 1,972,256 22,666 Capital expenditures (3,047,388) (2,129,084) (2,940,757) (4,192,614) (868,366) (1,230,148) FCF $ 13,177,579 $ 14,920,243 $ 20,575,879 $ 22,635,498 $ 11,087,612 $ 6,399,123


