
Exhibit 99.2 FINANCIAL SUPPLEMENT Summer 2024
Disclaimer This confidential information presentation (this “Presentation”) contains certain information pertaining to Beasley Medipa, G LLrC ( ou including any successor thereto, the “Company” doing business as “Beasley”). The Presentation is provided to th ne t a t re thciep ie recipient’s request for informational purposes only and is not, and may not be relied on in any manner as, legalstm , taexn o t ar i dvi nve ce or as an offer to sell or a solicitation of an offer to buy an interest in any securities of the Company. Neither the Company nor any of its advisors or agents intend for this Presentation to form the sole basis of any transaction decision. The recipient should conduct its own investigation and analysis of the Company in connection with any transaction. The information in this Presentation was provided by the Company or is from public or other sources. Neither the Company nor any of its advisors or agents assumes any responsibility for independently verifying such information and each of them expressly disclaims any liability to any purchaser in connection with such information or any transaction with the Company. Neither the Company nor any of its advisors or agents make any representation or warranty, express or implied, or accept any responsibility or liability for the accuracy or completeness of this Presentation or any other written or oral information that the Company or any other person makes available to any recipient. Neither the Company nor any of its advisors or agents makes any representation or warranty as to the achievement or reasonableness of any projections, management estimates, prospects or returns. This Presentation speaks only as of the date of the information herein and neither the Company nor any of its advisors or agents has any obligation to update or correct any information herein. Forward-Looking Statements: Statements in this Presentation that are “forw-alordoking statements” are based upon current expectations and assumptions, navo nd lve i certain risks and uncertainties within the meaning of the U.S. Private Securities Litigation Reform Act of 1995. Words or expressions such as “believe,” “plan,” “intends,” “expects,” “expected,” “anticipates” or variations of such words an r d e si xprm eissi la ons are intended to identify such forward-looking statements. Forward-looking statements by their nature address matters that are, to different degrees, uncertain, such as statements about expected income, revenues and growth. Key risks are described in our reports filed with the Securities and Exchange Commission (the “SEC”), including in our annual report on- F K aor nm d 1 qu0 arterly reports on Form 10-Q. Readers should note that forward-looking statements are subject to change and to inherent risks and uncertainties and may be impacted by several factors including: • the effects of the COVID-19 pandemic, including its potential effects on the economic environment and our results of operations, liquidity and financial condition; and the increased risk of impairments of our Federal Communications Commission (“FCC”) licenses and/or goodwill; • external economic forces and conditions that could have a material adverse impact on our advertising revenues and results of operations; • the ability of our stations to compete effectively in their respective markets for advertising revenues; • our ability to develop compelling and differentiated digital content, products and services; • audience acceptance of our content, particularly our audio programs; • our ability to respond to changes in technology, standards and services that affect the audio industry; • our dependence on federally issued licenses subject to extensive federal regulation; • actions by the FCC or new legislation affecting the audio industry; • increases to royalties we pay to copyright owners or the adoption of legislation requiring royalties to be paid to record labels and recording artists • our dependence on selected market clusters of stations for a material portion of our net revenue; • credit risk on our accounts receivable; • the risk that our FCC licenses and/or goodwill could become impaired; • our substantial debt levels and the potential effect of restrictive debt covenants on our operational flexibility and ability to pay dividends; • the potential effects of hurricanes on our corporate offices and stations; • the failure or destruction of the internet, satellite systems and transmitter facilities that we depend upon to distribute our programming; • disruptions or security breaches of our information technology infrastructure and information systems; • the loss of key personnel; • our ability to integrate acquired businesses and achieve fully the strategic and financial objectives related thereto and their impact on our financial condition and results of operations; • the fact that we are controlled by the Beasley family, which creates difficulties for any attempt to gain control of us; and • other economic, business, competitive, and regulatory factors affecting our businesses, including those set forth in our filings with the SEC. Our actual performance and results could differ materially because of these factors and other factors discussed in th ee m e“M nt’s anaDi gscussion and Analysis of Results of Operations and Financial Condition” in our SEC filings, including but n too t oulim r ited annual reports on Form 10-K or quarterly reports on Form 10-Q, copies of which can be obtained from the SEC website, www.sec.gov, or our website, www.bbgi.com. While forward-looking statements reflect our good faith beliefs, they are not guarantees of future performance. All information in this Presentation is as of the date of this Presentation, and we undertake no obligation to update the information contained herein to actual results or changes to our expectations. Projections: This Presentation contains projected financial information (the “Projections”) with respect to the business of the Com nclp ua dn iny, g ni et revenue and adjusted EBITDA for 2024-2029. Such Projections constitute forward-looking information, is for illustrative purposes only and should not be relied upon as being necessarily indicative of future results. The assumptions and estimates underlying Projections are inherently uncertain and are subject to a wide variety of significant business, economic and competitive risk and uncertainties that could cause actual results to differ materially from those contained in the Projections. See “Forw ing ard Stat Loem okents” paragraph above. Actual results may differ materially from the results contemplated by the Projections con in thi tais ned Presentation, and the inclusion of such information in this Presentation should not be regarded as a representation by the Company that the results reflected in such projections will be achieved. The auditors of the Company have not audited, reviewed, compiled or performed any procedures with respect to the Projections for the purpose of their inclusion in this Presentation, and, accordingly, have not expressed an opinion or provided any other form of assurance with respect thereto for the purpose of this Presentation. Use of Non-GAAP Financial Metrics: This Presentation includes certain financial measures that have not been prepared in a manner that complies with generally accepted accounting principles in the United States (“GAAP”), including, without limitation, EBITDA, Station Operating IncoI” m)e (“SO (collectively, the “non -GAAP financial measures”). These no -G nAAP financial measures are not measures of financial performance in accordance with GAAP and may exclude items that are significant in understanding and assessing the Company’s fina lts nci . al resu Therefore, these measures should not be considered in isolation or as an alternative to net income, net revenue, liquidity or performance under GAAP. Management believes that these non-GAAP financial measures provide meaningful information to investors because they provide insight into how effectively we operate our business. You should be aware that these non-GAAP financial measures may not be comparable to similarly-titled measures used by other companies. Reconciliations of these non-GAAP financial measures to the most directly comparable GAAP financial measures can be found in the appendix of this Presentation. No reconciliation of non-GAAP financial measures in the Projections to GAAP measures were created or used in connection with preparing the Projections, and there would be inherent difficulty in forecasting and quantifying the measures that would be necessary for such reconciliation. Confidential | 1

1. Financial Performance Confidential | 2
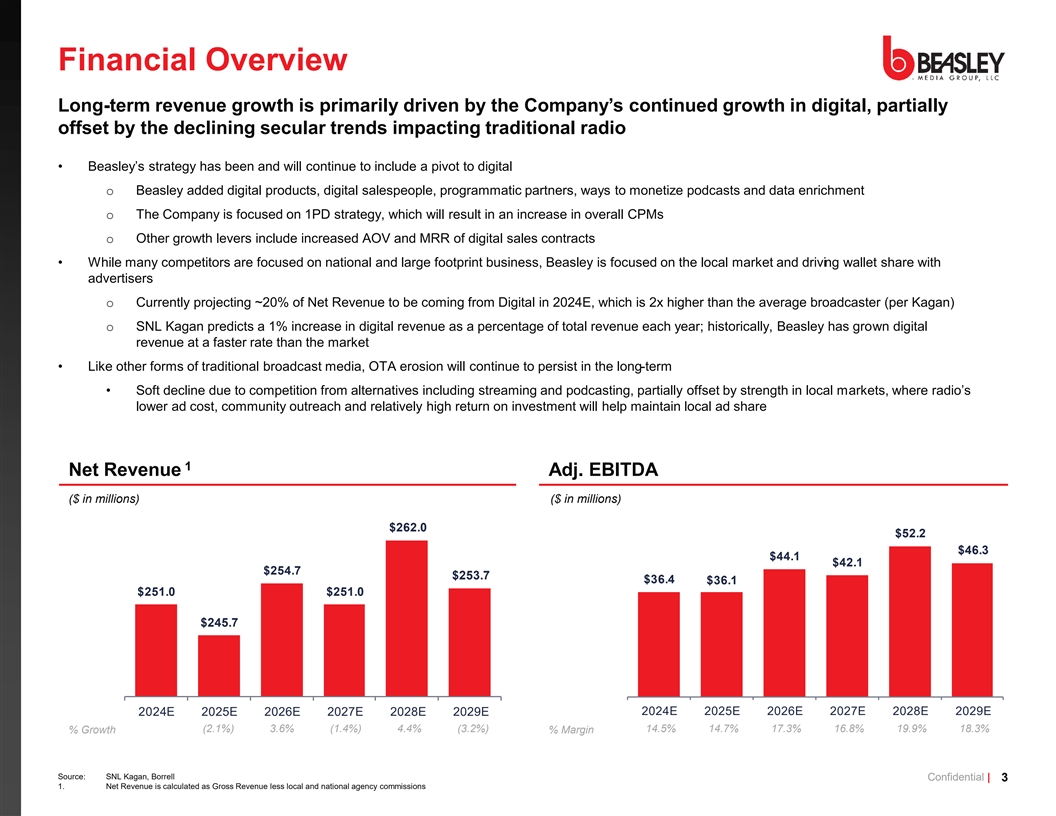
Financial Overview Long-term revenue growth is primarily driven by the Company’s continued growth in digital, partially offset by the declining secular trends impacting traditional radio • Beasley’s strategy has been and will continue to include a pivot to digital o Beasley added digital products, digital salespeople, programmatic partners, ways to monetize podcasts and data enrichment o The Company is focused on 1PD strategy, which will result in an increase in overall CPMs o Other growth levers include increased AOV and MRR of digital sales contracts • While many competitors are focused on national and large footprint business, Beasley is focused on the local market and driving wallet share with advertisers o Currently projecting ~20% of Net Revenue to be coming from Digital in 2024E, which is 2x higher than the average broadcaster (per Kagan) o SNL Kagan predicts a 1% increase in digital revenue as a percentage of total revenue each year; historically, Beasley has grown digital revenue at a faster rate than the market • Like other forms of traditional broadcast media, OTA erosion will continue to persist in the long-term • Soft decline due to competition from alternatives including streaming and podcasting, partially offset by strength in local markets, where radio’s lower ad cost, community outreach and relatively high return on investment will help maintain local ad share 1 Net Revenue Adj. EBITDA ($ in millions) ($ in millions) 0 E 0 E 0 E 0 E 0 E 0 E 0 E 0 E 0 E 0 E 0 E 0 E (2.1%) 3.6% (1.4%) 4.4% (3.2%) 14.5% 14.7% 17.3% 16.8% 19.9% 18.3% % Growth % Margin Source: SNL Kagan, Borrell Confidential | 3 1. Net Revenue is calculated as Gross Revenue less local and national agency commissions
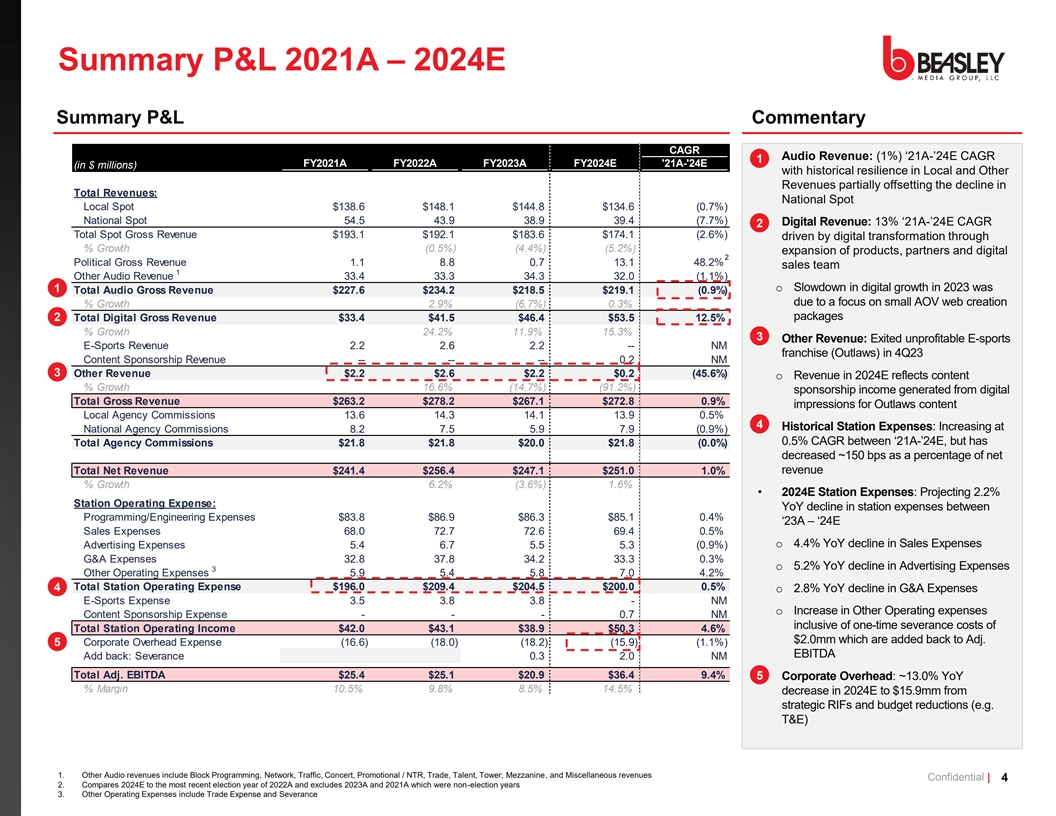
Summary P&L 2021A – 2024E Summary P&L Commentary CAGR • Audio Revenue: (1%) ‘ 1A-’ E CAGR 1 FY2021A FY2022A FY2023A FY2024E '21A-'24E (in $ millions) with historical resilience in Local and Other Revenues partially offsetting the decline in Total Revenues: National Spot Local Spot $138.6 $148.1 $144.8 $134.6 (0.7%) National Spot 54.5 43.9 38.9 39.4 (7.7%) • Digital Revenue: 13% ‘ 1A-’ E CAGR 2 Total Spot Gross Revenue $193.1 $192.1 $183.6 $174.1 (2.6%) driven by digital transformation through % Growth (0.5%) (4.4%) (5.2%) expansion of products, partners and digital 2 Political Gross Revenue 1.1 8.8 0.7 13.1 48.2% sales team 1 Other Audio Revenue 33.4 33.3 34.3 32.0 (1.1%) 1 o Slowdown in digital growth in 2023 was Total Audio Gross Revenue $227.6 $234.2 $218.5 $219.1 (0.9%) due to a focus on small AOV web creation % Growth 2.9% (6.7%) 0.3% packages 2 Total Digital Gross Revenue $33.4 $41.5 $46.4 $53.5 12.5% % Growth 24.2% 11.9% 15.3% 3 • Other Revenue: Exited unprofitable E-sports E-Sports Revenue 2.2 2.6 2.2 -- NM franchise (Outlaws) in 4Q23 Content Sponsorship Revenue -- -- -- 0.2 NM 3 Other Revenue $2.2 $2.6 $2.2 $0.2 (45.6%) o Revenue in 2024E reflects content % Growth 16.6% (14.7%) (91.2%) sponsorship income generated from digital Total Gross Revenue $263.2 $278.2 $267.1 $272.8 0.9% impressions for Outlaws content Local Agency Commissions 13.6 14.3 14.1 13.9 0.5% 4 • Historical Station Expenses: Increasing at National Agency Commissions 8.2 7.5 5.9 7.9 (0.9%) 0. % CAGR between ‘ 1-A’ E, but has Total Agency Commissions $21.8 $21.8 $20.0 $21.8 (0.0%) decreased ~150 bps as a percentage of net revenue Total Net Revenue $241.4 $256.4 $247.1 $251.0 1.0% % Growth 6.2% (3.6%) 1.6% • 2024E Station Expenses: Projecting 2.2% Station Operating Expense: YoY decline in station expenses between Programming/Engineering Expenses $83.8 $86.9 $86.3 $85.1 0.4% ‘ 3A – ‘ E Sales Expenses 68.0 72.7 72.6 69.4 0.5% o 4.4% YoY decline in Sales Expenses Advertising Expenses 5.4 6.7 5.5 5.3 (0.9%) G&A Expenses 32.8 37.8 34.2 33.3 0.3% o 5.2% YoY decline in Advertising Expenses 3 Other Operating Expenses 5.9 5.4 5.8 7.0 4.2% Total Station Operating Expense $196.0 $209.4 $204.5 $200.0 0.5% 4 o 2.8% YoY decline in G&A Expenses E-Sports Expense 3.5 3.8 3.8 - NM o Increase in Other Operating expenses Content Sponsorship Expense - - - 0.7 NM inclusive of one-time severance costs of Total Station Operating Income $42.0 $43.1 $38.9 $50.3 4.6% $2.0mm which are added back to Adj. 5 Corporate Overhead Expense (16.6) (18.0) (18.2) (15.9) (1.1%) EBITDA Add back: Severance 0.3 2.0 NM Total Adj. EBITDA $25.4 $25.1 $20.9 $36.4 9.4% 5• Corporate Overhead: ~13.0% YoY % Margin 10.5% 9.8% 8.5% 14.5% decrease in 2024E to $15.9mm from Net Interest Expense (21.7) strategic RIFs and budget reductions (e.g. Tax Expense (4.7) T&E) Severance Expense (2.0) Proceeds from Sale of BMI 6.0 Capital Expenditures (4.5) 4 FCF Adjustments 0.2 1. Other Audio revenues include Block Programming, Network, Traffic, Concert, Promotional / NTR, Trade, Talent, Tower, Mezzanine, and Miscellaneous revenues Confidential | 4 2. Compares 2024E to the most recent election year of 2022A and excludes 2023A and 2021A which were non-election years Free Cash Flow $9.8 NA 3. Other Operating Expenses include Trade Expense and Severance
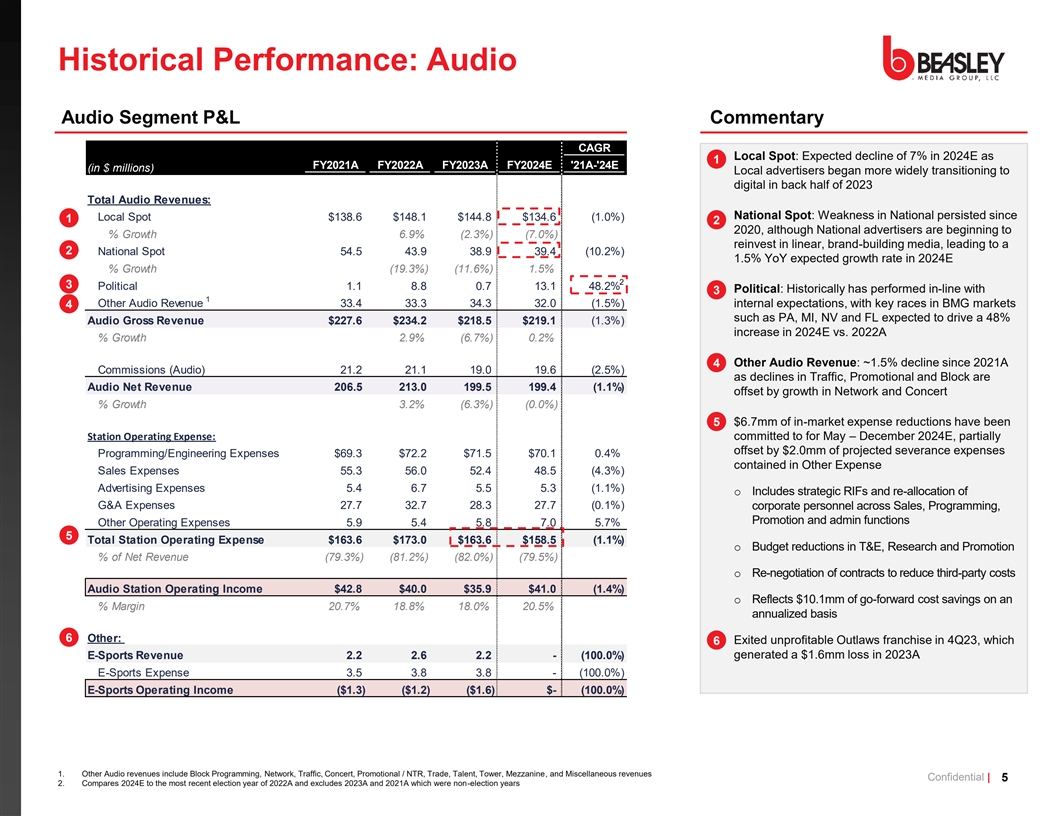
Historical Performance: Audio Audio Segment P&L Commentary CAGR • Local Spot: Expected decline of 7% in 2024E as 1 FY2021A FY2022A FY2023A FY2024E '21A-'24E (in $ millions) Local advertisers began more widely transitioning to digital in back half of 2023 Total Audio Revenues: • National Spot: Weakness in National persisted since Local Spot $138.6 $148.1 $144.8 $134.6 (1.0%) 1 2 2020, although National advertisers are beginning to % Growth 6.9% (2.3%) (7.0%) reinvest in linear, brand-building media, leading to a 2 National Spot 54.5 43.9 38.9 39.4 (10.2%) 1.5% YoY expected growth rate in 2024E % Growth (19.3%) (11.6%) 1.5% 2 3 Political 1.1 8.8 0.7 13.1 48.2% • Political: Historically has performed in-line with 3 1 4 Other Audio Revenue 33.4 33.3 34.3 32.0 (1.5%) internal expectations, with key races in BMG markets such as PA, MI, NV and FL expected to drive a 48% Audio Gross Revenue $227.6 $234.2 $218.5 $219.1 (1.3%) increase in 2024E vs. 2022A % Growth 2.9% (6.7%) 0.2% • Other Audio Revenue: ~1.5% decline since 2021A 4 Commissions (Audio) 21.2 21.1 19.0 19.6 (2.5%) as declines in Traffic, Promotional and Block are Audio Net Revenue 206.5 213.0 199.5 199.4 (1.1%) offset by growth in Network and Concert % Growth 3.2% (6.3%) (0.0%) • $6.7mm of in-market expense reductions have been 5 Station Operating Expense: committed to for May – December 2024E, partially offset by $2.0mm of projected severance expenses Programming/Engineering Expenses $69.3 $72.2 $71.5 $70.1 0.4% contained in Other Expense Sales Expenses 55.3 56.0 52.4 48.5 (4.3%) Advertising Expenses 5.4 6.7 5.5 5.3 (1.1%) o Includes strategic RIFs and re-allocation of G&A Expenses 27.7 32.7 28.3 27.7 (0.1%) corporate personnel across Sales, Programming, Promotion and admin functions Other Operating Expenses 5.9 5.4 5.8 7.0 5.7% 5 Total Station Operating Expense $163.6 $173.0 $163.6 $158.5 (1.1%) o Budget reductions in T&E, Research and Promotion % of Net Revenue (79.3%) (81.2%) (82.0%) (79.5%) o Re-negotiation of contracts to reduce third-party costs Audio Station Operating Income $42.8 $40.0 $35.9 $41.0 (1.4%) o Reflects $10.1mm of go-forward cost savings on an % Margin 20.7% 18.8% 18.0% 20.5% annualized basis 6 Other: • Exited unprofitable Outlaws franchise in 4Q23, which 6 generated a $1.6mm loss in 2023A E-Sports Revenue 2.2 2.6 2.2 - (100.0%) E-Sports Expense 3.5 3.8 3.8 - (100.0%) E-Sports Operating Income ($1.3) ($1.2) ($1.6) $- (100.0%) 1. Other Audio revenues include Block Programming, Network, Traffic, Concert, Promotional / NTR, Trade, Talent, Tower, Mezzanine, and Miscellaneous revenues Confidential | 5 2. Compares 2024E to the most recent election year of 2022A and excludes 2023A and 2021A which were non-election years

Historical Performance: Audio by Market 1 Market Audio Gross Revenue (in $ millions) 2021A 2022A 2023A 2024E '21A - '24E CAGR Boston $58.7 $58.4 $62.0 $60.4 1.0% % Growth (0.4%) 6.2% (2.7%) Philadelphia 54.3 54.3 47.9 45.0 (6.1%) % Growth 0.0% (11.9%) (5.9%) Detroit 27.0 29.1 24.6 26.2 (0.9%) % Growth 7.7% (15.5%) 6.8% Tampa 22.8 22.7 22.0 23.1 0.4% % Growth (0.2%) (3.3%) 4.9% Charlotte 19.7 19.7 18.3 20.0 0.6% % Growth 0.2% (7.1%) 9.4% New Jersey 12.4 12.6 11.9 11.1 (3.8%) % Growth 1.5% (6.2%) (6.5%) Las Vegas 8.5 11.3 8.4 11.6 10.9% % Growth 32.7% (25.3%) 37.4% Augusta 7.4 8.1 7.3 7.3 (0.4%) % Growth 9.6% (10.2%) 0.4% Fort Myers 6.9 7.4 7.9 7.8 3.9% % Growth 7.1% 5.8% (1.1%) Fayetteville 6.1 6.1 5.8 6.0 (0.1%) % Growth 0.8% (5.4%) 4.5% Corporate 0.3 1.3 0.4 0.5 23.4% 2 3.5 2.9 2.2 0.1 (69.8%) Other Total $227.6 $234.2 $218.5 $219.1 (1.3%) 1. Includes Local Spot, National Spot, Political and Other Audio Revenue Confidential | 6 2. Includes corporate adjustments, eliminations, exited markets (Wilmington and Boca Raton) and markets with immaterial Audio revenues (Atlanta)
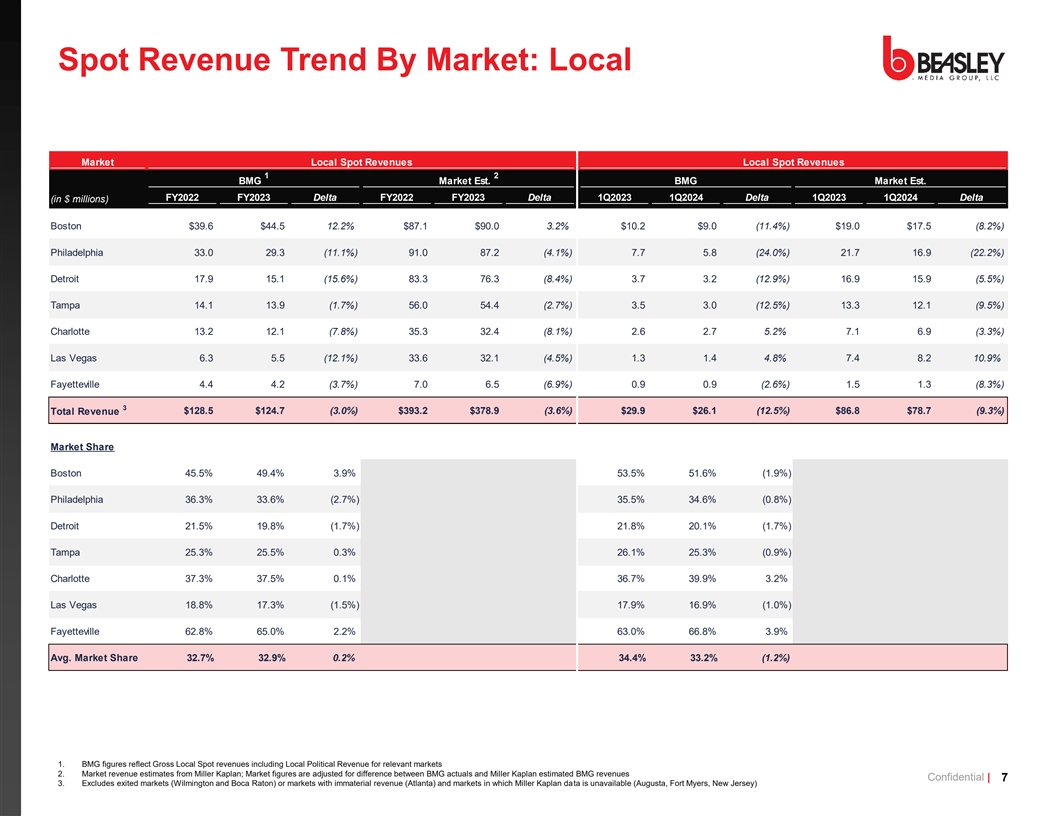
Spot Revenue Trend By Market: Local Market Local Spot Revenues Local Spot Revenues Market 1 2 1 BMG Market Est. BMG Market Est. BMG FY2022 FY2023 Delta FY2022 FY2023 Delta 1Q2023 1Q2024 Delta 1Q2023 1Q2024 Delta (in $ millions) Boston $39.6 $44.5 12.2% $87.1 $90.0 3.2% $10.2 $9.0 (11.4%) $19.0 $17.5 (8.2%) Philadelphia 33.0 29.3 (11.1%) 91.0 87.2 (4.1%) 7.7 5.8 (24.0%) 21.7 16.9 (22.2%) Detroit 17.9 15.1 (15.6%) 83.3 76.3 (8.4%) 3.7 3.2 (12.9%) 16.9 15.9 (5.5%) Tampa 14.1 13.9 (1.7%) 56.0 54.4 (2.7%) 3.5 3.0 (12.5%) 13.3 12.1 (9.5%) Charlotte 13.2 12.1 (7.8%) 35.3 32.4 (8.1%) 2.6 2.7 5.2% 7.1 6.9 (3.3%) Las Vegas 6.3 5.5 (12.1%) 33.6 32.1 (4.5%) 1.3 1.4 4.8% 7.4 8.2 10.9% Fayetteville 4.4 4.2 (3.7%) 7.0 6.5 (6.9%) 0.9 0.9 (2.6%) 1.5 1.3 (8.3%) 3 Total Revenue $128.5 $124.7 (3.0%) $393.2 $378.9 (3.6%) $29.9 $26.1 (12.5%) $86.8 $78.7 (9.3%) Market Share Boston 45.5% 49.4% 3.9% 53.5% 51.6% (1.9%) Philadelphia 36.3% 33.6% (2.7%) 35.5% 34.6% (0.8%) Detroit 21.5% 19.8% (1.7%) 21.8% 20.1% (1.7%) Tampa 25.3% 25.5% 0.3% 26.1% 25.3% (0.9%) Charlotte 37.3% 37.5% 0.1% 36.7% 39.9% 3.2% Las Vegas 18.8% 17.3% (1.5%) 17.9% 16.9% (1.0%) Fayetteville 62.8% 65.0% 2.2% 63.0% 66.8% 3.9% Avg. Market Share 32.7% 32.9% 0.2% 34.4% 33.2% (1.2%) 1. BMG figures reflect Gross Local Spot revenues including Local Political Revenue for relevant markets 2. Market revenue estimates from Miller Kaplan; Market figures are adjusted for difference between BMG actuals and Miller Kaplan estimated BMG revenues Confidential | 7 3. Excludes exited markets (Wilmington and Boca Raton) or markets with immaterial revenue (Atlanta) and markets in which Miller Kaplan data is unavailable (Augusta, Fort Myers, New Jersey)
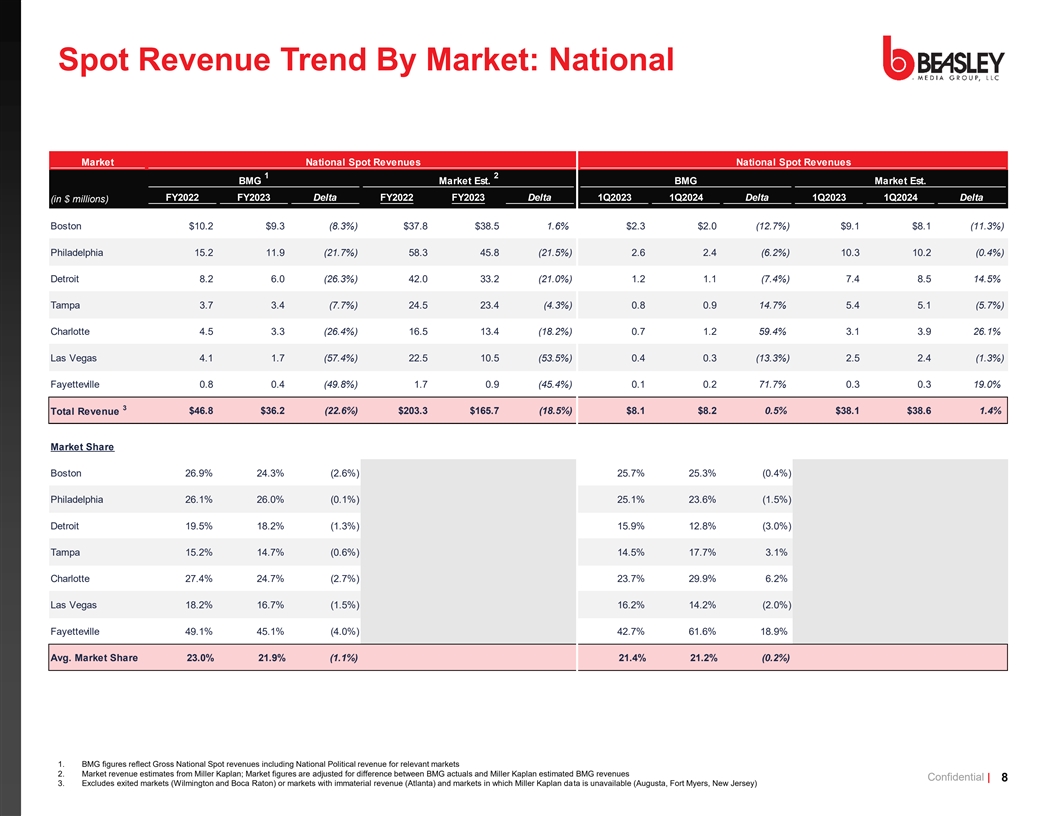
Spot Revenue Trend By Market: National Market National Spot Revenues National Spot Revenues Market 1 2 1 BMG Market Est. BMG Market Est. BMG FY2022 FY2023 Delta FY2022 FY2023 Delta 1Q2023 1Q2024 Delta 1Q2023 1Q2024 Delta (in $ millions) Boston $10.2 $9.3 (8.3%) $37.8 $38.5 1.6% $2.3 $2.0 (12.7%) $9.1 $8.1 (11.3%) Philadelphia 15.2 11.9 (21.7%) 58.3 45.8 (21.5%) 2.6 2.4 (6.2%) 10.3 10.2 (0.4%) Detroit 8.2 6.0 (26.3%) 42.0 33.2 (21.0%) 1.2 1.1 (7.4%) 7.4 8.5 14.5% Tampa 3.7 3.4 (7.7%) 24.5 23.4 (4.3%) 0.8 0.9 14.7% 5.4 5.1 (5.7%) Charlotte 4.5 3.3 (26.4%) 16.5 13.4 (18.2%) 0.7 1.2 59.4% 3.1 3.9 26.1% Las Vegas 4.1 1.7 (57.4%) 22.5 10.5 (53.5%) 0.4 0.3 (13.3%) 2.5 2.4 (1.3%) Fayetteville 0.8 0.4 (49.8%) 1.7 0.9 (45.4%) 0.1 0.2 71.7% 0.3 0.3 19.0% 3 Total Revenue $46.8 $36.2 (22.6%) $203.3 $165.7 (18.5%) $8.1 $8.2 0.5% $38.1 $38.6 1.4% Market Share Boston 26.9% 24.3% (2.6%) 25.7% 25.3% (0.4%) Philadelphia 26.1% 26.0% (0.1%) 25.1% 23.6% (1.5%) Detroit 19.5% 18.2% (1.3%) 15.9% 12.8% (3.0%) Tampa 15.2% 14.7% (0.6%) 14.5% 17.7% 3.1% Charlotte 27.4% 24.7% (2.7%) 23.7% 29.9% 6.2% Las Vegas 18.2% 16.7% (1.5%) 16.2% 14.2% (2.0%) Fayetteville 49.1% 45.1% (4.0%) 42.7% 61.6% 18.9% Avg. Market Share 23.0% 21.9% (1.1%) 21.4% 21.2% (0.2%) 1. BMG figures reflect Gross National Spot revenues including National Political revenue for relevant markets 2. Market revenue estimates from Miller Kaplan; Market figures are adjusted for difference between BMG actuals and Miller Kaplan estimated BMG revenues Confidential | 8 3. Excludes exited markets (Wilmington and Boca Raton) or markets with immaterial revenue (Atlanta) and markets in which Miller Kaplan data is unavailable (Augusta, Fort Myers, New Jersey)
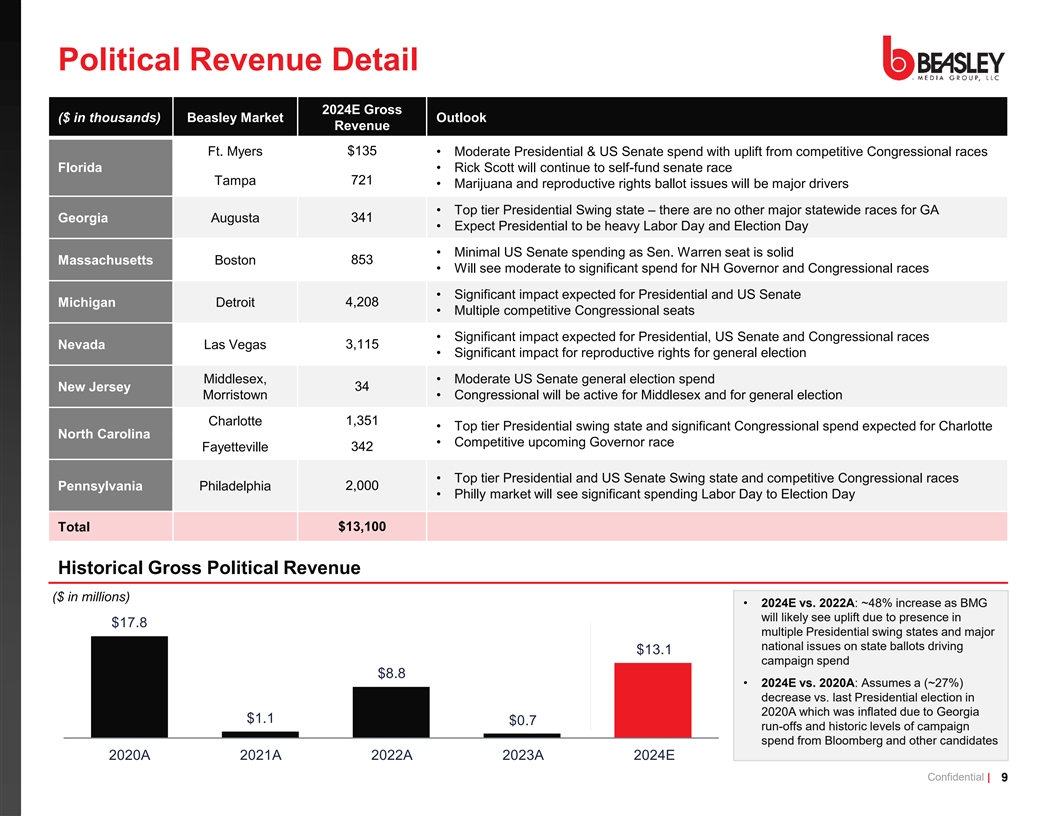
Political Revenue Detail 2024E Gross ($ in thousands) Beasley Market Outlook Revenue Ft. Myers $135 • Moderate Presidential & US Senate spend with uplift from competitive Congressional races Florida • Rick Scott will continue to self-fund senate race Tampa 721 • Marijuana and reproductive rights ballot issues will be major drivers • Top tier Presidential Swing state – there are no other major statewide races for GA Georgia Augusta 341 • Expect Presidential to be heavy Labor Day and Election Day • Minimal US Senate spending as Sen. Warren seat is solid 853 Massachusetts Boston • Will see moderate to significant spend for NH Governor and Congressional races • Significant impact expected for Presidential and US Senate Michigan Detroit 4,208 • Multiple competitive Congressional seats • Significant impact expected for Presidential, US Senate and Congressional races Nevada Las Vegas 3,115 • Significant impact for reproductive rights for general election Middlesex, • Moderate US Senate general election spend 34 New Jersey Morristown • Congressional will be active for Middlesex and for general election Charlotte 1,351 • Top tier Presidential swing state and significant Congressional spend expected for Charlotte North Carolina • Competitive upcoming Governor race 342 Fayetteville • Top tier Presidential and US Senate Swing state and competitive Congressional races Pennsylvania Philadelphia 2,000 • Philly market will see significant spending Labor Day to Election Day $13,100 Total Historical Gross Political Revenue ($ in millions) • 2024E vs. 2022A: ~48% increase as BMG will likely see uplift due to presence in 1 . multiple Presidential swing states and major national issues on state ballots driving 13.1 campaign spend . • 2024E vs. 2020A: Assumes a (~27%) decrease vs. last Presidential election in 2020A which was inflated due to Georgia 1.1 0. run-offs and historic levels of campaign spend from Bloomberg and other candidates 0 0A 0 1A 0 A 0 3A 0 E Confidential | 9
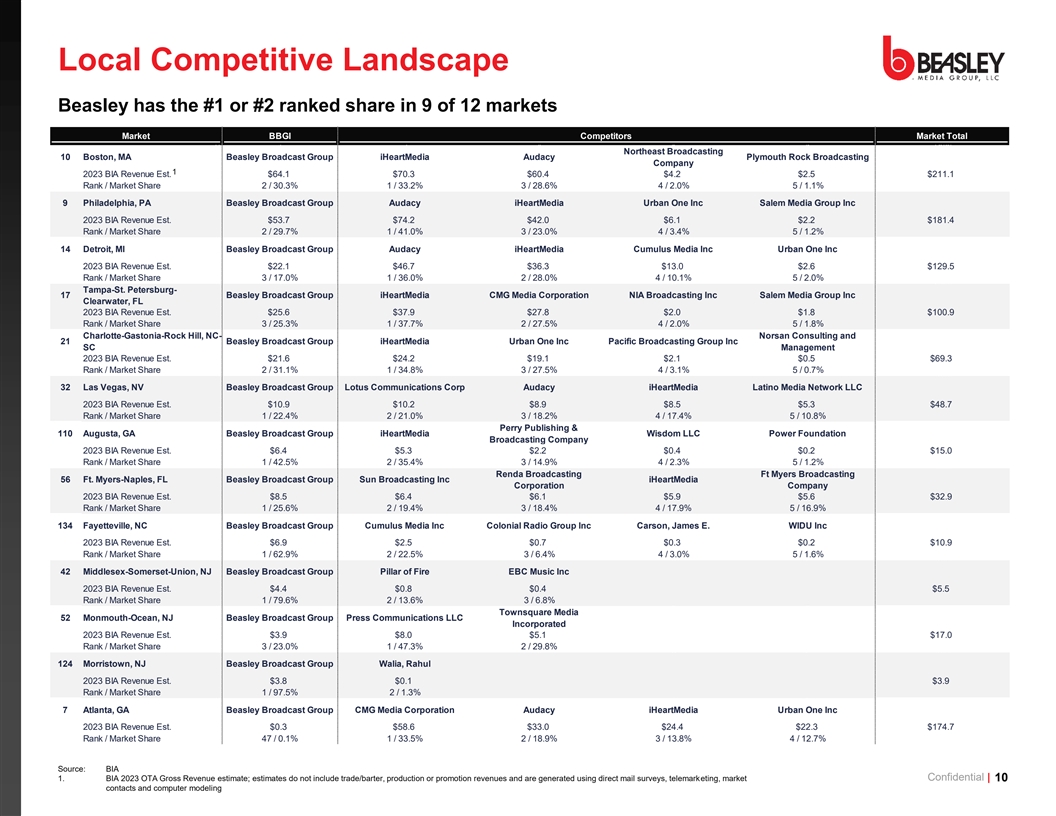
Local Competitive Landscape Beasley has the #1 or #2 ranked share in 9 of 12 markets Market BBGI Competitors Market Total 0 1 2 4 5 6 Total Northeast Broadcasting 10 Boston, MA Beasley Broadcast Group iHeartMedia Audacy Plymouth Rock Broadcasting Company 1 2023 BIA Revenue Est. $64.1 $70.3 $60.4 $4.2 $2.5 $211.1 Rank / Market Share 2 / 30.3% 1 / 33.2% 3 / 28.6% 4 / 2.0% 5 / 1.1% 0 1 2 4 5 6 Total 9 Philadelphia, PA Beasley Broadcast Group Audacy iHeartMedia Urban One Inc Salem Media Group Inc 2023 BIA Revenue Est. $53.7 $74.2 $42.0 $6.1 $2.2 $181.4 Rank / Market Share 2 / 29.7% 1 / 41.0% 3 / 23.0% 4 / 3.4% 5 / 1.2% 0 1 2 3 5 6 Total 14 Detroit, MI Beasley Broadcast Group Audacy iHeartMedia Cumulus Media Inc Urban One Inc 2023 BIA Revenue Est. $22.1 $46.7 $36.3 $13.0 $2.6 $129.5 Rank / Market Share 3 / 17.0% 1 / 36.0% 2 / 28.0% 4 / 10.1% 5 / 2.0% 0 1 2 3 5 6 Total Tampa-St. Petersburg- 17 Beasley Broadcast Group iHeartMedia CMG Media Corporation NIA Broadcasting Inc Salem Media Group Inc Clearwater, FL 2023 BIA Revenue Est. $25.6 $37.9 $27.8 $2.0 $1.8 $100.9 Rank / Market Share 3 / 25.3% 1 / 37.7% 2 / 27.5% 4 / 2.0% 5 / 1.8% 0 1 2 4 5 6 Total Charlotte-Gastonia-Rock Hill, NC- Norsan Consulting and 21 Beasley Broadcast Group iHeartMedia Urban One Inc Pacific Broadcasting Group Inc SC Management 2023 BIA Revenue Est. $21.6 $24.2 $19.1 $2.1 $0.5 $69.3 Rank / Market Share 2 / 31.1% 1 / 34.8% 3 / 27.5% 4 / 3.1% 5 / 0.7% 0 1 3 4 5 6 Total 32 Las Vegas, NV Beasley Broadcast Group Lotus Communications Corp Audacy iHeartMedia Latino Media Network LLC 2023 BIA Revenue Est. $10.9 $10.2 $8.9 $8.5 $5.3 $48.7 Rank / Market Share 1 / 22.4% 2 / 21.0% 3 / 18.2% 4 / 17.4% 5 / 10.8% 0 1 3 4 5 6 Total Perry Publishing & 110 Augusta, GA Beasley Broadcast Group iHeartMedia Wisdom LLC Power Foundation Broadcasting Company 2023 BIA Revenue Est. $6.4 $5.3 $2.2 $0.4 $0.2 $15.0 Rank / Market Share 1 / 42.5% 2 / 35.4% 3 / 14.9% 4 / 2.3% 5 / 1.2% 0 1 3 4 5 6 Total Renda Broadcasting Ft Myers Broadcasting 56 Ft. Myers-Naples, FL Beasley Broadcast Group Sun Broadcasting Inc iHeartMedia Corporation Company 2023 BIA Revenue Est. $8.5 $6.4 $6.1 $5.9 $5.6 $32.9 Rank / Market Share 1 / 25.6% 2 / 19.4% 3 / 18.4% 4 / 17.9% 5 / 16.9% 0 1 3 4 5 6 Total 134 Fayetteville, NC Beasley Broadcast Group Cumulus Media Inc Colonial Radio Group Inc Carson, James E. WIDU Inc 2023 BIA Revenue Est. $6.9 $2.5 $0.7 $0.3 $0.2 $10.9 Rank / Market Share 1 / 62.9% 2 / 22.5% 3 / 6.4% 4 / 3.0% 5 / 1.6% 0 1 3 4 5 6 Total 42 Middlesex-Somerset-Union, NJ Beasley Broadcast Group Pillar of Fire EBC Music Inc 2023 BIA Revenue Est. $4.4 $0.8 $0.4 $5.5 Rank / Market Share 1 / 79.6% 2 / 13.6% 3 / 6.8% 0 1 2 3 5 6 Total Townsquare Media 52 Monmouth-Ocean, NJ Beasley Broadcast Group Press Communications LLC Incorporated 2023 BIA Revenue Est. $3.9 $8.0 $5.1 $17.0 Rank / Market Share 3 / 23.0% 1 / 47.3% 2 / 29.8% 0 1 3 4 5 6 Total 124 Morristown, NJ Beasley Broadcast Group Walia, Rahul 2023 BIA Revenue Est. $3.8 $0.1 $3.9 Rank / Market Share 1 / 97.5% 2 / 1.3% 0 1 2 3 4 5 Total 7 Atlanta, GA Beasley Broadcast Group CMG Media Corporation Audacy iHeartMedia Urban One Inc 2023 BIA Revenue Est. $0.3 $58.6 $33.0 $24.4 $22.3 $174.7 Rank / Market Share 47 / 0.1% 1 / 33.5% 2 / 18.9% 3 / 13.8% 4 / 12.7% Source: BIA 1. BIA 2023 OTA Gross Revenue estimate; estimates do not include trade/barter, production or promotion revenues and are generated using direct mail surveys, telemarketing, market Confidential | 10 contacts and computer modeling
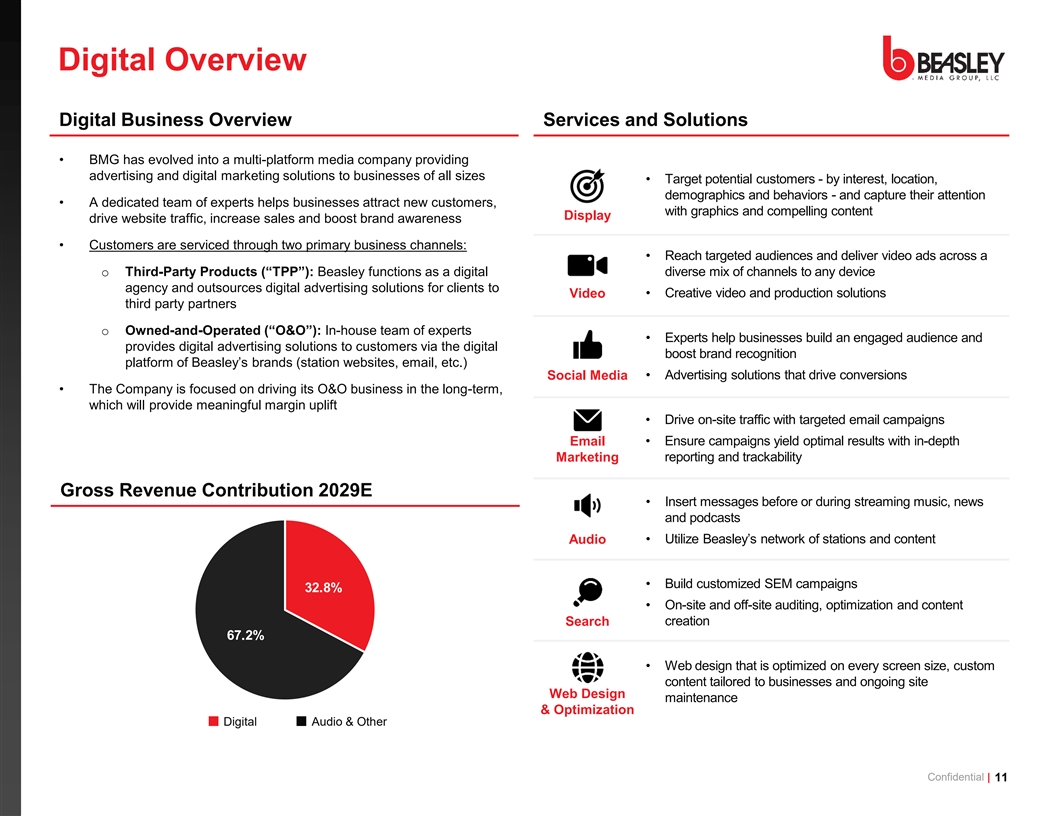
Digital Overview Digital Business Overview Services and Solutions • BMG has evolved into a multi-platform media company providing advertising and digital marketing solutions to businesses of all sizes • Target potential customers - by interest, location, demographics and behaviors - and capture their attention • A dedicated team of experts helps businesses attract new customers, with graphics and compelling content Display drive website traffic, increase sales and boost brand awareness • Customers are serviced through two primary business channels: • Reach targeted audiences and deliver video ads across a o Third-Party Products (“TPP”):B easley functions as a digital diverse mix of channels to any device agency and outsources digital advertising solutions for clients to • Creative video and production solutions Video third party partners o Owned-and-Operated (“O&O”): In-house team of experts • Experts help businesses build an engaged audience and provides digital advertising solutions to customers via the digital boost brand recognition platform of Beasley’s brands (station websites, email, etc.) Social Media • Advertising solutions that drive conversions • The Company is focused on driving its O&O business in the long-term, which will provide meaningful margin uplift • Drive on-site traffic with targeted email campaigns Email • Ensure campaigns yield optimal results with in-depth Marketing reporting and trackability Gross Revenue Contribution 2029E • Insert messages before or during streaming music, news and podcasts Audio • Utilize Beasley’s network of stations and content • Build customized SEM campaigns • On-site and off-site auditing, optimization and content creation Search • Web design that is optimized on every screen size, custom content tailored to businesses and ongoing site Web Design maintenance & Optimization Digital Audio & Other Confidential | 11

Historical Performance: Digital Digital Segment P&L Commentary CAGR • BMG has consistently outpaced the market with a 2021A – 1 FY2021A FY2022A FY2023A FY2024E '21A-'24E (in $ millions) 0 3A Digital Revenue CAGR of ~1 % vs. ~10% in BMG’s markets overall Total Revenues: TPP $18.8 $25.5 $27.3 $30.0 16.7% % Growth 35.6% 6.8% 9.8% 2• Margin expansion from 2021A – 2023A driven by operating O&O 14.6 15.9 19.1 23.5 17.4% leverage % Growth 9.5% 20.0% 23.1% Digital Gross Revenue $33.4 $41.5 $46.4 $53.5 17.0% % Growth 24.2% 11.9% 15.3% o ~$6mm of G&A expenses in 2023 which are primarily fixed 1 % Industry Growth 14.1% 6.0% - 1 costs and have remained largely stable since 2021, despite revenue CAGR of ~18% Commissions (Digital) $0.6 $0.7 $1.0 $2.1 49.4% Digital Net Revenue $32.7 $40.8 $45.4 $51.3 16.2% % Growth 24.5% 11.3% 13.2% • Growth in Digital has been driven by increases in AOV 3 Station Operating Expense: Programming/Engineering Expenses $14.5 $14.7 $14.8 $15.0 1.0% Sales Expenses 12.7 16.6 20.2 20.9 18.0% G&A Expenses 5.1 5.1 5.9 5.6 3.2% 2 Total Station Operating Expense $32.4 $36.4 $40.8 $41.5 8.7% % of Net Revenue 89.3% 90.0% 80.8% Digital Station Operating Income $0.4 $4.4 $4.6 $9.8 193.8% % Margin 1.2% 10.7% 10.0% 19.2% Other: Content Sponsorship Revenue – – – $0.2 NM Content Sponsorship Expense - - - 0.7 NM Content Sponsor. Operating Income $- $- $- ($0.6) NM Memo: Total Customers 3,204 3,273 3,283 3,329 1.3% 3 AOV $10,421 $12,671 $14,131 $16,070 15.5% Confidential | 12 1. BIA estimate; reflects weighted average Gross Digital Revenue growth rate for markets with BMG presence
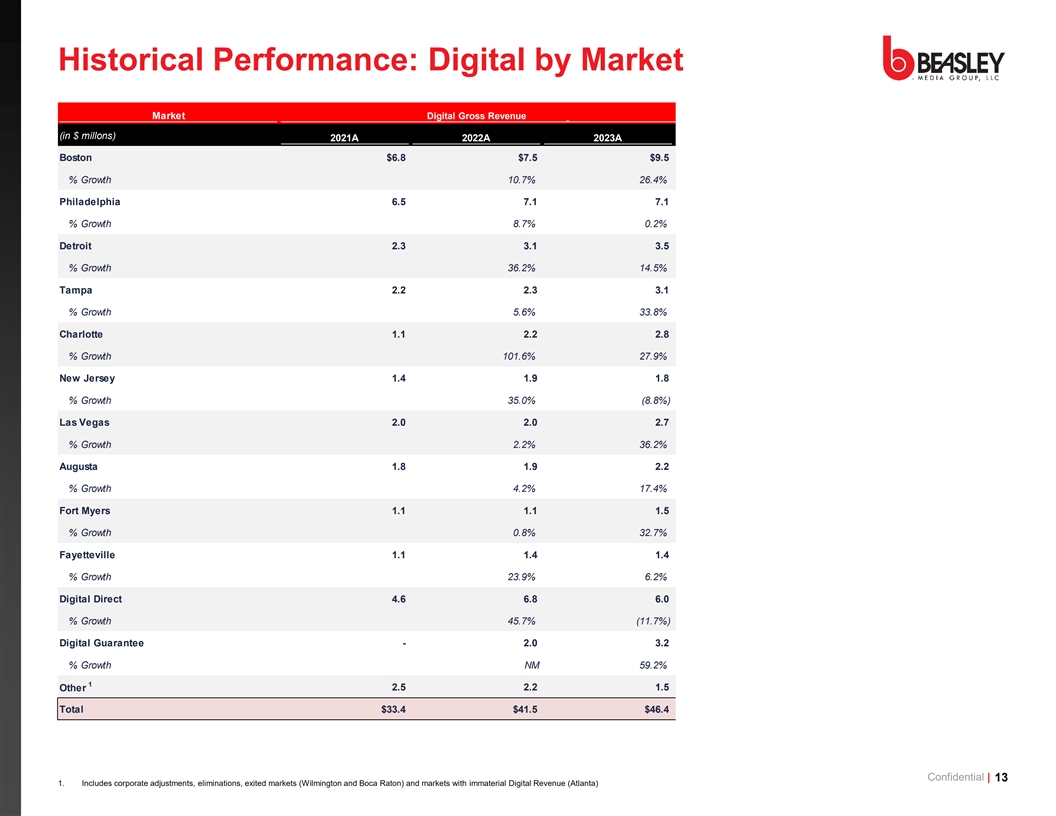
Historical Performance: Digital by Market Market Digital Gross Revenue Digital Gross Revenue (in $ millons) 2021A 2022A 2023A 2024E '21A - '24E CAGR Boston $6.8 $7.5 $9.5 $9.7 12.4% % Growth 10.7% 26.4% 1.4% Philadelphia 6.5 7.1 7.1 9.0 11.4% % Growth 8.7% 0.2% 27.0% Detroit 2.3 3.1 3.5 4.3 23.8% % Growth 36.2% 14.5% 21.8% Tampa 2.2 2.3 3.1 4.4 26.4% % Growth 5.6% 33.8% 43.0% Charlotte 1.1 2.2 2.8 3.9 53.3% % Growth 101.6% 27.9% 39.8% New Jersey 1.4 1.9 1.8 2.6 21.7% % Growth 35.0% (8.8%) 46.4% Las Vegas 2.0 2.0 2.7 1.8 (2.9%) % Growth 2.2% 36.2% (34.1%) Augusta 1.8 1.9 2.2 2.6 12.7% % Growth 4.2% 17.4% 17.1% Fort Myers 1.1 1.1 1.5 1.6 13.3% % Growth 0.8% 32.7% 8.6% Fayetteville 1.1 1.4 1.4 1.5 11.2% % Growth 23.9% 6.2% 4.6% Digital Direct 4.6 6.8 6.0 10.2 29.9% % Growth 45.7% (11.7%) 70.7% Digital Guarantee - 2.0 3.2 1.9 NM % Growth NM 59.2% (41.1%) 1 2.5 2.2 1.5 0.0 NM Other Total $33.4 $41.5 $46.4 $53.5 17.0% Confidential | 13 1. Includes corporate adjustments, eliminations, exited markets (Wilmington and Boca Raton) and markets with immaterial Digital Revenue (Atlanta)
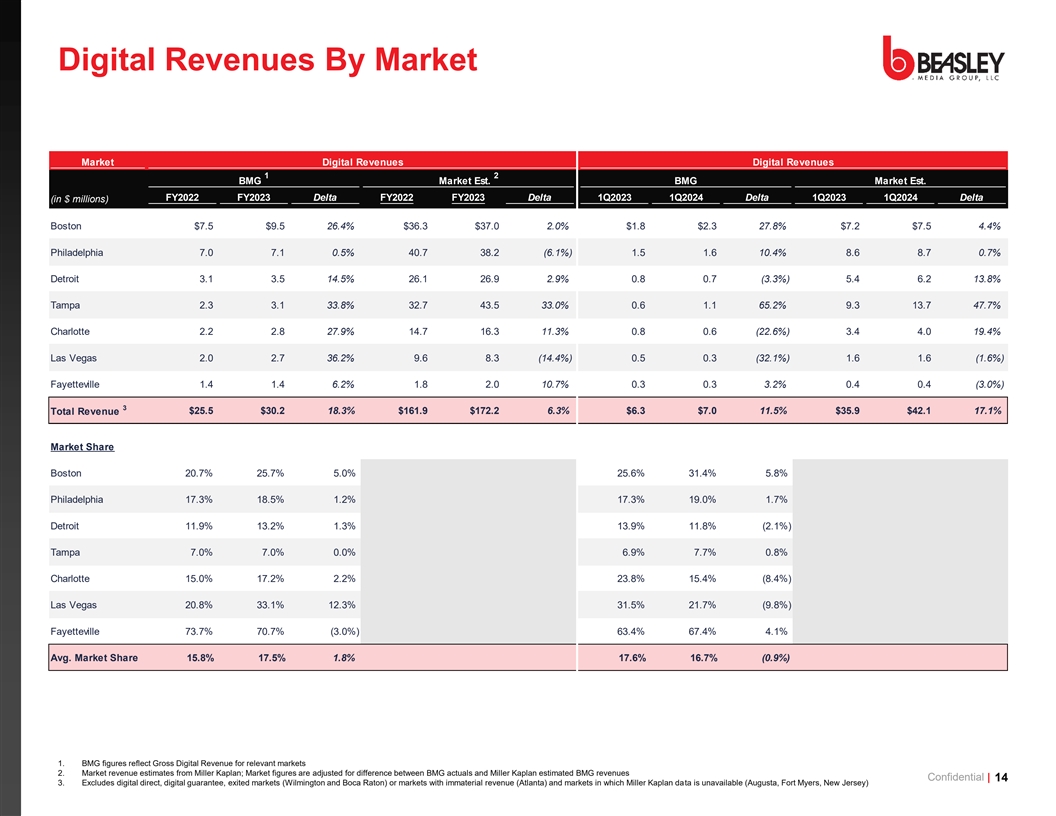
Digital Revenues By Market Market Digital Revenues Digital Revenues 1 2 BMG Market Est. BMG Market Est. FY2022 FY2023 Delta FY2022 FY2023 Delta 1Q2023 1Q2024 Delta 1Q2023 1Q2024 Delta (in $ millions) Boston $7.5 $9.5 26.4% $36.3 $37.0 2.0% $1.8 $2.3 27.8% $7.2 $7.5 4.4% Philadelphia 7.0 7.1 0.5% 40.7 38.2 (6.1%) 1.5 1.6 10.4% 8.6 8.7 0.7% Detroit 3.1 3.5 14.5% 26.1 26.9 2.9% 0.8 0.7 (3.3%) 5.4 6.2 13.8% Tampa 2.3 3.1 33.8% 32.7 43.5 33.0% 0.6 1.1 65.2% 9.3 13.7 47.7% Charlotte 2.2 2.8 27.9% 14.7 16.3 11.3% 0.8 0.6 (22.6%) 3.4 4.0 19.4% Las Vegas 2.0 2.7 36.2% 9.6 8.3 (14.4%) 0.5 0.3 (32.1%) 1.6 1.6 (1.6%) Fayetteville 1.4 1.4 6.2% 1.8 2.0 10.7% 0.3 0.3 3.2% 0.4 0.4 (3.0%) 3 Total Revenue $25.5 $30.2 18.3% $161.9 $172.2 6.3% $6.3 $7.0 11.5% $35.9 $42.1 17.1% Market Share Boston 20.7% 25.7% 5.0% 25.6% 31.4% 5.8% Philadelphia 17.3% 18.5% 1.2% 17.3% 19.0% 1.7% Detroit 11.9% 13.2% 1.3% 13.9% 11.8% (2.1%) Tampa 7.0% 7.0% 0.0% 6.9% 7.7% 0.8% Charlotte 15.0% 17.2% 2.2% 23.8% 15.4% (8.4%) Las Vegas 20.8% 33.1% 12.3% 31.5% 21.7% (9.8%) Fayetteville 73.7% 70.7% (3.0%) 63.4% 67.4% 4.1% Avg. Market Share 15.8% 17.5% 1.8% 17.6% 16.7% (0.9%) 1. BMG figures reflect Gross Digital Revenue for relevant markets 2. Market revenue estimates from Miller Kaplan; Market figures are adjusted for difference between BMG actuals and Miller Kaplan estimated BMG revenues Confidential | 14 3. Excludes digital direct, digital guarantee, exited markets (Wilmington and Boca Raton) or markets with immaterial revenue (Atlanta) and markets in which Miller Kaplan data is unavailable (Augusta, Fort Myers, New Jersey)

2. Business Plan Overview Confidential | 15
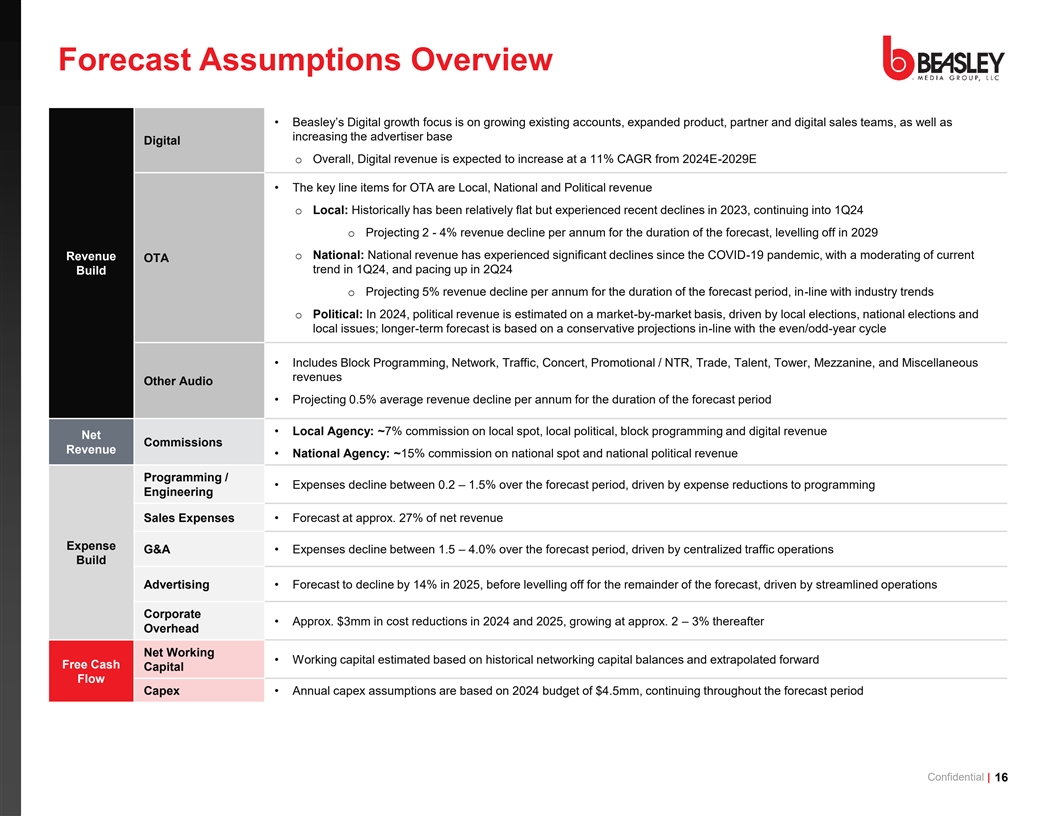
Forecast Assumptions Overview • Beasley’s Digital growth focus is on growing existing accounts, expanded product, partner and digital sales teams, a s well as increasing the advertiser base Digital o Overall, Digital revenue is expected to increase at a 11% CAGR from 2024E-2029E • The key line items for OTA are Local, National and Political revenue o Local: Historically has been relatively flat but experienced recent declines in 2023, continuing into 1Q24 o Projecting 2 - 4% revenue decline per annum for the duration of the forecast, levelling off in 2029 o National: National revenue has experienced significant declines since the COVID-19 pandemic, with a moderating of current Revenue OTA trend in 1Q24, and pacing up in 2Q24 Build o Projecting 5% revenue decline per annum for the duration of the forecast period, in-line with industry trends o Political: In 2024, political revenue is estimated on a market-by-market basis, driven by local elections, national elections and local issues; longer-term forecast is based on a conservative projections in-line with the even/odd-year cycle • Includes Block Programming, Network, Traffic, Concert, Promotional / NTR, Trade, Talent, Tower, Mezzanine, and Miscellaneous revenues Other Audio • Projecting 0.5% average revenue decline per annum for the duration of the forecast period • Local Agency: ~7% commission on local spot, local political, block programming and digital revenue Net Commissions Revenue • National Agency: ~15% commission on national spot and national political revenue Programming / • Expenses decline between 0.2 – 1.5% over the forecast period, driven by expense reductions to programming Engineering Sales Expenses • Forecast at approx. 27% of net revenue Expense G&A • Expenses decline between 1.5 – 4.0% over the forecast period, driven by centralized traffic operations Build Advertising • Forecast to decline by 14% in 2025, before levelling off for the remainder of the forecast, driven by streamlined operations Corporate • Approx. $3mm in cost reductions in 2024 and 2025, growing at approx. 2 – 3% thereafter Overhead Net Working • Working capital estimated based on historical networking capital balances and extrapolated forward Free Cash Capital Flow Capex • Annual capex assumptions are based on 2024 budget of $4.5mm, continuing throughout the forecast period Confidential | 16
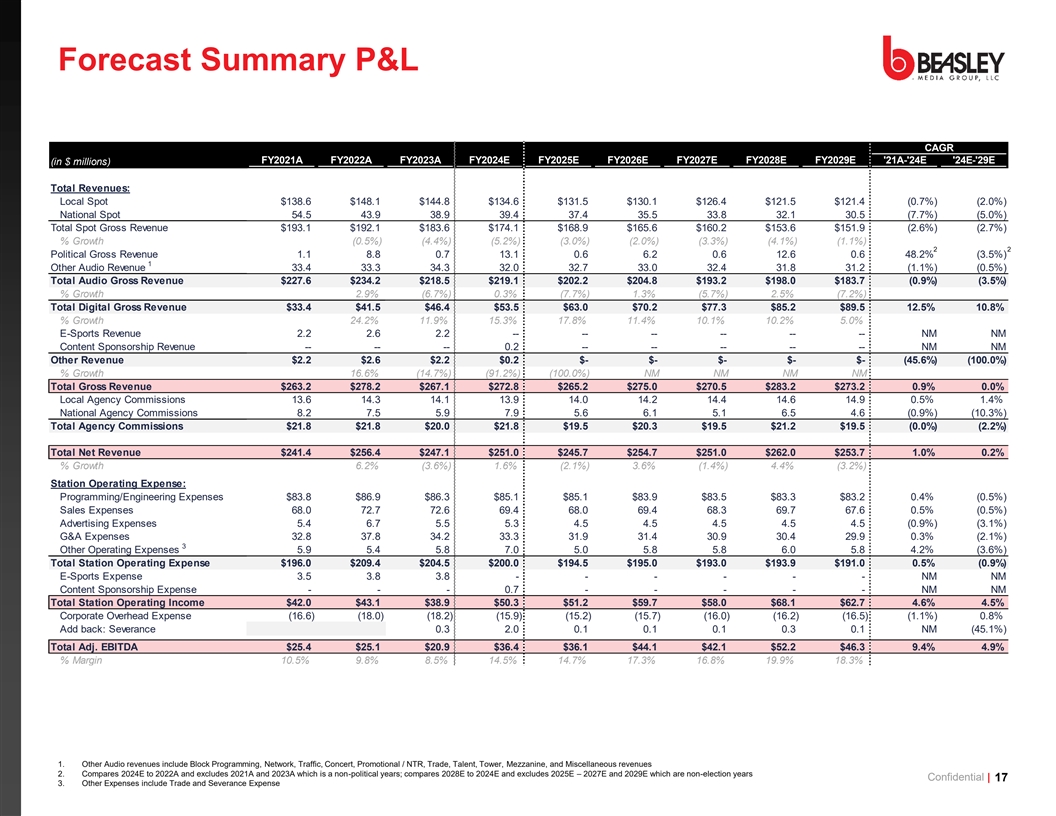
Forecast Summary P&L CAGR FY2021A FY2022A FY2023A FY2024E FY2025E FY2026E FY2027E FY2028E FY2029E '21A-'24E '24E-'29E (in $ millions) Total Revenues: Local Spot $138.6 $148.1 $144.8 $134.6 $131.5 $130.1 $126.4 $121.5 $121.4 (0.7%) (2.0%) National Spot 54.5 43.9 38.9 39.4 37.4 35.5 33.8 32.1 30.5 (7.7%) (5.0%) Total Spot Gross Revenue $193.1 $192.1 $183.6 $174.1 $168.9 $165.6 $160.2 $153.6 $151.9 (2.6%) (2.7%) % Growth (0.5%) (4.4%) (5.2%) (3.0%) (2.0%) (3.3%) (4.1%) (1.1%) 2 2 Political Gross Revenue 1.1 8.8 0.7 13.1 0.6 6.2 0.6 12.6 0.6 48.2% (3.5%) 1 Other Audio Revenue 33.4 33.3 34.3 32.0 32.7 33.0 32.4 31.8 31.2 (1.1%) (0.5%) Total Audio Gross Revenue $227.6 $234.2 $218.5 $219.1 $202.2 $204.8 $193.2 $198.0 $183.7 (0.9%) (3.5%) % Growth 2.9% (6.7%) 0.3% (7.7%) 1.3% (5.7%) 2.5% (7.2%) Total Digital Gross Revenue $33.4 $41.5 $46.4 $53.5 $63.0 $70.2 $77.3 $85.2 $89.5 12.5% 10.8% % Growth 24.2% 11.9% 15.3% 17.8% 11.4% 10.1% 10.2% 5.0% E-Sports Revenue 2.2 2.6 2.2 -- -- -- -- -- -- NM NM Content Sponsorship Revenue -- -- -- 0.2 -- -- -- -- -- NM NM Other Revenue $2.2 $2.6 $2.2 $0.2 $- $- $- $- $- (45.6%) (100.0%) % Growth 16.6% (14.7%) (91.2%) (100.0%) NM NM NM NM Total Gross Revenue $263.2 $278.2 $267.1 $272.8 $265.2 $275.0 $270.5 $283.2 $273.2 0.9% 0.0% Local Agency Commissions 13.6 14.3 14.1 13.9 14.0 14.2 14.4 14.6 14.9 0.5% 1.4% National Agency Commissions 8.2 7.5 5.9 7.9 5.6 6.1 5.1 6.5 4.6 (0.9%) (10.3%) Total Agency Commissions $21.8 $21.8 $20.0 $21.8 $19.5 $20.3 $19.5 $21.2 $19.5 (0.0%) (2.2%) Total Net Revenue $241.4 $256.4 $247.1 $251.0 $245.7 $254.7 $251.0 $262.0 $253.7 1.0% 0.2% % Growth 6.2% (3.6%) 1.6% (2.1%) 3.6% (1.4%) 4.4% (3.2%) Station Operating Expense: Programming/Engineering Expenses $83.8 $86.9 $86.3 $85.1 $85.1 $83.9 $83.5 $83.3 $83.2 0.4% (0.5%) Sales Expenses 68.0 72.7 72.6 69.4 68.0 69.4 68.3 69.7 67.6 0.5% (0.5%) Advertising Expenses 5.4 6.7 5.5 5.3 4.5 4.5 4.5 4.5 4.5 (0.9%) (3.1%) G&A Expenses 32.8 37.8 34.2 33.3 31.9 31.4 30.9 30.4 29.9 0.3% (2.1%) 3 Other Operating Expenses 5.9 5.4 5.8 7.0 5.0 5.8 5.8 6.0 5.8 4.2% (3.6%) Total Station Operating Expense $196.0 $209.4 $204.5 $200.0 $194.5 $195.0 $193.0 $193.9 $191.0 0.5% (0.9%) E-Sports Expense 3.5 3.8 3.8 - - - - - - NM NM Content Sponsorship Expense - - - 0.7 - - - - - NM NM Total Station Operating Income $42.0 $43.1 $38.9 $50.3 $51.2 $59.7 $58.0 $68.1 $62.7 4.6% 4.5% Corporate Overhead Expense (16.6) (18.0) (18.2) (15.9) (15.2) (15.7) (16.0) (16.2) (16.5) (1.1%) 0.8% Add back: Severance 0.3 2.0 0.1 0.1 0.1 0.3 0.1 NM (45.1%) Total Adj. EBITDA $25.4 $25.1 $20.9 $36.4 $36.1 $44.1 $42.1 $52.2 $46.3 9.4% 4.9% % Margin 10.5% 9.8% 8.5% 14.5% 14.7% 17.3% 16.8% 19.9% 18.3% Net Interest Expense (21.7) (21.8) (22.0) (22.1) (22.2) (22.2) Tax Expense (4.7) (5.0) (6.4) (6.1) (7.8) (6.8) Severance Expense (2.0) (0.1) (0.1) (0.1) (0.3) (0.1) Proceeds from Sale of BMI 6.0 - - - - - Capital Expenditures (4.5) (4.5) (4.5) (4.5) (4.5) (4.5) 4 FCF Adjustments 0.2 0.2 2.7 0.1 1.3 (1.3) Free Cash Flow $9.8 $7.4 $11.3 $10.7 $16.2 $14.8 NA 8.8% 1. Other Audio revenues include Block Programming, Network, Traffic, Concert, Promotional / NTR, Trade, Talent, Tower, Mezzanine, and Miscellaneous revenues 2. Compares 2024E to 2022A and excludes 2021A and 2023A which is a non-political years; compares 2028E to 2024E and excludes 2025E – 2027E and 2029E which are non-election years Confidential | 17 3. Other Expenses include Trade and Severance Expense
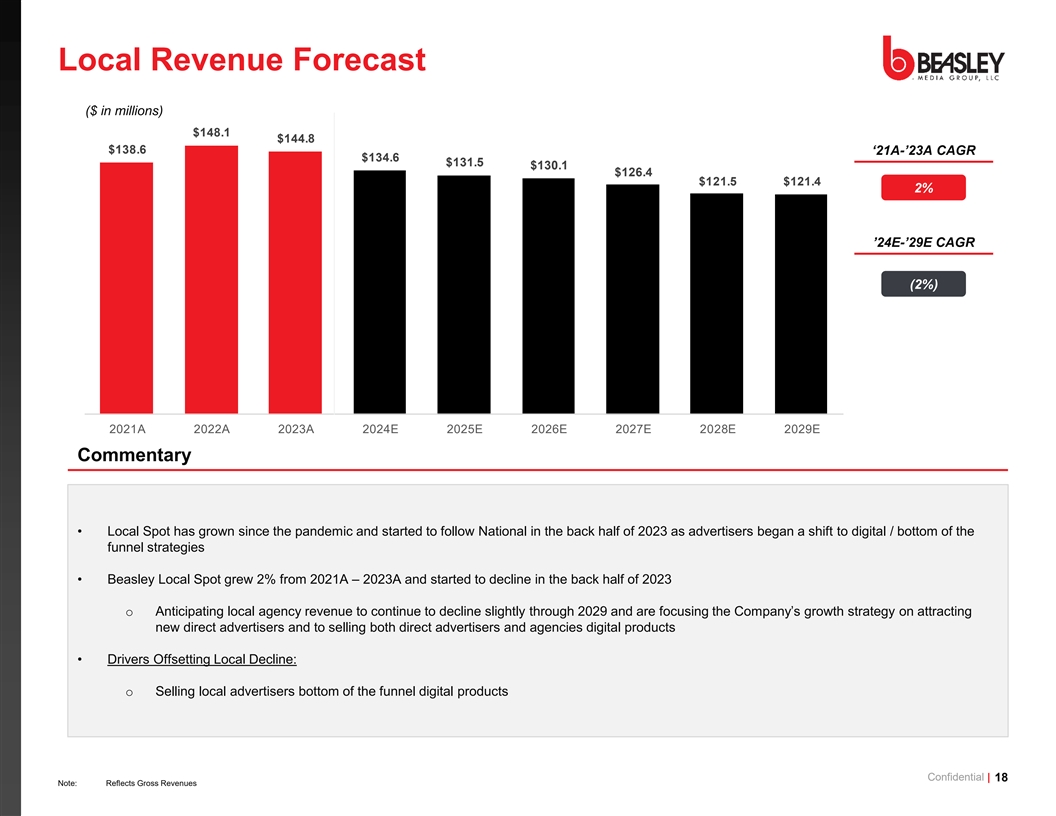
Local Revenue Forecast ($ in millions) ‘21A-’23A CAGR 2% ’24E-’29E CAGR (2%) 0 1A 0 A 0 3A 0 E 0 E 0 E 0 E 0 E 0 E Commentary • Local Spot has grown since the pandemic and started to follow National in the back half of 2023 as advertisers began a shift to digital / bottom of the funnel strategies • Beasley Local Spot grew 2% from 2021A – 2023A and started to decline in the back half of 2023 o Anticipating local agency revenue to continue to decline slightly through 0 and are focusing the Company’s growth ons tr attate racgy ting new direct advertisers and to selling both direct advertisers and agencies digital products • Drivers Offsetting Local Decline: o Selling local advertisers bottom of the funnel digital products Confidential | 18 Note: Reflects Gross Revenues

National Revenue Forecast ($ in millions) ‘21A-’23A CAGR (16%) ’24E-’29E CAGR (5%) 0 1A 0 A 0 3A 0 E 0 E 0 E 0 E 0 E 0 E Commentary • National has declined steeply since the pandemic with a (-16%) CAGR since 2021A o National advertisers have been focused on driving bottom of the funnel which has resulted in a shift in media investment away from linear and toward digital • Beginning in 1Q24, the Company has seen a modest recovery in National Revenue o Despite the recent trend, the forecast assumes a 5% decline per year which is in-line with industry benchmarks • Forecast Drivers: o National Advertisers have lost brand equity as a result of a focus on bottom of the funnel and the Company expects seeing a return to linear, brand-building media o National Agencies adding radio to the mix to offset the decline in TV reach Confidential | 19 Note: Reflects Gross Revenues
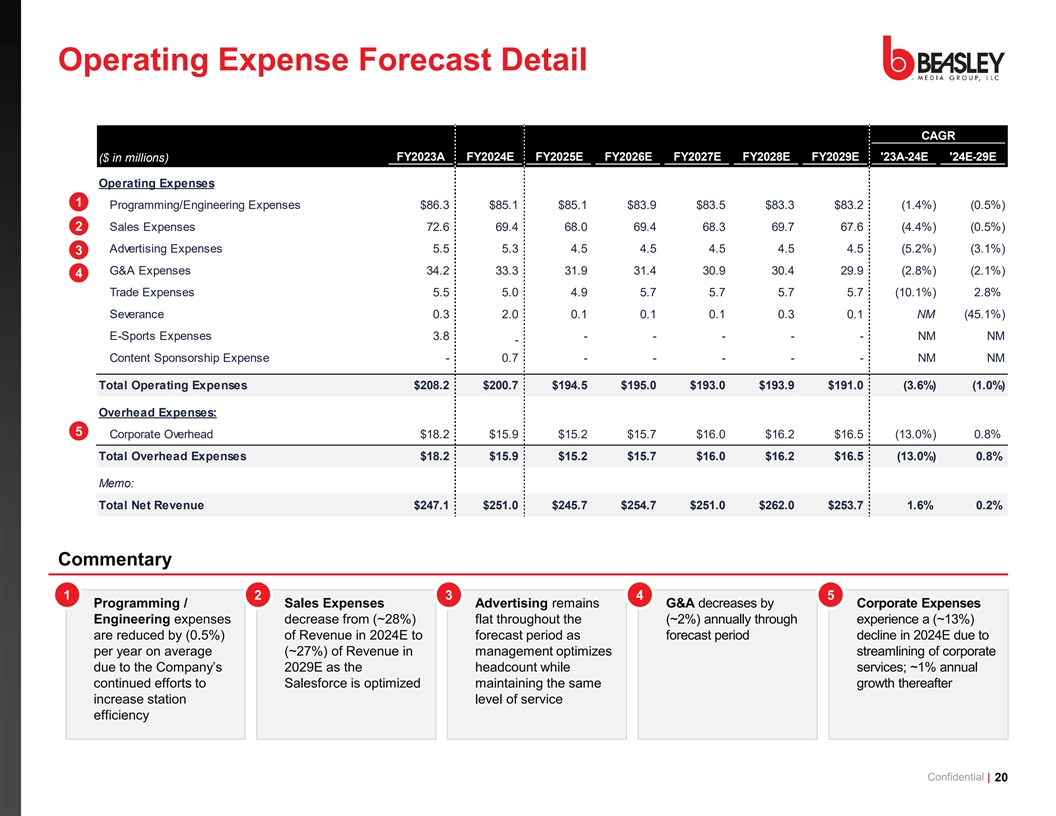
Operating Expense Forecast Detail CAGR ($ in millions) FY2023A FY2024E FY2025E FY2026E FY2027E FY2028E FY2029E '23A-24E '24E-29E Operating Expenses 1 Programming/Engineering Expenses $86.3 $85.1 $85.1 $83.9 $83.5 $83.3 $83.2 (1.4%) (0.5%) 2 Sales Expenses 72.6 69.4 68.0 69.4 68.3 69.7 67.6 (4.4%) (0.5%) Advertising Expenses 5.5 5.3 4.5 4.5 4.5 4.5 4.5 (5.2%) (3.1%) 3 G&A Expenses 34.2 33.3 31.9 31.4 30.9 30.4 29.9 (2.8%) (2.1%) 4 Trade Expenses 5.5 5.0 4.9 5.7 5.7 5.7 5.7 (10.1%) 2.8% Severance 0.3 2.0 0.1 0.1 0.1 0.3 0.1 NM (45.1%) E-Sports Expenses 3.8 - - - - - NM NM - Content Sponsorship Expense - 0.7 - - - - - NM NM Total Operating Expenses $208.2 $200.7 $194.5 $195.0 $193.0 $193.9 $191.0 (3.6%) (1.0%) Overhead Expenses: 5 Corporate Overhead $18.2 $15.9 $15.2 $15.7 $16.0 $16.2 $16.5 (13.0%) 0.8% Total Overhead Expenses $18.2 $15.9 $15.2 $15.7 $16.0 $16.2 $16.5 (13.0%) 0.8% Memo: Total Net Revenue $247.1 $251.0 $245.7 $254.7 $251.0 $262.0 $253.7 1.6% 0.2% Commentary 1 2 3 4 5 • Programming / • Sales Expenses • Advertising remains • G&A decreases by • Corporate Expenses Engineering expenses decrease from (~28%) flat throughout the (~2%) annually through experience a (~13%) are reduced by (0.5%) of Revenue in 2024E to forecast period as forecast period decline in 2024E due to per year on average (~27%) of Revenue in management optimizes streamlining of corporate due to the Company’s 2029E as the headcount while services; ~1% annual continued efforts to Salesforce is optimized maintaining the same growth thereafter increase station level of service efficiency Confidential | 20
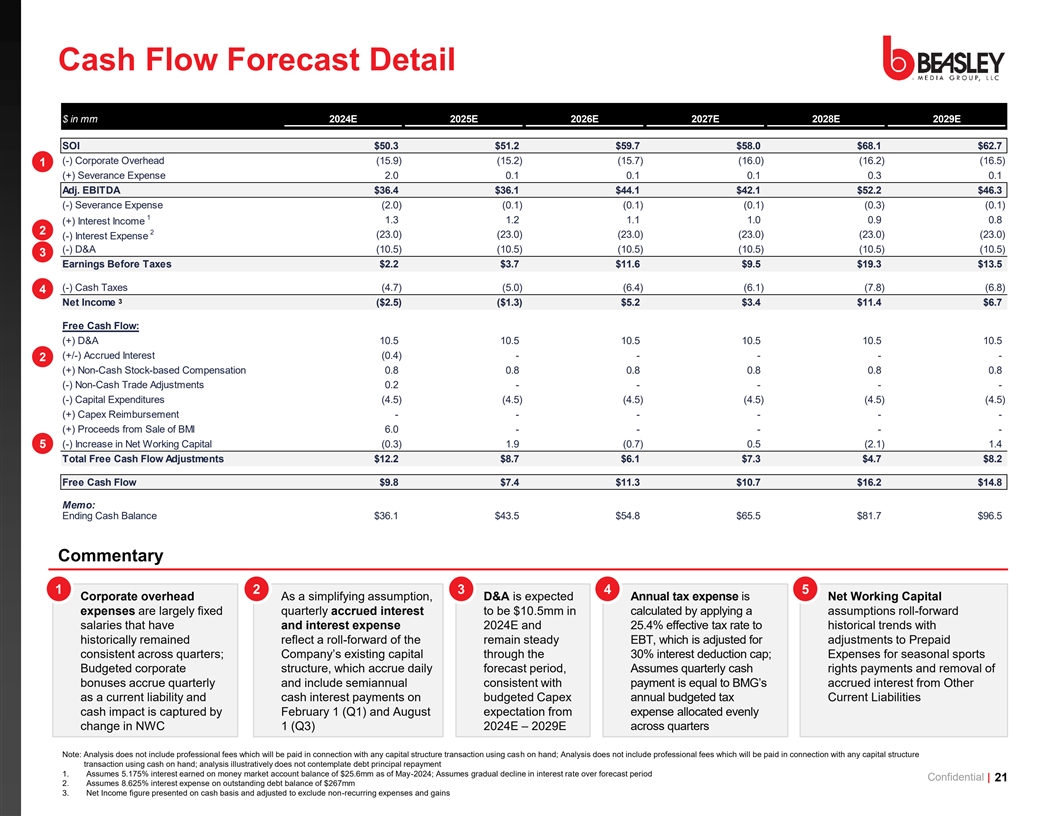
Cash Flow Forecast Detail $ in mm 2024E 2025E 2026E 2027E 2028E 2029E SOI $50.3 $51.2 $59.7 $58.0 $68.1 $62.7 (-) Corporate Overhead (15.9) (15.2) (15.7) (1 6.0) (16.2) (16.5) 1 (+) Severance Expense 2.0 0.1 0.1 0.1 0.3 0.1 Adj. EBITDA $36.4 $36.1 $44.1 $42.1 $52.2 $46.3 (-) Severance Expense (2.0) (0.1) (0 .1) (0 .1) (0.3) (0.1) 1 1.3 1.2 1.1 1.0 0.9 0.8 (+) Interest Income 2 2 (23.0) (23.0) (23.0) (23.0) (23.0) (23.0) (-) Interest Expense (-) D&A (10.5) (10.5) (10.5) (10.5) (10.5) (10.5) 3 Earnings Before Taxes $2.2 $3.7 $11.6 $9.5 $19.3 $13.5 (-) Cash Taxes (4.7) (5.0) (6.4) (6.1) (7.8) (6.8) 4 3 Net Income ($2.5) ($1.3) $5.2 $3.4 $11.4 $6.7 Free Cash Flow: (+) D&A 10.5 10.5 10.5 10.5 10.5 10.5 (+/-) Accrued Interest (0.4) - - - - - 2 (+) Non-Cash Stock-based Compensation 0.8 0.8 0.8 0.8 0.8 0.8 (-) Non-Cash Trade Adjustments 0.2 - - - - - (-) Capital Expenditures (4.5) (4.5) (4.5) (4.5) (4.5) (4.5) (+) Capex Reimbursement - - - - - - (+) Proceeds from Sale of BMI 6.0 - - - - - 5 (-) Increase in Net Working Capital (0.3) 1.9 (0.7) 0.5 (2.1) 1.4 Total Free Cash Flow Adjustments $12.2 $8.7 $6.1 $7.3 $4.7 $8.2 Free Cash Flow $9.8 $7.4 $11.3 $10.7 $16.2 $14.8 Memo: Ending Cash Balance $36.1 $43.5 $54.8 $65.5 $81.7 $96.5 Commentary 1 2 3 4 5 • Corporate overhead • As a simplifying assumption, • D&A is expected • Annual tax expense is • Net Working Capital expenses are largely fixed quarterly accrued interest to be $10.5mm in calculated by applying a assumptions roll-forward salaries that have and interest expense 2024E and 25.4% effective tax rate to historical trends with historically remained reflect a roll-forward of the remain steady EBT, which is adjusted for adjustments to Prepaid consistent across quarters; Company’s existing capital through the 30% interest deduction cap; Expenses for seasonal sports Budgeted corporate structure, which accrue daily forecast period, Assumes quarterly cash rights payments and removal of bonuses accrue quarterly and include semiannual consistent with payment is equal to BMG’s accrued interest from Other as a current liability and cash interest payments on budgeted Capex annual budgeted tax Current Liabilities cash impact is captured by February 1 (Q1) and August expectation from expense allocated evenly change in NWC 1 (Q3) 2024E – 2029E across quarters Note: Analysis does not include professional fees which will be paid in connection with any capital structure transaction using cash on hand; Analysis does not include professional fees which will be paid in connection with any capital structure transaction using cash on hand; analysis illustratively does not contemplate debt principal repayment 1. Assumes 5.175% interest earned on money market account balance of $25.6mm as of May-2024; Assumes gradual decline in interest rate over forecast period Confidential | 21 2. Assumes 8.625% interest expense on outstanding debt balance of $267mm 3. Net Income figure presented on cash basis and adjusted to exclude non-recurring expenses and gains

3. Incremental Financial Detail Confidential | 22

Overview of 2024E Cost-Saving Initiatives ‘ E Realized PF Annual Timing Commentary Cost Savings Cost Savings • Preemptively cut executive compensation by 30% for 2024E 30% Reduction to 2Q24 $1.6mm o $1.4mm of cash compensation / bonus savings, with remaining $0.2mm of Executive Comp savings tied to executives taking up additional market manager roles • Terminated 50+ under-utilized full time and part time employees across sales, programming, advertising and G&A functions, reflecting $3.8mm of 2024E savings in compensation expense 2Q / 3Q RIF 2Q – 3Q24 $6.7mm $10.1mm • Other associated cost savings initiatives (i.e., reduction of rights fees, COGS, research and marketing, etc.) totaling $2.9mm of additional savings in 2024E Corporate • Corporate Overhead Savings Overhead 2Q – 4Q24 $840k $1.4mm o Re-allocated corporate staff to market level functions to reduce overhead Reductions th • Shut down of Guarantee Digital is effective July 15 Shut Down of • Key revenue accounts are being moved to Digital Direct 3Q24 $540k $960k Guarantee Digital • Termination of 5 employees and reduction of operating expenses to result in significant cost savings Shut Down of • Shut down of un-profitable Outlaws content sponsorship business Outlaws Content 2Q – 4Q24 $400k $830k o Received inbound for purchase of Outlaws content business – buyer to Business assume all associated expenses and liabilities Completed and in-process initiatives total ~$15mm of pro-forma cost savings Confidential | 23 In Process Completed
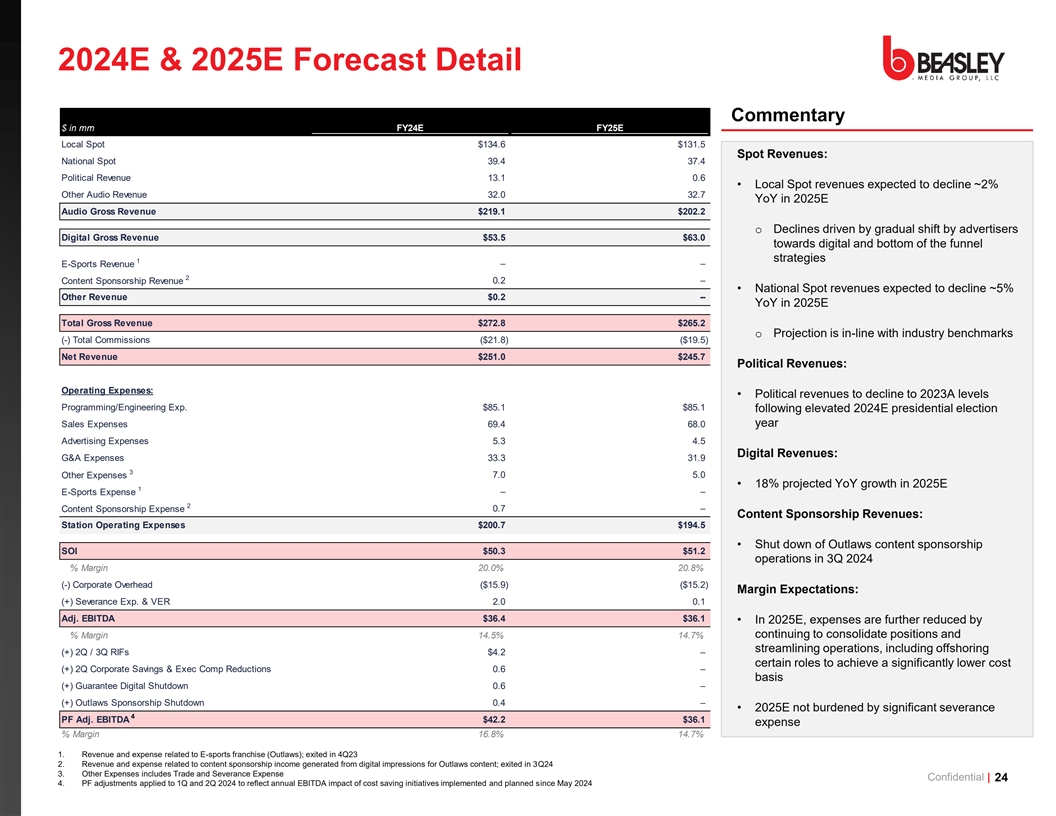
2024E & 2025E Forecast Detail Commentary $ in mm FY24E FY25E Local Spot $134.6 $131.5 Spot Revenues: National Spot 39.4 37.4 Political Revenue 13.1 0.6 • Local Spot revenues expected to decline ~2% Other Audio Revenue 32.0 32.7 YoY in 2025E Audio Gross Revenue $219.1 $202.2 o Declines driven by gradual shift by advertisers Digital Gross Revenue $53.5 $63.0 towards digital and bottom of the funnel strategies 1 – – E-Sports Revenue 2 Content Sponsorship Revenue 0.2 – • National Spot revenues expected to decline ~5% Other Revenue $0.2 – YoY in 2025E Total Gross Revenue $272.8 $265.2 o Projection is in-line with industry benchmarks (-) Total Commissions ($21.8) ($19.5) Net Revenue $251.0 $245.7 Political Revenues: Operating Expenses: • Political revenues to decline to 2023A levels Programming/Engineering Exp. $85.1 $85.1 following elevated 2024E presidential election year Sales Expenses 69.4 68.0 Advertising Expenses 5.3 4.5 Digital Revenues: G&A Expenses 33.3 31.9 3 Other Expenses 7.0 5.0 • 18% projected YoY growth in 2025E 1 – – E-Sports Expense 2 Content Sponsorship Expense 0.7 – Content Sponsorship Revenues: Station Operating Expenses $200.7 $194.5 • Shut down of Outlaws content sponsorship SOI $50.3 $51.2 operations in 3Q 2024 % Margin 20.0% 20.8% (-) Corporate Overhead ($15.9) ($15.2) Margin Expectations: (+) Severance Exp. & VER 2.0 0.1 Adj. EBITDA $36.4 $36.1 • In 2025E, expenses are further reduced by % Margin 14.5% 14.7% continuing to consolidate positions and streamlining operations, including offshoring (+) 2Q / 3Q RIFs $4.2 – certain roles to achieve a significantly lower cost (+) 2Q Corporate Savings & Exec Comp Reductions 0.6 – basis (+) Guarantee Digital Shutdown 0.6 – (+) Outlaws Sponsorship Shutdown 0.4 – • 2025E not burdened by significant severance 4 PF Adj. EBITDA $42.2 $36.1 expense % Margin 16.8% 14.7% 1. Revenue and expense related to E-sports franchise (Outlaws); exited in 4Q23 2. Revenue and expense related to content sponsorship income generated from digital impressions for Outlaws content; exited in 3Q24 3. Other Expenses includes Trade and Severance Expense Confidential | 24 4. PF adjustments applied to 1Q and 2Q 2024 to reflect annual EBITDA impact of cost saving initiatives implemented and planned since May 2024

4. Appendix Confidential | 25
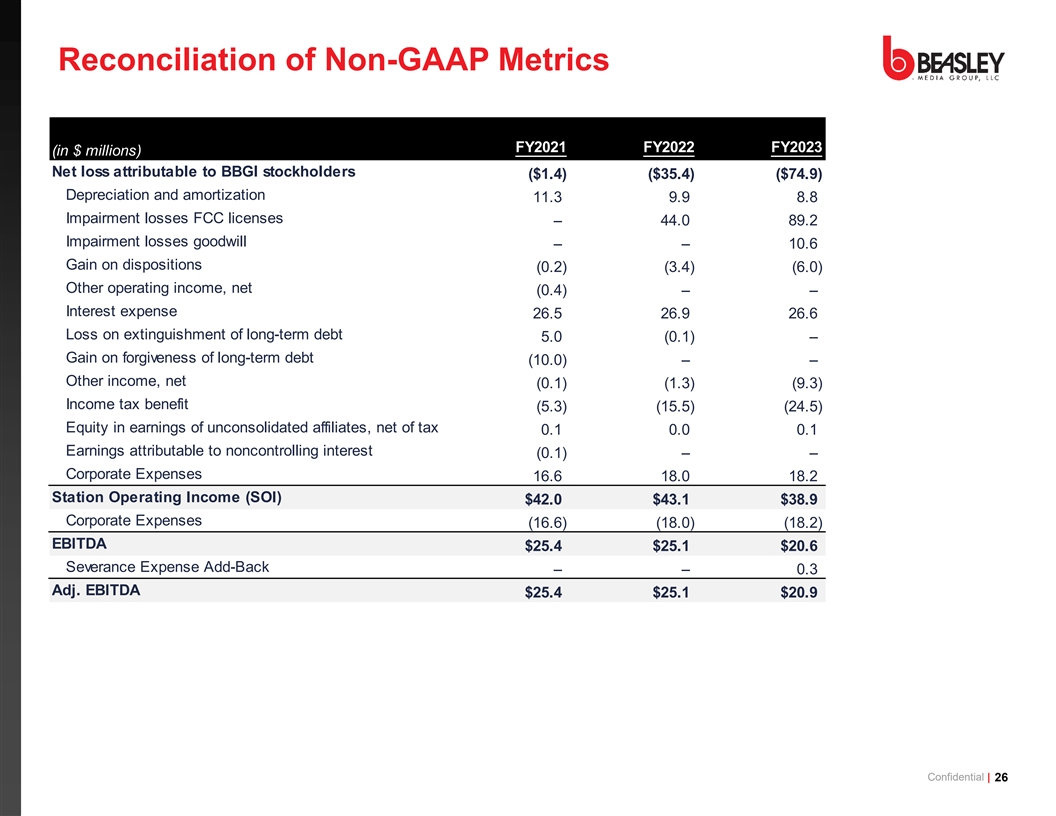
Reconciliation of Non-GAAP Metrics FY2021 FY2022 FY2023 (in $ millions) Net loss attributable to BBGI stockholders ($1.4) ($35.4) ($74.9) Depreciation and amortization 11.3 9.9 8.8 Impairment losses FCC licenses – 44.0 89.2 Impairment losses goodwill – – 10.6 Gain on dispositions (0.2) (3.4) (6.0) Other operating income, net (0.4) – – Interest expense 26.5 26.9 26.6 Loss on extinguishment of long-term debt 5.0 (0.1) – Gain on forgiveness of long-term debt (10.0) – – Other income, net (0.1) (1.3) (9.3) Income tax benefit (5.3) (15.5) (24.5) Equity in earnings of unconsolidated affiliates, net of tax 0.1 0.0 0.1 Earnings attributable to noncontrolling interest (0.1) – – Corporate Expenses 16.6 18.0 18.2 Station Operating Income (SOI) $42.0 $43.1 $38.9 Corporate Expenses (16.6) (18.0) (18.2) EBITDA $25.4 $25.1 $20.6 Severance Expense Add-Back – – 0.3 Adj. EBITDA $25.4 $25.1 $20.9 Confidential | 26
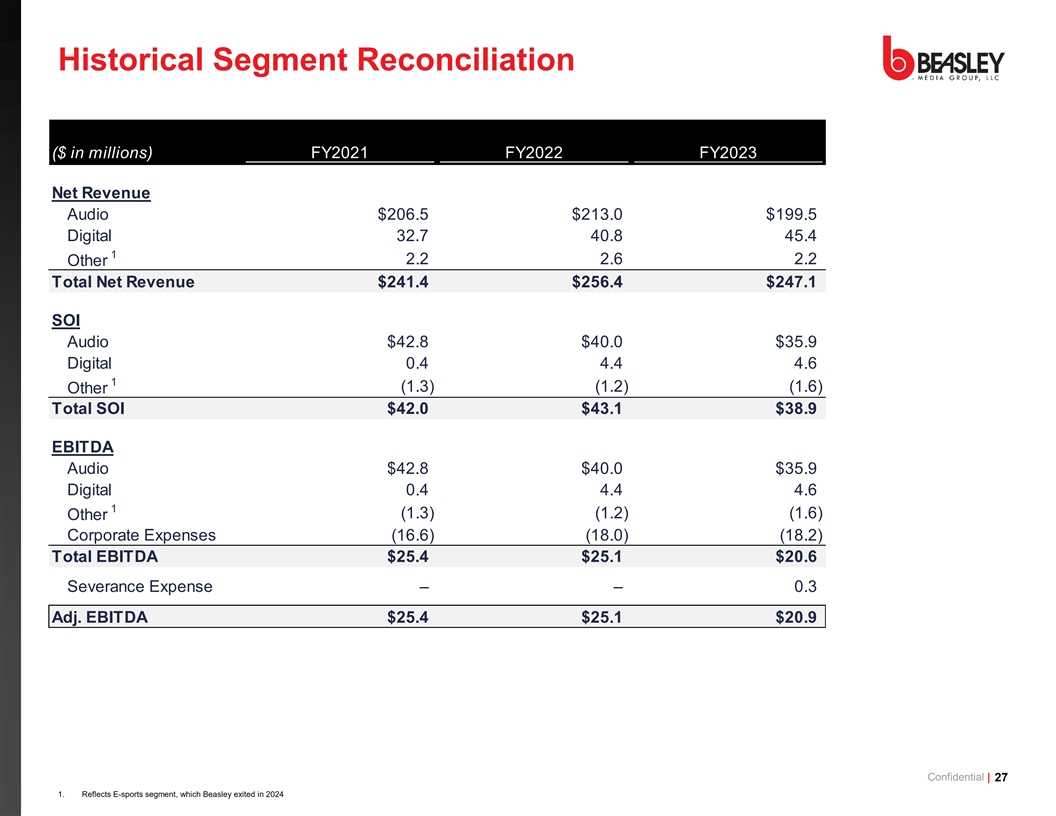
Historical Segment Reconciliation ($ in millions) FY2021 FY2022 FY2023 Net Revenue Audio $206.5 $213.0 $199.5 Digital 32.7 40.8 45.4 1 2.2 2.6 2.2 Other Total Net Revenue $241.4 $256.4 $247.1 SOI Audio $42.8 $40.0 $35.9 Digital 0.4 4.4 4.6 1 (1.3) (1.2) (1.6) Other Total SOI $42.0 $43.1 $38.9 EBITDA Audio $42.8 $40.0 $35.9 Digital 0.4 4.4 4.6 1 (1.3) (1.2) (1.6) Other Corporate Expenses (16.6) (18.0) (18.2) Total EBITDA $25.4 $25.1 $20.6 Severance Expense – – 0.3 Adj. EBITDA $25.4 $25.1 $20.9 Confidential | 27 1. Reflects E-sports segment, which Beasley exited in 2024