MetLife, Inc. Annual Investor Day
December 6, 2006
Agenda
Agenda
| Time | Topic | Presenters | ||
| 7:00 a.m. to 8:00 a.m. | Registration / Continental Breakfast | |||
| 8:00 a.m. to 8:05 a.m. | Outline of Day | Tracey A. Dedrick | ||
| 8:05 a.m. to 8:25 a.m. | Overview | C. Robert Henrikson | ||
| 8:25 a.m. to 8:55 a.m. | Investments | Steven A. Kandarian | ||
| 8:55 a.m. to 9:25 a.m. | Finance | William J. Wheeler | ||
| 9:25 a.m. to 9:45 a.m. | Finance & Investments Q&A | William J. Wheeler Steven A. Kandarian | ||
| 9:45 a.m. to 10:00 a.m. | Break | |||
| 10:00 a.m. to 10:30 a.m. | Institutional | Todd Katz Sherif Zakhary | ||
| 10:30 a.m. to 11:00 p.m. | International | Ichiro Miyake Stuart Solomon | ||
| 11:00 a.m. to 11:15 a.m. | Auto & Home | William J. Mullaney | ||
| 11:15 a.m. to 11:30 a.m. | Break | |||
| 11:30 a.m. to 12:00 p.m. | Individual | Michael Farrell Michael Vietri | ||
| 12:00 p.m. to 12:30 p.m. | Q&A | All |
Exhibit 99.1
| investor day 2 0 0 6 Tracey Dedrick Vice President Investor Relations |
| Safe Harbor Statement These materials contain statements which constitute forward-looking statements within the meaning of the Private Securities Litigation Reform Act of 1995, including statements relating to trends in the operations and financial results and the business and the products of MetLife, Inc. and its subsidiaries (collectively, the "Company"), as well as other statements including words such as "anticipate," "believe," "plan," "estimate," "expect," "intend" and other similar expressions. Forward-looking statements are made based upon management's current expectations and beliefs concerning future developments and their potential effects on the Company. Such forward-looking statements are not guarantees of future performance. Actual results may differ materially from those included in the forward-looking statements as a result of risks and uncertainties including, but not limited to, the following: (i) changes in general economic conditions, including the performance of financial markets and interest rates; (ii) heightened competition, including with respect to pricing, entry of new competitors and the development of new products by new and existing competitors; (iii) unanticipated changes in industry trends; (iv) MetLife, Inc.'s primary reliance, as a holding company, on dividends from its subsidiaries to meet debt payment obligations and the applicable regulatory restrictions on the ability of the subsidiaries to pay such dividends; (v) deterioration in the experience of the "closed block" established in connection with the reorganization of Metropolitan Life Insurance Company; (vi) catastrophe losses; (vii) adverse results or other consequences from litigation, arbitration or regulatory investigations; (viii) regulatory, accounting or tax changes that may affect the cost of, or demand for, the Company's products or services; (ix) downgrades in the Company's and its affiliates' claims paying ability, financial strength or credit ratings; (x) changes in rating agency policies or practices; (xi) discrepancies between actual claims experience and assumptions used in setting prices for the Company's products and establishing the liabilities for the Company's obligations for future policy benefits and claims; (xii) discrepancies between actual experience and assumptions used in establishing liabilities related to other contingencies or obligations; (xiii) the effects of business disruption or economic contraction due to terrorism or other hostilities; (xiv) the Company's ability to identify and consummate on successful terms any future acquisitions, and to successfully integrate acquired businesses with minimal disruption; and (xv) other risks and uncertainties described from time to time in MetLife, Inc.'s filings with the Securities and Exchange Commission, including its S-1 and S-3 registration statements. The Company specifically disclaims any obligation to update or revise any forward-looking statement, whether as a result of new information, future developments or otherwise. |
| Explanatory Note on Non-GAAP Financial Information The historical and forward-looking financial information presented at this conference and contained in this presentation include performance measures which are based on methodologies other than Generally Accepted Accounting Principles ("GAAP"). MetLife analyzes its performance using so-called non-GAAP measures, including operating earnings, operating earnings available to common shareholders, operating earnings available to common shareholders per diluted common share and operating return on equity ("ROE"). MetLife believes these measures enhance the understanding and comparability of its performance by excluding net investment gains and losses, net of income taxes, and adjustments related to net investment gains and losses, net of income taxes, both of which can fluctuate significantly from period to period, the impact of the cumulative effect of a change in accounting, net of income taxes, and discontinued operations other than discontinued real estate, net of income taxes, thereby highlighting the results from operations and the underlying profitability drivers of the business. Operating earnings is defined as GAAP net income, excluding net investment gains and losses, net of income taxes, adjustments related to net investment gains and losses, net of income taxes, the impact from the cumulative effect of a change in accounting, net of income taxes, and discontinued operations other than discontinued real estate, net of income taxes. Scheduled settlement payments on derivative instruments not qualifying for hedge accounting treatment are included in operating earnings. Operating earnings available to common shareholders is defined as operating earnings less preferred stock dividends, which are recorded in Corporate & Other. All references in these slides and in the presentation made at this conference to "operating earnings" for 2005 and future years should be read as references to "operating earnings available to common shareholders." Operating earnings available to common shareholders per diluted common share is calculated by dividing operating earnings available to common shareholders by the number of weighted average diluted common shares outstanding for the period indicated. All references in these slides and in the presentation made at this conference to "operating earnings per share" for 2005 and future years should be read as references to "operating earnings available to common shareholders per diluted common share." Operating return on equity is calculated by dividing operating earnings available to common shareholders by average common equity for the period indicated, excluding accumulated other comprehensive income. |
| Explanatory Note on Non-GAAP Financial Information (Cont'd) For the historical periods presented, reconciliations of the non-GAAP measures used in this presentation to the most directly comparable GAAP measures are included in the Appendix of this presentation and are on the Investor Relations portion of the Company's website (www.metlife.com). Additional information about MetLife's historical financial results is available in the Company's Quarterly Financial Supplements which may be accessed through the Company's website. The non-GAAP measures used in this presentation should not be viewed as substitutes for the most directly comparable GAAP measures. In this presentation, MetLife provides guidance on its future earnings, earnings per share and return on equity on an operating, non-GAAP basis. A reconciliation of these measures to the most directly comparable GAAP measures is not accessible on a forward-looking basis because MetLife believes it is not possible to provide a reliable forecast of net investment gains and losses, which can fluctuate significantly from period to period and may have a significant impact on GAAP net income. |

| Agenda |

| investor day 2 0 0 6 C. Robert Henrikson Chairman of the Board, President & Chief Executive Officer |

| Opening Remarks |
| 2006 Results |
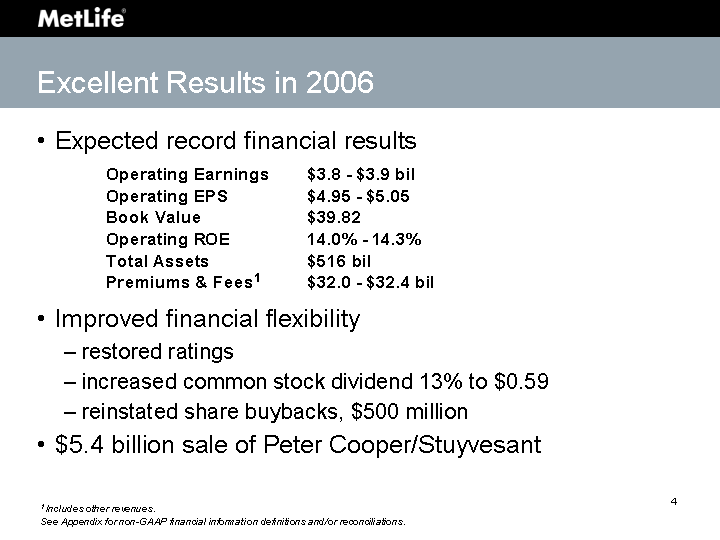
| Excellent Results in 2006 Expected record financial results Improved financial flexibility restored ratings increased common stock dividend 13% to $0.59 reinstated share buybacks, $500 million $5.4 billion sale of Peter Cooper/Stuyvesant 1 Includes other revenues. See Appendix for non-GAAP financial information definitions and/or reconciliations. |
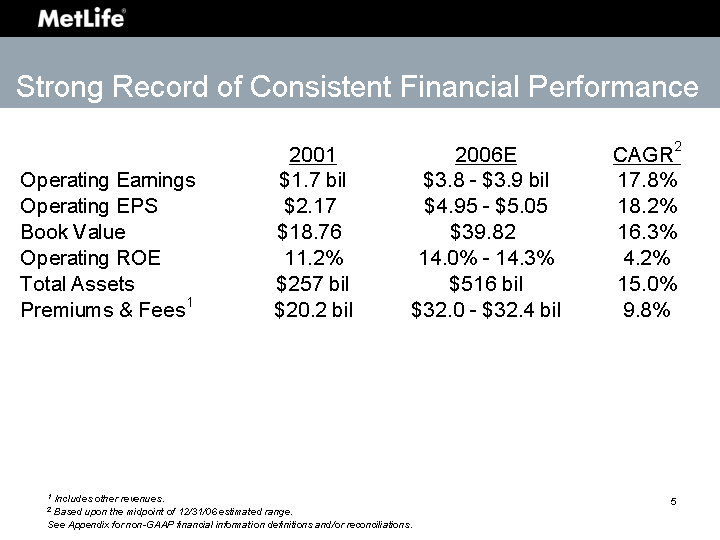
| Strong Record of Consistent Financial Performance 1 Includes other revenues. 2 Based upon the midpoint of 12/31/06 estimated range. See Appendix for non-GAAP financial information definitions and/or reconciliations. |
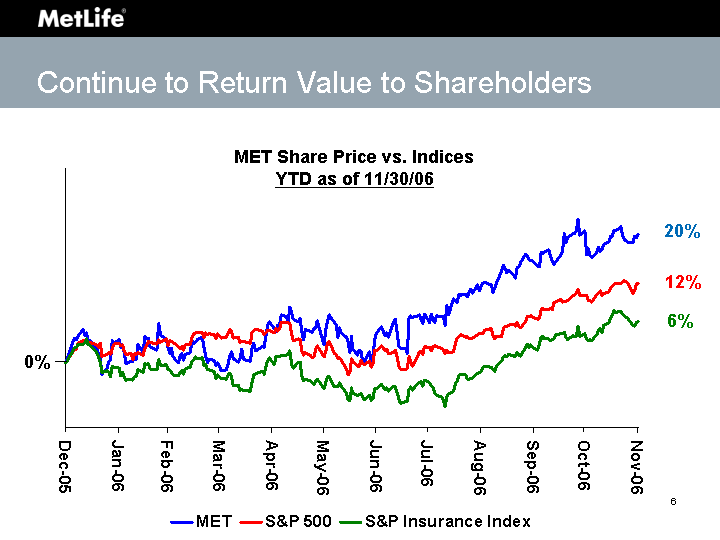
| Continue to Return Value to Shareholders 0% 6% 12% 20% MET Share Price vs. Indices YTD as of 11/30/06 |
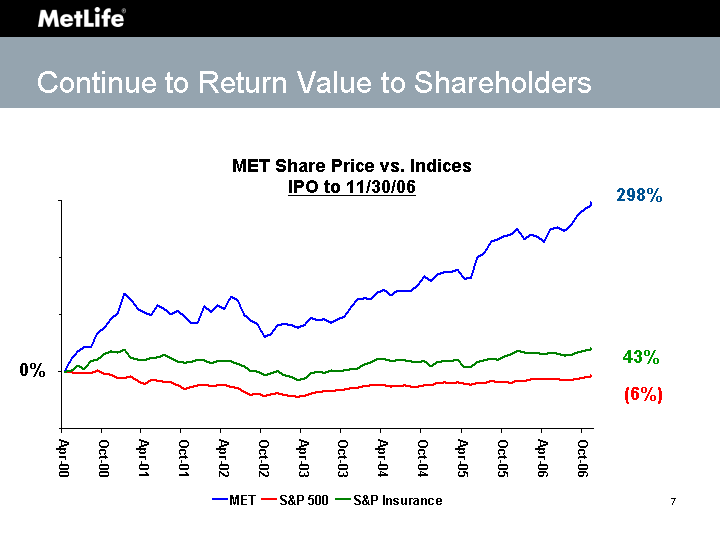
| Continue to Return Value to Shareholders 43% (6%) 298% MET Share Price vs. Indices IPO to 11/30/06 0% |

| Why You Should Continue to Own MetLife |

| Unsustainable social programs Changes in pension legislation & accounting regulations Employer benefit budgets getting squeezed Increased awareness of these issues by governments, corporations & individuals Trends Are Fueling Multiple Opportunities Products to meet income & longevity protection needs Help employers manage balance sheet volatility Offering employee paid benefits to attract and retain employees Increasing call to action |
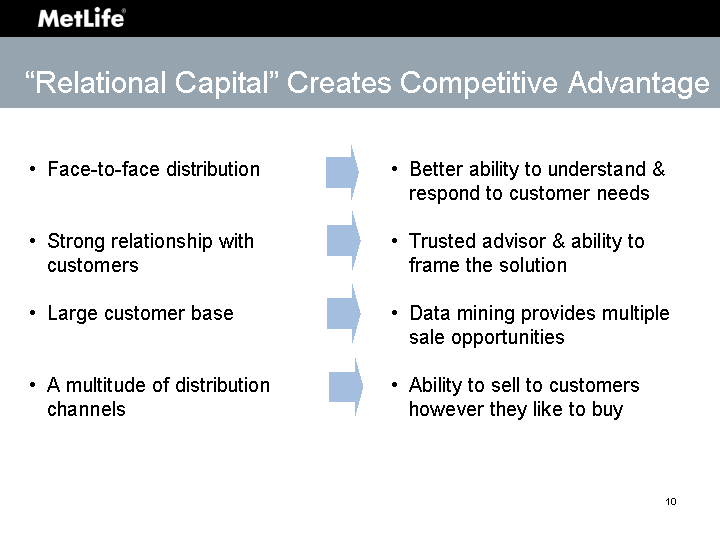
| Better ability to understand & respond to customer needs Trusted advisor & ability to frame the solution Data mining provides multiple sale opportunities Ability to sell to customers however they like to buy "Relational Capital" Creates Competitive Advantage Face-to-face distribution Strong relationship with customers Large customer base A multitude of distribution channels |
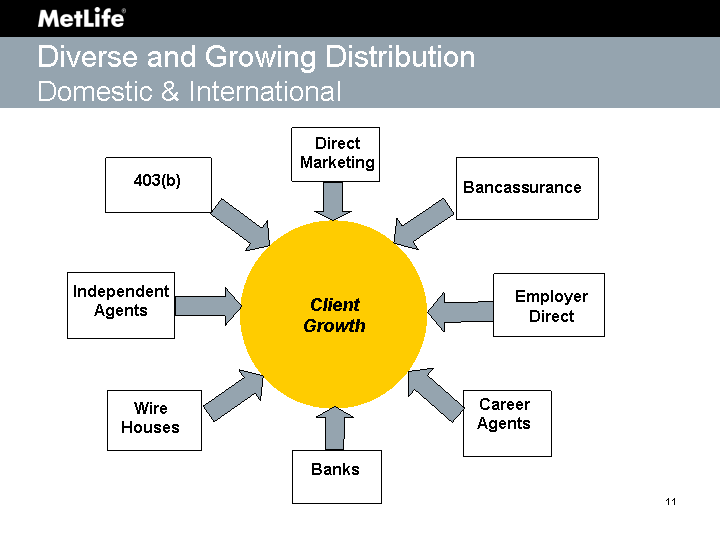
| Diverse and Growing Distribution Domestic & International Client Growth Banks Employer Direct 403(b) Bancassurance Career Agents Wire Houses Independent Agents Direct Marketing |
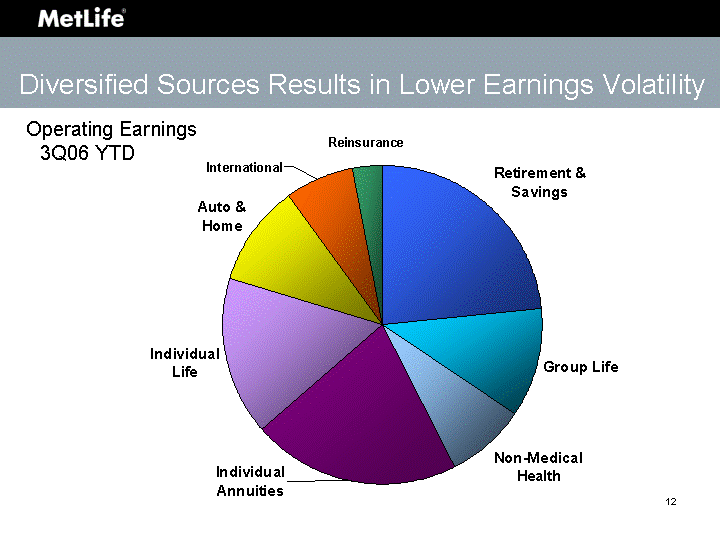
| 4th Quarter Retirement & Savings 0.23 Group Life 0.11 Non-Medical Health 0.08 Individual Annuities 0.21 Individual Life 0.16 Auto & Home 0.1 International 0.07 Reinsurance 0.03 Operating Earnings 3Q06 YTD Diversified Sources Results in Lower Earnings Volatility |
| Financial Strength to Support Growth Strong capital position Excellent and stable ratings Solid operating cash flow Leverage capacity |
| Unique Competitive Advantages Magnet for outstanding talent Leading industry risk management practices Unparalleled brand recognition |
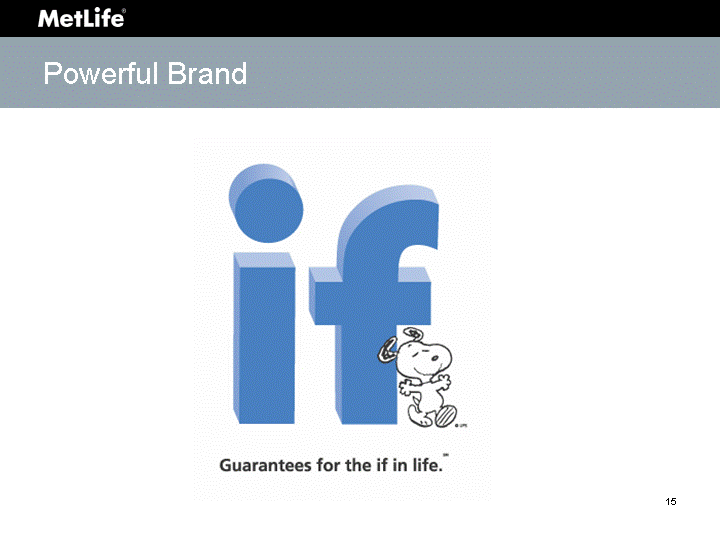
| Powerful Brand |
| Powerful Brand |

| Today's Agenda |
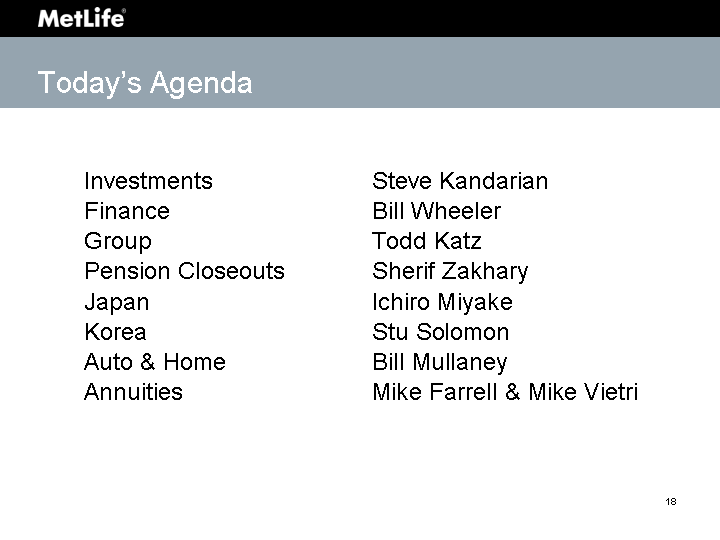
| Today's Agenda Investments Steve Kandarian Finance Bill Wheeler Group Todd Katz Pension Closeouts Sherif Zakhary Japan Ichiro Miyake Korea Stu Solomon Auto & Home Bill Mullaney Annuities Mike Farrell & Mike Vietri |

| investor day 2 0 0 6 Steven A. Kandarian Executive Vice President & Chief Investment Officer Investments |

| Market Overview |
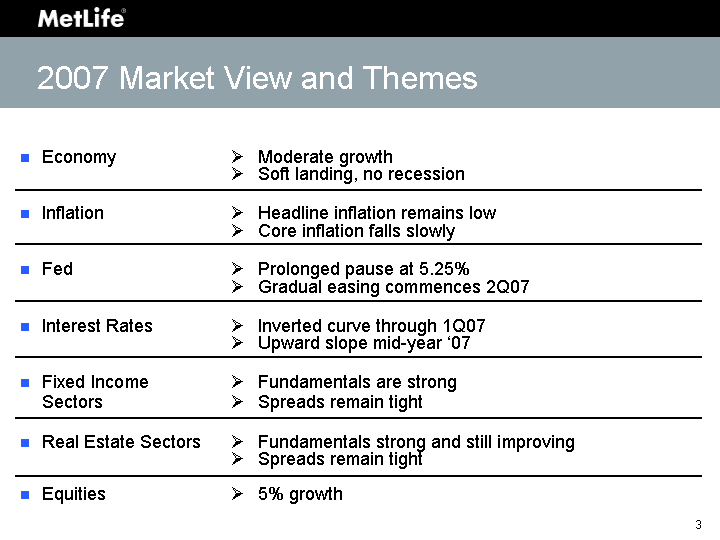
| Economy ? Moderate growth ? Soft landing, no recession Inflation ? Headline inflation remains low ? Core inflation falls slowly Fed ? Prolonged pause at 5.25% ? Gradual easing commences 2Q07 Interest Rates ? Inverted curve through 1Q07 ? Upward slope mid-year '07 Fixed Income ? Fundamentals are strong Sectors ? Spreads remain tight Real Estate Sectors ? Fundamentals strong and still improving ? Spreads remain tight Equities ? 5% growth 2007 Market View and Themes |
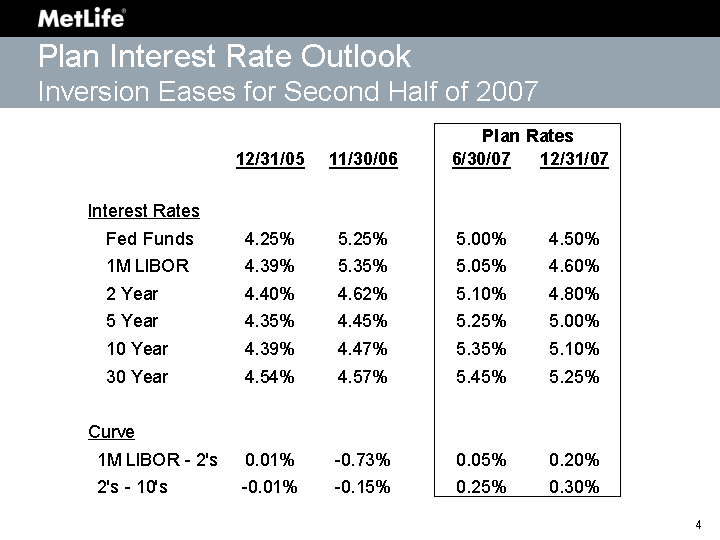
| Plan Interest Rate Outlook Inversion Eases for Second Half of 2007 |
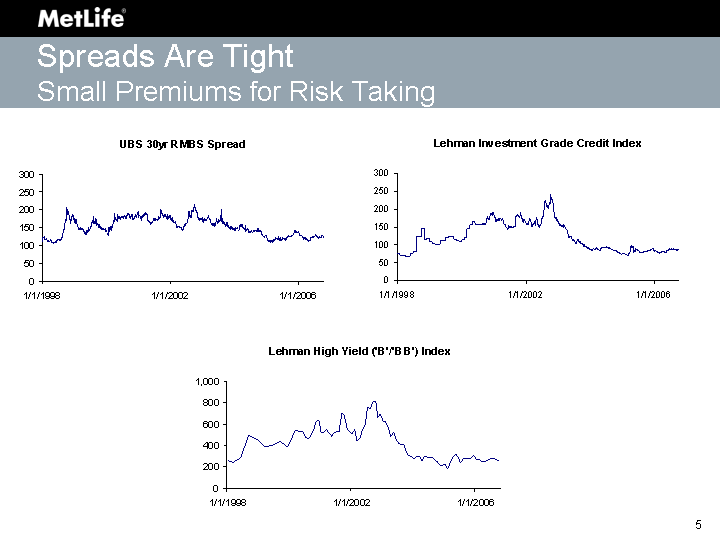
| Spreads Are Tight Small Premiums for Risk Taking |

| Portfolio Overview |
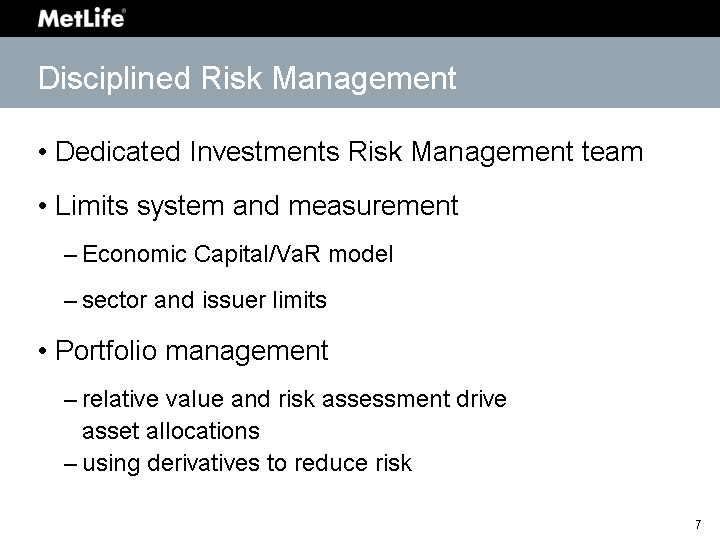
| Disciplined Risk Management Dedicated Investments Risk Management team Limits system and measurement Economic Capital/VaR model sector and issuer limits Portfolio management relative value and risk assessment drive asset allocations using derivatives to reduce risk |
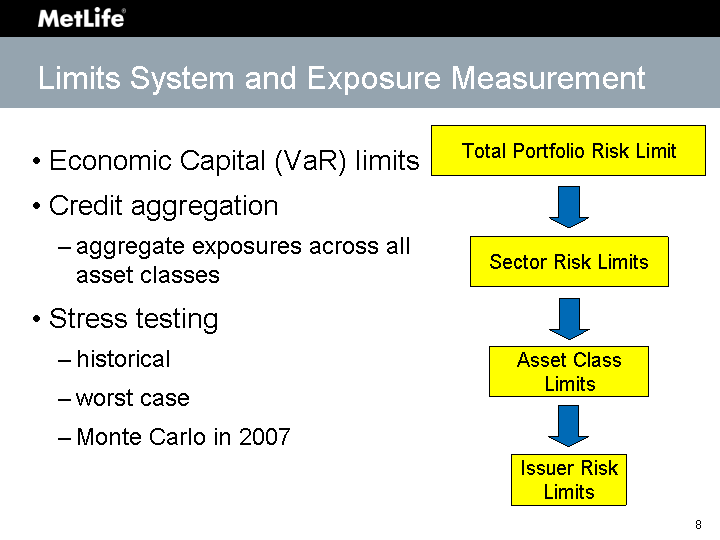
| Limits System and Exposure Measurement Economic Capital (VaR) limits Credit aggregation aggregate exposures across all asset classes Stress testing historical worst case Monte Carlo in 2007 Total Portfolio Risk Limit Sector Risk Limits Issuer Risk Limits Asset Class Limits |
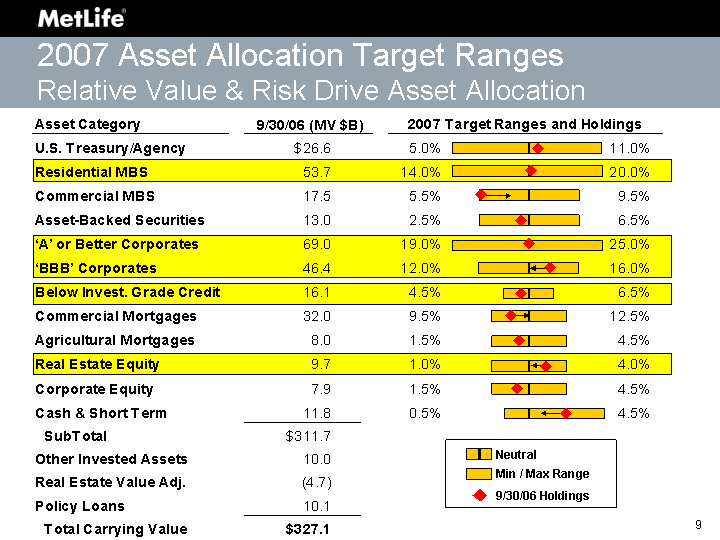
| 9/30/06 Holdings Min / Max Range Neutral 2007 Asset Allocation Target Ranges Relative Value & Risk Drive Asset Allocation |
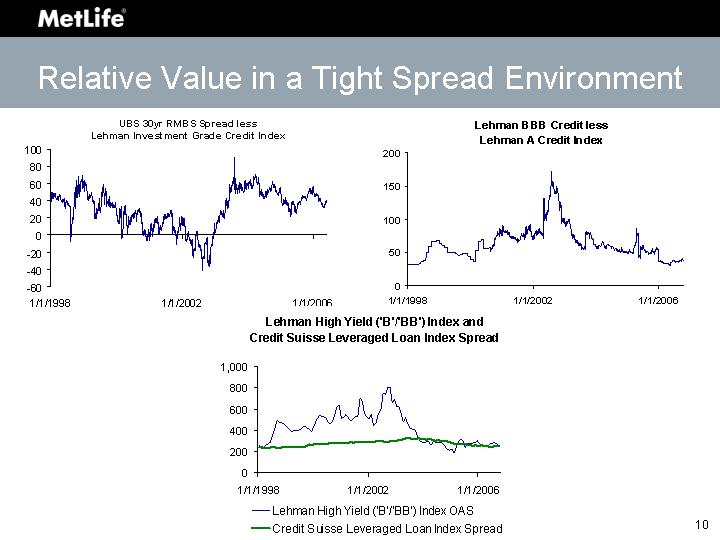
| Relative Value in a Tight Spread Environment |
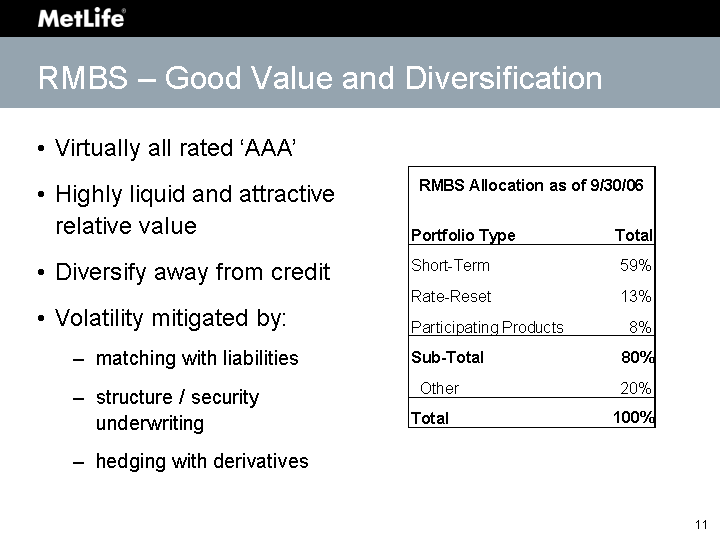
| RMBS - Good Value and Diversification Virtually all rated 'AAA' Highly liquid and attractive relative value Diversify away from credit Volatility mitigated by: matching with liabilities structure / security underwriting hedging with derivatives |
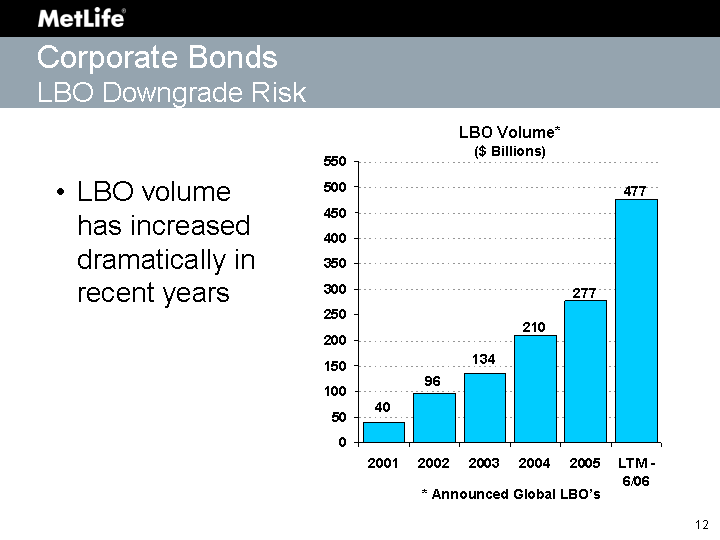
| LBO volume has increased dramatically in recent years 2001 2002 2003 2004 2005 LTM - 6/06 East 40 96 134 210 277 477 LBO Volume* ($ Billions) * Announced Global LBO's Corporate Bonds LBO Downgrade Risk |
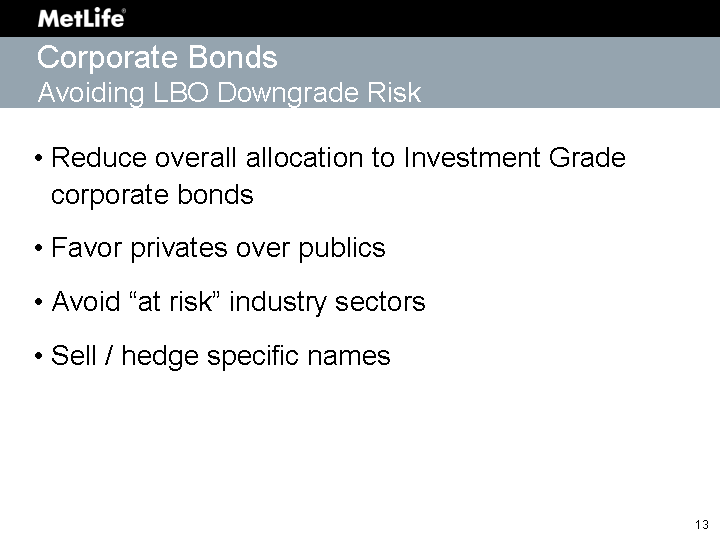
| Reduce overall allocation to Investment Grade corporate bonds Favor privates over publics Avoid "at risk" industry sectors Sell / hedge specific names Corporate Bonds Avoiding LBO Downgrade Risk |
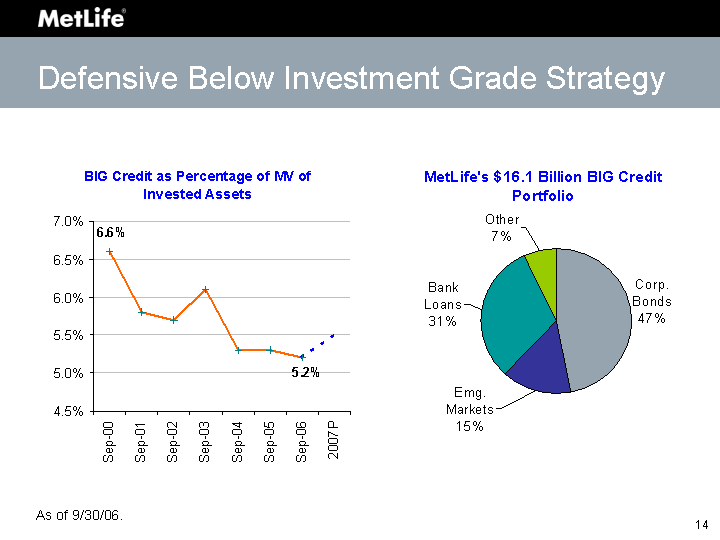
| 9/30/2000 9/30/2001 9/30/2002 9/30/2003 9/30/2004 9/30/2005 9/30/2006 2007P % of Portfolio 0.066 0.058 0.057 0.061 0.053 0.053 0.052 2007 Projections 0.052 0.055 Corp. Bonds Emg. Markets Bank Loans Other 47 15 31 7 Defensive Below Investment Grade Strategy As of 9/30/06. |
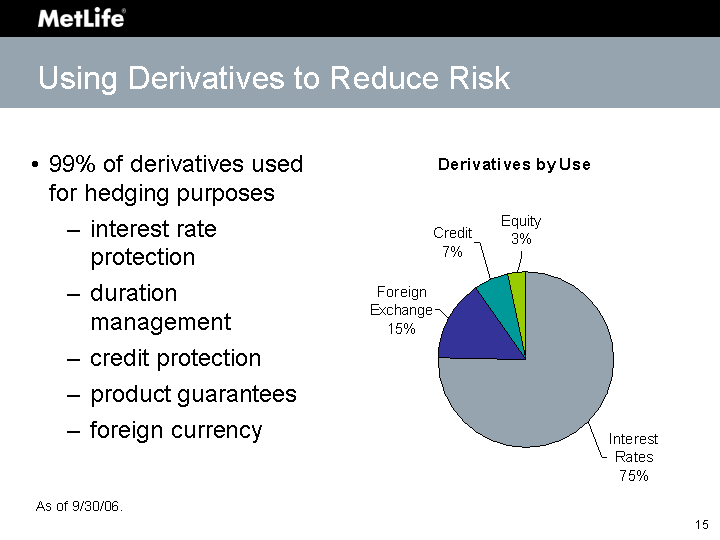
| 99% of derivatives used for hedging purposes interest rate protection duration management credit protection product guarantees foreign currency Interest Rates Foreign Exchange Credit Equity 108.8 21.5 9.5 4.7 Using Derivatives to Reduce Risk As of 9/30/06. |
| Portfolio Income |
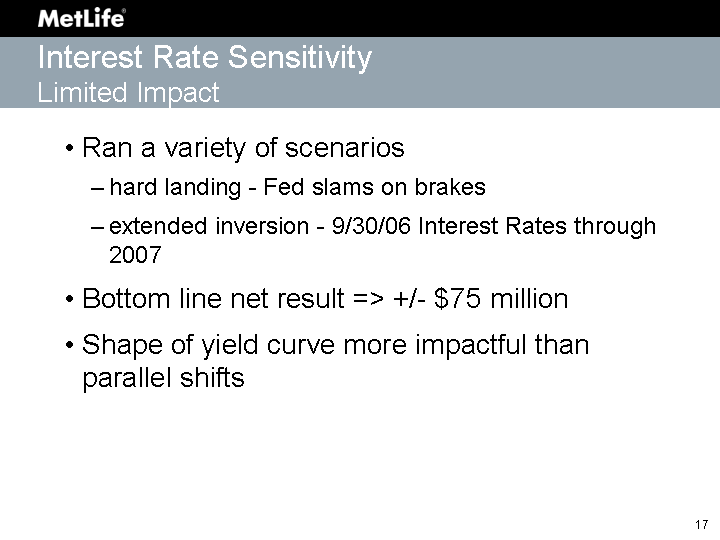
| Ran a variety of scenarios hard landing - Fed slams on brakes extended inversion - 9/30/06 Interest Rates through 2007 Bottom line net result => +/- $75 million Shape of yield curve more impactful than parallel shifts Interest Rate Sensitivity Limited Impact |
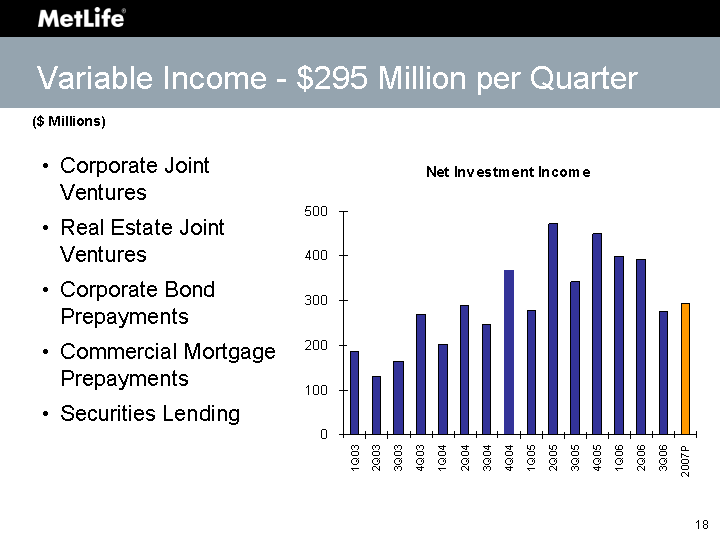
| Corporate Joint Ventures Real Estate Joint Ventures Corporate Bond Prepayments Commercial Mortgage Prepayments Securities Lending 1Q03 2Q03 3Q03 4Q03 1Q04 2Q04 3Q04 4Q04 1Q05 2Q05 3Q05 4Q05 1Q06 2Q06 3Q06 2007P Actual Volatile Income 185 130 165 269 202 288 246 367 279 472 342 449 398 392 276 295 Variable Income - $295 Million per Quarter ($ Millions) |
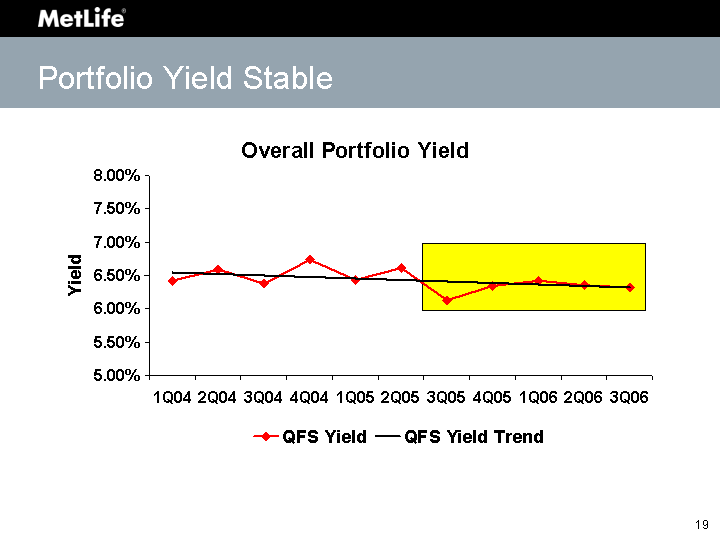
| 1Q04 2Q04 3Q04 4Q04 1Q05 2Q05 3Q05 4Q05 1Q06 2Q06 3Q06 QFS Yield 0.0642 0.0659 0.0638 0.0674 0.0643 0.0661 0.0613 0.0634 0.0642 0.0635 0.0632 Portfolio Yield Stable |
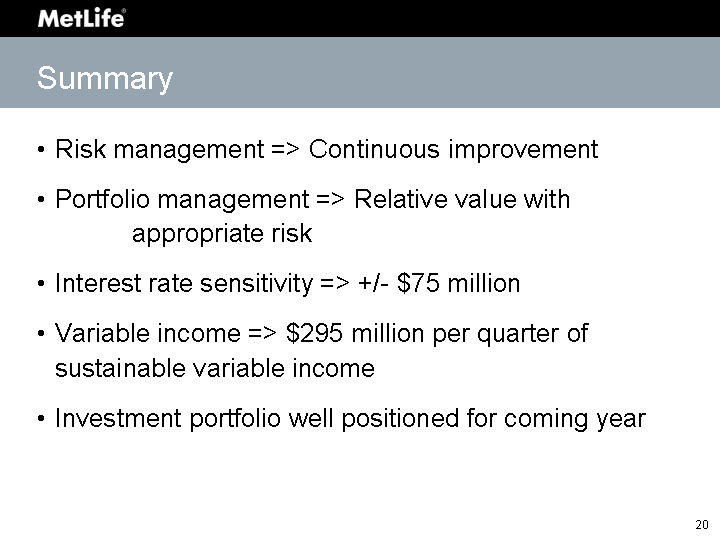
| Summary Risk management => Continuous improvement Portfolio management => Relative value with appropriate risk Interest rate sensitivity => +/- $75 million Variable income => $295 million per quarter of sustainable variable income Investment portfolio well positioned for coming year |

| William J. Wheeler Executive Vice-President & Chief Financial Officer Finance investor day 2 0 0 6 |
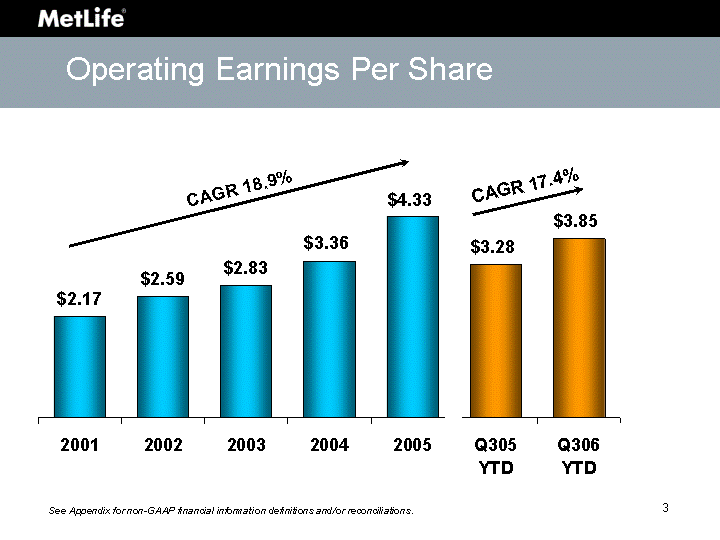
| Operating Earnings Per Share 2001 2002 2003 2004 2005 Q305 YTD Q306 YTD 2.17 2.59 2.83 3.36 4.33 3.28 3.85 CAGR 18.9% See Appendix for non-GAAP financial information definitions and/or reconciliations. CAGR 17.4% 3 |
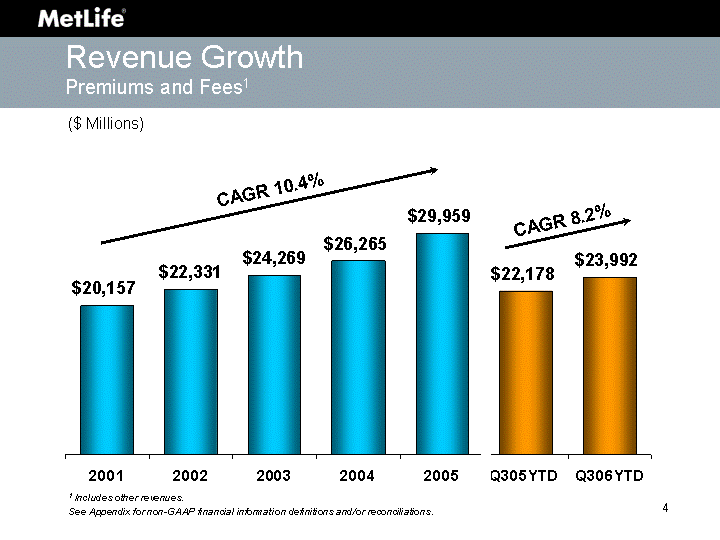
| Revenue Growth Premiums and Fees1 2001 2002 2003 2004 2005 Q305YTD Q306YTD 20157 22331 24269 26265 29959 22178 23992 CAGR 10.4% ($ Millions) 1 Includes other revenues. See Appendix for non-GAAP financial information definitions and/or reconciliations. CAGR 8.2% 4 |
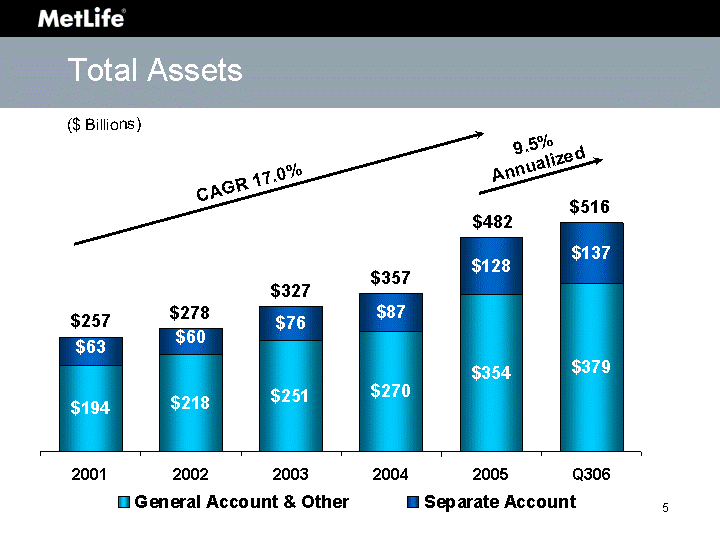
| Total Assets 2001 2002 2003 2004 2005 Q306 General Account & Other 194.3 217.7 251 270 353.7 378.9 Separate Account 62.7 59.7 76 87 127.9 137.3 ($ Billions) CAGR 17.0% $327 $278 $257 $357 9.5% Annualized $516 $482 5 |
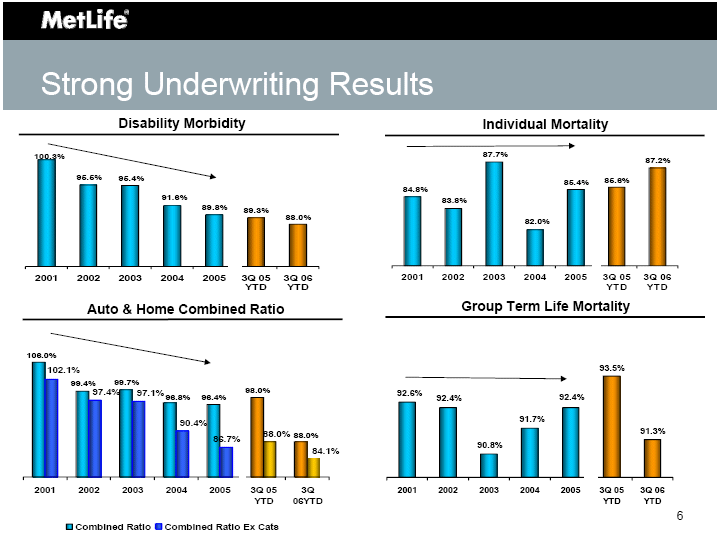
| Strong Underwriting Results 2001 2002 2003 2004 2005 3Q 05 YTD 3Q 06 YTD Individual Mortality (Gross of Reinsurance) 0.848 0.838 0.877 0.82 0.854 0.856 0.872 2001 2002 2003 2004 2005 3Q 05 YTD 3Q 06YTD Combined Ratio 1.06 0.994 0.997 0.968 0.964 0.98 0.88 Combined Ratio Ex Cats 1.021 0.974 0.971 0.904 0.867 0.88 0.841 2001 2002 2003 2004 2005 3Q 05 YTD 3Q 06 YTD Group Term Life Mortality 0.926 0.924 0.908 0.917 0.924 0.935 0.913 Individual Mortality Disability Morbidity Group Term Life Mortality Auto & Home Combined Ratio 2001 2002 2003 2004 2005 3Q 05 YTD 3Q 06 YTD Individual Mortality (Gross of Reinsurance) 1.003 0.955 0.954 0.916 0.898 0.893 0.88 6 |
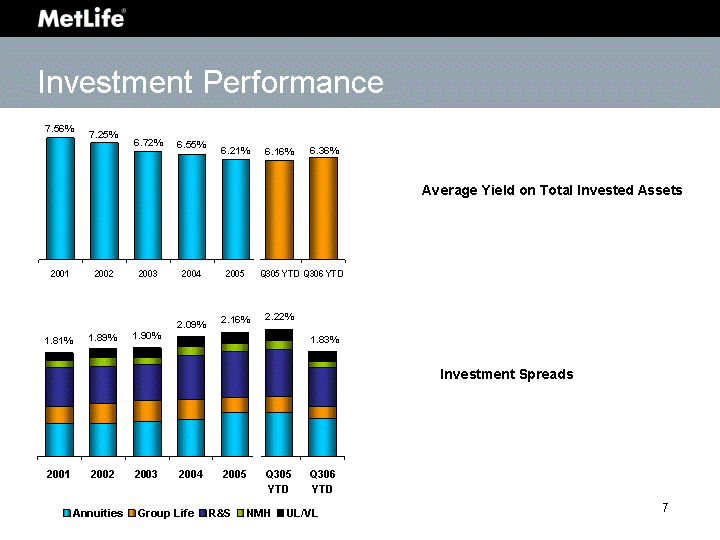
| Investment Performance 2001 2002 2003 2004 2005 Q305 YTD Q306 YTD 0.0756 0.0725 0.0672 0.0655 0.0621 0.0616 0.0636 2001 2002 2003 2004 2005 Q305 YTD Q306 YTD Annuities 0.0057 0.0058 0.0061 0.0065 0.0076 0.0077 0.0066 Group Life 0.0029 0.0034 0.0036 0.0035 0.0027 0.0028 0.002 R&S 0.0069 0.0066 0.0063 0.0077 0.008 0.0082 0.0069 NMH 0.0012 0.0014 0.0012 0.0014 0.0015 0.0016 0.001 UL/VL 0.0014 0.0017 0.0018 0.0018 0.0019 0.0019 0.0018 Average Yield on Total Invested Assets Investment Spreads 7.56% 7.25% 6.72% 6.55% 6.16% 6.36% 1.81% 1.89% 1.90% 2.09% 2.22% 1.83% 6.21% 2.16% 7 |
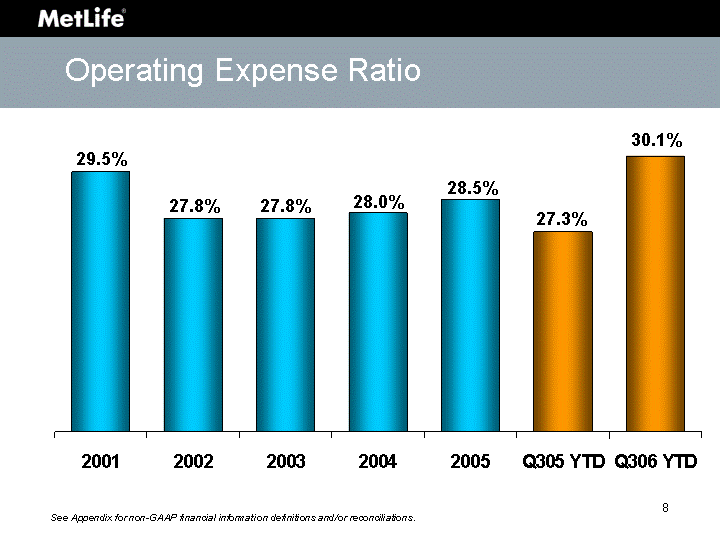
| Operating Expense Ratio 2001 2002 2003 2004 2005 Q305 YTD Q306 YTD 0.295 0.278 0.278 0.28 0.285 0.273 0.301 29.5% 27.8% 27.8% 28.0% 27.3% 30.1% 28.5% See Appendix for non-GAAP financial information definitions and/or reconciliations. 8 |

| Dividends Per Common Share 2001 2002 2003 2004 2005 2006 0.2 0.21 0.23 0.46 0.52 0.59 CAGR 24.2% 9 |
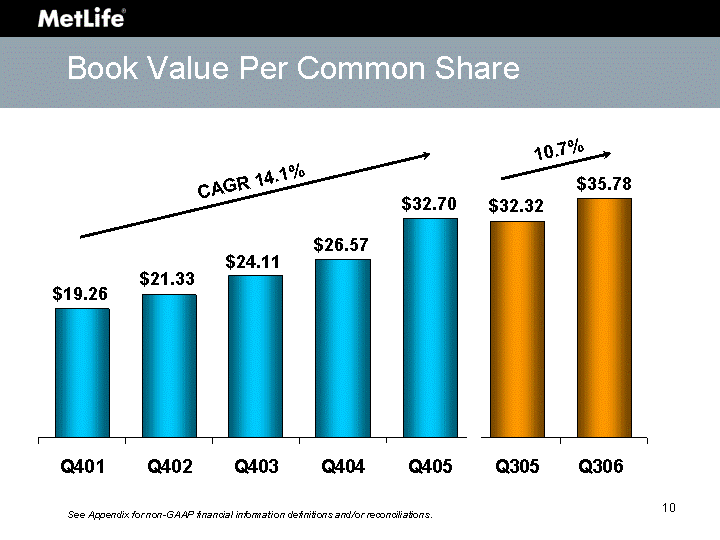
| Book Value Per Common Share Q401 Q402 Q403 Q404 Q405 Q305 Q306 19.26 21.33 24.11 26.57 32.7 32.32 35.78 See Appendix for non-GAAP financial information definitions and/or reconciliations. $24.11 $21.33 $19.26 $26.57 $32.32 $35.78 CAGR 14.1% 10.7% $32.70 10 |
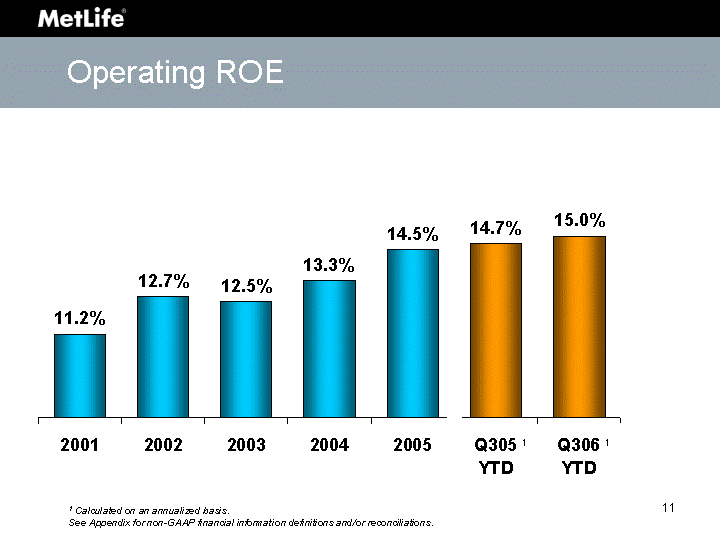
| Operating ROE 2001 2002 2003 2004 2005 Q305 YTD Q306 YTD 0.112 0.127 0.125 0.133 0.145 0.147 0.15 1 Calculated on an annualized basis. See Appendix for non-GAAP financial information definitions and/or reconciliations. 12.5% 12.7% 11.2% 13.3% 14.7% 15.0% 1 1 14.5% 11 |
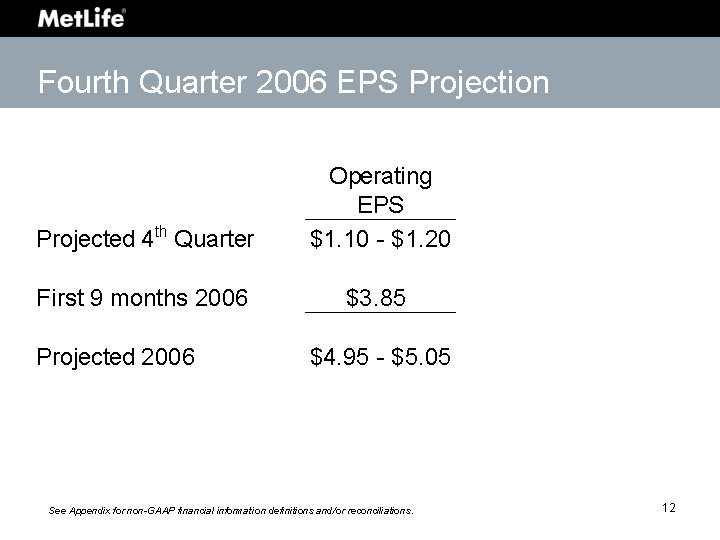
| Fourth Quarter 2006 EPS Projection 12 See Appendix for non-GAAP financial information definitions and/or reconciliations. |
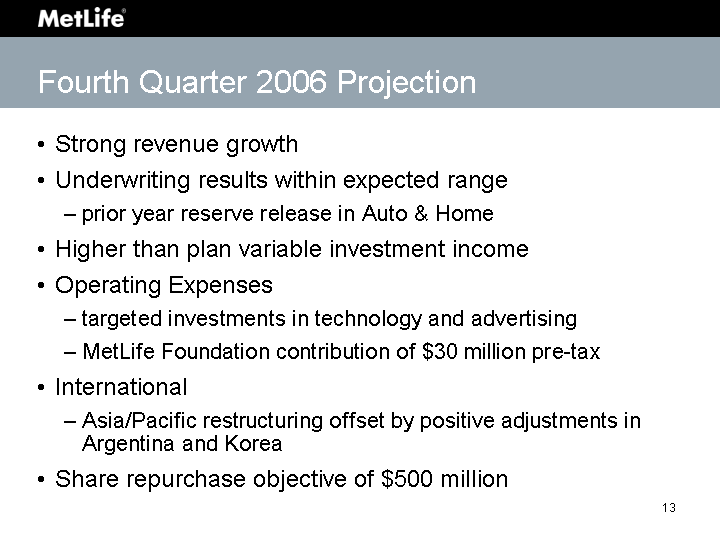
| Fourth Quarter 2006 Projection Strong revenue growth Underwriting results within expected range prior year reserve release in Auto & Home Higher than plan variable investment income Operating Expenses targeted investments in technology and advertising MetLife Foundation contribution of $30 million pre-tax International Asia/Pacific restructuring offset by positive adjustments in Argentina and Korea Share repurchase objective of $500 million 13 |
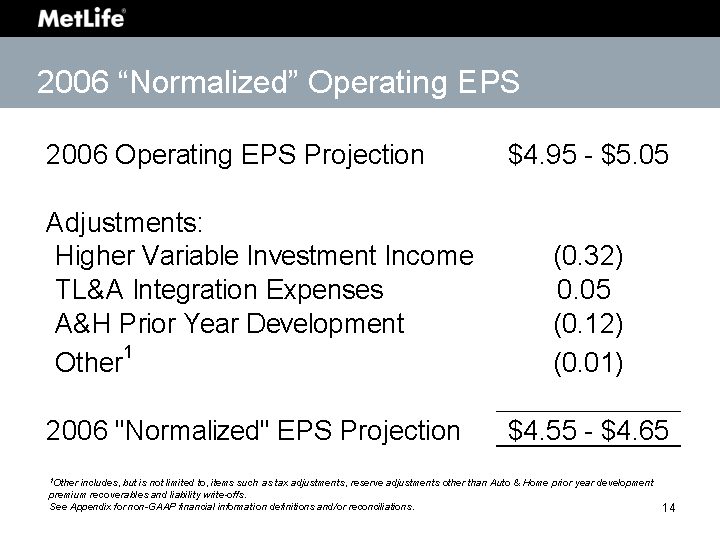
| 2006 "Normalized" Operating EPS 1Other includes, but is not limited to, items such as tax adjustments, reserve adjustments other than Auto & Home prior year development premium recoverables and liability write-offs. See Appendix for non-GAAP financial information definitions and/or reconciliations. 14 |
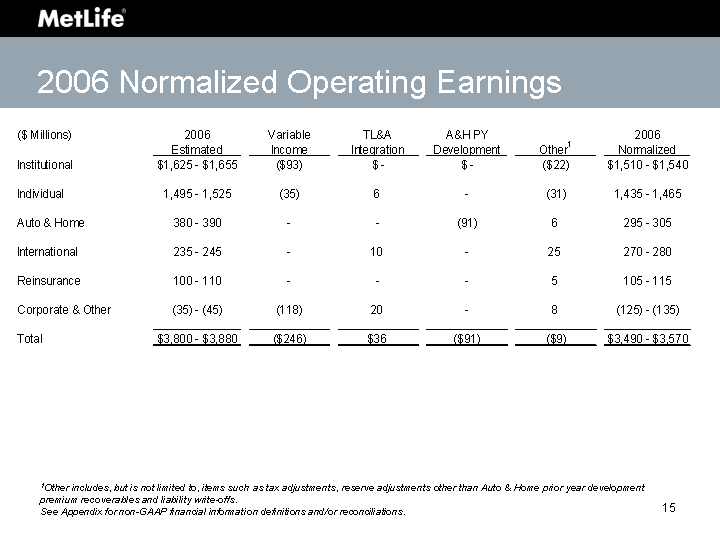
| 2006 Normalized Operating Earnings 1Other includes, but is not limited to, items such as tax adjustments, reserve adjustments other than Auto & Home prior year development premium recoverables and liability write-offs. See Appendix for non-GAAP financial information definitions and/or reconciliations. 15 |
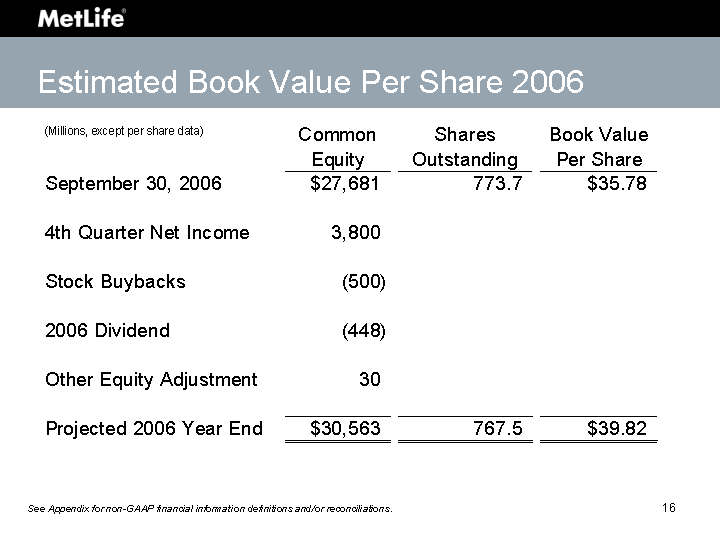
| Estimated Book Value Per Share 2006 See Appendix for non-GAAP financial information definitions and/or reconciliations. 16 |
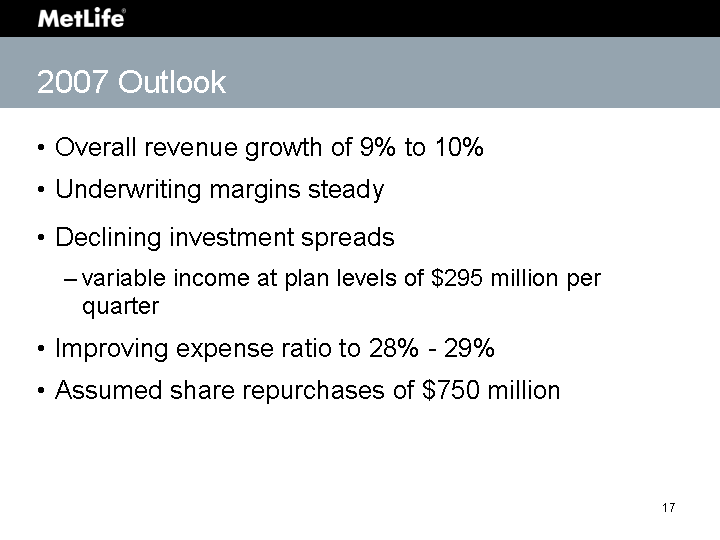
| 2007 Outlook Overall revenue growth of 9% to 10% Underwriting margins steady Declining investment spreads variable income at plan levels of $295 million per quarter Improving expense ratio to 28% - 29% Assumed share repurchases of $750 million 17 |
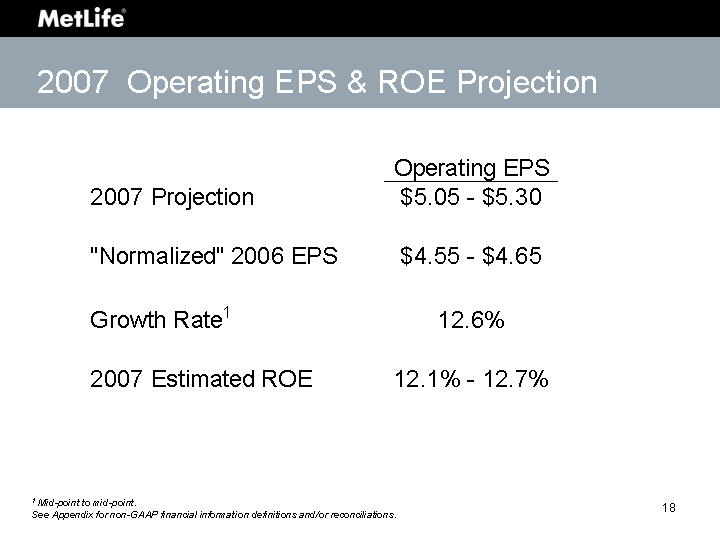
| 2007 Operating EPS & ROE Projection 18 1 Mid-point to mid-point. See Appendix for non-GAAP financial information definitions and/or reconciliations. |

| 2007 Projected Revenue Growth Premiums and Fees 1 1 Includes other revenues; excludes certain items. 2 Mid-point to mid-point. See Appendix for non-GAAP financial information definitions and/or reconciliations. 19 |
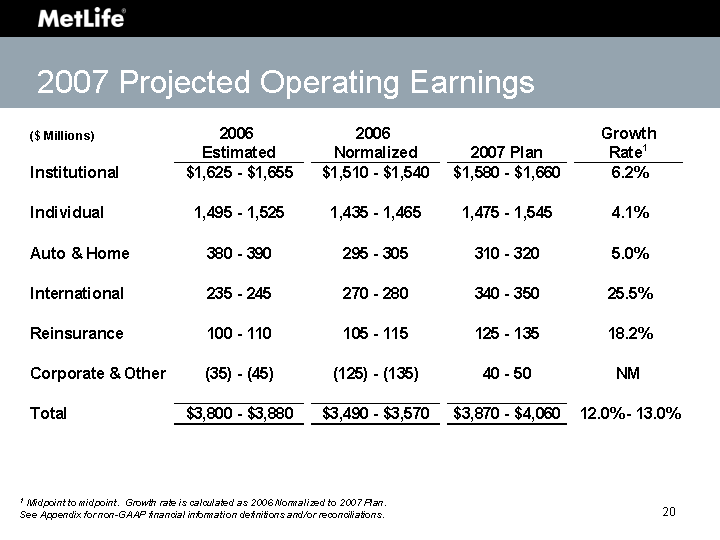
| 2007 Projected Operating Earnings 1 Midpoint to midpoint. Growth rate is calculated as 2006 Normalized to 2007 Plan. See Appendix for non-GAAP financial information definitions and/or reconciliations. 20 |
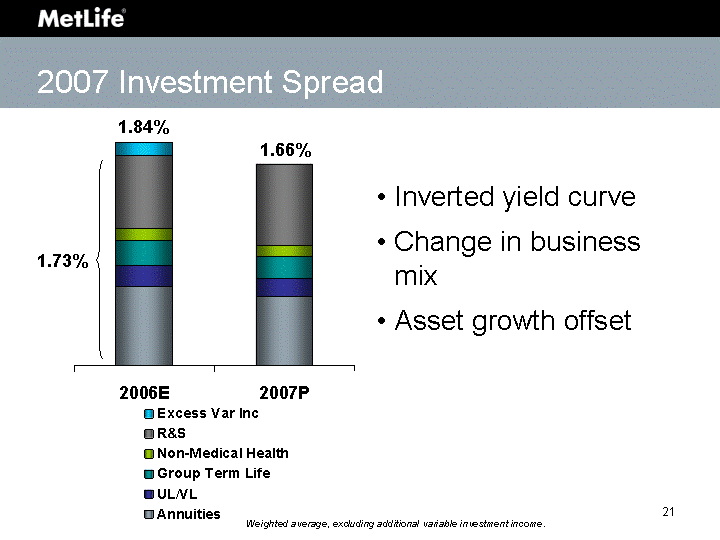
| 2007 Investment Spread 2006E 2007P Annuities 0.0065 0.0057 UL/VL 0.0017 0.0015 Group Term Life 0.0021 0.0018 Non-Medical Health 0.001 0.0009 R&S 0.006 0.0067 Excess Var Inc 0.0011 0 Inverted yield curve Change in business mix Asset growth offset Weighted average, excluding additional variable investment income. 1.66% 1.84% 1.73% 21 |
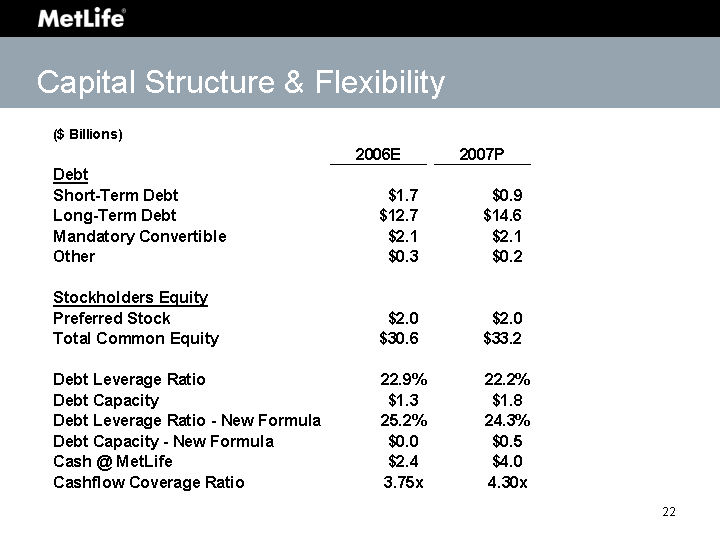
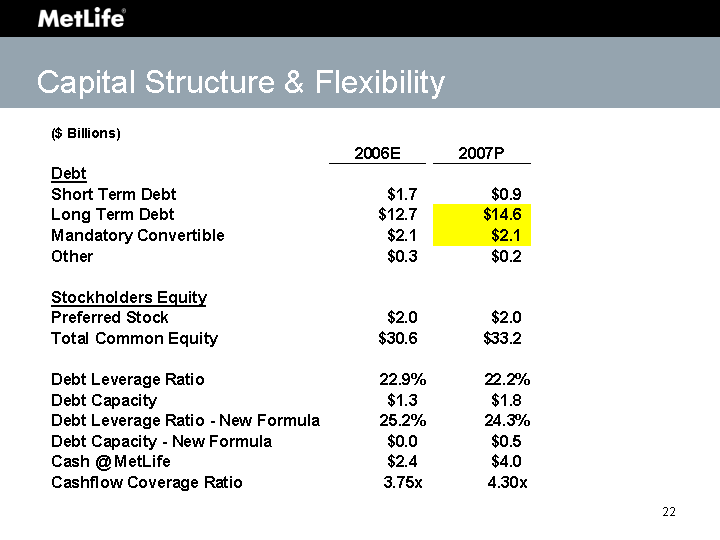
| Capital Structure & Flexibility 22 |
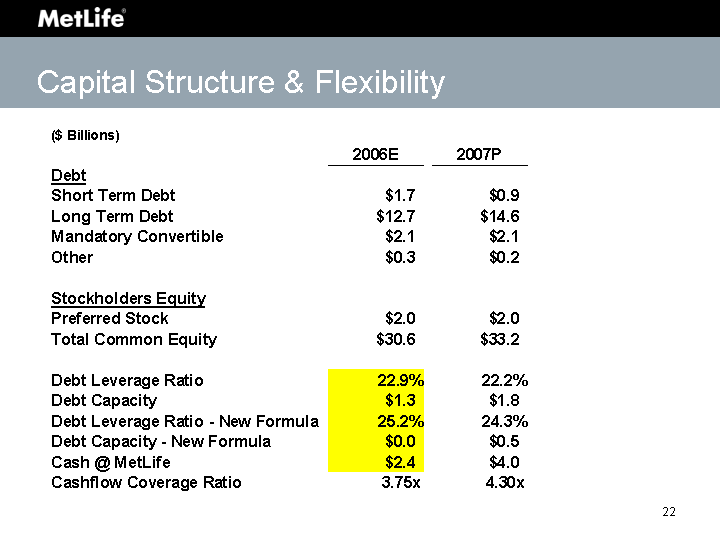
| Capital Structure & Flexibility 22 |
| Capital Structure & Flexibility 22 |

| Capital Structure & Flexibility 22 |
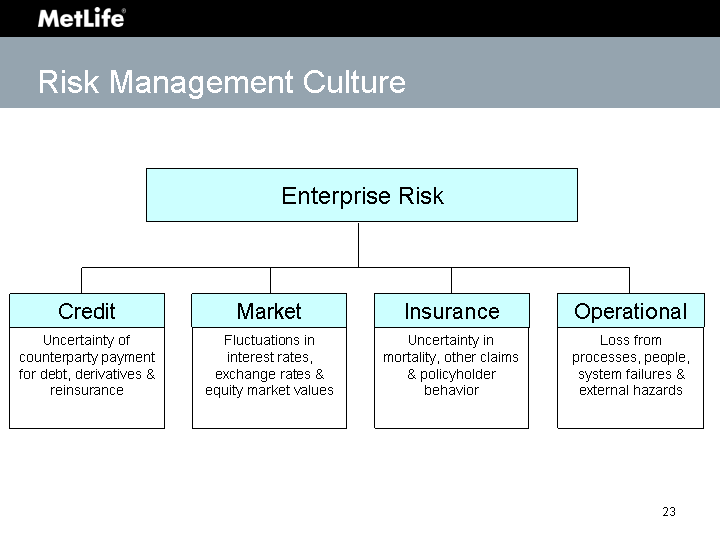
| Risk Management Culture Credit Uncertainty of counterparty payment for debt, derivatives & reinsurance Market Fluctuations in interest rates, exchange rates & equity market values Insurance Uncertainty in mortality, other claims & policyholder behavior Operational Loss from processes, people, system failures & external hazards Enterprise Risk 23 |
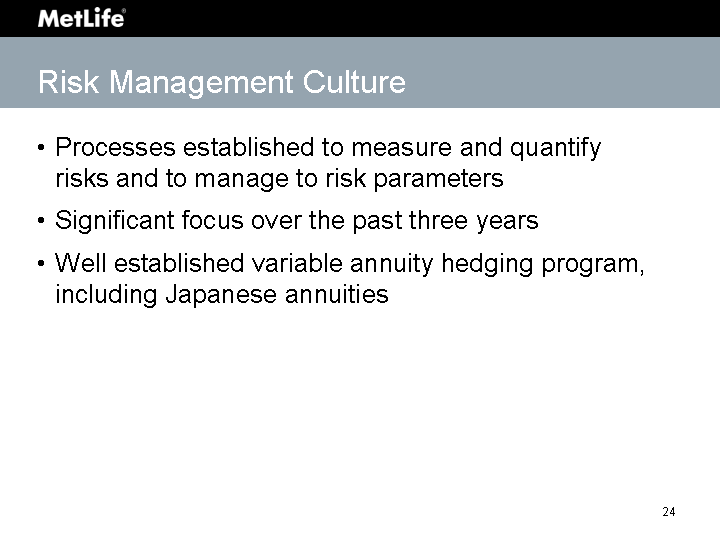
| Risk Management Culture Processes established to measure and quantify risks and to manage to risk parameters Significant focus over the past three years Well established variable annuity hedging program, including Japanese annuities 24 |
| Conclusions 2006 - Another excellent year Great momentum going into '07 Challenging interest rate environment Well positioned for the future 25 |

| investor day 2 0 0 6 Todd Katz Senior Vice President - Life, Dental & Disability Products Institutional Business |
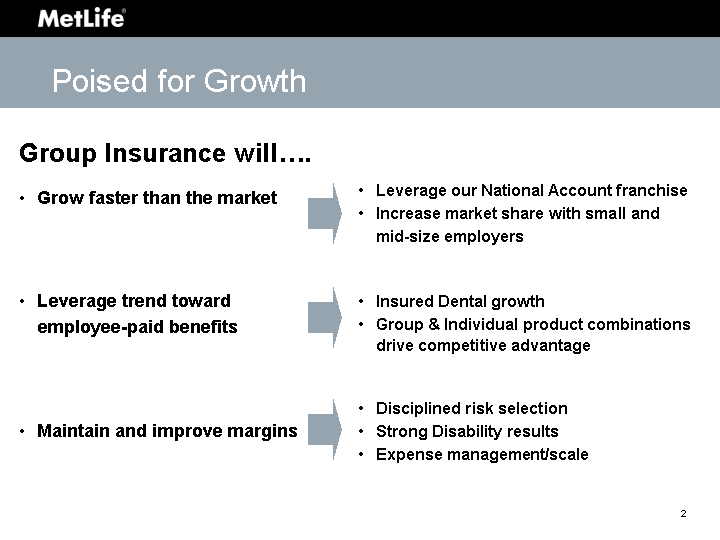
| Poised for Growth Group Insurance will.... Grow faster than the market Leverage trend toward employee-paid benefits Maintain and improve margins Leverage our National Account franchise Increase market share with small and mid-size employers Insured Dental growth Group & Individual product combinations drive competitive advantage Disciplined risk selection Strong Disability results Expense management/scale |
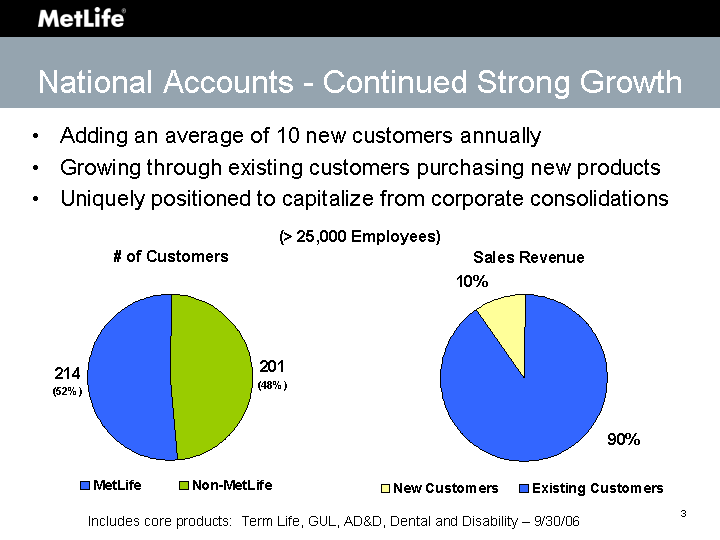
| National Accounts - Continued Strong Growth MetLife Non-MetLife Employers 214 201 New Customers Existing Customers Employers 0.1 0.903 Adding an average of 10 new customers annually Growing through existing customers purchasing new products Uniquely positioned to capitalize from corporate consolidations (> 25,000 Employees) Includes core products: Term Life, GUL, AD&D, Dental and Disability - 9/30/06 |

| National Accounts - Continued Strong Growth MetLife Non-MetLife Employers 214 201 MetLife Non-MetLife Employers 267 148 Including all products, customer share increases to 64% (> 25,000 Employees) Includes core products: Term Life, GUL, AD&D, Dental and Disability - 9/30/06 Includes all products - 9/30/06 |
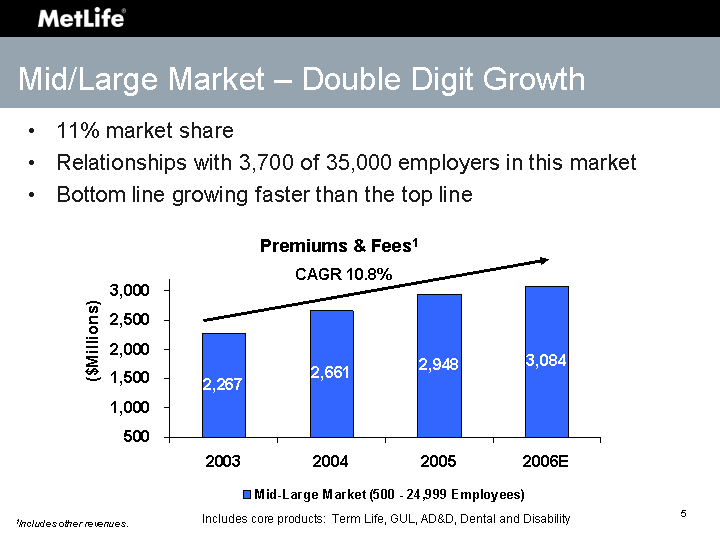
| Mid/Large Market - Double Digit Growth 11% market share Relationships with 3,700 of 35,000 employers in this market Bottom line growing faster than the top line 2003 2004 2005 2006E Mid-Large Market (500 - 24,999 Employees) 2267 2661 2948 3084 CAGR 10.8% Premiums & Fees1 1Includes other revenues. Includes core products: Term Life, GUL, AD&D, Dental and Disability |
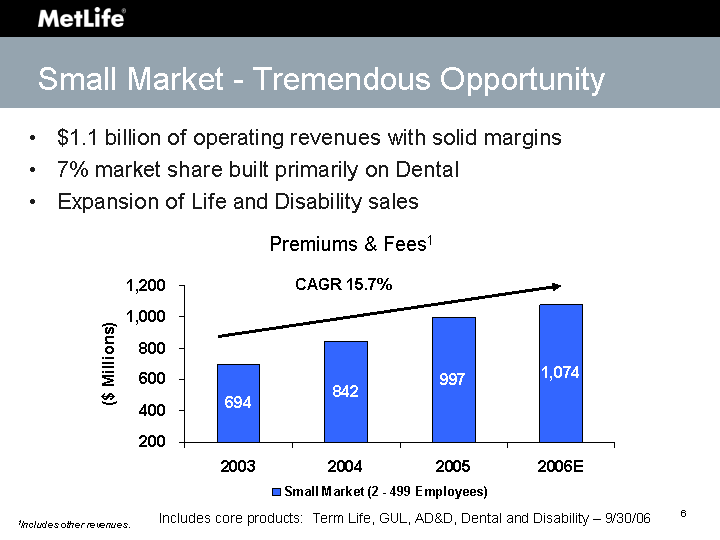
| Small Market - Tremendous Opportunity $1.1 billion of operating revenues with solid margins 7% market share built primarily on Dental Expansion of Life and Disability sales 2003 2004 2005 2006E Small Market (2 - 499 Employees) 694 842 997 1074 CAGR 15.7% Premiums & Fees1 1Includes other revenues. Includes core products: Term Life, GUL, AD&D, Dental and Disability - 9/30/06 |
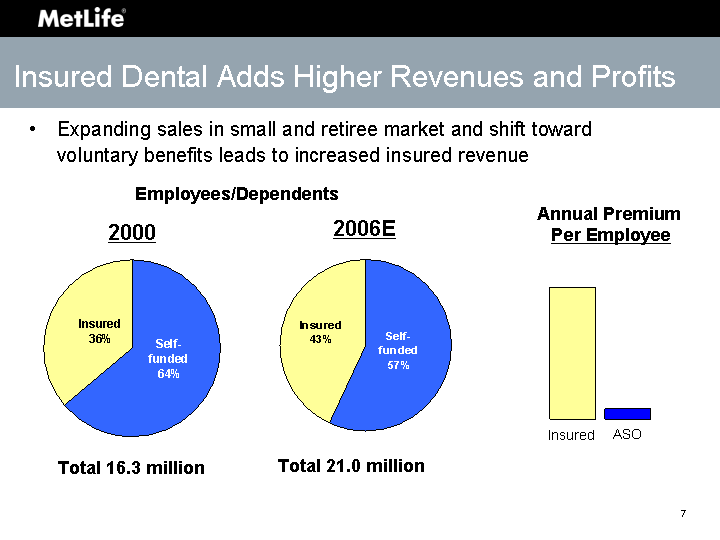
| Insured Self-funded 0.43 0.57 2006E 2000 Insured Self-funded 0.36 0.64 Insured Dental Adds Higher Revenues and Profits Expanding sales in small and retiree market and shift toward voluntary benefits leads to increased insured revenue Employees/Dependents Total 21.0 million Insured ASO Annual Premium Per Employee Total 16.3 million |
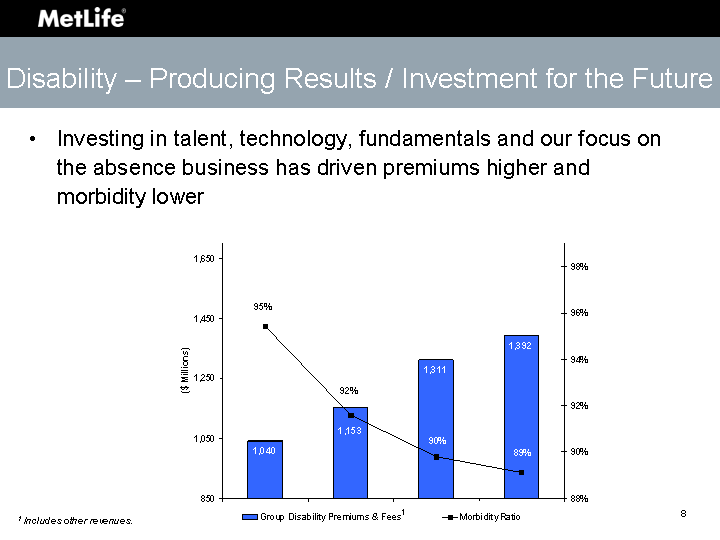
| Disability - Producing Results / Investment for the Future Investing in talent, technology, fundamentals and our focus on the absence business has driven premiums higher and morbidity lower 1 1 Includes other revenues. |
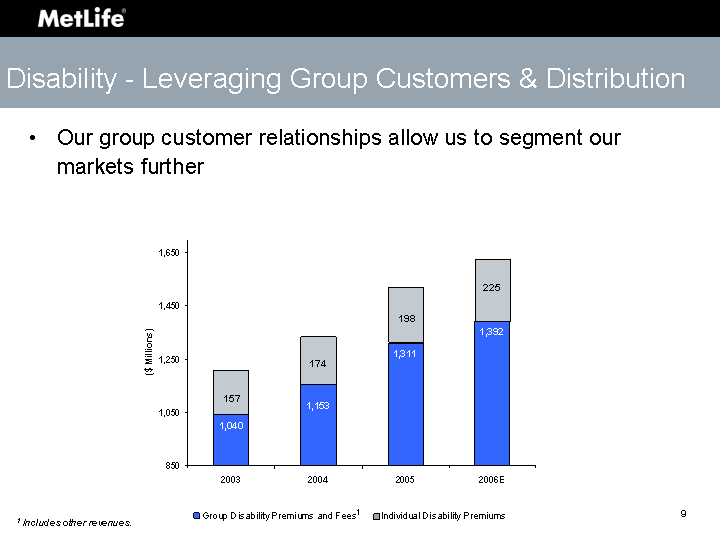
| Disability - Leveraging Group Customers & Distribution Our group customer relationships allow us to segment our markets further 157 174 198 225 1 Includes other revenues. 1 |
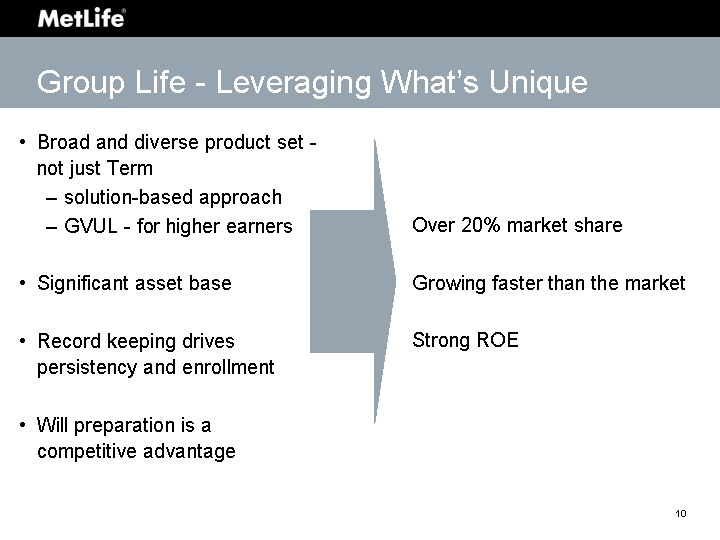
| Broad and diverse product set - not just Term solution-based approach GVUL - for higher earners Significant asset base Record keeping drives persistency and enrollment Will preparation is a competitive advantage Over 20% market share Growing faster than the market Strong ROE Group Life - Leveraging What's Unique |
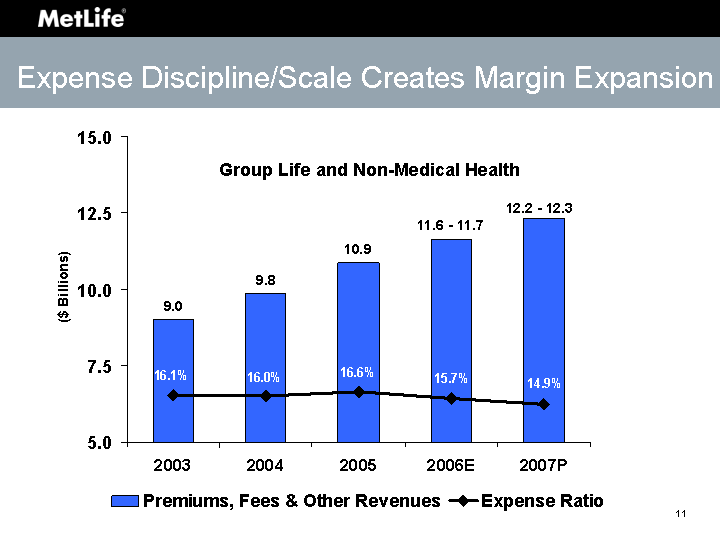
| 2003 2004 2005 2006E 2007P Premiums, Fees & Other Revenues 8.998 9.848 10.874 11.632 12.307 Expense Ratio 0.161 0.16 0.166 0.157 0.149 Expense Discipline/Scale Creates Margin Expansion Group Life and Non-Medical Health |

| Group Insurance - Poised for Growth in 2007 $12+ billion business - we still stand alone 6%+ top line growth and growing faster than the market Unprecedented customer relationships Tremendous growth opportunities Innovative products and capabilities 8% bottom line growth with expanding margins Maintain underwriting margins discipline Expand expense margins scale Offset spread compression 20% ROE |

| investor day 2 0 0 6 Sherif Zakhary Vice President - Retirement & Savings Institutional Business |
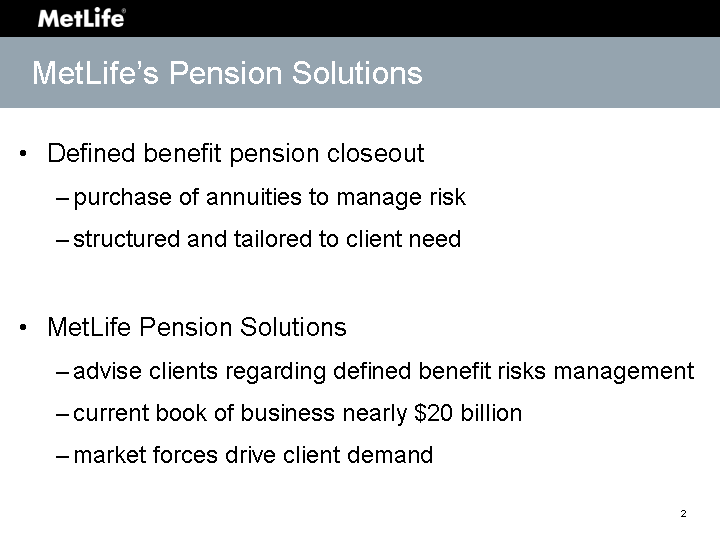
| MetLife's Pension Solutions Defined benefit pension closeout purchase of annuities to manage risk structured and tailored to client need MetLife Pension Solutions advise clients regarding defined benefit risks management current book of business nearly $20 billion market forces drive client demand |
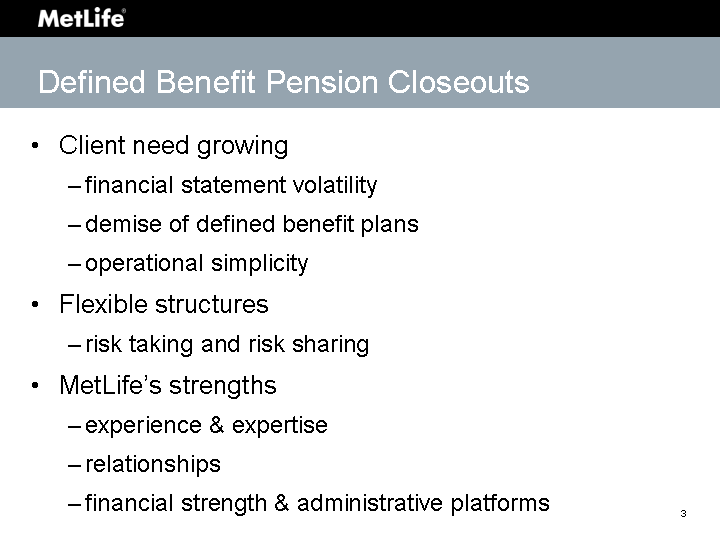
| Client need growing financial statement volatility demise of defined benefit plans operational simplicity Flexible structures risk taking and risk sharing MetLife's strengths experience & expertise relationships financial strength & administrative platforms Defined Benefit Pension Closeouts |
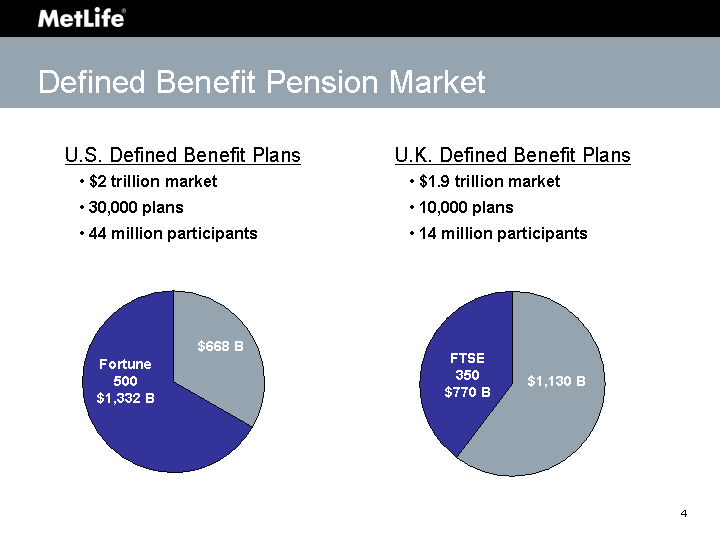
| $2 trillion market 30,000 plans 44 million participants Fortune 500 $1,332 B $1.9 trillion market 10,000 plans 14 million participants FTSE 350 $770 B U.S. Defined Benefit Plans U.K. Defined Benefit Plans $668 B $1,130 B Defined Benefit Pension Market |
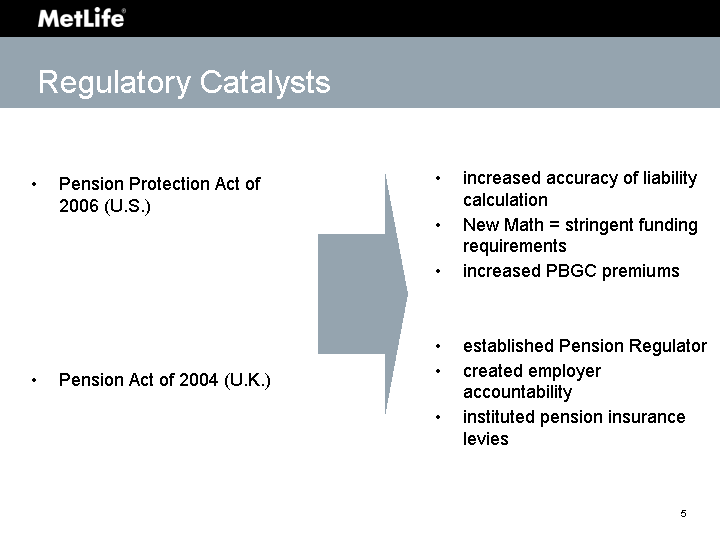
| Pension Protection Act of 2006 (U.S.) Pension Act of 2004 (U.K.) increased accuracy of liability calculation New Math = stringent funding requirements increased PBGC premiums established Pension Regulator created employer accountability instituted pension insurance levies Regulatory Catalysts |
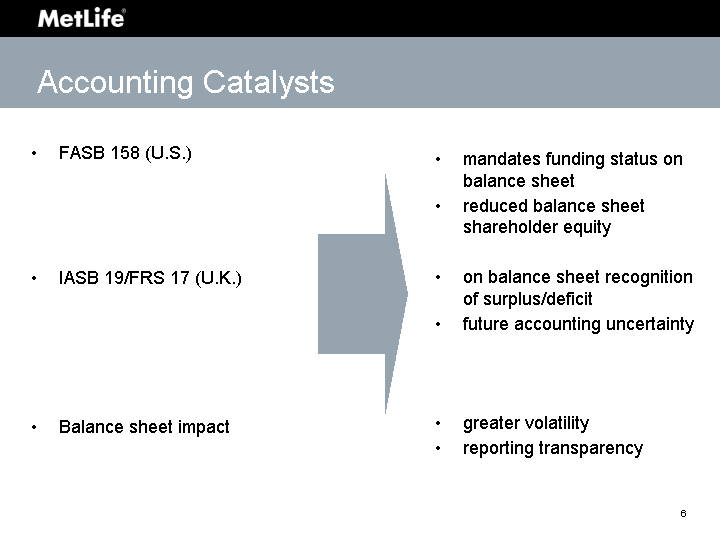
| FASB 158 (U.S.) IASB 19/FRS 17 (U.K.) Balance sheet impact mandates funding status on balance sheet reduced balance sheet shareholder equity on balance sheet recognition of surplus/deficit future accounting uncertainty greater volatility reporting transparency Accounting Catalysts |
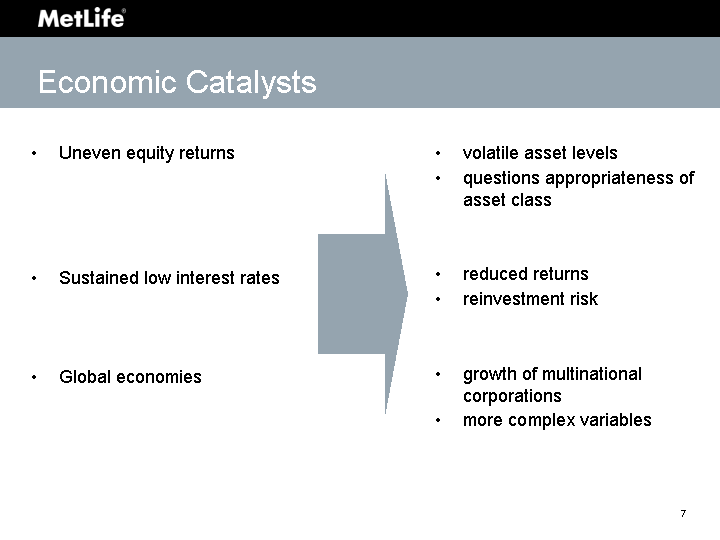
| Uneven equity returns Sustained low interest rates Global economies volatile asset levels questions appropriateness of asset class reduced returns reinvestment risk growth of multinational corporations more complex variables Economic Catalysts |
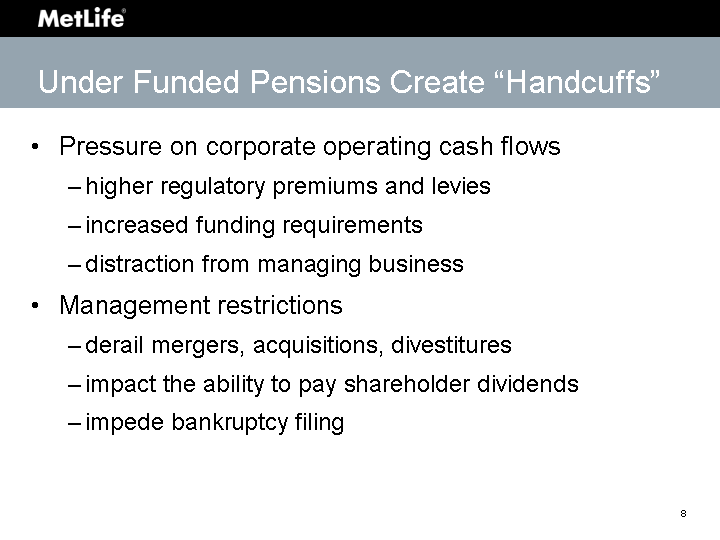
| Pressure on corporate operating cash flows higher regulatory premiums and levies increased funding requirements distraction from managing business Management restrictions derail mergers, acquisitions, divestitures impact the ability to pay shareholder dividends impede bankruptcy filing Under Funded Pensions Create "Handcuffs" |

| Single Employer Plans FY 1990-2005 1990 1991 1992 1993 1994 1995 1996 1997 1998 1999 2000 2001 2002 2003 2004 2005 -1.913 -2.503 -2.737 -2.897 -1.24 -0.315 0.869 3.481 5.012 7.038 9.704 7.732 -3.638 -11.238 -23.305 -22.776 ($ Billions) Source: PBGC Annual Reports 1990-2005 PBGC Net Position |
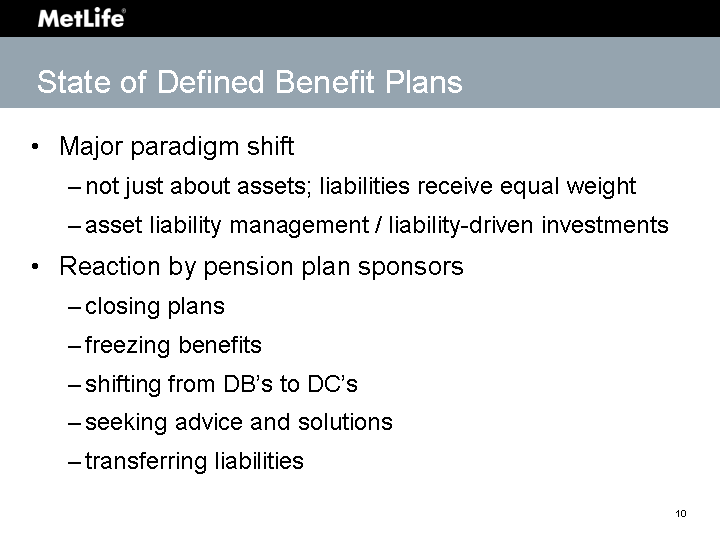
| Major paradigm shift not just about assets; liabilities receive equal weight asset liability management / liability-driven investments Reaction by pension plan sponsors closing plans freezing benefits shifting from DB's to DC's seeking advice and solutions transferring liabilities State of Defined Benefit Plans |
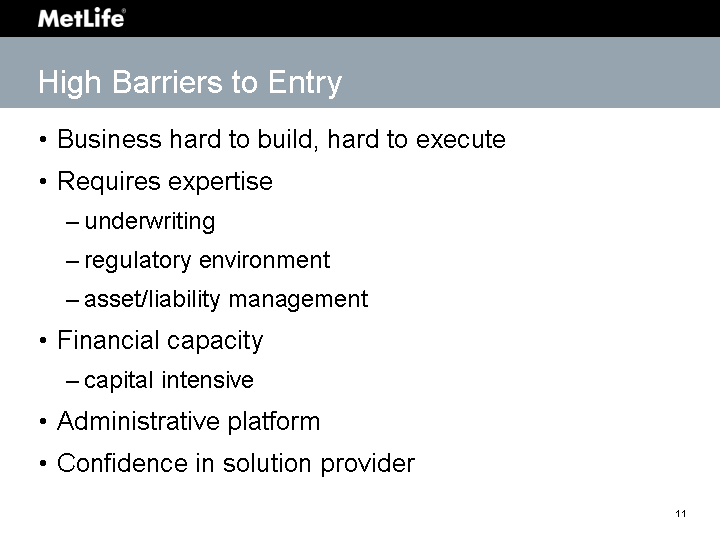
| Business hard to build, hard to execute Requires expertise underwriting regulatory environment asset/liability management Financial capacity capital intensive Administrative platform Confidence in solution provider High Barriers to Entry |
| Experience & expertise closeout book of business of nearly $20 billion service over 1 million annuitants built complex administration platforms Access to capital Relationships large U.S. franchise - National Accounts, Mid/Large strong multinational U.K. opportunities MetLife's Advantages |
| Financial impact top line impact - lumpy, hard to predict bottom line impact - step function increases asset growth - step function increases capital usage depends on structure Placeholder of $1 billion revenues in Plan MetLife's Closeout Expectations for 2007 |
| Growth Global GICs funding agreements structured settlements pension closeouts Operating Earnings impacted by a decline in variable income over 2006 actual Total R&S assets projected to grow to $120-123 billion 2007 Retirement & Savings |

| investor day 2 0 0 6 Ichiro Miyake Co-Chief Executive Officer, MSIMetLife International |
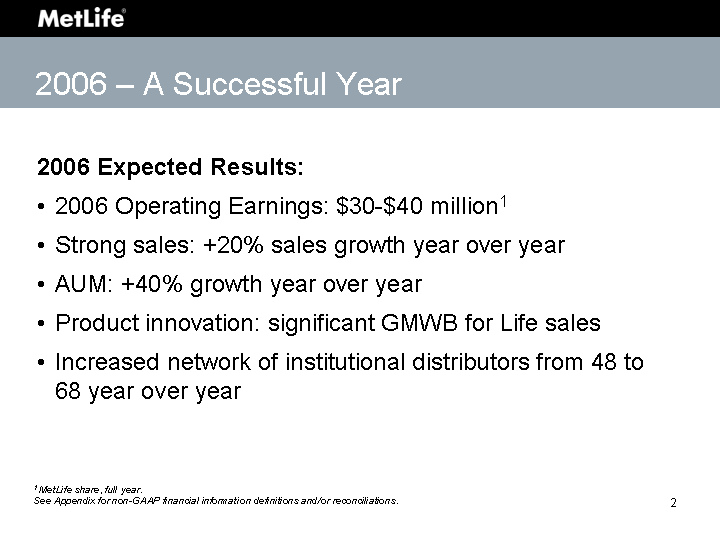
| 2006 Expected Results: 2006 Operating Earnings: $30-$40 million1 Strong sales: +20% sales growth year over year AUM: +40% growth year over year Product innovation: significant GMWB for Life sales Increased network of institutional distributors from 48 to 68 year over year 2006 - A Successful Year 1 MetLife share, full year. See Appendix for non-GAAP financial information definitions and/or reconciliations. |
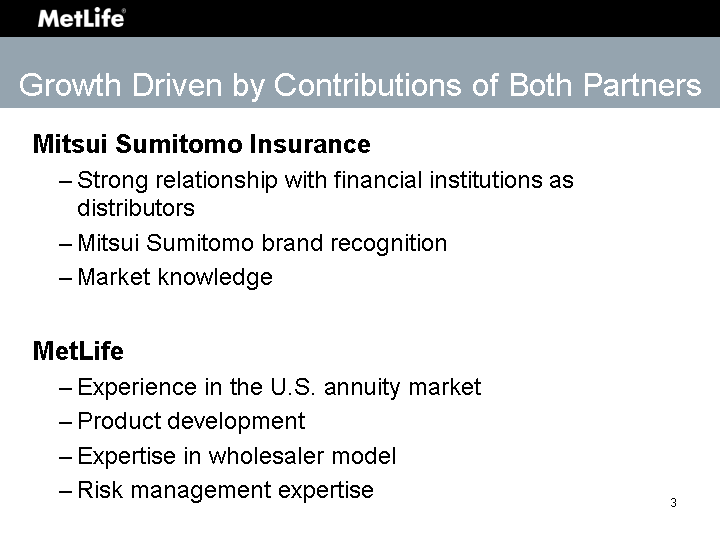
| Mitsui Sumitomo Insurance Strong relationship with financial institutions as distributors Mitsui Sumitomo brand recognition Market knowledge MetLife Experience in the U.S. annuity market Product development Expertise in wholesaler model Risk management expertise Growth Driven by Contributions of Both Partners |
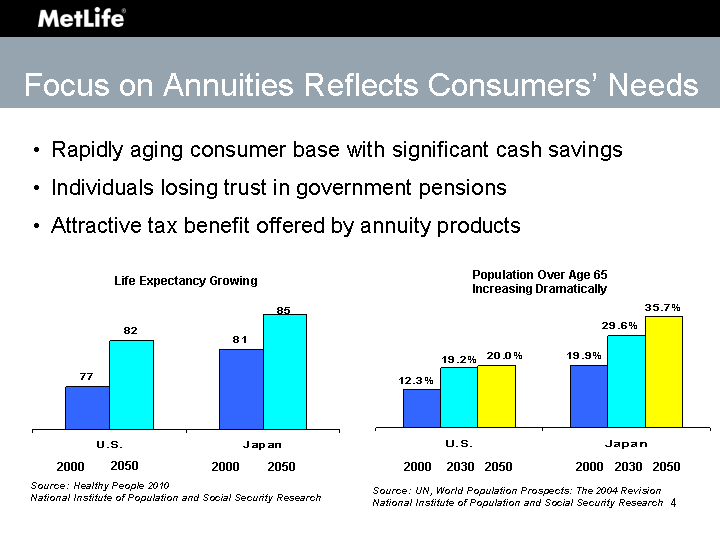
| Population Over Age 65 Increasing Dramatically Life Expectancy Growing Rapidly aging consumer base with significant cash savings Individuals losing trust in government pensions Attractive tax benefit offered by annuity products Focus on Annuities Reflects Consumers' Needs 2000 2000 2000 2000 2050 2030 2030 2050 2050 2050 Source: Healthy People 2010 National Institute of Population and Social Security Research Source: UN, World Population Prospects: The 2004 Revision National Institute of Population and Social Security Research U.S. Japan 2000 0.1228 0.1988 2030 0.1918 0.2957 2050 0.1998 0.3565 U.S. Japan 2000 76.8 81.1 2050 82 85 |
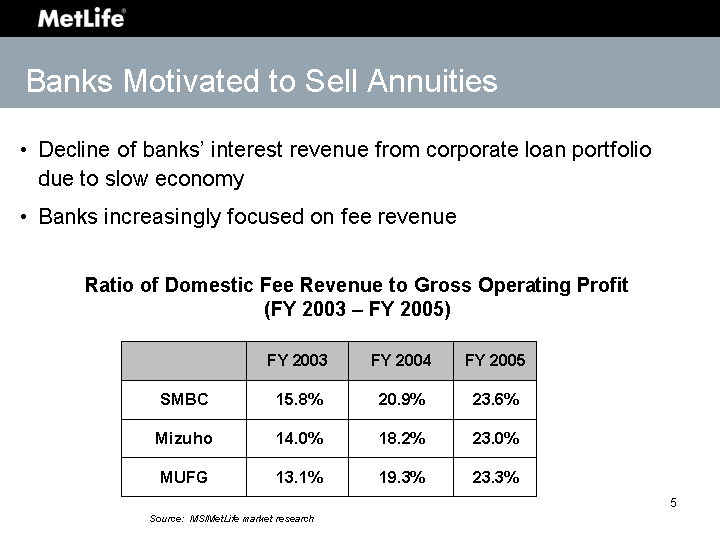
| Banks Motivated to Sell Annuities Ratio of Domestic Fee Revenue to Gross Operating Profit (FY 2003 - FY 2005) Decline of banks' interest revenue from corporate loan portfolio due to slow economy Banks increasingly focused on fee revenue Source: MSIMetLife market research |
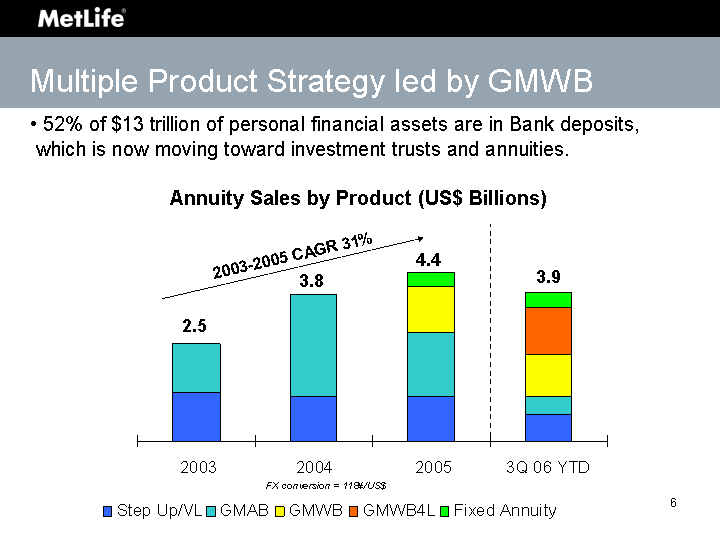
| Multiple Product Strategy led by GMWB 2.53 3.82 4.37 3.86 CAGR % 2003 2004 2005 3Q 06 YTD Step Up/VL GMAB GMWB GMWB4L Fixed Annuity 2003-2005 CAGR 31% 2.5 4.4 3.8 3.9 52% of $13 trillion of personal financial assets are in Bank deposits, which is now moving toward investment trusts and annuities. FX conversion = 118¥/US$ Annuity Sales by Product (US$ Billions) |

| 0.2 2.5 3.8 4.4 3.9 2002 2003 2004 2005 2006 YTD 0.1 2.7 6.6 12.1 15.8 2002 2003 2004 2005 3Q 06 Strong Overall Growth in Sales and AUM Note: Both Sales and AUM data are presented on a calendar year basis. FX conversion = 118¥/US$. Japan joint venture not consolidated for financial reporting purposes. (US$ Billions) AUM Sales CAGR 2003-2005: 31% CAGR 2003-2005: 112% Strong net sales and market growth expected to continue |
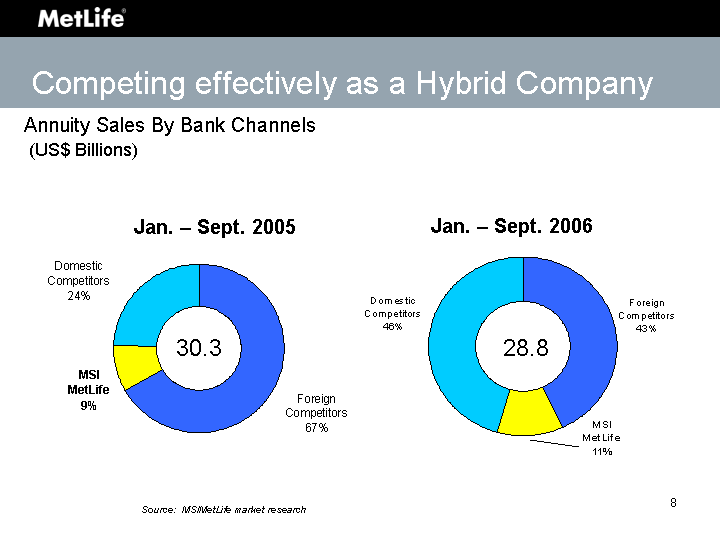
| Competing effectively as a Hybrid Company Annuity Sales By Bank Channels (US$ Billions) Source: MSIMetLife market research 30.3 Jan. - Sept. 2005 Jan. - Sept. 2006 28.8 |
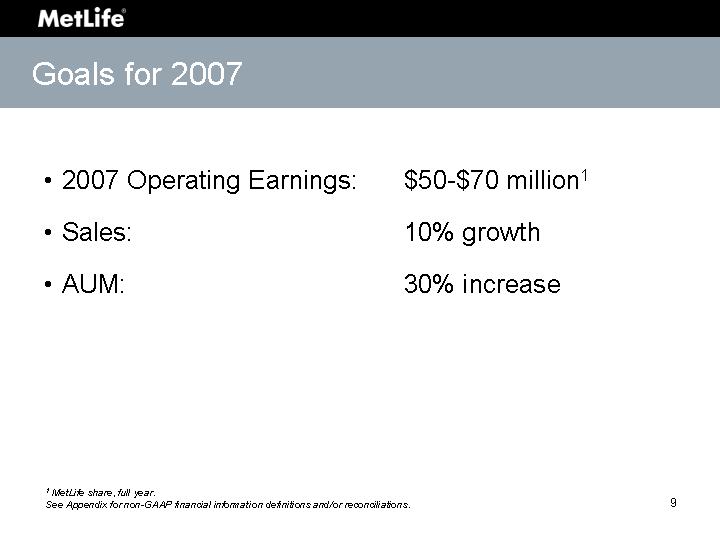
| 2007 Operating Earnings: $50-$70 million1 Sales: 10% growth AUM: 30% increase Goals for 2007 1 MetLife share, full year. See Appendix for non-GAAP financial information definitions and/or reconciliations. |
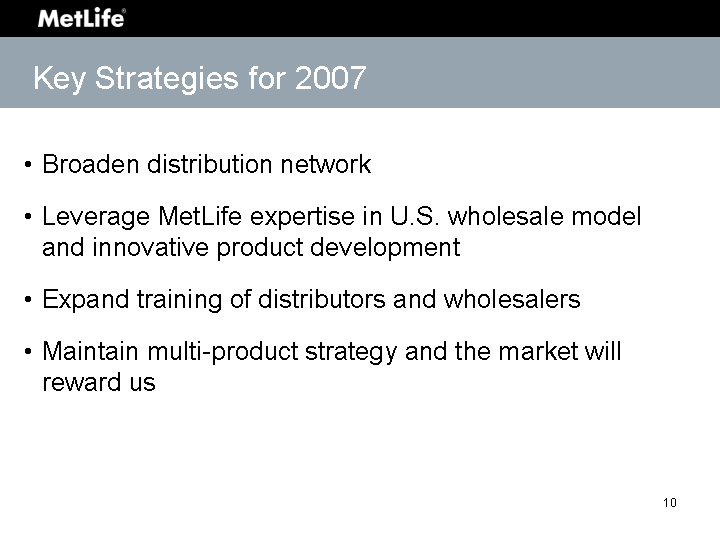
| Broaden distribution network Leverage MetLife expertise in U.S. wholesale model and innovative product development Expand training of distributors and wholesalers Maintain multi-product strategy and the market will reward us Key Strategies for 2007 |
| Addressing needs created by Japan's aging society Growing market share Possessing strong complementary JV partners with history of product innovation Benefiting from excellent relationships with distributors Leveraging U.S. wholesaling experience Increasing the number of regional bank distribution relationships presents opportunity for growth Important Takeaways |


| investor day 2 0 0 6 Stuart Solomon Chief Executive Officer, MetLife Korea International |
| Record Operating Earnings, $95 - $105 million, up 60% year over year Strong sales, $780 - $910 million Record AUM, $4.6 - $4.8 billion Funded by organic growth since 1998 Innovative products as part of a balanced portfolio Strong credit ratings: AA+/Stable from NICE1 2006 - A Successful Year 1 National Information & Credit Evaluation, Inc. AA+/Stable from AA/Positive as of October 24, 2006. See Appendix for non-GAAP financial information definitions and/or reconciliations. |
| Experienced, disciplined management team Highly trained, highly productive professional sales force selling quality business Proven first mover for introduction of innovative, sophisticated products such as VUL and GMWB Accessed mass market through bancassurance and direct marketing channels Leveraged MetLife's core competencies Components of Success |
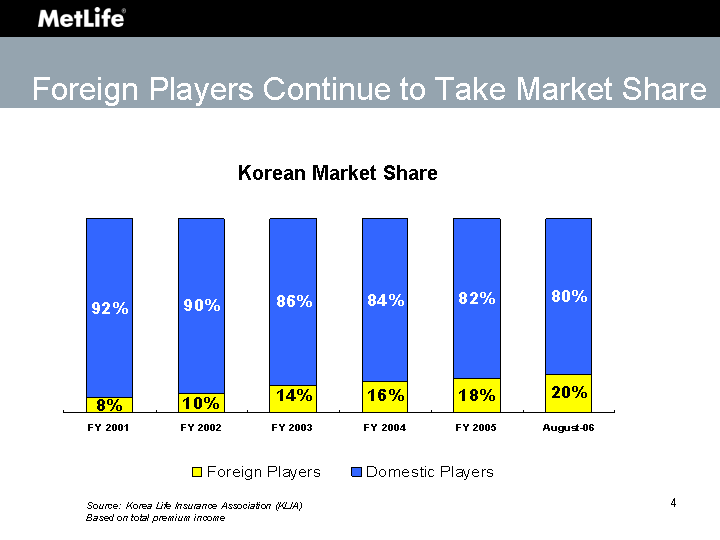
| Foreign Players Continue to Take Market Share FY 2001 FY 2002 FY 2003 FY 2004 FY 2005 8/1/2006 Foreign Players 0.08 0.1 0.14 0.16 0.18 0.2 Domestic Players 0.92 0.9 0.86 0.84 0.82 0.8 Source: Korea Life Insurance Association (KLIA) Based on total premium income Korean Market Share |
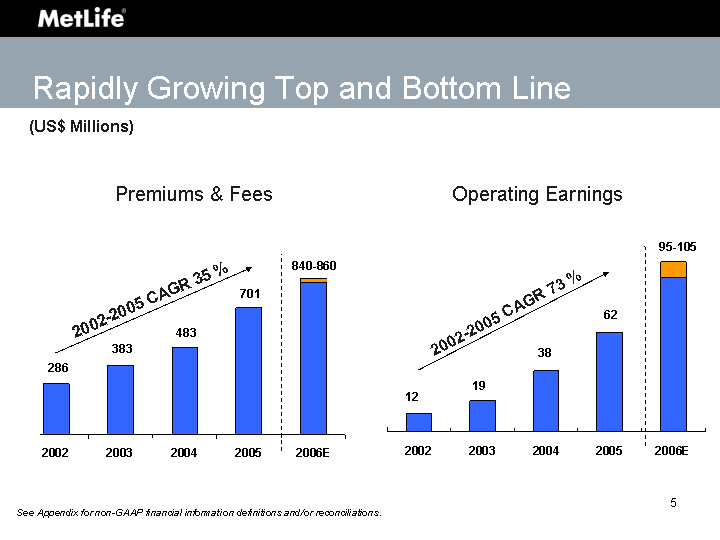
| 2002 2003 2004 2005 2006E Premium & Fees 281 383 483 701 840 20 2002 2003 2004 2005 2006E Operating Earnings 11.6 19.2 37.5 61.5 95 10 Premiums & Fees Rapidly Growing Top and Bottom Line 2002-2005 CAGR 35 % Operating Earnings 286 383 483 701 840-860 12 19 38 62 95-105 (US$ Millions) 2002-2005 CAGR 73 % See Appendix for non-GAAP financial information definitions and/or reconciliations. |
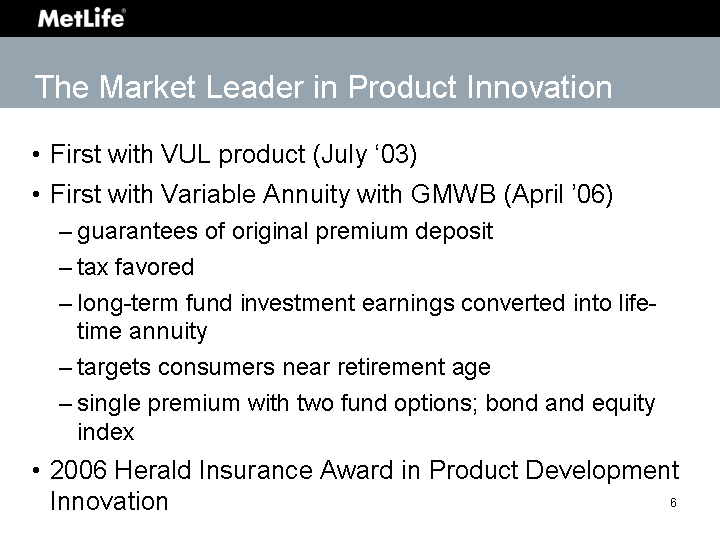
| First with VUL product (July '03) First with Variable Annuity with GMWB (April '06) guarantees of original premium deposit tax favored long-term fund investment earnings converted into life- time annuity targets consumers near retirement age single premium with two fund options; bond and equity index 2006 Herald Insurance Award in Product Development Innovation The Market Leader in Product Innovation |
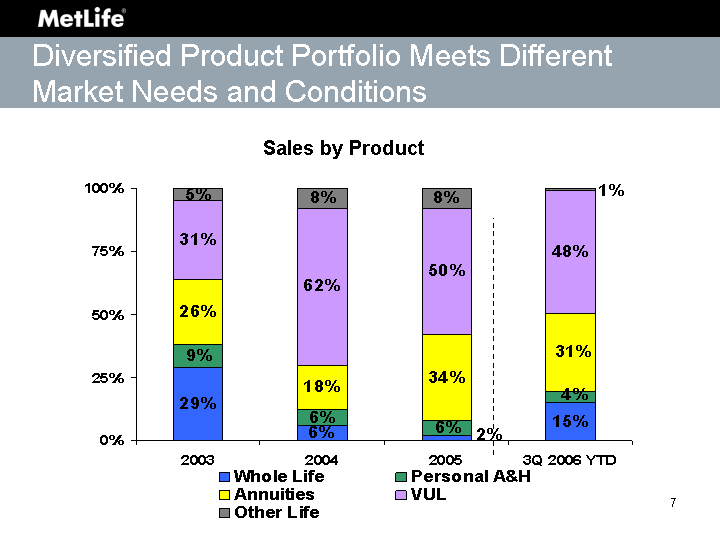
| 2003 2004 2005 3Q 2006 YTD Whole Life 0.29 0.06 0.02 0.15 Personal A&H 0.09 0.06 0.06 0.04 Annuities 0.26 0.18 0.34 0.31 VUL 0.31 0.62 0.5 0.48 Other Life 0.05 0.08 0.08 0.01 Sales by Product Diversified Product Portfolio Meets Different Market Needs and Conditions |
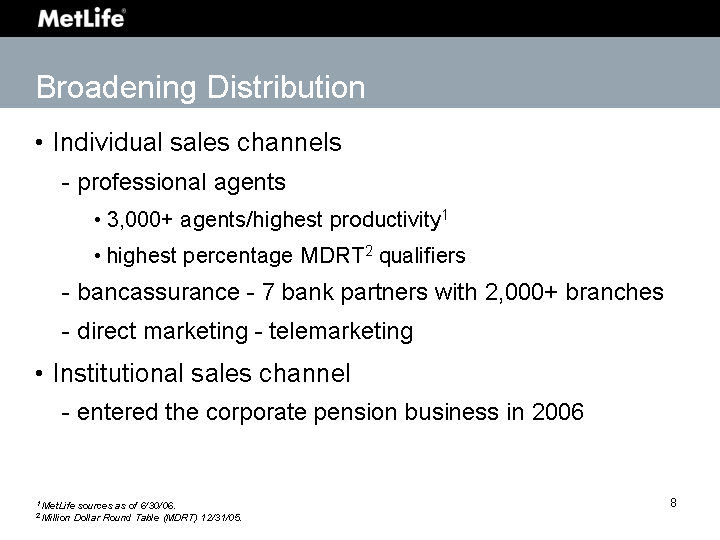
| Individual sales channels - - professional agents 3,000+ agents/highest productivity1 highest percentage MDRT2 qualifiers - - bancassurance - 7 bank partners with 2,000+ branches - - direct marketing - telemarketing Institutional sales channel - - entered the corporate pension business in 2006 Broadening Distribution 1 MetLife sources as of 6/30/06. 2 Million Dollar Round Table (MDRT) 12/31/05. |
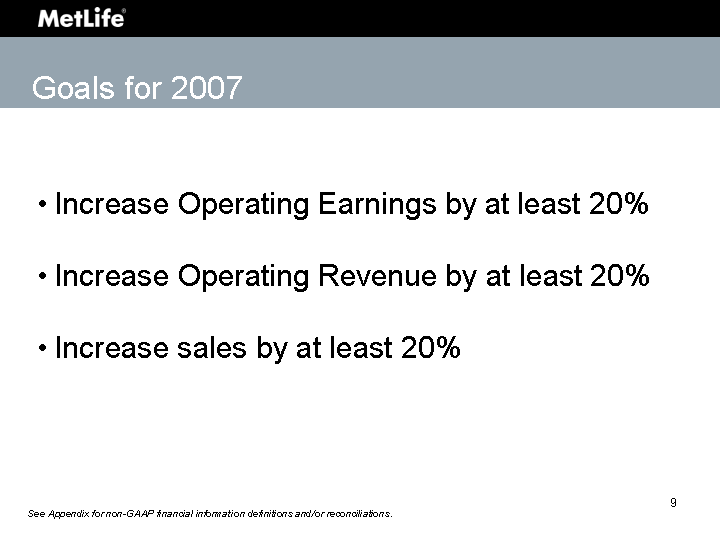
| Goals for 2007 Increase Operating Earnings by at least 20% Increase Operating Revenue by at least 20% Increase sales by at least 20% See Appendix for non-GAAP financial information definitions and/or reconciliations. |
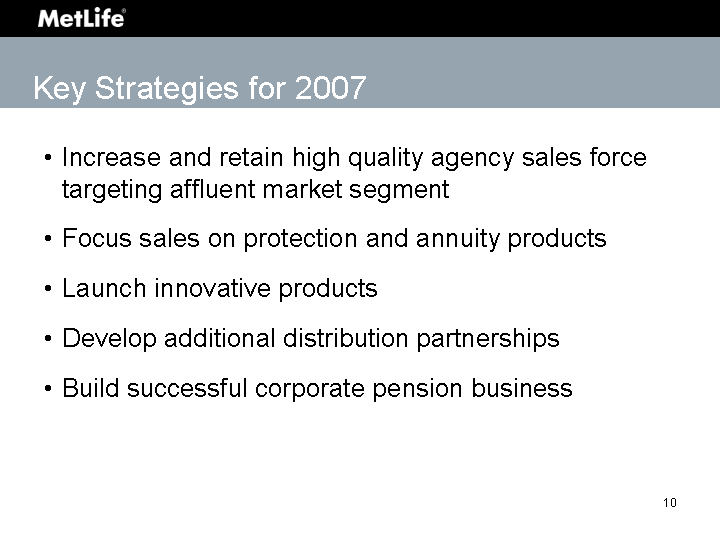
| Key Strategies for 2007 Increase and retain high quality agency sales force targeting affluent market segment Focus sales on protection and annuity products Launch innovative products Develop additional distribution partnerships Build successful corporate pension business |
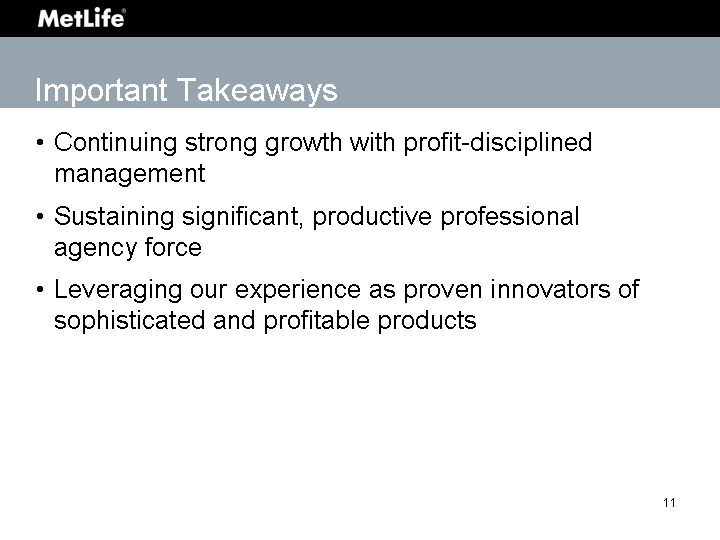
| Continuing strong growth with profit-disciplined management Sustaining significant, productive professional agency force Leveraging our experience as proven innovators of sophisticated and profitable products Important Takeaways |

| investor day 2 0 0 6 William J. Mullaney President Auto & Home |
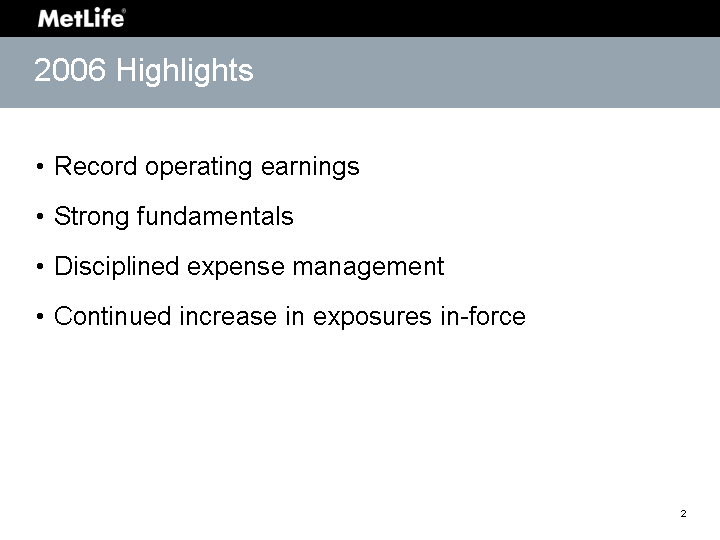
| 2006 Highlights Record operating earnings Strong fundamentals Disciplined expense management Continued increase in exposures in-force |

| Record Operating Earnings 380 - 390 CAGR 32% ($ Millions) See Appendix for non-GAAP financial information definitions and/or reconciliations. |
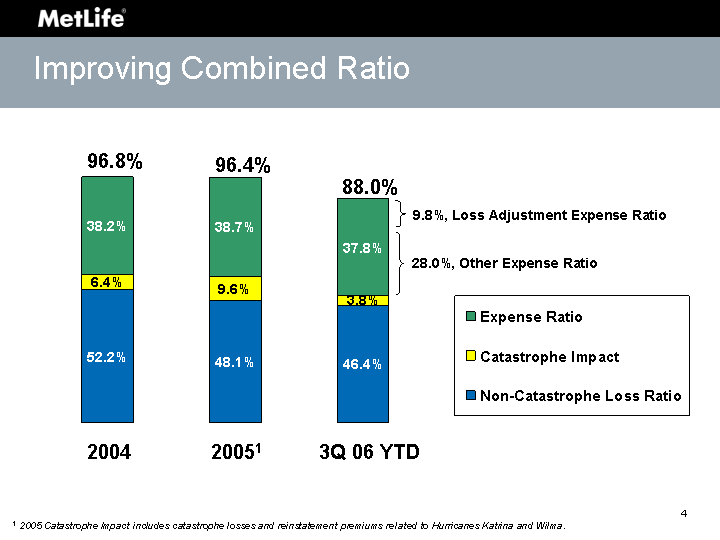
| Improving Combined Ratio 96.8% 96.4% 88.0% 9.8%, Loss Adjustment Expense Ratio 28.0%, Other Expense Ratio 38.2% 38.7% 37.8% Expense Ratio 6.4% 9.6% 3.8% Catastrophe Impact 1 2005 Catastrophe Impact includes catastrophe losses and reinstatement premiums related to Hurricanes Katrina and Wilma. 52.2% 48.1% 46.4% 2004 20051 3Q 06 YTD Non-Catastrophe Loss Ratio |
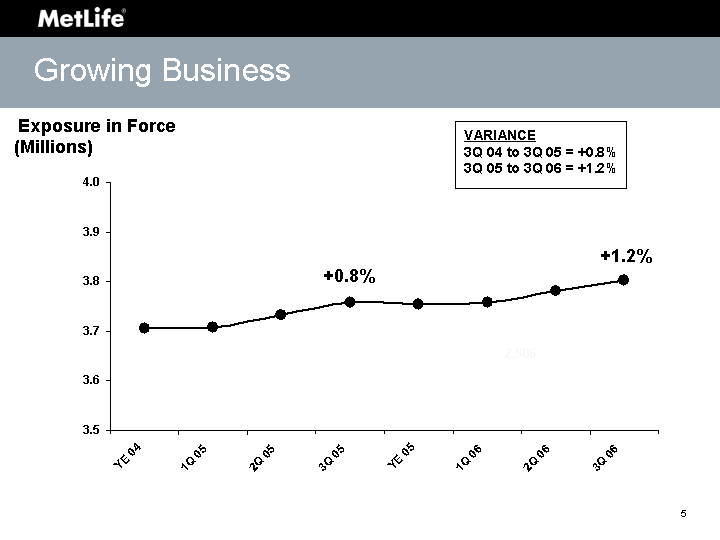
| VARIANCE 3Q 04 to 3Q 05 = +0.8% 3Q 05 to 3Q 06 = +1.2% Growing Business 2,906 Exposure in Force (Millions) +0.8% +1.2% |
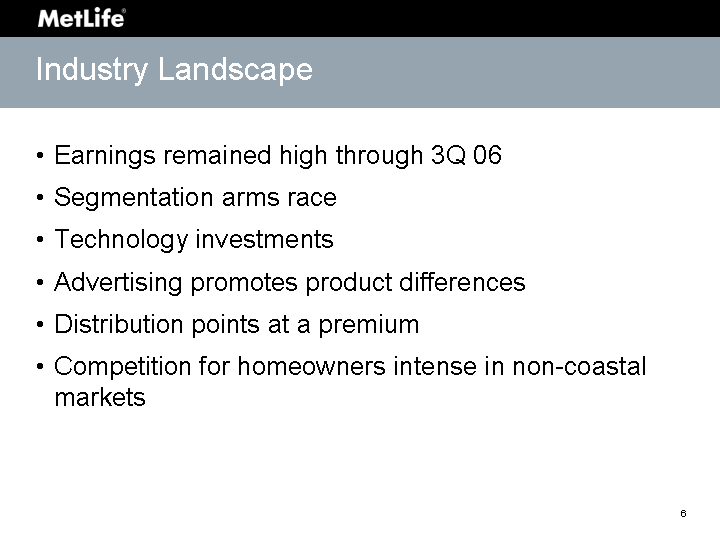
| Industry Landscape Earnings remained high through 3Q 06 Segmentation arms race Technology investments Advertising promotes product differences Distribution points at a premium Competition for homeowners intense in non-coastal markets |
| Auto & Home: Focus for 2007 Expand pricing sophistication Leverage differentiated products Capitalize on distribution capabilities Aggressive expense management Continue volatility management |
| Expand Pricing Sophistication Metrix for Auto Next generation of tiering Refine segmentation More competitive niches More rate levels Greater flexibility |

| Measures of Success Quotes Up Closing Ratio Up Sales Up Average Premium Up Bonus: Home Sales Up As measured from 12 weeks before roll-out in each state to 11/30/06. |
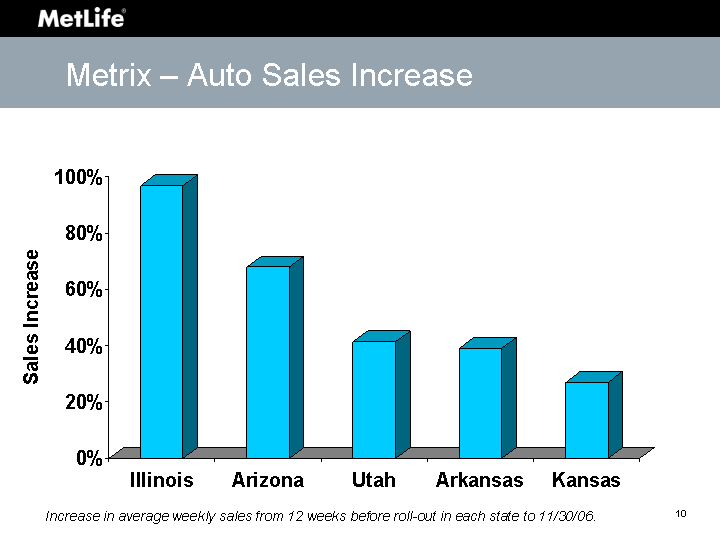
| Metrix - Auto Sales Increase Illinois Arizona Utah Arkansas Kansas Auto Sales Increase 0.969 0.679 0.413 0.391 0.269 Increase in average weekly sales from 12 weeks before roll-out in each state to 11/30/06. |
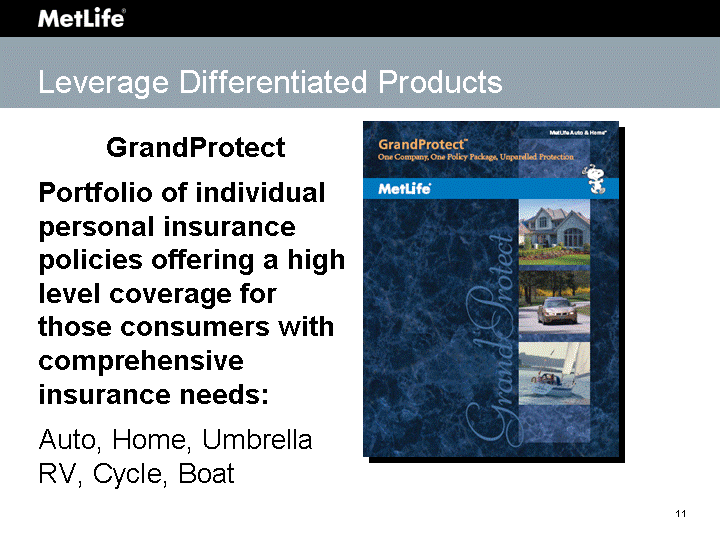
| Leverage Differentiated Products GrandProtect Portfolio of individual personal insurance policies offering a high level coverage for those consumers with comprehensive insurance needs: Auto, Home, Umbrella RV, Cycle, Boat |
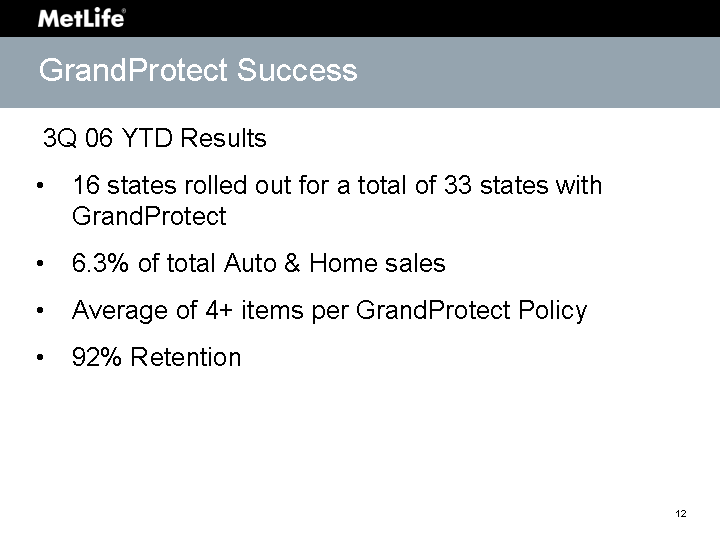
| 3Q 06 YTD Results 16 states rolled out for a total of 33 states with GrandProtect 6.3% of total Auto & Home sales Average of 4+ items per GrandProtect Policy 92% Retention GrandProtect Success |
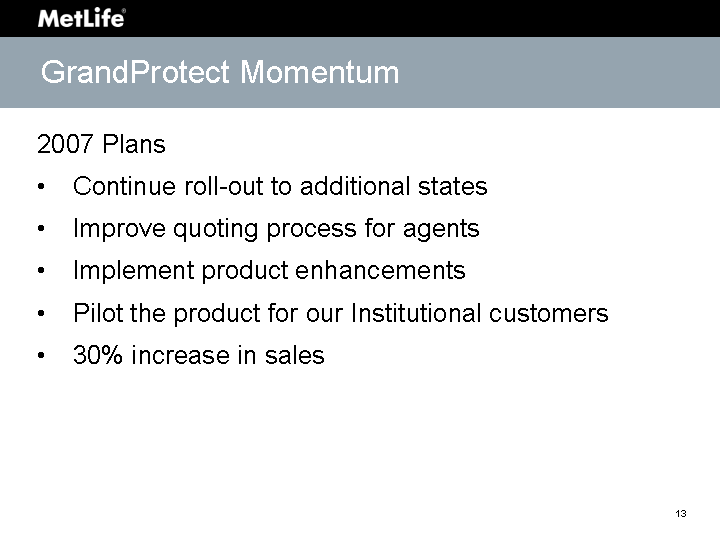
| GrandProtect Momentum 2007 Plans Continue roll-out to additional states Improve quoting process for agents Implement product enhancements Pilot the product for our Institutional customers 30% increase in sales |
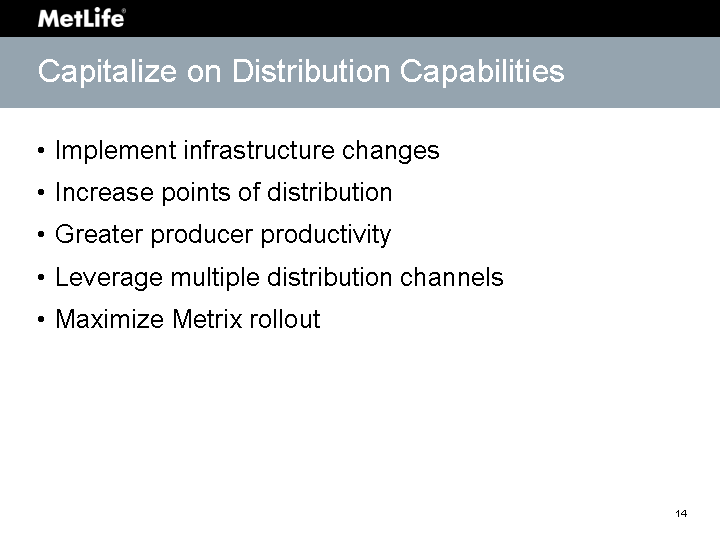
| Capitalize on Distribution Capabilities Implement infrastructure changes Increase points of distribution Greater producer productivity Leverage multiple distribution channels Maximize Metrix rollout |
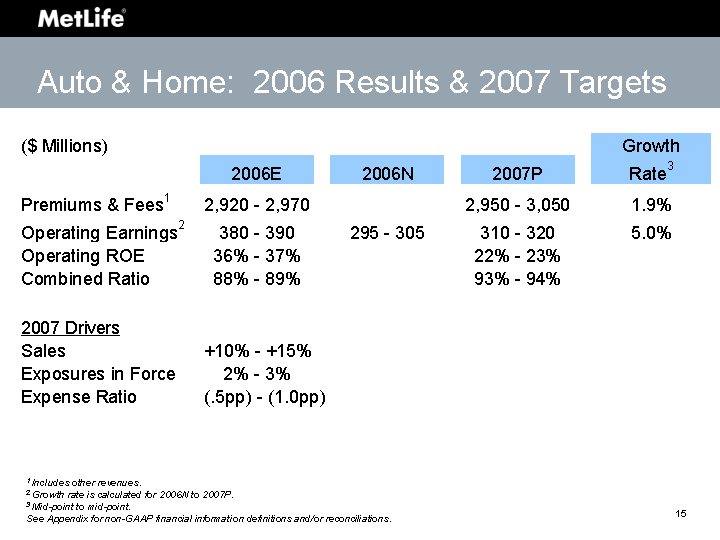
| Auto & Home: 2006 Results & 2007 Targets 1 Includes other revenues. 2 Growth rate is calculated for 2006N to 2007P. 3 Mid-point to mid-point. See Appendix for non-GAAP financial information definitions and/or reconciliations. |

| Mike Farrell Executive Vice President - Independent Distribution Group Mike Vietri Executive Vice President - Agency Distribution Group Individual Business investor day 2 0 0 6 |
| Individual Annuities: A continuing growth opportunity |
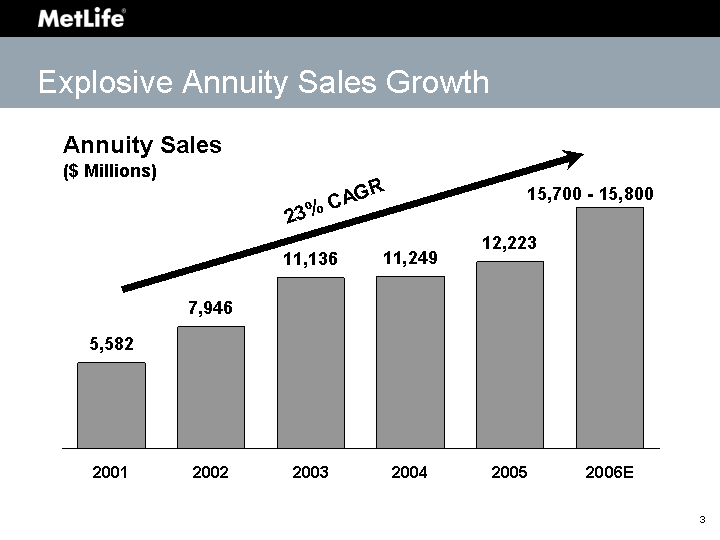
| Explosive Annuity Sales Growth 23% CAGR Annuity Sales ($ Millions) |
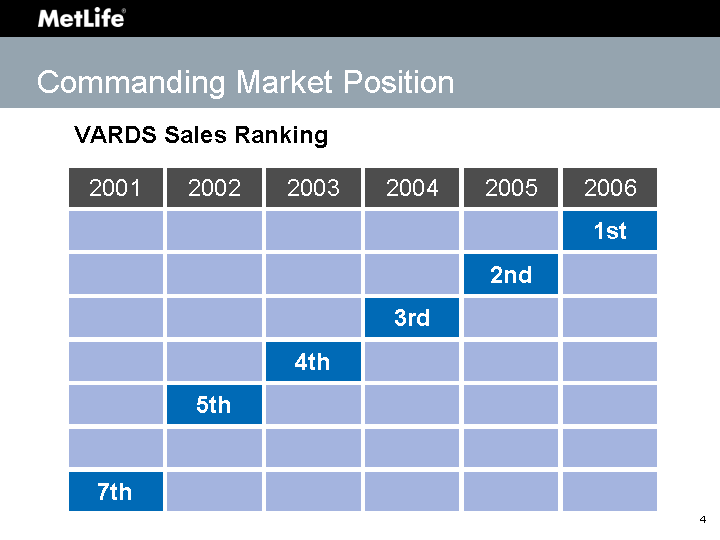
| Commanding Market Position Commanding Market Position VARDS Sales Ranking |
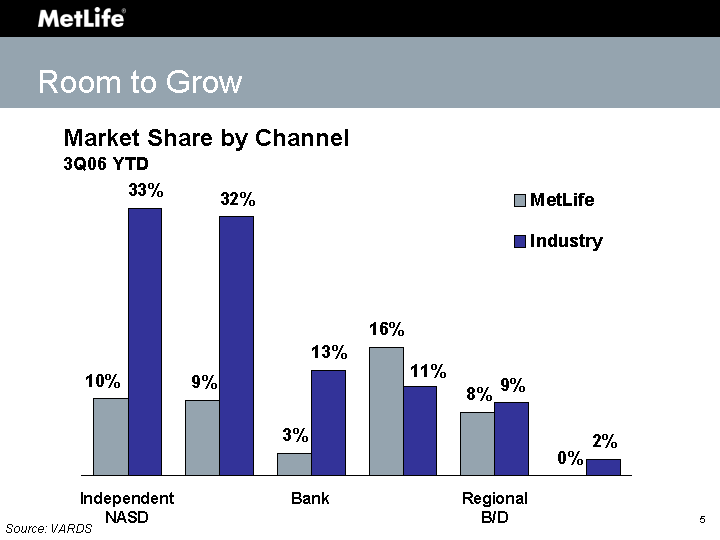
| Room to Grow Source: VARDS Independent NASD Agency Bank Wirehouse Regional B/D Other MetLife 0.0953 0.0933 0.0274 0.1585 0.0786 0 Industry 0.33 0.32 0.13 0.11 0.09 0.02 Market Share by Channel 3Q06 YTD |
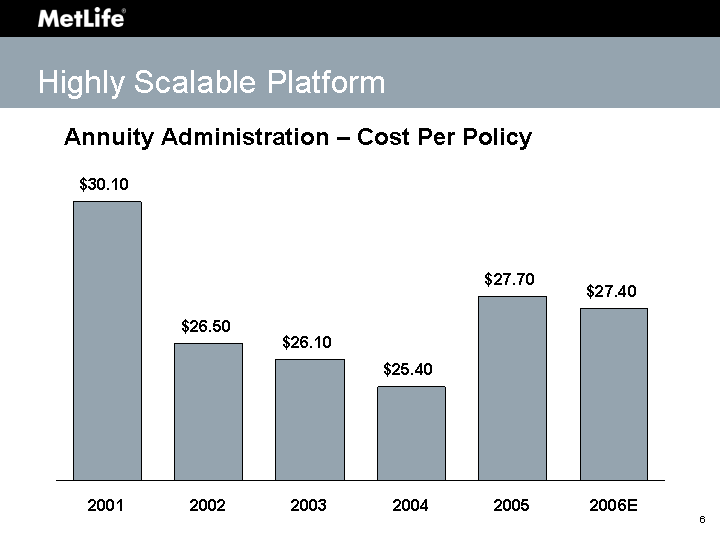
| Highly Scalable Platform 12/1/2001 12/1/2002 12/3/2003 12/3/2004 12/3/2005 2006E In Force Counts 30.1 26.5 26.1 25.4 27.7 27.4 Annuity Administration - Cost Per Policy |
| Independent Distribution |
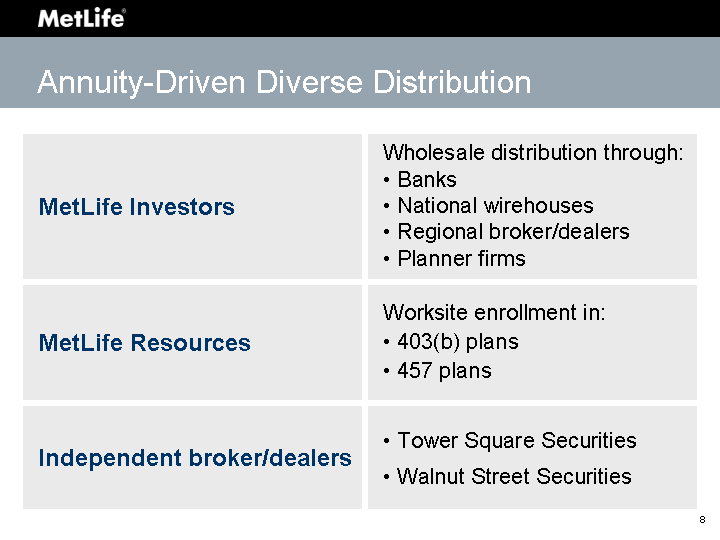
| Annuity-Driven Diverse Distribution Annuity-Driven Diverse Distribution |
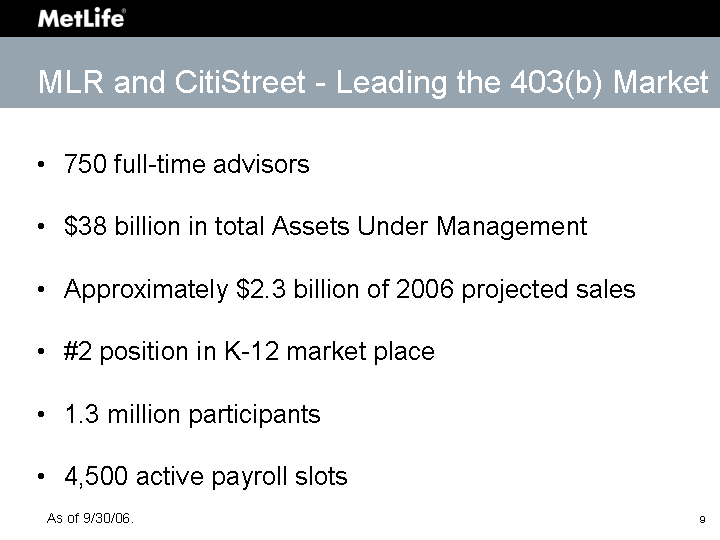
| 750 full-time advisors $38 billion in total Assets Under Management Approximately $2.3 billion of 2006 projected sales #2 position in K-12 market place 1.3 million participants 4,500 active payroll slots MLR and CitiStreet - Leading the 403(b) Market As of 9/30/06. |
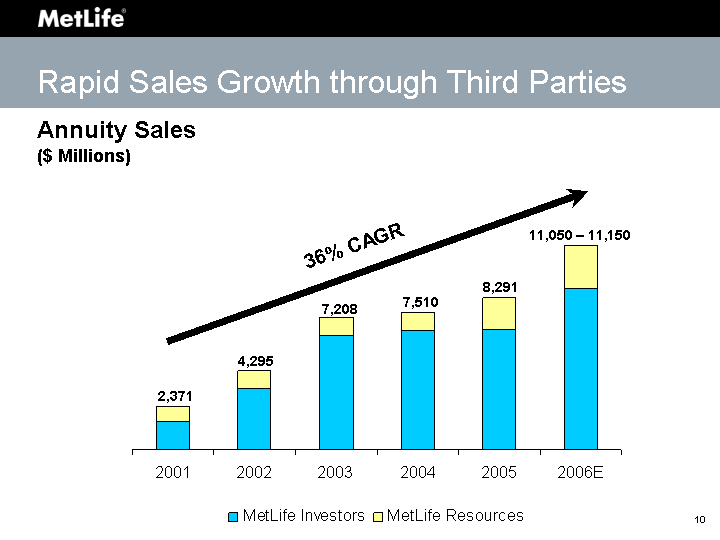
| Rapid Sales Growth through Third Parties Annuity Sales ($ Millions) 36% CAGR 2,371 4,295 7,208 7,510 8,291 11,050 - 11,150 |
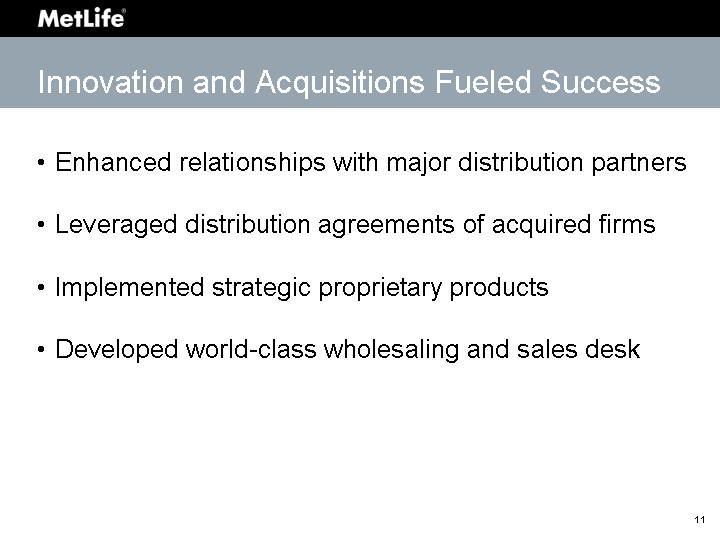
| Innovation and Acquisitions Fueled Success Enhanced relationships with major distribution partners Leveraged distribution agreements of acquired firms Implemented strategic proprietary products Developed world-class wholesaling and sales desk |
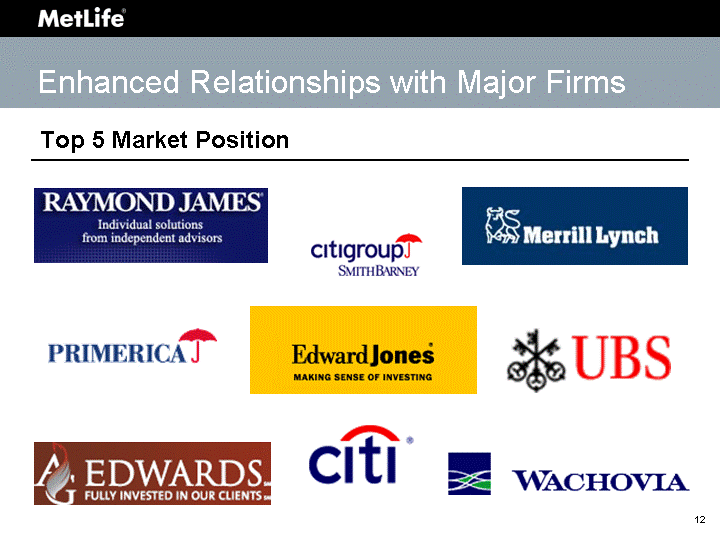
| Enhanced Relationships with Major Firms Top 5 Market Position |
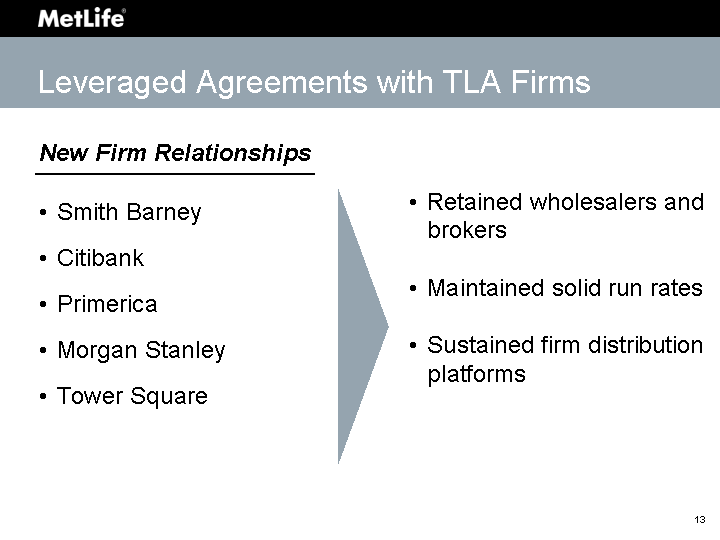
| Retained wholesalers and brokers Maintained solid run rates Sustained firm distribution platforms Leveraged Agreements with TLA Firms New Firm Relationships Smith Barney Citibank Primerica Morgan Stanley Tower Square |
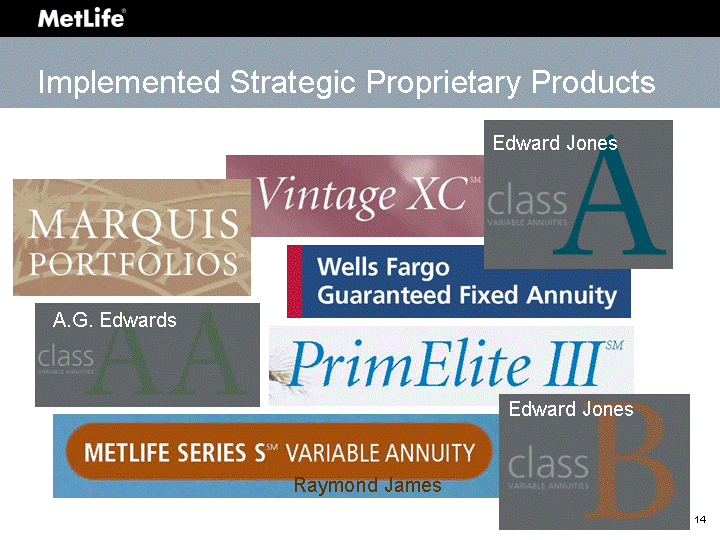
| Raymond James Edward Jones A.G. Edwards Edward Jones Implemented Strategic Proprietary Products |
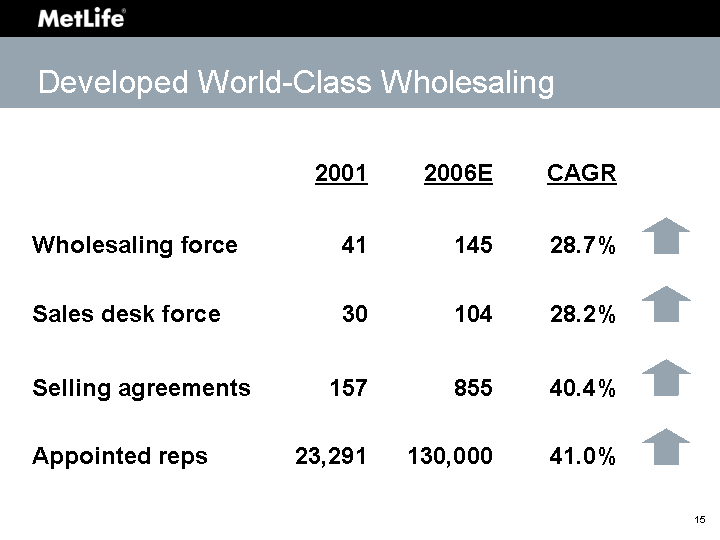
| Developed World-Class Wholesaling 2001 2006E CAGR Wholesaling force 41 145 28.7% Sales desk force 30 104 28.2% Selling agreements 157 855 40.4% Appointed reps 23,291 130,000 41.0% |
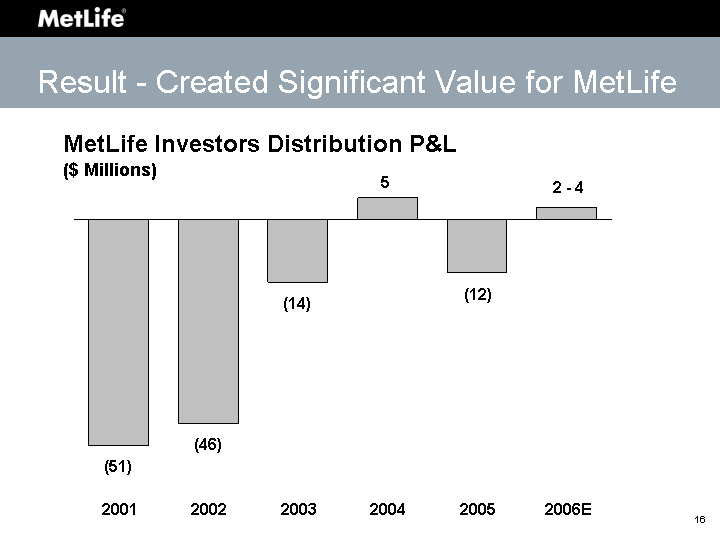
| Result - Created Significant Value for MetLife (46) (51) (14) 5 (12) 2 - 4 2001 2002 2003 2004 2005 2006E MetLife Investors Distribution P&L ($ Millions) |

| The Future - More Growth on Horizon Full rollout of new LWG rider Enhanced product offerings Increased productivity through investment in technology Significant opportunities in bank and planner channels Continued product innovation Organic growth will be the principal engine of sales growth Multiple product strategy creates cross-sell advantage Deeper penetration in existing channels Asset protection (Longevity Insurance) for advisors who don't sell annuities Short-Term Long-Term |
| Agency Distribution |

| "Not Your Father's Insurance Co. Anymore" Life-only agents Career agency offices Costly operations Age-old product Middle America Retirement savvy advisors Distribution outlets Lean platform Innovative portfolio Face of America Then Now |
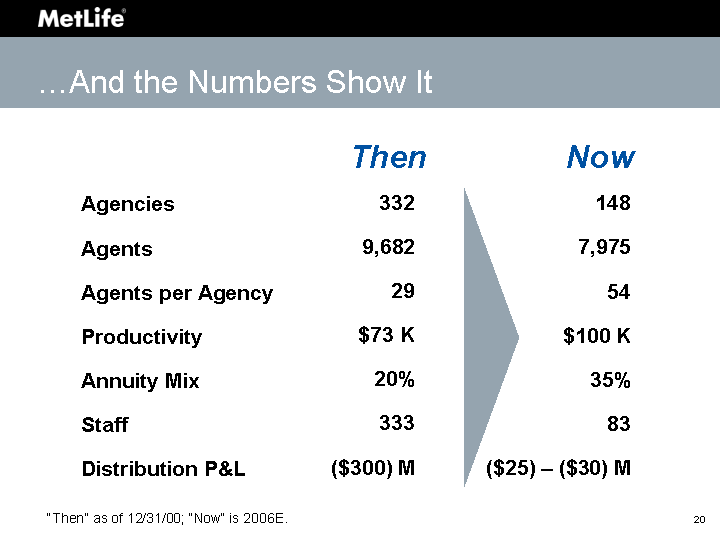
| ....And the Numbers Show It Agencies Agents Agents per Agency Productivity Annuity Mix Staff Distribution P&L 148 7,975 54 $100 K 35% 83 ($25) - ($30) M Then Now 332 9,682 29 $73 K 20% 333 ($300) M "Then" as of 12/31/00; "Now" is 2006E. |

| Annuity Growth Played Key Role in Change Annuity Sales - MetLife and NEF Agents ($ Millions) 7.4% CAGR 3,481 3,928 3,740 3,932 4,620 - 4,660 2002 2003 2004 2005 2006E |
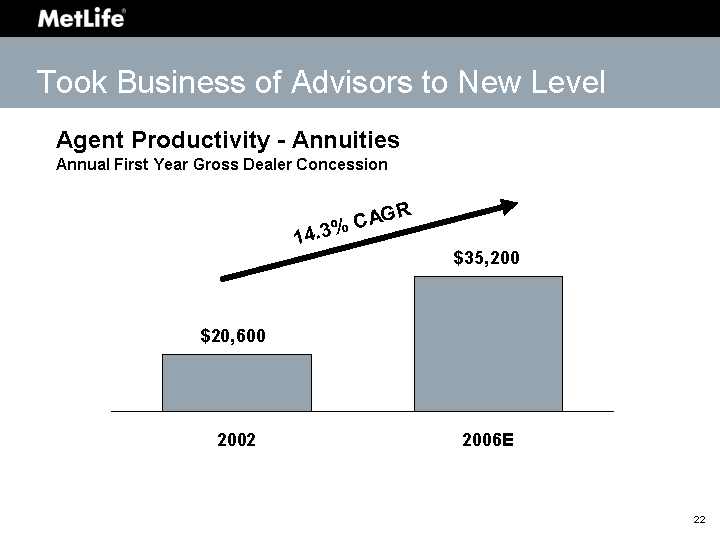
| Took Business of Advisors to New Level 2002 2006E Exp Gap 20600 35200 14.3% CAGR Agent Productivity - Annuities Annual First Year Gross Dealer Concession |
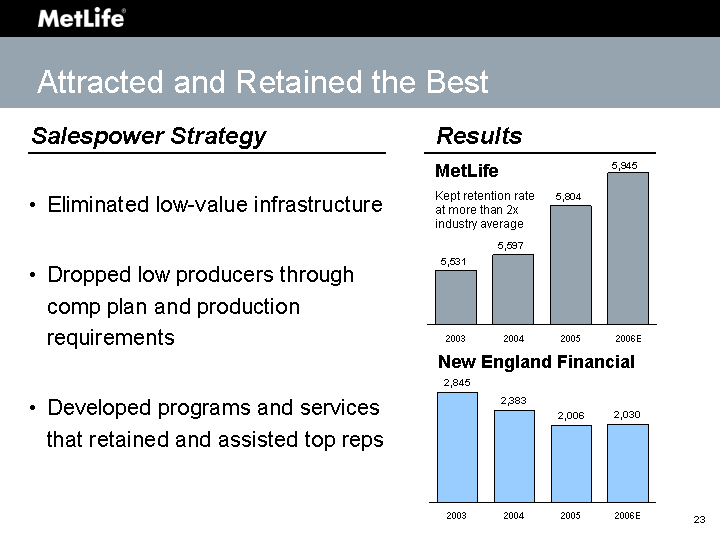
| Attracted and Retained the Best Eliminated low-value infrastructure Dropped low producers through comp plan and production requirements Developed programs and services that retained and assisted top reps Results 2003 2004 2005 2006E MetLife 5531 5597 5804 6000 New England Financial 2845 2383 2006 2030 MetLife New England Financial Kept retention rate at more than 2x industry average Salespower Strategy 5,531 5,597 5,804 5,945 2003 2004 2005 2006E |
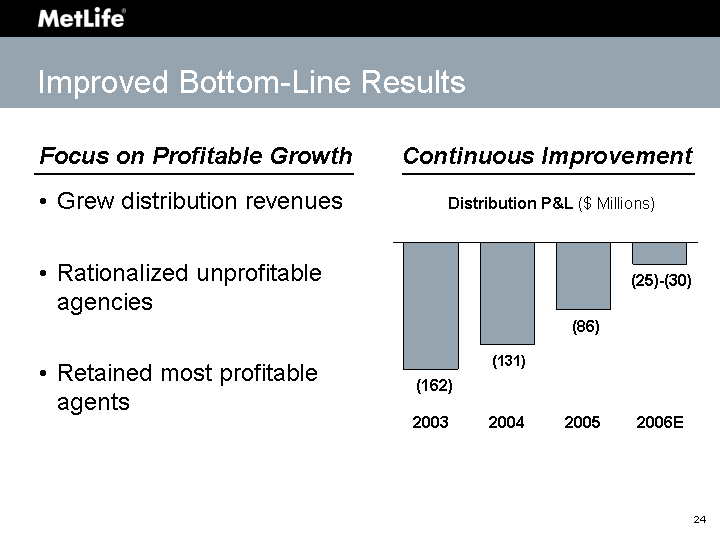
| Grew distribution revenues Rationalized unprofitable agencies Retained most profitable agents Focus on Profitable Growth Continuous Improvement Distribution P&L ($ Millions) Improved Bottom-Line Results (86) (25)-(30) (131) (162) 2003 2004 2005 2006E |
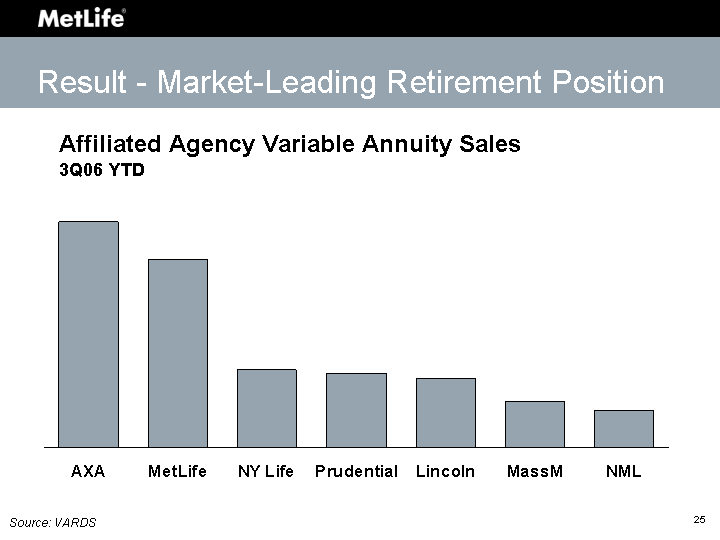
| AXA MetLife NY Life Prudential Lincoln MassM NML Exp Gap 4163 3472 1424 1374 1278 850 685 Affiliated Agency Variable Annuity Sales 3Q06 YTD Source: VARDS Result - Market-Leading Retirement Position |
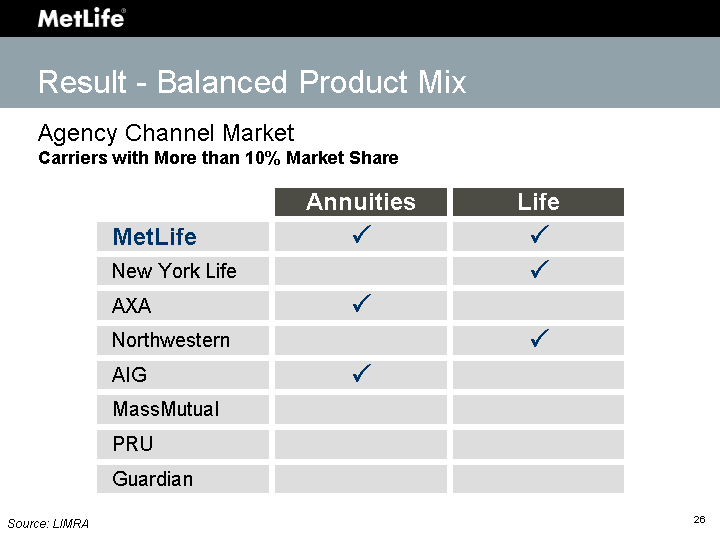
| Result - Balanced Product Mix Source: LIMRA Agency Channel Market Carriers with More than 10% Market Share Carriers with More than 10% Market Share Carriers with More than 10% Market Share |
| Momentum Continues - 2006E Annuity sales up approximately 18% Salespower increasing +220 Agent retention increasing to 24% Per agent productivity up 5% Improved distribution P&L by over $50 million |
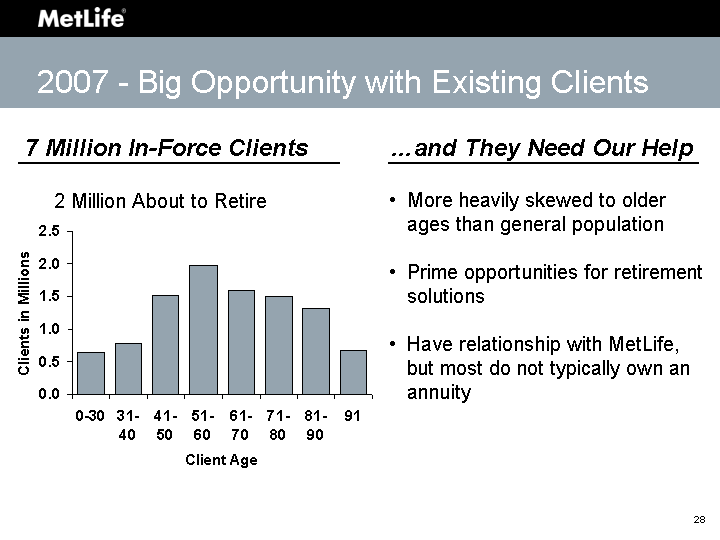
| More heavily skewed to older ages than general population Prime opportunities for retirement solutions Have relationship with MetLife, but most do not typically own an annuity ....and They Need Our Help 0-30 31-40 41-50 51-60 61-70 71-80 81-90 91 Term Conversions 639815 787843 1516201 1970982 1591278 1505813 1322080 667988 2 Million About to Retire 7 Million In-Force Clients 2007 - Big Opportunity with Existing Clients |
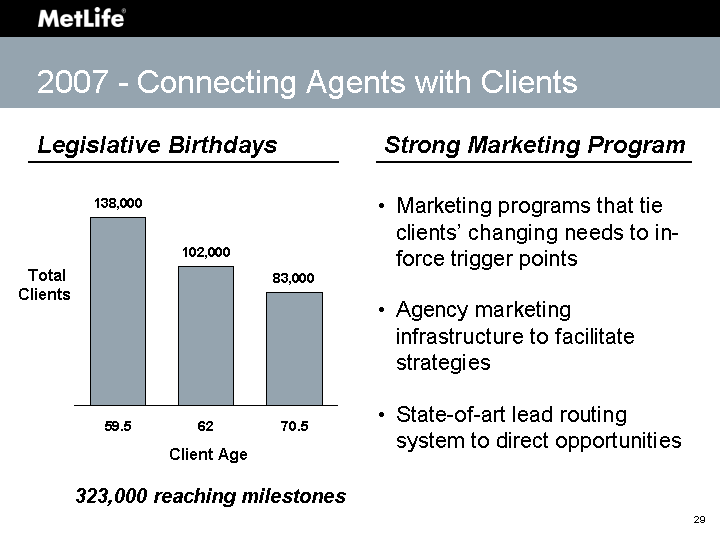
| Marketing programs that tie clients' changing needs to in- force trigger points Agency marketing infrastructure to facilitate strategies State-of-art lead routing system to direct opportunities Strong Marketing Program 59.5 62 70.5 Term Conversions 138000 102000 83000 Legislative Birthdays Client Age Total Clients 2007 - Connecting Agents with Clients 323,000 reaching milestones |
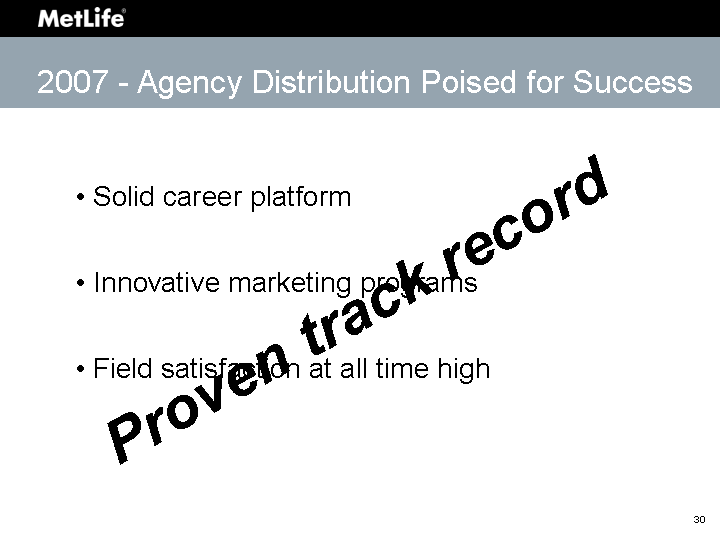
| 2007 - Agency Distribution Poised for Success Solid career platform Innovative marketing programs Field satisfaction at all time high Proven track record |
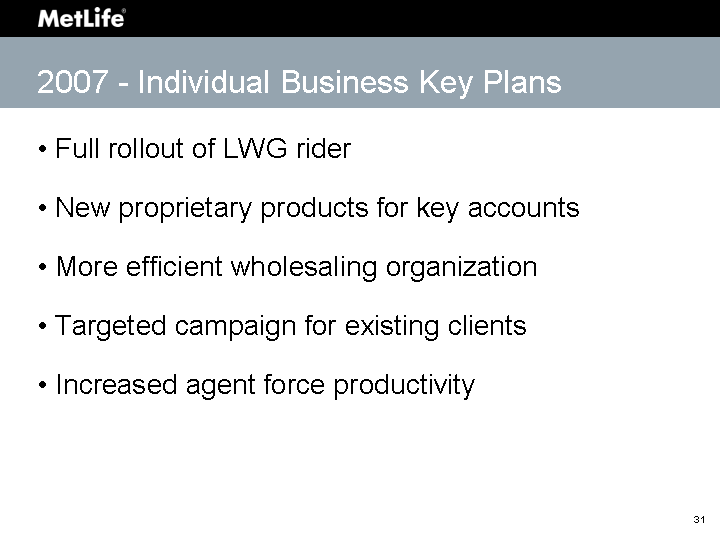
| 2007 - Individual Business Key Plans Full rollout of LWG rider New proprietary products for key accounts More efficient wholesaling organization Targeted campaign for existing clients Increased agent force productivity |
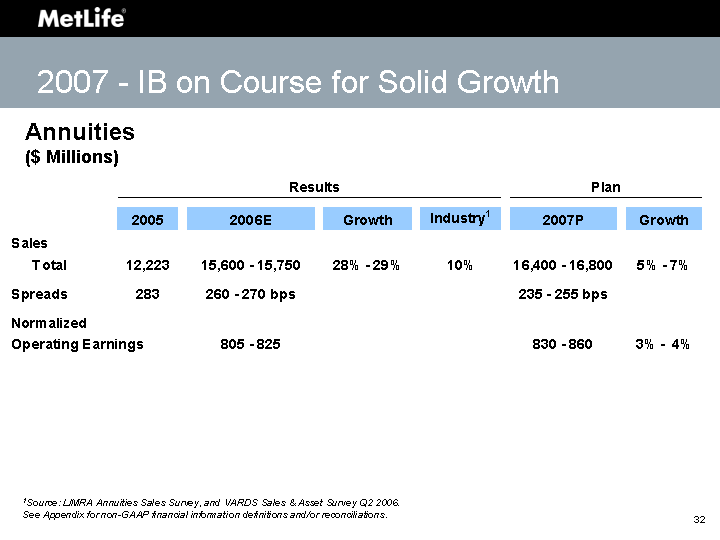
| 1Source: LIMRA Annuities Sales Survey, and VARDS Sales & Asset Survey Q2 2006. See Appendix for non-GAAP financial information definitions and/or reconciliations. 2007 - IB on Course for Solid Growth Annuities ($ Millions) |
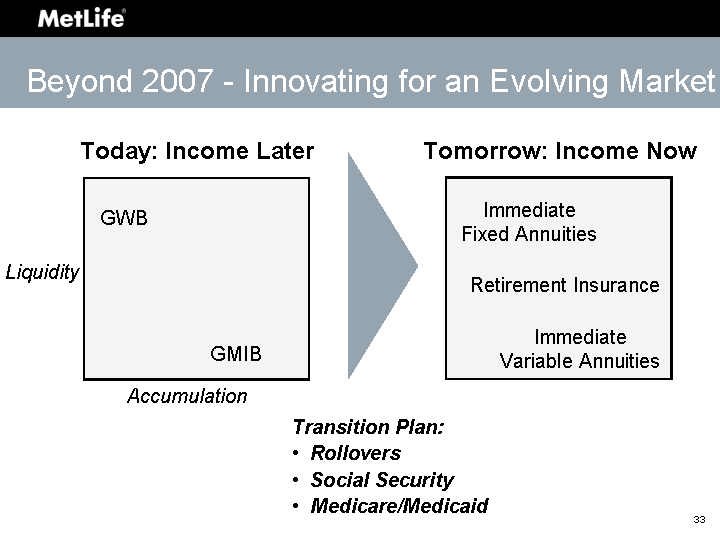
| Beyond 2007 - Innovating for an Evolving Market Tomorrow: Income Now GMIB GWB Immediate Fixed Annuities Immediate Variable Annuities Liquidity Accumulation Retirement Insurance Transition Plan: Rollovers Social Security Medicare/Medicaid Today: Income Later |
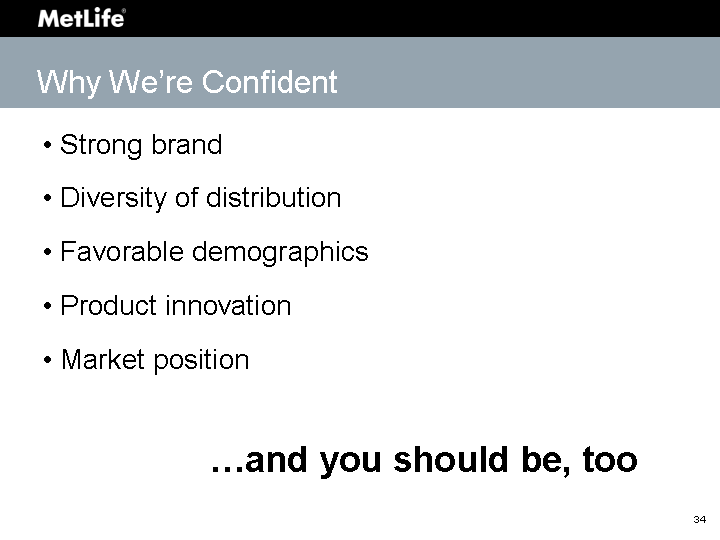
| Why We're Confident Strong brand Diversity of distribution Favorable demographics Product innovation Market position ....and you should be, too |

| investor day 2 0 0 6 Appendix |
| Normalization investor day 2 0 0 6 |
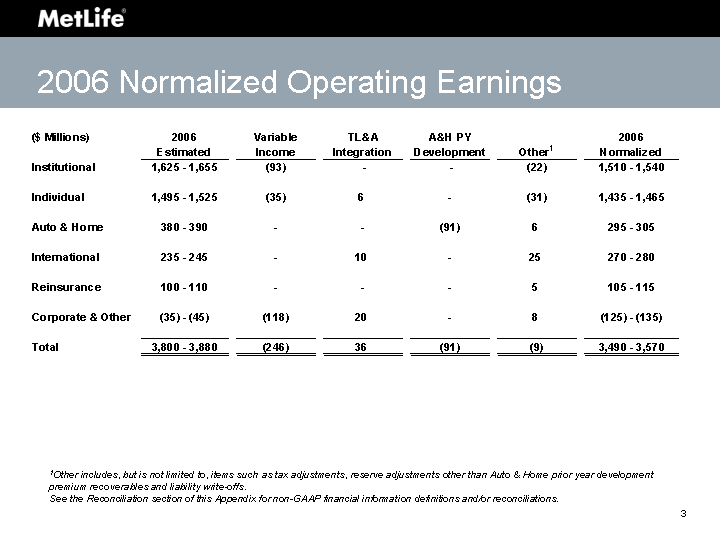
| 2006 Normalized Operating Earnings 1Other includes, but is not limited to, items such as tax adjustments, reserve adjustments other than Auto & Home prior year development premium recoverables and liability write-offs. See the Reconciliation section of this Appendix for non-GAAP financial information definitions and/or reconciliations. |
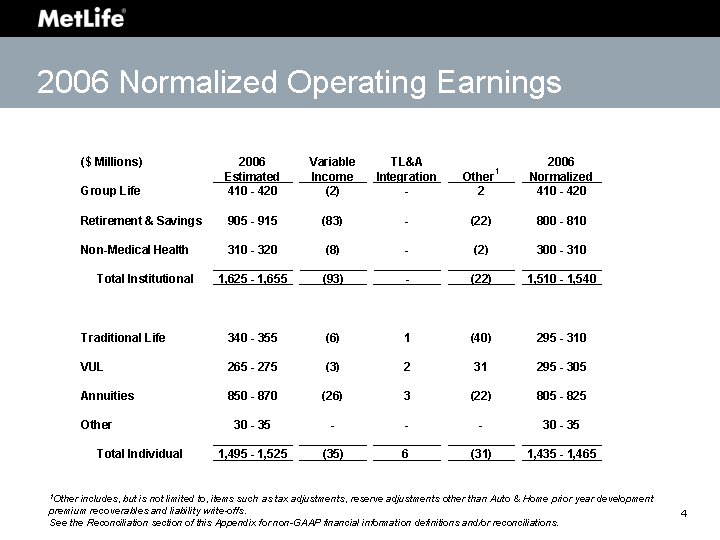
| 2006 Normalized Operating Earnings 1Other includes, but is not limited to, items such as tax adjustments, reserve adjustments other than Auto & Home prior year development premium recoverables and liability write-offs. See the Reconciliation section of this Appendix for non-GAAP financial information definitions and/or reconciliations. |
| Institutional Metrics investor day 2 0 0 6 |
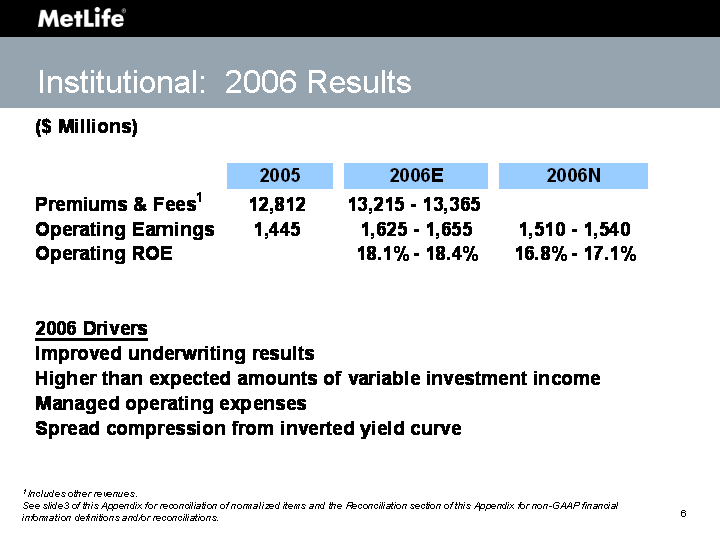
| 1 Includes other revenues. See slide3 of this Appendix for reconciliation of normalized items and the Reconciliation section of this Appendix for non-GAAP financial information definitions and/or reconciliations. Institutional: 2006 Results |
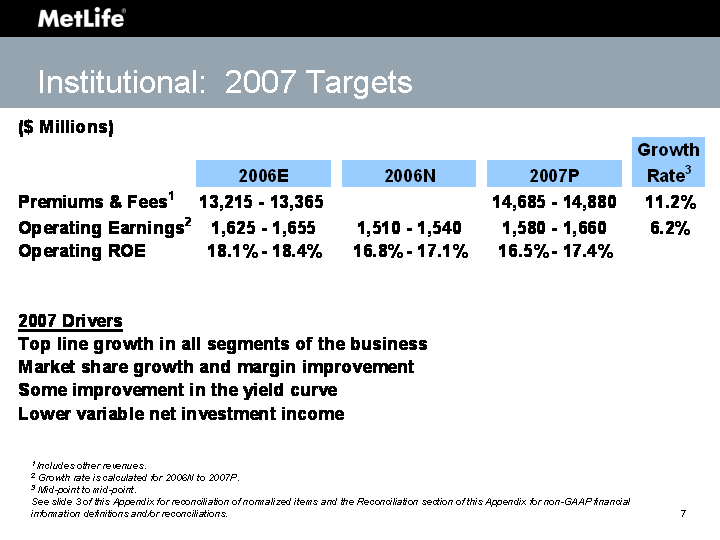
| Institutional: 2007 Targets 1 Includes other revenues. 2 Growth rate is calculated for 2006N to 2007P. 3 Mid-point to mid-point. See slide 3 of this Appendix for reconciliation of normalized items and the Reconciliation section of this Appendix for non-GAAP financial information definitions and/or reconciliations. |
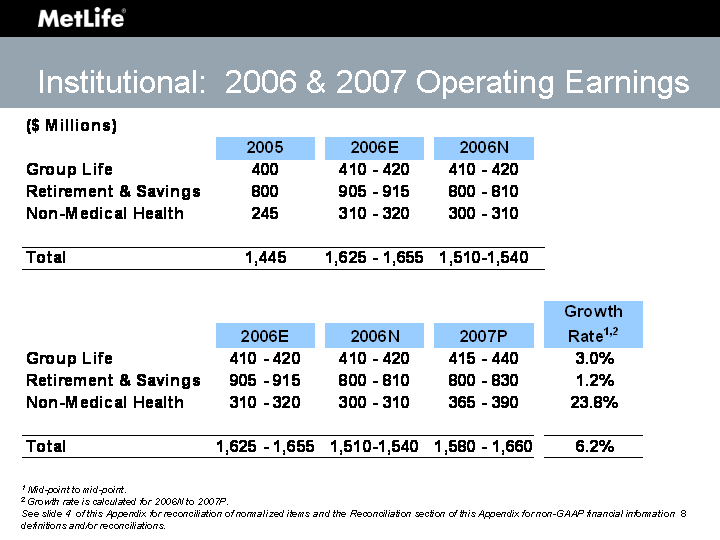
| Institutional: 2006 & 2007 Operating Earnings 1 Mid-point to mid-point. 2 Growth rate is calculated for 2006N to 2007P. See slide 4 of this Appendix for reconciliation of normalized items and the Reconciliation section of this Appendix for non-GAAP financial information definitions and/or reconciliations. |

| Group Life: Key Metrics 1 Includes other revenues. 2 Mid-point to mid-point. 3 Growth rate is calculated for 2006N to 2007P. See slide 4 of this Appendix for reconciliation of normalized items and the Reconciliation section of this Appendix for non-GAAP financial information definitions and/or reconciliations. |
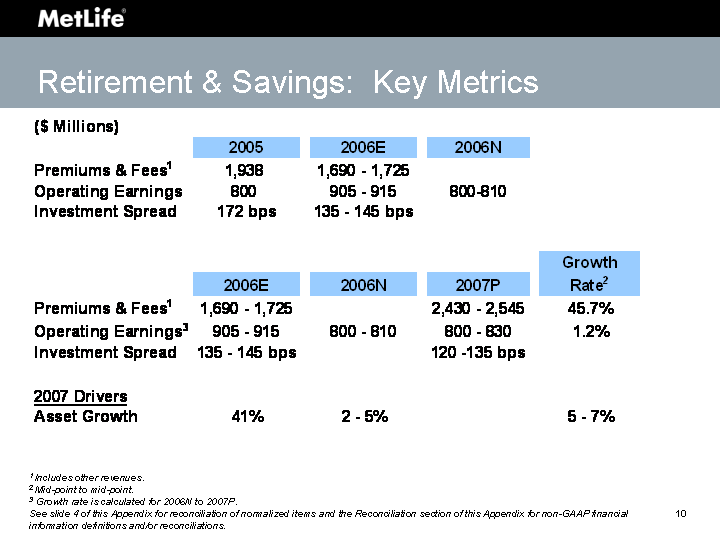
| Retirement & Savings: Key Metrics 1 Includes other revenues. 2 Mid-point to mid-point. 3 Growth rate is calculated for 2006N to 2007P. See slide 4 of this Appendix for reconciliation of normalized items and the Reconciliation section of this Appendix for non-GAAP financial information definitions and/or reconciliations. |
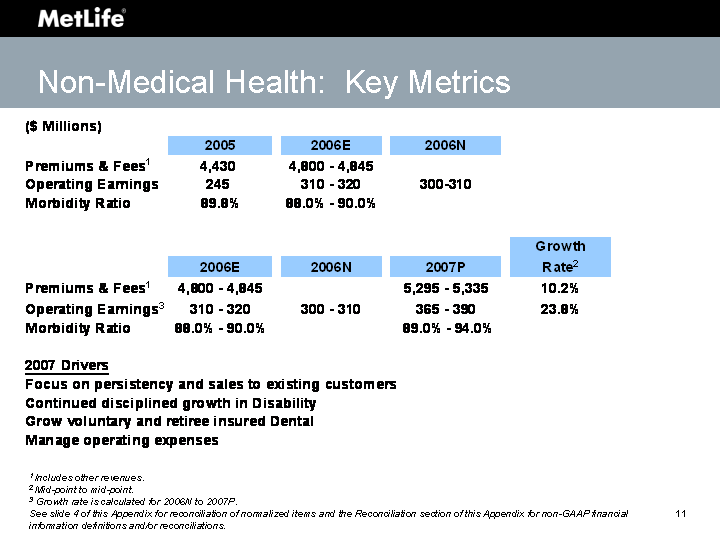
| Non-Medical Health: Key Metrics 1 Includes other revenues. 2 Mid-point to mid-point. 3 Growth rate is calculated for 2006N to 2007P. See slide 4 of this Appendix for reconciliation of normalized items and the Reconciliation section of this Appendix for non-GAAP financial information definitions and/or reconciliations. |
| Individual Metrics investor day 2 0 0 6 |
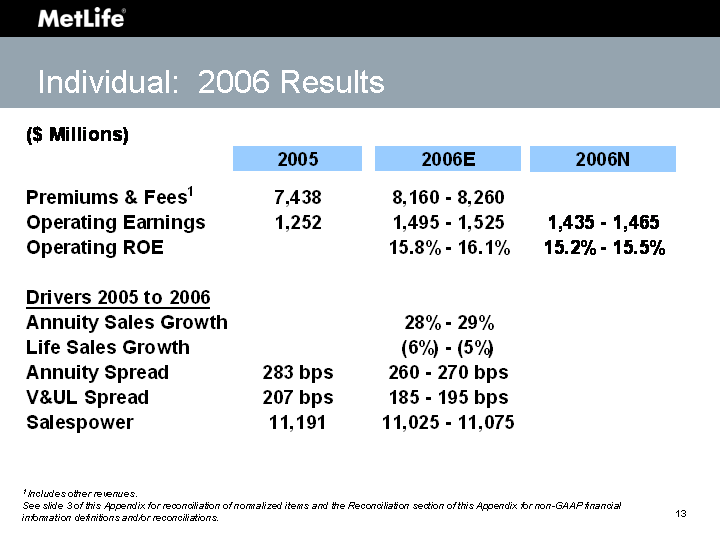
| Individual: 2006 Results 1 Includes other revenues. See slide 3 of this Appendix for reconciliation of normalized items and the Reconciliation section of this Appendix for non-GAAP financial information definitions and/or reconciliations. |
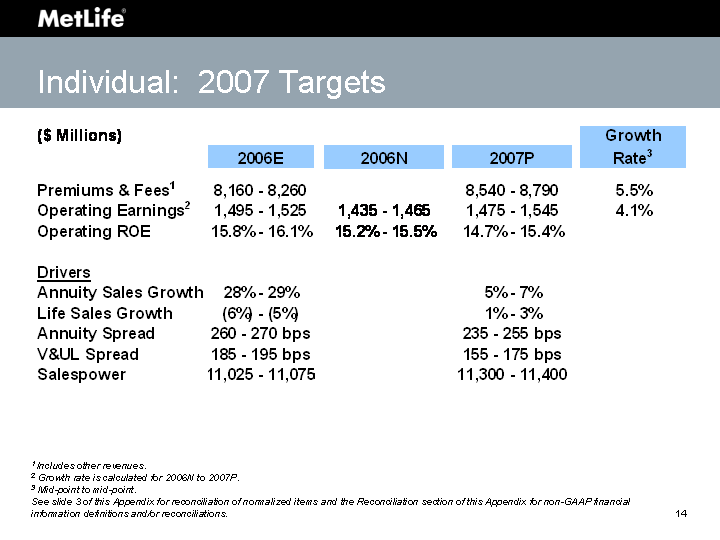
| Individual: 2007 Targets 1 Includes other revenues. 2 Growth rate is calculated for 2006N to 2007P. 3 Mid-point to mid-point. See slide 3 of this Appendix for reconciliation of normalized items and the Reconciliation section of this Appendix for non-GAAP financial information definitions and/or reconciliations. |
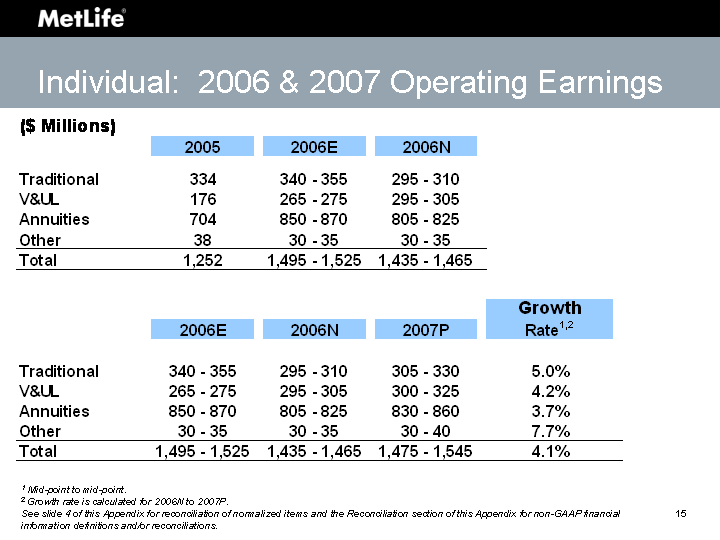
| Individual: 2006 & 2007 Operating Earnings 1 Mid-point to mid-point. 2 Growth rate is calculated for 2006N to 2007P. See slide 4 of this Appendix for reconciliation of normalized items and the Reconciliation section of this Appendix for non-GAAP financial information definitions and/or reconciliations. |
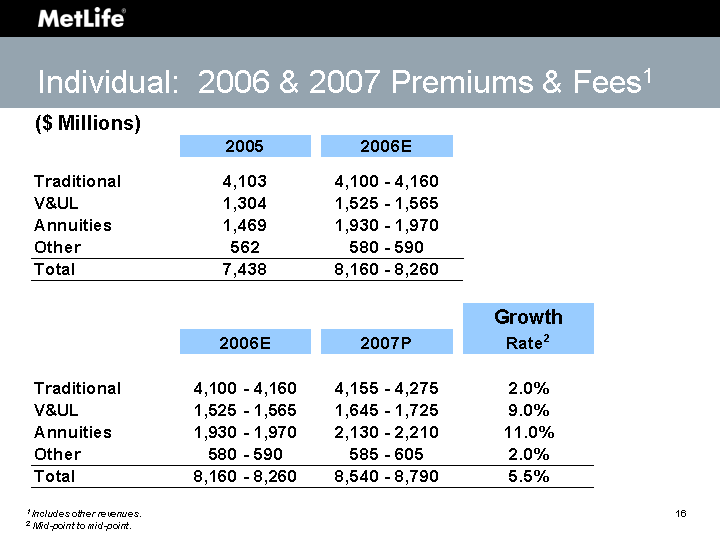
| Individual: 2006 & 2007 Premiums & Fees1 1 Includes other revenues. 2 Mid-point to mid-point. |
| Auto & Home Metrics investor day 2 0 0 6 |
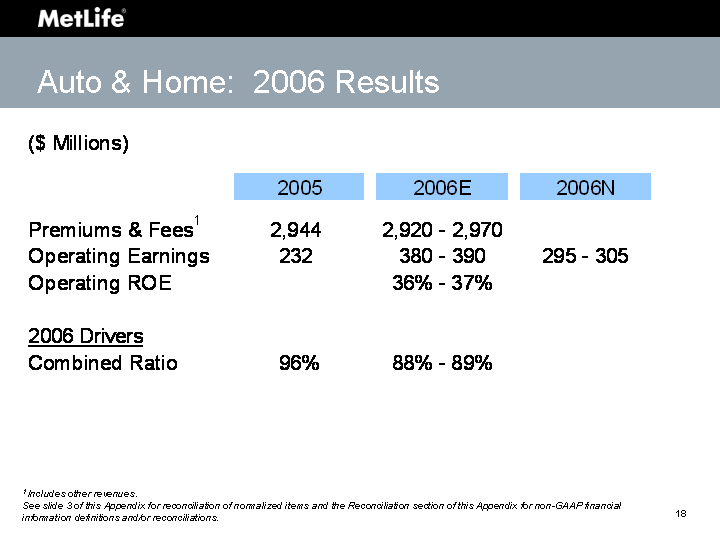
| Auto & Home: 2006 Results 1 Includes other revenues. See slide 3 of this Appendix for reconciliation of normalized items and the Reconciliation section of this Appendix for non-GAAP financial information definitions and/or reconciliations. |
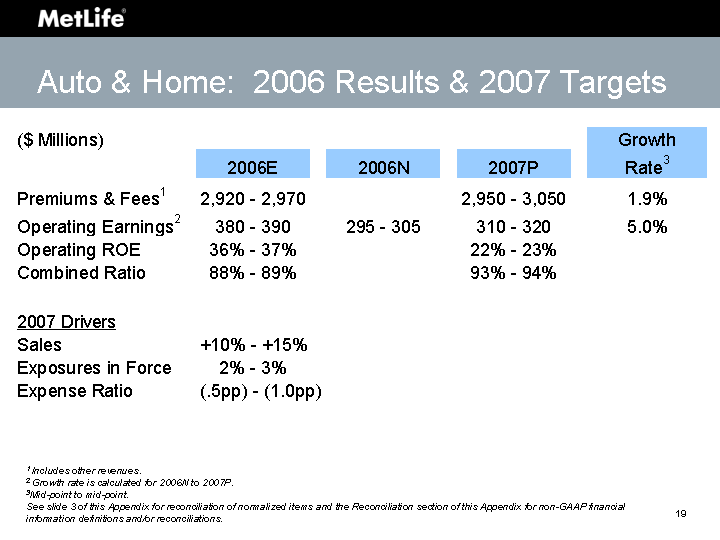
| Auto & Home: 2006 Results & 2007 Targets 1 Includes other revenues. 2 Growth rate is calculated for 2006N to 2007P. 3Mid-point to mid-point. See slide 3 of this Appendix for reconciliation of normalized items and the Reconciliation section of this Appendix for non-GAAP financial information definitions and/or reconciliations. |
| International Metrics investor day 2 0 0 6 |
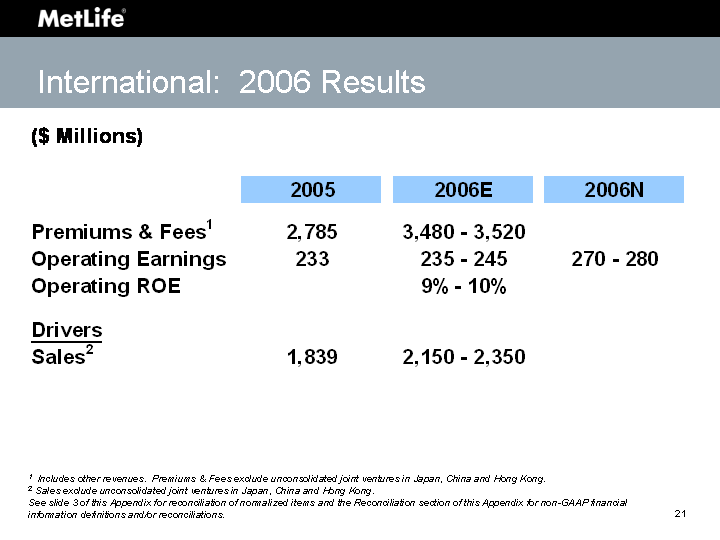
| International: 2006 Results 1 Includes other revenues. Premiums & Fees exclude unconsolidated joint ventures in Japan, China and Hong Kong. 2 Sales exclude unconsolidated joint ventures in Japan, China and Hong Kong. See slide 3 of this Appendix for reconciliation of normalized items and the Reconciliation section of this Appendix for non-GAAP financial information definitions and/or reconciliations. |
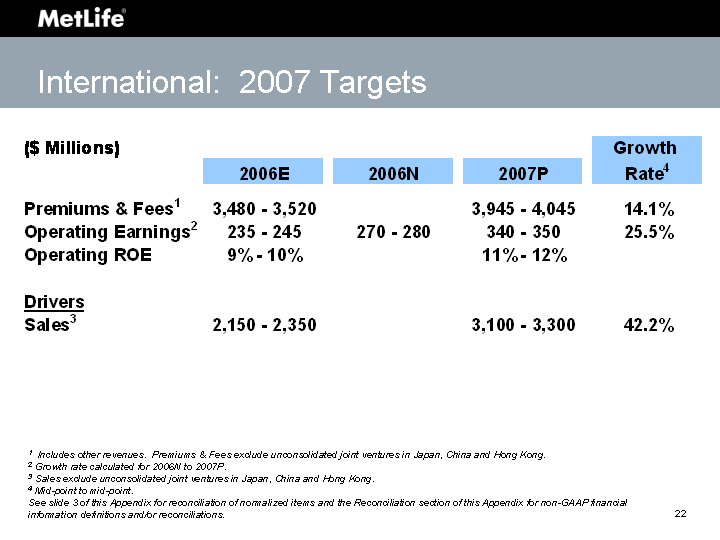
| International: 2007 Targets 1 Includes other revenues. Premiums & Fees exclude unconsolidated joint ventures in Japan, China and Hong Kong. 2 Growth rate calculated for 2006N to 2007P. 3 Sales exclude unconsolidated joint ventures in Japan, China and Hong Kong. 4 Mid-point to mid-point. See slide 3 of this Appendix for reconciliation of normalized items and the Reconciliation section of this Appendix for non-GAAP financial information definitions and/or reconciliations. |
| Reconciliation investor day 2 0 0 6 |
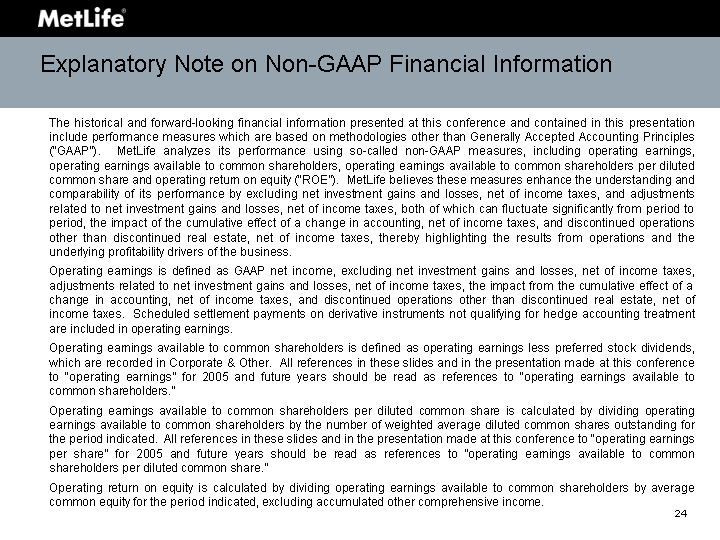
| Explanatory Note on Non-GAAP Financial Information The historical and forward-looking financial information presented at this conference and contained in this presentation include performance measures which are based on methodologies other than Generally Accepted Accounting Principles ("GAAP"). MetLife analyzes its performance using so-called non-GAAP measures, including operating earnings, operating earnings available to common shareholders, operating earnings available to common shareholders per diluted common share and operating return on equity ("ROE"). MetLife believes these measures enhance the understanding and comparability of its performance by excluding net investment gains and losses, net of income taxes, and adjustments related to net investment gains and losses, net of income taxes, both of which can fluctuate significantly from period to period, the impact of the cumulative effect of a change in accounting, net of income taxes, and discontinued operations other than discontinued real estate, net of income taxes, thereby highlighting the results from operations and the underlying profitability drivers of the business. Operating earnings is defined as GAAP net income, excluding net investment gains and losses, net of income taxes, adjustments related to net investment gains and losses, net of income taxes, the impact from the cumulative effect of a change in accounting, net of income taxes, and discontinued operations other than discontinued real estate, net of income taxes. Scheduled settlement payments on derivative instruments not qualifying for hedge accounting treatment are included in operating earnings. Operating earnings available to common shareholders is defined as operating earnings less preferred stock dividends, which are recorded in Corporate & Other. All references in these slides and in the presentation made at this conference to "operating earnings" for 2005 and future years should be read as references to "operating earnings available to common shareholders." Operating earnings available to common shareholders per diluted common share is calculated by dividing operating earnings available to common shareholders by the number of weighted average diluted common shares outstanding for the period indicated. All references in these slides and in the presentation made at this conference to "operating earnings per share" for 2005 and future years should be read as references to "operating earnings available to common shareholders per diluted common share." Operating return on equity is calculated by dividing operating earnings available to common shareholders by average common equity for the period indicated, excluding accumulated other comprehensive income. |
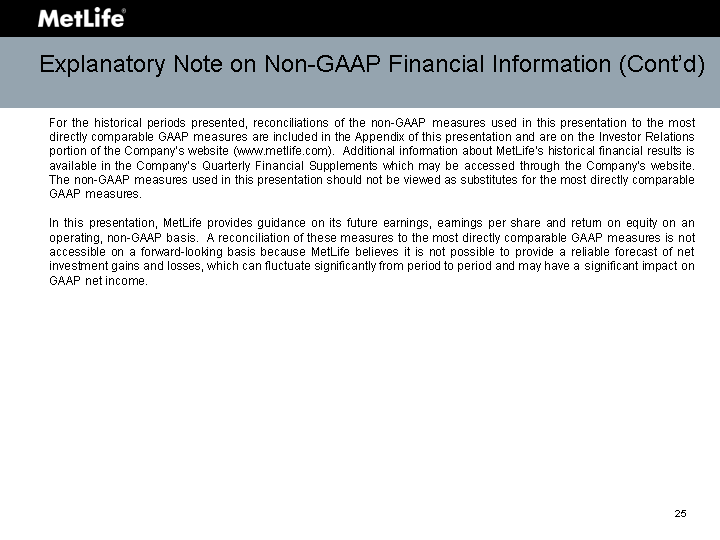
| Explanatory Note on Non-GAAP Financial Information (Cont'd) For the historical periods presented, reconciliations of the non-GAAP measures used in this presentation to the most directly comparable GAAP measures are included in the Appendix of this presentation and are on the Investor Relations portion of the Company's website (www.metlife.com). Additional information about MetLife's historical financial results is available in the Company's Quarterly Financial Supplements which may be accessed through the Company's website. The non-GAAP measures used in this presentation should not be viewed as substitutes for the most directly comparable GAAP measures. In this presentation, MetLife provides guidance on its future earnings, earnings per share and return on equity on an operating, non-GAAP basis. A reconciliation of these measures to the most directly comparable GAAP measures is not accessible on a forward-looking basis because MetLife believes it is not possible to provide a reliable forecast of net investment gains and losses, which can fluctuate significantly from period to period and may have a significant impact on GAAP net income. |
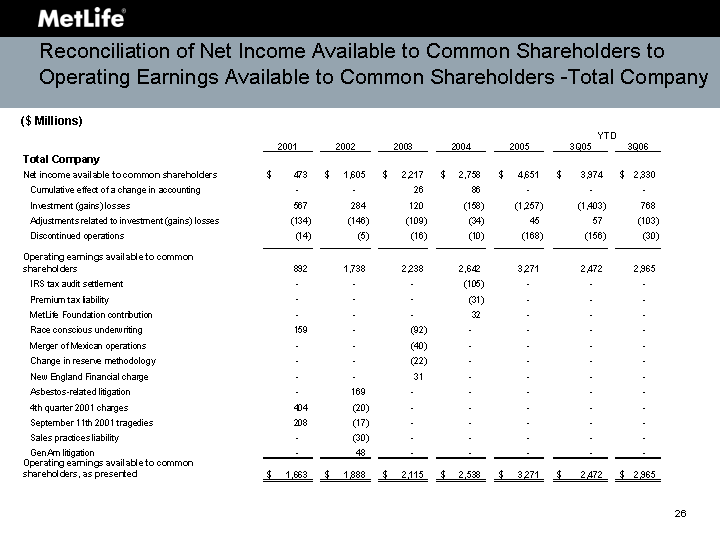
| Reconciliation of Net Income Available to Common Shareholders to Operating Earnings Available to Common Shareholders -Total Company ($ Millions) |
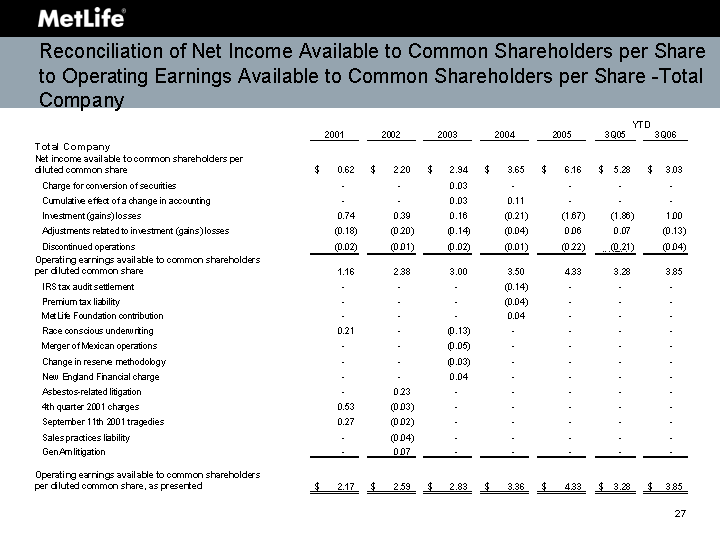
| Reconciliation of Net Income Available to Common Shareholders per Share to Operating Earnings Available to Common Shareholders per Share -Total Company |
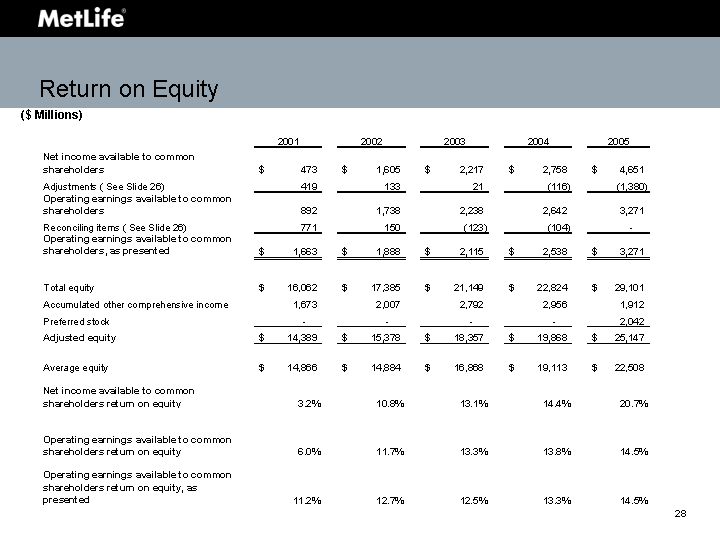
| Return on Equity ($ Millions) |
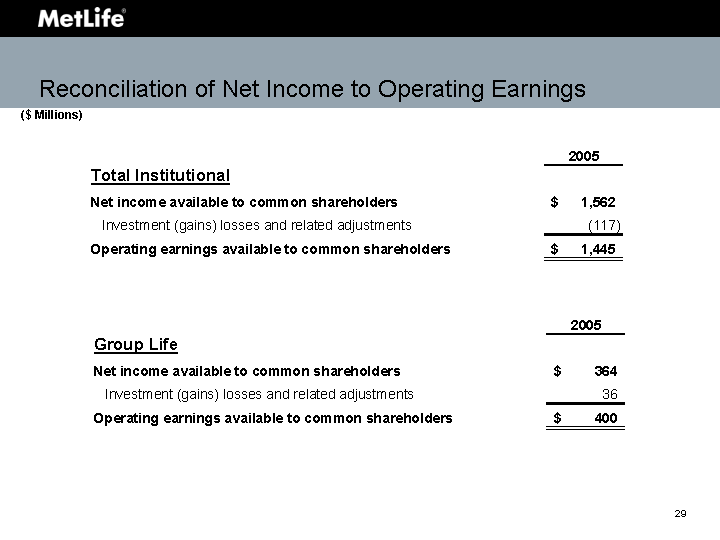
| Reconciliation of Net Income to Operating Earnings ($ Millions) |
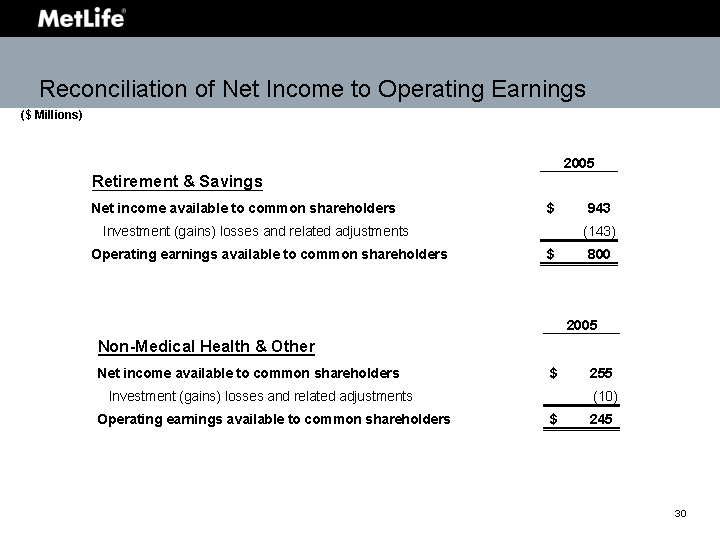
| Reconciliation of Net Income to Operating Earnings ($ Millions) |
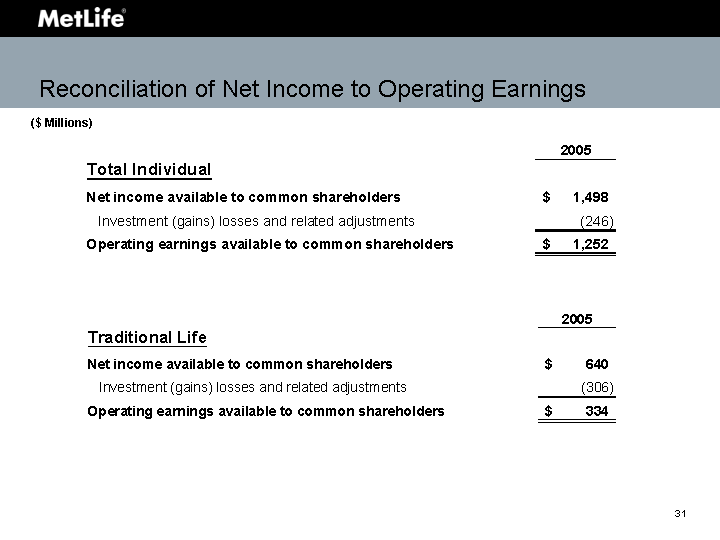
| Reconciliation of Net Income to Operating Earnings ($ Millions) |
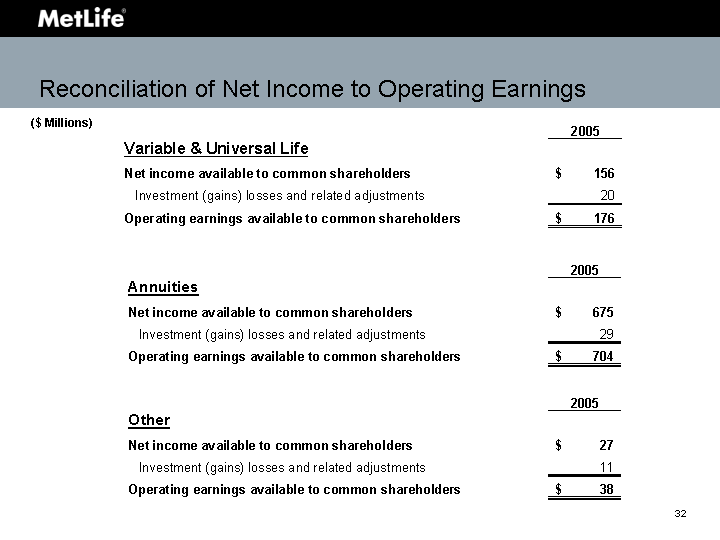
| Reconciliation of Net Income to Operating Earnings ($ Millions) |
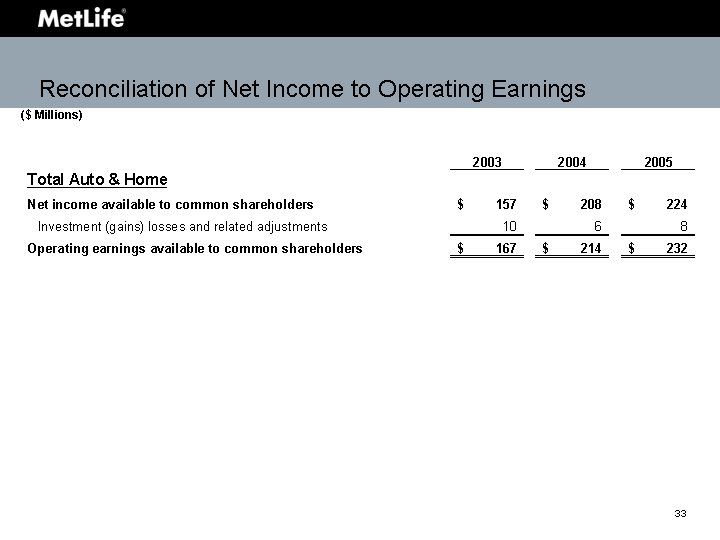
| Reconciliation of Net Income to Operating Earnings ($ Millions) |
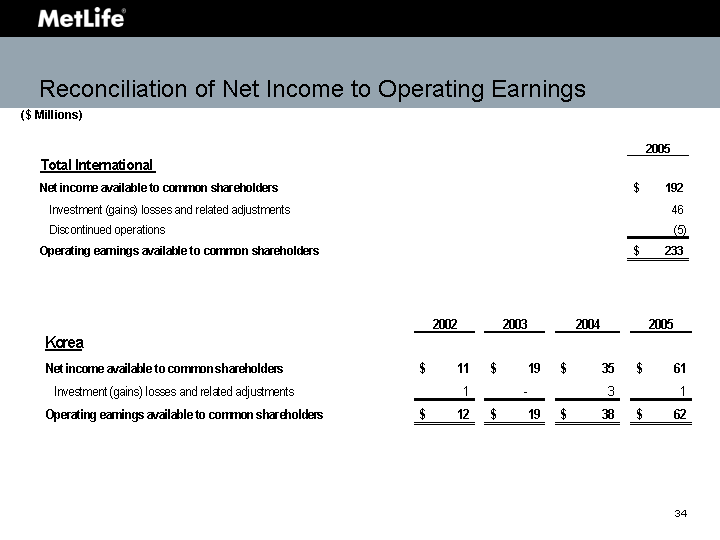
| Reconciliation of Net Income to Operating Earnings ($ Millions) |
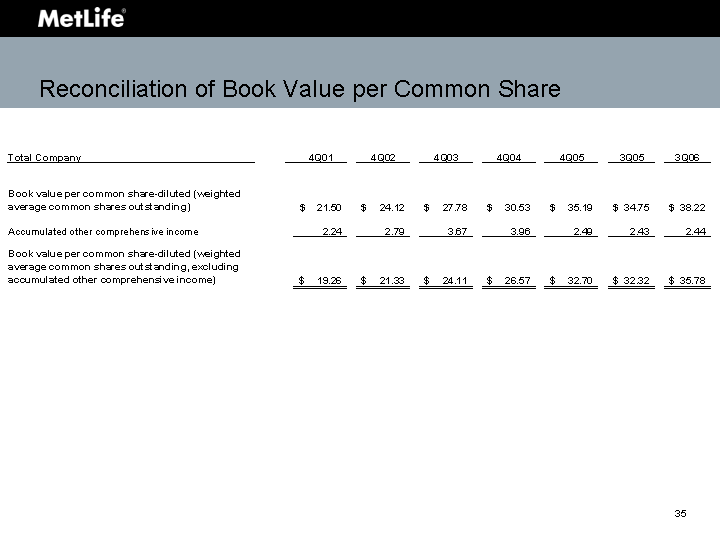
| Reconciliation of Book Value per Common Share |
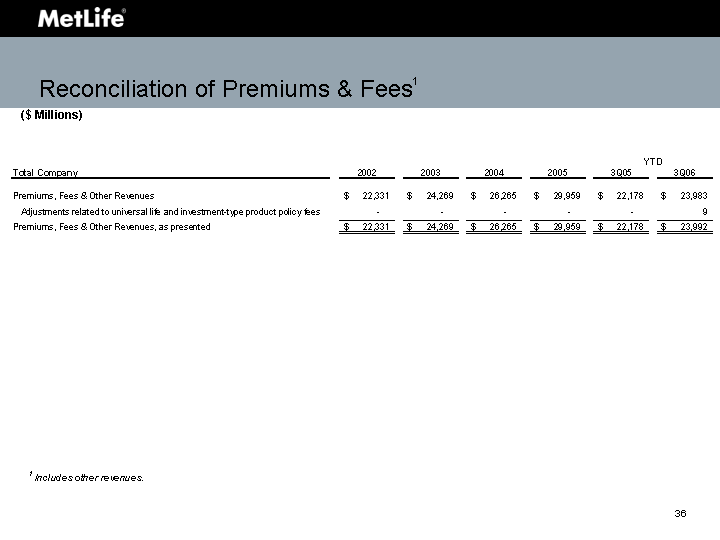
| Reconciliation of Premiums & Fees1 ($ Millions) 1 Includes other revenues. 1 Includes other revenues. |
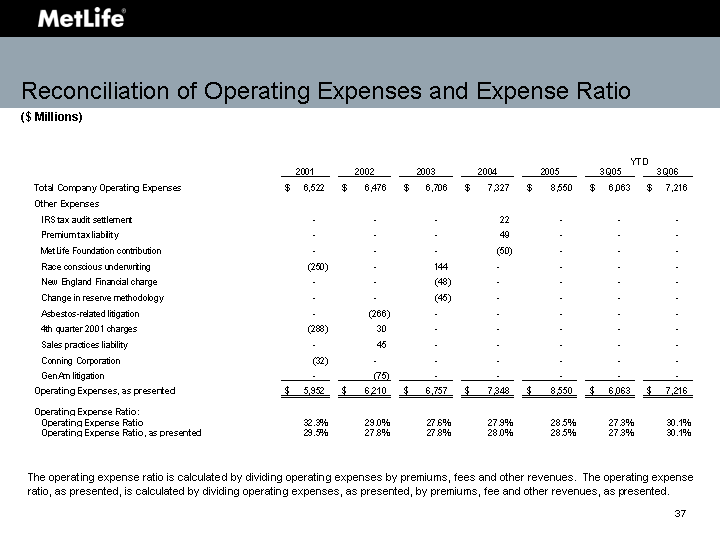
| Reconciliation of Operating Expenses and Expense Ratio ($ Millions) The operating expense ratio is calculated by dividing operating expenses by premiums, fees and other revenues. The operating expense ratio, as presented, is calculated by dividing operating expenses, as presented, by premiums, fee and other revenues, as presented. ratio, as presented, is calculated by dividing operating expenses, as presented, by premiums, fee and other revenues, as presented. ratio, as presented, is calculated by dividing operating expenses, as presented, by premiums, fee and other revenues, as presented. |

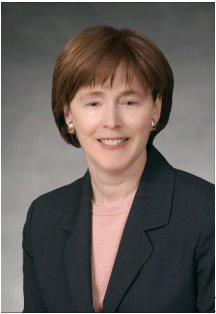
Tracey A. Dedrick
Vice President, Investor Relations
MetLife
Vice President, Investor Relations
MetLife
Tracey A. Dedrick is vice president and head of investor relations for MetLife, Inc. In this role, she manages the company’s relationships with buy-side and sell-side analysts along with institutional and retail investors. She was appointed to this position in June 2004.
Prior to her current position, Tracey was assistant treasurer in charge of the capital and corporate finance department within the corporate treasury department of MetLife. In this role, Tracey was responsible for managing the enterprise’s capital planning, allocation and financing strategy as well as managing rating agency relationships. She was also responsible for maintaining sufficient liquidity to support the continued solvency of the MetLife enterprise and the profitable operation of its core businesses.
Tracey joined MetLife in 2001 from AXA Financial, where she was assistant treasurer. In additional to capital management, at AXA she was responsible for merger & acquisitions analysis and participated in the purchase of Sanford Bernstein, the sale of Donaldson Lufkin & Jenrette and the merger with AXA Group Paris. She has an extensive background in liquidity and interest rate risk management.
Tracey began her career with First Bank Minneapolis in their Treasury group where she acquired extensive experience in all aspects of bank funding and asset liability management. She was the first person in U.S. banking history to receive permission from the Office of the Comptroller of the Currency to trade financial futures.
Tracey received a B.A. from the University of Minnesota and attended the Edwin L. Cox School of Management at Southern Methodist University.

Michael K. Farrell
Executive Vice President, Independent Distribution Group
MetLife
Executive Vice President, Independent Distribution Group
MetLife
Michael K. Farrell is an executive vice president at MetLife and is responsible for the organization’s Independent Distribution Group, which includes the businesses of MetLife Investors (MLI) and the MetLife Broker/Dealer Group, including advanced markets and financial planning. Mike is also responsible for MetLife Resources, MetLife’s business that services the needs of the not-for-profit community. He was promoted to executive vice president in December 2005.
As a result of MetLife’s 2005 acquisitions of Travelers Life & Annuity and CitiStreet Associates, MetLife solidified its leadership position and currently holds the #2 ranking for variable annuities, according to VARDS. The acquisitions also contributed to growth in the Independent Distribution Group, which is designed to grow sales from independent channels with accumulation products such as annuities and protection products, including life and long-term care insurance. MetLife’s increased distribution includes ten year distribution arrangements with companies such as Smith Barney, Primerica and Citibank, Tower Square as a non-affiliated broker/dealer, and the CitiStreet Associates sales force. In 2006, those agreements were renewed, and total selling agreements increased to 700, compared with 500 in 2005.
Mike played an integral role in the leadership team that quickly and seamlessly integrated the new organizations within the MetLife family. To support this expanded distribution, Mike restructured the leadership team to support all distribution channels including key broker/dealer and financial institution relationships, wholesalers and representatives.
Mike has more than 30 years of experience in the financial services industry. Prior to joining MetLife in May 2001, he was president of Michael K. Farrell Associates, Inc. Founded in 1990, the firm specialized in corporate qualified retirement plans and retirement plans for not-for-profit organizations. At the time of its sale to ING in 2001, the firm had over 1,500 clients.
Over the span of his career, Mike has held the positions of president, Mutual Benefit Pension Corporation and senior vice president, sales and marketing for Mutual Benefit Life Insurance Company. He served as national sales director for ReliaStar Retirement Plans and as a member of the ReliaStar Enterprise Council. Mike is a past member of the board of directors of Employee Benefit Plans, Inc., a former vice president of Mutual Benefit Investment Advisory Corporation and a former director of Essex Corporation.
Mike is active in community affairs and served as president of St. Vincent’s Home and School Association; a trustee of Integrity House Drug Abuse Center; president of the Delbarton Football Boosters Club; and director of the Fordham Gridiron Club. In 2005, he was named New Jersey’s Irishman of the Year. In 1996, Mike was named Tourette Syndrome Association Business Person of the Year. He is also a committee member of the Boys and Girls Club of Newark.
He received a B.A. from Fairleigh Dickenson University and attended the Columbia University School of Management.
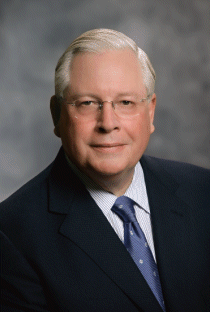
C. Robert (Rob) Henrikson
Chairman, President & Chief Executive Officer
MetLife, Inc.
Chairman, President & Chief Executive Officer
MetLife, Inc.
C. Robert (Rob) Henrikson is chairman of the board of directors, president and chief executive officer of MetLife, Inc.
Prior to his appointment as CEO on March 1, 2006, Rob had overseen the company’s domestic and international revenue-generating businesses as president and chief operating officer. He implemented an aggressive growth strategy that included double-digit organic growth, the divestiture of non-core businesses, and an M&A strategy, which resulted in market leadership in all of MetLife’s core product lines.
Rob started his career at MetLife in sales, first selling retail policies to individuals and, ultimately, multi-million dollar insurance and investment contracts to the employee benefits plans of the largest U.S. companies. He leveraged his intimate knowledge of customer needs and developed new product design and market opportunities. In 1993, he was selected to head the company’s pension business. Three years later, he was named president of MetLife’s Institutional Business, bringing under common leadership the company’s employee benefits businesses. Under his leadership, Institutional Business grew faster than the market, more than doubling revenues and significantly increasing customer satisfaction, retention, market share, and return on capital. Today, MetLife holds the #1 market position in 12 group product categories.
In 2002, Rob was named president of the then-U.S. Insurance and Financial Services businesses, which moved MetLife’s Institutional Business and its domestic retail franchises under common leadership, enabling the company to leverage the competencies of these major business lines. MetLife’s Individual Business has the industry’s most diverse distribution system with career agency, general agency and independent advisors, as well as distribution through banks and broker-dealers.
Under Rob’s leadership, Individual Business developed new distribution profitability models and has realized operational efficiencies through the development of common platforms for product manufacturing, pricing, underwriting and marketing. These organizational changes strengthened the company’s integration capabilities, which were demonstrated during the quick and seamless integration of the 2005 acquisition of Travelers Life & Annuity. They also enhanced the company’s ability to leverage its domestic business capabilities for the benefit of its international growth.
An industry thought leader, Rob is regularly called upon to testify before and advise members of Congress, particularly on retirement-related issues. He is frequently quoted in the press about retirement and insurance issues and trends.
Rob is a board member of the American Council of Life Insurers and a board member emeritus of the American Benefits Council. In his capacity as CEO, he also represents MetLife as a member of the Financial Services Forum. He serves on the National Board of Advisors at the Morehouse School of Medicine and the board of directors of The New York Botanical Garden, and is a trustee of the American Museum of Natural History.
Rob received a B.A. from the University of Pennsylvania, where he was a featured speaker this year at Wharton’s 125th anniversary celebration, and a J.D. from Emory University School of Law, where he has been honored as distinguished alumnus.

Steven A. Kandarian
Executive Vice President & Chief Investment Officer
MetLife, Inc.
Executive Vice President & Chief Investment Officer
MetLife, Inc.
Steven A. Kandarian is executive vice president and chief investment officer of MetLife, Inc. He joined the company in April 2005.
As CIO, Steve is responsible for MetLife’s investment department and the company’s more than $325 billion general account portfolio.
Since joining MetLife, Steve has overseen a number of initiatives and strategies that have benefited and further diversified MetLife’s investment portfolio, enhanced the company’s focus on effective risk management and contributed to MetLife’s bottom line. In addition to expanding investments into several new asset classes and global markets, MetLife has recently completed transactions and formed relationships with a number of organizations, including Farmer Mac and the Federal Home Loan Bank of New York. At the same time, under Steve’s leadership, MetLife has diversified its real estate equity portfolio in part through the late 2006 sale of Peter Cooper Village/Stuyvesant Town and has also grown the company’s debt and equity investments in timber.
Prior to joining MetLife, Steve was the executive director of the Pension Benefit Guaranty Corporation (PBGC) from 2001 to 2004. He made the public case for comprehensive reform of the pension funding rules to put the defined benefit system and the PBGC on a sound financial footing. In addition, under Steve’s leadership, the PBGC adopted a new investment policy ensuring that, going forward, its assets be structured to better match liability durations, which was critically important to the mission of the PBGC. As executive director, he reported to a board comprised of the secretaries of treasury, commerce and labor, and was responsible for operations that involved assets of over $35 billion and benefit obligations to some 934,000 workers and retirees in more than 3,200 pension plans.
Before joining the PBGC, Steve was founder and managing partner of Orion Partners, LP, where he managed a private equity fund specializing in venture capital and corporate acquisitions for eight years. From 1990 to 1993, he served as president and founder of Eagle Capital Holdings, where he formed a private merchant bank to sponsor equity investments in small and mid-sized businesses. Prior to establishing Eagle Capital Holdings, from 1984 to 1990, he was managing director of Lee Capital Holdings, a private equity firm based in Boston.
Previously, he held several corporate merger and acquisition and leveraged buyout positions at State Street Bank and Trust and LCB Holdings, Inc. Prior to joining LCB, Steve was an investment banker with Houston-based Rotan Mosle, Inc., where he had responsibility for a broad range of projects, including: initial public offerings, mergers and acquisitions, private placements and fairness opinions. Steve previously served as a member of the board of trustees for MassMutual Corporate Investors, MassMutual Participation Investors and MassMutual Premier Funds.
Steve received a B.A. from Clark University, a J.D. from Georgetown University Law Center, and a M.B.A. from Harvard Business School.

Todd B. Katz
Senior Vice President, Institutional Business
MetLife
Senior Vice President, Institutional Business
MetLife
Todd B. Katz is a senior vice president in MetLife’s Institutional Business segment and responsible for MetLife’s group life, dental and disability businesses. An industry leader in each of these businesses, MetLife provides coverage to more than 55,000 employers with over $11 billion in 2005 premiums, fees and other revenues. He was appointed to this position in September 2005.
As senior vice president, Todd oversees the management of these group businesses, including all product design and development, sales support, claims operations and overall profit and loss. The products represent the core of MetLife’s group insurance portfolio. Since 2000, MetLife has expanded its industry-leading market share in these businesses, grown revenue faster than the market and expanded margins. At the same time, the company has provided its group customers and their employees with valuable protection solutions critical to their employee benefits needs.
Prior to being promoted to senior vice president in December 2005 and assuming his current role, Todd had been the head of MetLife’s group disability business since 2003. Under his leadership, the disability business experienced double-digit growth and significant operational improvements. In 2000, he was promoted to vice president and served as the head of MetLife’s group dental business until 2003. During this time, the company’s network of preferred providers expanded from 50,000 to 70,000 dentist locations. In addition, MetLife’s industry-leading dental functionality was introduced on the company’s MyBenefits and metdental.com platforms, which improved customer service for both plan participants and dentists.
Todd started his career as a group sales trainee in New York City in 1989. While in group sales, he sold medical, dental, life and disability products to clients with between 200 and 25,000 employees, with a focus on employers with more than 3,000 employees. He advanced through the sales ranks in the early nineties and was promoted to regional sales director in 1998, running new customer sales in New York from 1998 to 2000. During his sales career he was recognized as MetLife’s #1 institutional sales leader in 1997 and 1998.
Todd received a B.A. from Brandeis University.

Leland C. Launer, Jr.
President, Institutional Business
MetLife, Inc.
President, Institutional Business
MetLife, Inc.
Leland C. Launer, Jr. is president of Institutional Business for MetLife, Inc. He was appointed to this position in March 2005.
As president, Lee oversees MetLife’s Institutional Business segment, which provides group life, disability, dental, long-term care, auto & home and critical illness insurance to group customers in the United States. Institutional Business provides coverage to 88 of the top one hundred FORTUNE 500® companies, and offers a broad range of benefit solutions, particularly in the area of retirement and savings products. Today, MetLife is the number one provider of many group insurance and benefit offerings, including group life, group long-term care, group auto & home and institutional annuities.
Under Lee’s leadership, Institutional Business achieved record operating earnings in 2005 due to continued business growth and record sales in many of the product lines. At the same time, the business was completing and fully integrating the 2005 acquisition of Travelers Life & Annuity. Since becoming president, Lee has increased the segment’s focus on service and reorganized the product groups to better align with MetLife clients. Lee also consolidated the company’s sales forces by market and focused on investments in growth opportunities.
Lee began his career in MetLife’s investment department in Southern California where his responsibilities included making loans to large companies headquartered on the west coast. During the next 20 years, Lee headed every major unit within the investment department, including the portfolio management group, fixed income investments and its real estate division.
In 2003, Lee became MetLife’s chief investment officer and was responsible for the company’s then-$240 billion investment portfolio. Under Lee’s direction, MetLife diversified its sources of investment earnings and upgraded its risk management system.
Prior to serving as chief investment officer, Lee has held other senior leadership positions at MetLife. In 1999, he worked in the Individual Business segment, where he was responsible for several key strategic initiatives including the integration of New England Financial and the General American companies. In 2000, he became the treasurer of MetLife and a key member of the company’s financial organization. Lee was instrumental in creating MetLife’s post-IPO borrowing facilities and made significant improvements in the company’s capital management initiatives.
Lee currently serves as chairman of the board of directors of Reinsurance Group of America, Inc. and also serves on the board of directors of MetLife Bank.
He received a B.S. from the University of Redlands and a M.B.A. from the University of Southern California.

James Lipscomb
Executive Vice President & General Counsel
MetLife, Inc.
Executive Vice President & General Counsel
MetLife, Inc.
James Lipscomb is executive vice president and general counsel of MetLife, Inc. He was named to this position in July 2003.
James oversees the company’s legal affairs group with responsibility for the global operation of the MetLife law department, government and industry relations department and the corporate secretary’s office. He also provides advice to the board of directors and management on corporate governance and business operations.
From 2001 to 2003, James served as senior vice president and deputy general counsel. Prior to this role, he was president and chief executive officer of Conning Corporation, a former MetLife subsidiary, and oversaw its asset management portfolio, private equity group, real estate loan origination and servicing platform, equity broker dealer and insurance industry research group. In addition, James led MetLife’s corporate planning and strategy department from 1998 to 2000. He also served as a senior vice president in MetLife’s real estate investments department, where he was in charge of MetLife’s commercial mortgage loan portfolio. James first joined MetLife in 1972 as an attorney.
Throughout his career, James has held leadership positions in various local, state and national legal organizations, including the American College of Real Estate Lawyers and the State Bar of California. James currently serves as treasurer and a member of the Executive Committee of the Association of the Bar of the City of New York. He has spoken widely on many legal forums and has been published on many topics, including the publication of “Structuring Complex Real Estate Transactions” (John Wiley 1988, Supp. 1993).
His civic affiliations include serving as a vice chair of the Citizens Budget Commission of New York, director of the Life Insurance Council of New York, trustee of the Practising Law Institute, director of Graffiti Ministries, Inc. and a member of the Center of Hope (Haiti), Inc. Advisory Board. James also serves as a member of the board of directors of several MetLife subsidiaries — General American Life Insurance Company, Metropolitan Life Property and Liability Company and MetLife Foundation.
James received a B.A. from Howard University, a J.D. from Columbia University Law School and a L.L.M. (Corporations) from New York University. He is a member of the state bar in New York and California and the federal bar in the Northern District of California, the Southern District of New York and the Second Circuit.
James was named toInside CounselMagazine’s 2006 list of the top 50 most influential in-house counsel in North America and was recognized especially for diversity initiatives.

Ichiro Miyake
President & Chief Executive Officer
Mitsui Sumitomo MetLife Insurance Co., Ltd.
President & Chief Executive Officer
Mitsui Sumitomo MetLife Insurance Co., Ltd.
Ichiro Miyake is president and chief executive officer of Mitsui Sumitomo MetLife Insurance Co., Ltd., a joint venture between Mitsui Sumitomo Insurance Company, Ltd. and MetLife. Ichiro was appointed to this position in October 2004.
Since the joint venture (which was acquired as part of MetLife’s acquisition of Travelers Life & Annuity and certain CitiInsurance businesses) began in October 2002, Mitsui Sumitomo MetLife has achieved increasingly larger sales. In addition to business growth, the organization has also experienced rapid growth in the number of employees. As president & CEO, Ichiro oversaw the creation of a compliance department in order to meet important regulatory requirements. In addition, he initiated the introduction of the Guaranteed Minimum Withdrawal Benefit (GMWB) annuity product offering in Japan, which was the joint venture’s first jointly-developed product with MetLife. At the same time, Ichiro has led initiatives that have focused on organization/team building, product development, distribution development and FSA (Japanese regulator) inspection.
Prior to his current role, Ichiro was the managing director and head of GRB Financial Institutions Group for Citibank, N.A. in Japan.
He began his career in 1979 at Shimizu Corporation, the largest Japanese construction/property developer in Tokyo. While at Shimizu, he moved to Cairo, Egypt as project manager and built strong customer relationships. He also served as chief representative in Paris, France in 1987 and worked for the company’s start-up of Shimizu France S.A. His endeavors there included expanding commercial property developments and office interior renovations. The business achieved profitability three years after the company was established.
In 1990, he joined Citibank N.A. and was responsible for the company’s mergers and acquisitions business in New York for almost two years. In 1992, Ichiro returned to Japan as vice president and relationship manager in Citibank’s global relationship banking group. Six years later, he was appointed vice president, global relationship banking group, global insurance industry Japan head in 1998 and became director, global relationship banking group, global financial institutions Japan head in 2000. In 2003, he was named Citigroup/Citibank Japan managing director.
An industry leader, Ichiro is frequently quoted in the Japanese press about retirement and insurance issues and trends.
Ichiro received a law degree from Hitotsubashi University in Tokyo Japan and a M.B.A. from INSEAD in Fonteinbleau, France.

William J. Mullaney
President
MetLife Auto & Home
President
MetLife Auto & Home
William J. Mullaney is the president of MetLife Auto & Home, MetLife’s $3 billion personal lines property & casualty subsidiary that insures nearly 4 million autos and homes nationwide. He was appointed to this position in January 2005.
In this role, Bill oversees the company’s operations, including the development and distribution of all of MetLife’s property and casualty products — auto, home, condominium, boat and personal excess liability insurance. The company distributes its products through multiple distribution channels, including independent agents, MetLife financial services representatives, property & casualty specialists, direct-to-consumer and through the workplace, where MetLife Auto & Home is the number one provider of employer-sponsored group programs with more than $1 billion in premium.
For the past two years, MetLife Auto & Home has delivered record operating earnings despite some of the worst hurricane seasons in U.S. history. The company distinguished itself for its quick and compassionate response to customers affected by these natural disasters. MetLife Auto & Home continues to take the industry lead with new and innovative products and features, including GrandProtect and identity theft solutions.
Prior to assuming the position of president, Bill served, from 2002 through 2004, as senior vice president for claims and customer service at MetLife Auto & Home, where he oversaw claims, business operations and services, and customer retention initiatives as well as the project management office.
From 1998 to 2002, Bill was responsible for MetLife’s voluntary benefits business, which delivers financial products and services to employees at the workplace. In this role, he was responsible for creating and managing the sales, marketing and service platform for MetLife’s voluntary products, including group life, group auto & home and group long-term care insurance, as well as products offered by MetLife’s Hyatt Legal subsidiary. During the four years he oversaw the business, revenue increased by 50 percent. In 2000, he received added responsibility for MetLife’s national service center, which provides financial and administrative services to middle market customers in MetLife’s Institutional Business segment.
From 1996 to 1998, Bill served as the vice president overseeing MetLife’s relationship with the company’s largest institutional customer — General Motors. Prior to this position, he headed MetLife’s National Accounts customer units in Schaumburg, IL and Orange, CA, which served over 40 large customers, from 1994 to 1996. In 1992, Bill was put in charge of the Group National Accounts claim operations. He was promoted to vice president in 1990 and joined MetLife in 1982.
Bill is a member of the board of directors for Hyatt Legal Plans, Rhode Island Philharmonic, the Insurance Information Institute, the Property Casualty Insurers Association of America, the Greater Providence Chamber of Commerce and the Insurance Institute for Highway Safety.
He received a B.A. from the University of Pittsburgh, a M.B.A. from Pace University and a chartered life underwriter designation from The American College.

Catherine A. Rein
Senior Executive Vice President
& Chief Administrative Officer
MetLife, Inc.
Senior Executive Vice President
& Chief Administrative Officer
MetLife, Inc.
Catherine A. Rein is senior executive vice president and chief administrative officer of MetLife, Inc. She was appointed to this position in January 2005.
As chief administrative officer, Cathy oversees the more than 7,000 employees that make up MetLife’s human resources, information technology, corporate ethics and compliance, audit, corporate communications, advertising and brand management, corporate security, corporate real estate, corporate procurement and call center functions.
Since being named CAO, Cathy’s organization has supported a number of enterprise-wide initiatives at MetLife, including the company’s recent acquisition and integration of Travelers Life & Annuity. This transaction required contributions from all the departments within the CAO organization, each of which worked rapidly and cohesively to support the seamless integration of the Travelers businesses in just four months. In addition, under Cathy’s leadership, MetLife has successfully launched a new consumer advertising campaign; expanded its infrastructure in order to support the company’s international expansion; and implemented real estate strategies for MetLife offices around the world.
From 1999 through 2004, Cathy was president and chief executive officer of MetLife Auto & Home. In this role, she led the company to achieve record sales and operating earnings growth, improved MetLife Auto & Home’s combined ratio and increased customer retention. During her tenure, she also oversaw MetLife’s acquisition and integration of the personal insurance operations of the St. Paul Companies.
Prior to overseeing MetLife Auto & Home, Cathy was senior executive vice president in charge of the MetLife business services group from 1998. She was named a senior vice president in 1988 in charge of various MetLife staff functions, including human resources, information technology, facilities and services, public affairs and government relations, planning, and mergers and acquisitions. Cathy joined MetLife in 1985 as vice president in charge of the human resources department.
Before joining MetLife, she served as vice president and general counsel for The Continental Group, Inc. Prior to that, she was associated with the New York City law firm of Dewey, Ballantine, Bushby, Palmer & Wood.
Cathy chairs the MetLife Foundation. In addition, she serves on the board of directors of The Bank of New York, Inc., First Energy Corporation, and is director emeritus of Corning, Inc.
Cathy received a B.A. from Pennsylvania State University and a J.D. from New York University. She is a member of the board of trustees of New York University Law Center Foundation. She is also a member of the American Bar Association, the New York State Bar Association and the Association of the Bar of the City of New York.

Stuart B. Solomon
President & Chief Executive Officer
MetLife Korea
President & Chief Executive Officer
MetLife Korea
Stuart B. Solomon is president and chief executive officer of MetLife Korea. He was named to this position in June 2001.
In this role, Stu is responsible for overseeing all of MetLife’s operations in South Korea, including sales, finance, investments, product development and all support functions. In total, he has nine direct reports and manages a company with over 500 employees and a sales force of 4,000. Since 2002, MetLife Korea has grown rapidly and recorded increasing profitability every year.
Additionally, Stu serves as chairman of the MetLife Welfare Foundation in Korea, where contributions to needy children are made from earnings at MetLife Korea.
Stu joined MetLife in August 1995 and has served as a senior officer for MetLife Korea since October 1995. Prior to his current role, he served as MetLife Korea’s chief investment officer from 1997 to 1998 before taking on additional responsibility for the company’s information technology and human resources areas as an executive vice president.
Prior to joining MetLife, Stu worked for Korea Exchange Bank’s New York Branch, where he was responsible for the management of funding and investments from 1979 to 1995. He set up a bankers acceptance funding facility with major New York investment banks, a first for a Korean bank. He also oversaw a $300 million investment/trading portfolio. Before joining MetLife in 1995, Stu was deputy general manager of the Korea Exhange Bank’s New York Branch.
From 1974 to 1978, Stu served as an overseas branch representative in Busan for a United States steel importer, where he sourced foundries for specialized iron and steel castings. From 1971 to 1973, he served as a U.S. Peace Corps volunteer in Seoul as part of a nationwide health program.
Currently, Stu is serving his second, three-year term as an outside director at KT, Korea’s largest telecommunications company. He also serves as an auditor with the Korea Life Insurance Association, the industry trade organization. In addition, he was recently elected as a governor for the American Chamber of Commerce in Korea and chairs the life insurance committee.
Stu received a B.A. from Syracuse University.

William J. Toppeta
President, International
MetLife, Inc.
President, International
MetLife, Inc.
William J. Toppeta is president, International for MetLife, Inc. He was named to this position in July 2001 and is responsible for all of the company’s insurance and employee benefits businesses outside the United States.
Under his leadership, MetLife continues to successfully expand its operations in three key regions outside of the U.S.: Latin America, Asia Pacific and Europe.
Since Bill was named president, International’s revenues have grown from $1.2 billion in 2001 to $3.6 billion in 2005. As a result of MetLife’s 2005 acquisition of substantially all of Citigroup Inc.’s international insurance businesses, MetLife’s presence outside the U.S. has expanded to now reach over 17 million customers in multiple countries and territories.
Bill has focused MetLife’s International business on growth — both organically and through acquisitions. He was the principal architect of MetLife’s acquisition and integration of Aseguradora Hidalgo S.A. in Mexico, where MetLife is now the largest life insurer. He also expanded MetLife’s operations in South Korea, Chile, Brazil, India and China.
Prior to assuming his current role, Bill served as MetLife’s president of client services and chief administrative officer from 1999 to 2001. Prior to this position, he oversaw MetLife’s Individual Business segment after having led the U.S. career agency force for three years. In 1995, he was named senior vice president to lead MetLife’s corporate reengineering department.
After being named vice president and deputy general manager of MetLife’s Canadian operations in 1992, he became president and CEO of Metropolitan Life’s Canadian operations in 1993. Bill also served as executive assistant to Richard R. Shinn, who was MetLife’s CEO at the time, and was appointed assistant vice president in the office of the president in 1979. He began his career at MetLife in 1973 as an attorney in the law department.
Bill is a member of the board of the President’s Council of Fordham University, vice chairman of the International Committee of the American Council of Life Insurers, and serves on the board of directors of the Council of the Americas, U.S.-India Business Council, and Coalition of Services Industries. He also serves as a director of MetLife Foundation, MetLife Investors, MetLife Securities, New England Securities and Walnut Street Securities among others.
He holds a B.A. from Fordham College as well as a J.D. and a LL.M from New York University’s School of Law.
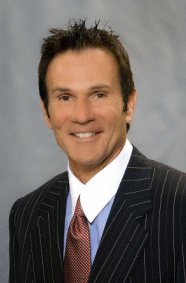
Michael J. Vietri
Executive Vice President, Agency Distribution Group
MetLife
Executive Vice President, Agency Distribution Group
MetLife
Michael J. Vietri is executive vice president of MetLife’s agency distribution group. In this role, he oversees approximately 8,000 sales people from the MetLife career agency and New England Financial general agency distribution channels. He was named the head of the MetLife sales force in August 2004 and received added responsibility for New England Financial in April 2005.
Mike is responsible for the strategic direction of the sales force as it ties to the company’s overall business sales, recruitment, retention, business goals and expense management. He successfully completed the restructuring of a number of MetLife sales offices from approximately 600 to 102, as well as led the two-year initiative to do the same for New England Financial (83 to 46 offices).
At the same time, he focused on increasing per agency production by developing the resources to strengthen the agencies’ infrastructure and reducing the expense gap. Retention of top sales producers continues to be a key objective. Year-to-date 2006, four-year retention is more than double the industry. Through October 2006, the first year gross dealer concession per representative is up 6% over prior year.
Mike continues to focus on recruiting a diverse sales force. New rep appointments are up 3% — of which 26% are multicultural and 28% are women. Initiatives such as MetLife’s partnership with The American College to provide internships and financial services class work to college sophomores and juniors is gaining momentum, as well as the women’s sales symposiums to gain new recruits and provide training opportunities to the sales people already at MetLife. Also, Mike created top producer advisory councils, focusing on key demographics including African American, Hispanic, Chinese, South Asian and women, for financial education, as well as recruitment and retention. From the African American advisory council came MetLife’s partnership with The American College for “Strategies to Be a Successful African American Financial Services Professional,” a unique seminar focused on training and networking for African American financial services representatives from MetLife and other companies. Other initiatives in 2006 include redesigning and standardizing sales compensation in terms of gross dealer commissions, as well as revising the way in which new hires are financially supported.
Mike joined MetLife as a financial services representative, then managed a sales agency before becoming a regional vice president in 1986. In 1990, Mike was appointed marketing vice present in the Northeastern territory and territorial vice present of the Mid-America territory in 1991, before becoming senior vice present of the North Central zone in 1999, which included 12 states and two regional offices with more than 1,700 producers. The zone accounted for 31% of the company’s total sales force and 32% of total sales. It was in this role that he developed programs that are used today to train and provide networking opportunities for women.
Mike earned his chartered life underwriter designation from The American College, where he now serves on the board of trustees, as well as the finance and marketing committees. Mike is a member of the General Agents & Managers Association (GAMA) and is involved in a number of industry associations. He has been a main platform speaker at key trade events. He is also a board member of the New England Life Insurance Company and MetLife Foundation.

Lisa M. Weber
President, Individual Business
MetLife, Inc.
President, Individual Business
MetLife, Inc.
Lisa M. Weber oversees the retail business segments, including Individual Business and Auto & Home, for MetLife, Inc., one of the largest providers of insurance and other financial services to millions of customers worldwide.
A 20-year veteran across the securities, banking and insurance industries, Lisa is driving a retail growth strategy at MetLife that emphasizes client needs through face-to-face distribution, best in class customer service and product innovation, as well as overall profitability for the retail businesses. Since being named president in June 2004, Lisa has overseen a number of initiatives that have impacted MetLife’s bottom- line and improved the company’s position in the marketplace.
Following MetLife’s 2005 acquisition of Travelers Life & Annuity, Lisa led significant enhancement to the product line up, integrated the sales force, redesigned the back office and drove bottom line results. At the same time, Lisa successfully directed the company’s response to two of the largest hurricanes in U.S. history. For the retail businesses (Individual Business and Auto & Home combined), year-end 2005 revenues grew 10% to $17.1 billion and operating earnings climbed 46% to $1.5 billion.
Through a reorganization of MetLife’s Agency Distribution Group in 2005, MetLife’s career agency channel has grown and the New England Financial general agency system has been refocused. On the independent distribution front, the successful integration of the Travelers acquisition has dramatically expanded the company’s presence in the independent marketplace. Simultaneously, MetLife’s Individual Business service strategy has been redesigned to better meet the needs of the company’s diverse distribution partners. Under Lisa’s direction, MetLife has also reshaped its life insurance product strategy at a time of significant industry change and enhanced its highly competitive annuity product portfolio.
From 2001 to 2004, Lisa served as MetLife’s senior executive vice president and chief administrative officer. In this position, she was responsible for MetLife’s worldwide brand and communications, human resources, corporate ethics & compliance, audit, corporate services, security as well as the company’s philanthropic efforts through MetLife Foundation. As executive vice president of human resources from 1999 to 2001, Lisa was instrumental in shaping and implementing MetLife’s overall strategy and the principal architect behind MetLife’s culture transformation and robust performance management system. She led a number of initiatives that were critical to MetLife’s 2000 conversion from a mutual to publicly-traded company.
Before joining MetLife in 1998, Lisa spent more than 10 years at PaineWebber, where she held a number of senior human resources positions. Previously, Lisa directed various human resources practices and strategies at Merrill Lynch and Manufacturers Hanover.
Lisa is a member of the boards of several MetLife subsidiaries, including MetLife Bank and MetLife Auto & Home, for which she serves as chair. She is a director of MetLife Foundation and Rutgers Executive Advisory Committee and a trustee of Northeast Region Boys & Girls Clubs of America.
She holds a B.A. from the State University of New York at Stony Brook where she was elected to Phi Beta Kappa.

William J. Wheeler
Executive Vice President & Chief Financial Officer
MetLife, Inc.
Executive Vice President & Chief Financial Officer
MetLife, Inc.
William J. Wheeler is executive vice president and chief financial officer of MetLife, Inc. He was named to this position in December 2003.
As chief financial officer, Bill is responsible for overseeing all financial management matters for MetLife. This includes financial reporting, treasury, corporate actuarial, risk management, tax, investor relations and mergers and acquisitions.
In addition, in June 2006, he was named the executive officer responsible for MetLife Bank, which offers retail banking products, including money market accounts, certificates of deposit and residential mortgages.
Most recently, in 2005 Bill oversaw the teams that negotiated the acquisition of, and secured all the necessary financing for, MetLife’s purchase of Travelers Life & Annuity and related international insurance businesses from Citigroup Inc. — MetLife’s largest deal ever in its 138-year history.
Before being promoted to chief financial officer, from 2002 to 2003 Bill was the head of product management, marketing and business development activities in the company’s Individual Business segment. Prior to this role and after MetLife’s initial public offering in 2000, Bill served as the chief financial officer of the company’s Institutional Business. In this position, he oversaw financial reporting and planning, as well as expense management for that segment.
Bill joined the company in 1997 as treasurer and played a key role in preparing MetLife to become a public company. He oversaw certain aspects of the demutualization, the development of investor relations and shareholder services organizations, and management of the initial public offering process and related transactions.
Before joining MetLife, Bill was an investment banker for ten years at Donaldson, Lufkin & Jenrette (DLJ). During his career at DLJ, he managed a variety of transactions, including equity and debt financings, mergers and acquisitions, leveraged buyouts, financial advisory and restructurings in a number of different industries, including the insurance industry.
Bill is a member of Wabash College’s board of trustees.
He holds an M.B.A. from Harvard Business School and also received an A.B., magna cum laude, and was awarded Phi Beta Kappa from Wabash College.
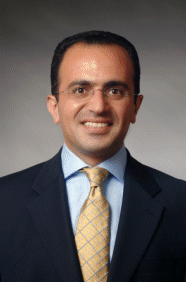
Sherif Zakhary
Vice President, Structured Risk Solutions
MetLife
Vice President, Structured Risk Solutions
MetLife
Sherif Zakhary is vice president of structured risk solutions within MetLife’s Institutional Business segment, based in London. He was named to this position in November 2005.
In this role, Sherif is responsible for developing all aspects of MetLife’s pension liability risk transfer (including pension plan closeouts/wind-up) and bulk annuity businesses in the United Kingdom. In directing financial solutions strategies for corporate pension customers, Sherif is establishing new U.K. corporate legal entities; developing new solutions/products; setting the parameters and priorities for product development; managing solutions/products to market introduction; and establishing origination/sales strategies.
Sherif joined MetLife in August 2003 and, before assuming his current role, was based in New York as a vice president in the company’s Institutional Business segment. In his capacity as head of structured risk solutions, Sherif was in charge of MetLife’s spread margin business (guaranteed interest contracts (GICs) and funding agreements), domestic pension closeouts and structured settlements.
In 2005, Sherif oversaw the integration of Travelers Life & Annuity’s institutional business within MetLife.
Prior to joining MetLife, Sherif worked at AIG in the Risk Finance Group where he headed up their structured insurance products group. Prior to AIG, Sherif established a risk transfer unit at American Financial Group, where he pioneered enterprise risk transfer insurance solutions. He also worked for NHP, Inc., a Washington, D.C. based Real Estate Investment Trust now owned by AIMCO. As vice president, Sherif was responsible for strategic planning, corporate finance, capital markets, mergers and acquisitions and treasury functions.
Sherif began his career with Donaldson, Lufkin, and Jenrette in both the structured finance investment banking group and the merchant banking group. He specialized in private equity investing, leveraged buyouts, mergers and acquisitions, corporate restructuring and bankruptcy consulting, financial restructuring of troubled and capitally-constrained companies, initial and secondary public equity offerings and public and private placement of debt securities.
He received a B.S. from Cornell University.