| MetLife, Inc. Annual Investor Day December 8, 2008 Agenda Topic Presenters Registration / Continental Breakfast Outline of Day Conor Murphy Overview C. Robert Henrikson Investments Steven A. Kandarian Finance William J. Wheeler Finance & Investments Q&A William J. Wheeler Steven A. Kandarian Break Institutional William J. Mullaney Individual Lisa M. Weber Break International William Toppeta Q&A All |

| Conor Murphy Vice President Investor Relations |

| Safe Harbor Statement These materials may contain or incorporate by reference information that includes or is based upon forward-looking statements within the meaning of the Private Securities Litigation Reform Act of 1995. Forward-looking statements give expectations or forecasts of future events. These statements can be identified by the fact that they do not relate strictly to historical or current facts. They use words such as "anticipate," "estimate," "expect," "project," "intend," "plan," "believe" and other words and terms of similar meaning in connection with a discussion of future operating or financial performance. In particular, these include statements relating to future actions, prospective services or products, future performance or results of current and anticipated services or products, sales efforts, expenses, the outcome of contingencies, such as legal proceedings, trends in operations and financial results. Any or all forward-looking statements may turn out to be wrong. They can be affected by inaccurate assumptions or by known or unknown risks and uncertainties. Many such factors will be important in determining MetLife's actual future results. These statements are based on current expectations and the current economic environment. They involve a number of risks and uncertainties that are difficult to predict. These statements are not guarantees of future performance. Actual results could differ materially from those expressed or implied in the forward-looking statements. Risks, uncertainties, and other factors that might cause such differences include the risks, uncertainties and other factors identified in MetLife, Inc.'s filings with the U.S. Securities and Exchange Commission ("SEC"). These factors include: (i) difficult and adverse conditions in the global and domestic capital and credit markets; (ii) continued volatility and further deterioration of the capital and credit markets; (iii) uncertainty about the effectiveness of the U.S. government's plan to purchase large amounts of illiquid, mortgage-backed and other securities from financial institutions; (iv) the impairment of other financial institutions; (v) potential liquidity and other risks resulting from MetLife's participation in a securities lending program and other transactions; (vi) exposure to financial and capital market risk; (vii) changes in general economic conditions, including the performance of financial markets and interest rates, which may affect the company's ability to raise capital and generate fee income and market-related revenue; (viii) defaults on the company's mortgage and consumer loans; (ix) investment losses and defaults, and changes to investment valuations; |
| Safe Harbor Statement (Continued) (x) market value impairments to illiquid assets; (xi) unanticipated changes in industry trends; (xii) heightened competition, including with respect to pricing, entry of new competitors, the development of new products by new and existing competitors and for personnel; (xiii) discrepancies between actual claims experience and assumptions used in setting prices for the company's products and establishing the liabilities for the company's obligations for future policy benefits and claims; (xiv) discrepancies between actual experience and assumptions used in establishing liabilities related to other contingencies or obligations; (xv) ineffectiveness of risk management policies and procedures; (xvi) catastrophe losses; (xvii) changes in assumptions related to deferred policy acquisition costs, value of business acquired or goodwill; (xviii) downgrades in MetLife's and its affiliates' claims paying ability, financial strength or credit ratings; (xix) economic, political, currency and other risks relating to the company's international operations; (xx) regulatory, legislative or tax changes that may affect the cost of, or demand for, the company's products or services; (xxi) changes in accounting standards, practices and/or policies; (xxii) adverse results or other consequences from litigation, arbitration or regulatory investigations; (xxiii) deterioration in the experience of the "closed block" established in connection with the reorganization of Metropolitan Life Insurance Company; (xxiv) the effects of business disruption or economic contraction due to terrorism or other hostilities; (xxv) MetLife's ability to identify and consummate on successful terms any future acquisitions, and to successfully integrate acquired businesses with minimal disruption; (xxvi) MetLife, Inc.'s primary reliance, as a holding company, on dividends from its subsidiaries to meet debt payment obligations and the applicable regulatory restrictions on the ability of the subsidiaries to pay such dividends; and (xxvii) other risks and uncertainties described from time to time in MetLife, Inc.'s filings with the SEC. MetLife, Inc. does not undertake any obligation to publicly correct or update any forward-looking statement if MetLife, Inc. later becomes aware that such statement is not likely to be achieved. Please consult any further disclosures MetLife, Inc. makes on related subjects in reports to the SEC. |
| Explanatory Note on Non-GAAP Financial Information The historical and forward-looking financial information presented at Investor Day and contained in these presentations include performance measures which are based on methodologies other than Generally Accepted Accounting Principles ("GAAP"). MetLife analyzes its performance using so-called non-GAAP measures, including operating earnings, operating earnings available to common shareholders, operating earnings available to common shareholders per diluted common share and operating return on common equity. MetLife believes these measures enhance the understanding and comparability of its performance by excluding net investment gains and losses, net of income tax, and adjustments related to net investment gains and losses, net of income tax, both of which can fluctuate significantly from period to period, and discontinued operations other than discontinued real estate, net of income tax, thereby highlighting the results from operations and the underlying profitability drivers of the business. Operating earnings is defined as GAAP net income, excluding net investment gains and losses, net of income tax, adjustments related to net investment gains and losses, net of income tax, and discontinued operations other than discontinued real estate, net of income tax. Scheduled periodic settlement payments on derivative instruments not qualifying for hedge accounting treatment are included in operating earnings available to common shareholders. Operating earnings available to common shareholders is defined as operating earnings less preferred stock dividends. All references in these slides and in the presentations made at Investor Day to "operating earnings" for 2005 and future years should be read as references to "operating earnings available to common shareholders." Operating earnings available to common shareholders per diluted common share is calculated by dividing operating earnings available to common shareholders by the number of weighted average diluted common shares outstanding for the period indicated. All references in these slides and in the presentations made at Investor Day to "operating earnings per share" for 2005 and future years should be read as references to "operating earnings available to common shareholders per diluted common share." |
| Explanatory Note on Non-GAAP Financial Information (Continued) Operating return on common equity is calculated by dividing operating earnings available to common shareholders by average common equity for the period indicated, excluding accumulated other comprehensive income. For the historical periods presented, reconciliations of the non-GAAP measures used in the presentations made at Investor Day to the most directly comparable GAAP measures are included in the Appendix to the presentation materials and are on the Investor Relations portion of MetLife, Inc.'s website (www.metlife.com). Additional information about MetLife's historical financial results is available in the Company's Quarterly Financial Supplements for the corresponding periods which may be accessed through the Company's website. The non-GAAP measures used in the presentations made at Investor Day should not be viewed as substitutes for the most directly comparable GAAP measures. In the presentations made at Investor Day, MetLife provides guidance on its future earnings, earnings per diluted common share and return on equity on an operating and non-GAAP basis. A reconciliation of the non-GAAP measures to the most directly comparable GAAP measures is not accessible on a forward-looking basis because MetLife believes it is not possible to provide other than a range of net investment gains and losses, which can fluctuate significantly within or without the range and from period to period and may have a significant impact on GAAP net income. |

| Agenda Topic Presenters Registration / Continental Breakfast Outline of Day Conor Murphy Overview C. Robert Henrikson Investments Steven A. Kandarian Finance William J. Wheeler Finance & Investments Q&A Steven A. Kandarian William J. Wheeler Break Institutional William J. Mullaney Individual Lisa Weber Break International William Toppeta Q&A All |


| C. Robert Henrikson Chairman, President & Chief Executive Officer |

| We are Big, Strong, and Trusted |
| Protecting Our Strength Reduced our securities lending program |
| Protecting Our Strength Reduced our securities lending program Raised capital of $2.3 billion |
| Protecting Our Strength Reduced our securities lending program Raised capital of $2.3 billion Continued to hedge our guarantees |
| Protecting Our Strength Reduced our securities lending program Raised capital of $2.3 billion Continued to hedge our guarantees Affirmed rating agency strength and outlook |
| Well Positioned Balance Sheet High quality investment portfolio Defensively structured Carefully underwritten Substantial capital To deliver on our promises A platform for growth |

| Growing Our Franchise through a Flight to Quality 2002 2003 2004 2005 2006 2007 2008E Revenue 20.3 21.6 22.9 26 28.2 29.8 33 8.9% CAGR2 1Premiums, Fees & Other Revenues. 2Calculated using 2008E mid-point. See Appendix for non-GAAP financial information definitions and/or reconciliations. Total Company Revenue1 ($ Billions) |
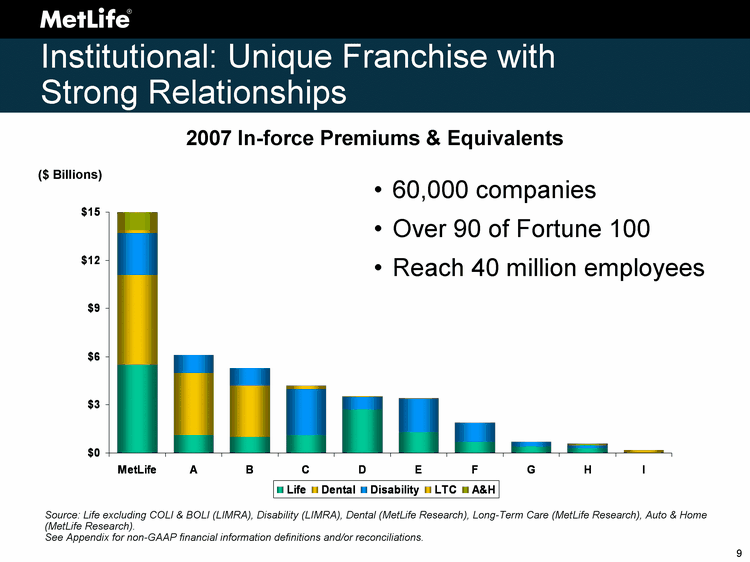
| MetLife A B C D E F G H I Life 5.5 1.1 1 1.1 2.7 1.3 0.7 0.4 0.3 - Dental 5.6 3.9 3.2 - - - - - - - Disability 2.6 1.1 1.1 2.9 0.8 2.1 1.2 0.3 0.2 - LTC 0.2 - - 0.2 0.039 - - - - 0.2 A&H 1.1 0.024 0.095 2007 In-force Premiums & Equivalents Institutional: Unique Franchise with Strong Relationships 60,000 companies Over 90 of Fortune 100 Reach 40 million employees Source: Life excluding COLI & BOLI (LIMRA), Disability (LIMRA), Dental (MetLife Research), Long-Term Care (MetLife Research), Auto & Home (MetLife Research). See Appendix for non-GAAP financial information definitions and/or reconciliations. ($ Billions) |
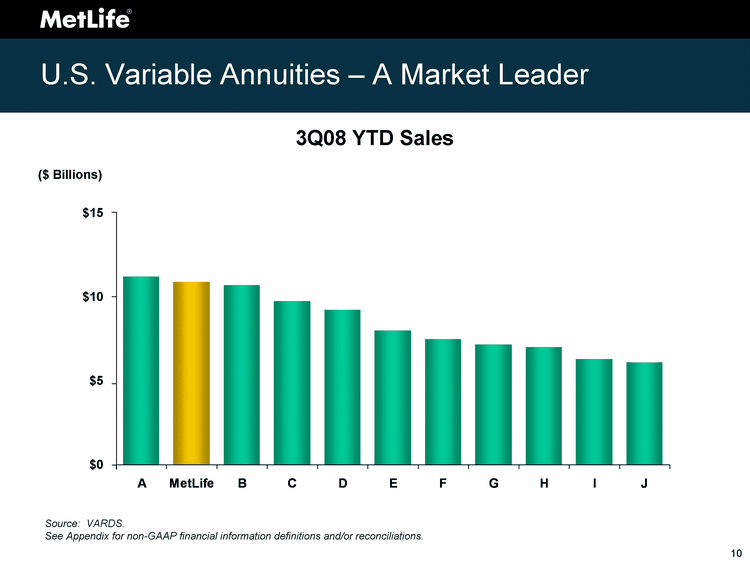
| U.S. Variable Annuities - A Market Leader A MetLife B C D E F G H I J Sales 10799.6 10489.5 10321.4 9389.2 8886.9 7714.6 7210.3 6901.2 6739.2 6066.8 5872.9 Source: VARDS. See Appendix for non-GAAP financial information definitions and/or reconciliations. 3Q08 YTD Sales $0 $5 $10 $15 ($ Billions) |

| International - Growing into a Global Company 2000 2001 2002 2003 2004 2005 2006 2007 2008E Revenue 0.7 0.9 1.1 1.7 2.1 2.8 3.6 4.1 4.7 22.5% CAGR 2 1Premiums, Fees & Other Revenues. 2Calculated using 2008E mid-point. Revenue1 ($ Billions) |
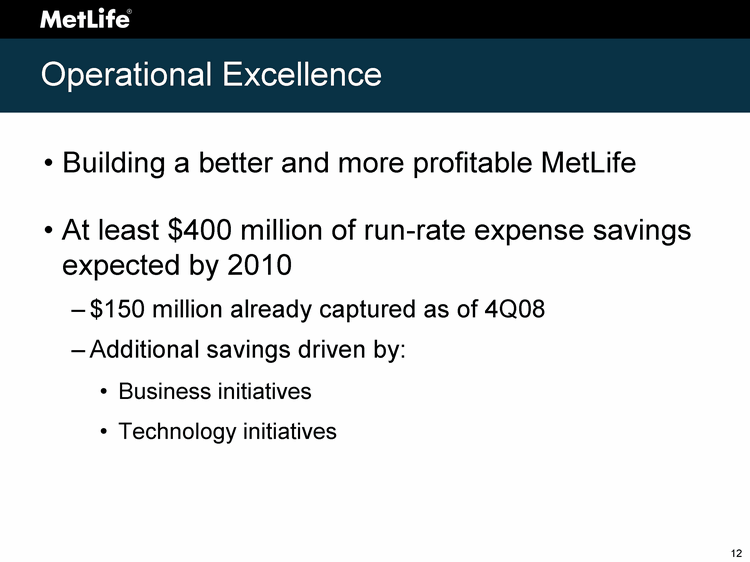
| Operational Excellence Building a better and more profitable MetLife At least $400 million of run-rate expense savings expected by 2010 $150 million already captured as of 4Q08 Additional savings driven by: Business initiatives Technology initiatives |
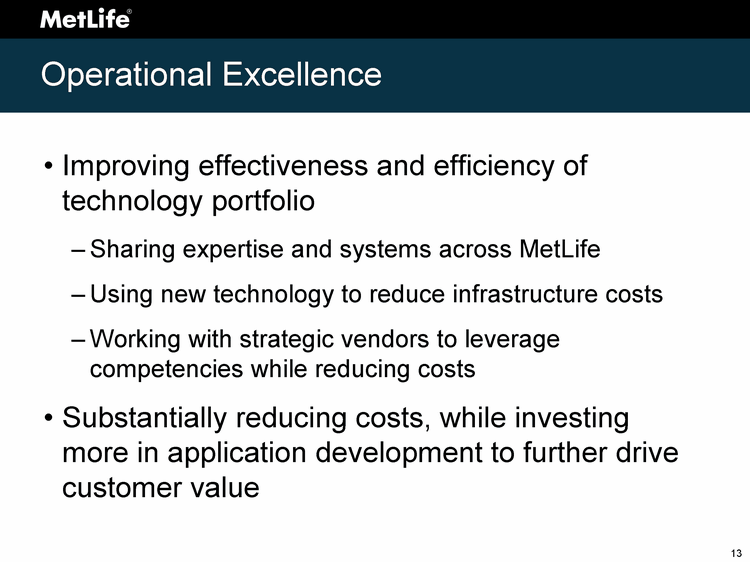
| Operational Excellence Improving effectiveness and efficiency of technology portfolio Sharing expertise and systems across MetLife Using new technology to reduce infrastructure costs Working with strategic vendors to leverage competencies while reducing costs Substantially reducing costs, while investing more in application development to further drive customer value |
| Summary Our capital position is strong Our investment portfolio is defensively positioned We have tremendous growth opportunities We continue to benefit from the flight to quality |

| Steven A. Kandarian Executive Vice President & Chief Investment Officer Investments |
| Defensively Positioned for Current Environment Identified weaknesses in certain asset sectors early and took action Repositioned portfolio for recession beginning in 2007 Reduced balance sheet leverage and increased liquidity |


| 2009 Market View and Themes Fundamentals deteriorate Credit Fundamentals deteriorate Real Estate Rates remain low Fed Contained, talk of deflation Inflation Global recession Economy Well ahead of fundamentals Spreads |
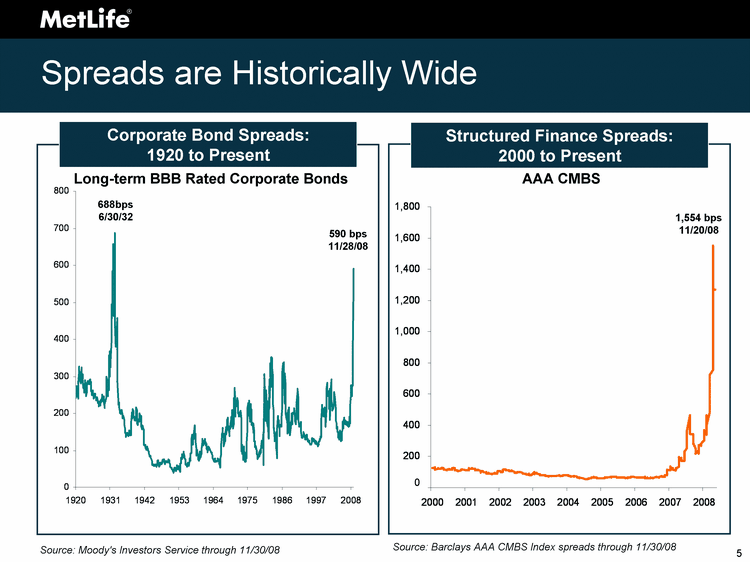
| Spreads are Historically Wide Source: Moody's Investor Service through 11/30/08 AAA CMBS 590 bps 11/28/08 688bps 6/30/32 1,554 bps 11/20/08 Corporate Bond Spreads: 1920 to Present Structured Finance Spreads: 2000 to Present Long-term BBB Rated Corporate Bonds 0 Source: Barclays AAA CMBS Index spreads through 11/30/08 |
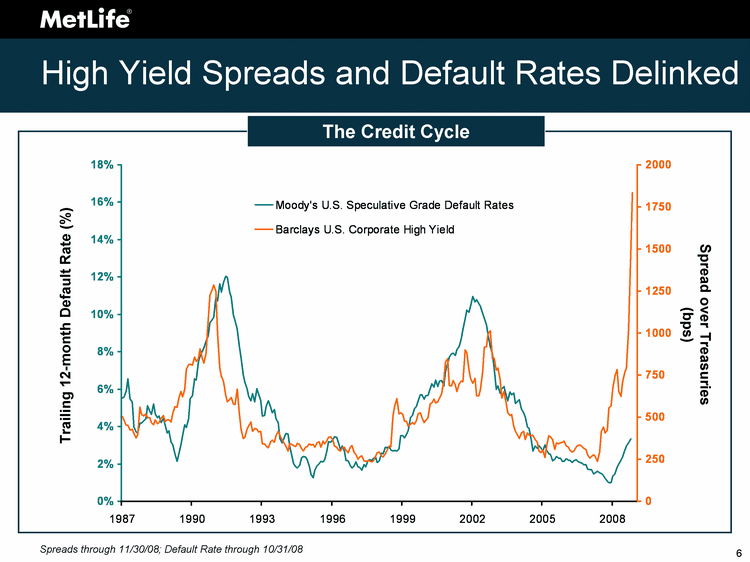
| High Yield Spreads and Default Rates Delinked Moody's U.S. Speculative Grade Default Rates Barclays U.S. Corporate High Yield 1/31/1987 0.0551 504 2/28/1987 0.0559 480 3/31/1987 0.0591 451 4/30/1987 0.0654 452 5/31/1987 0.0547 422 6/30/1987 0.0531 429 7/31/1987 0.0396 403 8/31/1987 0.037 376 9/30/1987 0.0364 397 10/31/1987 0.0419 560 11/30/1987 0.0419 516 12/31/1987 0.043 505 1/31/1988 0.044 521 2/29/1988 0.0512 496 3/31/1988 0.0483 498 4/30/1988 0.0466 466 5/31/1988 0.052 453 6/30/1988 0.0467 484 7/31/1988 0.0447 461 8/31/1988 0.0457 466 9/30/1988 0.0421 492 10/31/1988 0.0444 511 11/30/1988 0.041 473 12/31/1988 0.0364 483 1/31/1989 0.0378 484 2/28/1989 0.0317 471 3/31/1989 0.0304 522 4/30/1989 0.0253 562 5/31/1989 0.0214 560 6/30/1989 0.0252 609 7/31/1989 0.0301 652 8/31/1989 0.0351 619 9/30/1989 0.0409 666 10/31/1989 0.0395 785 11/30/1989 0.0441 813 12/31/1989 0.055 816 1/31/1990 0.0564 810 2/28/1990 0.0654 856 3/31/1990 0.065 830 4/30/1990 0.0744 846 5/31/1990 0.0777 906 6/30/1990 0.0802 851 7/31/1990 0.0821 820 8/31/1990 0.0855 881 9/30/1990 0.0885 1082 10/31/1990 0.0956 1225 11/30/1990 0.097 1258 12/31/1990 0.0985 1287 1/31/1991 0.1092 1248 2/28/1991 0.1073 1000 3/31/1991 0.1164 796 4/30/1991 0.1118 743 5/31/1991 0.1173 712 6/30/1991 0.1205 630 7/31/1991 0.1197 591 8/31/1991 0.1123 603 9/30/1991 0.1092 618 10/31/1991 0.0996 579 11/30/1991 0.0967 575 12/31/1991 0.0921 667 1/31/1992 0.0826 518 2/29/1992 0.0769 430 3/31/1992 0.0677 374 4/30/1992 0.0637 380 5/31/1992 0.0601 429 6/30/1992 0.0562 449 7/31/1992 0.0539 472 8/31/1992 0.0575 415 9/30/1992 0.0531 433 10/31/1992 0.0601 429 11/30/1992 0.0575 412 12/31/1992 0.054 417 1/31/1993 0.0456 341 2/28/1993 0.0459 340 3/31/1993 0.0509 327 4/30/1993 0.0538 319 5/31/1993 0.0506 355 6/30/1993 0.0473 364 7/31/1993 0.0491 351 8/31/1993 0.0441 390 9/30/1993 0.0422 415 10/31/1993 0.0335 392 11/30/1993 0.0313 364 12/31/1993 0.0332 351 1/31/1994 0.0361 329 2/28/1994 0.0359 300 3/31/1994 0.0296 345 4/30/1994 0.0242 338 5/31/1994 0.0203 330 6/30/1994 0.0184 324 7/31/1994 0.0179 345 8/31/1994 0.019 337 9/30/1994 0.0233 311 10/31/1994 0.0241 300 11/30/1994 0.0238 321 12/31/1994 0.0221 326 1/31/1995 0.0188 341 2/28/1995 0.0142 336 3/31/1995 0.0126 337 Spread over Treasuries (bps) Spreads through 11/30/08; Default Rate through 10/31/08 Trailing 12-month Default Rate (%) The Credit Cycle |

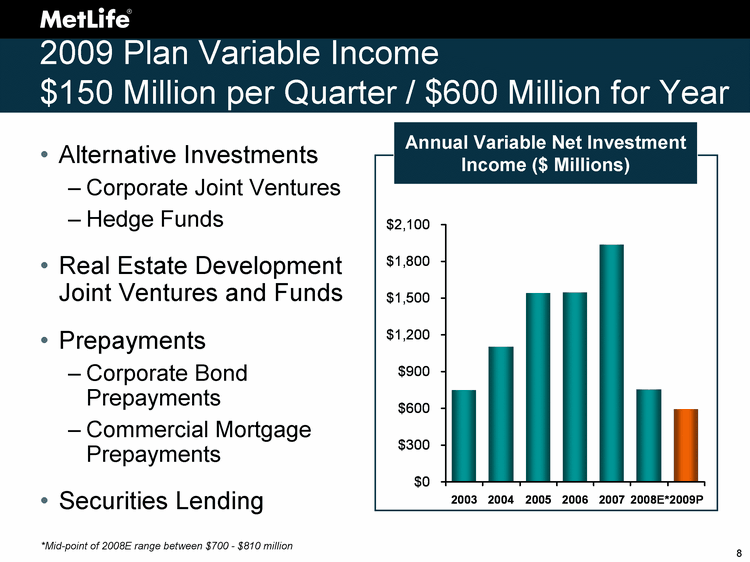
| 2003 2004 2005 2006 2007 2008E* 2009P Actual Volatile Income 749 1103 1542 1551 1938 755 596 Alternative Investments Corporate Joint Ventures Hedge Funds Real Estate Development Joint Ventures and Funds Prepayments Corporate Bond Prepayments Commercial Mortgage Prepayments Securities Lending 2009 Plan Variable Income $150 Million per Quarter / $600 Million for Year Annual Variable Net Investment Income ($ Millions) *Mid-point of 2008E range between $700 - $810 million |

| Securities Lending Has Declined Lower demand for securities lending Current balance is $26.8 billion as of 11/30/08 $15.8 billion on open (including $15.0 billion of Treasury and Agency securities) Sufficient liquidity to facilitate further reduction 12/31/2007 6/30/2008 9/12/2008 9/30/2008 10/28/2008 11/30/2008 East 42.9 44.6 46.1 41.2 30.8 26.8 Securities Lending Balances ($ Billions) |
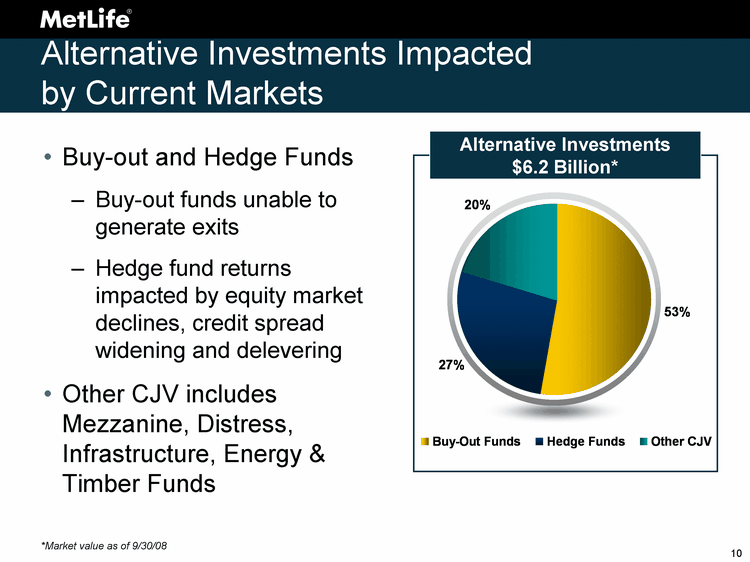
| Alternative Investments Impacted by Current Markets Buy-out and Hedge Funds Buy-out funds unable to generate exits Hedge fund returns impacted by equity market declines, credit spread widening and delevering Other CJV includes Mezzanine, Distress, Infrastructure, Energy & Timber Funds Buy-Out Funds Hedge Funds Other CJV RMBS 3270 1678 1254 Alternative Investments $6.2 Billion* *Market value as of 9/30/08 |

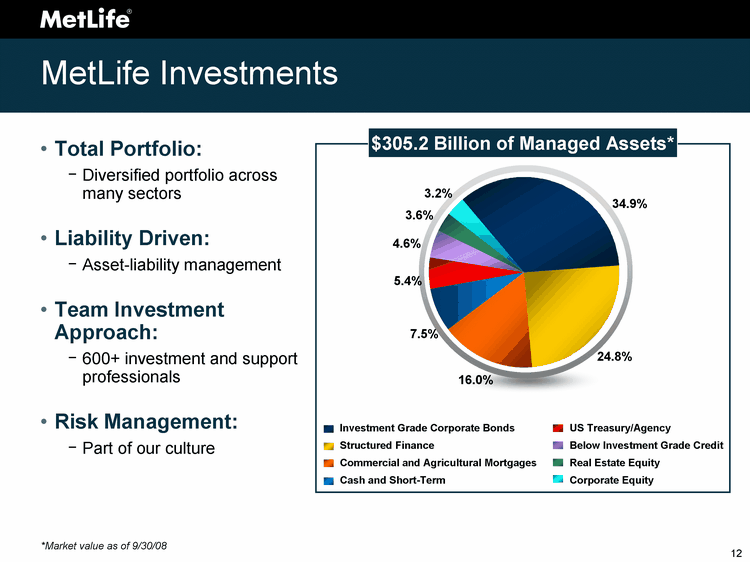
| Investment Grade Corporate Bonds Structured Finance Commercial and Agricultural Mortgages Cash and Short-Term U.S. Treasury Below Investment Grade Corporate Bonds Real Estate Equity Corporate Equity East 34.9 24.8 16 7.5 5.4 4.6 3.6 3.2 Total Portfolio: Diversified portfolio across many sectors Liability Driven: Asset-liability management Team Investment Approach: 600+ investment and support professionals Risk Management: Part of our culture MetLife Investments 34.9% 24.8% 16.0% *Market value as of 9/30/08 5.4% 3.2% 3.6% 4.6% 7.5% $305.2 Billion of Managed Assets* Investment Grade Corporate Bonds Structured Finance Commercial and Agricultural Mortgages Cash and Short-Term US Treasury/Agency Below Investment Grade Credit Real Estate Equity Corporate Equity |
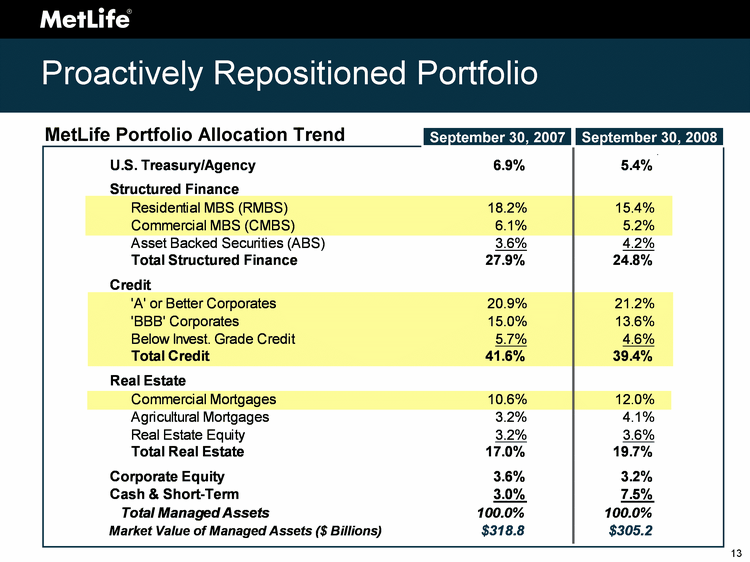
| Proactively Repositioned Portfolio MetLife Portfolio Allocation Trend September 30, 2007 September 30, 2008 |
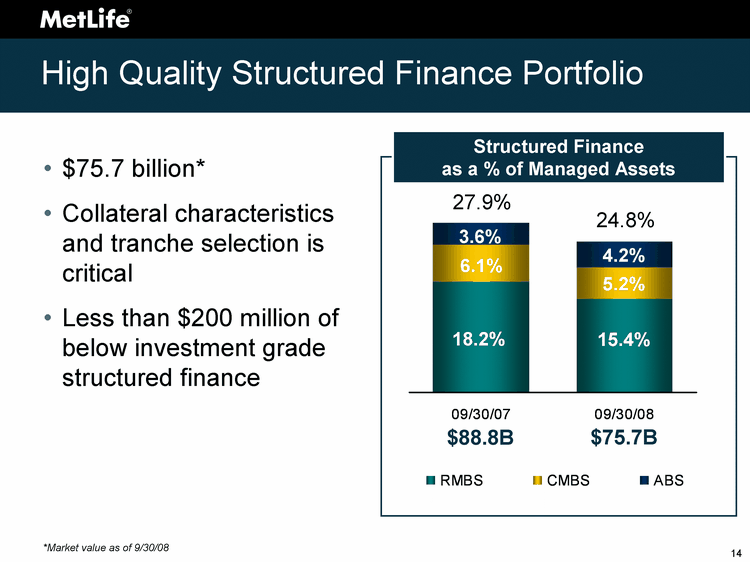
| High Quality Structured Finance Portfolio $75.7 billion* Collateral characteristics and tranche selection is critical Less than $200 million of below investment grade structured finance *Market value as of 9/30/08 9/30/2007 9/30/2008 RMBS 0.182 0.154 CMBS 0.061 0.052 ABS 0.036 0.042 Structured Finance as a % of Managed Assets $88.8B $75.7B 3.6% 6.1% 18.2% 15.4% 5.2% 4.2% 24.8% 27.9% |
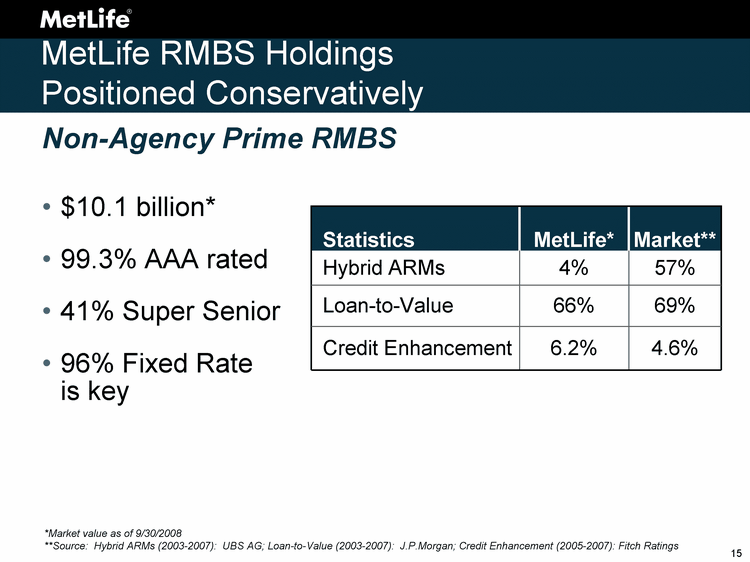
| MetLife RMBS Holdings Positioned Conservatively $10.1 billion* 99.3% AAA rated 41% Super Senior 96% Fixed Rate is key *Market value as of 9/30/2008 **Source: Hybrid ARMs (2003-2007): UBS AG; Loan-to-Value (2003-2007): J.P.Morgan; Credit Enhancement (2005-2007): Fitch Ratings Statistics MetLife* Market** Hybrid ARMs 4% 57% Loan-to-Value 66% 69% Credit Enhancement 6.2% 4.6% Non-Agency Prime RMBS |
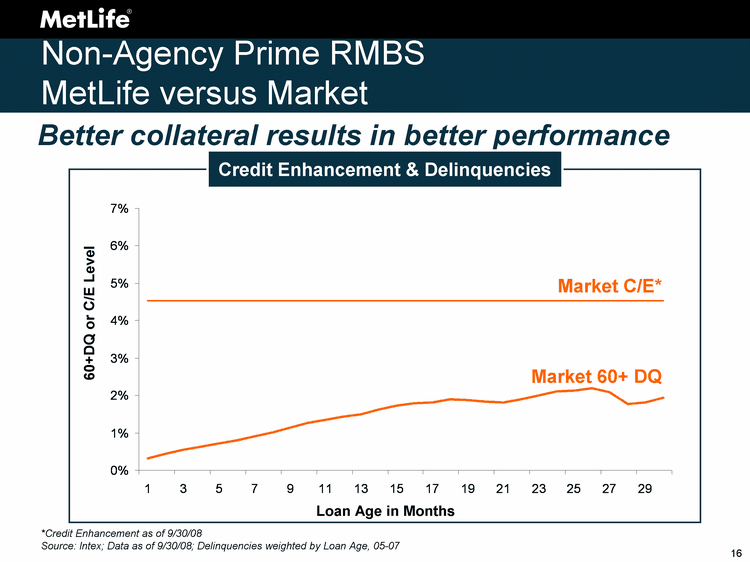
| Non-Agency Prime RMBS MetLife versus Market Better collateral results in better performance Market C/E* Market 60+ DQ 60+DQ or C/E Level Loan Age in Months *Credit Enhancement as of 9/30/08 Source: Intex; Data as of 9/30/08; Delinquencies weighted by Loan Age, 05-07 Credit Enhancement & Delinquencies |

| MET 60+ DQ Non-Agency Prime RMBS MetLife versus Market Better collateral results in better performance MET C/E* Market C/E* Market 60+ DQ 60+DQ or C/E Level Loan Age in Months *Credit Enhancement as of 9/30/08 Source: Intex; Data as of 9/30/08; Delinquencies weighted by Loan Age, 05-07 Credit Enhancement & Delinquencies |
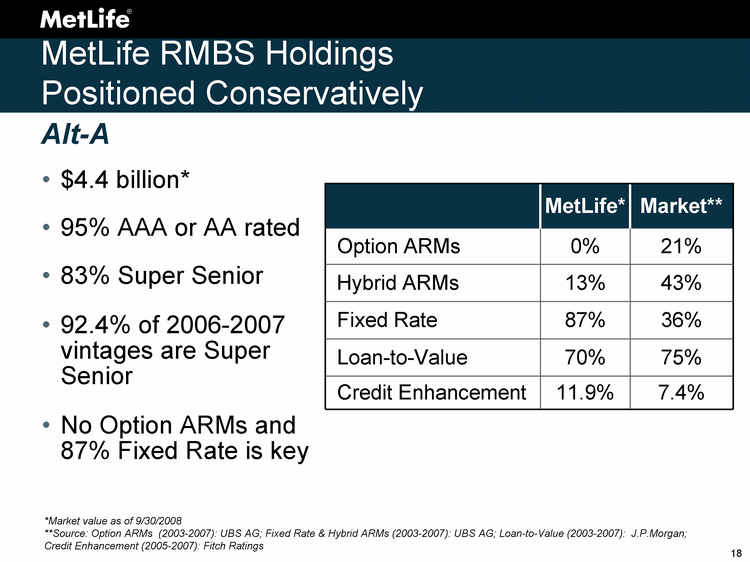
| MetLife RMBS Holdings Positioned Conservatively $4.4 billion* 95% AAA or AA rated 83% Super Senior 92.4% of 2006-2007 vintages are Super Senior No Option ARMs and 87% Fixed Rate is key MetLife* Market** Option ARMs 0% 21% Hybrid ARMs 13% 43% Fixed Rate 87% 36% Loan-to-Value 70% 75% Credit Enhancement 11.9% 7.4% Alt-A *Market value as of 9/30/2008 **Source: Option ARMs (2003-2007): UBS AG; Fixed Rate & Hybrid ARMs (2003-2007): UBS AG; Loan-to-Value (2003-2007): J.P.Morgan; Credit Enhancement (2005-2007): Fitch Ratings |

| Alt-A RMBS MetLife versus Market Better collateral results in better performance Market C/E* Market 60+ DQ 0% 2% 4% 6% 8% 10% 12% 14% 1 3 5 7 9 11 13 15 17 19 21 23 25 27 29 60+DQ or C/E Level Loan Age in Months *Credit Enhancement as of 9/30/08 Source: Intex; Data as of 9/30/08; Delinquencies weighted by Loan Age, 05-07 Credit Enhancement & Delinquencies |

| Alt-A RMBS MetLife versus Market Better collateral results in better performance MET C/E* Market C/E* Market 60+ DQ MET 60+ DQ 60+DQ or C/E Level 0% 2% 4% 6% 8% 10% 12% 14% 1 3 5 7 9 11 13 15 17 19 21 23 25 27 29 Loan Age in Months *Credit Enhancement as of 9/30/08 Source: Intex; Data as of 9/30/08; Delinquencies weighted by Loan Age, 05-07 Credit Enhancement & Delinquencies |
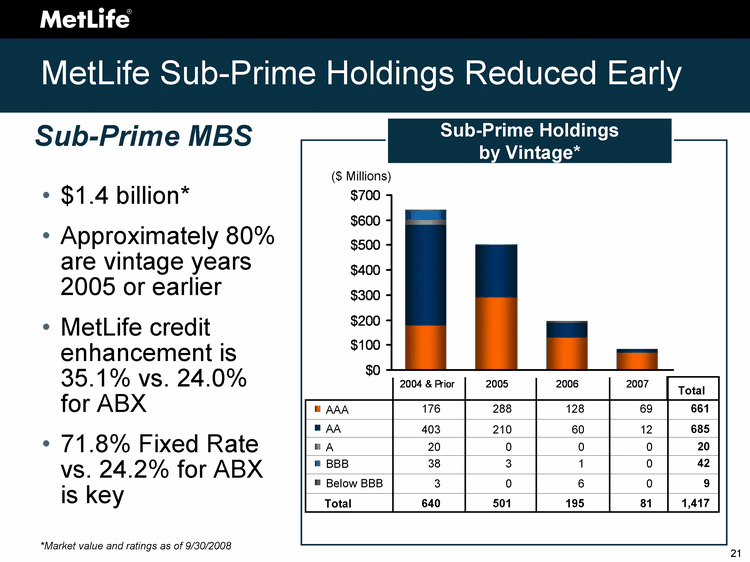
| MetLife Sub-Prime Holdings Reduced Early $1.4 billion* Approximately 80% are vintage years 2005 or earlier MetLife credit enhancement is 35.1% vs. 24.0% for ABX 71.8% Fixed Rate vs. 24.2% for ABX is key *Market value and ratings as of 9/30/2008 Sub-Prime MBS Below BBB 3 0 6 0 BBB 38 3 1 0 A 20 0 0 0 AA 403 210 60 12 AAA 176 288 128 69 9 42 20 685 661 Total Total 640 501 195 81 1,417 Sub-Prime Holdings by Vintage* ($ Millions) |
| Sub-Prime MBS MetLife versus Market *Credit Enhancement as of 9/30/08 Source: Intex Better collateral results in better performance MetLife ABX Market C/E MetLife C/E 1 0 0 0.2366 0.3273 2 0 0 0.2366 0.3273 3 0.01 0 0.2366 0.3273 4 0.01 0.01 0.2366 0.3273 5 0.02 0.01 0.2366 0.3273 6 0.02 0.02 0.2366 0.3273 7 0.03 0.04 0.2366 0.3273 8 0.03 0.05 0.2366 0.3273 9 0.04 0.07 0.2366 0.3273 10 0.05 0.08 0.2366 0.3273 11 0.05 0.1 0.2366 0.3273 12 0.06 0.11 0.2366 0.3273 13 0.07 0.13 0.2366 0.3273 14 0.07 0.14 0.2366 0.3273 15 0.07 0.16 0.2366 0.3273 16 0.08 0.17 0.2366 0.3273 17 0.08 0.19 0.2366 0.3273 18 0.09 0.2 0.2366 0.3273 19 0.09 0.21 0.2366 0.3273 20 0.1 0.23 0.2366 0.3273 21 0.1 0.23 0.2366 0.3273 22 0.11 0.24 0.2366 0.3273 23 0.12 0.24 0.2366 0.3273 24 0.13 0.25 0.2366 0.3273 25 0.13 0.27 0.2366 0.3273 26 0.14 0.29 0.2366 0.3273 27 0.15 0.3 0.2366 0.3273 28 0.15 0.32 0.2366 0.3273 29 0.16 0.33 0.2366 0.3273 30 0.16 0.35 0.2366 0.3273 31 0.16 0.36 0.2366 0.3273 32 0.16 0.37 0.2366 0.3273 33 0.16 0.39 0.2366 0.3273 34 0.16 0.39 0.2366 0.3273 Loan Age in Months ABX C/E* Market 60+ DQ Credit Enhancement & Delinquencies |
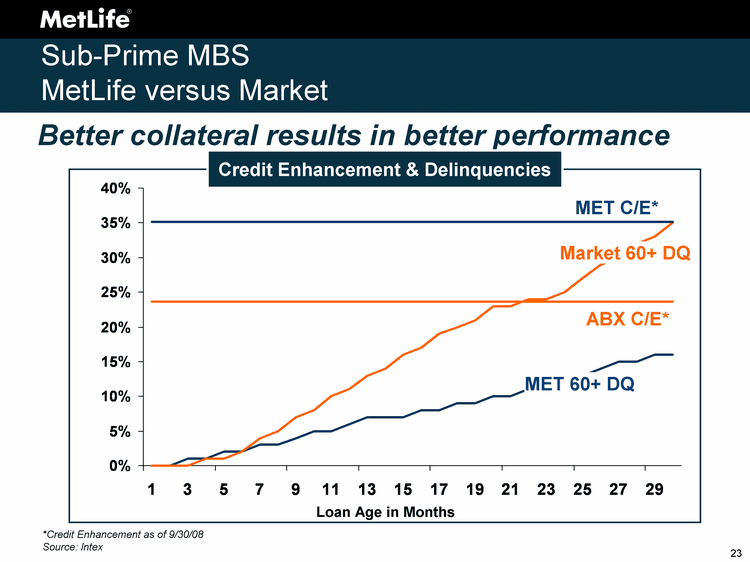
| Sub-Prime MBS MetLife versus Market Better collateral results in better performance MetLife ABX Market C/E MetLife C/E 1 0 0 0.2366 0.351 2 0 0 0.2366 0.351 3 0.01 0 0.2366 0.351 4 0.01 0.01 0.2366 0.351 5 0.02 0.01 0.2366 0.351 6 0.02 0.02 0.2366 0.351 7 0.03 0.04 0.2366 0.351 8 0.03 0.05 0.2366 0.351 9 0.04 0.07 0.2366 0.351 10 0.05 0.08 0.2366 0.351 11 0.05 0.1 0.2366 0.351 12 0.06 0.11 0.2366 0.351 13 0.07 0.13 0.2366 0.351 14 0.07 0.14 0.2366 0.351 15 0.07 0.16 0.2366 0.351 16 0.08 0.17 0.2366 0.351 17 0.08 0.19 0.2366 0.351 18 0.09 0.2 0.2366 0.351 19 0.09 0.21 0.2366 0.351 20 0.1 0.23 0.2366 0.351 21 0.1 0.23 0.2366 0.351 22 0.11 0.24 0.2366 0.351 23 0.12 0.24 0.2366 0.351 24 0.13 0.25 0.2366 0.351 25 0.13 0.27 0.2366 0.351 26 0.14 0.29 0.2366 0.351 27 0.15 0.3 0.2366 0.351 28 0.15 0.32 0.2366 0.351 29 0.16 0.33 0.2366 0.351 30 0.16 0.35 0.2366 0.351 31 0.16 0.36 0.2366 0.351 32 0.16 0.37 0.2366 0.351 33 0.16 0.39 0.2366 0.351 34 0.16 0.39 0.2366 0.351 Loan Age in Months MET C/E* MET 60+ DQ *Credit Enhancement as of 9/30/08 Source: Intex Credit Enhancement & Delinquencies ABX C/E* Market 60+ DQ |
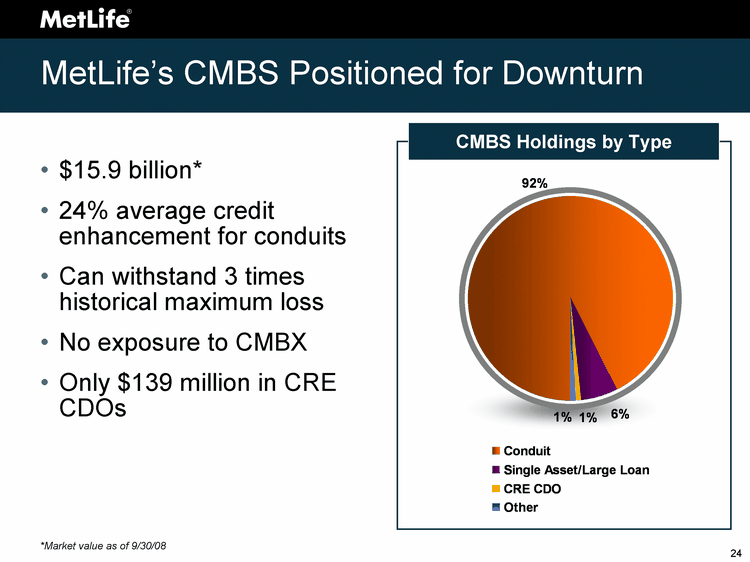
| MetLife's CMBS Positioned for Downturn $15.9 billion* 24% average credit enhancement for conduits Can withstand 3 times historical maximum loss No exposure to CMBX Only $139 million in CRE CDOs Conduit Single Asset/Large Loan CRE CDO Other East 14653 926 139 145 CMBS Holdings by Type *Market value as of 9/30/08 |
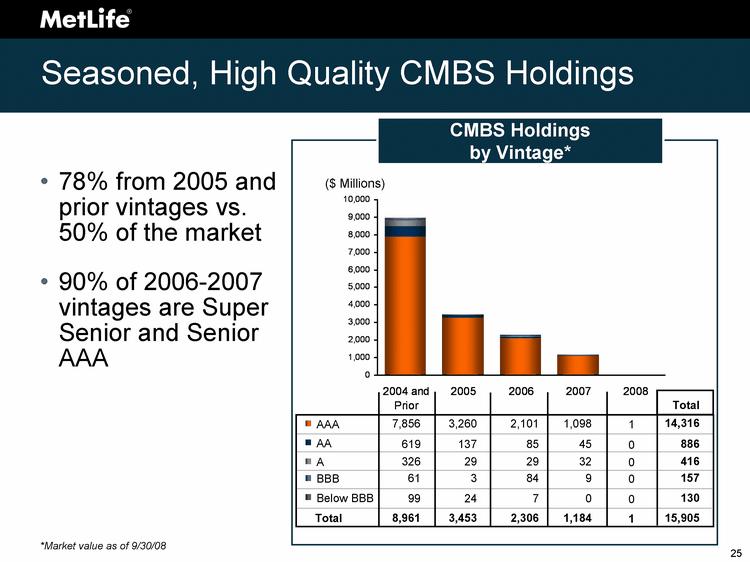
| Seasoned, High Quality CMBS Holdings 78% from 2005 and prior vintages vs. 50% of the market 90% of 2006-2007 vintages are Super Senior and Senior AAA CMBS Holdings by Vintage* Below BBB 99 24 7 0 BBB 61 3 84 9 A 326 29 29 32 AA 619 137 85 45 AAA 7,856 3,260 2,101 1,098 *Market value as of 9/30/08 130 157 416 886 14,316 Total Total 8,961 3,453 2,306 1,184 15,905 0 0 0 0 1 1 2004 and Prior 2005 2006 2007 2008 AAA 7856 3260 2100 1098 1 AA 619 137 85 45 0 A 326 29 29 32 0 BBB 61 3 85 9 0 Below BBB 99 24 6 0 0 ($ Millions) |

| CMBS Price Does Not Convey Full Story Fundamental analysis of bond characteristics is key Focus on the details MetLife Bond* Market Bond* Price $66 $67 Rating Senior AAA Senior AAA Vintage 2007 2007 Interest Only Loans 39.2% 80.4% Loans on Servicer Watch List 6.4% 49.9% MetLife's Projections: MetLife's Projections: MetLife's Projections: Expected Coverage 4.8x 1.7x *As of 10/31/08 |
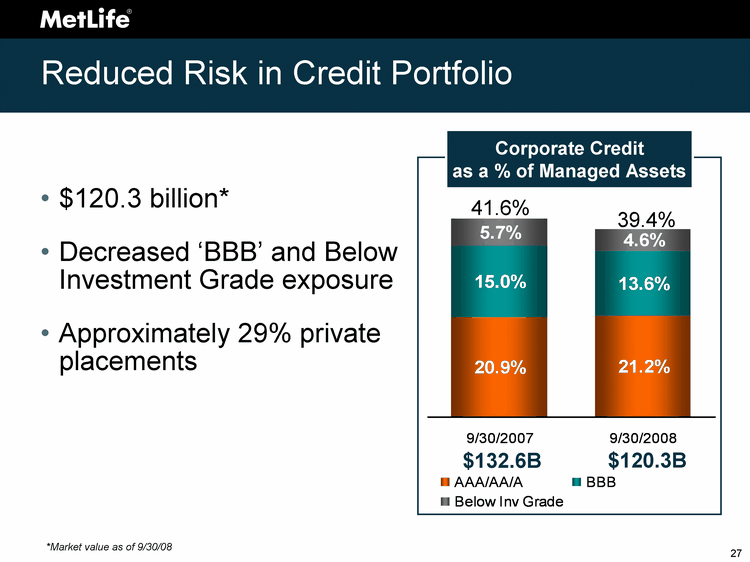
| Reduced Risk in Credit Portfolio $120.3 billion* Decreased 'BBB' and Below Investment Grade exposure Approximately 29% private placements 9/30/2007 9/30/2008 AAA/AA/A 0.209 0.212 BBB 0.15 0.1362 Below Inv Grade 0.057 0.0457 Corporate Credit as a % of Managed Assets 41.6% 39.4% $132.6B $120.3B *Market value as of 9/30/08 |
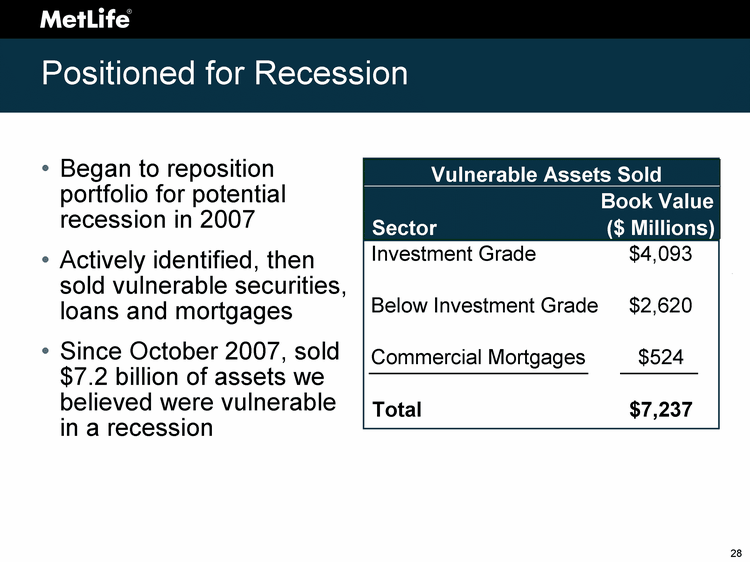
| Positioned for Recession Began to reposition portfolio for potential recession in 2007 Actively identified, then sold vulnerable securities, loans and mortgages Since October 2007, sold $7.2 billion of assets we believed were vulnerable in a recession Sector Book Value ($ Millions) Investment Grade $4,093 Below Investment Grade $2,620 Commercial Mortgages $524 Total $7,237 Vulnerable Assets Sold |
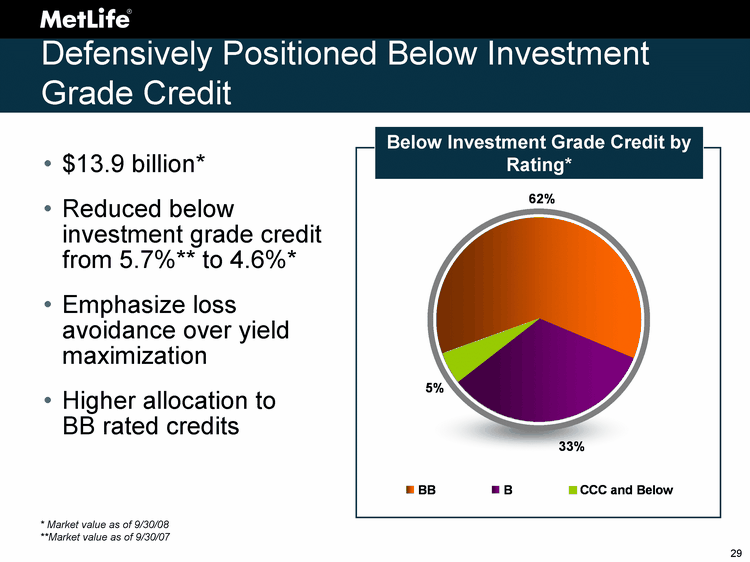
| Defensively Positioned Below Investment Grade Credit $13.9 billion* Reduced below investment grade credit from 5.7%** to 4.6%* Emphasize loss avoidance over yield maximization Higher allocation to BB rated credits BB B CCC and Below Other East 0.62 0.33 0.05 145 Below Investment Grade Credit by Rating* * Market value as of 9/30/08 **Market value as of 9/30/07 |
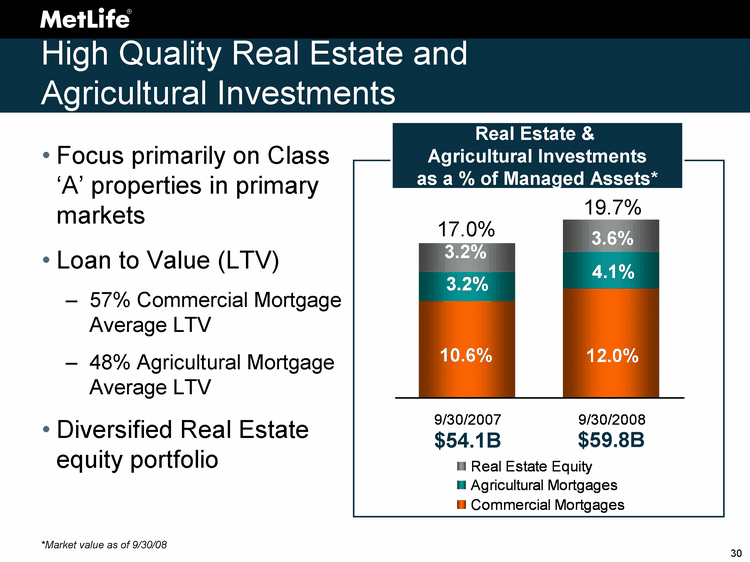
| High Quality Real Estate and Agricultural Investments 9/30/2007 9/30/2008 Commercial Mortgages 0.106 0.1195 Agricultural Mortgages 0.032 0.0406 Real Estate Equity 0.032 0.0357 Real Estate & Agricultural Investments as a % of Managed Assets* $54.1B $59.8B 3.2% 3.2% 10.6% 12.0% 4.1% 3.6% 19.7% 17.0% Focus primarily on Class 'A' properties in primary markets Loan to Value (LTV) 57% Commercial Mortgage Average LTV 48% Agricultural Mortgage Average LTV Diversified Real Estate equity portfolio *Market value as of 9/30/08 |

| 2003 2004 2005 2006 2007 2008 YTD MetLife LTV 0.65 0.66 0.63 0.62 0.61 0.55 CMBS LTV 0.723 0.725 0.727 0.73 0.71 0.7 70% CMBS LTV** Average Loan to Value Commercial Mortgage Portfolio Defensively Positioned $35.9 billion* Decreased portfolio LTV as market became more aggressive Underwritten to sustainable values and property incomes Only $2 million delinquent * Book value as of 9/30/08 **Source: Moody's Investor Service MetLife LTV MetLife LTV vs. Market LTV at Loan Origination |
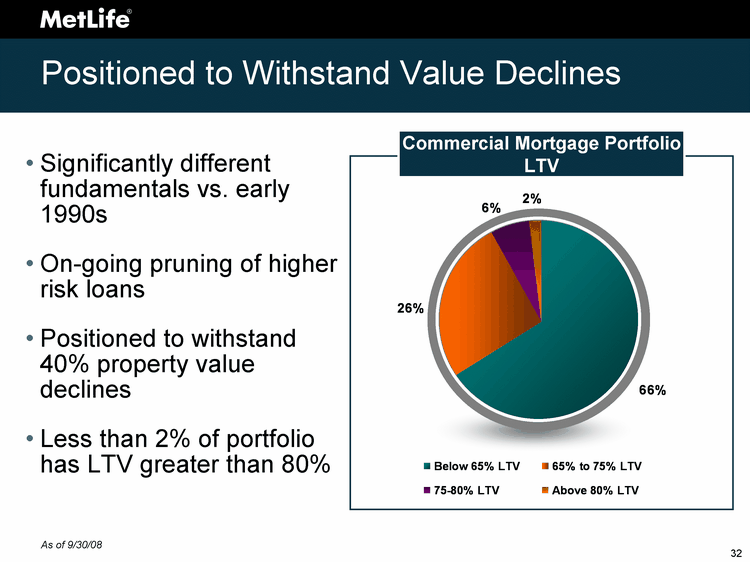
| Positioned to Withstand Value Declines Below 65% LTV 65% to 75% LTV 75-80% LTV Above 80% LTV MetLife LTV 0.66 0.26 0.06 0.02 Significantly different fundamentals vs. early 1990s On-going pruning of higher risk loans Positioned to withstand 40% property value declines Less than 2% of portfolio has LTV greater than 80% Commercial Mortgage Portfolio LTV As of 9/30/08 |

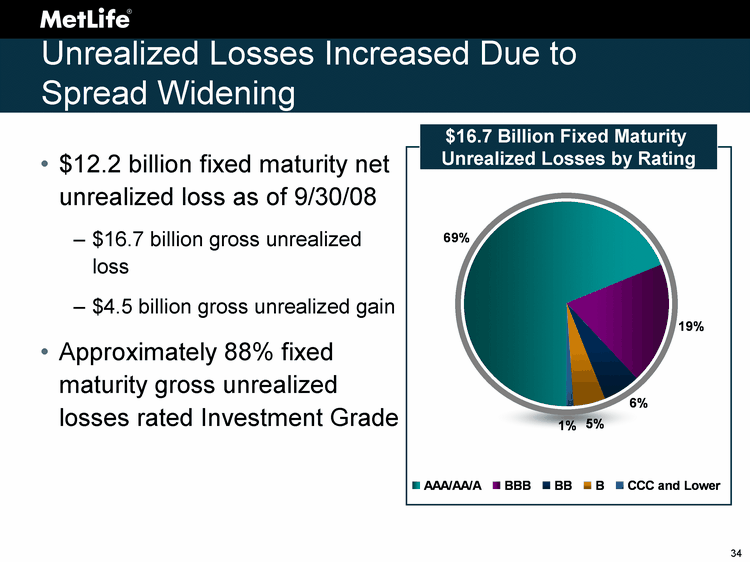
| Unrealized Losses Increased Due to Spread Widening $12.2 billion fixed maturity net unrealized loss as of 9/30/08 $16.7 billion gross unrealized loss $4.5 billion gross unrealized gain Approximately 88% fixed maturity gross unrealized losses rated Investment Grade AAA/AA/A BBB BB B CCC and Lower East -11508 -3226 -968 -828 -178 $16.7 Billion Fixed Maturity Unrealized Losses by Rating |
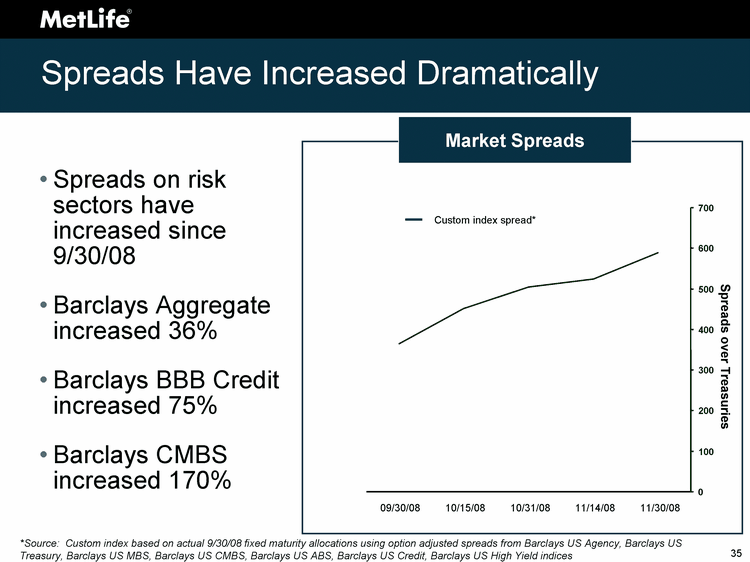
| Spreads over Treasuries Spreads Have Increased Dramatically *Source: Custom index based on actual 9/30/08 fixed maturity allocations using option adjusted spreads from Barclays US Agency, Barclays US Treasury, Barclays US MBS, Barclays US CMBS, Barclays US ABS, Barclays US Credit, Barclays US High Yield indices Spreads on risk sectors have increased since 9/30/08 Barclays Aggregate increased 36% Barclays BBB Credit increased 75% Barclays CMBS increased 170% Custom index spread* 09/30/08 10/15/08 10/31/08 11/14/08 11/30/08 0 100 200 300 400 500 600 700 Market Spreads |
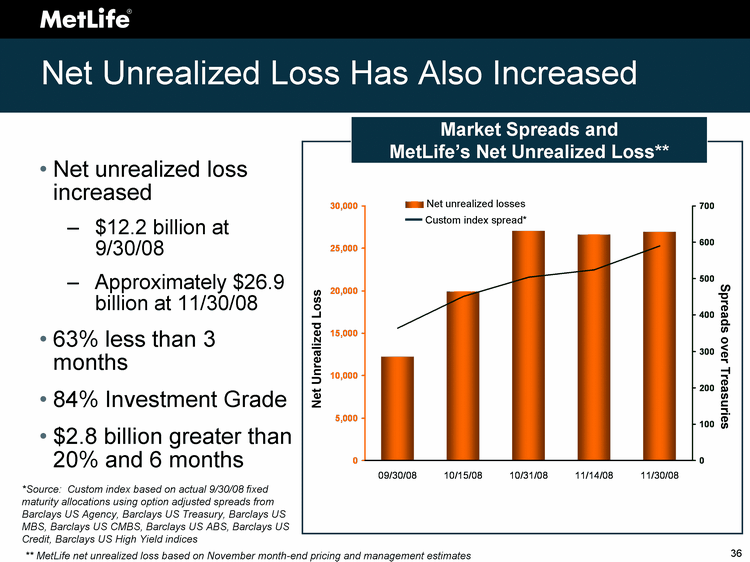
| Net Unrealized Loss Has Also Increased *Source: Custom index based on actual 9/30/08 fixed maturity allocations using option adjusted spreads from Barclays US Agency, Barclays US Treasury, Barclays US MBS, Barclays US CMBS, Barclays US ABS, Barclays US Credit, Barclays US High Yield indices Market Spreads and MetLife's Net Unrealized Loss** Net unrealized loss increased $12.2 billion at 9/30/08 Approximately $26.9 billion at 11/30/08 63% less than 3 months 84% Investment Grade $2.8 billion greater than 20% and 6 months Spreads over Treasuries ** MetLife net unrealized loss based on November month-end pricing and management estimates Net Unrealized Loss Net unrealized losses Custom index spread* |
| Loss Recognition Asset Liability Matching We buy assets to match our liabilities Hold the vast majority to maturity Robust process to identify credit impairments Creditworthiness of these securities has not fundamentally changed since 9/30/08 $200 - $300 million estimated Q408 after-tax impairments |
| Summary Diversified portfolio across fixed income, real estate, agricultural and equity sectors Focus on risk management, underwriting and proactive portfolio management Defensively positioned for current environment |


| William J. Wheeler Executive Vice President & Chief Financial Officer |
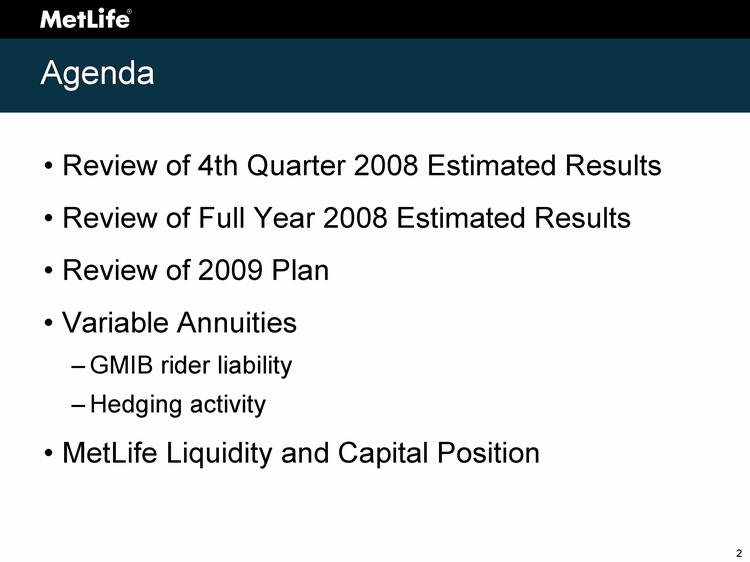
| Agenda Review of 4th Quarter 2008 Estimated Results Review of Full Year 2008 Estimated Results Review of 2009 Plan Variable Annuities GMIB rider liability Hedging activity MetLife Liquidity and Capital Position |
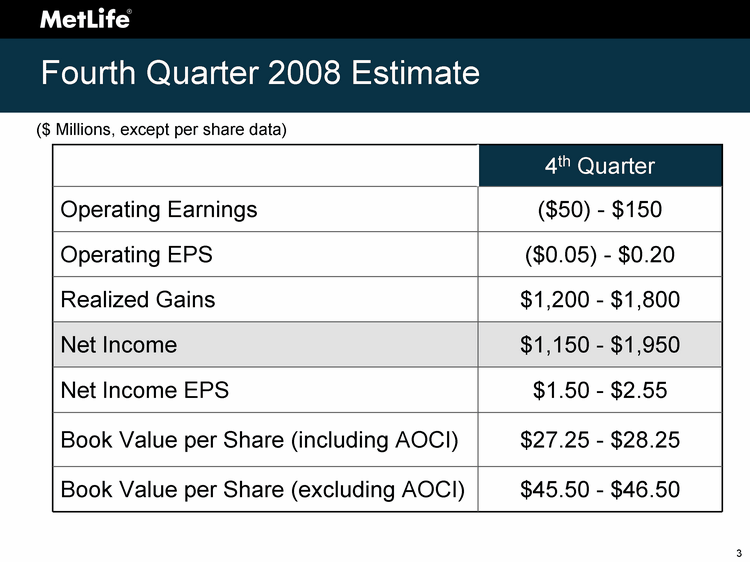
| Fourth Quarter 2008 Estimate ($ Millions, except per share data) 4th Quarter Operating Earnings ($50) - $150 Operating EPS ($0.05) - $0.20 Realized Gains $1,200 - $1,800 Net Income $1,150 - $1,950 Net Income EPS $1.50 - $2.55 Book Value per Share (including AOCI) $27.25 - $28.25 Book Value per Share (excluding AOCI) $45.50 - $46.50 |
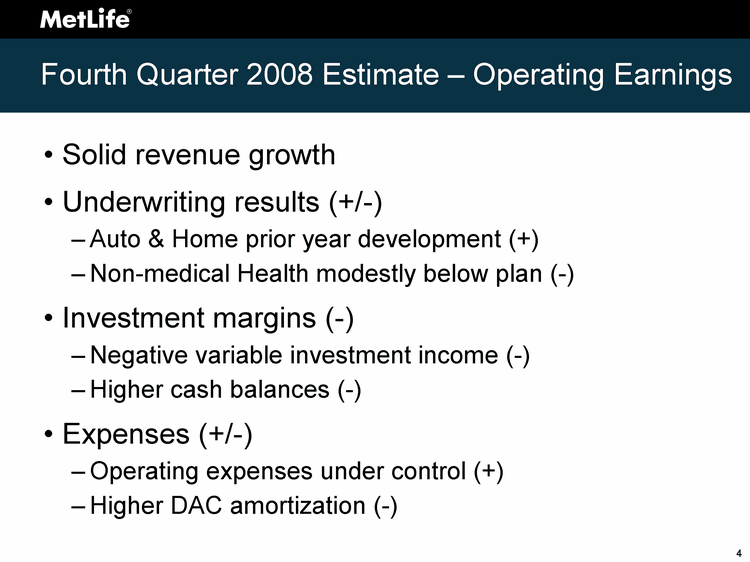
| Fourth Quarter 2008 Estimate - Operating Earnings Solid revenue growth Underwriting results (+/-) Auto & Home prior year development (+) Non-medical Health modestly below plan (-) Investment margins (-) Negative variable investment income (-) Higher cash balances (-) Expenses (+/-) Operating expenses under control (+) Higher DAC amortization (-) |

| Fourth Quarter 2008 Estimate - Realized Gains Relatively modest credit losses Very substantial derivative gains Interest rate floors Currency |

| 2008 Operating EPS Estimate See Appendix for non-GAAP financial information definitions and/or reconciliations. 2008 Operating EPS Estimated 4th Quarter ($0.05) - $0.20 First 9 Months 2008 $3.56 Estimated Full Year 2008 $3.50 - $3.75 |
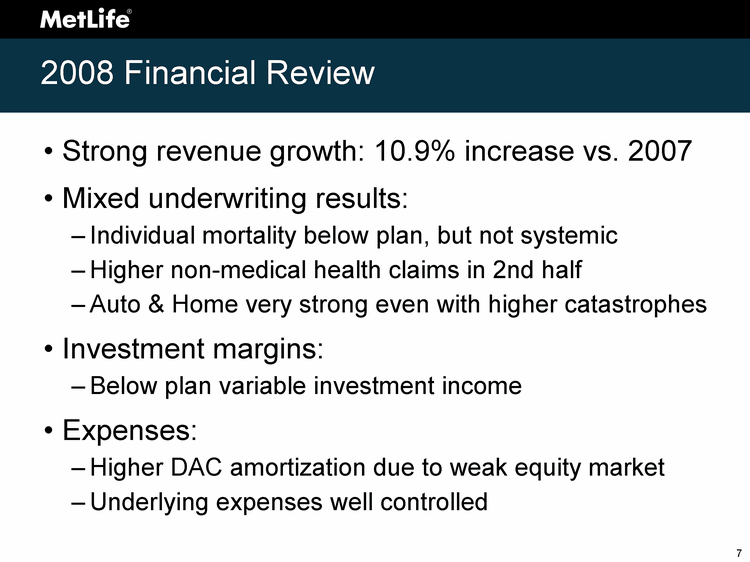
| 2008 Financial Review Strong revenue growth: 10.9% increase vs. 2007 Mixed underwriting results: Individual mortality below plan, but not systemic Higher non-medical health claims in 2nd half Auto & Home very strong even with higher catastrophes Investment margins: Below plan variable investment income Expenses: Higher DAC amortization due to weak equity market Underlying expenses well controlled |
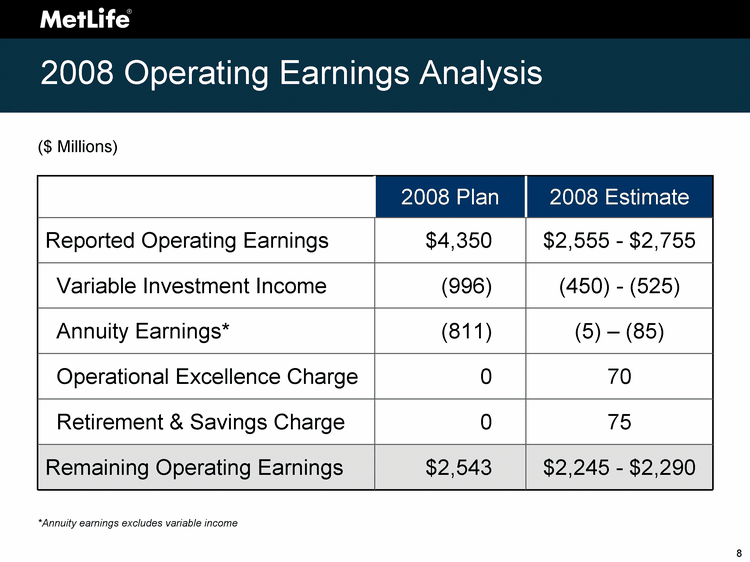
| 2008 Operating Earnings Analysis ($ Millions) *Annuity earnings excludes variable income 2008 Plan 2008 Estimate Reported Operating Earnings $4,350 $2,555 - $2,755 Variable Investment Income (996) (450) - (525) Annuity Earnings* (811) (5) - (85) Operational Excellence Charge 0 70 Retirement & Savings Charge 0 75 Remaining Operating Earnings $2,543 $2,245 - $2,290 |
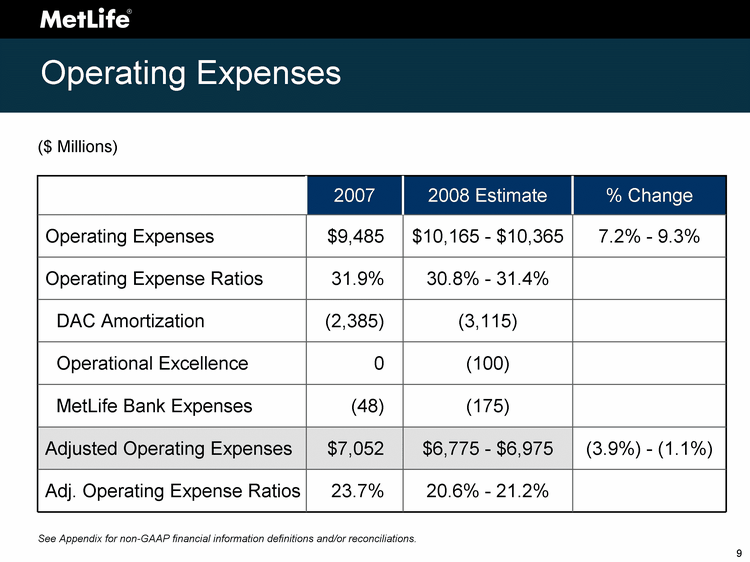
| Operating Expenses ($ Millions) 2007 2008 Estimate % Change Operating Expenses $9,485 $10,165 - $10,365 7.2% - 9.3% Operating Expense Ratios 31.9% 30.8% - 31.4% DAC Amortization (2,385) (3,115) Operational Excellence 0 (100) MetLife Bank Expenses (48) (175) Adjusted Operating Expenses $7,052 $6,775 - $6,975 (3.9%) - (1.1%) Adj. Operating Expense Ratios 23.7% 20.6% - 21.2% See Appendix for non-GAAP financial information definitions and/or reconciliations. |
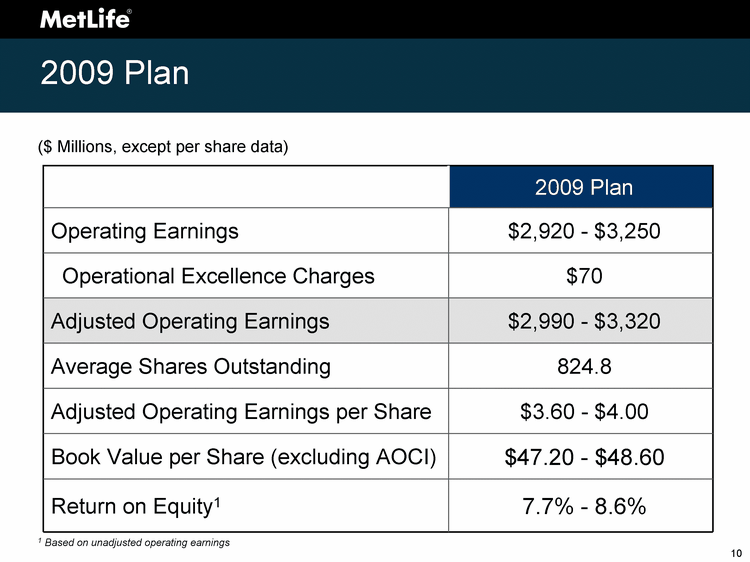
| 2009 Plan ($ Millions, except per share data) 2009 Plan Operating Earnings $2,920 - $3,250 Operational Excellence Charges $70 Adjusted Operating Earnings $2,990 - $3,320 Average Shares Outstanding 824.8 Adjusted Operating Earnings per Share $3.60 - $4.00 Book Value per Share (excluding AOCI) $47.20 - $48.60 Return on Equity1 7.7% - 8.6% 1 Based on unadjusted operating earnings |
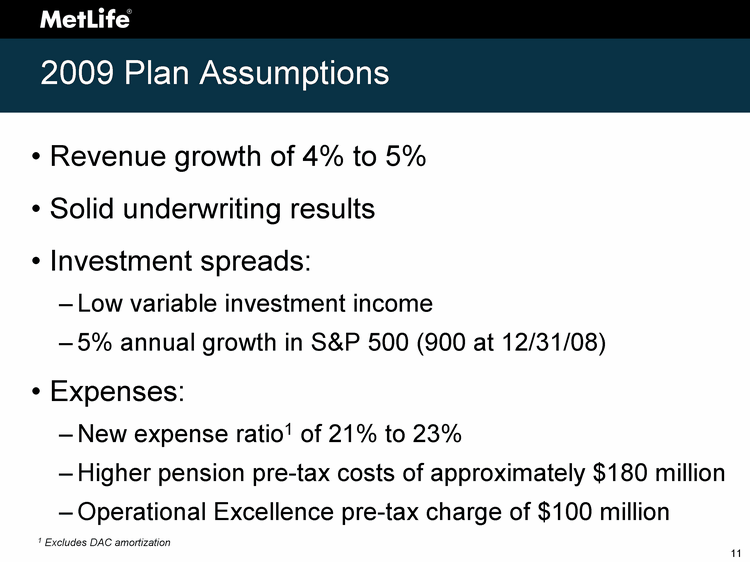
| 2009 Plan Assumptions Revenue growth of 4% to 5% Solid underwriting results Investment spreads: Low variable investment income 5% annual growth in S&P 500 (900 at 12/31/08) Expenses: New expense ratio1 of 21% to 23% Higher pension pre-tax costs of approximately $180 million Operational Excellence pre-tax charge of $100 million 1 Excludes DAC amortization |
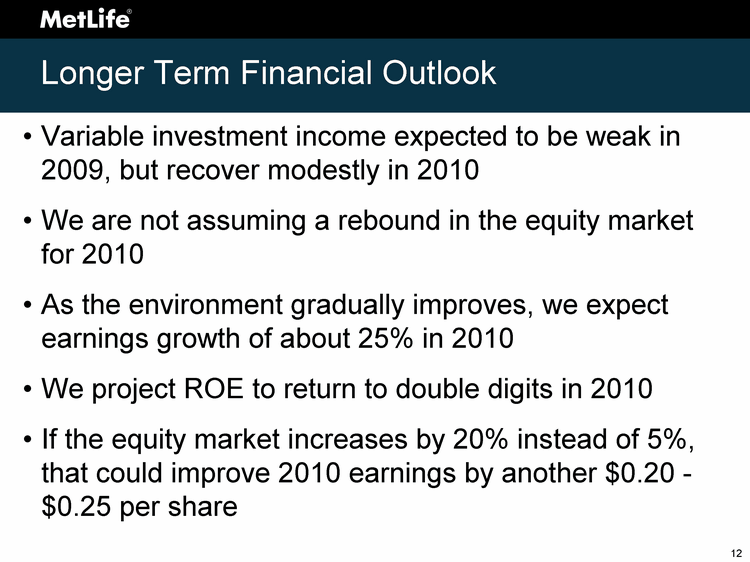
| Longer Term Financial Outlook Variable investment income expected to be weak in 2009, but recover modestly in 2010 We are not assuming a rebound in the equity market for 2010 As the environment gradually improves, we expect earnings growth of about 25% in 2010 We project ROE to return to double digits in 2010 If the equity market increases by 20% instead of 5%, that could improve 2010 earnings by another $0.20 - $0.25 per share |
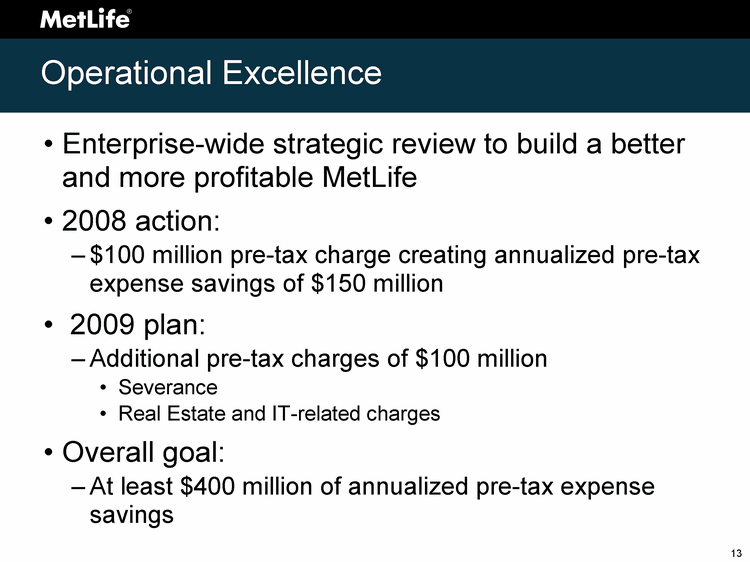
| Operational Excellence Enterprise-wide strategic review to build a better and more profitable MetLife 2008 action: $100 million pre-tax charge creating annualized pre-tax expense savings of $150 million 2009 plan: Additional pre-tax charges of $100 million Severance Real Estate and IT-related charges Overall goal: At least $400 million of annualized pre-tax expense savings |
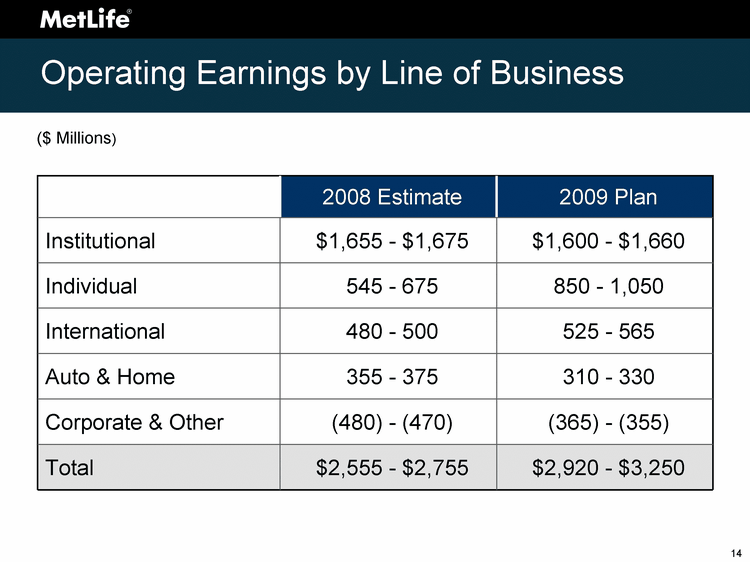
| Operating Earnings by Line of Business ($ Millions) 2008 Estimate 2009 Plan Institutional $1,655 - $1,675 $1,600 - $1,660 Individual 545 - 675 850 - 1,050 International 480 - 500 525 - 565 Auto & Home 355 - 375 310 - 330 Corporate & Other (480) - (470) (365) - (355) Total $2,555 - $2,755 $2,920 - $3,250 |
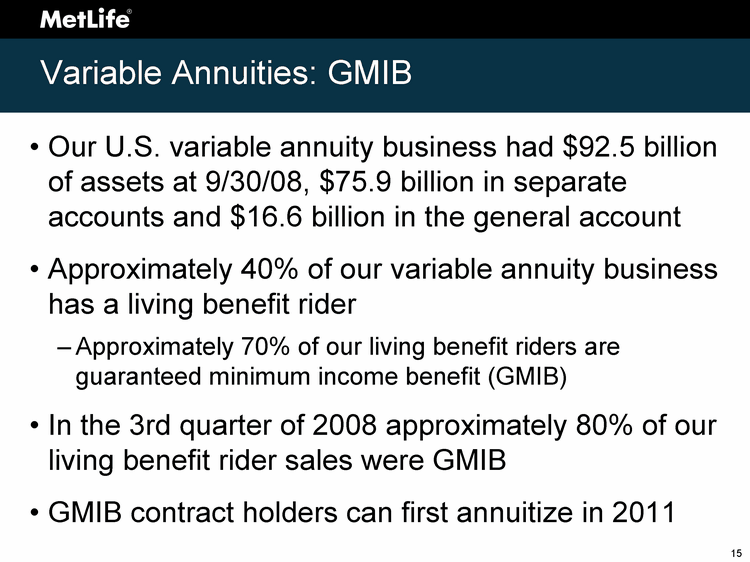
| Variable Annuities: GMIB Our U.S. variable annuity business had $92.5 billion of assets at 9/30/08, $75.9 billion in separate accounts and $16.6 billion in the general account Approximately 40% of our variable annuity business has a living benefit rider Approximately 70% of our living benefit riders are guaranteed minimum income benefit (GMIB) In the 3rd quarter of 2008 approximately 80% of our living benefit rider sales were GMIB GMIB contract holders can first annuitize in 2011 |
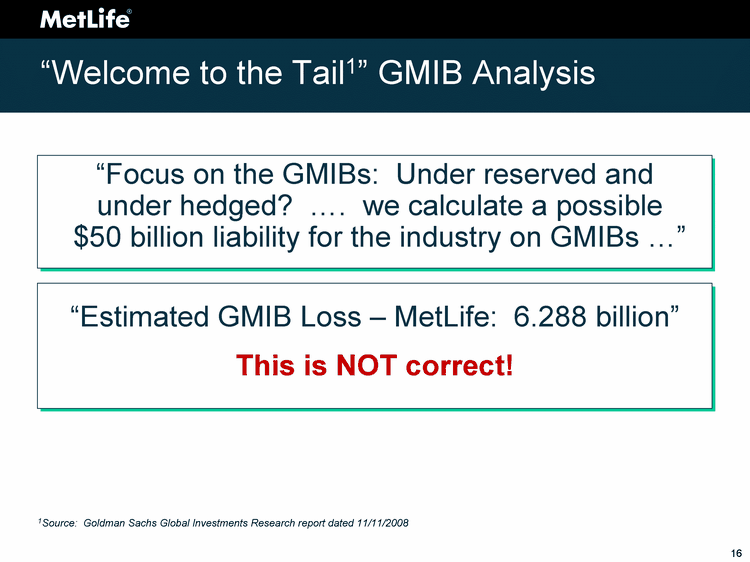
| "Welcome to the Tail1" GMIB Analysis 1Source: Goldman Sachs Global Investments Research report dated 11/11/2008 "Focus on the GMIBs: Under reserved and under hedged? .... we calculate a possible $50 billion liability for the industry on GMIBs ..." "Estimated GMIB Loss - MetLife: 6.288 billion" This is NOT correct! |
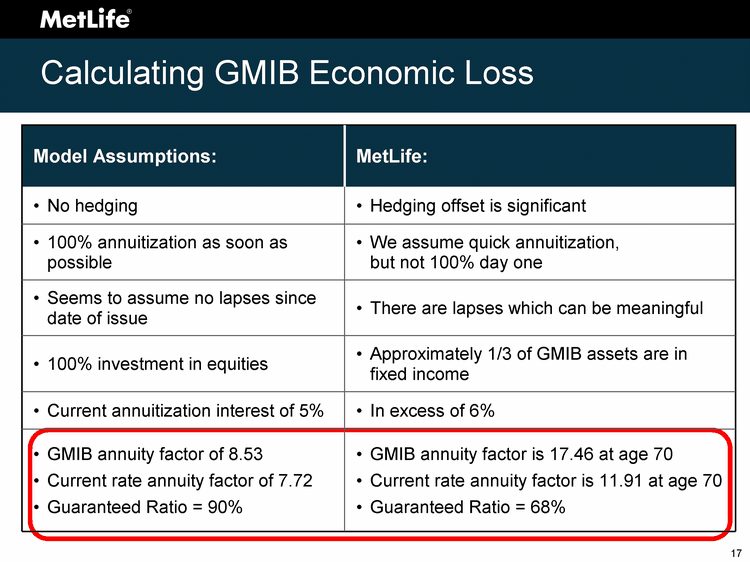
| Calculating GMIB Economic Loss Model Assumptions: MetLife: No hedging Hedging offset is significant 100% annuitization as soon as possible We assume quick annuitization, but not 100% day one Seems to assume no lapses since date of issue There are lapses which can be meaningful 100% investment in equities Approximately 1/3 of GMIB assets are in fixed income Current annuitization interest of 5% In excess of 6% GMIB annuity factor of 8.53 Current rate annuity factor of 7.72 Guaranteed Ratio = 90% GMIB annuity factor is 17.46 at age 70 Current rate annuity factor is 11.91 at age 70 Guaranteed Ratio = 68% |
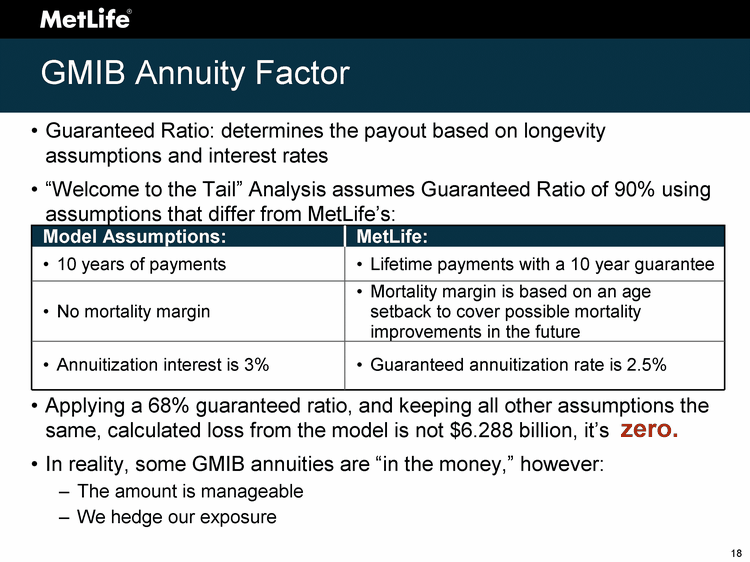
| GMIB Annuity Factor Guaranteed Ratio: determines the payout based on longevity assumptions and interest rates "Welcome to the Tail" Analysis assumes Guaranteed Ratio of 90% using assumptions that differ from MetLife's: Applying a 68% guaranteed ratio, and keeping all other assumptions the same, calculated loss from the model is not $6.288 billion, it's In reality, some GMIB annuities are "in the money," however: The amount is manageable We hedge our exposure zero. Model Assumptions: MetLife: 10 years of payments Lifetime payments with a 10 year guarantee No mortality margin Mortality margin is based on an age setback to cover possible mortality improvements in the future Annuitization interest is 3% Guaranteed annuitization rate is 2.5% |
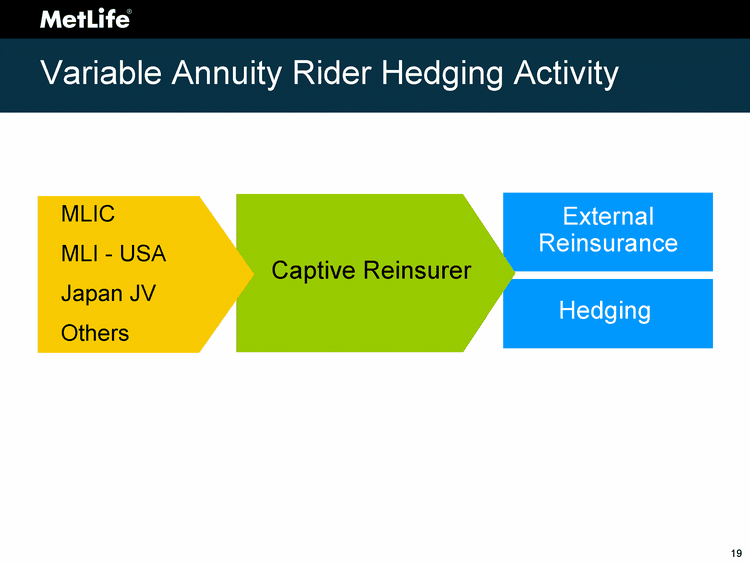
| Variable Annuity Rider Hedging Activity Captive Reinsurer External Reinsurance Hedging MLIC MLI - USA Japan JV Others |
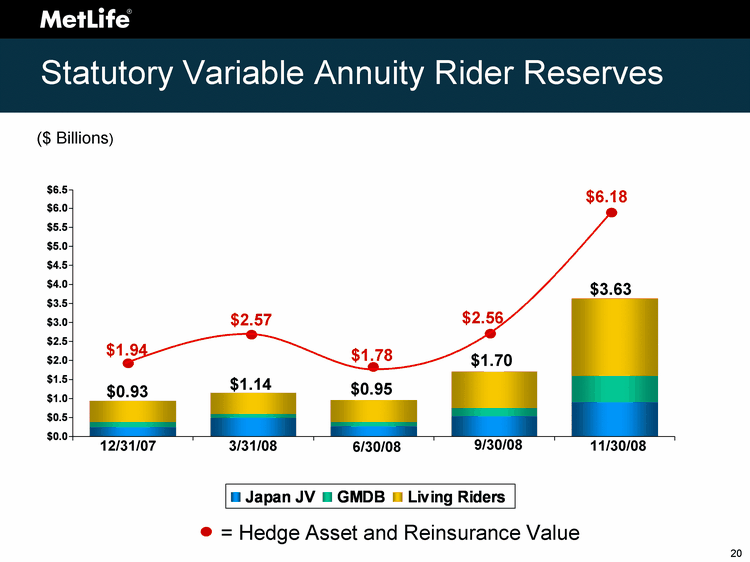
| Statutory Variable Annuity Rider Reserves = Hedge Asset and Reinsurance Value 12/31/07 3/31/08 6/30/08 9/30/08 11/30/08 $0.93 $1.14 $0.95 $3.63 $1.94 $2.57 $1.78 $1.70 $6.18 $2.56 ($ Billions) |
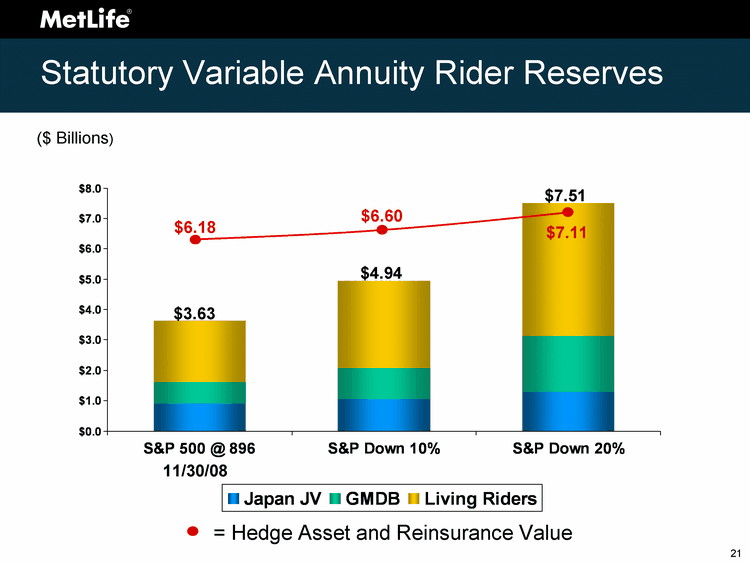
| S&P 500 @ 896 S&P Down 10% S&P Down 20% Japan JV 0.896 1.061 1.294 GMDB 0.705 1.014 1.845 Living Riders 2.026 2.864 4.37 Statutory Variable Annuity Rider Reserves $3.63 $4.94 $7.51 ($ Billions) $6.18 $6.60 $7.11 11/30/08 = Hedge Asset and Reinsurance Value |
| Variable Annuity Hedging MetLife has a strong and effective hedge program Why have we been successful? We did what we said we would do (3 Greeks) We hedged our Japanese products Regulation 128 has been adjusted Variable annuity riders and hedging are manageable capital issues |
| Liquidity Cash At 9/30/08 = $20.2 billion Current balance at 11/30/08 ^ $27 billion Securities lending At 9/30/08 = $41.2 billion Current balance at 11/30/08 = $26.8 billion Lapses in insurance products are declining or stable No debt maturities in the near term |
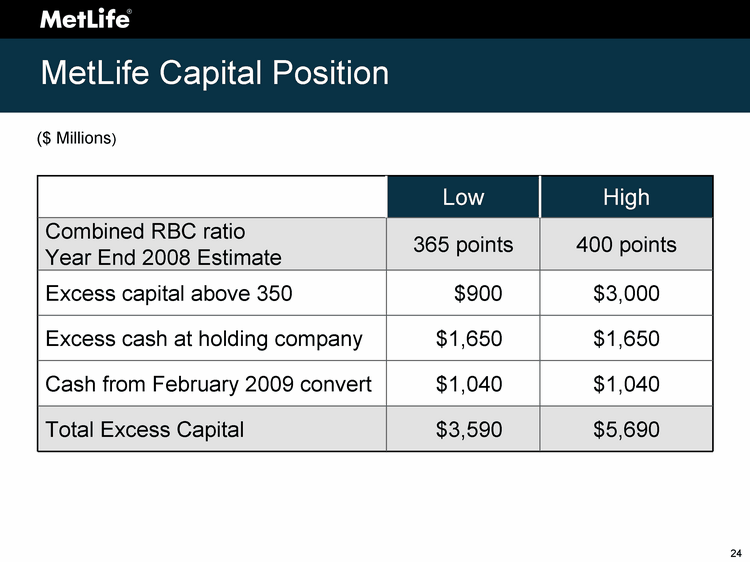
| MetLife Capital Position Low High Combined RBC ratio Year End 2008 Estimate 365 points 400 points Excess capital above 350 $900 $3,000 Excess cash at holding company $1,650 $1,650 Cash from February 2009 convert $1,040 $1,040 Total Excess Capital $3,590 $5,690 ($ Millions) |
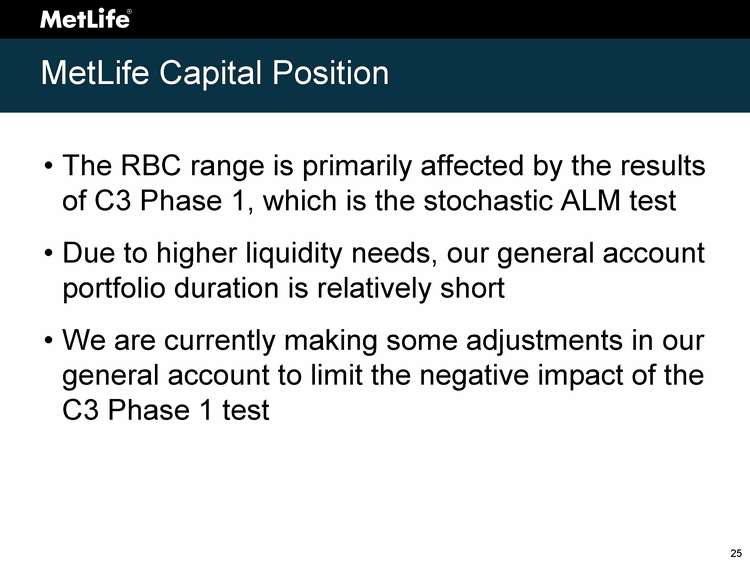
| MetLife Capital Position The RBC range is primarily affected by the results of C3 Phase 1, which is the stochastic ALM test Due to higher liquidity needs, our general account portfolio duration is relatively short We are currently making some adjustments in our general account to limit the negative impact of the C3 Phase 1 test |
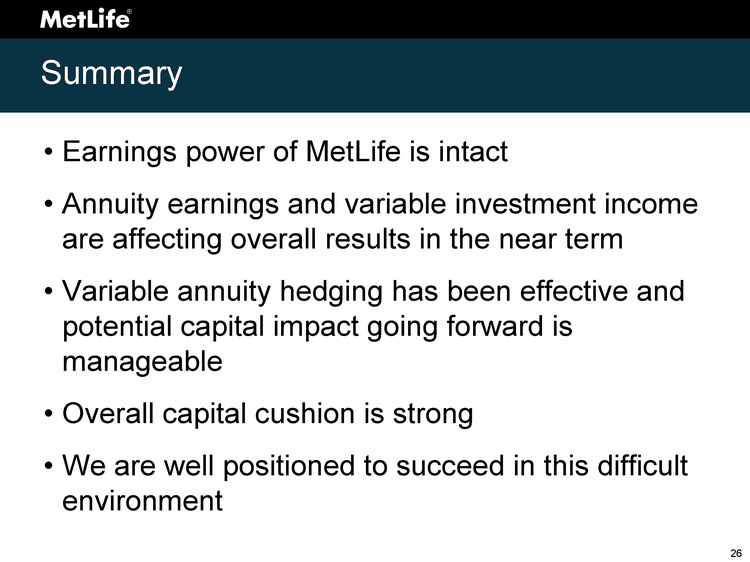
| Summary Earnings power of MetLife is intact Annuity earnings and variable investment income are affecting overall results in the near term Variable annuity hedging has been effective and potential capital impact going forward is manageable Overall capital cushion is strong We are well positioned to succeed in this difficult environment |

| William J. Mullaney President Institutional Business |
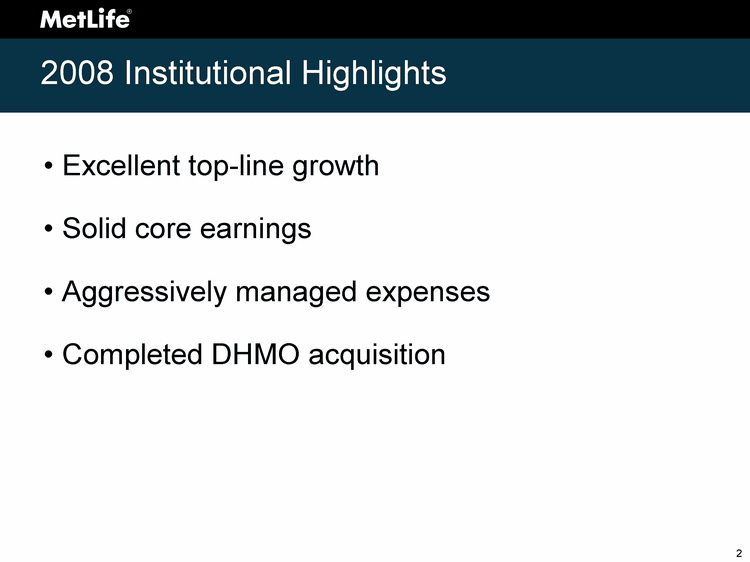
| 2008 Institutional Highlights Excellent top-line growth Solid core earnings Aggressively managed expenses Completed DHMO acquisition |
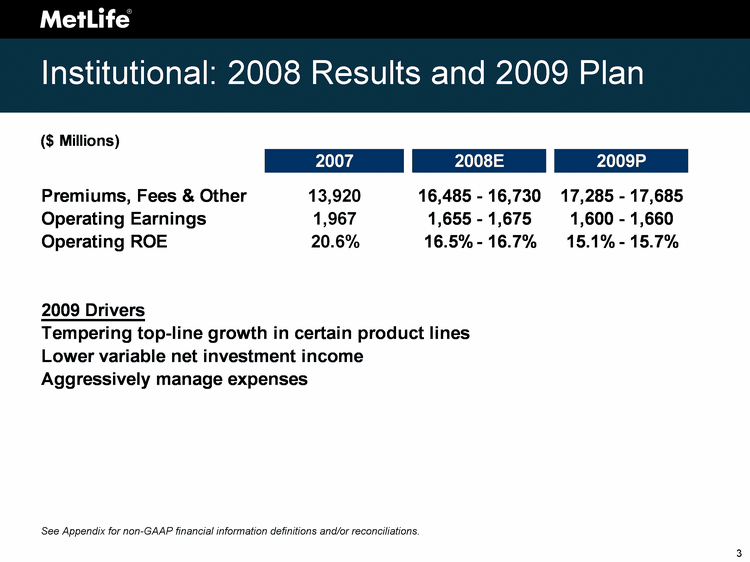
| Institutional: 2008 Results and 2009 Plan See Appendix for non-GAAP financial information definitions and/or reconciliations. |
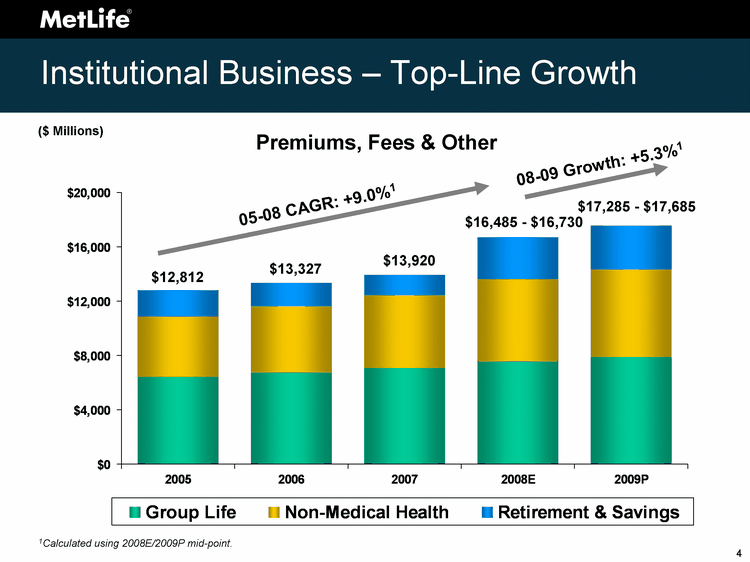
| Institutional Business - Top-Line Growth 2005 2006 2007 2008E 2009P Group Life 6444 6754 7100 7570 7880 Non-Medical Health 4430 4842 5324 6070 6440 Retirement & Savings 1938 1731 1496 3045 3265 ($ Millions) $12,812 $13,327 $13,920 $17,285 - $17,685 $16,485 - $16,730 05-08 CAGR: +9.0%1 08-09 Growth: +5.3%1 1Calculated using 2008E/2009P mid-point. Premiums, Fees & Other |
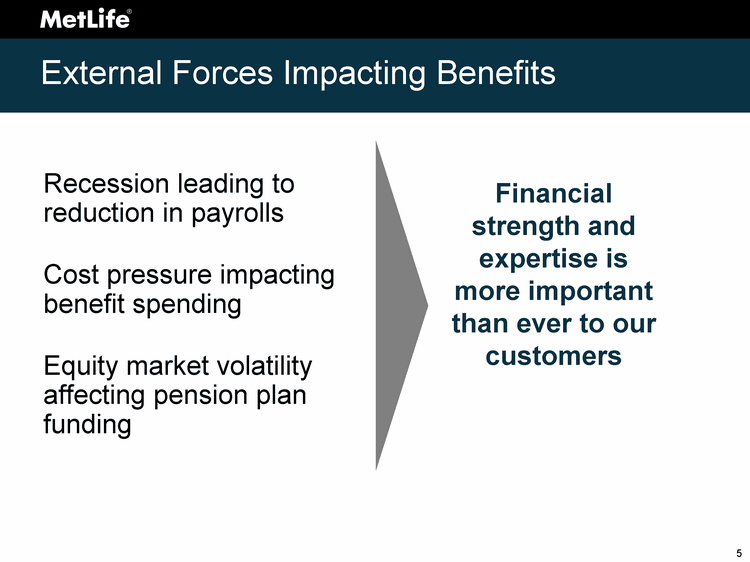
| External Forces Impacting Benefits Financial strength and expertise is more important than ever to our customers Recession leading to reduction in payrolls Cost pressure impacting benefit spending Equity market volatility affecting pension plan funding |
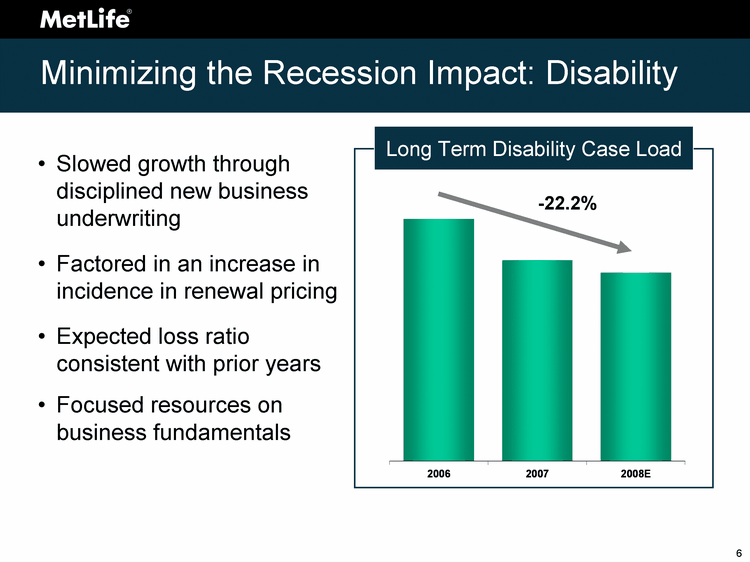
| Minimizing the Recession Impact: Disability Slowed growth through disciplined new business underwriting Factored in an increase in incidence in renewal pricing Expected loss ratio consistent with prior years Focused resources on business fundamentals 2006 2007 2008E Actual 135 112 105 - -22.2% Long Term Disability Case Load |
| Managing Institutional for Long-term Growth Unmatched customer relationships Careful risk selection Disciplined pricing Sophisticated asset-liability management |
| Group Life - Differentiation and Discipline Comprehensive set of products and services Consultative approach Continuous innovation and investment Sound pricing and underwriting |
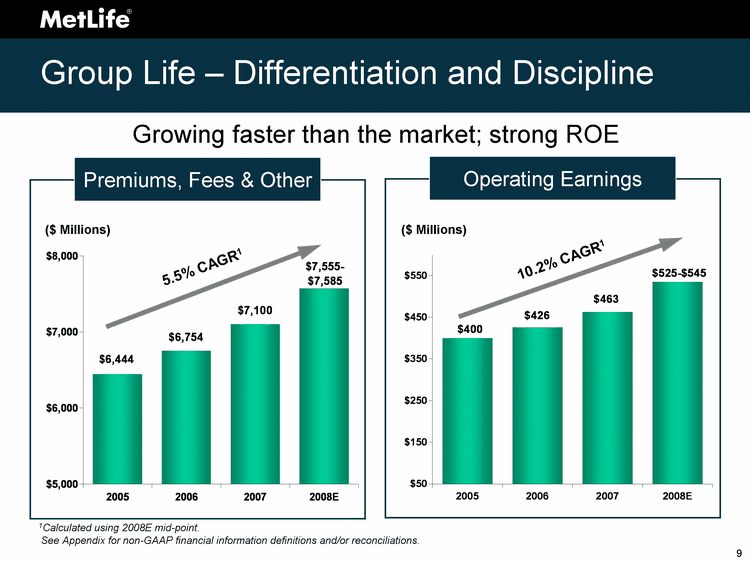
| 2005 2006 2007 2008E Earnings 400 426 463 535 2005 2006 2007 2008E Premiums & Fees 6444 6754 7100 7570 Group Life - Differentiation and Discipline Growing faster than the market; strong ROE 5.5% CAGR1 ($ Millions) ($ Millions) 10.2% CAGR1 See Appendix for non-GAAP financial information definitions and/or reconciliations. Operating Earnings Premiums, Fees & Other 1Calculated using 2008E mid-point. |

| Growth in the Dental Business Double digit top-line growth High ROE Broader product portfolio Preferred Provider Organization (PPO) Dental Health Maintenance Organization (DHMO) Voluntary Retiree Significant opportunities for continued growth |
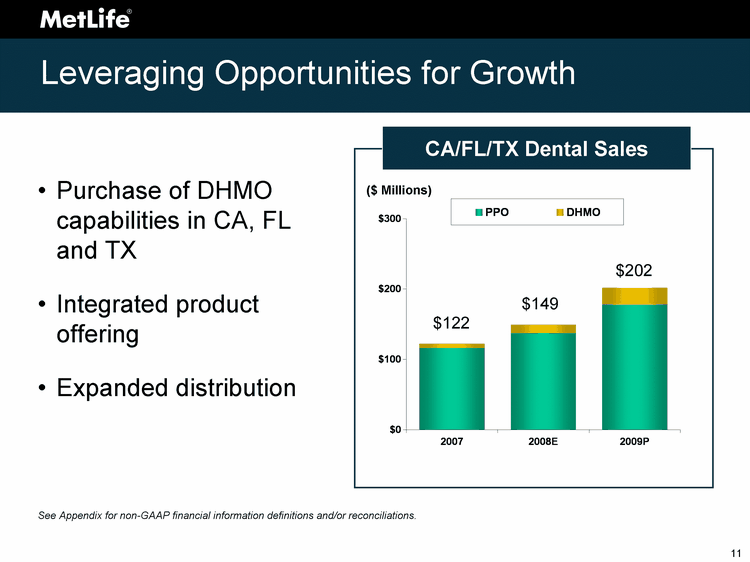
| Leveraging Opportunities for Growth Purchase of DHMO capabilities in CA, FL and TX Integrated product offering Expanded distribution 2007 2008E 2009P PPO 116 137 178 DHMO 6 12 24 $122 $149 $202 See Appendix for non-GAAP financial information definitions and/or reconciliations. CA/FL/TX Dental Sales ($ Millions) |
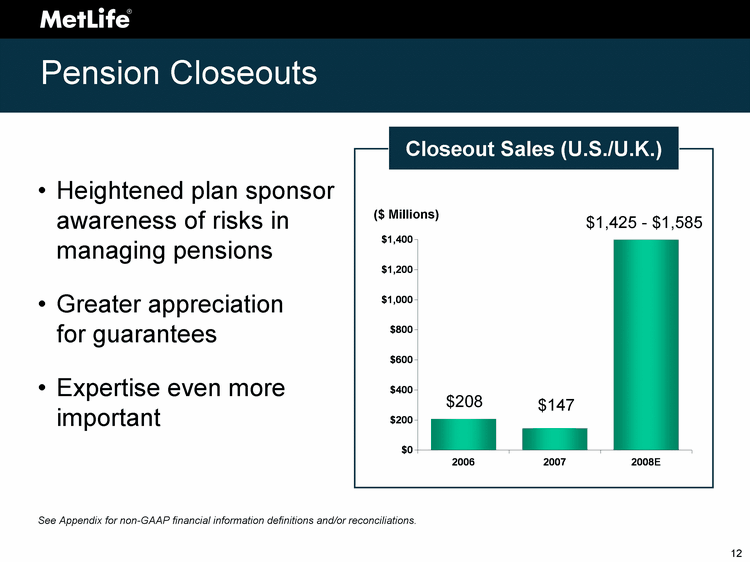
| Pension Closeouts Heightened plan sponsor awareness of risks in managing pensions Greater appreciation for guarantees Expertise even more important 2006 2007 2008E 207.5 147 1583 $208 $147 $1,425 - $1,585 ($ Millions) See Appendix for non-GAAP financial information definitions and/or reconciliations. Closeout Sales (U.S./U.K.) |

| Institutional Operational Excellence Initiatives Market segmentation Broker penetration strategy Distribution enhancements Small market strategy Operational re-engineering Process automation Sourcing of work Process re-engineering Deployment of workflow capabilities |
| Institutional Business: Focus for 2009 Maintain strong business fundamentals Invest in long-term growth opportunities Aggressively manage expenses Continue to tell our story in the market |


| Lisa Weber President Individual Business |
| 2008 Individual Business Highlights Strengthened leading VA market position Improved life market share and increased margins Grew affiliated distribution capacity Drove more sales through key third-party firms Improved operational efficiencies |
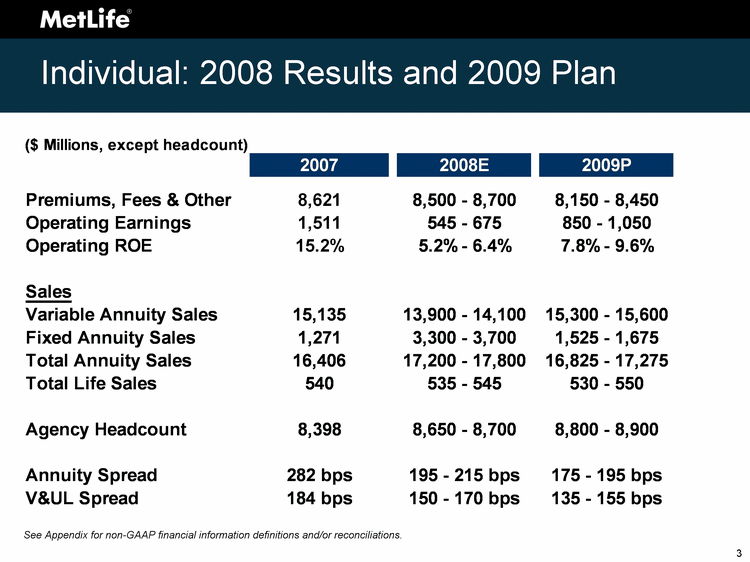
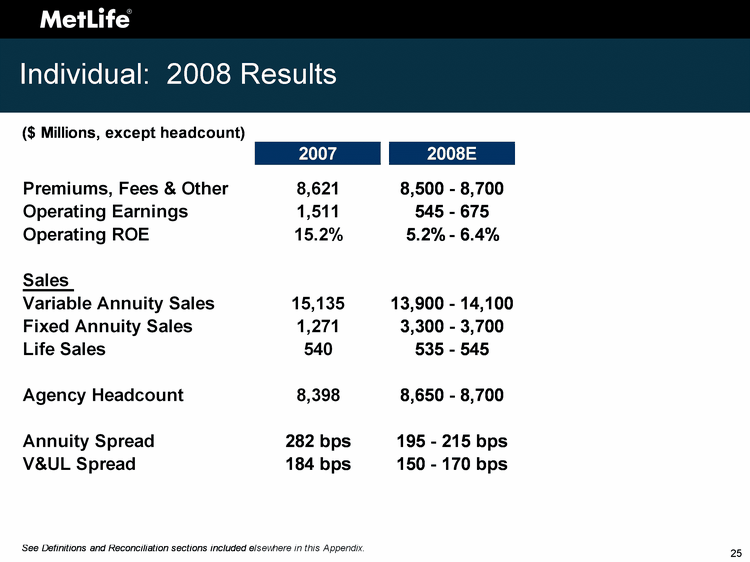
| Individual: 2008 Results and 2009 Plan See Appendix for non-GAAP financial information definitions and/or reconciliations. |
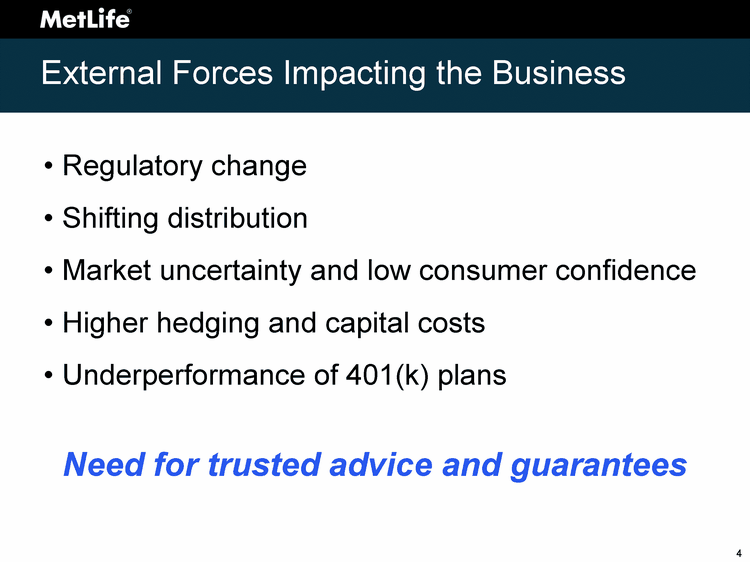
| External Forces Impacting the Business Regulatory change Shifting distribution Market uncertainty and low consumer confidence Higher hedging and capital costs Underperformance of 401(k) plans Need for trusted advice and guarantees |
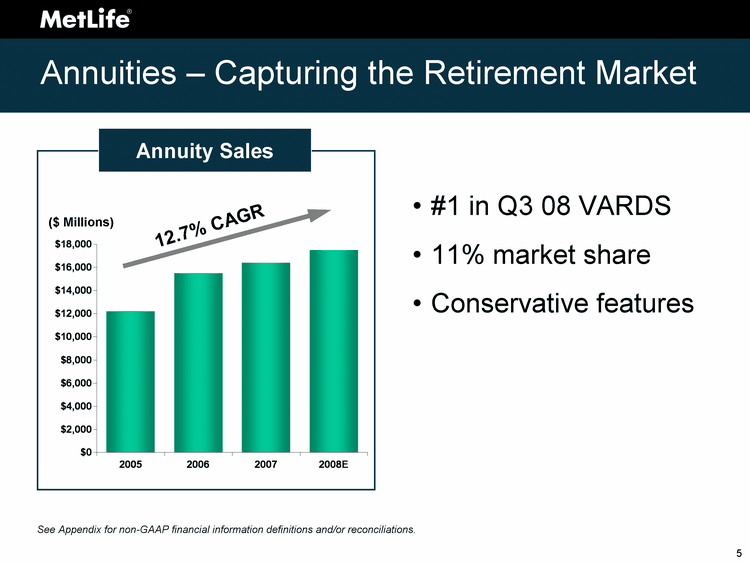
| Annuity Sales Annuities - Capturing the Retirement Market #1 in Q3 08 VARDS 11% market share Conservative features See Appendix for non-GAAP financial information definitions and/or reconciliations. 2005 2006 2007 2008E Annuity Sales 12223 15496 16406 17500 ($ Millions) 12.7% CAGR |
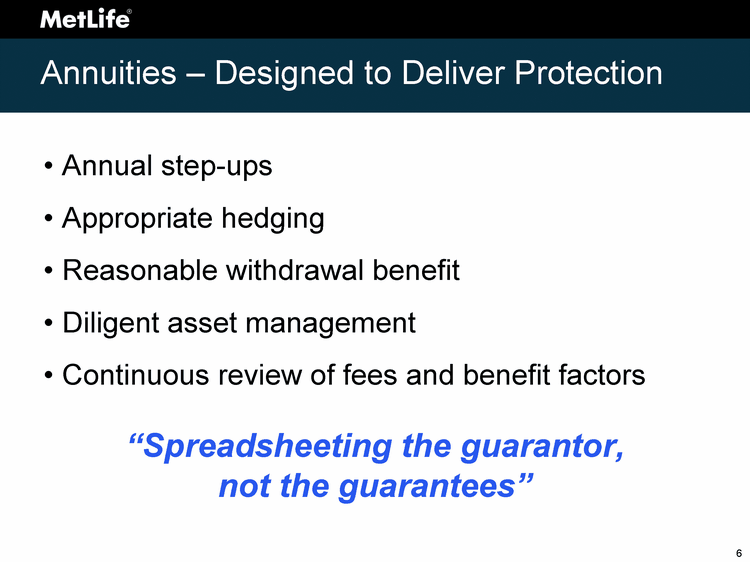
| Annuities - Designed to Deliver Protection Annual step-ups Appropriate hedging Reasonable withdrawal benefit Diligent asset management Continuous review of fees and benefit factors "Spreadsheeting the guarantor, not the guarantees" |

| Life - Growing Share, Driving Margins #5 in Q3 08 LIMRA 5% market share Rebuilt product portfolio Higher prices at older ages See Appendix for non-GAAP financial information definitions and/or reconciliations. 2005 2006 2007 2008E Life Sales 549 521 540 540 ($ Millions) Life Sales |
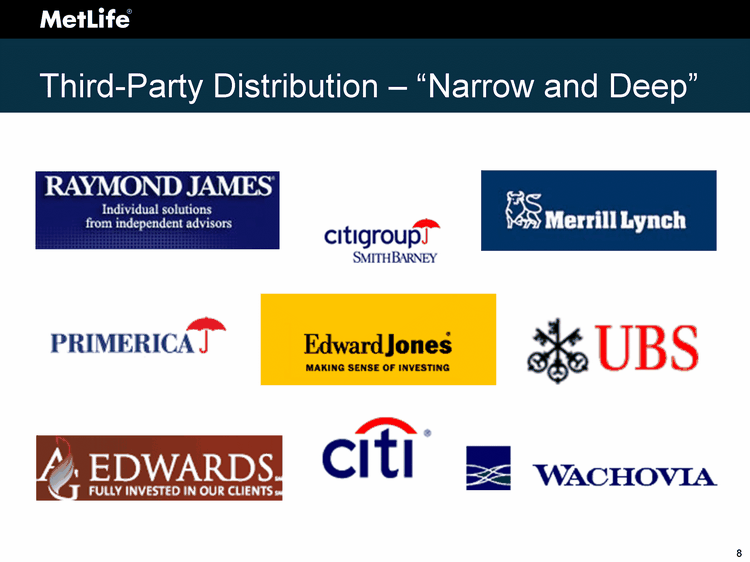
| Third-Party Distribution - "Narrow and Deep" |

| Affiliated Distribution - Blue-Chip Team Strong selection Industry-leading retention Strong local infrastructure Large existing client base High agent productivity Data include MetLife and New England Financial channels. 2005 2006 2007 2008E Salespower 7810 8003 8398 8675 8,650 - 8,700 Agent Headcount |
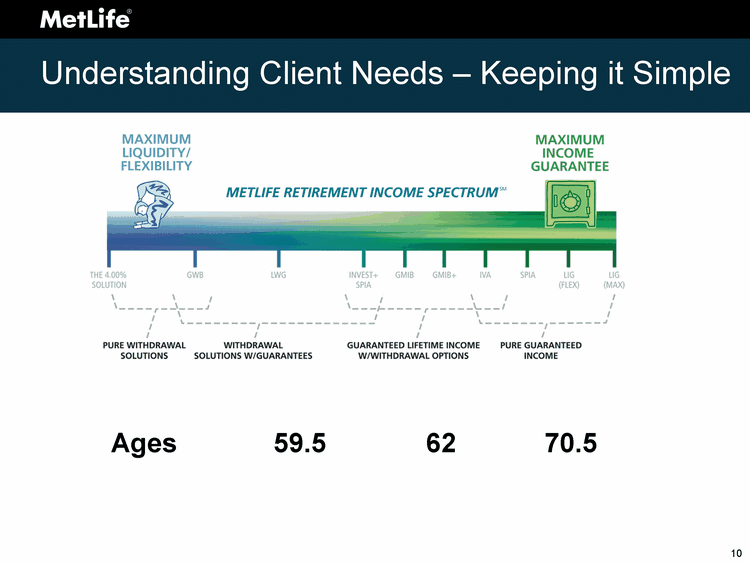
| Understanding Client Needs - Keeping it Simple 59.5 62 70.5 Retirement Ages |
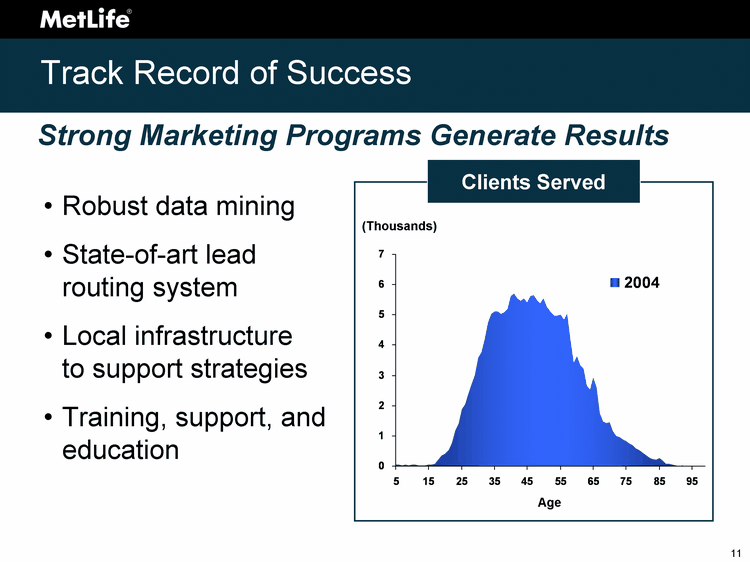
| Track Record of Success Strong Marketing Programs Generate Results Robust data mining State-of-art lead routing system Local infrastructure to support strategies Training, support, and education Clients Served Age Age 2007 2004 1 182 96 2 60 44 3 43 39 4 51 60 5 46 50 6 40 43 7 61 39 8 68 50 9 43 30 10 45 49 11 33 46 12 29 37 13 36 37 14 32 40 15 31 43 16 39 43 17 40 90 18 173 208 19 361 339 20 431 408 21 642 536 22 990 793 23 1331 1172 24 1798 1398 25 2289 1873 26 2506 2039 27 2795 2402 28 3224 2713 29 3474 3023 30 3910 3585 31 4232 3774 32 4406 4206 33 4870 4749 34 4963 5026 35 5390 5103 36 5699 5104 37 5671 5030 38 5650 5085 39 5607 5195 40 5408 5636 41 5464 5713 42 5590 5546 43 5885 5474 44 5918 5549 45 5956 5419 46 5935 5629 47 5703 5659 48 5534 5503 49 5948 5395 50 6426 5549 51 5897 5285 52 5453 5083 53 5489 4987 54 5171 4988 55 5698 5019 56 5257 4843 57 4819 5048 58 4743 4178 59 5053 3407 60 5679 3626 61 4302 3335 62 3805 3234 63 3342 2657 64 3259 2525 65 4179 2927 66 3513 2619 67 2405 1747 68 2027 1469 69 2150 1419 70 2351 1441 71 1918 1161 72 1384 992 73 1223 965 74 1159 895 75 1109 840 76 1054 743 77 907 706 78 777 589 79 719 549 80 608 468 81 457 368 82 346 288 83 302 252 84 280 228 85 373 260 86 209 193 87 88 82 88 54 68 89 35 48 90 33 38 91 14 10 92 9 14 93 8 6 94 6 7 95 2 5 96 7 3 97 1 2 98 2 2 99 1 1 (Thousands) |

| Track Record of Success Strong Marketing Programs Generate Results Robust data mining State-of-art lead routing system Local infrastructure to support strategies Training, support, and education Clients Served 70 65 Age Age 2007 2004 1 182 96 2 60 44 3 43 39 4 51 60 5 46 50 6 40 43 7 61 39 8 68 50 9 43 30 10 45 49 11 33 46 12 29 37 13 36 37 14 32 40 15 31 43 16 39 43 17 40 90 18 173 208 19 361 339 20 431 408 21 642 536 22 990 793 23 1331 1172 24 1798 1398 25 2289 1873 26 2506 2039 27 2795 2402 28 3224 2713 29 3474 3023 30 3910 3585 31 4232 3774 32 4406 4206 33 4870 4749 34 4963 5026 35 5390 5103 36 5699 5104 37 5671 5030 38 5650 5085 39 5607 5195 40 5408 5636 41 5464 5713 42 5590 5546 43 5885 5474 44 5918 5549 45 5956 5419 46 5935 5629 47 5703 5659 48 5534 5503 49 5948 5395 50 6426 5549 51 5897 5285 52 5453 5083 53 5489 4987 54 5171 4988 55 5698 5019 56 5257 4843 57 4819 5048 58 4743 4178 59 5053 3407 60 5679 3626 61 4302 3335 62 3805 3234 63 3342 2657 64 3259 2525 65 4179 2927 66 3513 2619 67 2405 1747 68 2027 1469 69 2150 1419 70 2351 1441 71 1918 1161 72 1384 992 73 1223 965 74 1159 895 75 1109 840 76 1054 743 77 907 706 78 777 589 79 719 549 80 608 468 81 457 368 82 346 288 83 302 252 84 280 228 85 373 260 86 209 193 87 88 82 88 54 68 89 35 48 90 33 38 91 14 10 92 9 14 93 8 6 94 6 7 95 2 5 96 7 3 97 1 2 98 2 2 99 1 1 (Thousands) 50 55 60 |
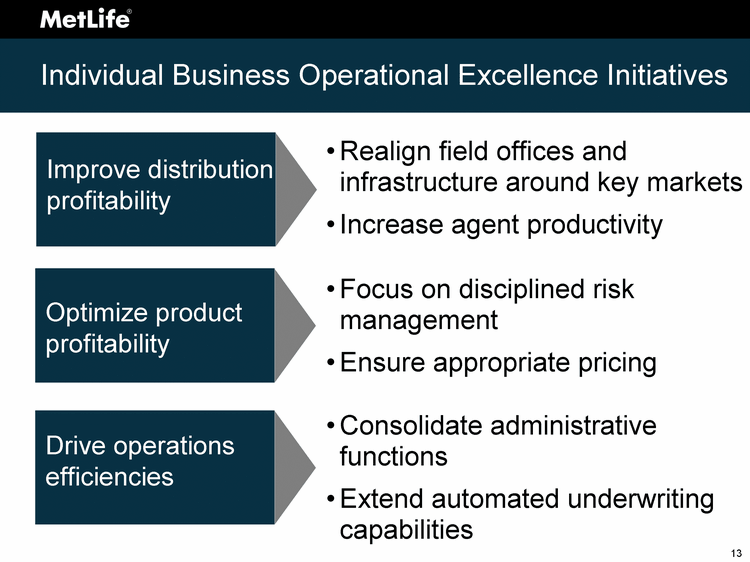
| Individual Business Operational Excellence Initiatives Realign field offices and infrastructure around key markets Increase agent productivity Improve distribution profitability Focus on disciplined risk management Ensure appropriate pricing Consolidate administrative functions Extend automated underwriting capabilities Optimize product profitability Drive operations efficiencies |
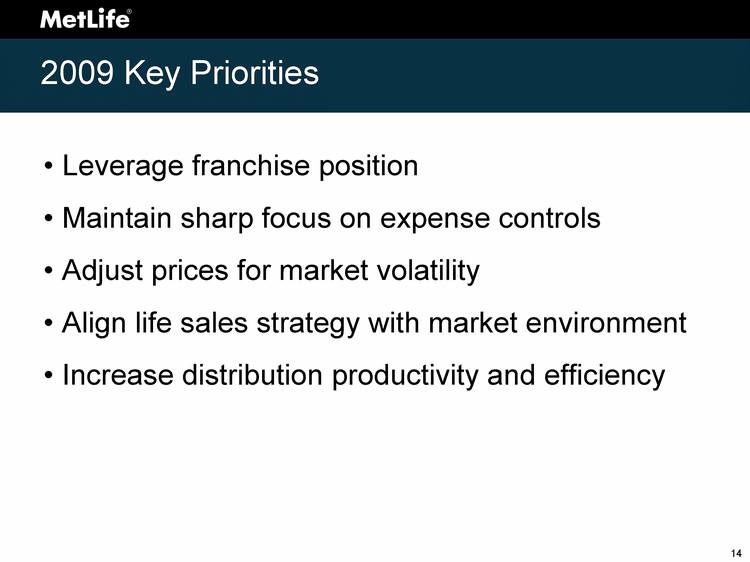
| 2009 Key Priorities Leverage franchise position Maintain sharp focus on expense controls Adjust prices for market volatility Align life sales strategy with market environment Increase distribution productivity and efficiency |
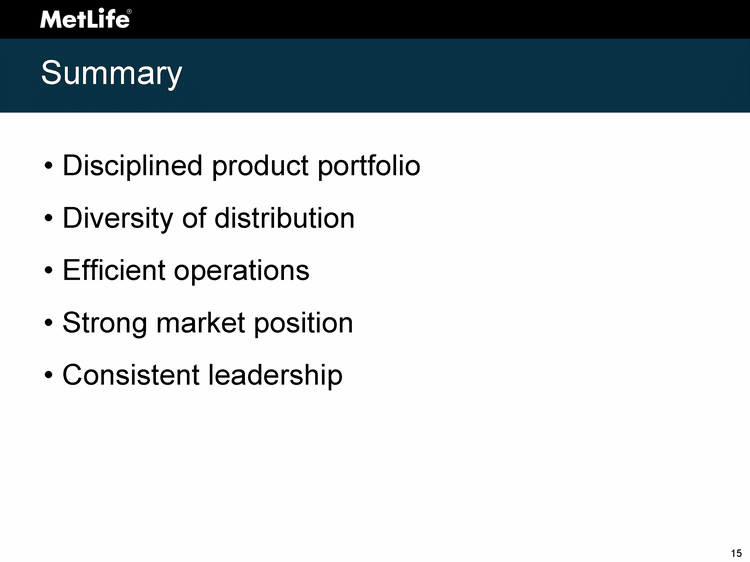
| Summary Disciplined product portfolio Diversity of distribution Efficient operations Strong market position Consistent leadership |

| Bill Toppeta President International |
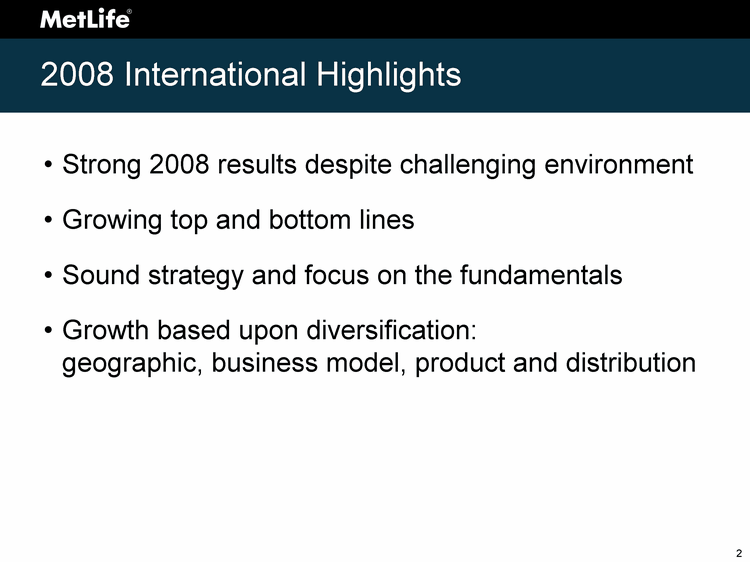
| 2008 International Highlights Strong 2008 results despite challenging environment Growing top and bottom lines Sound strategy and focus on the fundamentals Growth based upon diversification: geographic, business model, product and distribution |
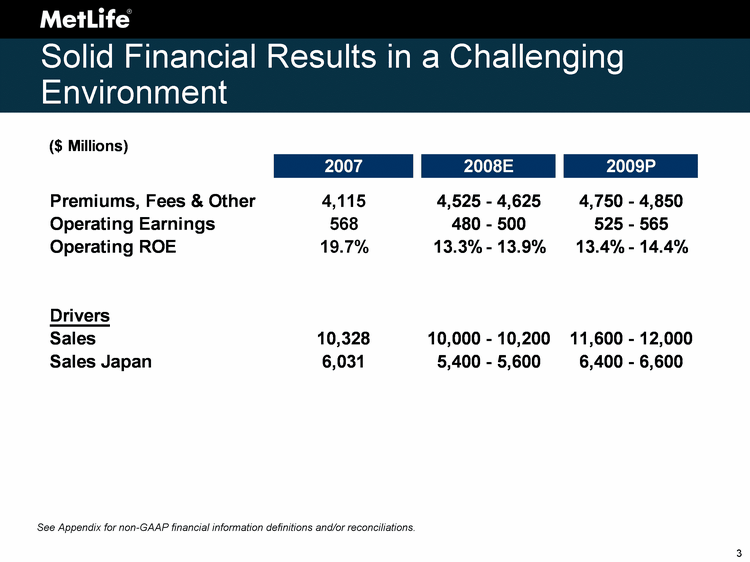
| Solid Financial Results in a Challenging Environment See Appendix for non-GAAP financial information definitions and/or reconciliations. |
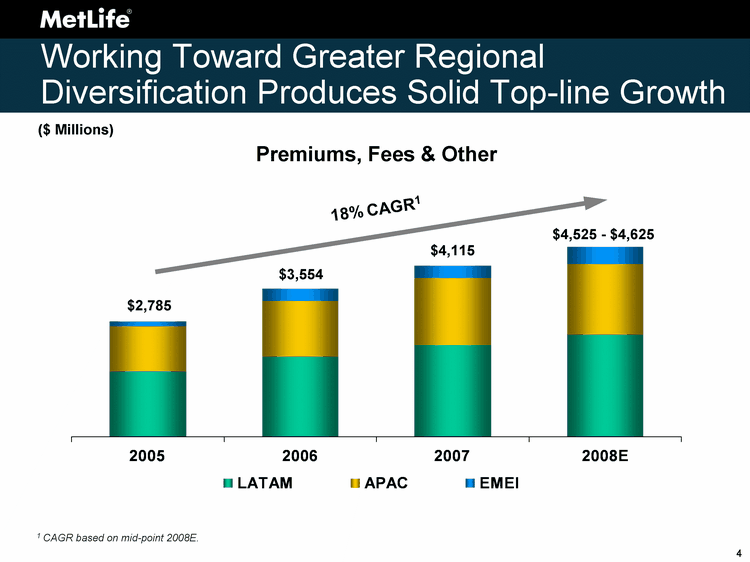
| Working Toward Greater Regional Diversification Produces Solid Top-line Growth 1 CAGR based on mid-point 2008E. 2005 2006 2007 2008E LATAM 1583.8 1925.3 2203.7 2461.7 APAC 1070.2 1345.3 1607.2 1700.4 EMEI 130.8 284.7 303.5 410.3 18% CAGR1 $2,785 $3,554 $4,115 $4,525 - $4,625 ($ Millions) Premiums, Fees & Other |
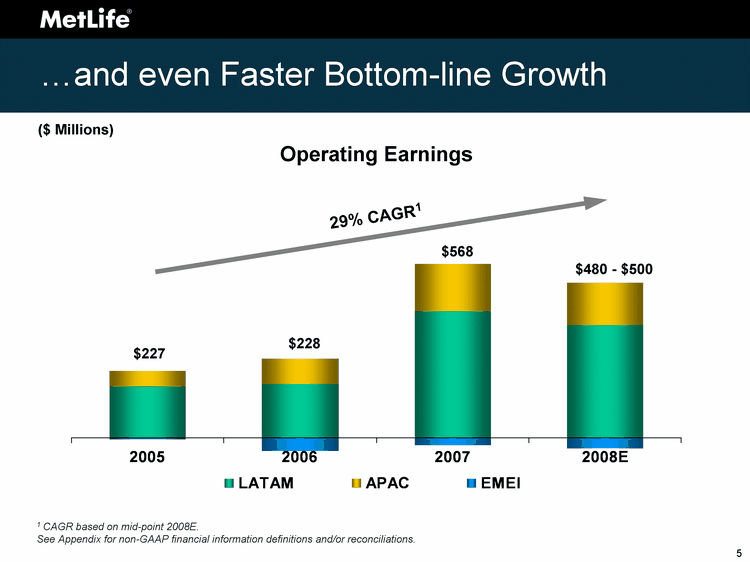
| ....and even Faster Bottom-line Growth 2005 2006 2007 2008E LATAM 172 180 423 377 APAC 51 84 160 143 EMEI -6 -45 -26 -37 29% CAGR1 ($ Millions) Operating Earnings $227 $228 $568 $480 - $500 1 CAGR based on mid-point 2008E. See Appendix for non-GAAP financial information definitions and/or reconciliations. |
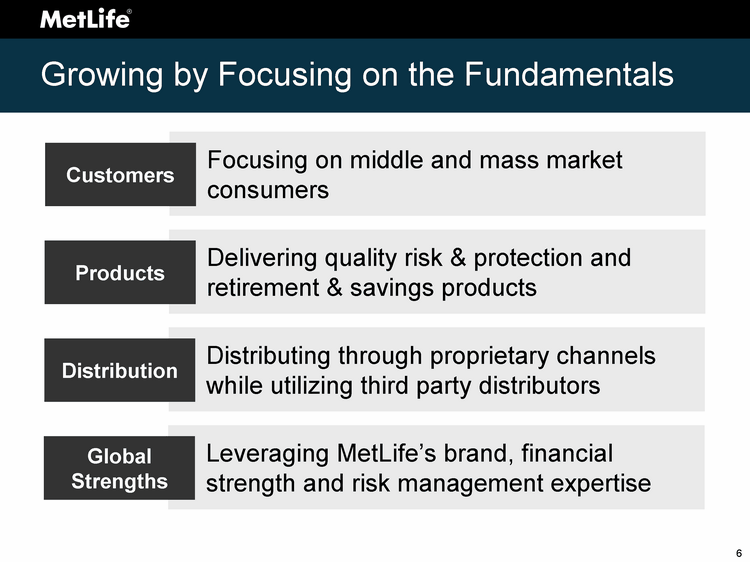
| Growing by Focusing on the Fundamentals Focusing on middle and mass market consumers Customers Delivering quality risk & protection and retirement & savings products Products Distributing through proprietary channels while utilizing third party distributors Distribution Leveraging MetLife's brand, financial strength and risk management expertise Global Strengths |

| Diversified Business Models - A Source of Strength and Stability Mexico: Government workers Group Life and Major Medical Savings products distributed at the worksite Paid through automatic payroll deduction Chile: Middle and mass market customers Fixed pay-out annuities Group Life and Accident & Health Sold through brokers and our exclusive partnership with Banco Estado Brazil: Middle and mass affluent customers Life, Accident & Health and now Dental insurance Sold through banks and retail brokers Plus a powerful Group Life business |
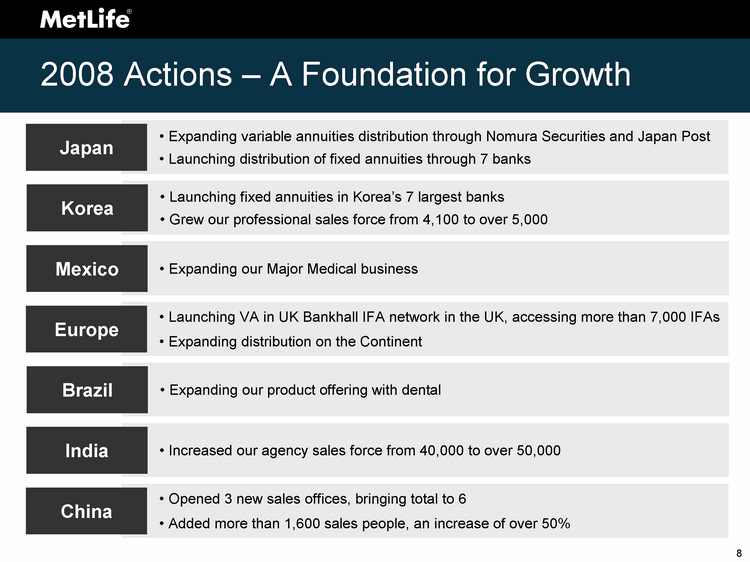
| 2008 Actions - A Foundation for Growth Expanding variable annuities distribution through Nomura Securities and Japan Post Launching distribution of fixed annuities through 7 banks Launching fixed annuities in Korea's 7 largest banks Grew our professional sales force from 4,100 to over 5,000 Expanding our Major Medical business Launching VA in UK Bankhall IFA network in the UK, accessing more than 7,000 IFAs Expanding distribution on the Continent Expanding our product offering with dental Increased our agency sales force from 40,000 to over 50,000 Opened 3 new sales offices, bringing total to 6 Added more than 1,600 sales people, an increase of over 50% Japan Korea Mexico Europe Brazil India China |
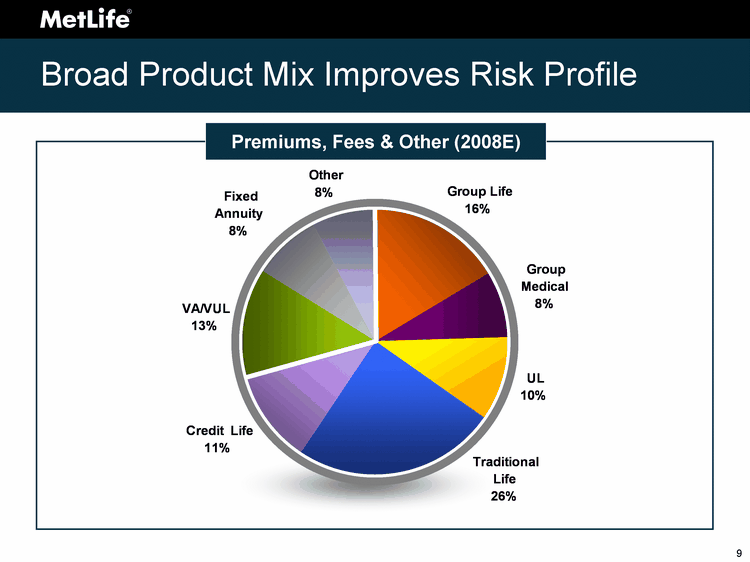
| Broad Product Mix Improves Risk Profile Premiums, Fees & Other (2008E) 2009 Group Life 774.2 Group Medical 372.5 UL 491.5 Traditional Life 1154.4 Credit Life 528.5 VA/VUL 621.7 Fixed Annuity 395 Other 367.9 |
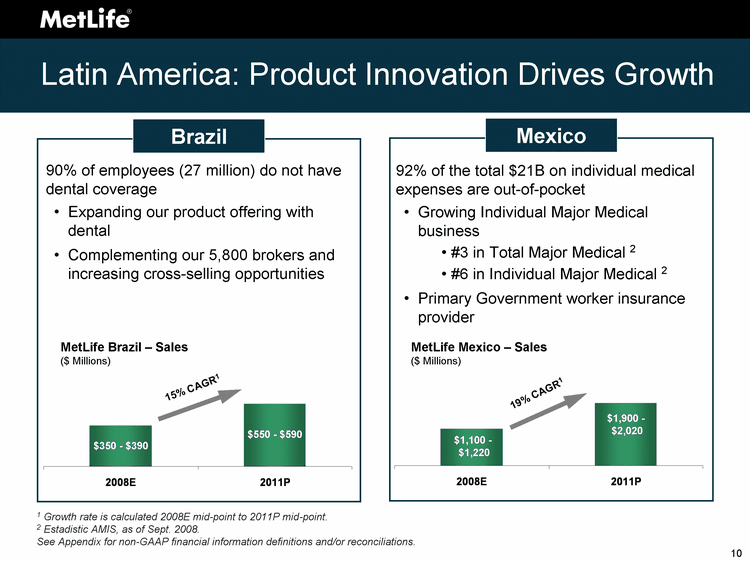
| Latin America: Product Innovation Drives Growth Mexico Brazil 19% CAGR1 MetLife Mexico - Sales ($ Millions) 15% CAGR1 MetLife Brazil - Sales ($ Millions) Expanding our product offering with dental Complementing our 5,800 brokers and increasing cross-selling opportunities Growing Individual Major Medical business #3 in Total Major Medical 2 #6 in Individual Major Medical 2 Primary Government worker insurance provider $350 - $390 $550 - $590 $1,100 - $1,220 $1,900 - $2,020 90% of employees (27 million) do not have dental coverage 92% of the total $21B on individual medical expenses are out-of-pocket 1 Growth rate is calculated 2008E mid-point to 2011P mid-point. 2 Estadistic AMIS, as of Sept. 2008. See Appendix for non-GAAP financial information definitions and/or reconciliations. |
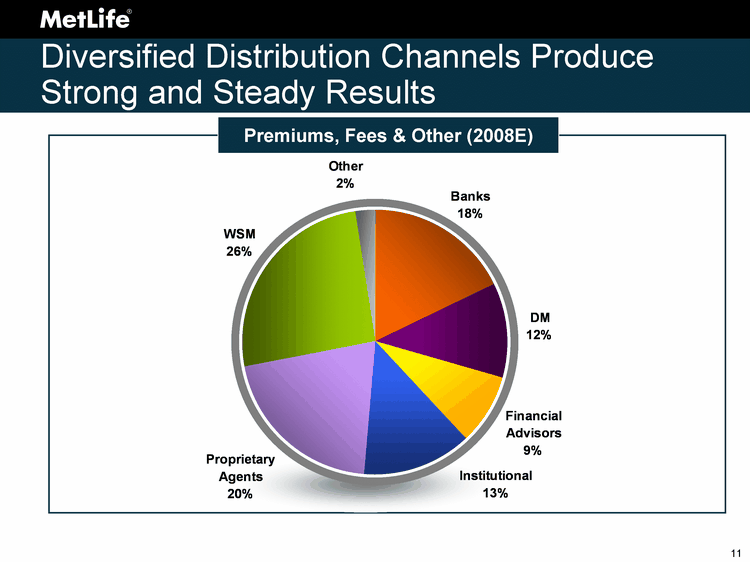
| Diversified Distribution Channels Produce Strong and Steady Results Premiums, Fees & Other (2008E) 2009 Banks 833 DM 553 Financial Advisors 404 Institutional 620 Proprietary Agents 962 Mex Gov't 691 WSM 1212 Other 112 |

| Asia Pacific: Distribution Expansion Fuels Growth 1 Growth rate is calculated 2008E mid-point to 2011P mid-point. 2 Source: Korea Ministry of Strategy and Finance as of year end 2005 3 Source: Bank of Japan Flow of Funds - Household Financial Assets as of September 30, 2008 See Appendix for non-GAAP financial information definitions and/or reconciliations. Japan Korea MetLife Korea - Sales ($ Millions) MSI MetLife - Sales ($ Millions) 18% CAGR1 16% CAGR1 $990 - $1,090 $1,650 - $1,750 $5,200 - $5,700 $8,230 - $8,730 Over 50% of individual financial assets are in bank deposits 2 Over 55% of individual financial assets are in bank deposits 3 Expanding bank partners network, now partnering with 7of 9 national banks Introducing fixed annuities in 7 banks Growing our sales force to 5,000 agents in 2008, and 5,800 by 2009 Launching variable annuities through Nomura Securities Significantly expanding distribution through Japan Post well above 320 outlets Offering fixed annuities through SMBC, Mizuho, Risona & other banks |
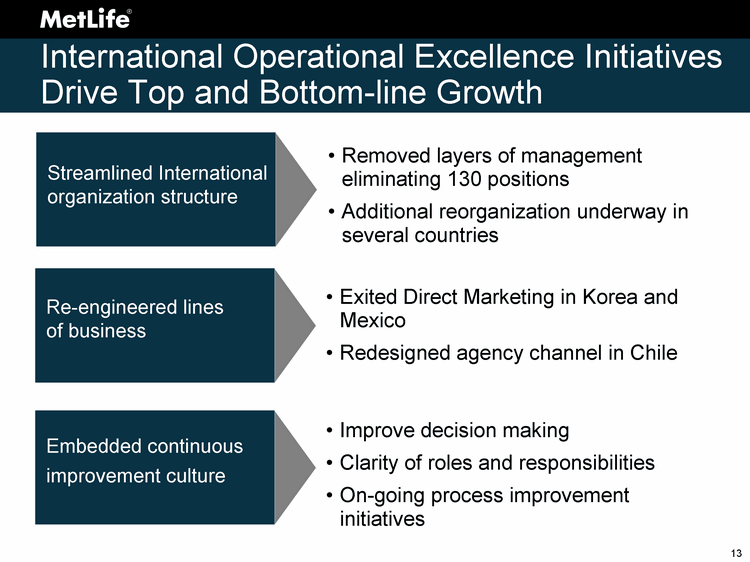
| International Operational Excellence Initiatives Drive Top and Bottom-line Growth Removed layers of management eliminating 130 positions Additional reorganization underway in several countries Streamlined International organization structure Exited Direct Marketing in Korea and Mexico Redesigned agency channel in Chile Improve decision making Clarity of roles and responsibilities On-going process improvement initiatives Re-engineered lines of business Embedded continuous improvement culture |
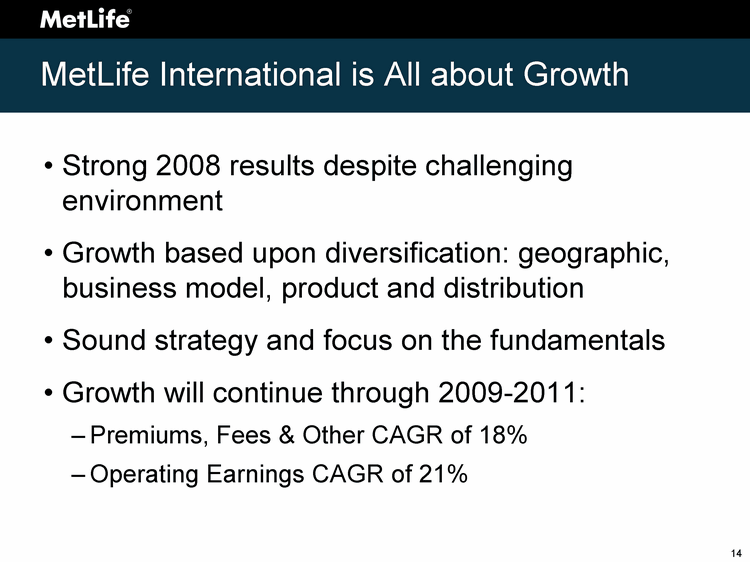
| MetLife International is All about Growth Strong 2008 results despite challenging environment Growth based upon diversification: geographic, business model, product and distribution Sound strategy and focus on the fundamentals Growth will continue through 2009-2011: Premiums, Fees & Other CAGR of 18% Operating Earnings CAGR of 21% |


| Explanatory Note on Non-GAAP Financial Information The historical and forward-looking financial information presented at Investor Day and contained in these presentations include performance measures which are based on methodologies other than Generally Accepted Accounting Principles ("GAAP"). MetLife analyzes its performance using so-called non-GAAP measures, including operating earnings, operating earnings available to common shareholders, operating earnings available to common shareholders per diluted common share and operating return on common equity. MetLife believes these measures enhance the understanding and comparability of its performance by excluding net investment gains and losses, net of income tax, and adjustments related to net investment gains and losses, net of income tax, both of which can fluctuate significantly from period to period, and discontinued operations other than discontinued real estate, net of income tax, thereby highlighting the results from operations and the underlying profitability drivers of the business. Operating earnings is defined as GAAP net income, excluding net investment gains and losses, net of income tax, adjustments related to net investment gains and losses, net of income tax, and discontinued operations other than discontinued real estate, net of income tax. Scheduled periodic settlement payments on derivative instruments not qualifying for hedge accounting treatment are included in operating earnings available to common shareholders. Operating earnings available to common shareholders is defined as operating earnings less preferred stock dividends. All references in these slides and in the presentations made at Investor Day to "operating earnings" for 2005 and future years should be read as references to "operating earnings available to common shareholders." Operating earnings available to common shareholders per diluted common share is calculated by dividing operating earnings available to common shareholders by the number of weighted average diluted common shares outstanding for the period indicated. All references in these slides and in the presentations made at Investor Day to "operating earnings per share" for 2005 and future years should be read as references to "operating earnings available to common shareholders per diluted common share." Operating return on common equity is calculated by dividing operating earnings available to common shareholders by average common equity for the period indicated, excluding accumulated other comprehensive income. |

| Explanatory Note on Non-GAAP Financial Information (Continued) For the historical periods presented, reconciliations of the non-GAAP measures used in the presentations made at Investor Day to the most directly comparable GAAP measures are included in this Appendix and are on the Investor Relations portion of MetLife, Inc.'s website (www.metlife.com). Additional information about MetLife's historical financial results is available in the Company's Quarterly Financial Supplements for the corresponding periods which may be accessed through the Company's website. The non- GAAP measures used in the presentations made at Investor Day should not be viewed as substitutes for the most directly comparable GAAP measures. In the presentations made at Investor Day, MetLife provides guidance on its future earnings, earnings per diluted common share and return on equity on an operating and non-GAAP basis. A reconciliation of the non-GAAP measures to the most directly comparable GAAP measures is not accessible on a forward-looking basis because MetLife believes it is not possible to provide other than a range of net investment gains and losses, which can fluctuate significantly within or without the range and from period to period and may have a significant impact on GAAP net income. |

| Table of Contents Definitions...............................................................................................5 Reconciliation Reconciliation of Net Income Available to Common Shareholders.....................8 Reconciliation of Book Value per Common Share........................................12 Reconciliation of Premiums, Fees & Other Revenues....................................13 Reconciliation of Operating Expenses and Expense Ratio..............................14 Reconciliation of Return on Common Equity................................................15 2007 Reconciliation of Return on Common Equity........................................16 Institutional Metrics.................................................................................17 Individual Metrics...................................................................................24 International Metrics...............................................................................29 Auto & Home Metrics...............................................................................32 |

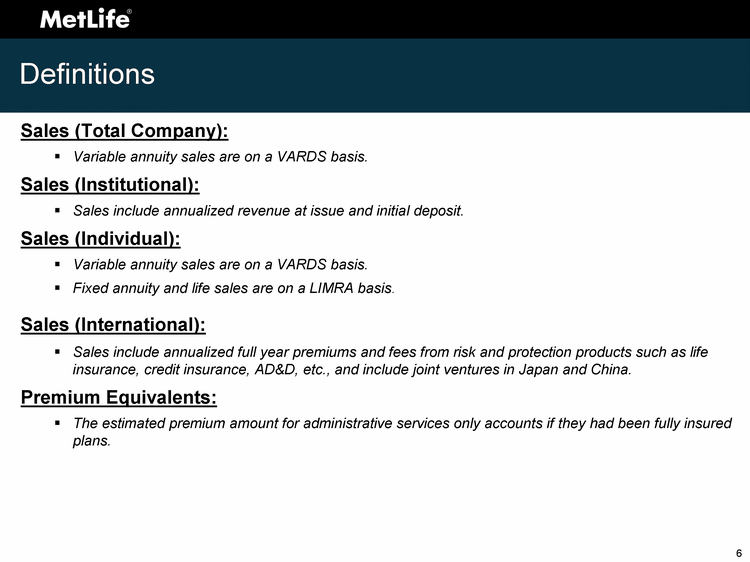
| Definitions Sales (Total Company): Variable annuity sales are on a VARDS basis. Sales (Institutional): Sales include annualized revenue at issue and initial deposit. Sales (Individual): Variable annuity sales are on a VARDS basis. Fixed annuity and life sales are on a LIMRA basis. Sales (International): Sales include annualized full year premiums and fees from risk and protection products such as life insurance, credit insurance, AD&D, etc., and include joint ventures in Japan and China. Premium Equivalents: The estimated premium amount for administrative services only accounts if they had been fully insured plans. |

| Reconciliation of Net Income Available to Common Shareholders to Operating Earnings Available to Common Shareholders -Total Company Operating Earnings Available to Common Shareholders -Total Company Operating Earnings Available to Common Shareholders -Total Company |
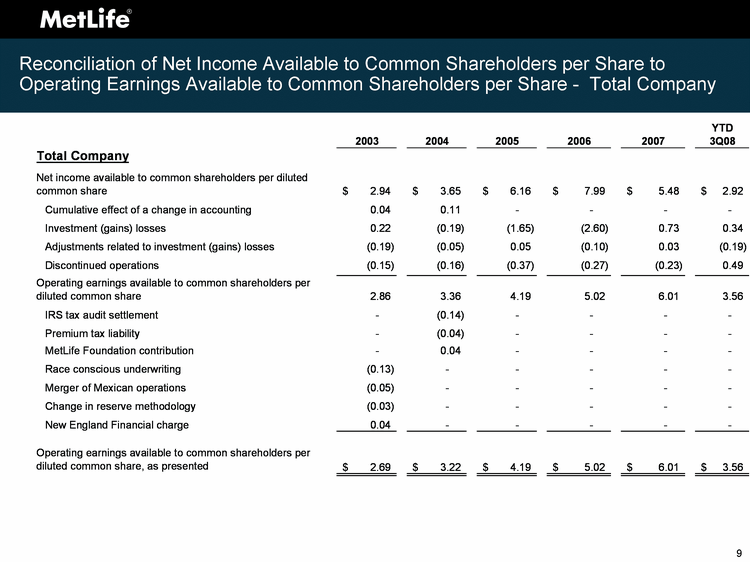
| Reconciliation of Net Income Available to Common Shareholders per Share to Operating Earnings Available to Common Shareholders per Share - Total Company Operating Earnings Available to Common Shareholders per Share - Total Company Operating Earnings Available to Common Shareholders per Share - Total Company |
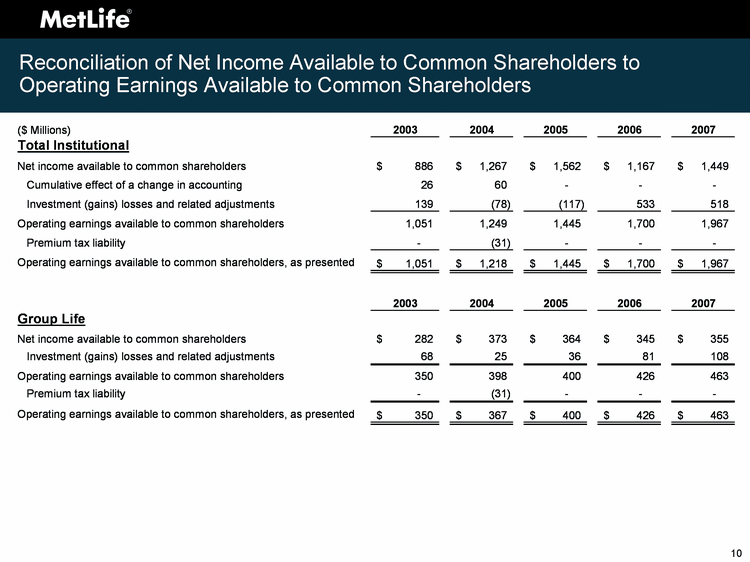
| Reconciliation of Net Income Available to Common Shareholders to Operating Earnings Available to Common Shareholders Operating Earnings Available to Common Shareholders Operating Earnings Available to Common Shareholders |
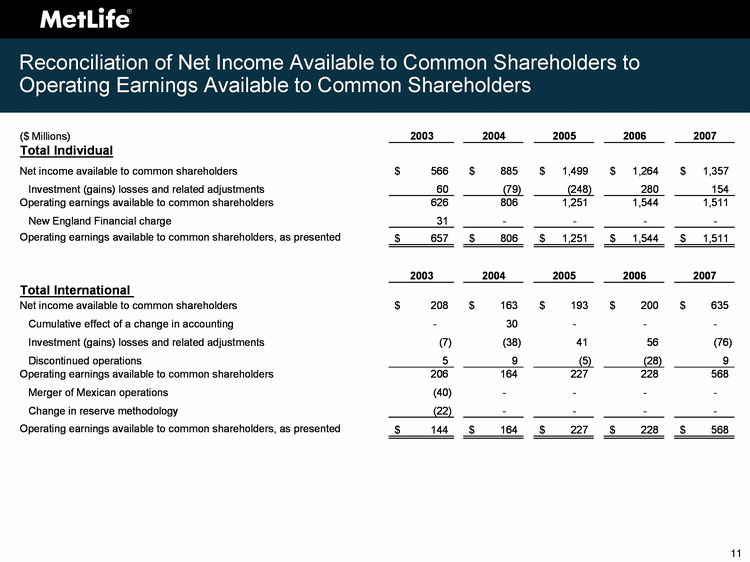
| Reconciliation of Net Income Available to Common Shareholders to Operating Earnings Available to Common Shareholders Operating Earnings Available to Common Shareholders Operating Earnings Available to Common Shareholders Operating Earnings Available to Common Shareholders Operating Earnings Available to Common Shareholders |
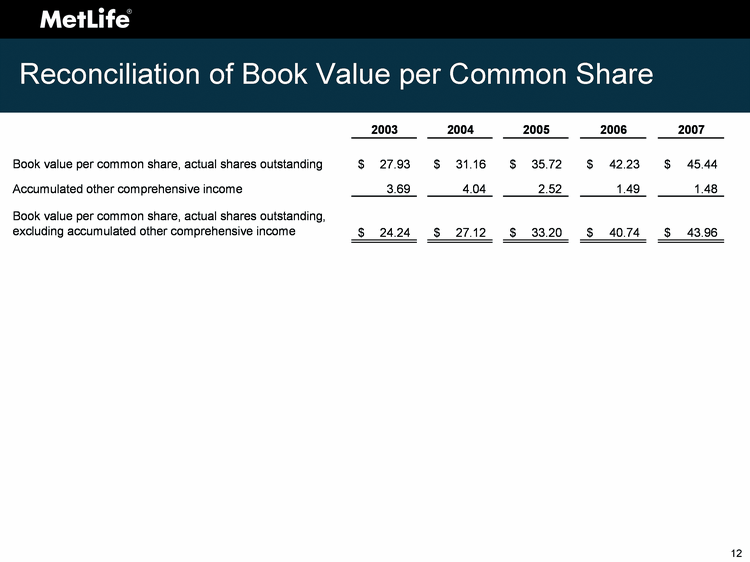
| Reconciliation of Book Value per Common Share Reconciliation of Book Value per Common Share |
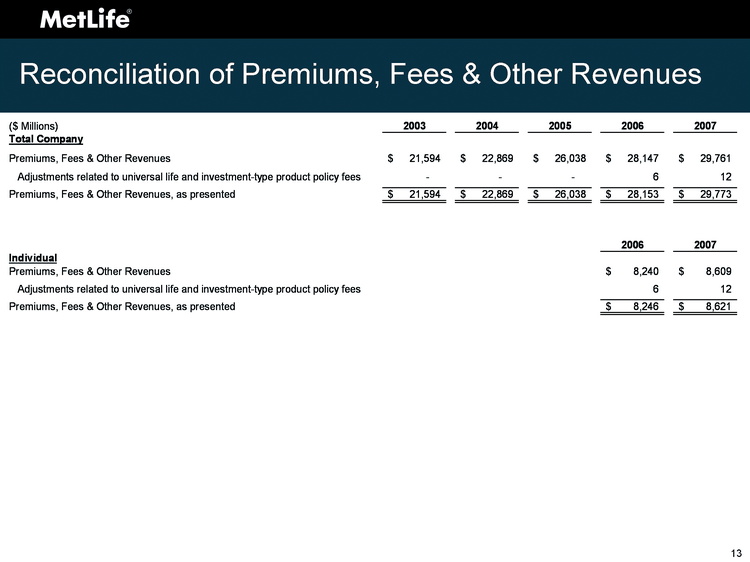
| Reconciliation of Premiums, Fees & Other Revenues Reconciliation of Premiums, Fees & Other Revenues |

| Reconciliation of Operating Expenses and Expense Ratio 1 The operating expense ratio is calculated by dividing operating expenses by premiums, fees & other revenues. The operating expense ratio, as presented, is calculated by dividing operating expenses, as presented, by premiums, fees & other revenues, as presented. ratio, as presented, is calculated by dividing operating expenses, as presented, by premiums, fees & other revenues, as presented. ratio, as presented, is calculated by dividing operating expenses, as presented, by premiums, fees & other revenues, as presented. |
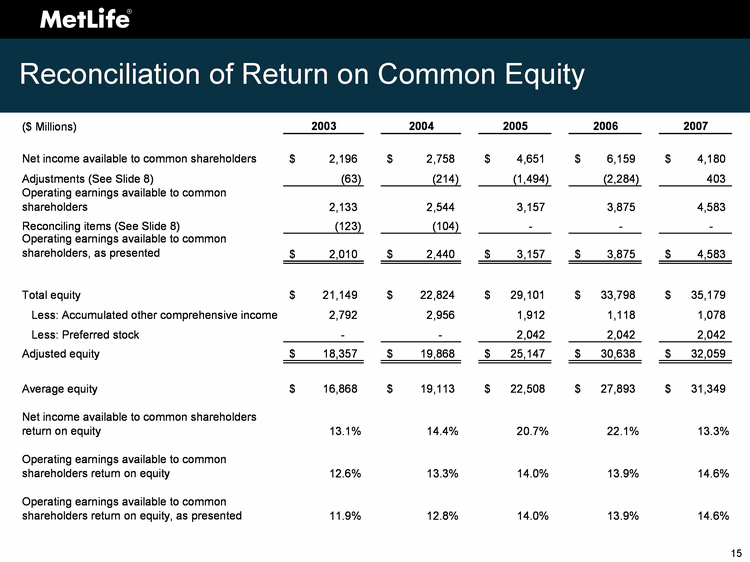
| Reconciliation of Return on Common Equity Reconciliation of Return on Common Equity |
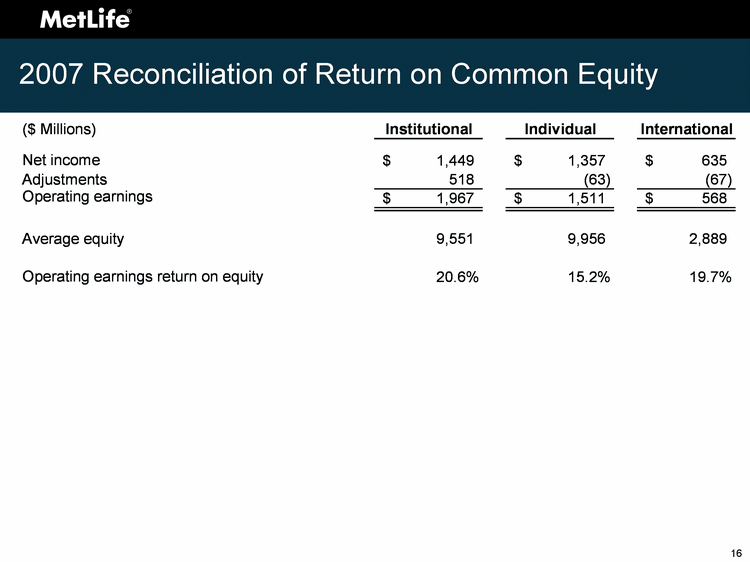
| 2007 Reconciliation of Return on Common Equity 2007 Reconciliation of Return on Common Equity |

| Institutional: 2008 Results |
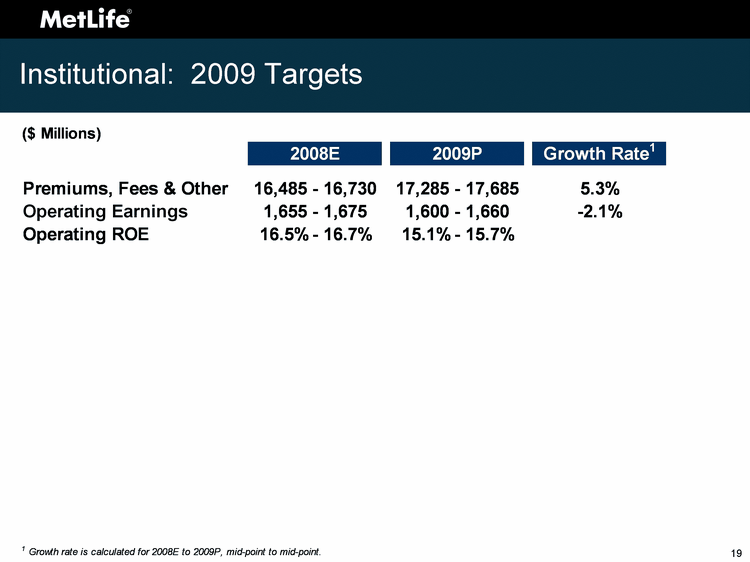
| Institutional: 2009 Targets |

| Institutional: 2007 - 2009 Operating Earnings |

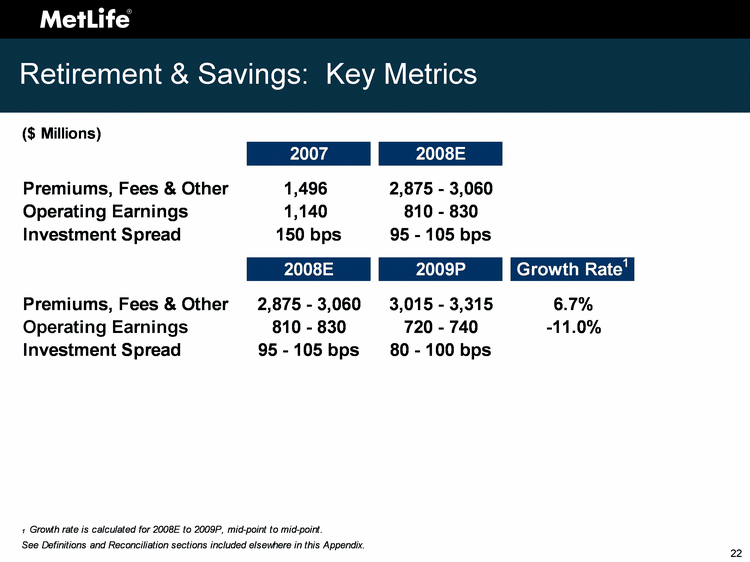
| Retirement & Savings: Key Metrics |
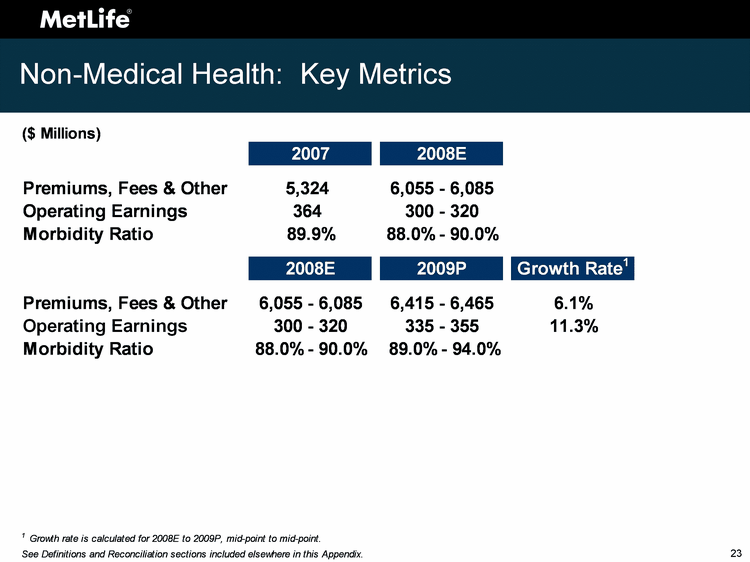
| Non-Medical Health: Key Metrics |

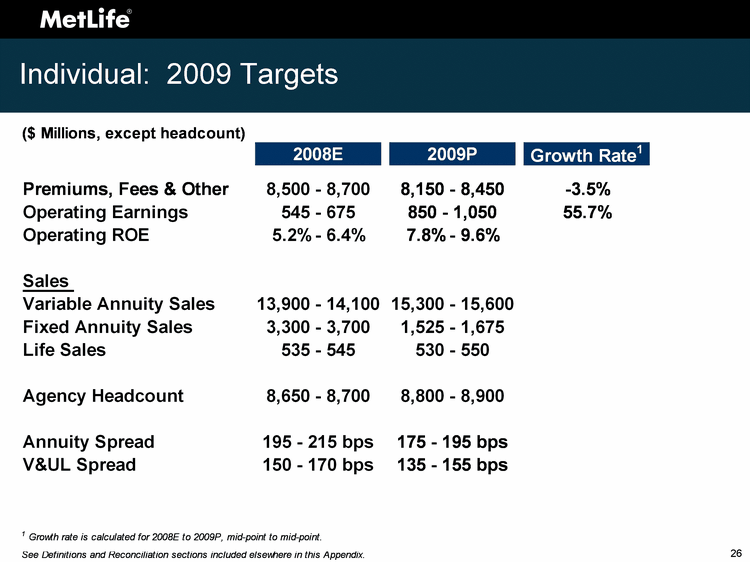
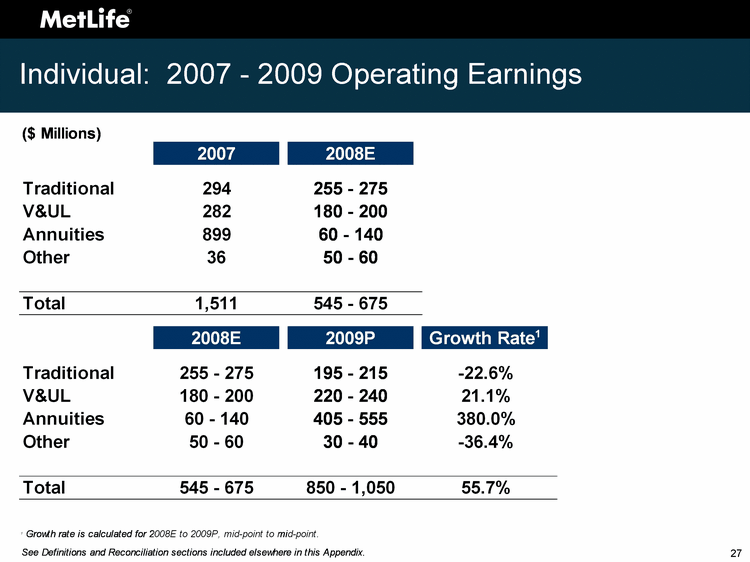
| Individual: 2007 - 2009 Operating Earnings |
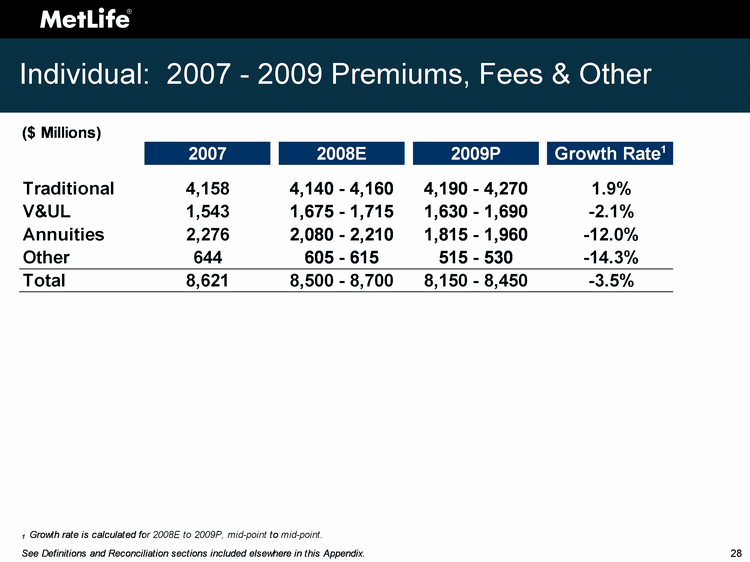
| Individual: 2007 - 2009 Premiums, Fees & Other |
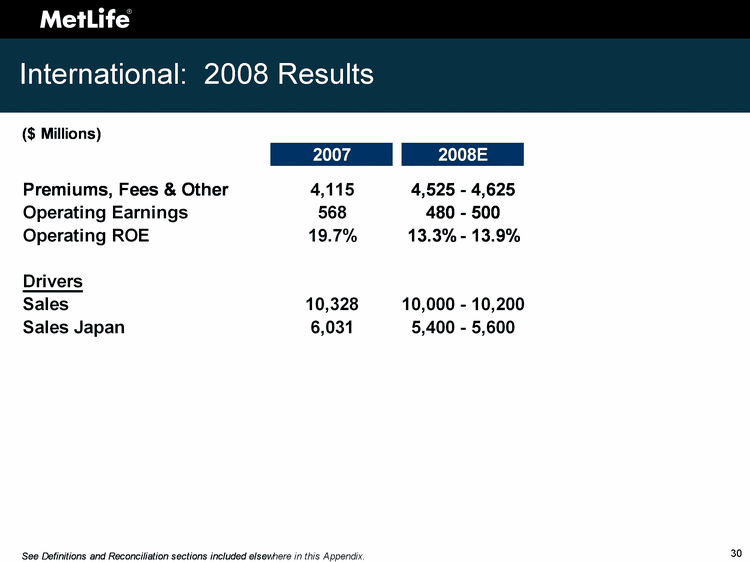
| International: 2008 Results |
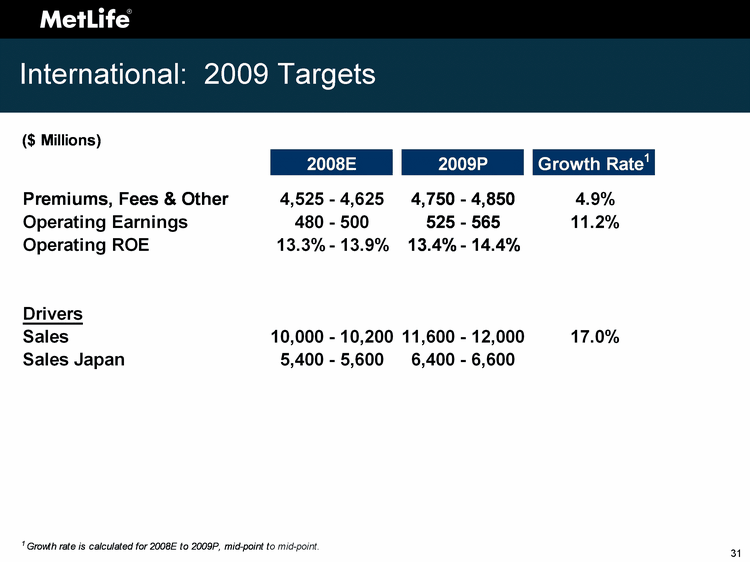
| International: 2009 Targets |

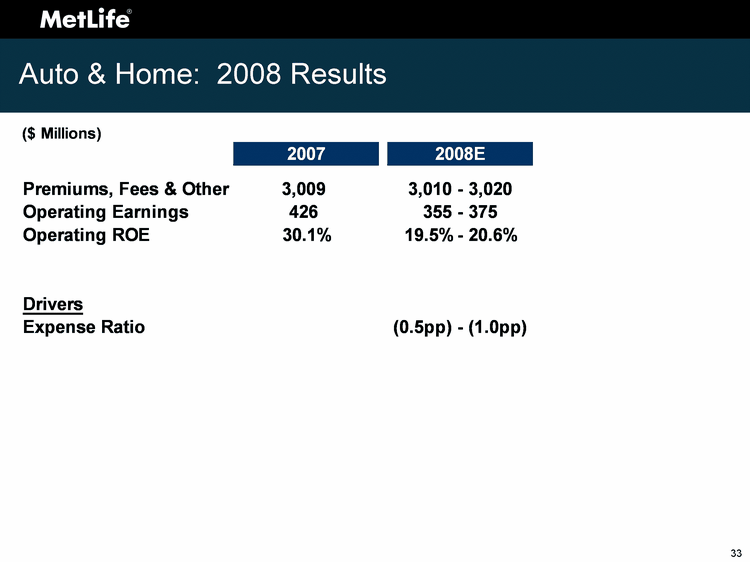
| Auto & Home: 2008 Results |
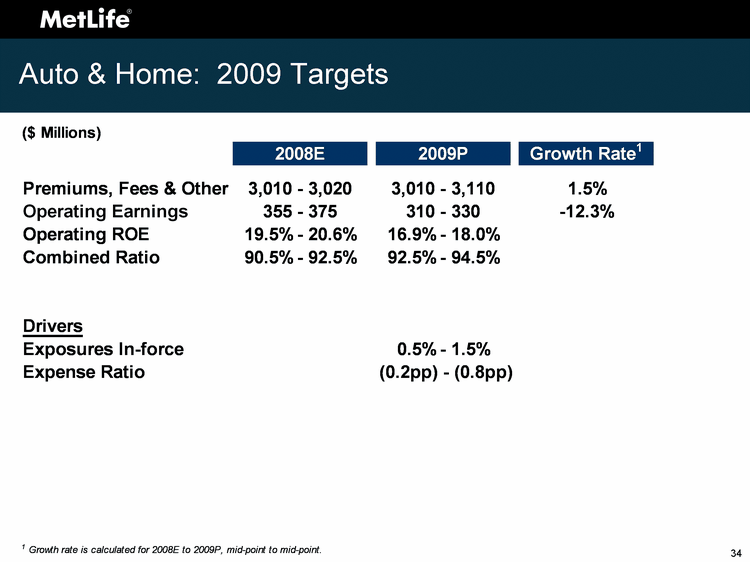
| Auto & Home: 2009 Targets |

Ruth A. Fattori
Executive Vice President
& Chief Administrative Officer
MetLife, Inc.
Ruth A. Fattori is executive vice president and chief administrative officer of MetLife, Inc. She was named to this position in January 2008.
As chief administrative officer, Fattori oversees MetLife’s human resources, corporate ethics and compliance, audit, corporate communications, advertising and brand management, corporate security, corporate real estate and corporate procurement functions.
Prior to joining MetLife, Fattori was executive vice president, human resources for Motorola, Inc., with responsibility for attracting and retaining outstanding talent, anticipating business trends, developing top performers and providing them with appropriate career challenges. Fattori also had responsibility for loss prevention and security. In addition, she provided stewardship to Motorola’s diversity and inclusion initiatives and played a key role in embedding a high-tech, quality-focused, customer-driven culture in Motorola employees.
Fattori joined Motorola in November 2004 from JPMorgan Chase & Co., where she was senior vice president, responsible for human resources, communications, productivity and quality for the global technology infrastructure group. Previously, Fattori worked for Conseco, Inc., as executive vice president, process and productivity. She also has served as senior vice president, human resources for Siemens Corporation, the U.S. entity of Siemens AG, and as vice president, human resources for the worldwide industry segment of Asea Brown Boveri.
At GE Capital, Fattori was managing director of European operations, based in London, and also served as vice president and chief quality officer. In the latter role, she successfully deployed the first Six Sigma initiative in a financial services company. Fattori began her career as an advanced manufacturing engineer for Xerox Corporation and later served in a number of service operations leadership roles for Xerox.
Fattori holds a bachelor of science degree in mechanical engineering from Cornell University.
She serves on the boards of trustees of Polytechnic Institute of NYU and the board of governors of the Boys and Girls Club of America in Atlanta.
# # #
C. Robert (Rob) Henrikson
Chairman, President & Chief Executive Officer
MetLife, Inc.
C. Robert (Rob) Henrikson is chairman of the board, president and chief executive officer of MetLife, Inc. (NYSE: MET), the largest life insurer in the U.S. and a leading provider of insurance and financial services to more than 70 million customers worldwide.
Appointed CEO and chairman in March and April 2006, respectively, Henrikson has led MetLife to achieve record financial results while capitalizing on emerging trends in several markets around the globe. In 2007, MetLife earned $54 billion in annual revenue and ranked 43rd on the FORTUNE 500®. MetLife was named byForbesas the best managed insurance company in the U.S. for 2008.
Henrikson has positioned MetLife to expand its domestic leadership positions and capitalize on emerging life, annuity and retirement markets outside the U.S. In addition to counting over 90 of the top one hundred FORTUNE 500® companies among its corporate clients, MetLife is a leading provider of group insurance and retirement & savings offerings, including group life, group dental and institutional annuities. MetLife also is the largest life insurer in Mexico, and has strong and growing positions in several markets, including Japan, South Korea and Chile. The company offers products and services to customers in the U.S., Latin America, Asia Pacific and Europe.
Henrikson is a board member and chairman-elect of the American Council of Life Insurers, chairman of the Financial Services Forum and a board member emeritus of the American Benefits Council. He also serves on the National Board of Advisors at the Morehouse School of Medicine, the board of directors of The New York Botanical Garden and the New York Philharmonic, and is a trustee of the American Museum of Natural History.
Henrikson received a B.A. from the University of Pennsylvania and a J.D. from Emory University School of Law. His dedication to both institutions continues, serving as chairman of the board of Wharton’s S.S. Huebner Foundation for Insurance Education and as an alumni trustee of Emory University.
He resides in Connecticut with his wife of more than 30 years, Mary. They have two grown sons and a grandson.
# # #
Steven A. Kandarian
Executive Vice President & Chief Investment Officer
MetLife, Inc.
Steven A. Kandarian is executive vice president and chief investment officer of MetLife, Inc. He joined the company in April 2005. As CIO, Kandarian is responsible for MetLife’s investment department and the company’s $324 billion general account portfolio.
Since joining MetLife, Kandarian has overseen a number of initiatives and strategies that have benefited MetLife’s investment portfolio and contributed to MetLife’s bottom line. He was instrumental in the sale of MetLife’s Peter Cooper Village and Stuyvesant Town properties in 2006, which resulted in a gain of approximately $3 billion, net of income taxes. Under his leadership, MetLife identified the housing bubble early and reduced its exposure to sub-prime mortgage-backed securities, increased the overall quality of its corporate credit portfolio, and increased its focus on low loan-to-value commercial and agricultural mortgages.
Prior to joining MetLife, Kandarian was the executive director of the Pension Benefit Guaranty Corporation (PBGC) from 2001 to 2004. He made the public case for comprehensive reform of the pension funding rules to put the defined benefit system and the PBGC on a sound financial footing. In addition, under Kandarian’s leadership, the PBGC adopted a new investment policy ensuring that, going forward, its assets be structured to better match liability durations.
Before joining the PBGC, Kandarian was founder and managing partner of Orion Partners, LP. From 1990 to 1993, he served as president and founder of Eagle Capital Holdings, where he formed a private merchant bank to sponsor equity investments in small and mid-sized businesses. Prior to establishing Eagle Capital Holdings, from 1984 to 1990, he was managing director of Lee Capital Holdings, a private equity firm based in Boston.
Previously, he held positions in corporate merger and acquisitions and leveraged buyouts at State Street Bank and Trust and LCB Holdings, Inc. Prior to joining LCB, Kandarian was an investment banker with Houston-based Rotan Mosle, Inc., where he had responsibility for a broad range of projects, including initial public offerings, mergers and acquisitions and private placements.
Kandarian previously served as a member of the board of trustees for MassMutual Corporate Investors, MassMutual Participation Investors and MassMutual Premier Funds. He received a B.A. from Clark University, a J.D. from Georgetown University Law Center, and a M.B.A. from Harvard Business School.
# # #
James Lipscomb
Executive Vice President & General Counsel
MetLife, Inc.
James Lipscomb is executive vice president and general counsel of MetLife, Inc. He was named to this position in July 2003.
Lipscomb oversees the company’s legal affairs group with responsibility for the global operation of the MetLife law and government and industry relations departments. He also provides advice to the board of directors and management on corporate governance and business operations.
From 2001 to 2003, Lipscomb served as senior vice president and deputy general counsel. Prior to this role, he was president and chief executive officer of Conning Corporation, a former MetLife subsidiary, and oversaw its asset management portfolio, private equity group, real estate loan origination and servicing platform, equity broker dealer and insurance industry research group. In addition, Lipscomb led MetLife’s corporate planning and strategy department from 1998 to 2000. He also served as a senior vice president in MetLife’s real estate investments department. Lipscomb first joined MetLife in 1972 as an attorney.
Throughout his career, Lipscomb has held leadership positions in various local, state and national legal organizations, including the American College of Real Estate Lawyers, the State Bar of California and the Association of the Bar of the City of New York, where he served as treasurer and a member of the executive committee. He has spoken widely on many legal topics.
His civic affiliations include serving as chairman of the Citizens Budget Commission of New York, director of the Life Insurance Council of New York, trustee of the Practising Law Institute, director of Graffiti Ministries, Inc. and a member of the Economic Club of New York as well as the Center of Hope (Haiti), Inc. Advisory Board. Lipscomb also serves as a member of the board of directors of several MetLife subsidiaries – General American Life Insurance Company, Metropolitan Property and Casualty Insurance Company and MetLife Foundation.
Lipscomb received a B.A. from Howard University, a J.D. from Columbia University Law School and a L.L.M. (Corporations) from New York University. He is a member of the state bar in New York and California and the federal bar in the Northern District of California, the Southern District of New York, the Second Circuit and the U.S. Supreme Court.
Lipscomb was named toInside CounselMagazine’s 2006 list of the top 50 most influential in-house counsel in North America and was recognized especially for diversity initiatives.
# # #
Maria R. Morris
Executive Vice President, Technology & Operations
MetLife, Inc.
Maria R. Morris is executive vice president and head of technology and operations for MetLife. She was appointed to this position in January 2008.
In this role, Morris oversees MetLife’s information technology organization as well as the customer sales and service group, capability sourcing and global operations support center.
Previously, Morris served as executive vice president, employee benefits sales within the Institutional Business segment for MetLife. Since December 2005 she oversaw the group insurance and retirement and savings sales forces that generated approximately $14 billion in annual revenue. Under Morris’s leadership, Institutional Business achieved record sales and drove strong revenue growth in part to the retention and expansion of the company’s extensive client relationships.
From 2003 to 2005, Morris served as senior vice president of group insurance sales and individual disability. In this role, she was responsible for MetLife’s small business center, group regional operations and individual disability product and sales. In 2004, she assumed oversight of the company’s National Accounts organization as well as voluntary benefits and group insurance service operations.
As the vice president of MetLife’s group disability business from 2000 to 2003, Morris had profit and loss responsibility overseeing product development and management as well as claims operations. From 1996 to 2000, Morris had similar responsibilities for MetLife’s dental product and also managed the preferred dentist network. Under her leadership, revenue grew 20% and profitability grew 200%, while an efficient claims model was implemented. Morris joined MetLife in 1984 as an account administrator in the company’s National Accounts organization and has since held a number of roles with increasing responsibility.
She received a B.A. from Franklin and Marshall College, magna cum laude, where she was elected to Phi Beta Kappa. Morris is a selected member of the YWCA Academy of Women Achievers. In 2005, she was recognized byProfiles in Diversity JournalMagazine as one of a number of “Women to Watch.”
Maria Morris serves as a board member of MetLife Services East Private Limited (MSEPL), MetLife Global Operations Support Center Private Limited (MGOSC) and MetLife Securities, Inc. She also serves on INROADS national board of directors and All Stars Project, Inc. board of directors, a non-profit organization focused on developing young people.
# # #
William J. Mullaney
President, Institutional Business
MetLife, Inc.
William J. Mullaney is president of MetLife’s Institutional Business division, which provides benefit solutions to more than 61,000 group customers in the United States, including over 90 of the top one hundred FORTUNE 500® companies. Through these relationships, MetLife products and services reach nearly 40 million employees. Today, MetLife is a leading provider of many group insurance and retirement & savings offerings, including group life, group dental and institutional annuities.
After Mullaney was promoted to head Institutional Business in January 2007, the business achieved its best top- and bottom-line results that year. Previously, Mullaney served as the president of MetLife Auto & Home, MetLife’s $3 billion personal lines property & casualty subsidiary that insures nearly 4 million autos and homes nationwide. Under Mullaney’s leadership, Auto & Home delivered record operating earnings despite some of the worst hurricanes in U.S. history. At the same time, the company distinguished itself for its quick and compassionate response to customers affected by these natural disasters. From 2002 through 2004, Mullaney served as senior vice president for claims and customer service at Auto & Home, where he oversaw claims, business operations and services, and customer retention initiatives as well as the project management office.
From 1998 to 2002, Mullaney was responsible for MetLife’s voluntary benefits business. In this role, he was responsible for creating and managing the sales, marketing and service platform for MetLife’s employee paid workplace products, including group life, group auto & home and group long-term care insurance, as well as products offered by MetLife’s Hyatt Legal subsidiary. During the four years he oversaw the business, revenue increased by 50 percent. In 2000, he received added responsibility for MetLife’s national service center, which provides financial and administrative services to middle market customers in MetLife’s Institutional Business segment.
From 1996 to 1998, Mullaney served as the vice president overseeing MetLife’s relationship with the company’s largest institutional customer – General Motors. Prior to this position, he headed MetLife’s National Accounts customer units in Schaumburg, IL and Orange, CA and also led the National Accounts claim operations. He was promoted to vice president in 1990 and joined MetLife in 1982.
Mullaney currently serves as the Chairman of the New York Blood Center’s Volunteer Leadership Campaign and is a member of the board of directors for the Employee Benefit Research Institute; MetLife Auto & Home and MetLife Bank. He has also previously served on the boards of the Insurance Information Institute, Insurance Institute for Highway Safety and the Rhode Island Philharmonic, among others. In 2007 and 2008, Mullaney was named toIrish America Magazine’s“Business 100,” recognizing the top 100 Irish-American business leaders in the United States. He received a B.A. from the University of Pittsburgh, his M.B.A. from Pace University and a chartered life underwriter designation from The American College.
# # #
Conor Murphy
Vice President, Investor Relations
MetLife
Conor Murphy is vice president and head of investor relations for MetLife. He was appointed to this position in November 2007.
In this role, Murphy manages the coordination and execution of presenting MetLife’s financial results, messages and strategies to the analyst and investor community.
Before being named to his current position, Murphy was vice president and chief financial officer for MetLife’s investments department since July 2002. His various responsibilities included financial reporting & analysis, investment income projections, performance measurement & attribution, portfolio valuation and the Sarbanes-Oxley processes for investments.
Prior to joining the investments department, Murphy served in MetLife’s internal audit department, where he was responsible for various groups, including investments and investment affiliate auditing operations. Affiliate operations included investment advisor, mutual fund, broker dealer and trust company subsidiaries. He was also responsible for the Reinsurance Group of America (RGA) audit functions. MetLife, Inc. was the beneficial owner of approximately 52% of RGA’s outstanding shares before divesting its majority stake in the company in September 2008.
Murphy joined MetLife in October 2000 after seven years with PricewaterhouseCoopers LLP, where he served in the New York Financial Services Industry Practice. Prior to PricewaterhouseCoopers, he spent five years with Grant Thornton LLP in Dublin, Ireland.
Murphy is a founding trustee of Cristo Rey New York High School and a past president of the Association of Chartered Accountants in the United States. In 2008, Murphy was among a select group of 50 Irish-American business leaders honored at the 11th annual “Wall Street 50” awards.
He is a certified public accountant and a member of the Massachusetts Society of CPAs. Murphy is also a chartered accountant and a fellow of the Institute of Chartered Accountants in Ireland.
# # #
William J. Toppeta
President, International
MetLife, Inc.
William J. Toppeta is president, International for MetLife, Inc. He was named to this position in July 2001 and is responsible for all of the company’s insurance and employee benefits businesses outside the United States.
Under his leadership, MetLife continues to successfully expand its operations in three key regions outside of the U.S.: Latin America, Asia Pacific and Europe.
Since Toppeta was named president, International’s revenues have grown from $1.2 billion in 2001 to $5.4 billion in 2007. As a result of MetLife’s 2005 acquisition of substantially all of Citigroup Inc.’s international insurance businesses, MetLife’s presence outside the U.S. has expanded to now reach over 17 million customers in multiple countries and territories.
Toppeta has focused MetLife’s International business on growth — both organically and through acquisitions. He was the principal architect of MetLife’s acquisition and integration of Aseguradora Hidalgo S.A. in Mexico, where MetLife is now the largest life insurer. He also expanded MetLife’s operations in South Korea, Chile, Brazil, India and China.
Prior to assuming his current role, Toppeta served as MetLife’s president of client services and chief administrative officer from 1999 to 2001. Prior to this position, he oversaw MetLife’s Individual Business segment after having led the U.S. career agency force for three years. In 1995, he was named senior vice president to lead MetLife’s corporate reengineering department.
After being named vice president and deputy general manager of MetLife’s Canadian operations in 1992, he became president and CEO of Metropolitan Life’s Canadian operations in 1993. Toppeta also served as executive assistant to former CEO, Richard R. Shinn, and was appointed assistant vice president in the office of the president in 1979. He began his career at MetLife in 1973 as an attorney in the law department.
Toppeta is a member of the board of the President’s Council of Fordham University, vice chairman of the International Committee of the American Council of Life Insurers, and serves on the board of directors of the Council of the Americas, U.S.-India Business Council, and Coalition of Services Industries. He also serves as a director of MetLife Foundation, MetLife Investors, MetLife Securities, New England Securities and Walnut Street Securities among others.
He holds a B.A. from Fordham College as well as a J.D. and a LL.M from New York University’s School of Law.
# # #
Lisa M. Weber
President, Individual Business
MetLife, Inc.
Lisa M. Weber oversees Individual Business and Auto & Home for MetLife, Inc., a global leader in insurance and other financial services. Combined operating earnings for both units have doubled under her leadership to nearly $2 billion. In 2007, the combined businesses’ revenue grew to nearly $19 billion.
Since being named to the position in 2004, Weber has pursued a strategy emphasizing face-to-face advice that meets the critical protection and retirement income needs of over 13 million clients. She oversees a distribution system with more than 11,000 affiliated advisors and 160,000 points of sale as well as an annuity and life portfolio with offerings in every major market segment. Weber played a critical role in the successful integration of the Travelers Life & Annuity acquisition in 2005, which dramatically expanded the company’s presence in the independent marketplace through third-party distributors.
During her tenure, MetLife’s annuity sales have increased at a compound annual growth rate in excess of 14%. The company claimed the #1 spot in the VARDS industry ranking of variable annuity sales for the third quarter of 2008. Weber also strengthened the company’s broker-dealer platform. In addition, client assets have increased to more than $195 billion.
Under her leadership, MetLife Auto & Home’s performance has continued to be strong. Solid claims management, disciplined underwriting and innovative product design have led to three straight years of growth in total clients and earnings.
From 2001 to 2004, Weber served as MetLife’s senior executive vice president and chief administrative officer. In this position, she was responsible for MetLife’s worldwide brand and communications, human resources, corporate ethics and compliance, audit, corporate services, security as well as the company’s philanthropic efforts through MetLife Foundation.
A veteran across the securities and banking industries, before joining MetLife, Weber spent more than 10 years at PaineWebber. She previously held leadership roles at Merrill Lynch and Manufacturers Hanover Trust Company.
Weber is a member of the boards of several MetLife subsidiaries, including MetLife Bank and MetLife Auto & Home as chair. She served as a director on the board of Reinsurance Group of America (NYSE: RGA) from 2004 to 2006. She is a director of MetLife Foundation and a trustee of Northeast Region Boys & Girls Clubs of America. She holds a B.A. from the State University of New York at Stony Brook where she was elected to Phi Beta Kappa.
# # #
William J. Wheeler
Executive Vice President & Chief Financial Officer
MetLife, Inc.
William J. Wheeler is executive vice president and chief financial officer of MetLife, Inc. He was named to this position in December 2003.
As chief financial officer, Wheeler is responsible for overseeing all financial management matters for MetLife. This includes financial reporting, treasury, corporate actuarial, risk management, tax and mergers and acquisitions.
In addition, in June 2006, he was named the executive officer responsible for MetLife Bank, which offers retail banking products, including money market accounts, certificates of deposit, residential mortgages and reverse mortgages.
In 2005, Wheeler oversaw the teams that negotiated the acquisition of, and secured all the necessary financing for, MetLife’s purchase of Travelers Life & Annuity and related international insurance businesses from Citigroup Inc. — MetLife’s largest acquisition in its 140-year history.
Before being promoted to chief financial officer, from 2002 to 2003 Wheeler was the head of product management, marketing and business development activities in the company’s Individual Business segment. Prior to this role and after MetLife’s initial public offering in 2000, Wheeler served as the chief financial officer of the company’s Institutional Business. In this position, he oversaw financial reporting and planning, as well as expense management for that segment.
Wheeler joined the company in 1997 as treasurer and played a key role in preparing MetLife to become a public company. He oversaw certain aspects of the demutualization, the development of investor relations and shareholder services organizations, and management of the initial public offering process and related transactions.
Before joining MetLife, Wheeler was an investment banker for ten years at Donaldson, Lufkin & Jenrette (DLJ). During his career at DLJ, he managed a variety of transactions, including equity and debt financings, mergers and acquisitions, leveraged buyouts, financial advisory and restructurings in a number of different industries, including the insurance industry.
Wheeler is a member of Wabash College’s board of trustees. He holds an M.B.A. from Harvard Business School and also received an A.B., magna cum laude, and was awarded Phi Beta Kappa from Wabash College.
# # #