MetLife Eric Steigerwalt, Senior VP and Treasurer John Rosenthal, Senior Managing Director |
Safe Harbor Statement These materials may contain or incorporate by reference information that includes or is based upon forward-looking statements within the meaning of the Private Securities Litigation Reform Act of 1995. Forward-looking statements give expectations or forecasts of future events. These statements can be identified by the fact that they do not relate strictly to historical or current facts. They use words such as "anticipate," "estimate," "expect," "project," "intend," "plan," "believe" and other words and terms of similar meaning in connection with a discussion of future operating or financial performance. In particular, these include statements relating to future actions, prospective services or products, future performance or results of current and anticipated services or products, sales efforts, expenses, the outcome of contingencies such as legal proceedings, trends in operations and financial results. Any or all forward-looking statements may turn out to be wrong. They can be affected by inaccurate assumptions or by known or unknown risks and uncertainties. Many such factors will be important in determining MetLife's actual future results. These statements are based on current expectations and the current economic environment. They involve a number of risks and uncertainties that are difficult to predict. These statements are not guarantees of future performance. Actual results could differ materially from those expressed or implied in the forward-looking statements. Risks, uncertainties, and other factors that might cause such differences include the risks, uncertainties and other factors identified in MetLife, Inc.'s filings with the U.S. Securities and Exchange Commission ("SEC"). These factors include: (i) difficult and adverse conditions in the global and domestic capital and credit markets; (ii) continued volatility and further deterioration of the capital and credit markets, which may affect the company's ability to seek financing or access its credit facilities; (iii) uncertainty about the effectiveness of the U.S. government's plan to stabilize the financial system by injecting capital into financial institutions, purchasing large amounts of illiquid, mortgage-backed and other securities from financial institutions, or otherwise; (iv) the impairment of other financial institutions; (v) potential liquidity and other risks resulting from MetLife's participation in a securities lending program and other transactions; (vi) exposure to financial and capital market risk; (vii) changes in general economic conditions, including the performance of financial markets and interest rates, which may affect the company's ability to raise capital, generate fee income and market-related revenue and finance statutory reserve requirements and may require the company to pledge collateral or make payments related to declines in value of specified assets; (viii) defaults on the company's mortgage and consumer loans; (ix) investment losses and defaults, and changes to investment valuations; (x) impairments of goodwill and realized losses or market value impairments to illiquid assets; (xi) unanticipated changes in industry trends; (xii) heightened competition, including with respect to pricing, entry of new competitors, consolidation of distributors, the development of new products by new and existing competitors and for personnel; (xiii) discrepancies between actual claims experience and assumptions used in setting prices for the company's products and establishing the liabilities for the company's obligations for future policy benefits and claims; (xiv) discrepancies between actual experience and assumptions used in establishing liabilities related to other contingencies or obligations; (xv) ineffectiveness of risk management policies and procedures, including with respect to guaranteed benefit riders (which may be affected by fair value adjustments arising from changes in our own credit spread) on certain of the company's variable annuity products; (xvi) increased expenses relating to pension and post-retirement benefit plans, (xvii) catastrophe losses; (xviii) changes in assumptions related to deferred policy acquisition costs, value of business acquired or goodwill; (xix) downgrades in MetLife, Inc.'s and its affiliates' claims paying ability, financial strength or credit ratings; (xx) economic, political, currency and other risks relating to the company's international operations; (xx) availability and effectiveness of reinsurance or indemnification arrangements, (xxi) regulatory, legislative or tax changes that may affect the cost of, or demand for, the company's products or services; (xxii) changes in accounting standards, practices and/or policies; (xxiii) adverse results or other consequences from litigation, arbitration or regulatory investigations; (xxiv) deterioration in the experience of the "closed block" established in connection with the reorganization of Metropolitan Life Insurance Company; (xxv) the effects of business disruption or economic contraction due to terrorism, other hostilities, or natural catastrophes; (xxvi) MetLife's ability to identify and consummate on successful terms any future acquisitions, and to successfully integrate acquired businesses with minimal disruption; (xxvii) MetLife, Inc.'s primary reliance, as a holding company, on dividends from its subsidiaries to meet debt payment obligations and the applicable regulatory restrictions on the ability of the subsidiaries to pay such dividends; and (xxviii) other risks and uncertainties described from time to time in MetLife, Inc.'s filings with the SEC. MetLife, Inc. does not undertake any obligation to publicly correct or update any forward-looking statement if MetLife, Inc. later becomes aware that such statement is not likely to be achieved. Please consult any further disclosures MetLife, Inc. makes on related subjects in reports to the SEC. |
Explanatory Note on Non-GAAP Financial Information The historical and forward-looking financial information used in these slides and contained in this presentation includes performance measures which are based on methodologies other than Generally Accepted Accounting Principles ("GAAP"). MetLife analyzes its performance using so-called non-GAAP measures, including operating earnings, operating earnings available to common shareholders, operating earnings available to common shareholders per diluted common share and operating return on common equity. MetLife believes these measures enhance the understanding and comparability of its performance by excluding net investment gains and losses, net of income tax, and adjustments related to net investment gains and losses, net of income tax, both of which can fluctuate significantly from period to period, and discontinued operations other than discontinued real estate, net of income tax, thereby highlighting the results from operations and the underlying profitability drivers of the business. Operating earnings is defined as GAAP net income, excluding net investment gains and losses, net of income tax, adjustments related to net investment gains and losses, net of income tax, and discontinued operations other than discontinued real estate, net of income tax. Scheduled periodic settlement payments on derivative instruments not qualifying for hedge accounting treatment are included in operating earnings available to common shareholders. Operating earnings available to common shareholders is defined as operating earnings less preferred stock dividends. All references in these slides and in the presentation delivered at this conference to "operating earnings" for 2005 and future years should be read as references to "operating earnings available to common shareholders." Operating earnings available to common shareholders per diluted common share is calculated by dividing operating earnings available to common shareholders by the number of weighted average diluted common shares outstanding for the period indicated. All references in these slides and in the presentations made at this conference to "operating earnings per share" for 2005 and future years should be read as references to "operating earnings available to common shareholders per diluted common share." Operating return on common equity is calculated by dividing operating earnings available to common shareholders by average common equity for the period indicated, excluding accumulated other comprehensive income. For the historical periods presented, reconciliations of the non-GAAP measures used in these slides and the presentation made at this conference to the most directly comparable GAAP measures are included in the Appendix to the presentation materials for MetLife, Inc.'s 2008 Investor Day conference and are on the Investor Relations portion of MetLife, Inc.'s Internet website (www.metlife.com). Additional information about MetLife's historical financial results is available in the company's Quarterly Financial Supplements for the corresponding periods which may be accessed through MetLife, Inc.'s Internet website. The non-GAAP measures used in these slides and the presentation made at this conference should not be viewed as substitutes for the most directly comparable GAAP measures. Managed assets is also a non-GAAP financial measure and therefore a reconciliation to total investments is included in the appendix to this presentation. MetLife believes the managed assets measure enhances the understanding of assets by excluding those assets not actively managed in the investment portfolio. |
Evaluation of Insurance Companies Several key criteria have become dominant: Criteria MetLife Status Diversified Yes Capital "Cushion" $3.6 - $5.7 Billion Liquidity* $38 Billion Risk Management Strong Investment Quality Good * Cash & Cash Equivalents and Short-term Investments |
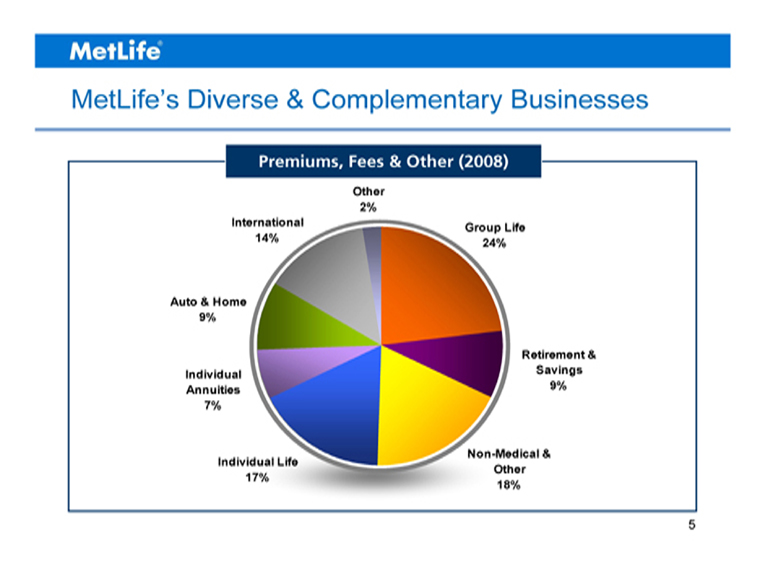
MetLife's Diverse & Complementary Businesses Premiums, Fees & Other (2008) 2008 Group Life 7604 Retirement & Savings 2948 Non-Medical & Other 6073 Individual Life 5657 Individual Annuities 2169 Auto & Home 3009 International 4583 Other 820 |
MetLife's Capital "Cushion" is Strong Current estimated excess capital of $3.6 - $5.7 billion 2008 estimated RBC ratio of 365% - 400% Manage domestic life subsidiaries to "AA Levels" |
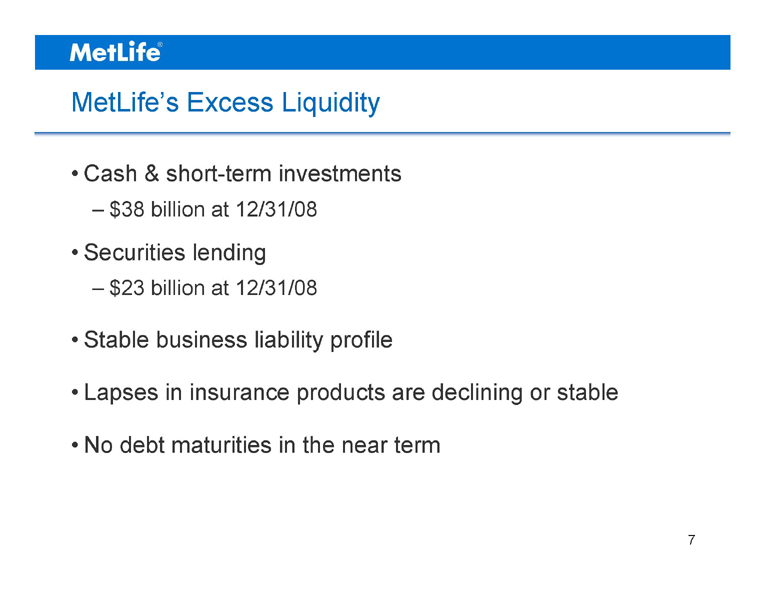
MetLife's Excess Liquidity Cash & short-term investments $38 billion at 12/31/08 Securities lending $23 billion at 12/31/08 Stable business liability profile Lapses in insurance products are declining or stable No debt maturities in the near term |
Variable Annuity Hedging MetLife has a strong and effective hedge program Why have we been successful? We did what we said we would do (3 Greeks) We hedged our Japanese products Regulation 128 has been adjusted Variable annuity hedging is a manageable capital issue |
Financial Strength Ratings & Outlook* Moody's Aa2 Negative S&P AA- Negative Fitch AA Negative A.M. Best A+ Stable * Ratings current as of March 11, 2009 for Metropolitan Life Insurance Company, MetLife Insurance Company of Connecticut, and MetLife Investors USA Insurance Company |
MetLife investments |
Defensively Positioned for Current Environment RMBS Real Estate Recognized deterioration in mortgage underwriting standards early Limited exposure to sub-prime RMBS Vast majority of Alt-A holdings are Super Senior Decreased commercial mortgage portfolio loan-to-value Diversified real estate equity portfolio Reduced exposure to housing, auto and airline sectors Identified housing bubble early Decreased BBB and High Yield exposure over time Corporate Credit |
MetLife Investments Total Portfolio: Diversified portfolio across many sectors Liability Driven: Asset-liability management Team Investment Approach: 580+ investment and support professionals Risk Management: Part of our culture *Market value as of 12/31/08 Investment Grade Corporate Bonds Structured Finance Commercial and Agricultural Mortgages Cash and Short-Term US Treasury/Agency Below Investment Grade Credit Real Estate Equity Corporate Equity East 32.9 20.2 16.2 13 7.2 3.9 3.5 3.1 $293.4 Billion of Managed Assets* See Appendix for non-GAAP financial information reconciliations. |
Portfolio Trends Dec -07* Dec -08 U.S. Treasury/Agency 6.7% 7.3% Structured Finance RMBS CMBS ABS Total Structured Finance 17.5% 5.4% 3.4% 26.3% 12.3% 4.3% 3.6% 20.2% Credit 'A' or Better Corporates 'BBB' Corporates Below Investment Grade Credit Total Credit 21.3% 14.2% 5.5% 41.0% 20.3% 12.6% 3.9% 36.7% Real Estate Comm and Other Consumer Loans Agricultural Mortgages Real Estate Equity Total Real Estate 11.4% 3.5% 3.3% 18.2% 12.0% 4.2% 3.5% 19.7% Corporate Equity Cash & Short-Term Total Managed Assets 3.8% 4.0% 100% 3.1% 13.0% 100% *Excludes RGA and Texas Life See Appendix for non-GAAP financial information reconciliations. |
High Quality Structured Finance Portfolio $70.3 billion book value* $59.2 billion market value* Collateral characteristics and tranche selection is critical *As of 12/31/08 12/31/2007 12/31/2008 RMBS 0.175 0.123 CMBS 0.054 0.043 ABS 0.034 0.036 Structured Finance as a % of Managed Assets $82.6B $59.2B 3.4% 5.4% 17.5% 12.3% 4.3% 3.6% 20.2% 26.3% See Appendix for non-GAAP financial information reconciliations. |
MetLife RMBS Holdings Positioned Conservatively $10.5 billion book value* $7.9 billion market value* 38% Super Senior 96% Fixed Rate is key *As of 12/31/08 **Source: Hybrid ARMs (2003-2007): UBS AG; Loan-to-Value (2003-2007): J.P.Morgan; Credit Enhancement (2005-2007): Fitch Ratings Statistics MetLife* Market** Fixed Rate 96% 50% Hybrid ARMs 4% 50% Loan-to-Value 67% 71% Credit Enhancement 6.1% 4.8% Non-Agency Prime RMBS |
MET 60+ DQ Non-Agency Prime RMBS MetLife versus Market Better collateral results in better performance MET C/E* Market C/E* Market 60+ DQ 60+DQ or C/E Level Loan Age in Months Credit Enhancement & Delinquencies *Credit Enhancement as of 12/31/08 Source: Intex; Data as of 12/31/08; Delinquencies weighted by Loan Age, 05-07 |
Non-Agency Prime RMBS Price Does Not Convey Full Story Bond 1 Bond 2 Non-Agency RMBS $59 $57 Current Rating AAA AAA Vintage 2005 2007 FICO 749 730 LTV 66 71 60+ Days Delinquencies 0.5% 5.7% Expected Coverage 14.7x 1.3x As of 2/25/2009 |
MetLife RMBS Holdings Positioned Conservatively $5.3 billion book value* $3.4 billion market value* 83% Super Senior 92.4% of 2006-2007 vintages are Super Senior No Option ARMs and 88% Fixed Rate is key MetLife* Market** Option ARMs 0% 29% Hybrid ARMs 12% 36% Fixed Rate 88% 35% Loan-to-Value 69% 74% Credit Enhancement 11.5% 7.0% Alt-A *As of 12/31/08 **Source: Option ARMs, Fixed Rate & Hybrid ARMs (2005-2007): Merrill Lynch (Mortgage Round-Up); Loan-to-Value (2005-2007): J.P.Morgan; Credit Enhancement (2005-2007): Fitch Ratings |
Alt-A RMBS MetLife versus Market Better collateral results in better performance *Credit Enhancement as of 12/31/08 Source: Intex; Data as of 12/31/08; Delinquencies weighted by Loan Age, 05-07 Credit Enhancement & Delinquencies MET C/E* Market C/E* Market 60+ DQ with Option ARMs MET 60+ DQ Market 60+ DQ without Option ARMs 60+DQ or C/E Level |
Alt-A RMBS Price Does Not Convey Full Story Bond 1 Bond 2 Alt-A $52 $54 Current Rating AA B Vintage 2006 2006 LTV 68 74 Interest Only Loans 24% 46% 60+ Days Delinquencies 11.6% 24.9% Expected Coverage 2.1x 0.7x As of 2/25/2009 |
MetLife's CMBS Positioned for Downturn $16.1 billion book value* $12.6 billion market value* 23% average credit enhancement for conduits No exposure to CMBX $183 million book value CRE CDO holdings AAA AA A BBB BB and Below East 93 4 1 1 1 CMBS Holdings by Ratings *As of 12/31/08 1% 1% 1% 4% 93% |
Seasoned, High Quality CMBS Holdings 16% from 2006-2007 vintage vs. 50% of the market 91% of 2006-2007 vintages are Super Senior and Senior AAA *Market value as of 12/31/08 CMBS Holdings by Vintage* Below BBB 67 10 0 0 BBB 35 1 36 9 A 165 13 14 28 AA 372 49 39 28 AAA 7,230 2,664 1,348 535 77 81 220 488 11,778 Total Total 7,869 2,737 1,437 600 12,644 0 0 0 0 1 1 2004 and Prior 2005 2006 2007 2008 AAA 7230 2664 1348 535 1 AA 372 49 39 28 0 A 165 13 14 28 0 BBB 35 1 36 9 0 Below BBB 67 10 0 0 0 ($ Millions) |
Bond 1 Bond 2 CMBS $33 $33 Current Ratings Senior AAA Senior AAA Vintage 2007 2007 Loans on Servicer Watch List 5.0% 51.2% Debt Service Coverage (DSC) 1.6x 1.2x Loans with DSC <1x 2.1% 21.4% Expected Coverage 2.4x 1.0x CMBS Price Does Not Convey Full Story As of 3/6/09 |
Ratings Actions Through 12/31/08 Source: Bloomberg RATT function The Market represents all new issuances from 2004 through 2008. The Alt-A Market of 129.8% reflects 1) the same securities that were downgraded multiple times during 2008, and 2) downgraded securities issued prior to 2004. The Subprime Market of 127.4% reflects 1) the same securities that were downgraded multiple times during 2008, and 2) downgraded securities issued prior to 2004. MetLife Subprime RMBS Downgrades include Wrapped securities. Excluding Wrapped securities the MetLife Downgrade % by Count and MV are 24% and 18% respectively. Rating Actions Impact by the Count of Security |
Reduced Risk in Credit Portfolio $122.0 billion book value* $107.7 billion market value* 89% Investment Grade Decreased 'BBB' and Below Investment Grade exposure Approximately 30% private placements 12/31/2007 12/31/2008 AAA/AA/A 0.213 0.203 BBB 0.142 0.126 Below Inv Grade 0.055 0.039 Corporate Credit as a % of Managed Assets 41.0% 36.7% $128.6B $107.7B *As of 12/31/08 See Appendix for non-GAAP financial information reconciliations. |
Defensively Positioned Below Investment Grade Portfolio $15.7 billion book value* $11.3 billion market value* Reduced below investment grade credit from 5.5%** to 3.9%* Portfolio repositioned to reduce holdings in cyclical sectors Higher allocation to BB rated credits BB B CCC and Below Other MetLife 0.62 0.32 0.06 145 Market 0.41 0.35 0.24 Below Investment Grade Credit by Rating* * As of 12/31/08 **Market value as of 12/31/07 See Appendix for non-GAAP financial information reconciliations. |
High Quality Real Estate and Agricultural Investments 12/31/2007 12/31/2008 Commercial Mortgages 0.114 0.1195 Agricultural Mortgages 0.034 0.042 Real Estate Equity 0.033 0.035 Real Estate & Agricultural Investments as a % of Managed Assets* $56.9B $57.8B 3.3% 3.4% 11.4% 12.0% 4.2% 3.5% 19.7% 18.1% Focus primarily on Class 'A' properties in primary markets Loan to Value (LTV) 58% Commercial Mortgage Average LTV 49% Agricultural Mortgage Average LTV Diversified Real Estate equity portfolio *Market value as of 12/31/08 See Appendix for non-GAAP financial information reconciliations. |
2003 2004 2005 2006 2007 6/30/1905 MetLife LTV 0.65 0.66 0.63 0.62 0.61 0.53 CMBS LTV 0.723 0.725 0.727 0.73 0.71 0.7 70% CMBS LTV** Average Loan to Value Commercial Mortgage Portfolio Defensively Positioned $36.0 billion* Decreased portfolio LTV as market became more aggressive Underwritten to sustainable values and property incomes Only $3 million delinquent* * Book value as of 12/31/08 **Source: Moody's Investor Service MetLife LTV MetLife LTV vs. Market LTV at Loan Origination |
Positioned to Withstand Value Declines Below 65% LTV 65% to 75% LTV 75-80% LTV Above 80% LTV MetLife LTV 0.63 0.29 0.05 0.03 Positioned to withstand 40% property value declines Approximately 3% of portfolio has LTV greater than 80% Commercial Mortgage Portfolio LTV* *As of 12/31/08 |
Summary Diversified portfolio across fixed income, real estate, agricultural and equity sectors Focus on risk management, underwriting and proactive portfolio management Defensively positioned for current environment |
MetLife - Positioned to Win Diverse mix of businesses Our capital position is strong Our investment portfolio is defensively positioned We continue to benefit from the flight to quality |
Reconciliation of Total Investments to Market Value of Managed Assets ($ Billions) 12/31/2007 12/31/2008 Total Investments 318.0 298.3 Plus Cash and Cash Equivalents 10.0 24.2 Less Policy Loans (9.3) (9.8) Less Other Invested Assets (8.1) (17.3) Less Mortgages Held For Sale 0.0 (2.0) Adjustment to Real Estate to reflect Carrying Value 4.0 0.9 Less Trading Securities, at estimated fair value (0.8) (0.9) Market Value of Managed Assets 313.8 293.4 |