Bill Toppeta President MetLife International Barclays Conference May 6-7, 2009 |
Safe Harbor Statement These materials may contain or incorporate by reference information that includes or is based upon forward-looking statements within the meaning of the Private Securities Litigation Reform Act of 1995. Forward-looking statements give expectations or forecasts of future events. These statements can be identified by the fact that they do not relate strictly to historical or current facts. They use words such as "anticipate," "estimate," "expect," "project," "intend," "plan," "believe" and other words and terms of similar meaning in connection with a discussion of future operating or financial performance. In particular, these include statements relating to future actions, prospective services or products, future performance or results of current and anticipated services or products, sales efforts, expenses, the outcome of contingencies such as legal proceedings, trends in operations and financial results. Any or all forward-looking statements may turn out to be wrong. They can be affected by inaccurate assumptions or by known or unknown risks and uncertainties. Many such factors will be important in determining MetLife's actual future results. These statements are based on current expectations and the current economic environment. They involve a number of risks and uncertainties that are difficult to predict. These statements are not guarantees of future performance. Actual results could differ materially from those expressed or implied in the forward-looking statements. Risks, uncertainties, and other factors that might cause such differences include the risks, uncertainties and other factors identified in MetLife, Inc.'s filings with the U.S. Securities and Exchange Commission ("SEC"). These factors include: (i) difficult and adverse conditions in the global and domestic capital and credit markets; (ii) continued volatility and further deterioration of the capital and credit markets, which may affect the Company's ability to seek financing or access its credit facilities; (iii) uncertainty about the effectiveness of the U.S. government's plan to stabilize the financial system by injecting capital into financial institutions, purchasing large amounts of illiquid, mortgage-backed and other securities from financial institutions, or otherwise; (iv) the impairment of other financial institutions; (v) potential liquidity and other risks resulting from MetLife's participation in a securities lending program and other transactions; (vi) exposure to financial and capital market risk; (vii) changes in general economic conditions, including the performance of financial markets and interest rates, which may affect the Company's ability to raise capital, generate fee income and market-related revenue and finance statutory reserve requirements and may require the company to pledge collateral or make payments related to declines in value of specified assets; (viii) defaults on the Company's mortgage and consumer loans; (ix) investment losses and defaults, and changes to investment valuations; (x) impairments of goodwill and realized losses or market value impairments to illiquid assets; (xi) unanticipated changes in industry trends; (xii) heightened competition, including with respect to pricing, entry of new competitors, consolidation of distributors, the development of new products by new and existing competitors and for personnel; (xiii) discrepancies between actual claims experience and assumptions used in setting prices for the Company's products and establishing the liabilities for the Company's obligations for future policy benefits and claims; (xiv) discrepancies between actual experience and assumptions used in establishing liabilities related to other contingencies or obligations; (xv) ineffectiveness of risk management policies and procedures, including with respect to guaranteed benefit riders (which may be affected by fair value adjustments arising from changes in our own credit spread) on certain of the Company's variable annuity products; (xvi) increased expenses relating to pension and post-retirement benefit plans, (xvii) catastrophe losses; (xviii) changes in assumptions related to deferred policy acquisition costs, value of business acquired or goodwill; (xix) downgrades in MetLife, Inc.'s and its affiliates' claims paying ability, financial strength or credit ratings; (xx) economic, political, currency and other risks relating to the Company's international operations; (xx) availability and effectiveness of reinsurance or indemnification arrangements, (xxi) regulatory, legislative or tax changes that may affect the cost of, or demand for, the Company's products or services; (xxii) changes in accounting standards, practices and/or policies; (xxiii) adverse results or other consequences from litigation, arbitration or regulatory investigations; (xxiv) deterioration in the experience of the "closed block" established in connection with the reorganization of Metropolitan Life Insurance Company; (xxv) the effects of business disruption or economic contraction due to terrorism, other hostilities, or natural catastrophes; (xxvi) MetLife's ability to identify and consummate on successful terms any future acquisitions, and to successfully integrate acquired businesses with minimal disruption; (xxvii) MetLife, Inc.'s primary reliance, as a holding company, on dividends from its subsidiaries to meet debt payment obligations and the applicable regulatory restrictions on the ability of the subsidiaries to pay such dividends; and (xxviii) other risks and uncertainties described from time to time in MetLife, Inc.'s filings with the SEC. MetLife, Inc. does not undertake any obligation to publicly correct or update any forward-looking statement if MetLife, Inc. later becomes aware that such statement is not likely to be achieved. Please consult any further disclosures MetLife, Inc. makes on related subjects in reports to the SEC. |
Explanatory Note on Non-GAAP Financial Information All references in this presentation to net income (loss), net income (loss) per share, operating earnings and operating earnings per share should be read as net income (loss) available to MetLife, Inc.'s common shareholders, net income (loss) available to MetLife, Inc.'s common shareholders per diluted common share, operating earnings available to MetLife, Inc.'s common shareholders and operating earnings available to MetLife, Inc.'s common shareholders per diluted common share, respectively. Net income (loss) available to MetLife, Inc.'s common shareholders and net income (loss) available to MetLife, Inc.'s common shareholders per diluted common share are defined as Generally Accepted Accounting Principles ("GAAP") net income (loss) available to MetLife, Inc.'s common shareholders and GAAP net income (loss) available to MetLife, Inc.'s common shareholders per diluted common share less preferred stock dividends, respectively. The historical and forward-looking financial information presented in this press release includes performance measures which are based on methodologies other than GAAP. MetLife analyzes its performance using so-called non-GAAP measures, including operating earnings, operating earnings per share and operating return on common equity. MetLife believes these measures enhance the understanding and comparability of its performance by excluding net investment gains and losses, net of income tax, and adjustments related to net investment gains and losses, net of income tax, both of which can fluctuate significantly from period to period, and adjustments related to acquisition costs, net of income tax, discontinued operations other than discontinued real estate, net of income tax, and noncontrolling interests, thereby highlighting the results from operations and the underlying profitability drivers of the business. Operating earnings available to MetLife, Inc.'s common shareholders and operating earnings available to MetLife, Inc.'s common shareholders per diluted common share should not be viewed as substitutes for GAAP net income (loss) available to MetLife, Inc.'s common shareholders and GAAP net income (loss) available to MetLife, Inc.'s common shareholders per diluted common share, respectively. Operating earnings is defined as GAAP net income (loss) attributable to MetLife, Inc., excluding net investment gains and losses, net of income tax, adjustments related to net investment gains and losses, net of income tax, adjustments related to acquisition costs, net of income tax, and discontinued operations other than discontinued real estate, net of income tax, less preferred stock dividends. Scheduled periodic settlement payments on derivative instruments not qualifying for hedge accounting treatment are included in operating earnings. Operating earnings available to MetLife, Inc.'s common shareholders is defined as operating earnings less preferred stock dividends, which are recorded in Corporate & Other. Operating earnings available to MetLife, Inc.'s common shareholders per diluted common share is calculated by dividing operating earnings available to MetLife, Inc.'s common shareholders by the number of weighted average diluted common shares outstanding for the period indicated. Operating return on common equity is calculated by dividing operating earnings available to MetLife, Inc.'s common shareholders by average MetLife, Inc. common equity for the period indicated, excluding accumulated other comprehensive income. |
Key Themes MetLife: Big, Strong and Trusted International is an increasingly important part of MetLife International is a growth engine for MetLife Sound strategy and focus on the fundamentals International diversification provides earnings stability Growth continues despite difficult macroeconomic environment |
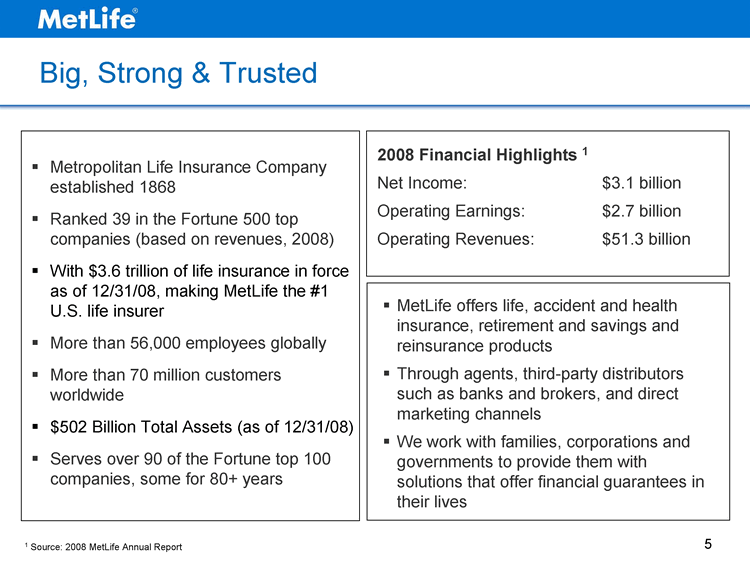
Big, Strong & Trusted Metropolitan Life Insurance Company established 1868 Ranked 39 in the Fortune 500 top companies (based on revenues, 2008) With $3.6 trillion of life insurance in force as of 12/31/08, making MetLife the #1 U.S. life insurer More than 56,000 employees globally More than 70 million customers worldwide $502 Billion Total Assets (as of 12/31/08) Serves over 90 of the Fortune top 100 companies, some for 80+ years 2008 Financial Highlights 1 Net Income: $3.1 billion Operating Earnings: $2.7 billion Operating Revenues: $51.3 billion MetLife offers life, accident and health insurance, retirement and savings and reinsurance products Through agents, third-party distributors such as banks and brokers, and direct marketing channels We work with families, corporations and governments to provide them with solutions that offer financial guarantees in their lives 1 Source: 2008 MetLife Annual Report |
LatAm Region: - - Argentina - - Brazil - - Chile - Mexico - Uruguay EIME Region: - - Belgium - - India - - Ireland - - Poland - - UK Asia Pac Region: - - Australia - - China - - Hong Kong - - Japan - - South Korea - - Taiwan 1 Life insurance premium generated in countries where MetLife is licensed to sell, expressed as a percentage of total global life insurance premium volume. Source: Swiss Re - World Insurance Report 2007 MetLife has access to over 90% of the world's life insurance market1 |
International is becoming an increasingly important part of MetLife... 2004 2008 3rd Qtr 4th Qtr East 0.92 0.86 90 20.4 Premiums & Fees 0.08 0.14 34.6 31.6 North 45.9 46.9 45 43.9 2004 2008 3rd Qtr 4th Qtr East 0.92 0.86 90 20.4 Operating Earnings 0.06 0.19 34.6 31.6 North 45.9 46.9 45 43.9 Increasing our contributions to the enterprise on both the top line and the bottom line 1 1 1 International segment share of MetLife overall premium & fees and operating earnings. Source: 2004 and 2008 MetLife Annual Reports |
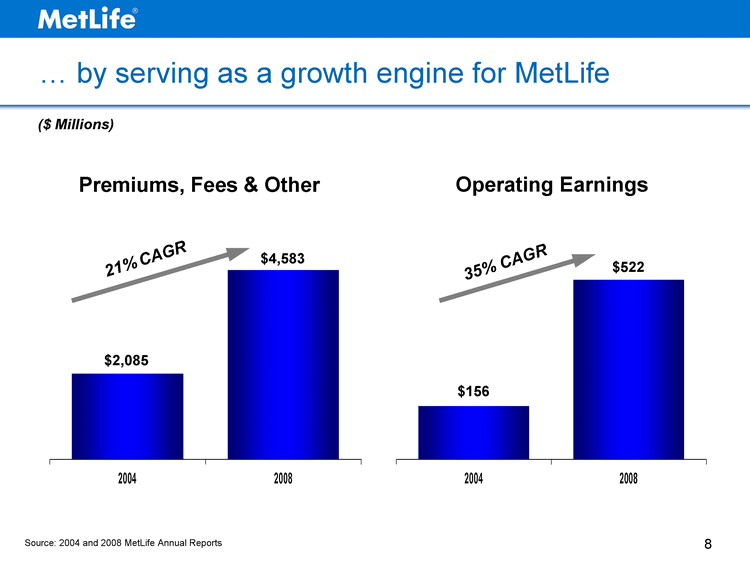
2004 2006 2007 2008 2085 180 423 4583 APAC 51 84 160 143 EMEI -6 -45 -26 -37 .... by serving as a growth engine for MetLife 2004 2006 2007 2008 156 1925.3 2203.7 522 APAC 1070.2 1345.3 1607.2 1700.4 EMEI 130.8 284.7 303.5 410.3 21% CAGR $2,085 $4,583 ($ Millions) Premiums, Fees & Other $156 $522 Operating Earnings 35% CAGR Source: 2004 and 2008 MetLife Annual Reports |
Sound International strategy based on diversification and focus on the fundamentals Focusing on middle market and mass affluent consumers Customers Delivering quality risk & protection and retirement & savings products Products Distributing through proprietary channels and third party distributors Leveraging MetLife's brand, financial strength and risk management expertise Global Strengths Distribution The fundamental tenets of our business are the same globally, however the business models are appropriate to the local market environment |
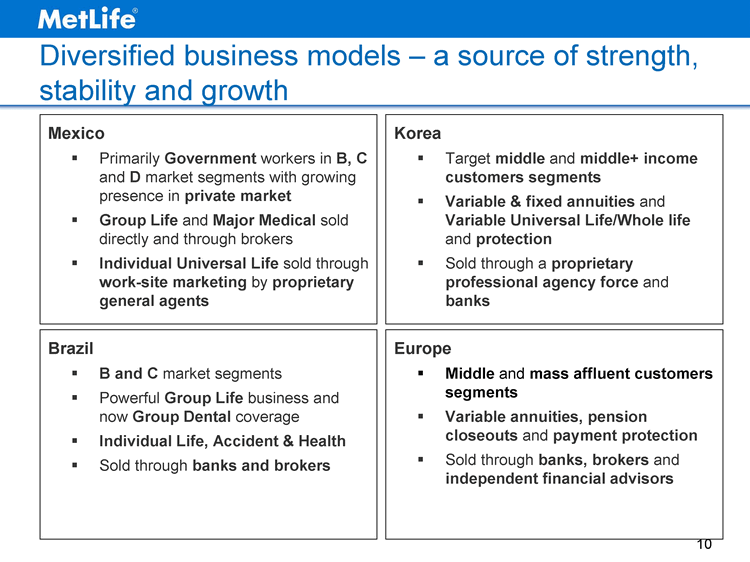
Diversified business models - a source of strength, stability and growth Mexico Primarily Government workers in B, C and D market segments with growing presence in private market Group Life and Major Medical sold directly and through brokers Individual Universal Life sold through work-site marketing by proprietary general agents Korea Target middle and middle+ income customers segments Variable & fixed annuities and Variable Universal Life/Whole life and protection Sold through a proprietary professional agency force and banks Brazil B and C market segments Powerful Group Life business and now Group Dental coverage Individual Life, Accident & Health Sold through banks and brokers Europe Middle and mass affluent customers segments Variable annuities, pension closeouts and payment protection Sold through banks, brokers and independent financial advisors |
2009 Banks 683.5 DM 669.8 Financial Advisors 380.1 Institutional(Brokers & Direct) 669.5 Proprietary Agents 947.1 WSM 1144 2009 Group Life 778.7 Group Medical 375.3 UL 503.3 Traditional Life 1109.7 Payment Protection 505.2 VA/VUL 539.5 Fixed Annuity 403.6 Other 397.7 Our broad diversification improves risk profile and produces strong results Product Distribution 1 Premiums Fees and Other excludes unconsolidated joint ventures in Japan and China 2008 Premiums, Fees & Other 1 = $4.6B |
Sales force: In 2008, MetLife China added 488 sales representatives for combined Agency, Bancassurance and DM channels, raising our total to 2,462 During 1Q09, the sales force has increased to 2,702 and will be increased to 3,271 by the end of 2009 Branch expansion: Since the beginning of 2008 our China business has added 4 additional cities bringing total to 11 In 2009 we expect to expand into 4 more cities Bank distribution: As of 1Q 2009, we have bank distribution relationships with 15 major banks nationwide, led by SOE banks such as ICBC and BOC, and foreign banks such as Citibank 3 more partner banks are planned to be launched in 2009 2004 2005 2006 'Dec 07 'Mar 09 'Dec 09 (E) 10 27 53 1974 2702 3271 Sales Force 'Dec 07 'Mar 09 'Dec 09 (E) 7 11 15 Cities 'Jan 08 'Mar 09 'Dec 09 (E) 10 15 18 Bank Distribution Partners China: Distribution expansion continues |
New business growth 1: MetLife India new sales in 2008 up 87% YOY vs. 14% for Industry and 41% for private life insurers Jan-Feb 2009, new sales grew 8% while the Industry dropped 22% compared to Jan-Feb 2008 Agency growth: Our business in India expanded its agency sales force from 32,389 to 53,766, or a 66% growth in 2008 In 2009, we will continue growing our agency sales force to approximately 75,000 by year end Since the beginning of 2008 we have added 105 additional sales offices bringing the total number of sales offices to 192 Bancassurance: MetLife India's multi-channel distribution strategy has a healthy mix between bancassurance, and proprietary agency sales force India Infoline distribution partnership, started March 2009 with access to 120 branches nationwide 2004 2005 2006 2007 'Dec 07 'Mar 09 'Dec 09 (E) 2011 10 27 53 152.5 32389 61896 74658 570 Agency Growth India: Growth of agency and bancassurance Total industry Private Insurers MetLife FY 2008 0.14 0.41 0.87 Business Growth 1 1 Based on weighted first year gross written premium (single premium at 10% and regular premium at 100%). Gross written premiums information from insurance regulator (IRDA) 2 2008 MetLife India sales by channel distribution YOY 2008 Growth Bancassurance 57% Agency 39% Institutional 4% Bancassurance 2 |
2004 2005 2006 2007 'Nov 08 'Mar 09 2010 2011 Sales 10 27 53 152.5 312 739 538 570 2004 2005 2006 2007 'Nov 08 'Mar 09 2010 2011 10 27 53 152.5 128000 154000 538 570 2004 2005 2006 2007 'Nov 08 'Mar 09 2010 2011 10 27 53 152.5 4000 7800 538 570 Dentist Network Number of Cities Covered People Brazil Dental: Rapid growth of MetLife capabilities Significant opportunity in the dental market: Annual premiums of US$600M at a 23% CAGR 1 from 2003 to 2007 Low penetration - 90% of formal workers (32 million) do not have dental coverage Higher profit margins than basic life insurance In November 2008 MetLife Brazil acquired Odonto A and since then has: More than doubled city coverage to 739 cities Added 3,800 dentists to network now totaling 7,800 Increased covered people by approximately 20% to 154,000 Leveraged MetLife expertise 1 23% CAGR is calculated at local currency (Brazilian Real) |
MetLife International is still all about Growth International is an increasingly important part of MetLife International growth based upon diversification: geographic, business model, product and distribution Sound strategy and focus on the fundamentals Growth continues despite a challenging environment |