MetLife, Inc. Annual Investor Day
Monday, December 6, 2010
AGENDA
| | | |
| Topic | | Presenters |
| Registration / Continental Breakfast | | |
| | | |
| Outline of Day | | Conor Murphy |
| | | |
| Overview | | C. Robert Henrikson |
| | | |
| Investments | | Steven A. Kandarian |
| | | |
| Finance | | William J. Wheeler |
| | | |
| Investments & Finance Q&A | | Steven A. Kandarian
William J. Wheeler |
| | | |
| Break | | |
| | | |
| U.S. Business | | William J. Mullaney |
| | | |
| International | | William J. Toppeta |
| | | |
| Q&A | | All |
| INVESTOR DAY 2 0 1 0 Conor Murphy Vice President Investor Relations |
| These materials may contain or incorporate by reference information that includes or is based upon forward-looking statements within the meaning of the Private Securities Litigation Reform Act of 1995. Forward-looking statements give expectations or forecasts of future events. These statements can be identified by the fact that they do not relate strictly to historical or current facts. They use words such as "anticipate," "estimate," "expect," "project," "intend," "plan," "believe" and other words and terms of similar meaning in connection with a discussion of future operating or financial performance. In particular, these include statements relating to future actions, prospective services or products, future performance or results of current and anticipated services or products, sales efforts, expenses, the outcome of contingencies such as legal proceedings, trends in operations and financial results. Any or all forward-looking statements may turn out to be wrong. They can be affected by inaccurate assumptions or by known or unknown risks and uncertainties. Many such factors will be important in determining the actual future results of MetLife, Inc. and its subsidiaries. These statements are based on current expectations and the current economic environment. They involve a number of risks and uncertainties that are difficult to predict. These statements are not guarantees of future performance. Actual results could differ materially from those expressed or implied in the forward-looking statements. Risks, uncertainties, and other factors that might cause such differences include the risks, uncertainties and other factors identified in MetLife, Inc.'s filings with the U.S. Securities and Exchange Commission (the "SEC"). These factors include: (1) difficult conditions in the global capital markets; (2) increased volatility and disruption of the capital and credit markets, which may affect our ability to seek financing or access our credit facilities; (3) uncertainty about the effectiveness of the U.S. government's programs to stabilize the financial system, the imposition of fees relating thereto, or the promulgation of additional regulations; (4) impact of comprehensive financial services regulation reform on us; (5) exposure to financial and capital market risk; (6) changes in general economic conditions, including the performance of financial markets and interest rates, which may affect our ability to raise capital, generate fee income and market-related revenue and finance statutory reserve requirements and may require us to pledge collateral or make payments related to declines in value of specified assets; (7) potential liquidity and other risks resulting from our participation in a securities lending program and other transactions; (8) investment losses and defaults, and changes to investment valuations; (9) impairments of goodwill and realized losses or market value impairments to illiquid assets; (10) defaults on our mortgage loans; (11) the impairment of other financial institutions that could adversely affect our investments or business; (12) our ability to address unforeseen liabilities, asset impairments, loss of key contractual relationships, or rating actions arising from acquisitions or dispositions, including our acquisition of American Life Insurance Company ("Alico"), a subsidiary of Alico Holdings LLC ("Alico Holdings"), and Delaware American Life Insurance Company (collectively, the "Acquisition") and to successfully integrate and manage the growth of acquired businesses with minimal disruption; (13) uncertainty with respect to the outcome of the closing agreement entered into between Alico and the United States Internal Revenue Service in connection with the Acquisition; (14) uncertainty with respect to the making of elections under Section 338 of the U.S. Internal Revenue Code of 1986, as amended, and any benefits therefrom, in connection with the Acquisition; (15) the dilutive impact on our stockholders resulting from the issuance of equity securities to Alico Holdings in connection with the Acquisition; (16) downward pressure on our stock price as a result of Alico Holdings' ability to sell its equity securities; (17) the conditional payment obligation of approximately $300 million to Alico Holdings if the conversion of the preferred stock issued to Alico Holdings in connection with the Acquisition into our common stock is not approved; (18) economic, political, currency and other risks relating to our international operations, including with respect to fluctuations of exchange rates; (19) our primary reliance, as a holding company, on dividends from our subsidiaries to meet debt payment obligations and the applicable regulatory restrictions on the ability of the subsidiaries to pay such dividends; (20) downgrades in our and our Safe Harbor Statement |
| affiliates' claims paying ability, financial strength or credit ratings; (21) ineffectiveness of risk management policies and procedures; (22) availability and effectiveness of reinsurance or indemnification arrangements, as well as default or failure of counterparties to perform; (23) discrepancies between actual claims experience and assumptions used in setting prices for our products and establishing the liabilities for our obligations for future policy benefits and claims; (24) catastrophe losses; (25) heightened competition, including with respect to pricing, entry of new competitors, consolidation of distributors, the development of new products by new and existing competitors, distribution of amounts available under U.S. government programs, and for personnel; (26) unanticipated changes in industry trends; (27) changes in accounting standards, practices and/or policies; (28) changes in assumptions related to deferred policy acquisition costs, deferred sales inducements, value of business acquired or goodwill; (29) increased expenses relating to pension and postretirement benefit plans, as well as health care and other employee benefits; (30) exposure to losses related to variable annuity guarantee benefits, including from significant and sustained downturns or extreme volatility in equity markets, reduced interest rates, unanticipated policyholder behavior, mortality or longevity, and the adjustment for nonperformance risk; (31) deterioration in the experience of the "closed block" established in connection with the reorganization of Metropolitan Life Insurance Company; (32) adverse results or other consequences from litigation, arbitration or regulatory investigations; (33) inability to protect our intellectual property rights or claims of infringement of the intellectual property rights of others, (34) discrepancies between actual experience and assumptions used in establishing liabilities related to other contingencies or obligations; (35) regulatory, legislative or tax changes relating to our insurance, banking, international, or other operations that may affect the cost of, or demand for, our products or services, impair our ability to attract and retain talented and experienced management and other employees, or increase the cost or administrative burdens of providing benefits to employees; (36) the effects of business disruption or economic contraction due to terrorism, other hostilities, or natural catastrophes, including any related impact on our disaster recovery systems and management continuity planning which could impair our ability to conduct business effectively; (37) the effectiveness of our programs and practices in avoiding giving our associates incentives to take excessive risks; and (38) other risks and uncertainties described from time to time in MetLife, Inc.'s filings with the SEC. We do not undertake any obligation to publicly correct or update any forward-looking statement if we later become aware that such statement is not likely to be achieved. Please consult any further disclosures MetLife, Inc. makes on related subjects in reports to the SEC. Safe Harbor Statement (Continued) |
| All references in these slides and in the presentations made at Investor Day to net income (loss), net income (loss) per share, operating earnings and operating earnings per share should be read as net income (loss) available to MetLife, Inc.'s common shareholders, net income (loss) available to MetLife, Inc.'s common shareholders per diluted common share, operating earnings available to common shareholders and operating earnings available to common shareholders per diluted common share, respectively. The historical and forward-looking financial information presented at Investor Day and contained in the presentations include performance measures which are based on methodologies other than generally accepted accounting principles ("GAAP"). We analyze our performance using financial measures, such as operating earnings, operating revenues, operating expenses, operating earnings available to common shareholders and operating earnings available to common shareholders per diluted common share, that are not based on GAAP. We believe the presentation of operating earnings and operating earnings available to common shareholders as we measure it for management purposes enhances the understanding of our performance by highlighting the results of operations and the underlying profitability drivers of our businesses. Operating earnings, operating revenues, operating expenses, operating earnings available to common shareholders, operating earnings available to common shareholders per diluted common share and operating return on common equity should not be viewed as substitutes for GAAP net income (loss) from continuing operations, net of income tax, GAAP revenues, GAAP expenses, GAAP net income (loss) available to MetLife, Inc.'s common shareholders, GAAP net income (loss) available to MetLife, Inc.'s common shareholders per diluted common share, and return on common equity, respectively. Operating earnings is the measure of segment profit or loss that we use to evaluate segment performance and allocate resources and, consistent with GAAP accounting guidance for segment reporting, is MetLife's measure of segment performance. Operating earnings is also a measure by which our senior management's and many other employees' performance is evaluated for the purposes of determining their compensation under applicable compensation plans. Operating earnings is defined as operating revenues less operating expenses, net of income tax. Operating earnings available to common shareholders is defined as operating earnings less preferred stock dividends and operating earnings available to common shareholders per diluted common share is calculated by dividing operating earnings available to common shareholders by the number of weighted average diluted common shares outstanding for the period indicated. Operating revenues is defined as GAAP revenues (i) less net investment gains (losses) and net derivative gains (losses), (ii) less amortization of unearned revenue related to net investment gains (losses) and net derivative gains (losses), (iii) plus scheduled periodic settlement payments on derivatives that are hedges of investments but do not qualify for hedge accounting treatment, (iv) plus income from discontinued real estate operations and (v) plus, for operating joint ventures reported under the equity method of accounting, the aforementioned adjustments, those identified in the definition of operating expenses and changes in fair value of hedges of operating joint venture liabilities, all net of income tax. Operating expenses is defined as GAAP expenses (i) less changes in policyholder benefits associated with asset value fluctuations related to experience-rated contractholder liabilities and certain inflation-indexed liabilities, (ii) less costs related to business combinations and noncontrolling interests, (iii) less amortization of deferred policy acquisition costs and value of business acquired and changes in the policyholder dividend obligation related to net investment gains (losses) and net derivative gains (losses) and (iv) plus scheduled periodic settlement payments on derivatives that are hedges of policyholder account balances but do not qualify for hedge accounting treatment. Explanatory Note on Non-GAAP Financial Information |
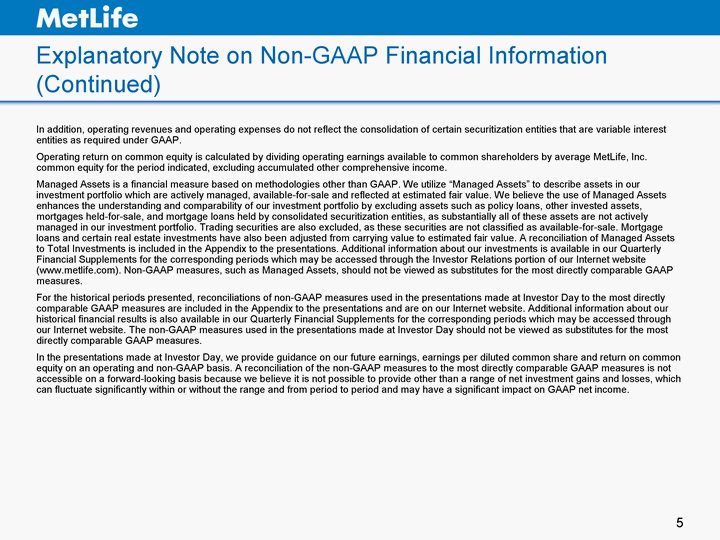
| In addition, operating revenues and operating expenses do not reflect the consolidation of certain securitization entities that are variable interest entities as required under GAAP. Operating return on common equity is calculated by dividing operating earnings available to common shareholders by average MetLife, Inc. common equity for the period indicated, excluding accumulated other comprehensive income. Managed Assets is a financial measure based on methodologies other than GAAP. We utilize "Managed Assets" to describe assets in our investment portfolio which are actively managed, available-for-sale and reflected at estimated fair value. We believe the use of Managed Assets enhances the understanding and comparability of our investment portfolio by excluding assets such as policy loans, other invested assets, mortgages held-for-sale, and mortgage loans held by consolidated securitization entities, as substantially all of these assets are not actively managed in our investment portfolio. Trading securities are also excluded, as these securities are not classified as available-for-sale. Mortgage loans and certain real estate investments have also been adjusted from carrying value to estimated fair value. A reconciliation of Managed Assets to Total Investments is included in the Appendix to the presentations. Additional information about our investments is available in our Quarterly Financial Supplements for the corresponding periods which may be accessed through the Investor Relations portion of our Internet website (www.metlife.com). Non-GAAP measures, such as Managed Assets, should not be viewed as substitutes for the most directly comparable GAAP measures. For the historical periods presented, reconciliations of non-GAAP measures used in the presentations made at Investor Day to the most directly comparable GAAP measures are included in the Appendix to the presentations and are on our Internet website. Additional information about our historical financial results is also available in our Quarterly Financial Supplements for the corresponding periods which may be accessed through our Internet website. The non-GAAP measures used in the presentations made at Investor Day should not be viewed as substitutes for the most directly comparable GAAP measures. In the presentations made at Investor Day, we provide guidance on our future earnings, earnings per diluted common share and return on common equity on an operating and non-GAAP basis. A reconciliation of the non-GAAP measures to the most directly comparable GAAP measures is not accessible on a forward-looking basis because we believe it is not possible to provide other than a range of net investment gains and losses, which can fluctuate significantly within or without the range and from period to period and may have a significant impact on GAAP net income. Explanatory Note on Non-GAAP Financial Information (Continued) |
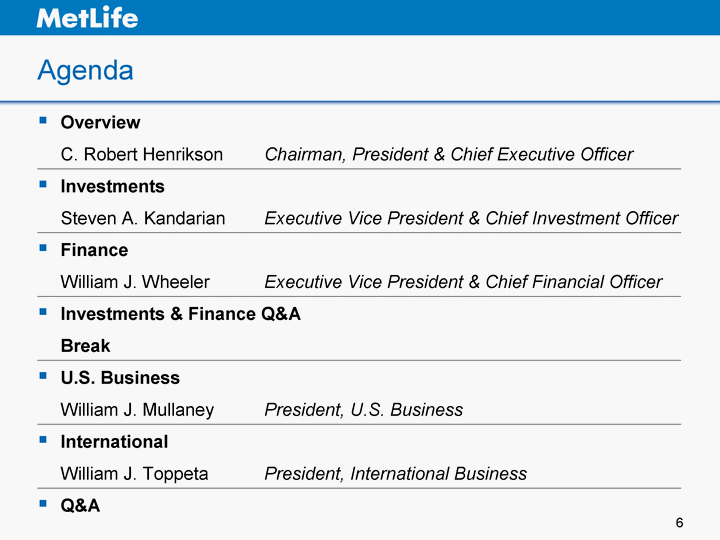
| Agenda Overview Overview Overview C. Robert Henrikson Chairman, President & Chief Executive Officer Investments Investments Investments Steven A. Kandarian Executive Vice President & Chief Investment Officer Finance Finance Finance William J. Wheeler Executive Vice President & Chief Financial Officer Investments & Finance Q&A Investments & Finance Q&A Investments & Finance Q&A Break Break Break U.S. Business U.S. Business U.S. Business William J. Mullaney President, U.S. Business International International International William J. Toppeta President, International Business Q&A Q&A Q&A |
| INVESTOR DAY 2 0 1 0 C. Robert Henrikson Chairman, President & Chief Executive Officer |
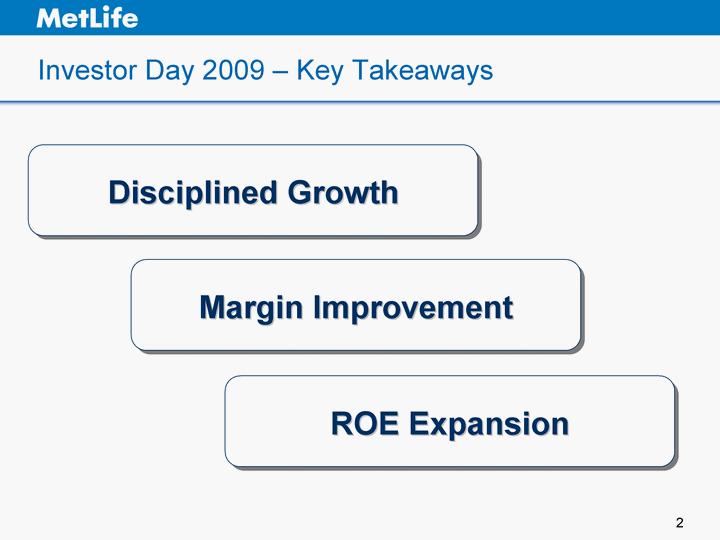
| Investor Day 2009 - Key Takeaways Disciplined Growth Margin Improvement ROE Expansion |
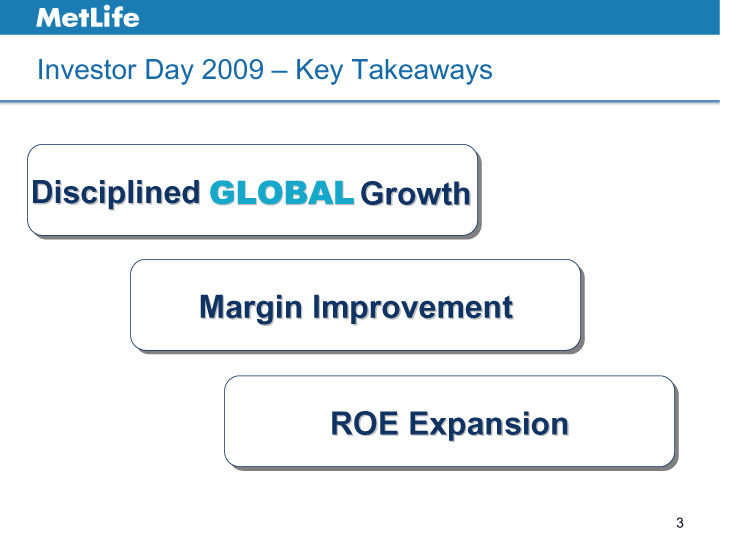
| Investor Day 2009 - Key Takeaways Margin Improvement ROE Expansion GLOBAL Disciplined Growth |
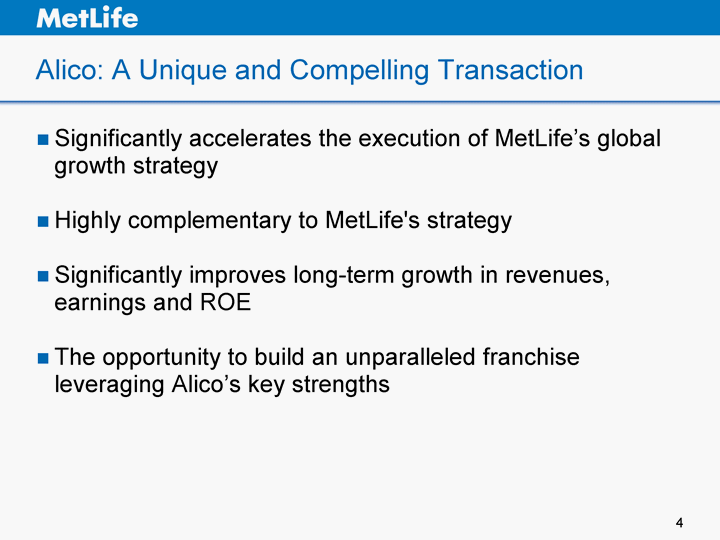
| Significantly accelerates the execution of MetLife's global growth strategy Highly complementary to MetLife's strategy Significantly improves long-term growth in revenues, earnings and ROE The opportunity to build an unparalleled franchise leveraging Alico's key strengths Alico: A Unique and Compelling Transaction |
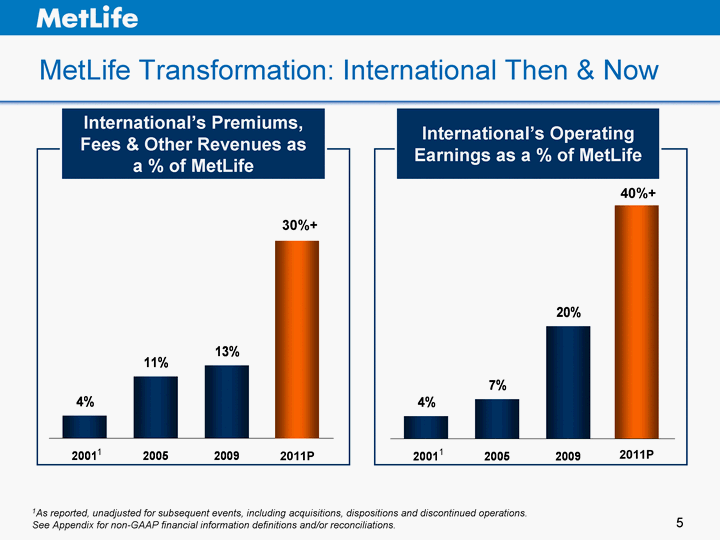
| MetLife Transformation: International Then & Now 2001 2005 2009 0.04 0.11 0.13 0.35 2001 2005 2009 0.04 0.07 0.2 0.41 40%+ 30%+ 1 1 International's Operating Earnings as a % of MetLife International's Premiums, Fees & Other Revenues as a % of MetLife 2011P 2011P 1As reported, unadjusted for subsequent events, including acquisitions, dispositions and discontinued operations. See Appendix for non-GAAP financial information definitions and/or reconciliations. |
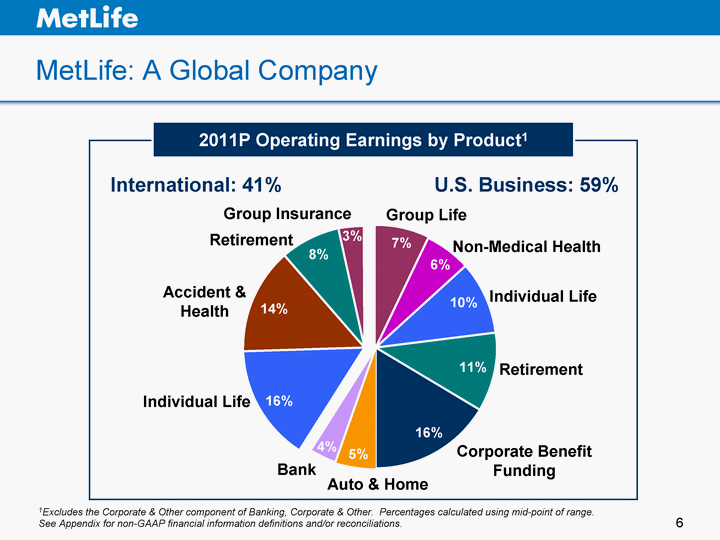
| MetLife: A Global Company 2011P Operating Earnings by Product1 International: 41% U.S. Business: 59% Individual Life Accident & Health Group Insurance Retirement Individual Life Auto & Home Non-Medical Health Retirement Bank Group Life Corporate Benefit Funding 4% 5% 16% 11% 10% 6% 7% 3% 8% 14% 16% See Appendix for non-GAAP financial information definitions and/or reconciliations. 1Excludes the Corporate & Other component of Banking, Corporate & Other. Percentages calculated using mid-point of range. |
| MetLife's Strengths as a Global Company We are financially strong We are disciplined in our growth We are diversified in product, geography, and distribution We have a powerful brand We are a worldwide industry leader We are One Global MetLife |
| INVESTOR DAY 2 0 1 0 Steven A. Kandarian Executive Vice President & Chief Investment Officer |
| Agenda Economic Outlook Portfolio Overview Gains and Losses Low Interest Rate Environment Select Updates Summary |
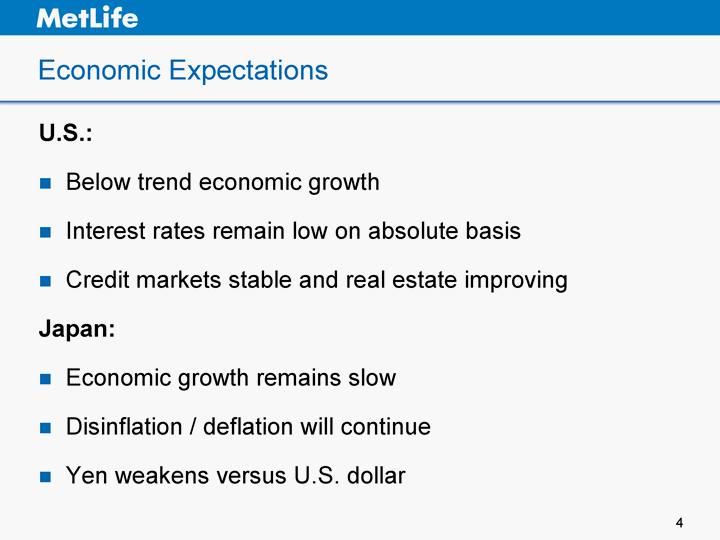
| Economic Expectations U.S.: Below trend economic growth Interest rates remain low on absolute basis Credit markets stable and real estate improving Japan: Economic growth remains slow Disinflation / deflation will continue Yen weakens versus U.S. dollar |
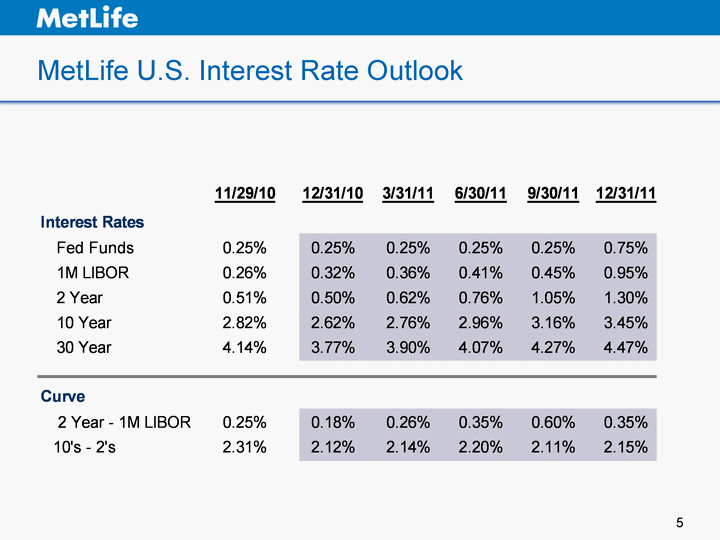
| MetLife U.S. Interest Rate Outlook |
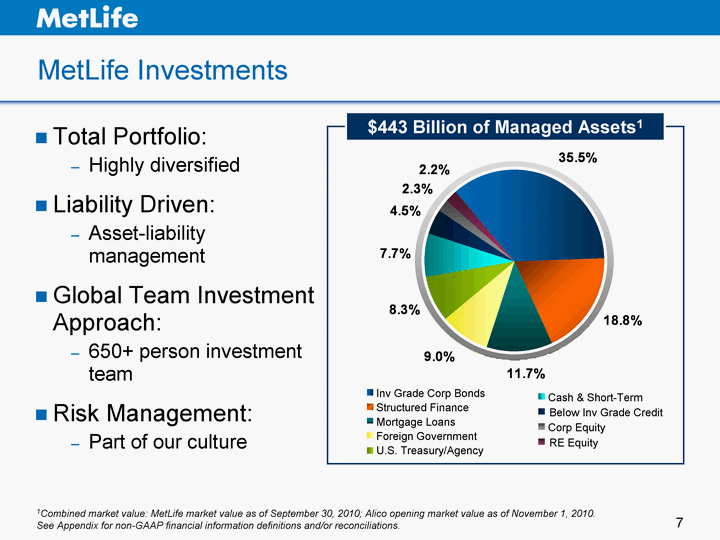
| MetLife Investments Total Portfolio: Highly diversified Liability Driven: Asset-liability management Global Team Investment Approach: 650+ person investment team Risk Management: Part of our culture $443 Billion of Managed Assets1 Inv Grade Corp Bonds Structured Finance Mortgage Loans Foreign Government U.S. Treasury/Agency Cash & Short-Term Below Inv Grade Credit Corp Equity RE Equity East 35.5 18.8 11.7 9 8.3 7.7 4.5 2.3 2.2 1Combined market value: MetLife market value as of September 30, 2010; Alico opening market value as of November 1, 2010. See Appendix for non-GAAP financial information definitions and/or reconciliations. .. Inv Grade Corp Bonds Structured Finance Mortgage Loans Foreign Government U.S. Treasury/Agency Cash & Short-Term Below Inv Grade Credit Corp Equity RE Equity |
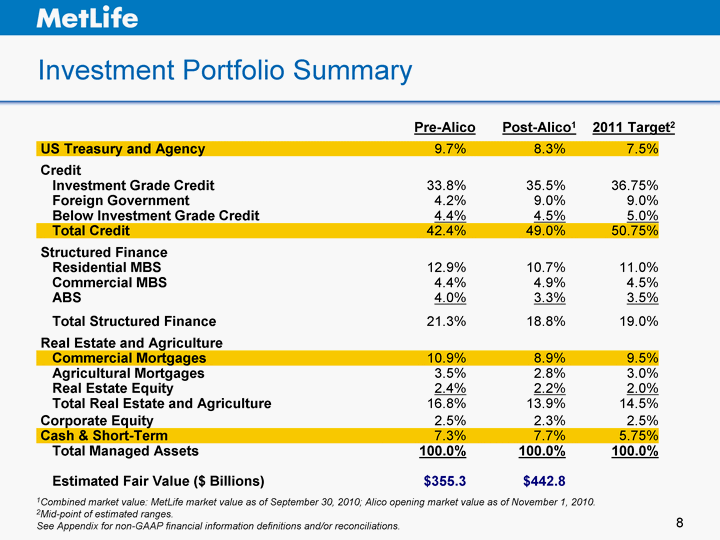
| Investment Portfolio Summary US Treasury and Agency 9.7% 8.3% 7.5% Credit Investment Grade Credit 33.8% 35.5% 36.75% Foreign Government 4.2% 9.0% 9.0% Below Investment Grade Credit 4.4% 4.5% 5.0% Total Credit 42.4% 49.0% 50.75% Structured Finance Residential MBS 12.9% 10.7% 11.0% Commercial MBS 4.4% 4.9% 4.5% ABS 4.0% 3.3% 3.5% Total Structured Finance 21.3% 18.8% 19.0% Real Estate and Agriculture Commercial Mortgages 10.9% 8.9% 9.5% Agricultural Mortgages 3.5% 2.8% 3.0% Real Estate Equity 2.4% 2.2% 2.0% Total Real Estate and Agriculture 16.8% 13.9% 14.5% Corporate Equity 2.5% 2.3% 2.5% Cash & Short-Term 7.3% 7.7% 5.75% Total Managed Assets 100.0% 100.0% 100.0% Estimated Fair Value ($ Billions) $355.3 $442.8 1Combined market value: MetLife market value as of September 30, 2010; Alico opening market value as of November 1, 2010. 2Mid-point of estimated ranges. See Appendix for non-GAAP financial information definitions and/or reconciliations. .. Pre-Alico Post-Alico1 2011 Target2 |
| Cash & Short-Term Post-Alico balance temporarily inflated Alico capital raise Long-term bonds reclassified under PGAAP Reinvestment factored into 2011 Company guidance |
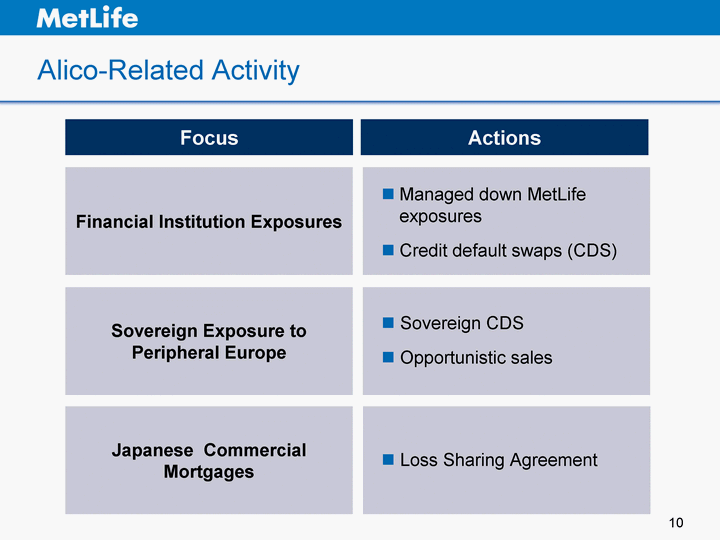
| Alico-Related Activity Focus Actions Financial Institution Exposures Sovereign Exposure to Peripheral Europe Managed down MetLife exposures Credit default swaps (CDS) Sovereign CDS Opportunistic sales Japanese Commercial Mortgages Loss Sharing Agreement |
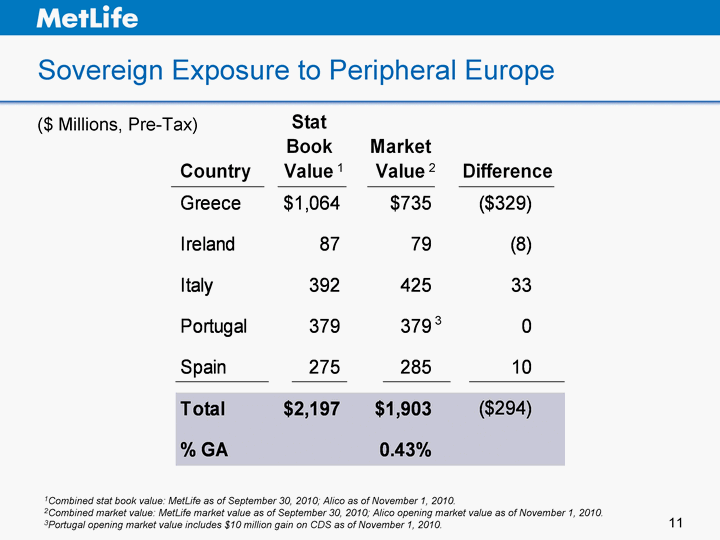
| Sovereign Exposure to Peripheral Europe 1Combined stat book value: MetLife as of September 30, 2010; Alico as of November 1, 2010. 2Combined market value: MetLife market value as of September 30, 2010; Alico opening market value as of November 1, 2010. 3Portugal opening market value includes $10 million gain on CDS as of November 1, 2010. 3 2 1 ($ Millions, Pre-Tax) |

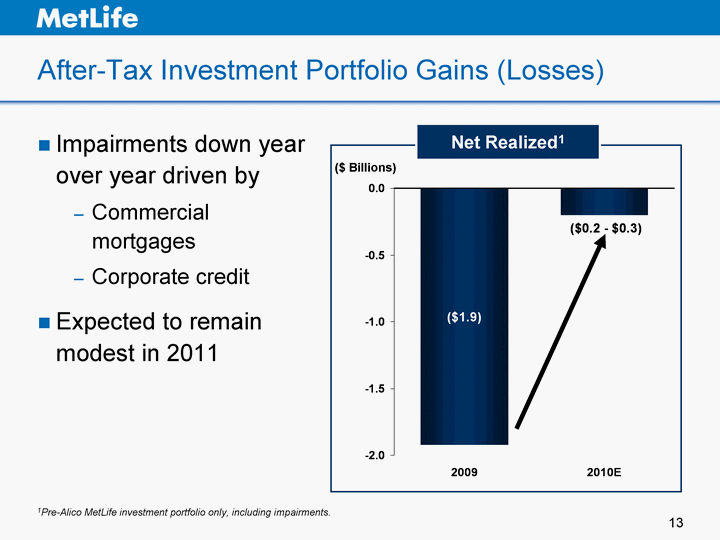
| YTD 2009 2010E Total -1.921 -0.2 Economic 696 Other 456 After-Tax Investment Portfolio Gains (Losses) Impairments down year over year driven by Commercial mortgages Corporate credit Expected to remain modest in 2011 1Pre-Alico MetLife investment portfolio only, including impairments. ($ Billions) Net Realized1 |
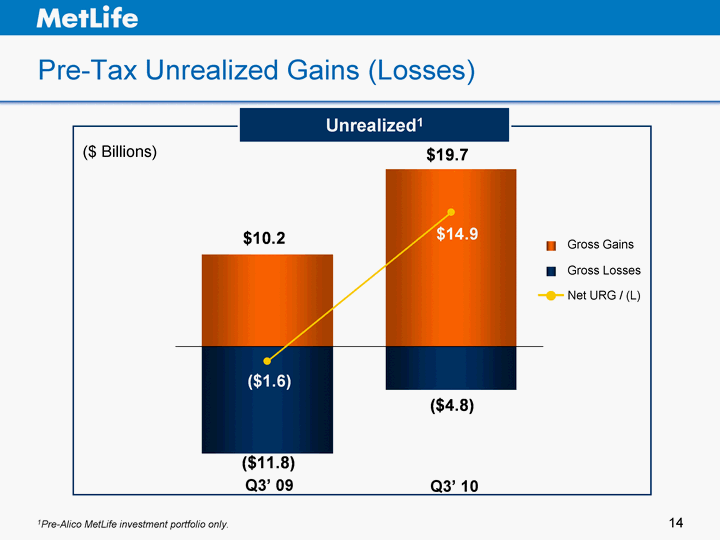
| Pre-Tax Unrealized Gains (Losses) URL 9/30/2009 9/30/2010 Loss -11838 Gross Gains 10228 19656 Net URG/(L) -1610 8/11/1940 Gross Losses -11838 -4822 ($ Billions) Unrealized1 Q3' 09 Q3' 10 Gross Gains Gross Losses Net URG / (L) 1Pre-Alico MetLife investment portfolio only. |
| Low Interest Rate Environment |
| Low Interest Rate Environment: Mitigants Product design and pricing ALM / duration management Derivative hedging Private asset origination |
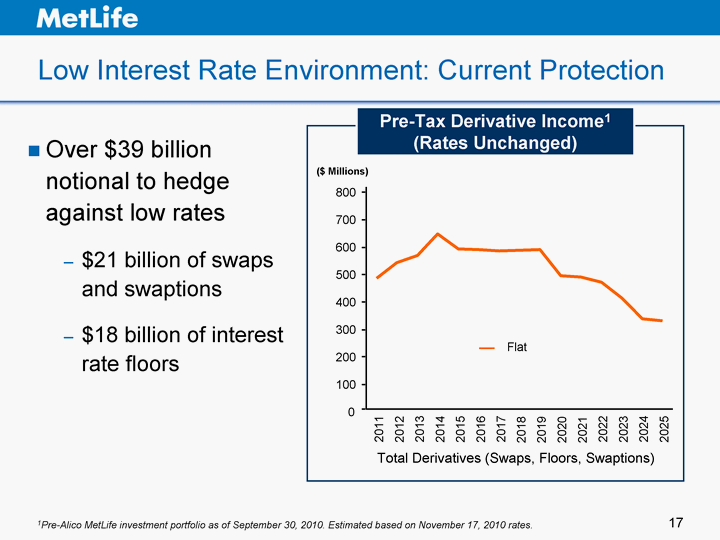
| Low Interest Rate Environment: Current Protection Pre-Tax Derivative Income1 (Rates Unchanged) 0 100 200 300 400 500 600 700 800 ($ Millions) Over $39 billion notional to hedge against low rates $21 billion of swaps and swaptions $18 billion of interest rate floors Flat Total Derivatives (Swaps, Floors, Swaptions) 2011 2012 2013 2014 2015 2016 2017 2018 2019 2020 2021 2022 2023 2024 2025 1Pre-Alico MetLife investment portfolio as of September 30, 2010. Estimated based on November 17, 2010 rates. |
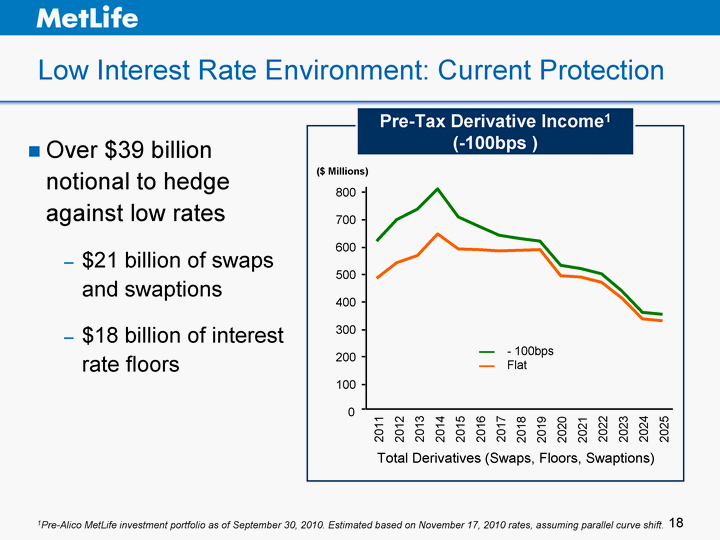
| ($ Millions) Low Interest Rate Environment: Current Protection Pre-Tax Derivative Income1 (-100bps ) 0 100 200 300 400 500 600 700 800 Over $39 billion notional to hedge against low rates $21 billion of swaps and swaptions $18 billion of interest rate floors - - 100bps Flat Total Derivatives (Swaps, Floors, Swaptions) 2011 2012 2013 2014 2015 2016 2017 2018 2019 2020 2021 2022 2023 2024 2025 1Pre-Alico MetLife investment portfolio as of September 30, 2010. Estimated based on November 17, 2010 rates, assuming parallel curve shift. |
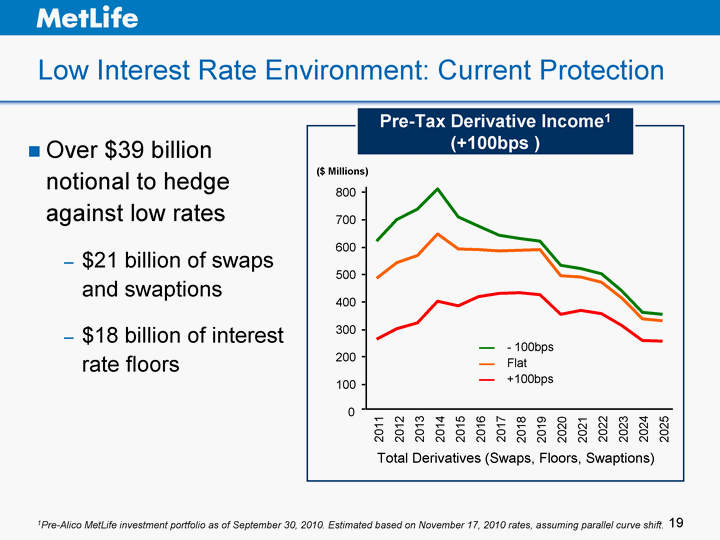
| ($ Millions) Low Interest Rate Environment: Current Protection Pre-Tax Derivative Income1 (+100bps ) 0 100 200 300 400 500 600 700 800 +100bps Over $39 billion notional to hedge against low rates $21 billion of swaps and swaptions $18 billion of interest rate floors Total Derivatives (Swaps, Floors, Swaptions) - - 100bps Flat 2011 2012 2013 2014 2015 2016 2017 2018 2019 2020 2021 2022 2023 2024 2025 1Pre-Alico MetLife investment portfolio as of September 30, 2010. Estimated based on November 17, 2010 rates, assuming parallel curve shift. |
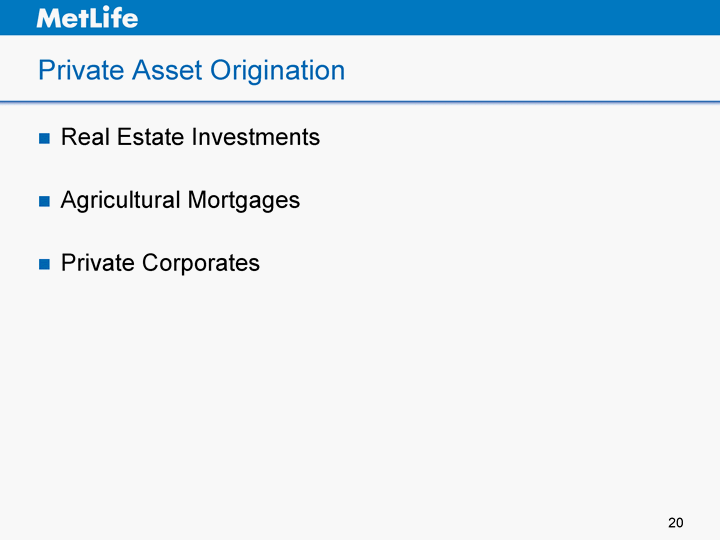
| Private Asset Origination Real Estate Investments Agricultural Mortgages Private Corporates |
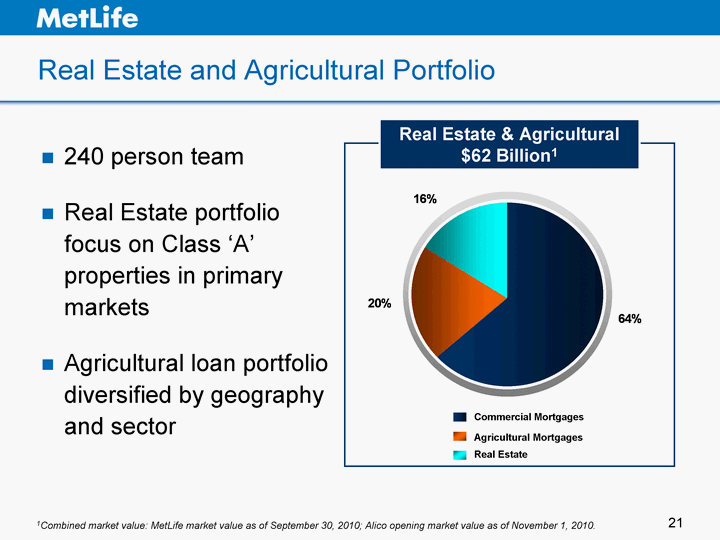
| Adequately Positioned Commercial Mortgages 0.64 Agricultural Mortgages 0.2 Real Estate Equity 0.16 Commercial Mortgages Agricultural Mortgages Real Estate Real Estate and Agricultural Portfolio 240 person team Real Estate portfolio focus on Class 'A' properties in primary markets Agricultural loan portfolio diversified by geography and sector Real Estate & Agricultural $62 Billion1 1Combined market value: MetLife market value as of September 30, 2010; Alico opening market value as of November 1, 2010. |
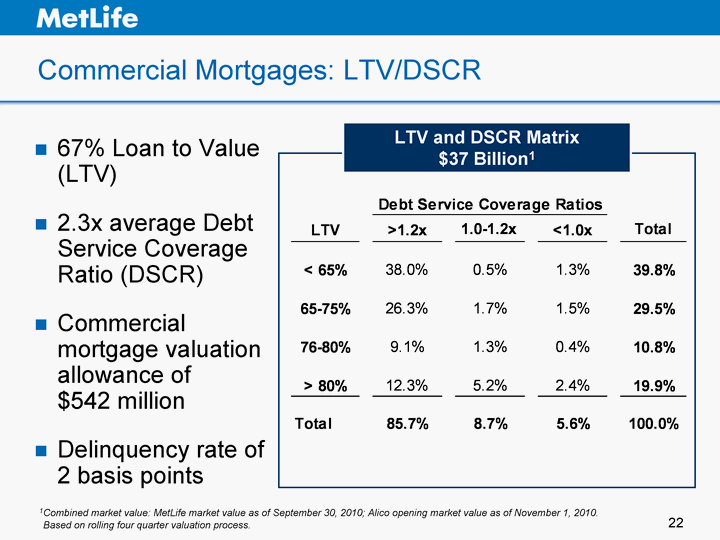
| Commercial Mortgages: LTV/DSCR Based on rolling four quarter valuation process. LTV and DSCR Matrix $37 Billion1 67% Loan to Value (LTV) 2.3x average Debt Service Coverage Ratio (DSCR) Commercial mortgage valuation allowance of $542 million Delinquency rate of 2 basis points 1Combined market value: MetLife market value as of September 30, 2010; Alico opening market value as of November 1, 2010. |
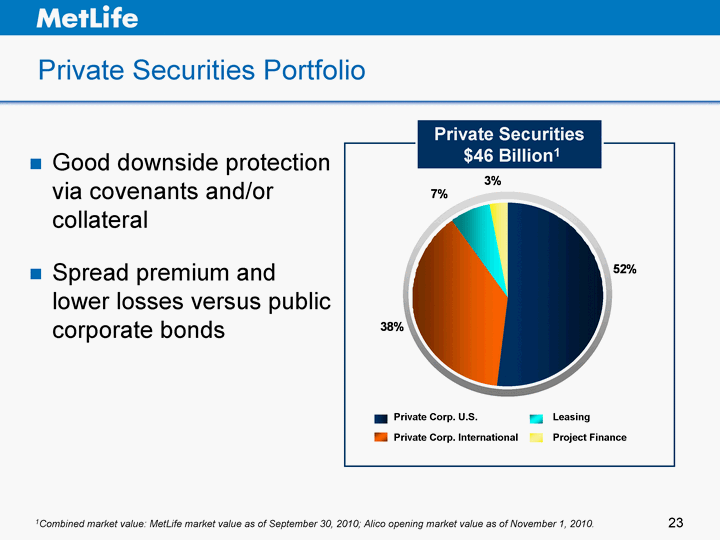
| Private Securities Portfolio Good downside protection via covenants and/or collateral Spread premium and lower losses versus public corporate bonds Adequately Positioned Private Corp. US 0.52 Private Corp. Non-US 0.38 Leasing and Tax Products 0.07 Project Finance 0.03 Leasing Project Finance Private Corp. U.S. Private Corp. International 1Combined market value: MetLife market value as of September 30, 2010; Alico opening market value as of November 1, 2010. Private Securities $46 Billion1 |
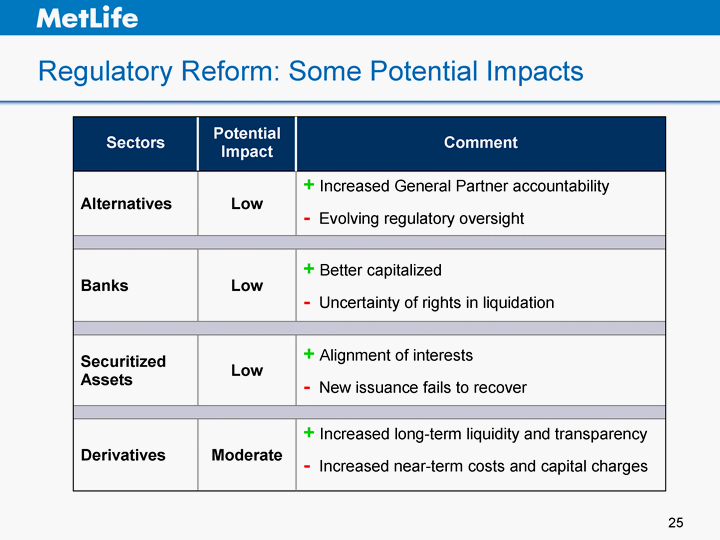
| Sectors Potential Impact Comment Alternatives Low + Increased General Partner accountability - - Evolving regulatory oversight Banks Low + Better capitalized - - Uncertainty of rights in liquidation Securitized Assets Low + Alignment of interests - - New issuance fails to recover Derivatives Moderate + Increased long-term liquidity and transparency - - Increased near-term costs and capital charges Regulatory Reform: Some Potential Impacts |
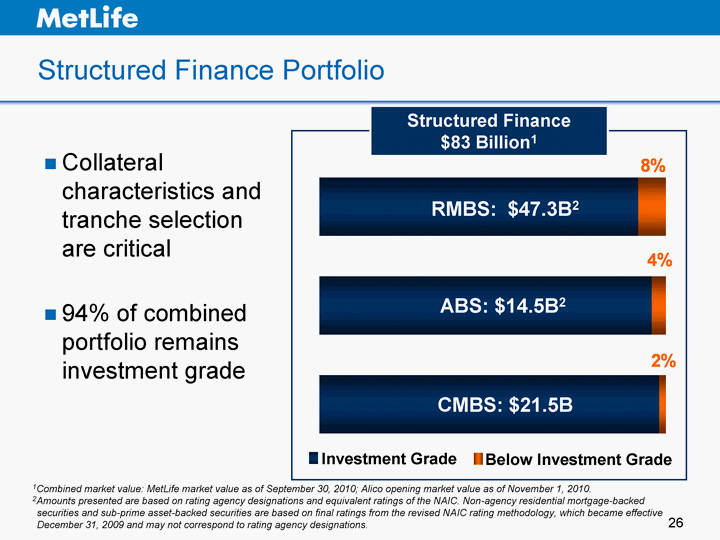
| Structured Finance Portfolio Collateral characteristics and tranche selection are critical 94% of combined portfolio remains investment grade 2Amounts presented are based on rating agency designations and equivalent ratings of the NAIC. Non-agency residential mortgage-backed securities and sub-prime asset-backed securities are based on final ratings from the revised NAIC rating methodology, which became effective December 31, 2009 and may not correspond to rating agency designations. 4th Qtr CMBS: $21.5B ABS: $14.5B2 RMBS: $47.3B2 Structured Finance $83 Billion1 Investment Grade Below Investment Grade 1Combined market value: MetLife market value as of September 30, 2010; Alico opening market value as of November 1, 2010. |
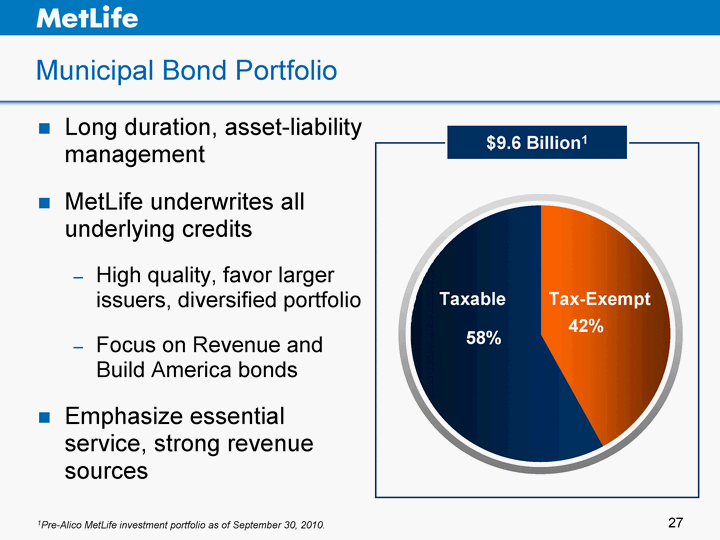
| Tax Exempt Taxable 3rd Qtr 4th Qtr East 0.42 0.58 90 20.4 West 30.6 38.6 34.6 31.6 North 45.9 46.9 45 43.9 Municipal Bond Portfolio $9.6 Billion1 Taxable Tax-Exempt Long duration, asset-liability management MetLife underwrites all underlying credits High quality, favor larger issuers, diversified portfolio Focus on Revenue and Build America bonds Emphasize essential service, strong revenue sources 1Pre-Alico MetLife investment portfolio as of September 30, 2010. |
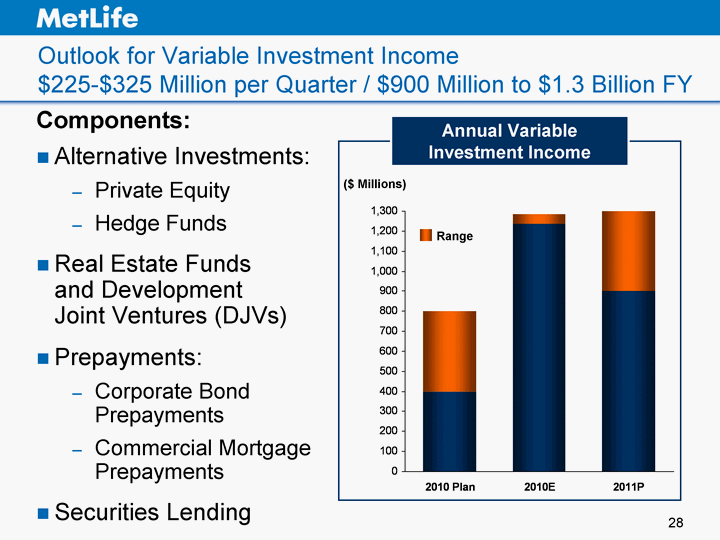
| 2010 Plan 2010E 2011P 4th Qtr 28 Outlook for Variable Investment Income $225-$325 Million per Quarter / $900 Million to $1.3 Billion FY Components: Alternative Investments: Private Equity Hedge Funds Real Estate Funds and Development Joint Ventures (DJVs) Prepayments: Corporate Bond Prepayments Commercial Mortgage Prepayments Securities Lending ($ Millions) Range Annual Variable Investment Income |
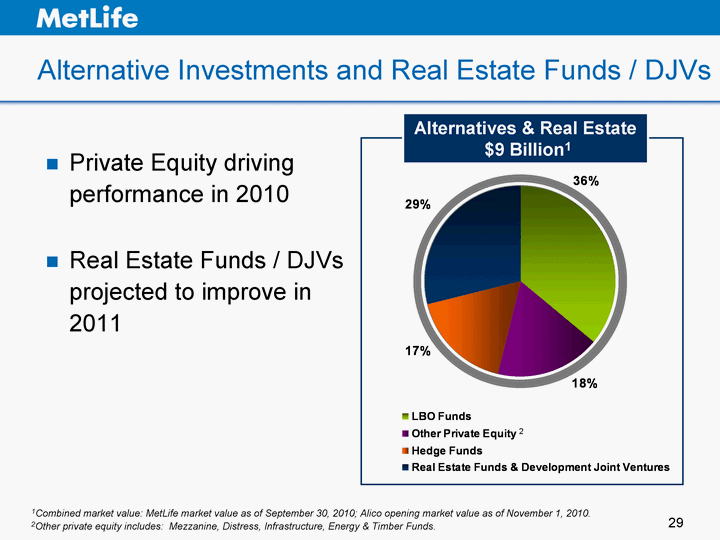
| Alternative Investments and Real Estate Funds / DJVs LBO Funds Other Private Equity Hedge Funds Real Estate Funds & Development Joint Ventures MetLife 0.36 0.18 0.17 0.29 Private Equity driving performance in 2010 Real Estate Funds / DJVs projected to improve in 2011 Alternatives & Real Estate $9 Billion1 2Other private equity includes: Mezzanine, Distress, Infrastructure, Energy & Timber Funds. 1Combined market value: MetLife market value as of September 30, 2010; Alico opening market value as of November 1, 2010. 2 |
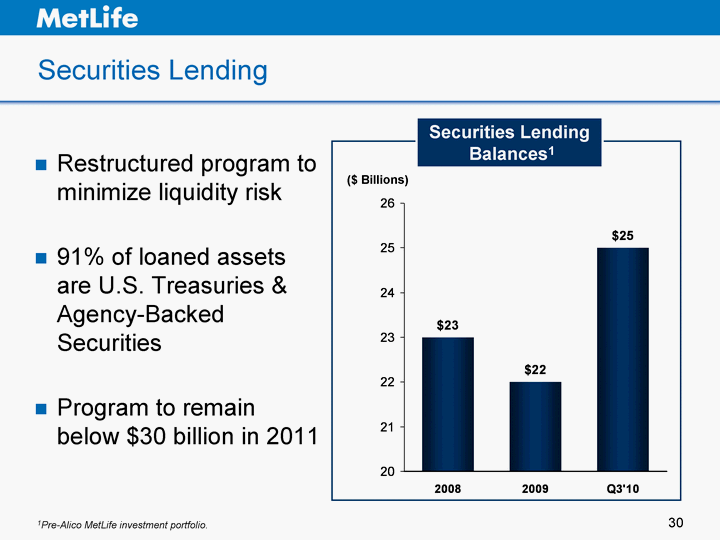
| Securities Lending 2007 2008 2009 Q3'10 Total Loans Maturing 43 23 22 25 Average LTV 0.54 0.57 0.59 ($ Billions) Restructured program to minimize liquidity risk 91% of loaned assets are U.S. Treasuries & Agency-Backed Securities Program to remain below $30 billion in 2011 Securities Lending Balances1 1Pre-Alico MetLife investment portfolio. |
| Summary Material improvement in realized losses, substantial unrealized gain Have taken measures to protect against adverse interest rate and market environments, will continue to do so Opportunistically sourcing private assets Portfolio is healthy and well positioned |
| INVESTOR DAY 2 0 1 0 William J. Wheeler Executive Vice President & Chief Financial Officer |
| Agenda Review of 4th Quarter 2010 Estimated Results Review of Full Year 2010 Estimated Results MetLife Capital Position Review of 2011 Plan Interest Rate Review ROE Outlook |
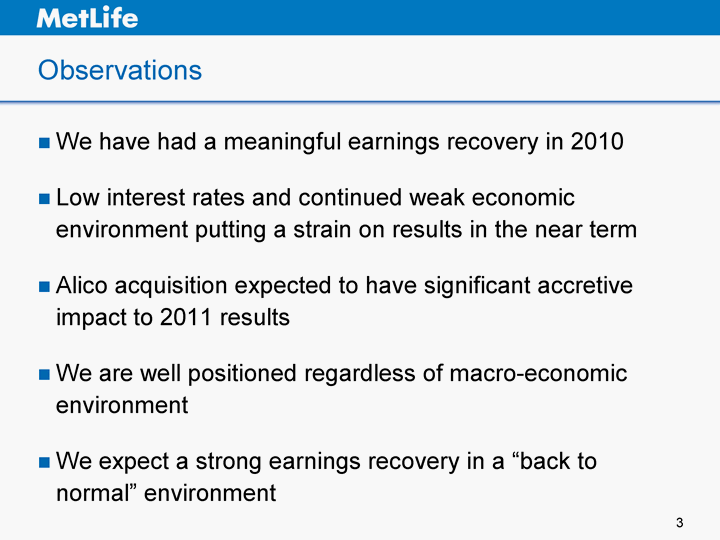
| Observations We have had a meaningful earnings recovery in 2010 Low interest rates and continued weak economic environment putting a strain on results in the near term Alico acquisition expected to have significant accretive impact to 2011 results We are well positioned regardless of macro-economic environment We expect a strong earnings recovery in a "back to normal" environment |
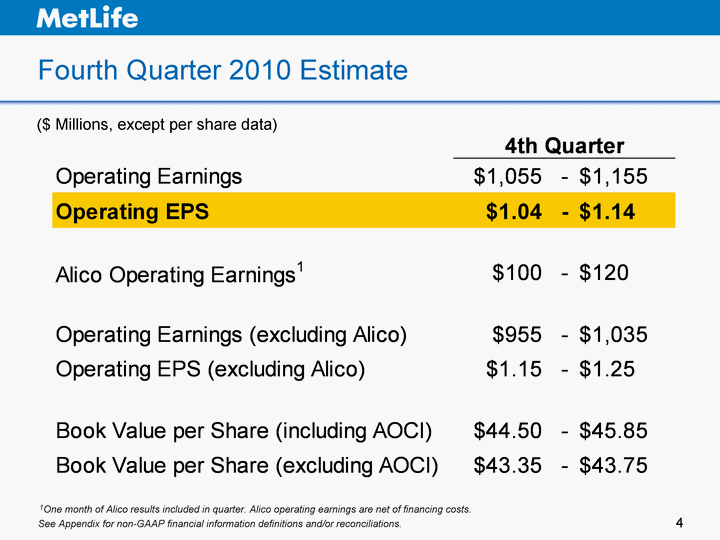
| Fourth Quarter 2010 Estimate ($ Millions, except per share data) See Appendix for non-GAAP financial information definitions and/or reconciliations. 1One month of Alico results included in quarter. Alico operating earnings are net of financing costs. |
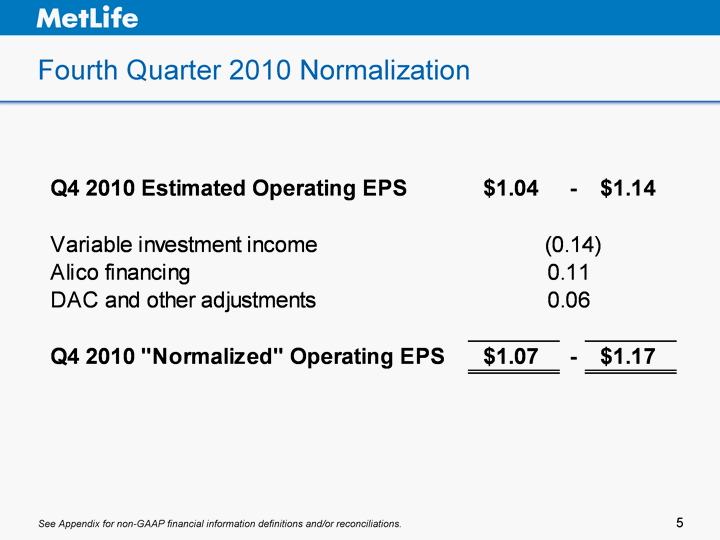
| Fourth Quarter 2010 Normalization See Appendix for non-GAAP financial information definitions and/or reconciliations. |
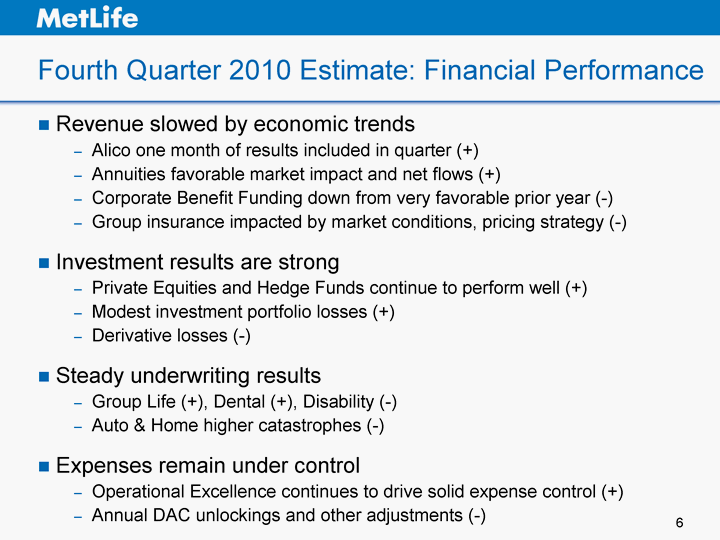
| Fourth Quarter 2010 Estimate: Financial Performance Revenue slowed by economic trends Alico one month of results included in quarter (+) Annuities favorable market impact and net flows (+) Corporate Benefit Funding down from very favorable prior year (-) Group insurance impacted by market conditions, pricing strategy (-) Investment results are strong Private Equities and Hedge Funds continue to perform well (+) Modest investment portfolio losses (+) Derivative losses (-) Steady underwriting results Group Life (+), Dental (+), Disability (-) Auto & Home higher catastrophes (-) Expenses remain under control Operational Excellence continues to drive solid expense control (+) Annual DAC unlockings and other adjustments (-) |
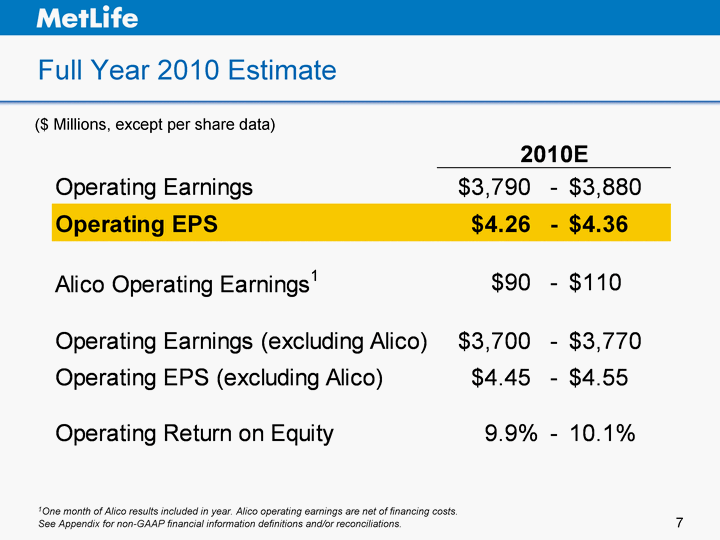
| Full Year 2010 Estimate ($ Millions, except per share data) See Appendix for non-GAAP financial information definitions and/or reconciliations. 1One month of Alico results included in year. Alico operating earnings are net of financing costs. |
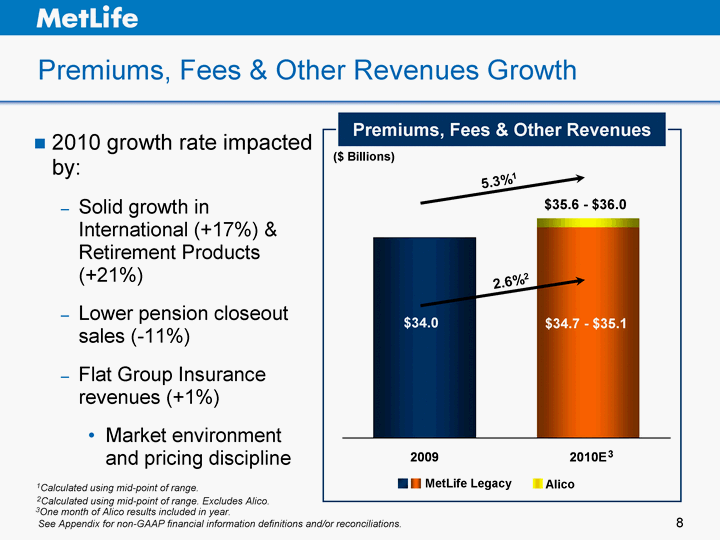
| Premiums, Fees & Other Revenues Growth 2010 growth rate impacted by: Solid growth in International (+17%) & Retirement Products (+21%) Lower pension closeout sales (-11%) Flat Group Insurance revenues (+1%) Market environment and pricing discipline $35.6 - $36.0 5.3%1 Premiums, Fees & Other Revenues 2009 2010E Legacy 34019 34956 Alico 890 MetLife Legacy Alico 1Calculated using mid-point of range. $34.7 - $35.1 2.6%2 $34.0 See Appendix for non-GAAP financial information definitions and/or reconciliations. 3 3One month of Alico results included in year. 2Calculated using mid-point of range. Excludes Alico. ($ Billions) |
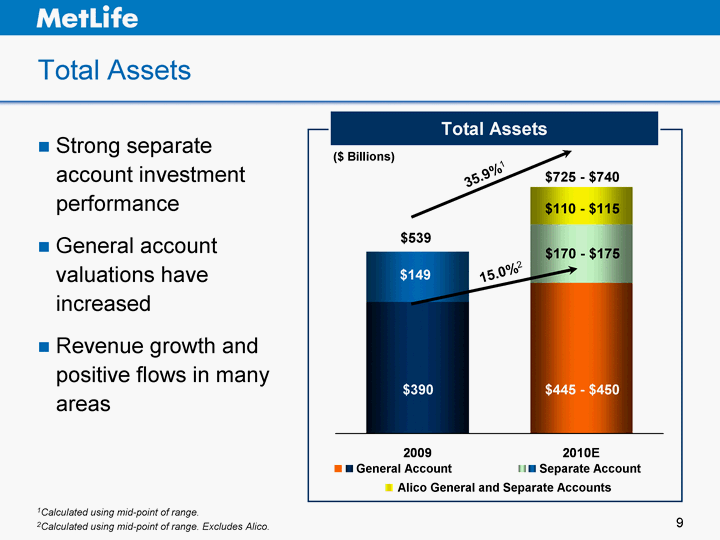
| 2009 2010E General Account & Other 390 447.5 Separate Account 149 172.5 Alico General Account & Other 110.5 Alico Separate Account 0.25 Total Assets Strong separate account investment performance General account valuations have increased Revenue growth and positive flows in many areas 35.9%1 $725 - $740 $539 1Calculated using mid-point of range. 2Calculated using mid-point of range. Excludes Alico. $445 - $450 $170 - $175 ($ Billions) Total Assets Alico General and Separate Accounts $390 $149 Separate Account General Account $110 - $115 15.0%2 |
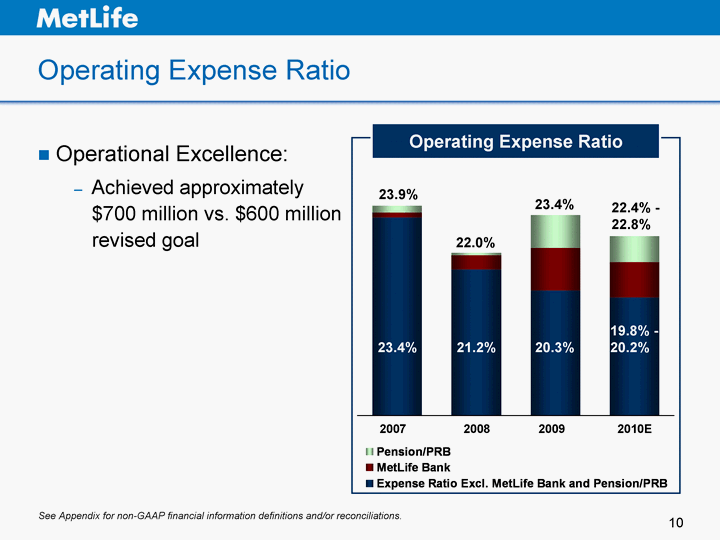
| 2007 2008 2009 2010E Expense Ratio Excl. MetLife Bank and Pension/PRB 0.234 0.212 0.203 0.2 MetLife Bank 0.002 0.006 0.018 0.015 Pension/PRB 0.003 0.001 0.014 0.011 Operating Expense Ratio Operational Excellence: Achieved approximately $700 million vs. $600 million revised goal See Appendix for non-GAAP financial information definitions and/or reconciliations. 23.9% 22.0% 23.4% 22.4% - 22.8% Operating Expense Ratio 19.8% - 20.2% 2007 2008 2009 2010E 20.3% 21.2% 23.4% |
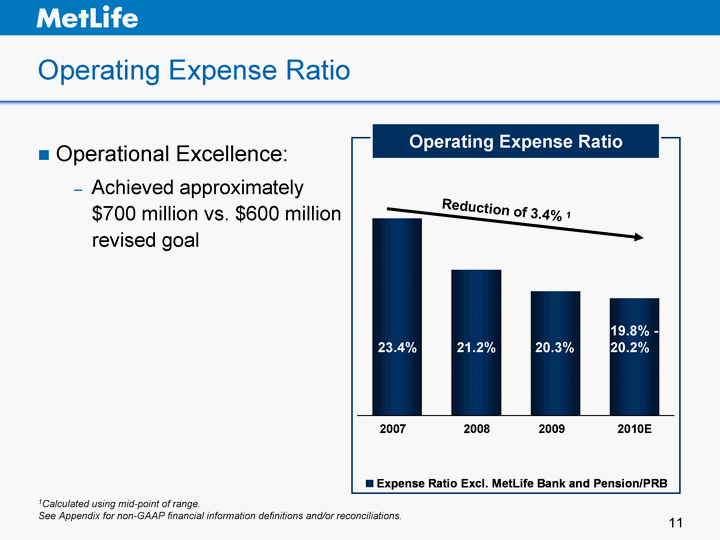
| 2007 2008 2009 2010E Expense Ratio Excl. MetLife Bank and Pension/PRB 0.234 0.212 0.203 0.2 MetLife Bank 0.002 0.006 0.018 0.015 Pension/PRB 0.003 0.001 0.014 0.011 Operating Expense Ratio Operational Excellence: Achieved approximately $700 million vs. $600 million revised goal 1Calculated using mid-point of range. See Appendix for non-GAAP financial information definitions and/or reconciliations. 23.9% 22.0% 23.4% 22.4% - 22.8% Operating Expense Ratio 19.8% - 20.2% 2007 2008 2009 2010E 20.3% 21.2% 23.4% Reduction of 3.4% 1 |
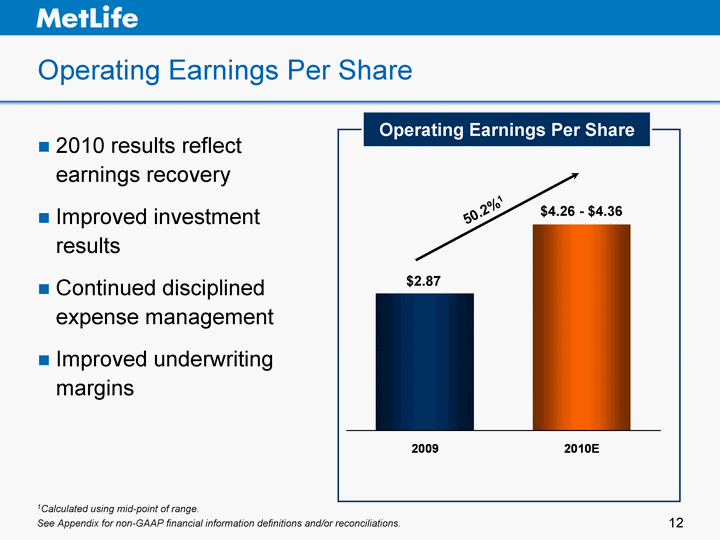
| Operating Earnings Per Share 2010 results reflect earnings recovery Improved investment results Continued disciplined expense management Improved underwriting margins 2009 2010E 2.87 4.31 1Calculated using mid-point of range. See Appendix for non-GAAP financial information definitions and/or reconciliations. $4.26 - $4.36 Operating Earnings Per Share $2.87 50.2%1 |
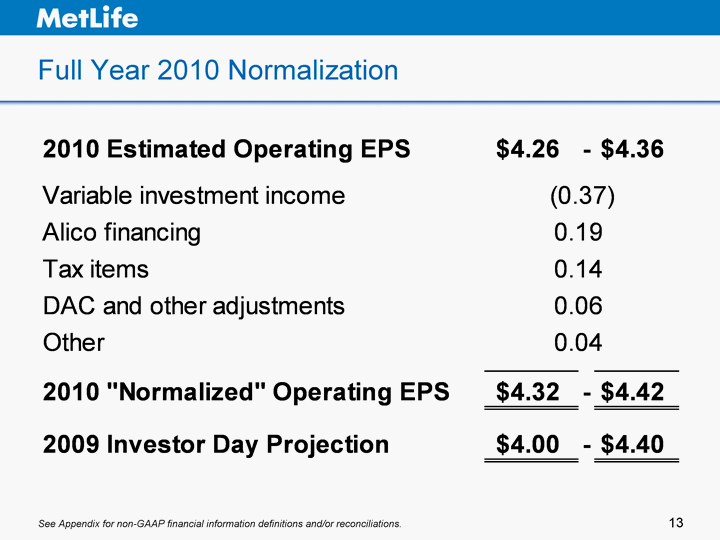
| Full Year 2010 Normalization See Appendix for non-GAAP financial information definitions and/or reconciliations. |
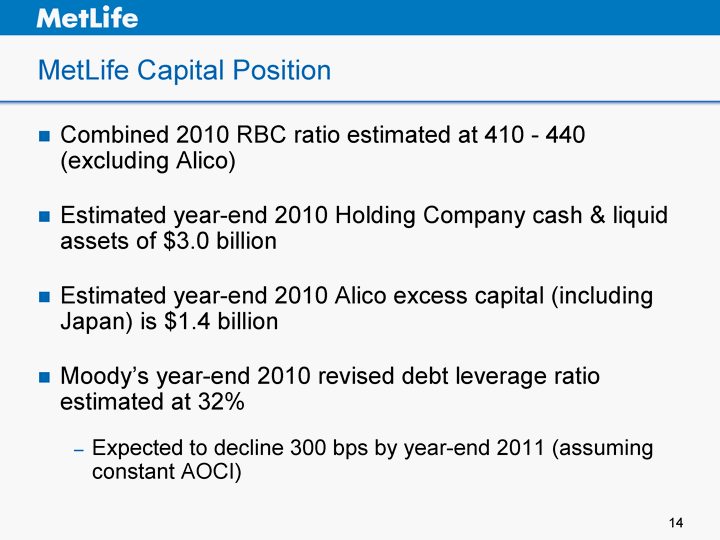
| MetLife Capital Position Combined 2010 RBC ratio estimated at 410 - 440 (excluding Alico) Estimated year-end 2010 Holding Company cash & liquid assets of $3.0 billion Estimated year-end 2010 Alico excess capital (including Japan) is $1.4 billion Moody's year-end 2010 revised debt leverage ratio estimated at 32% Expected to decline 300 bps by year-end 2011 (assuming constant AOCI) |
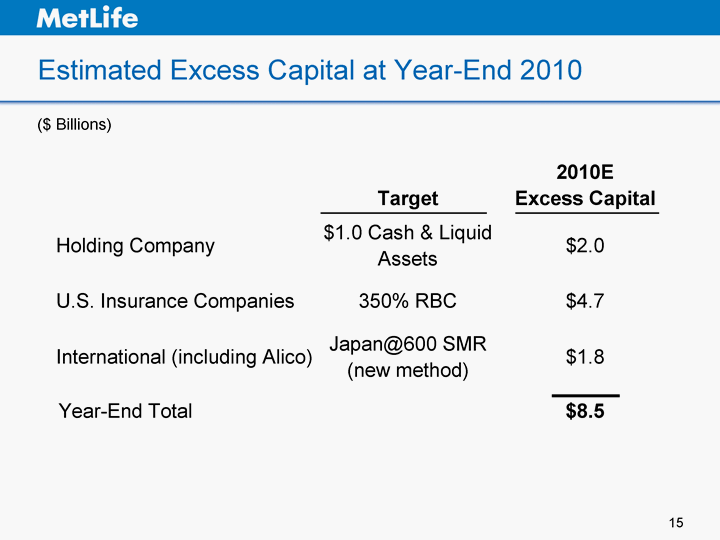
| Estimated Excess Capital at Year-End 2010 Target 2010E Excess Capital Holding Company $1.0 Cash & Liquid Assets $2.0 U.S. Insurance Companies 350% RBC $4.7 International (including Alico) Japan@600 SMR (new method) $1.8 Year-End Total $8.5 ($ Billions) |
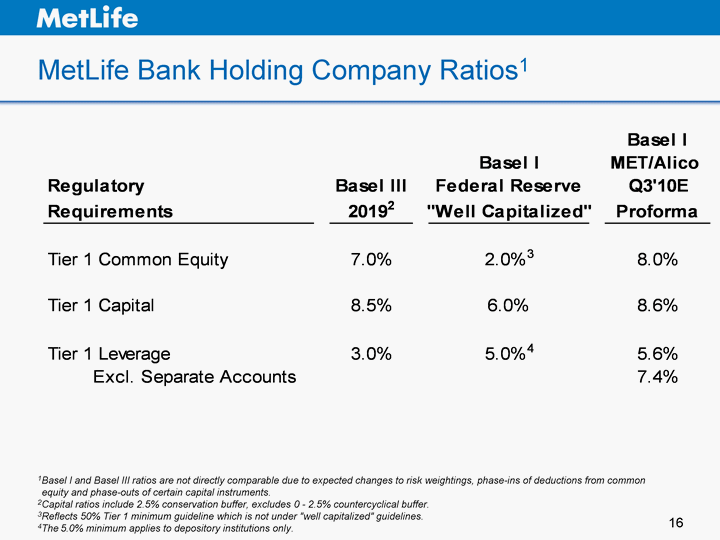
| MetLife Bank Holding Company Ratios1 1Basel I and Basel III ratios are not directly comparable due to expected changes to risk weightings, phase-ins of deductions from common equity and phase-outs of certain capital instruments. 2Capital ratios include 2.5% conservation buffer, excludes 0 - 2.5% countercyclical buffer. 3Reflects 50% Tier 1 minimum guideline which is not under "well capitalized" guidelines. 4The 5.0% minimum applies to depository institutions only. |
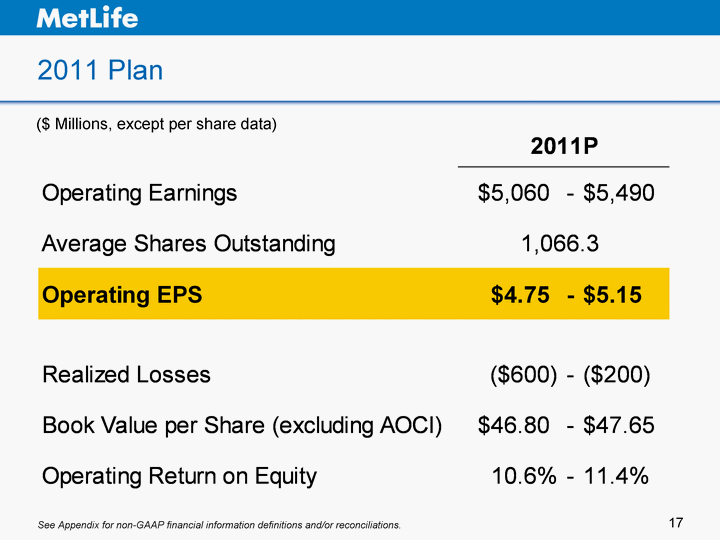
| 2011 Plan ($ Millions, except per share data) See Appendix for non-GAAP financial information definitions and/or reconciliations. |
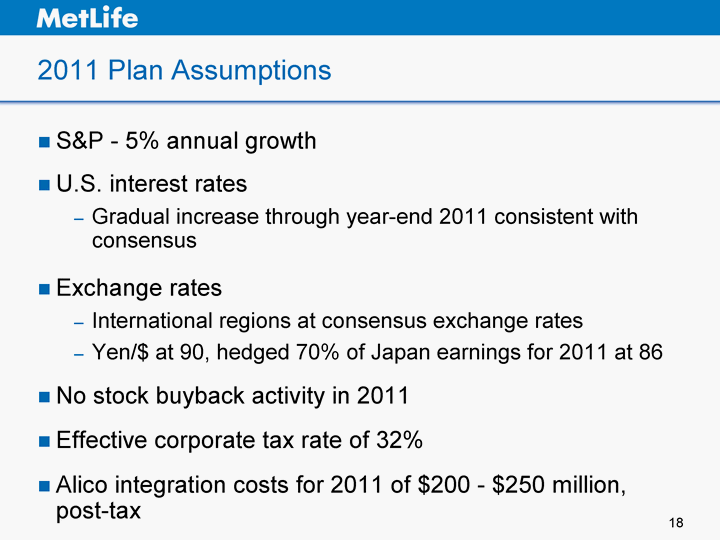
| 2011 Plan Assumptions S&P - 5% annual growth U.S. interest rates Gradual increase through year-end 2011 consistent with consensus Exchange rates International regions at consensus exchange rates Yen/$ at 90, hedged 70% of Japan earnings for 2011 at 86 No stock buyback activity in 2011 Effective corporate tax rate of 32% Alico integration costs for 2011 of $200 - $250 million, post-tax |
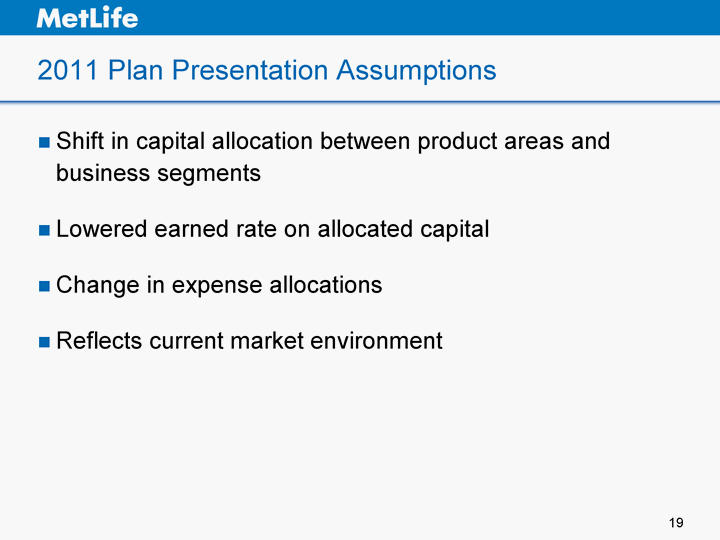
| 2011 Plan Presentation Assumptions Shift in capital allocation between product areas and business segments Lowered earned rate on allocated capital Change in expense allocations Reflects current market environment |
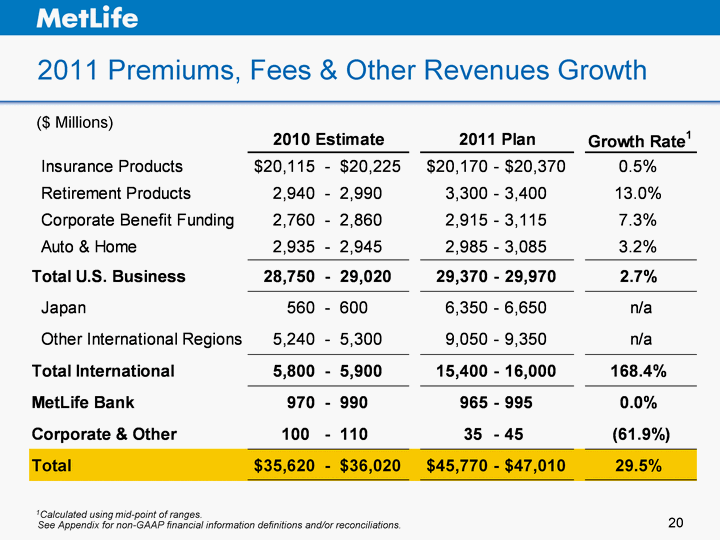
| 2011 Premiums, Fees & Other Revenues Growth ($ Millions) 1Calculated using mid-point of ranges. See Appendix for non-GAAP financial information definitions and/or reconciliations. |
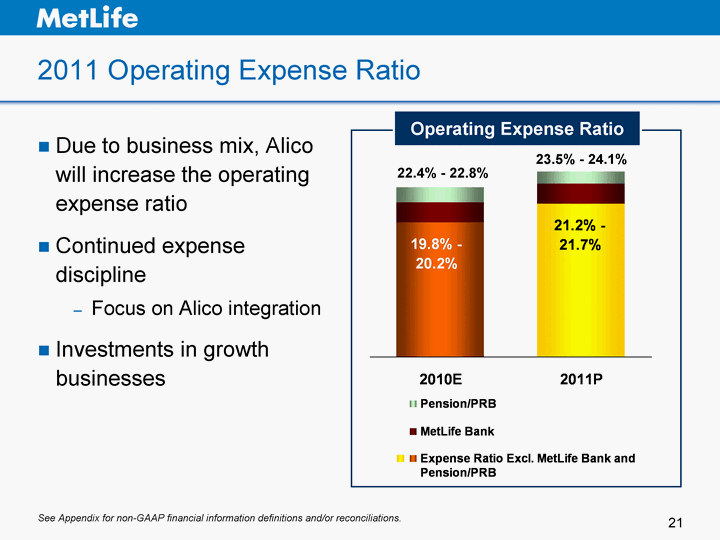
| 2011 Operating Expense Ratio See Appendix for non-GAAP financial information definitions and/or reconciliations. Operating Expense Ratio1 2010E 2011P Expense Ratio Excl. MetLife Bank and Pension/PRB 0.2 0.214 MetLife Bank 0.015 0.015 Pension/PRB 0.011 0.009 23.5% - 24.1% 22.4% - 22.8% 1Operating expense ratio is calculated by dividing operating expenses, excluding amortization of DAC, by premiums, fees & other revenues. Due to business mix, Alico will increase the operating expense ratio Continued expense discipline Focus on Alico integration Investments in growth businesses |
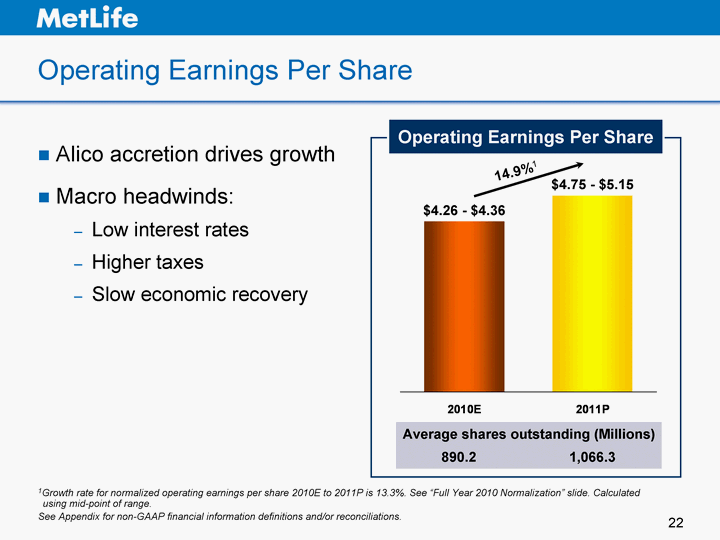
| Operating Earnings Per Share Alico accretion drives growth Macro headwinds: Low interest rates Higher taxes Slow economic recovery 2010E 2011P 4.31 4.95 1Growth rate for normalized operating earnings per share 2010E to 2011P is 13.3%. See "Full Year 2010 Normalization" slide. Calculated using mid-point of range. See Appendix for non-GAAP financial information definitions and/or reconciliations. 14.9%1 $4.26 - $4.36 $4.75 - $5.15 Operating Earnings Per Share 890.2 1,066.3 Average shares outstanding (Millions) |
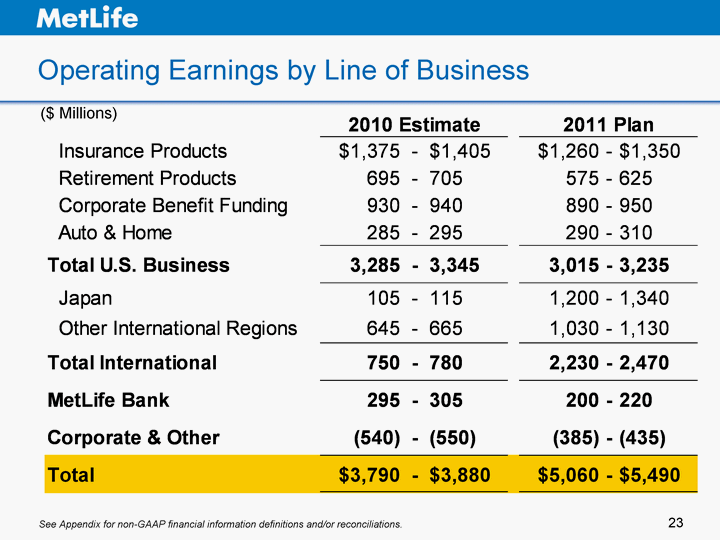
| Operating Earnings by Line of Business ($ Millions) See Appendix for non-GAAP financial information definitions and/or reconciliations. |
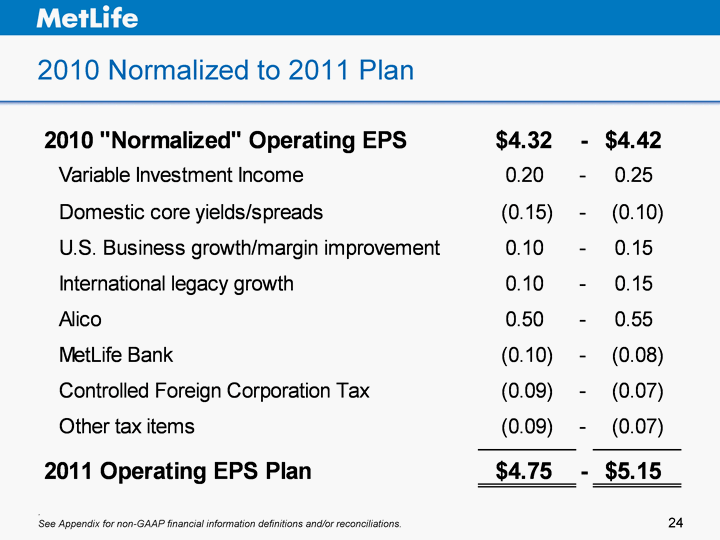
| 2010 Normalized to 2011 Plan .. See Appendix for non-GAAP financial information definitions and/or reconciliations. |
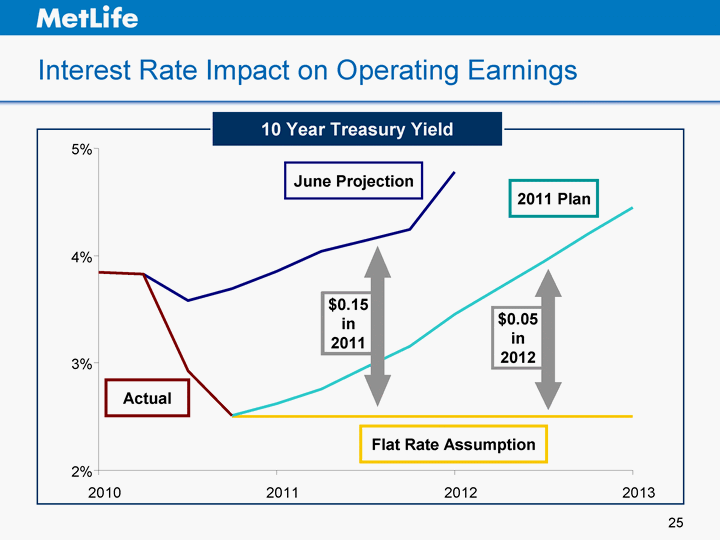
| Interest Rate Impact on Operating Earnings 10 Year Treasury Yield 2% 3% 4% 5% 2010 2011 2012 2013 $0.05 in 2012 $0.20 in 2011 Flat Rate Assumption 2011 Plan June Projection Actual $0.15 in 2011 |
| Interest Rate Impact in 2011 - 2012 Low interest rates are a headwind, but we have "shock absorbers" We have $18 billion notional interest rate floors Natural hedges in certain businesses (e.g. MetLife Bank) Possible DAC adjustments and reserve strengthening (GAAP & STAT) Shouldn't be significant |
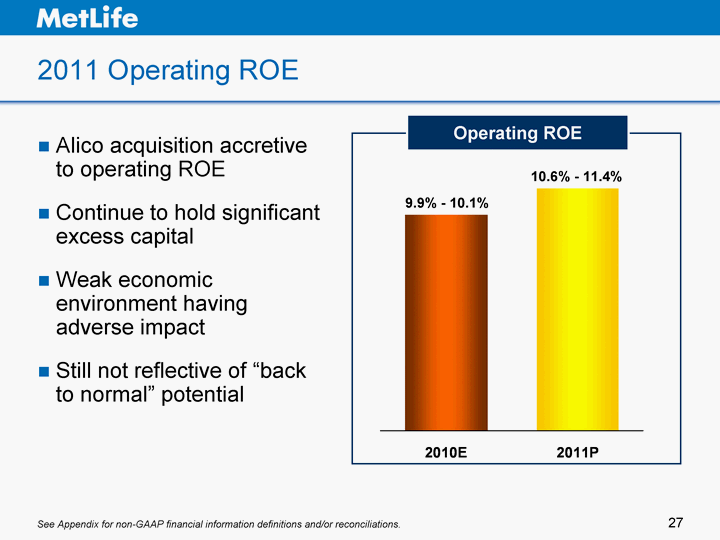
| 2011 Operating ROE Alico acquisition accretive to operating ROE Continue to hold significant excess capital Weak economic environment having adverse impact Still not reflective of "back to normal" potential 2010E 2011P 0.1 0.11 10.6% - 11.4% 9.9% - 10.1% See Appendix for non-GAAP financial information definitions and/or reconciliations. Operating ROE |
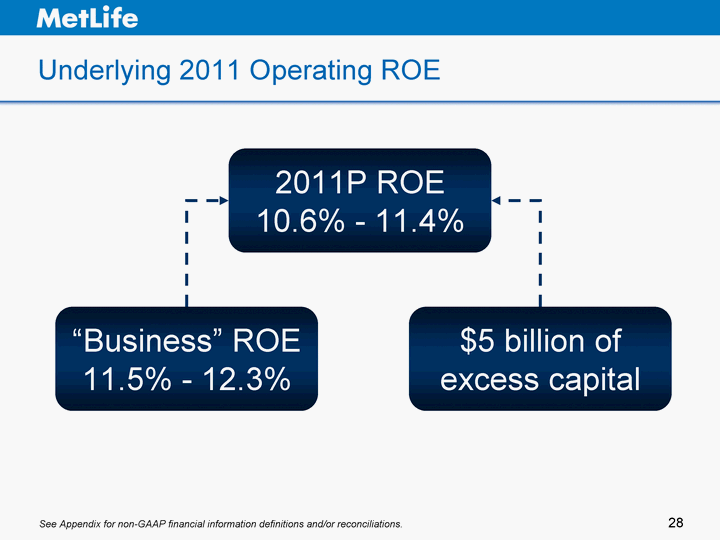
| Underlying 2011 Operating ROE 2011P ROE 10.6% - 11.4% See Appendix for non-GAAP financial information definitions and/or reconciliations. "Business" ROE 11.5% - 12.3% $5 billion of excess capital |
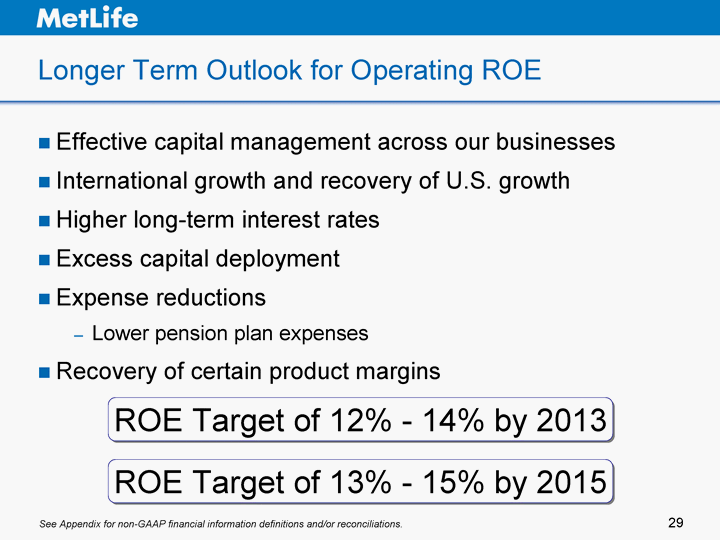
| Longer Term Outlook for Operating ROE Effective capital management across our businesses International growth and recovery of U.S. growth Higher long-term interest rates Excess capital deployment Expense reductions Lower pension plan expenses Recovery of certain product margins ROE Target of 13% - 15% by 2015 See Appendix for non-GAAP financial information definitions and/or reconciliations. ROE Target of 12% - 14% by 2013 |
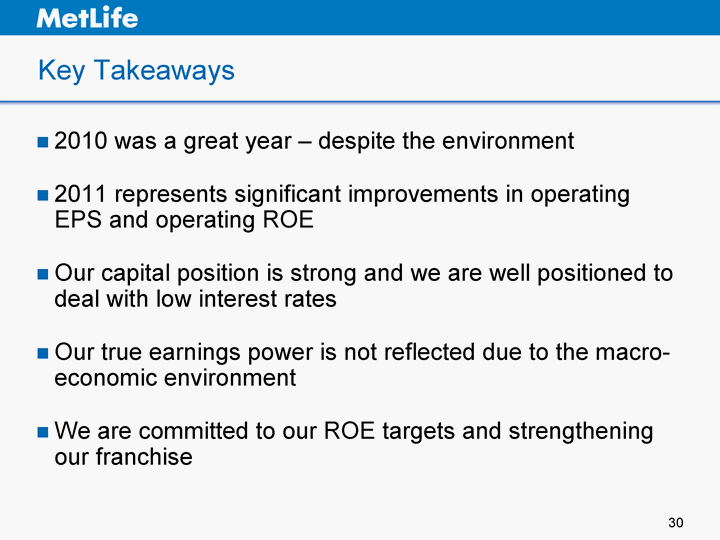
| Key Takeaways 2010 was a great year - despite the environment 2011 represents significant improvements in operating EPS and operating ROE Our capital position is strong and we are well positioned to deal with low interest rates Our true earnings power is not reflected due to the macro- economic environment We are committed to our ROE targets and strengthening our franchise |
| INVESTOR DAY 2 0 1 0 William J. Mullaney President U.S. Business |
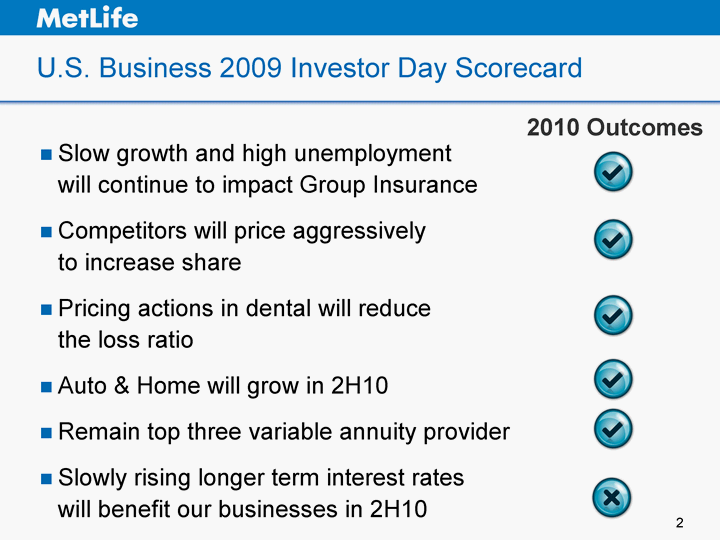
| 2 U.S. Business 2009 Investor Day Scorecard Slow growth and high unemployment will continue to impact Group Insurance Competitors will price aggressively to increase share Pricing actions in dental will reduce the loss ratio Auto & Home will grow in 2H10 Remain top three variable annuity provider Slowly rising longer term interest rates will benefit our businesses in 2H10 2010 Outcomes 2 2 |
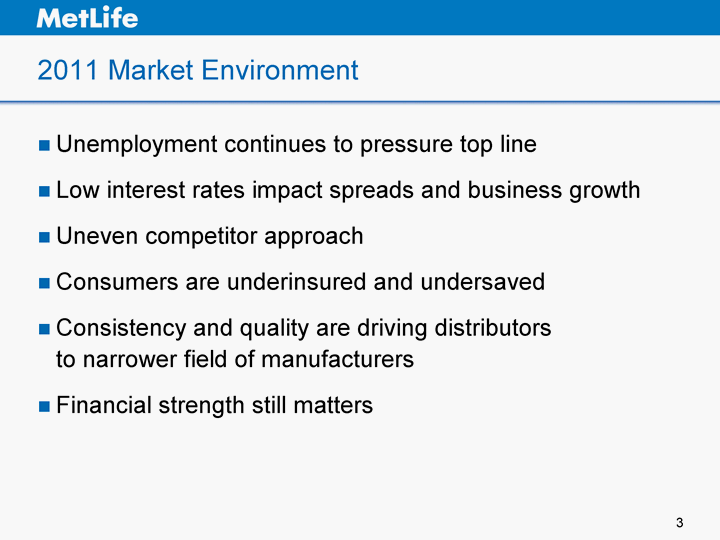
| 3 2011 Market Environment Unemployment continues to pressure top line Low interest rates impact spreads and business growth Uneven competitor approach Consumers are underinsured and undersaved Consistency and quality are driving distributors to narrower field of manufacturers Financial strength still matters 3 |
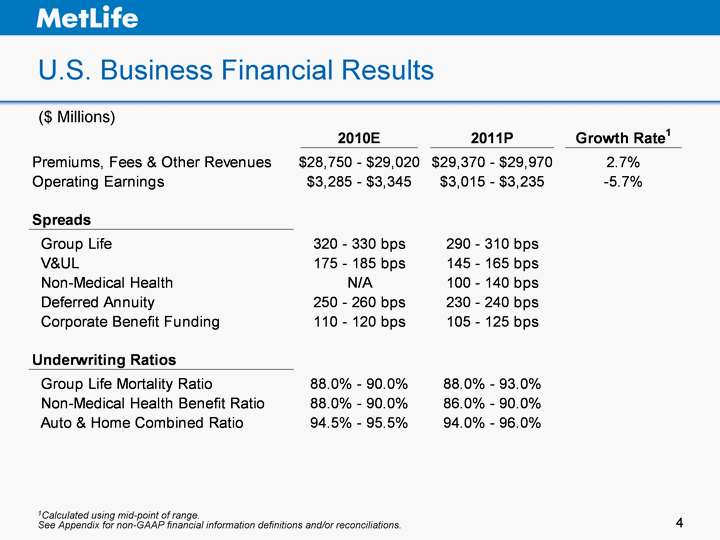
| 4 U.S. Business Financial Results 4 See Appendix for non-GAAP financial information definitions and/or reconciliations. 1Calculated using mid-point of range. ($ Millions) |
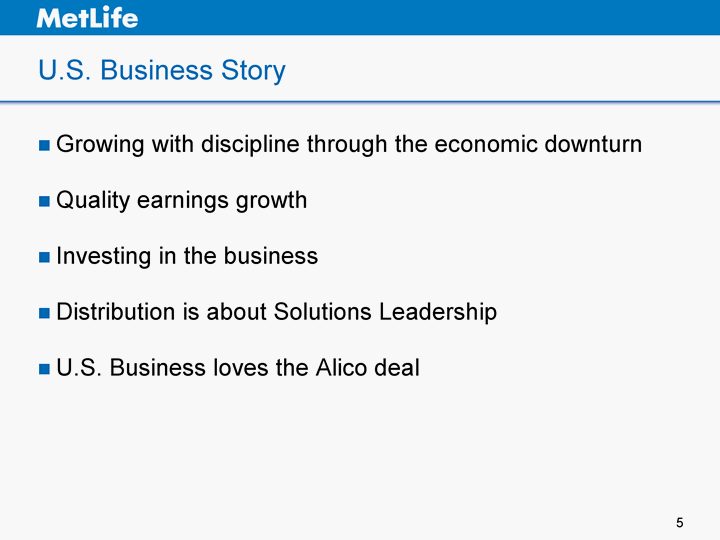
| 5 U.S. Business Story Growing with discipline through the economic downturn Quality earnings growth Investing in the business Distribution is about Solutions Leadership U.S. Business loves the Alico deal 5 |
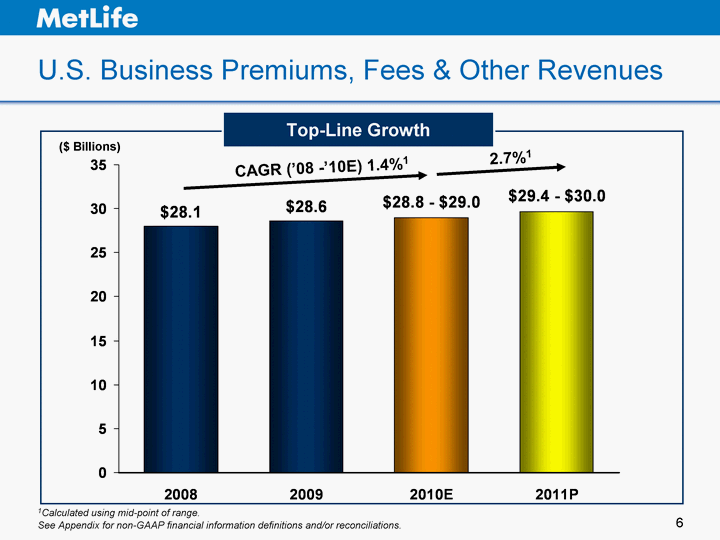
| 6 2008 2009 2010E 2011P Premiums, Fees and Other Revenues 28 28.6 29 29.7 6 U.S. Business Premiums, Fees & Other Revenues ($ Billions) Top-Line Growth 2.7%1 CAGR ('08 -'10E) 1.4%1 See Appendix for non-GAAP financial information definitions and/or reconciliations. 1Calculated using mid-point of range. |
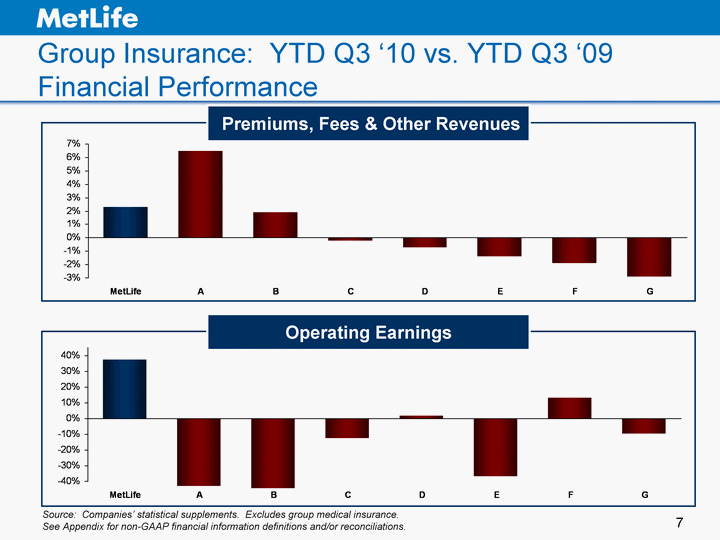
| MetLife A B C D E F G 0.373 -0.43 -0.443 -0.124 0.02 -0.366 0.13 -0.098 7 MetLife A B C D E F G Japan 0.023 0.065 0.019 -0.002 -0.007 -0.014 -0.019 -0.029 West 38.6 34.6 31.6 North 46.9 45 43.9 Group Insurance: YTD Q3 '10 vs. YTD Q3 '09 Financial Performance Source: Companies' statistical supplements. Excludes group medical insurance. See Appendix for non-GAAP financial information definitions and/or reconciliations. Premiums, Fees & Other Revenues Operating Earnings |
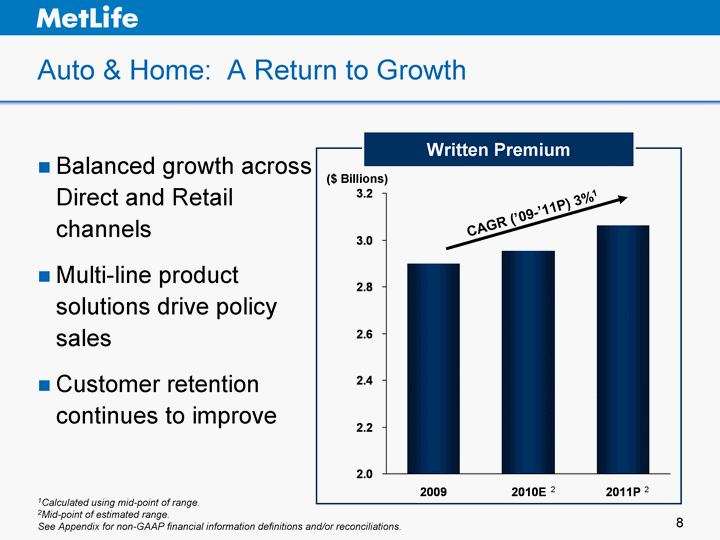
| 8 Auto & Home: A Return to Growth 8 Balanced growth across Direct and Retail channels Multi-line product solutions drive policy sales Customer retention continues to improve 2008 2009 2010E 2011P 2949 2.898 2.954 3.064 ($ Billions) Written Premium CAGR ('09-'11P) 3%1 1Calculated using mid-point of range. 2Mid-point of estimated range. See Appendix for non-GAAP financial information definitions and/or reconciliations. 2 2 |
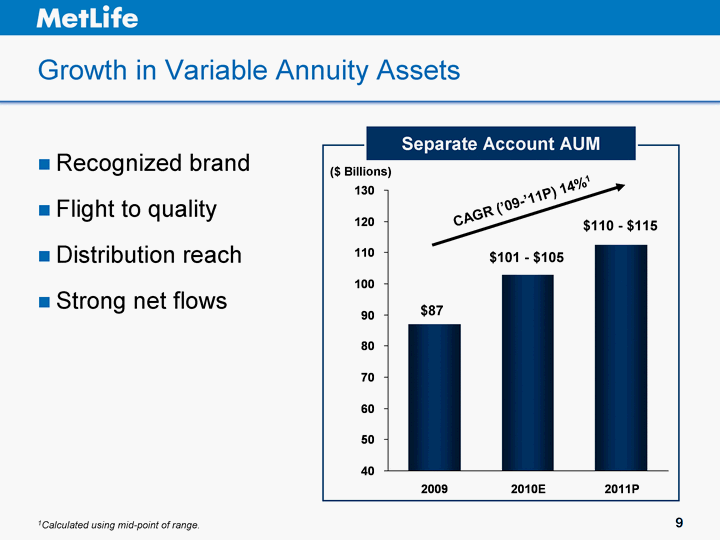
| 9 Growth in Variable Annuity Assets 9 1Calculated using mid-point of range. Recognized brand Flight to quality Distribution reach Strong net flows 1st Qtr 2nd Qtr 3rd Qtr 4th Qtr East 20.4 27.4 90 20.4 West 30.6 38.6 34.6 31.6 North 45.9 46.9 45 43.9 2008 2009 2010E 2011P 20389 87 103 112.5 ($ Billions) Separate Account AUM CAGR ('09-'11P) 14%1 $101 - $105 $110 - $115 $87 |
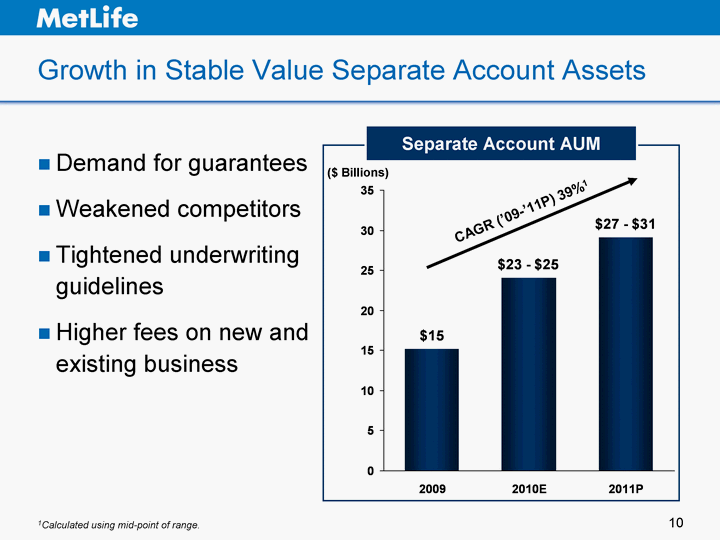
| 10 Growth in Stable Value Separate Account Assets 10 Demand for guarantees Weakened competitors Tightened underwriting guidelines Higher fees on new and existing business 1st Qtr 2nd Qtr 3rd Qtr 4th Qtr East 20.4 27.4 90 20.4 West 30.6 38.6 34.6 31.6 North 45.9 46.9 45 43.9 2008 2009 2010E 2011P 20389 15.181 24.101 29.164 ($ Billions) Separate Account AUM CAGR ('09-'11P) 39%1 1Calculated using mid-point of range. |
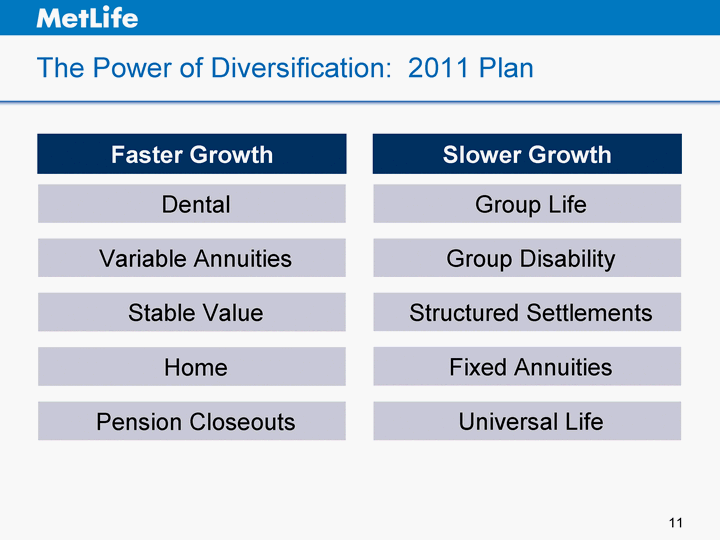
| 11 The Power of Diversification: 2011 Plan Faster Growth Group Life Slower Growth Group Disability Structured Settlements Fixed Annuities Dental Variable Annuities Stable Value Home Pension Closeouts 11 Universal Life |
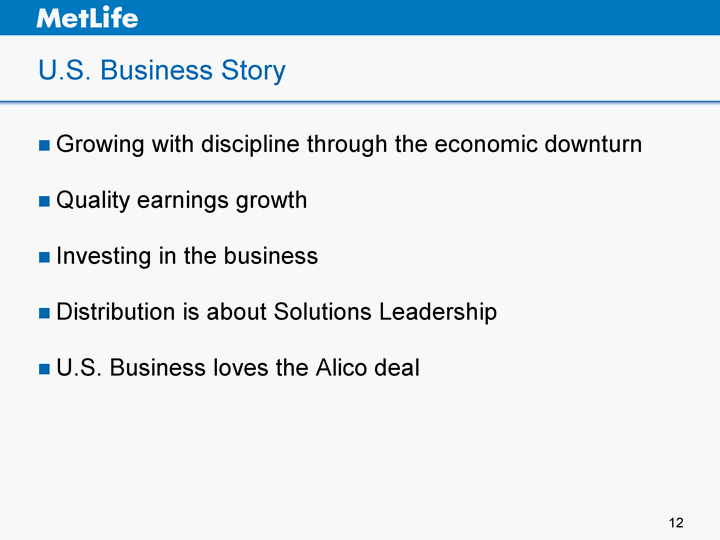
| 12 U.S. Business Story Growing with discipline through the economic downturn Quality earnings growth Investing in the business Distribution is about Solutions Leadership U.S. Business loves the Alico deal 12 |
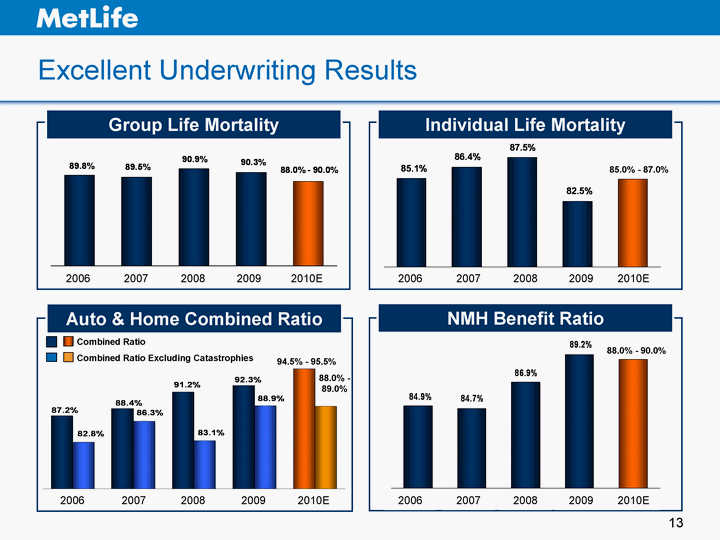
| 13 2006 2007 2008 2009 2010E Individual Mortality (Gross of Reinsurance) 0.849 0.847 0.869 0.892 0.888 NMH Benefit Ratio Excellent Underwriting Results 2006 2007 2008 2009 2010E Individual Mortality (Gross of Reinsurance) 0.851 0.864 0.875 0.825 0.85 Individual Life Mortality 2006 2007 2008 2009 2010E Combined Ratio 0.872 0.884 0.912148 0.923 0.951 Combined Ratio Ex Cats 0.828 0.863 0.831 0.889 0.888 2006 2007 2008 2009 2010E Group Term Life Mortality 0.898 0.895 0.909 0.903 0.888 94.5% - 95.5% Combined Ratio Combined Ratio Excluding Catastrophies Group Life Mortality Auto & Home Combined Ratio 85.0% - 87.0% 88.0% - 90.0% 88.0% - 89.0% 13 2006 2007 2008 2009 2010E 2006 2007 2008 2009 2010E 2006 2007 2008 2009 2010E 2006 2007 2008 2009 2010E |
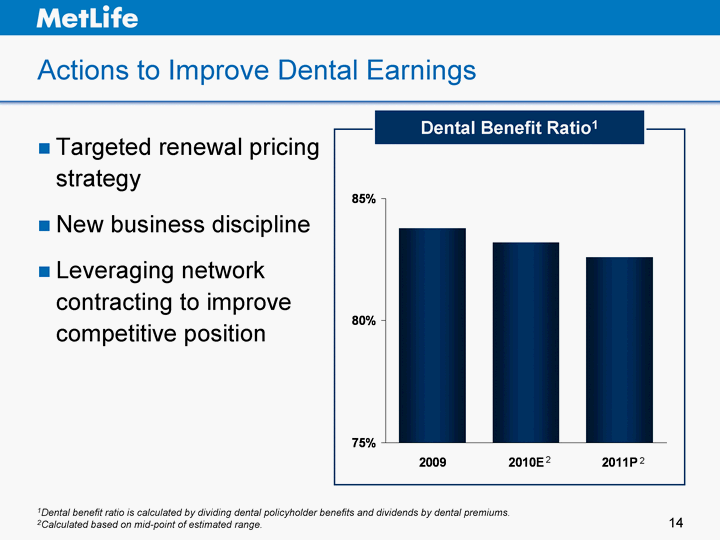
| 14 Actions to Improve Dental Earnings 14 Targeted renewal pricing strategy New business discipline Leveraging network contracting to improve competitive position 2008 2009 2010E 2011P Dental Benefit Ratio 0.817 0.838 0.832 0.826 Dental Benefit Ratio1 1Dental benefit ratio is calculated by dividing dental policyholder benefits and dividends by dental premiums. 2Calculated based on mid-point of estimated range. 2 2 |
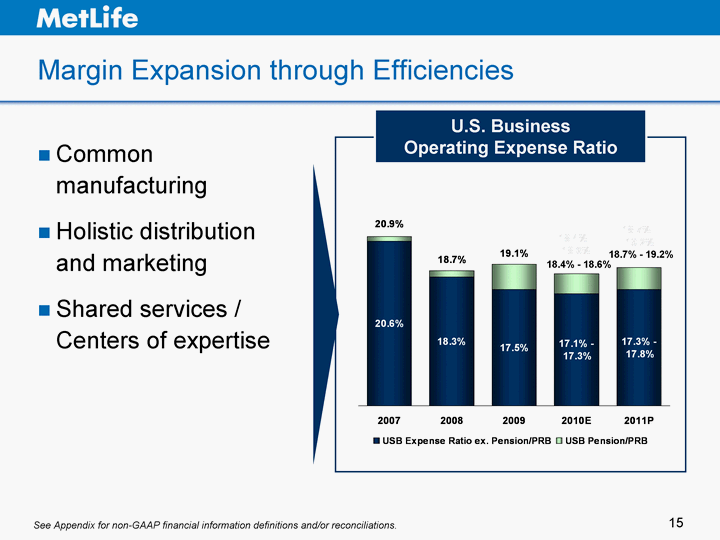
| Margin Expansion through Efficiencies Common manufacturing Holistic distribution and marketing Shared services / Centers of expertise See Appendix for non-GAAP financial information definitions and/or reconciliations. 2007 2008 2009 2010E 2011P USB Expense Ratio ex. Pension/PRB 0.206 0.183 0.175 0.172 0.175 USB Pension/PRB 0.003 0.004 0.016 0.013 0.014 18.7% - 19.2% 18.4% - 18.6% U.S. Business Operating Expense Ratio 15 |
| 16 Solid VA Sales with Risk Management Discipline 20% of sales have no living benefit rider Almost 10% of sales from simplified, lower cost, de-risked product Lowering GMIB guaranteed annuitization rates Modifying GMIB no-lapse guarantees 2011 Sales Plan $18.3 - $18.7 billion, 4%1 higher than 2010E 16 See Appendix for non-GAAP financial information definitions and/or reconciliations. 1Calculated using mid-point of range. |
| 17 Long-Term Care Actions Reduce Risk Announced decision to exit new business Demonstrated extended history of disciplined approach to risk management Prudent reserving approach Raised prices for certain individual policies 17 |
| 18 U.S. Business Story Growing with discipline through the economic downturn Quality earnings growth Investing in the business Distribution is about Solutions Leadership U.S. Business loves the Alico deal 18 |
| 19 Investing for the Future Enhanced distribution capabilities Product redesigns Expanded customer knowledge Data management and analytics Technology infrastructure 19 |
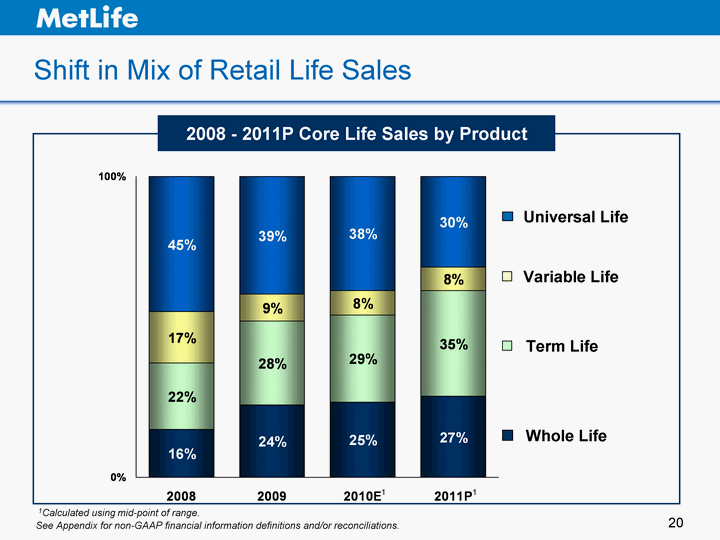
| 20 2007 2008 2009 2010E 2011P Whole Life 0.206 0.16 0.24 0.25 0.27 Term Life 0.004 0.22 0.28 0.29 0.35 Variable Life 0.17 0.09 0.08 0.08 Universal Life 0.45 0.39 0.38 0.3 Shift in Mix of Retail Life Sales 20 See Appendix for non-GAAP financial information definitions and/or reconciliations. 2008 - 2011P Core Life Sales by Product Universal Life Variable Life Term Life Whole Life 1Calculated using mid-point of range. 1 1 |
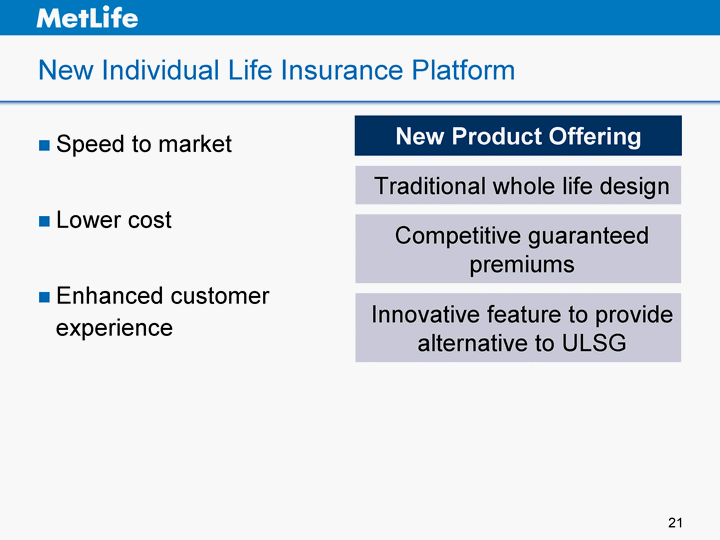
| 21 New Individual Life Insurance Platform Speed to market Lower cost Enhanced customer experience 21 Traditional whole life design New Product Offering Competitive guaranteed premiums Innovative feature to provide alternative to ULSG |
| 22 Insuring the Middle Market 22 Three major components Develop new tools to educate and empower consumers Open new distribution channels (phone, click to call, chat, web) Re-engineer underwriting to be faster, easier and cheaper Single session, driven by eUnderwriting, plus an online experience is patent-pending Innovative approach to reach underserved market |
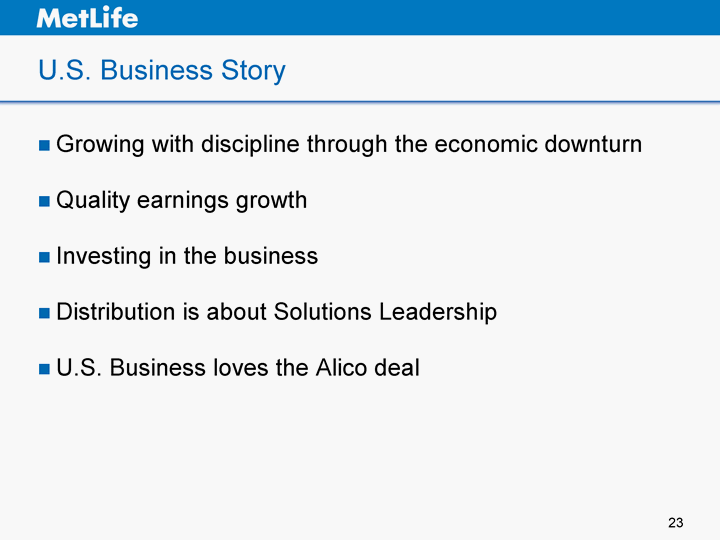
| 23 U.S. Business Story Growing with discipline through the economic downturn Quality earnings growth Investing in the business Distribution is about Solutions Leadership U.S. Business loves the Alico deal 23 |
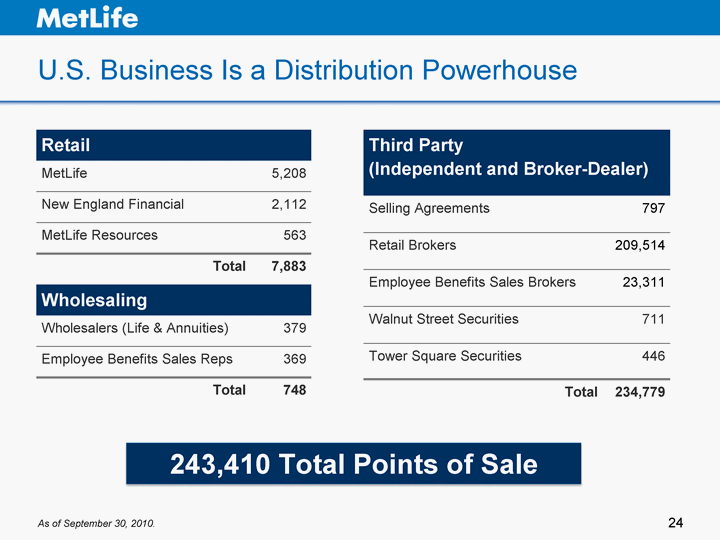
| 24 U.S. Business Is a Distribution Powerhouse 24 As of September 30, 2010. Retail Retail MetLife 5,208 New England Financial 2,112 MetLife Resources 563 Total 7,883 Wholesaling Wholesaling Wholesalers (Life & Annuities) 379 Employee Benefits Sales Reps 369 Total 748 Third Party (Independent and Broker-Dealer) Third Party (Independent and Broker-Dealer) Selling Agreements 797 Retail Brokers 209,514 Employee Benefits Sales Brokers 23,311 Walnut Street Securities 711 Tower Square Securities 446 Total 234,779 243,410 Total Points of Sale |
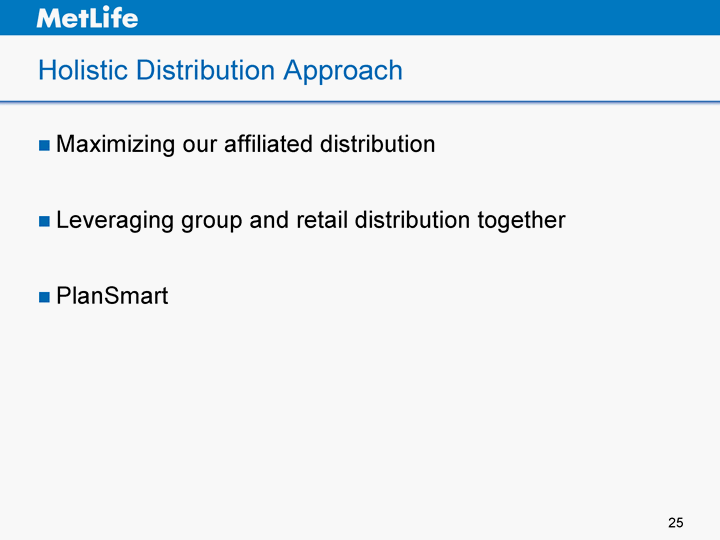
| 25 Holistic Distribution Approach Maximizing our affiliated distribution Leveraging group and retail distribution together PlanSmart 25 |
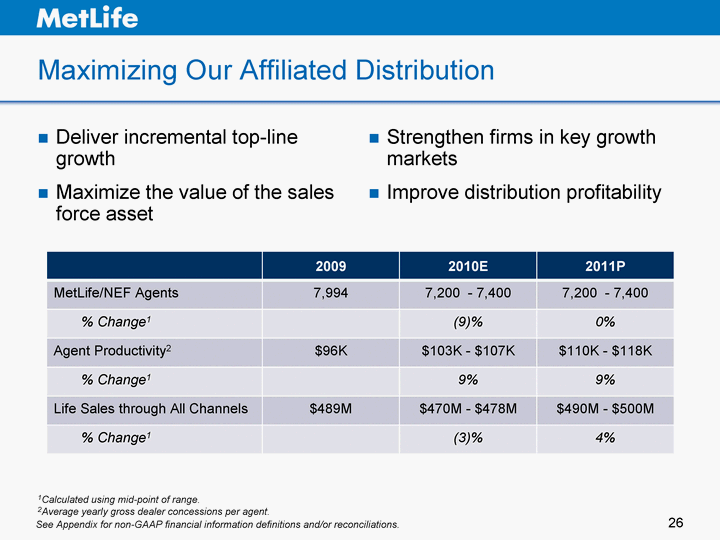
| 2009 2010E 2011P MetLife/NEF Agents 7,994 7,200 - 7,400 7,200 - 7,400 % Change1 (9)% 0% Agent Productivity $96K $103K - $107K $110K - $118K % Change1 9% 9% 26 Maximizing Our Affiliated Distribution Deliver incremental top-line growth Maximize the value of the sales force asset 26 Strengthen firms in key growth markets Improve distribution profitability 1Calculated using mid-point of range. 2Average yearly gross dealer concessions per agent. See Appendix for non-GAAP financial information definitions and/or reconciliations. 2009 2010E 2011P MetLife/NEF Agents 7,994 7,200 - 7,400 7,200 - 7,400 % Change1 (9)% 0% Agent Productivity2 $96K $103K - $107K $110K - $118K % Change1 9% 9% Life Sales through All Channels $489M $470M - $478M $490M - $500M % Change1 (3)% 4% |
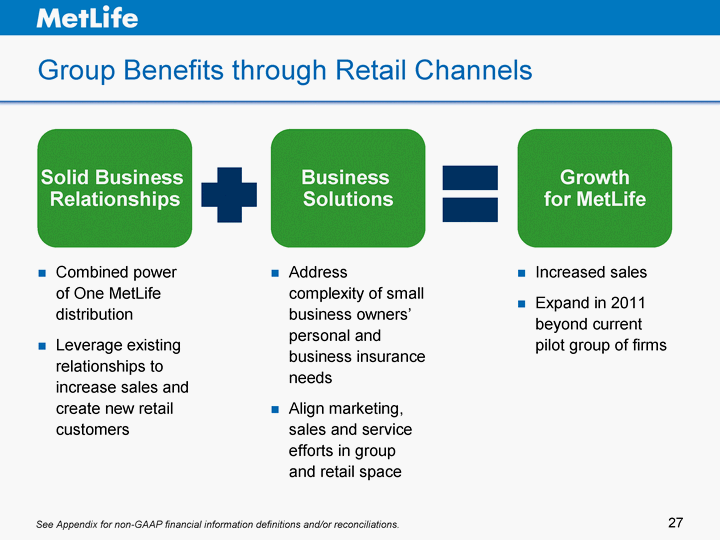
| 27 Group Benefits through Retail Channels Address complexity of small business owners' personal and business insurance needs Align marketing, sales and service efforts in group and retail space 27 Solid Business Relationships Business Solutions Growth for MetLife Increased sales Expand in 2011 beyond current pilot group of firms See Appendix for non-GAAP financial information definitions and/or reconciliations. Combined power of One MetLife distribution Leverage existing relationships to increase sales and create new retail customers |
| 28 PlanSmart Opportunity 28 Leverages strengths of Employee Benefits and Retail distribution channels Brings together new and existing educational programs with one face to the customer Competitive differentiator Highly valued service to employers Recruiting and retention in individual distribution business Opportunity to reach executive marketplace Creates new markets for advisors |
| 29 U.S. Business Story Growing with discipline through the economic downturn Quality earnings growth Investing in the business Distribution is about Solutions Leadership U.S. Business loves the Alico deal 29 |
| 30 Alico Brings Opportunities for U.S. Business Multinational solutions Two-way product and capability transfer Pension closeout expertise Accident & Health Direct marketing Increased name recognition with U.S. customers born outside the U.S. 30 |
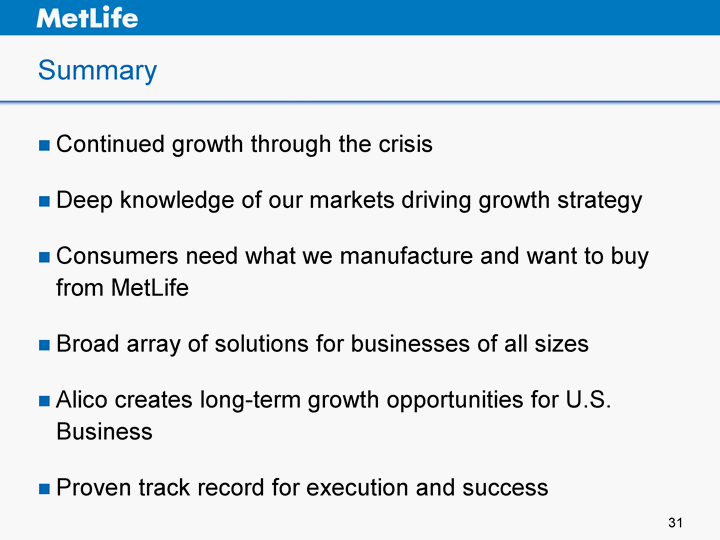
| 31 Summary Continued growth through the crisis Deep knowledge of our markets driving growth strategy Consumers need what we manufacture and want to buy from MetLife Broad array of solutions for businesses of all sizes Alico creates long-term growth opportunities for U.S. Business Proven track record for execution and success 31 |
| INVESTOR DAY 2 0 1 0 William J. Toppeta President International |
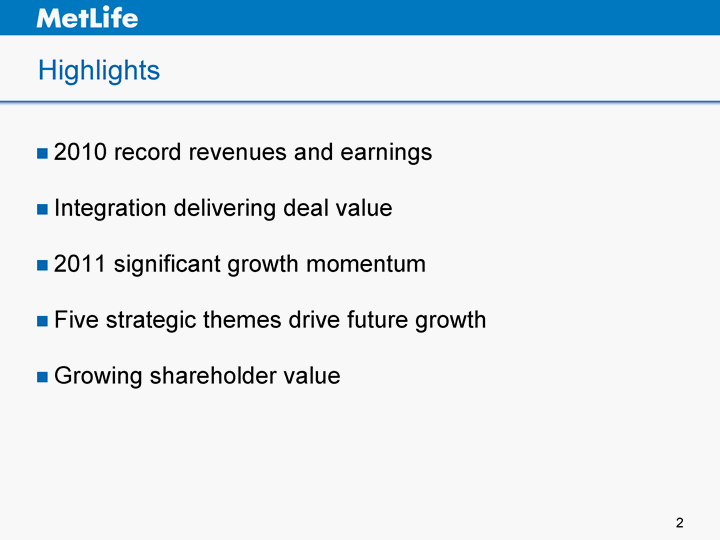
| Highlights 2010 record revenues and earnings Integration delivering deal value 2011 significant growth momentum Five strategic themes drive future growth Growing shareholder value |
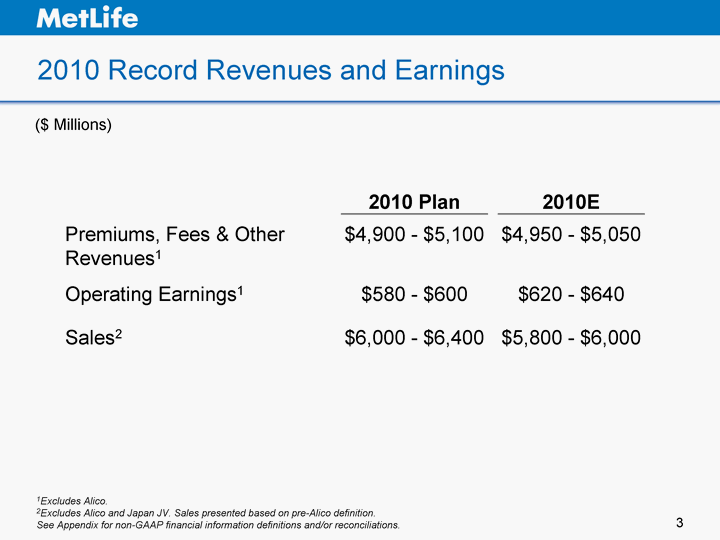
| 2010 Record Revenues and Earnings 1Excludes Alico. 2Excludes Alico and Japan JV. Sales presented based on pre-Alico definition. See Appendix for non-GAAP financial information definitions and/or reconciliations. 2010 Plan 2010E Premiums, Fees & Other Revenues1 $4,900 - $5,100 $4,950 - $5,050 Operating Earnings1 $580 - $600 $620 - $640 Sales2 $6,000 - $6,400 $5,800 - $6,000 ($ Millions) |
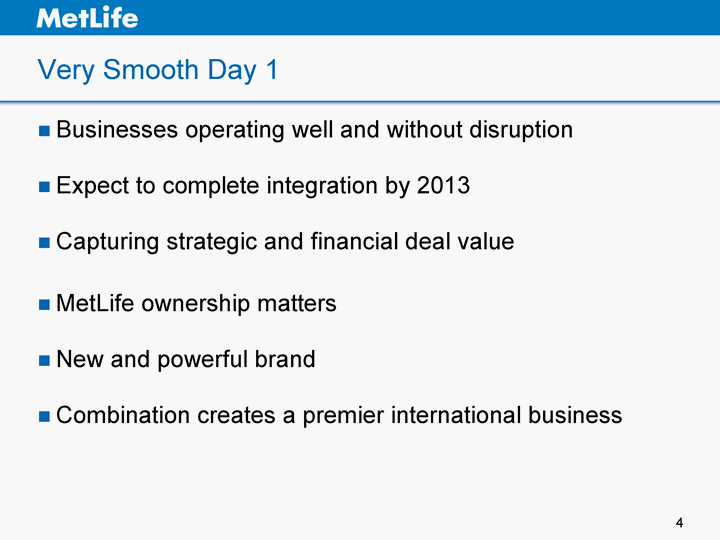
| Very Smooth Day 1 Businesses operating well and without disruption Expect to complete integration by 2013 Capturing strategic and financial deal value MetLife ownership matters New and powerful brand Combination creates a premier international business |
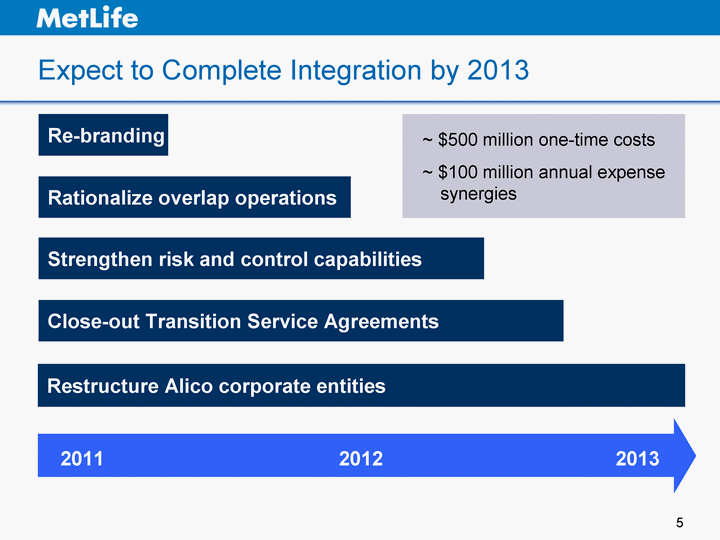
| Expect to Complete Integration by 2013 Re-branding Rationalize overlap operations Strengthen risk and control capabilities Close-out Transition Service Agreements Restructure Alico corporate entities 2011 2013 2012 ~ $500 million one-time costs ~ $100 million annual expense synergies |
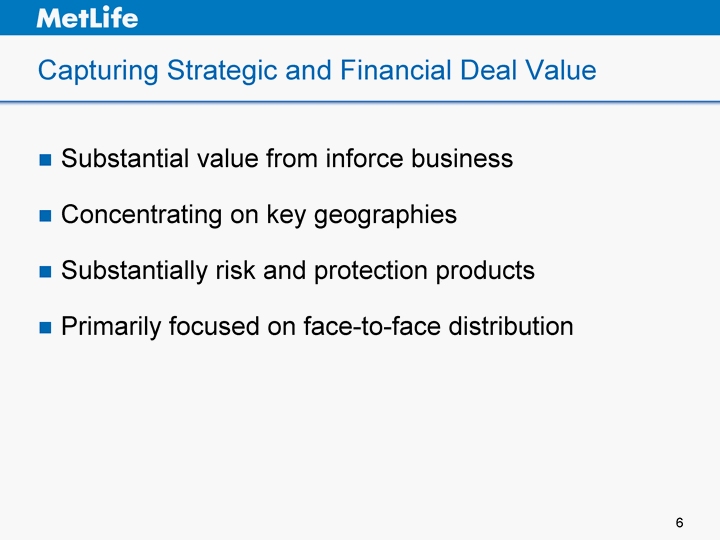
| Capturing Strategic and Financial Deal Value Substantial value from inforce business Concentrating on key geographies Substantially risk and protection products Primarily focused on face-to-face distribution |
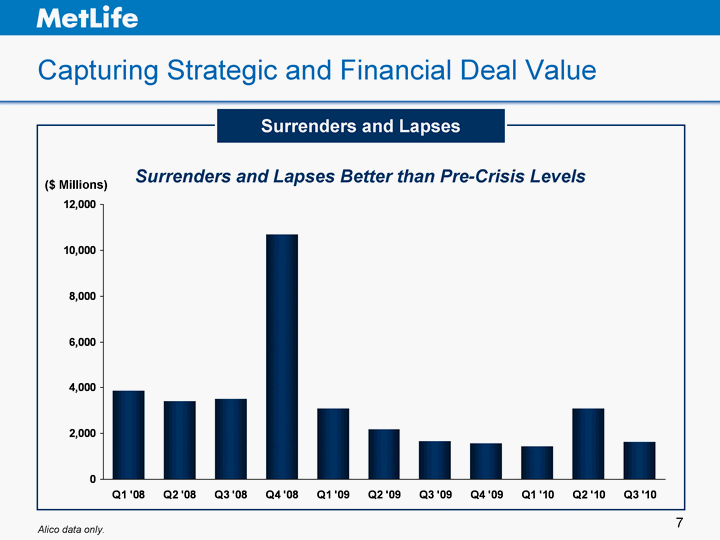
| Capturing Strategic and Financial Deal Value Q1 '08 Q2 '08 Q3 '08 Q4 '08 Q1 '09 Q2 '09 Q3 '09 Q4 '09 Q1 '10 Q2 '10 Q3 '10 Total 3855 3399 3485 10681 3088 2155 1648 1553 1437 3085 1622 ($ Millions) Surrenders and Lapses Alico data only. Surrenders and Lapses Better than Pre-Crisis Levels |
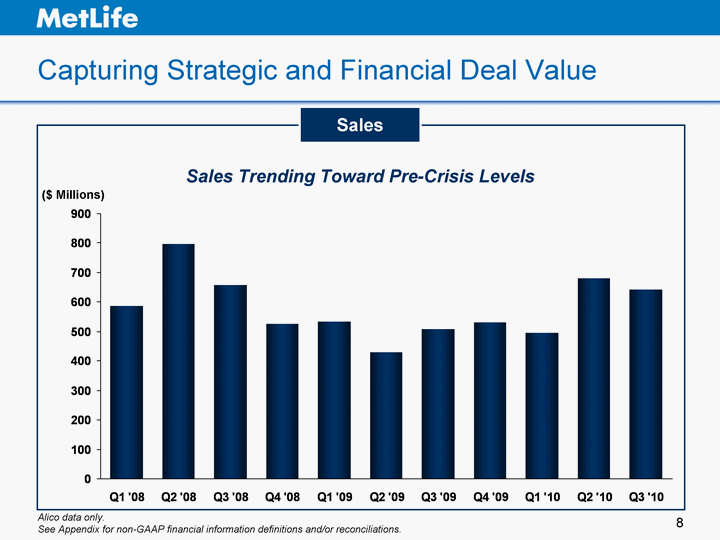
| Q1 '08 Q2 '08 Q3 '08 Q4 '08 Q1 '09 Q2 '09 Q3 '09 Q4 '09 Q1 '10 Q2 '10 Q3 '10 Total 586 797 656 525 533 428 506 531 495 680 641 Capturing Strategic and Financial Deal Value See Appendix for non-GAAP financial information definitions and/or reconciliations. Sales Trending Toward Pre-Crisis Levels Alico data only. Sales ($ Millions) |
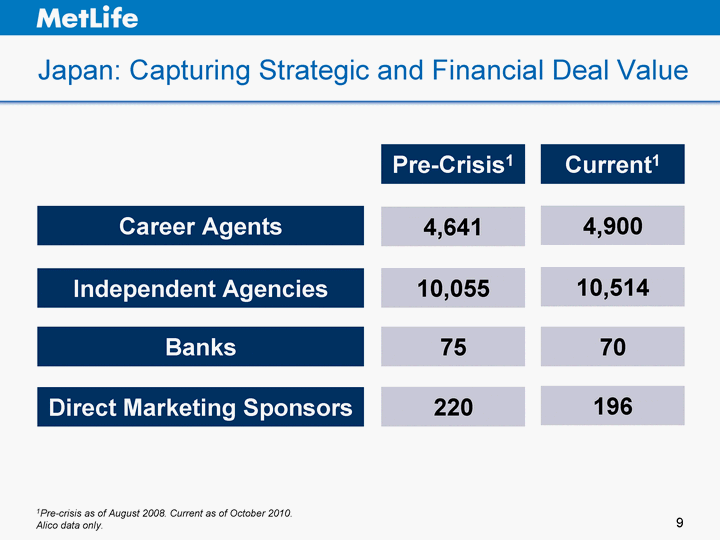
| Japan: Capturing Strategic and Financial Deal Value Career Agents Banks Direct Marketing Sponsors 1Pre-crisis as of August 2008. Current as of October 2010. Alico data only. 4,641 75 220 4,900 70 196 Pre-Crisis1 Current1 Independent Agencies 10,055 10,514 |
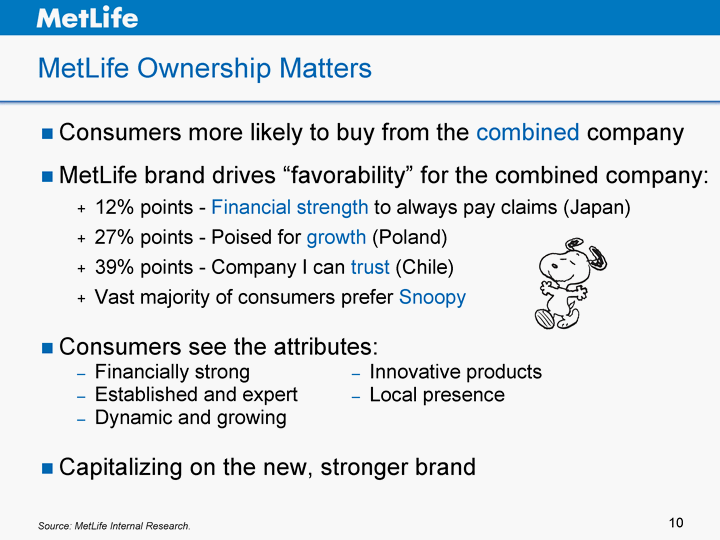
| MetLife Ownership Matters Consumers more likely to buy from the combined company MetLife brand drives "favorability" for the combined company: 12% points - Financial strength to always pay claims (Japan) 27% points - Poised for growth (Poland) 39% points - Company I can trust (Chile) Vast majority of consumers prefer Snoopy Consumers see the attributes: Financially strong Established and expert Dynamic and growing Capitalizing on the new, stronger brand Source: MetLife Internal Research. Innovative products Local presence |

| "Today the world is waking up to a more secure tomorrow" Key idea: Starting today, MetLife and Alico have joined together to become the global insurer better able to help more people protect themselves and their families. New and Powerful Brand |
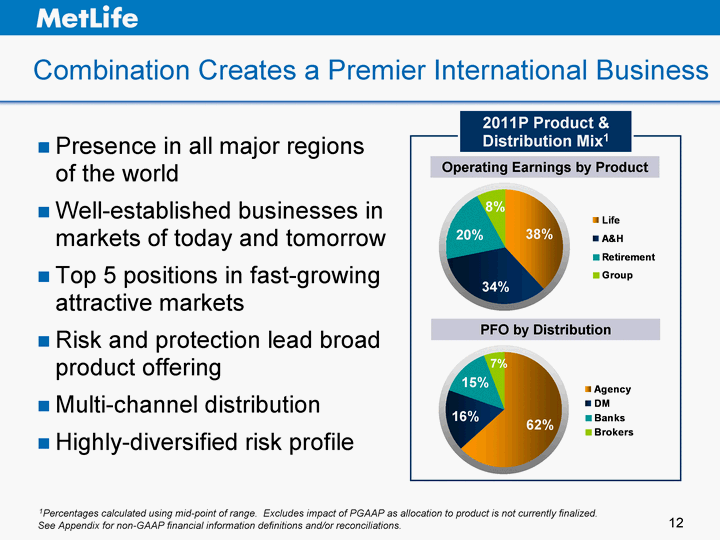
| Agency DM Banks Brokers East 0.64 0.17 0.14 0.06 Life A&H Retirement Group East 0.38 0.34 0.2 0.08 Combination Creates a Premier International Business 1Percentages calculated using mid-point of range. Excludes impact of PGAAP as allocation to product is not currently finalized. 2011P Product & Distribution Mix1 34% 38% 20% 8% 62% 16% 15% 7% Presence in all major regions of the world Well-established businesses in markets of today and tomorrow Top 5 positions in fast-growing attractive markets Risk and protection lead broad product offering Multi-channel distribution Highly-diversified risk profile See Appendix for non-GAAP financial information definitions and/or reconciliations. PFO by Distribution Operating Earnings by Product |
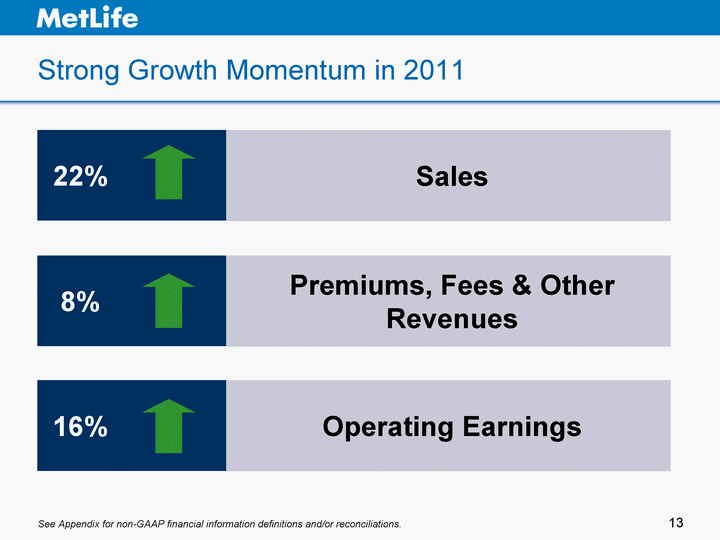
| Premiums, Fees & Other Revenues Operating Earnings Sales Strong Growth Momentum in 2011 22% 8% 16% See Appendix for non-GAAP financial information definitions and/or reconciliations. |
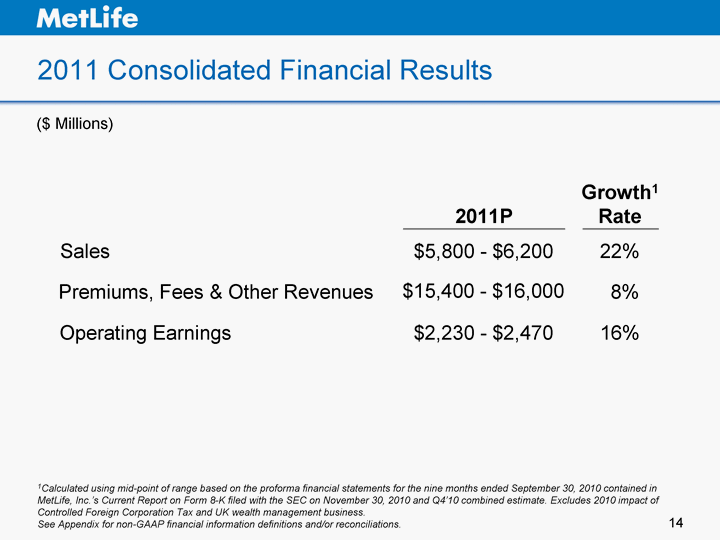
| 2011 Consolidated Financial Results ($ Millions) 2011P Growth1 Rate Sales $5,800 - $6,200 22% Premiums, Fees & Other Revenues $15,400 - $16,000 8% Operating Earnings $2,230 - $2,470 16% 1Calculated using mid-point of range based on the proforma financial statements for the nine months ended September 30, 2010 contained in MetLife, Inc.'s Current Report on Form 8-K filed with the SEC on November 30, 2010 and Q4'10 combined estimate. Excludes 2010 impact of Controlled Foreign Corporation Tax and UK wealth management business. See Appendix for non-GAAP financial information definitions and/or reconciliations. |
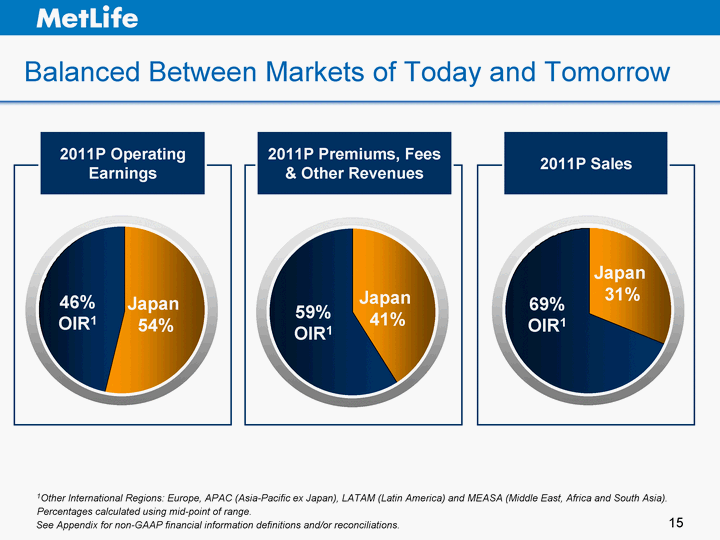
| 1st Qtr 2nd Qtr 3rd Qtr 4th Qtr East 0.41 0.59 90 20.4 West 30.6 38.6 34.6 31.6 North 45.9 46.9 45 43.9 1st Qtr 2nd Qtr 3rd Qtr 4th Qtr East 0.54 0.46 90 20.4 West 30.6 38.6 34.6 31.6 North 45.9 46.9 45 43.9 1st Qtr 2nd Qtr 3rd Qtr 4th Qtr East 0.31 0.69 90 20.4 West 30.6 38.6 34.6 31.6 North 45.9 46.9 45 43.9 Japan 54% 46% OIR1 Balanced Between Markets of Today and Tomorrow Japan 41% 59% OIR1 Japan 31% 69% OIR1 1Other International Regions: Europe, APAC (Asia-Pacific ex Japan), LATAM (Latin America) and MEASA (Middle East, Africa and South Asia). See Appendix for non-GAAP financial information definitions and/or reconciliations. 2011P Operating Earnings 2011P Premiums, Fees & Other Revenues 2011P Sales Percentages calculated using mid-point of range. |
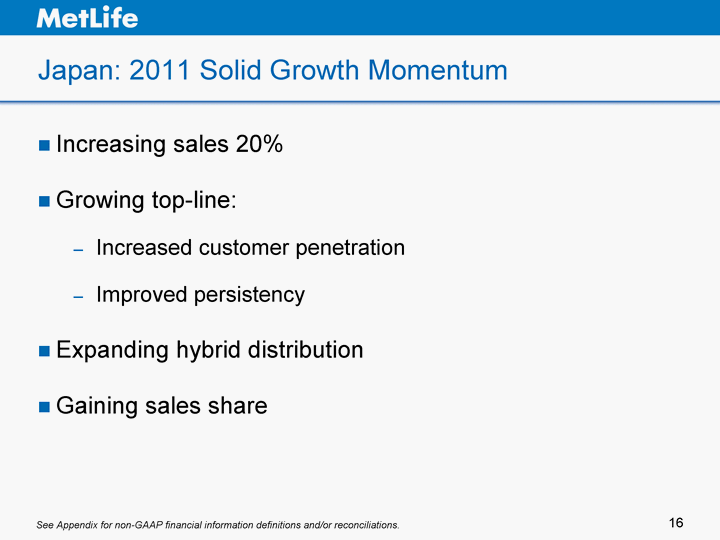
| Japan: 2011 Solid Growth Momentum Increasing sales 20% Growing top-line: Increased customer penetration Improved persistency Expanding hybrid distribution Gaining sales share See Appendix for non-GAAP financial information definitions and/or reconciliations. |
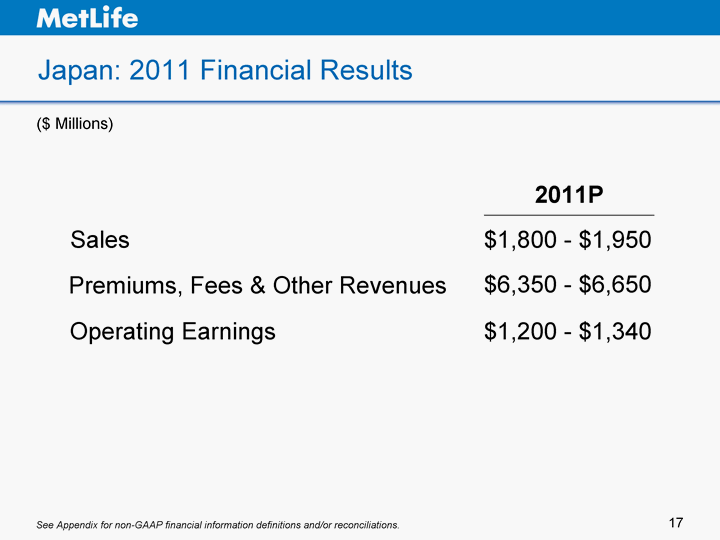
| Japan: 2011 Financial Results ($ Millions) 2011P Sales $1,800 - $1,950 Premiums, Fees & Other Revenues $6,350 - $6,650 Operating Earnings $1,200 - $1,340 See Appendix for non-GAAP financial information definitions and/or reconciliations. |
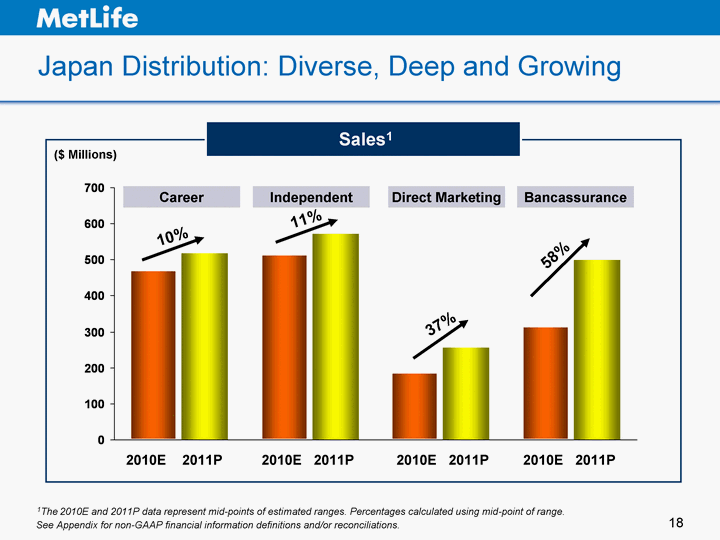
| Japan Distribution: Diverse, Deep and Growing 2010 Estimate 2011 Plan 4th Qtr Career 472 518 31.6 Independent 516 572 43.9 Direct Marketing 186 255 Bancassurance 316 499 ($ Millions) Sales1 See Appendix for non-GAAP financial information definitions and/or reconciliations. Career Independent Direct Marketing Bancassurance 2010E 2011P 2010E 2011P 10% 11% 37% 58% 1The 2010E and 2011P data represent mid-points of estimated ranges. Percentages calculated using mid-point of range. 2010E 2011P 2010E 2011P |
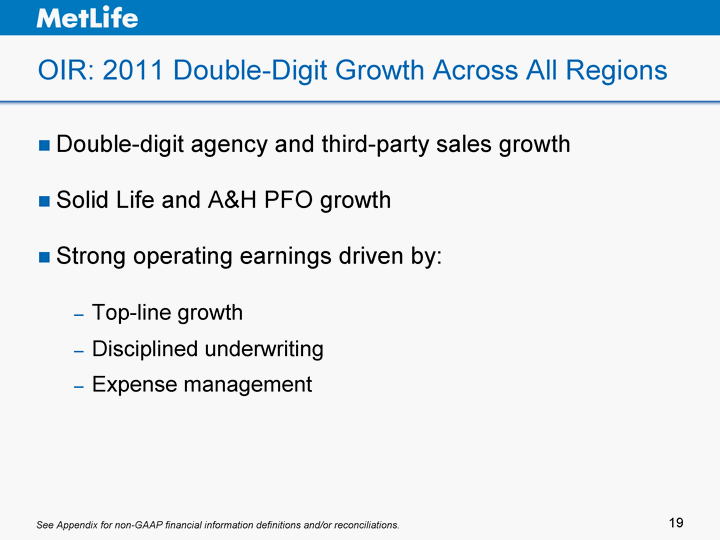
| OIR: 2011 Double-Digit Growth Across All Regions Double-digit agency and third-party sales growth Solid Life and A&H PFO growth Strong operating earnings driven by: Top-line growth Disciplined underwriting Expense management See Appendix for non-GAAP financial information definitions and/or reconciliations. |
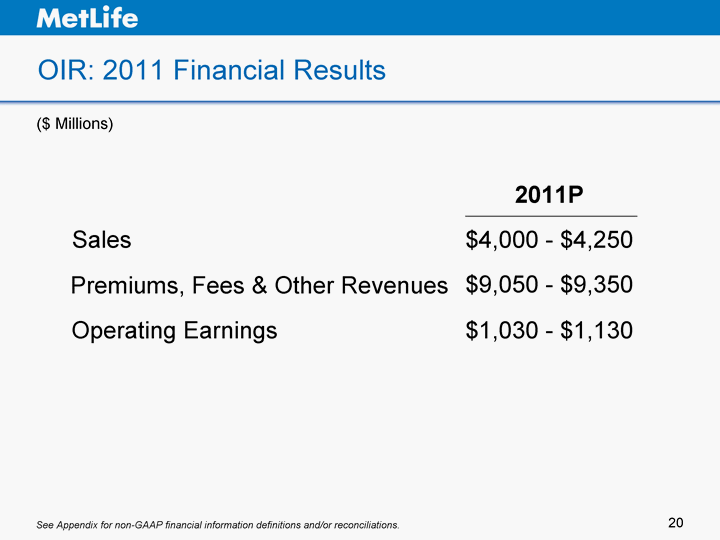
| OIR: 2011 Financial Results ($ Millions) 2011P Sales $4,000 - $4,250 Premiums, Fees & Other Revenues $9,050 - $9,350 Operating Earnings $1,030 - $1,130 See Appendix for non-GAAP financial information definitions and/or reconciliations. |
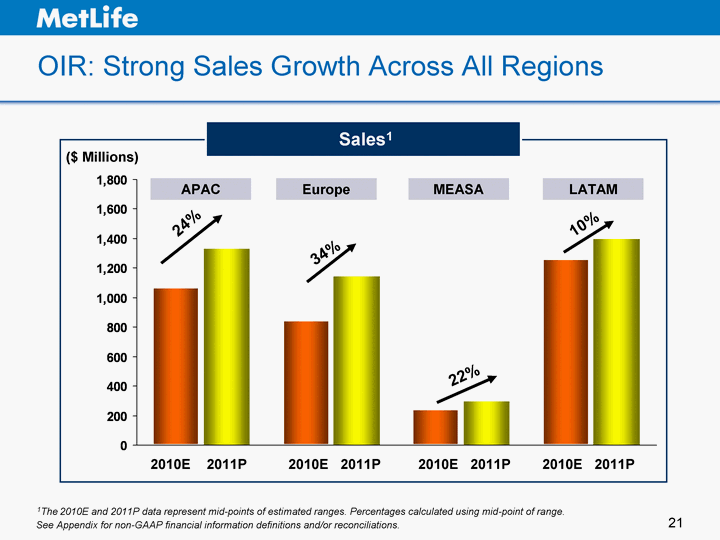
| OIR: Strong Sales Growth Across All Regions 2010 Estimate 2011 Plan 4th Qtr APAC 1071 1329 31.6 Europe 848 1140 43.9 MEASA 241 293 LATAM 1261 1392 ($ Millions) Sales1 See Appendix for non-GAAP financial information definitions and/or reconciliations. APAC Europe MEASA LATAM 2010E 2011P 2010E 2011P 2010E 2011P 2010E 2011P 24% 34% 22% 10% 1The 2010E and 2011P data represent mid-points of estimated ranges. Percentages calculated using mid-point of range. |
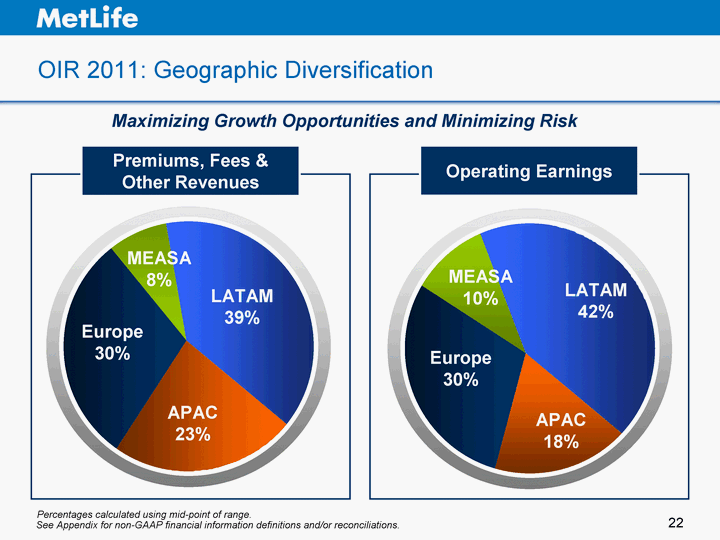
| Asia Europe MEASA LatAm East 0.23 0.3 0.08 0.39 Asia Europe MEASA LatAm East 0.18 0.3 0.1 0.42 OIR 2011: Geographic Diversification Europe 30% LATAM 39% MEASA 8% APAC 23% Europe 30% LATAM 42% MEASA 10% APAC 18% See Appendix for non-GAAP financial information definitions and/or reconciliations. Premiums, Fees & Other Revenues Operating Earnings Maximizing Growth Opportunities and Minimizing Risk Percentages calculated using mid-point of range. |
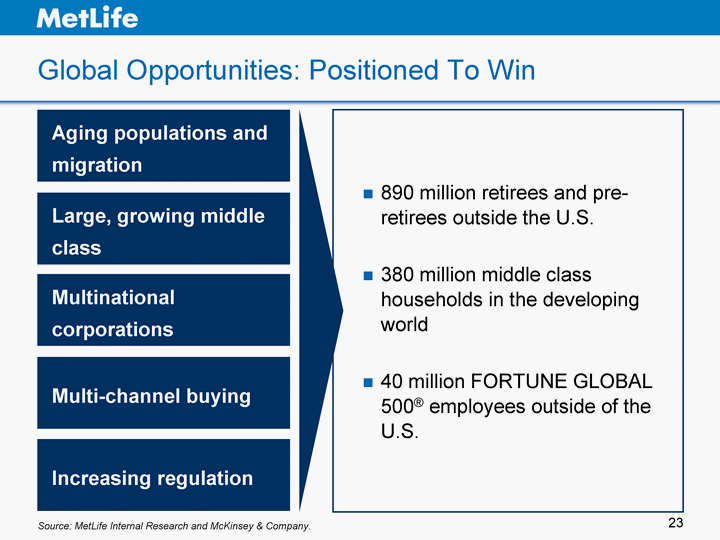
| Global Opportunities: Positioned To Win 890 million retirees and pre- retirees outside the U.S. 380 million middle class households in the developing world 40 million FORTUNE GLOBAL 500(r) employees outside of the U.S. Aging populations and migration Large, growing middle class Multinational corporations Multi-channel buying Increasing regulation Source: MetLife Internal Research and McKinsey & Company. |
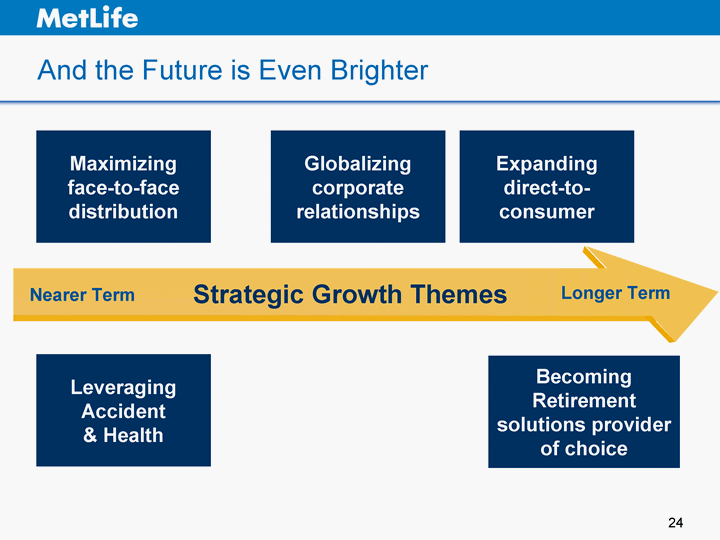
| And the Future is Even Brighter Maximizing face-to-face distribution Nearer Term Longer Term Leveraging Accident & Health Globalizing corporate relationships Expanding direct-to- consumer Becoming Retirement solutions provider of choice Strategic Growth Themes |
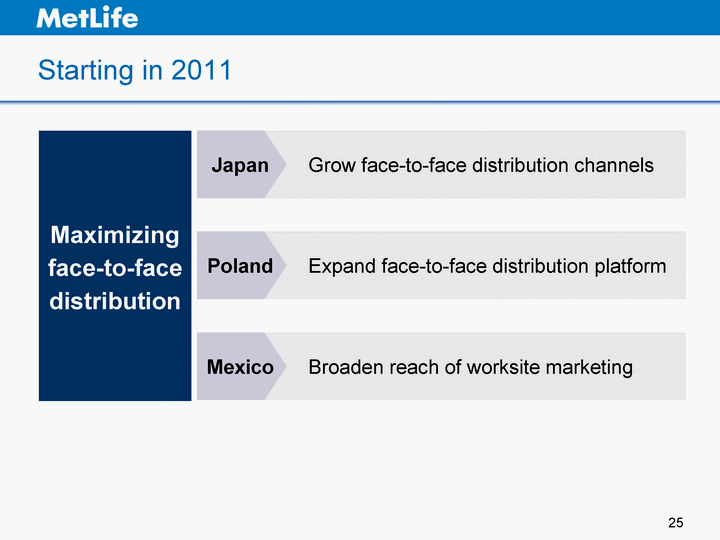
| Starting in 2011 Maximizing face-to-face distribution Grow face-to-face distribution channels Expand face-to-face distribution platform Broaden reach of worksite marketing Japan Poland Mexico |
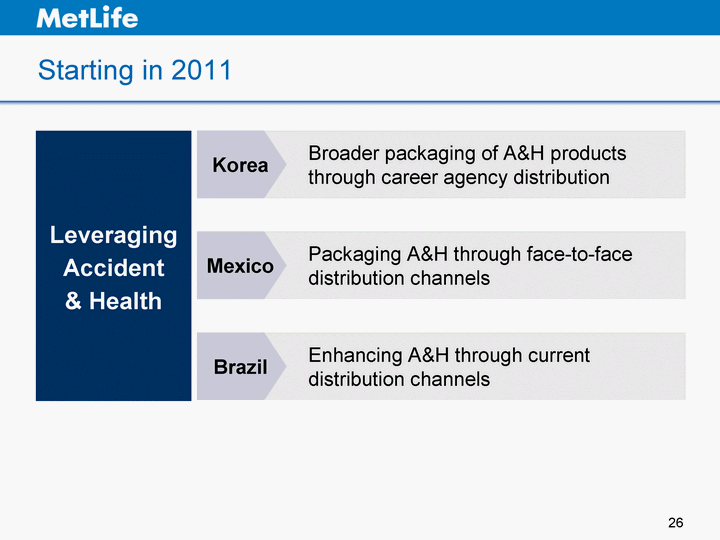
| Starting in 2011 Leveraging Accident & Health Broader packaging of A&H products through career agency distribution Packaging A&H through face-to-face distribution channels Enhancing A&H through current distribution channels Korea Mexico Brazil |
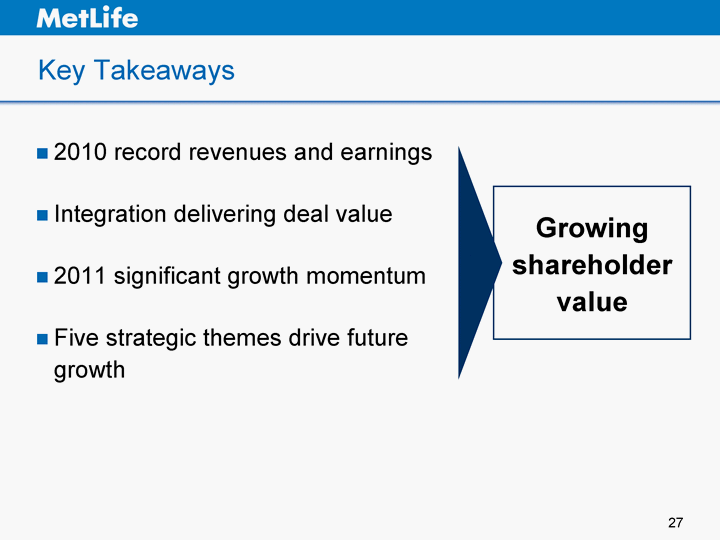
| 2010 record revenues and earnings Integration delivering deal value 2011 significant growth momentum Five strategic themes drive future growth Growing shareholder value Key Takeaways |
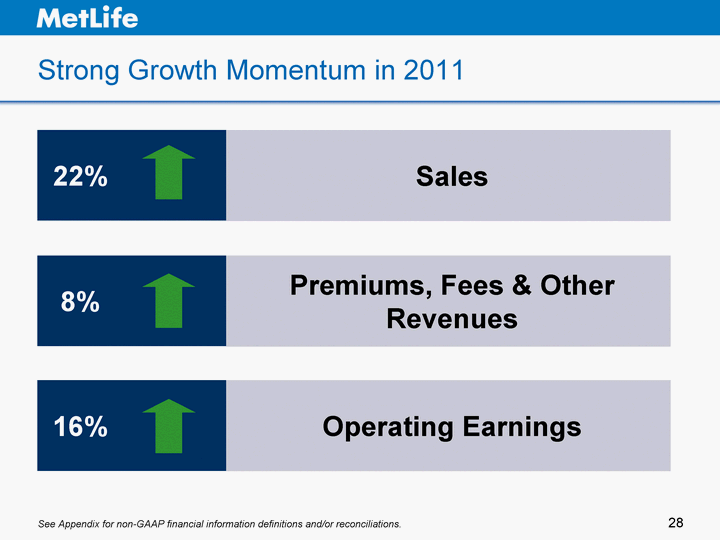
| Premiums, Fees & Other Revenues Operating Earnings Sales Strong Growth Momentum in 2011 22% 8% 16% See Appendix for non-GAAP financial information definitions and/or reconciliations. |
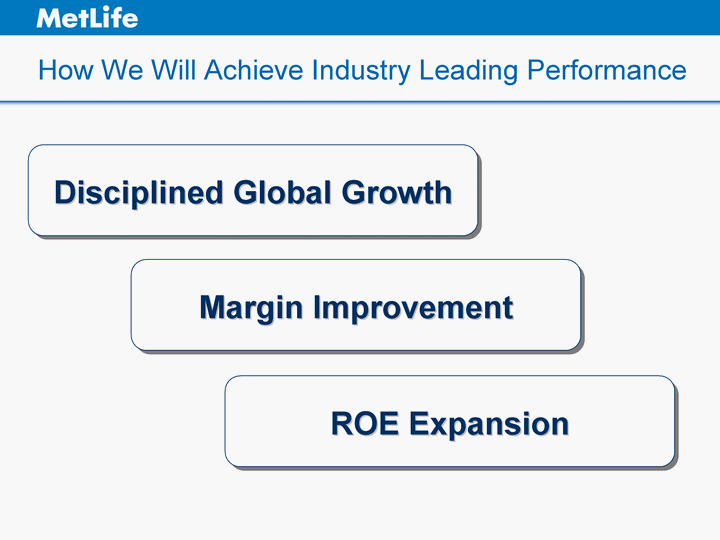
| How We Will Achieve Industry Leading Performance Disciplined Global Growth Margin Improvement ROE Expansion |
| INVESTOR DAY 2 0 1 0 Appendix |
| All references in these slides and in the presentations made at Investor Day to net income (loss), net income (loss) per share, operating earnings and operating earnings per share should be read as net income (loss) available to MetLife, Inc.'s common shareholders, net income (loss) available to MetLife, Inc.'s common shareholders per diluted common share, operating earnings available to common shareholders and operating earnings available to common shareholders per diluted common share, respectively. The historical and forward-looking financial information presented at Investor Day and contained in the presentations include performance measures which are based on methodologies other than generally accepted accounting principles ("GAAP"). We analyze our performance using financial measures, such as operating earnings, operating revenues, operating expenses, operating earnings available to common shareholders and operating earnings available to common shareholders per diluted common share, that are not based on GAAP. We believe the presentation of operating earnings and operating earnings available to common shareholders as we measure it for management purposes enhances the understanding of our performance by highlighting the results of operations and the underlying profitability drivers of our businesses. Operating earnings, operating revenues, operating expenses, operating earnings available to common shareholders, operating earnings available to common shareholders per diluted common share and operating return on common equity should not be viewed as substitutes for GAAP net income (loss) from continuing operations, net of income tax, GAAP revenues, GAAP expenses, GAAP net income (loss) available to MetLife, Inc.'s common shareholders, GAAP net income (loss) available to MetLife, Inc.'s common shareholders per diluted common share, and return on common equity, respectively. Operating earnings is the measure of segment profit or loss that we use to evaluate segment performance and allocate resources and, consistent with GAAP accounting guidance for segment reporting, is MetLife's measure of segment performance. Operating earnings is also a measure by which our senior management's and many other employees' performance is evaluated for the purposes of determining their compensation under applicable compensation plans. Operating earnings is defined as operating revenues less operating expenses, net of income tax. Operating earnings available to common shareholders is defined as operating earnings less preferred stock dividends and operating earnings available to common shareholders per diluted common share is calculated by dividing operating earnings available to common shareholders by the number of weighted average diluted common shares outstanding for the period indicated. Operating revenues is defined as GAAP revenues (i) less net investment gains (losses) and net derivative gains (losses), (ii) less amortization of unearned revenue related to net investment gains (losses) and net derivative gains (losses), (iii) plus scheduled periodic settlement payments on derivatives that are hedges of investments but do not qualify for hedge accounting treatment, (iv) plus income from discontinued real estate operations and (v) plus, for operating joint ventures reported under the equity method of accounting, the aforementioned adjustments, those identified in the definition of operating expenses and changes in fair value of hedges of operating joint venture liabilities, all net of income tax. Operating expenses is defined as GAAP expenses (i) less changes in policyholder benefits associated with asset value fluctuations related to experience-rated contractholder liabilities and certain inflation-indexed liabilities, (ii) less costs related to business combinations and noncontrolling interests, (iii) less amortization of deferred policy acquisition costs and value of business acquired and changes in the policyholder dividend obligation related to net investment gains (losses) and net derivative gains (losses) and (iv) plus scheduled periodic settlement payments on derivatives that are hedges of policyholder account balances but do not qualify for hedge accounting treatment. Explanatory Note on Non-GAAP Financial Information |
| In addition, operating revenues and operating expenses do not reflect the consolidation of certain securitization entities that are variable interest entities as required under GAAP. Operating return on common equity is calculated by dividing operating earnings available to common shareholders by average MetLife, Inc. common equity for the period indicated, excluding accumulated other comprehensive income. Managed Assets is a financial measure based on methodologies other than GAAP. We utilize "Managed Assets" to describe assets in our investment portfolio which are actively managed, available-for-sale and reflected at estimated fair value. We believe the use of Managed Assets enhances the understanding and comparability of our investment portfolio by excluding assets such as policy loans, other invested assets, mortgages held-for-sale, and mortgage loans held by consolidated securitization entities, as substantially all of these assets are not actively managed in our investment portfolio. Trading securities are also excluded, as these securities are not classified as available-for-sale. Mortgage loans and certain real estate investments have also been adjusted from carrying value to estimated fair value. A reconciliation of Managed Assets to Total Investments is included in the Appendix to the presentations. Additional information about our investments is available in our Quarterly Financial Supplements for the corresponding periods which may be accessed through the Investor Relations portion of our Internet website (www.metlife.com). Non-GAAP measures, such as Managed Assets, should not be viewed as substitutes for the most directly comparable GAAP measures. For the historical periods presented, reconciliations of non-GAAP measures used in the presentations made at Investor Day to the most directly comparable GAAP measures are included in the Appendix to the presentations and are on our Internet website. Additional information about our historical financial results is also available in our Quarterly Financial Supplements for the corresponding periods which may be accessed through our Internet website. The non-GAAP measures used in the presentations made at Investor Day should not be viewed as substitutes for the most directly comparable GAAP measures. In the presentations made at Investor Day, we provide guidance on our future earnings, earnings per diluted common share and return on common equity on an operating and non-GAAP basis. A reconciliation of the non-GAAP measures to the most directly comparable GAAP measures is not accessible on a forward-looking basis because we believe it is not possible to provide other than a range of net investment gains and losses, which can fluctuate significantly within or without the range and from period to period and may have a significant impact on GAAP net income. Explanatory Note on Non-GAAP Financial Information (Continued) |
| Table of Contents Table of Contents |
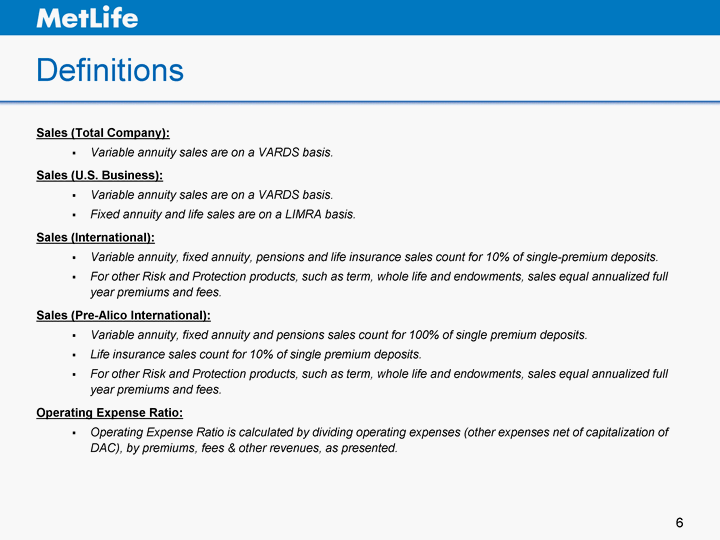
| Definitions Sales (Total Company): Variable annuity sales are on a VARDS basis. Sales (U.S. Business): Variable annuity sales are on a VARDS basis. Fixed annuity and life sales are on a LIMRA basis. Sales (International): Variable annuity, fixed annuity, pensions and life insurance sales count for 10% of single-premium deposits. For other Risk and Protection products, such as term, whole life and endowments, sales equal annualized full year premiums and fees. Sales (Pre-Alico International): Variable annuity, fixed annuity and pensions sales count for 100% of single premium deposits. Life insurance sales count for 10% of single premium deposits. For other Risk and Protection products, such as term, whole life and endowments, sales equal annualized full year premiums and fees. Operating Expense Ratio: Operating Expense Ratio is calculated by dividing operating expenses (other expenses net of capitalization of DAC), by premiums, fees & other revenues, as presented. |
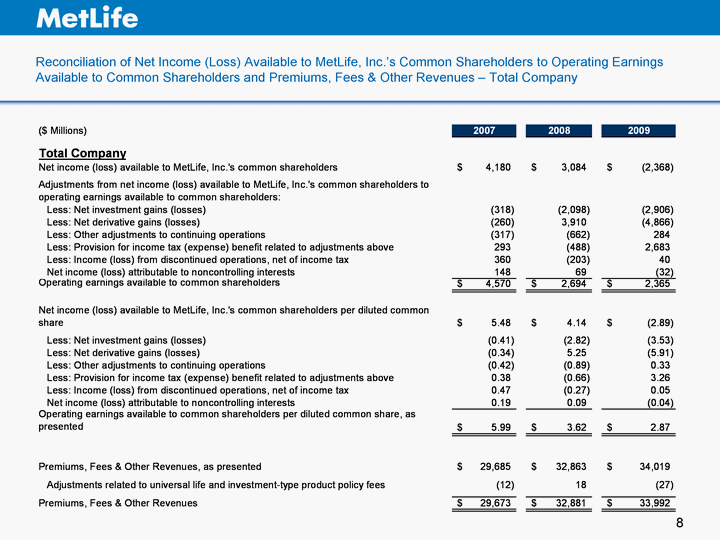
| Reconciliation of Net Income (Loss) Available to MetLife, Inc.'s Common Shareholders to Operating Earnings Available to Common Shareholders and Premiums, Fees & Other Revenues - Total Company Available to Common Shareholders and Premiums, Fees & Other Revenues - Total Company Available to Common Shareholders and Premiums, Fees & Other Revenues - Total Company |
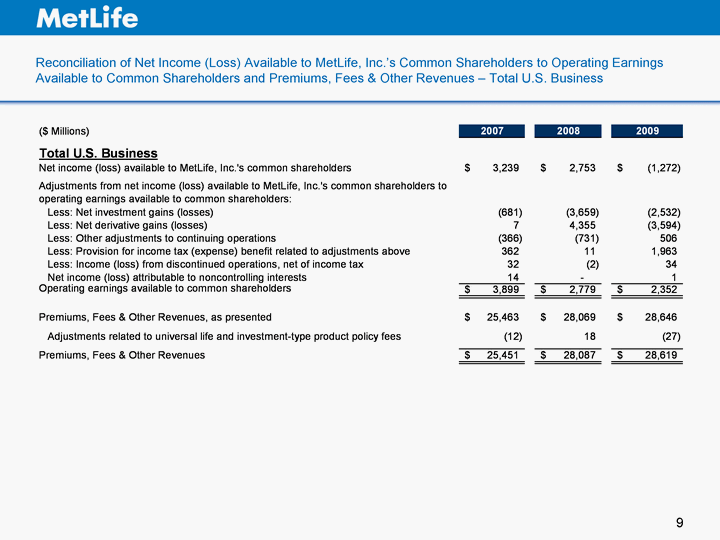
| Reconciliation of Net Income (Loss) Available to MetLife, Inc.'s Common Shareholders to Operating Earnings Available to Common Shareholders and Premiums, Fees & Other Revenues - Total U.S. Business Available to Common Shareholders and Premiums, Fees & Other Revenues - Total U.S. Business Available to Common Shareholders and Premiums, Fees & Other Revenues - Total U.S. Business |
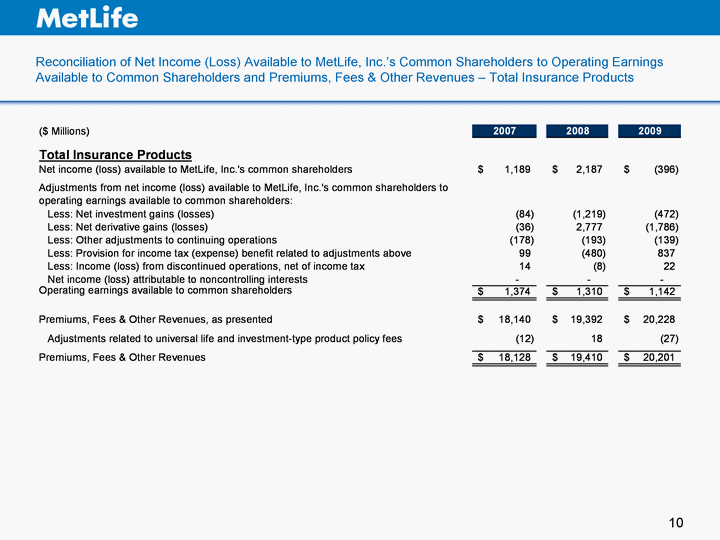
| Reconciliation of Net Income (Loss) Available to MetLife, Inc.'s Common Shareholders to Operating Earnings Available to Common Shareholders and Premiums, Fees & Other Revenues - Total Insurance Products Available to Common Shareholders and Premiums, Fees & Other Revenues - Total Insurance Products Available to Common Shareholders and Premiums, Fees & Other Revenues - Total Insurance Products |
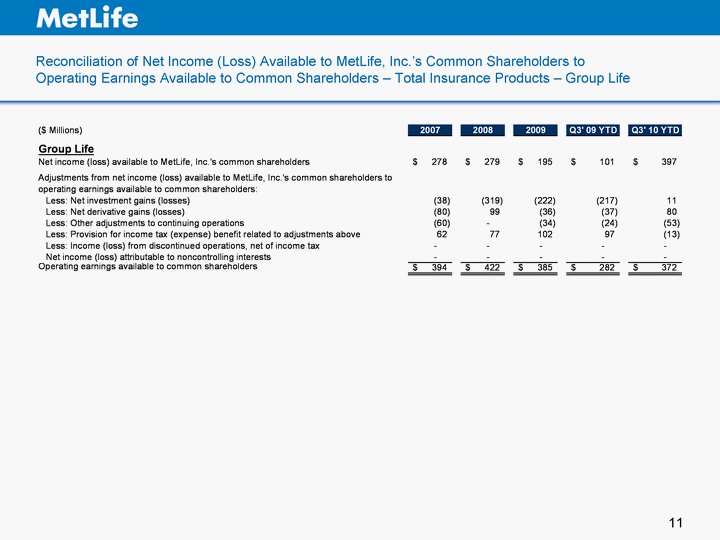
| Reconciliation of Net Income (Loss) Available to MetLife, Inc.'s Common Shareholders to Operating Earnings Available to Common Shareholders - Total Insurance Products - Group Life Operating Earnings Available to Common Shareholders - Total Insurance Products - Group Life Operating Earnings Available to Common Shareholders - Total Insurance Products - Group Life |
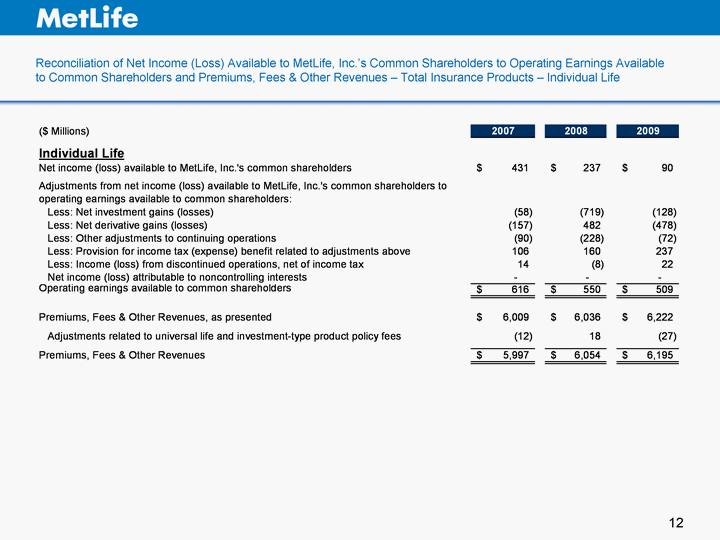
| Reconciliation of Net Income (Loss) Available to MetLife, Inc.'s Common Shareholders to Operating Earnings Available to Common Shareholders and Premiums, Fees & Other Revenues - Total Insurance Products - Individual Life to Common Shareholders and Premiums, Fees & Other Revenues - Total Insurance Products - Individual Life to Common Shareholders and Premiums, Fees & Other Revenues - Total Insurance Products - Individual Life |
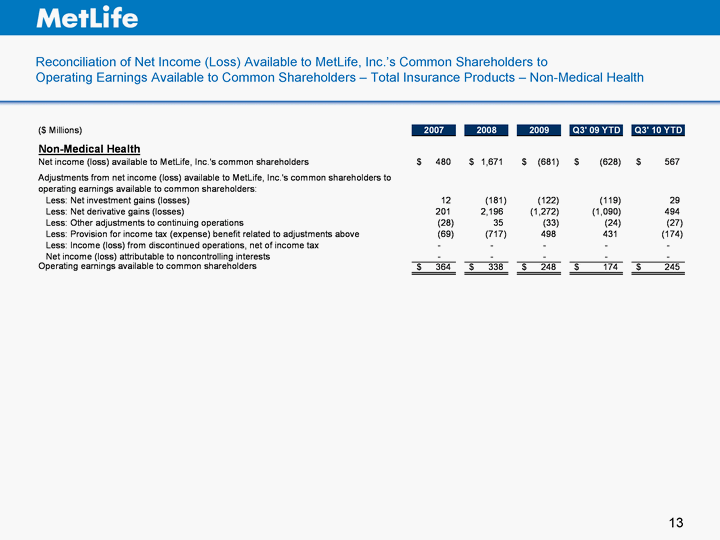
| Reconciliation of Net Income (Loss) Available to MetLife, Inc.'s Common Shareholders to Operating Earnings Available to Common Shareholders - Total Insurance Products - Non-Medical Health Operating Earnings Available to Common Shareholders - Total Insurance Products - Non-Medical Health Operating Earnings Available to Common Shareholders - Total Insurance Products - Non-Medical Health |
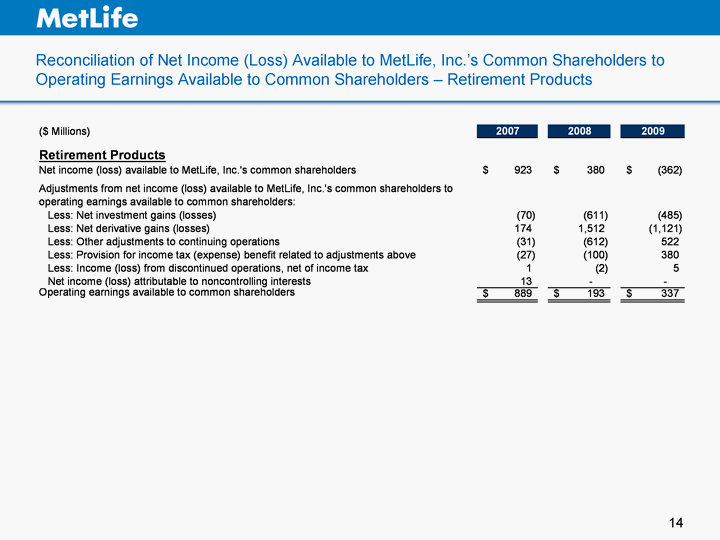
| Reconciliation of Net Income (Loss) Available to MetLife, Inc.'s Common Shareholders to Operating Earnings Available to Common Shareholders - Retirement Products Operating Earnings Available to Common Shareholders - Retirement Products Operating Earnings Available to Common Shareholders - Retirement Products |
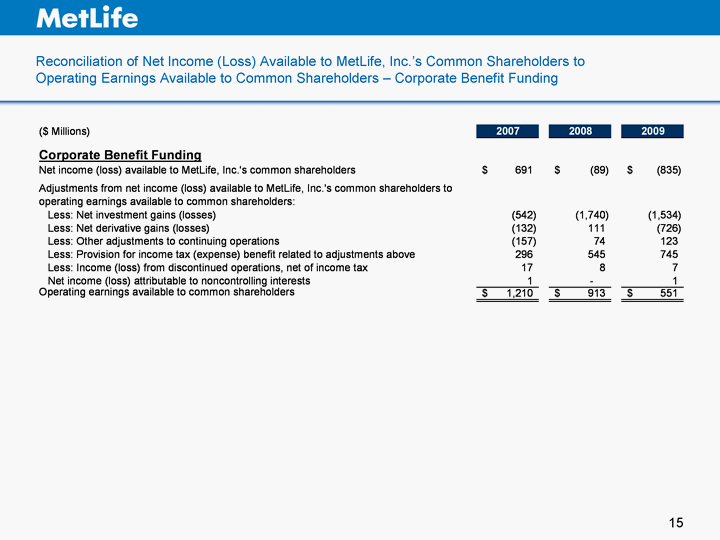
| Reconciliation of Net Income (Loss) Available to MetLife, Inc.'s Common Shareholders to Operating Earnings Available to Common Shareholders - Corporate Benefit Funding Operating Earnings Available to Common Shareholders - Corporate Benefit Funding Operating Earnings Available to Common Shareholders - Corporate Benefit Funding |
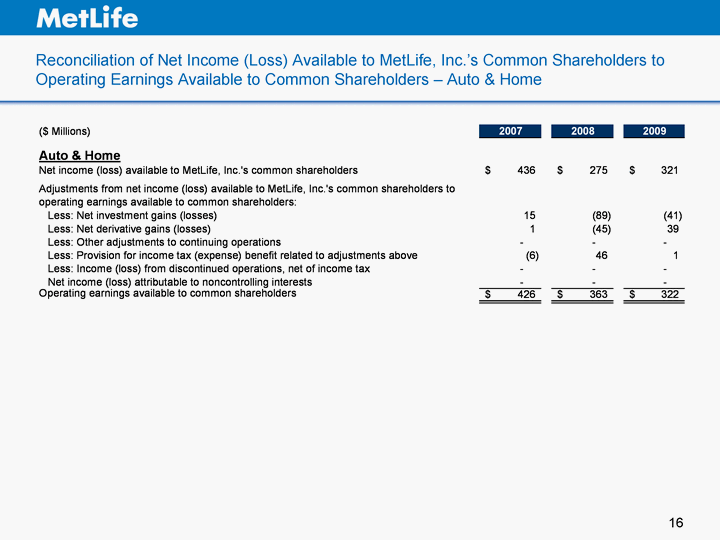
| Reconciliation of Net Income (Loss) Available to MetLife, Inc.'s Common Shareholders to Operating Earnings Available to Common Shareholders - Auto & Home Operating Earnings Available to Common Shareholders - Auto & Home Operating Earnings Available to Common Shareholders - Auto & Home |
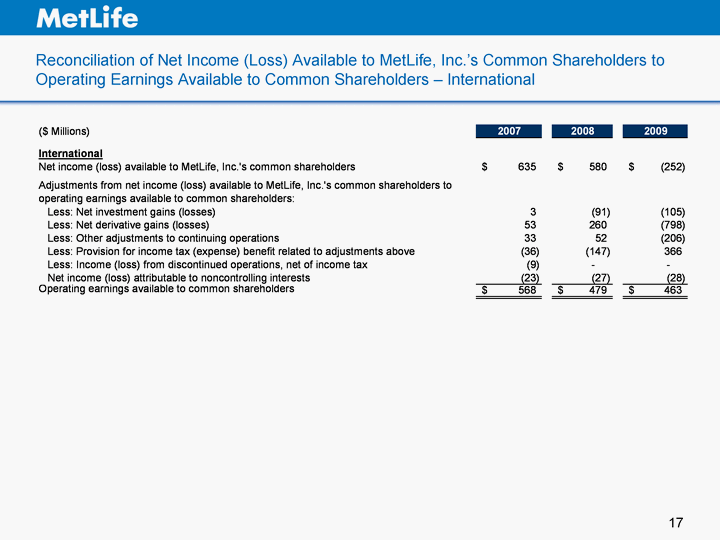
| Reconciliation of Net Income (Loss) Available to MetLife, Inc.'s Common Shareholders to Operating Earnings Available to Common Shareholders - International Operating Earnings Available to Common Shareholders - International Operating Earnings Available to Common Shareholders - International |
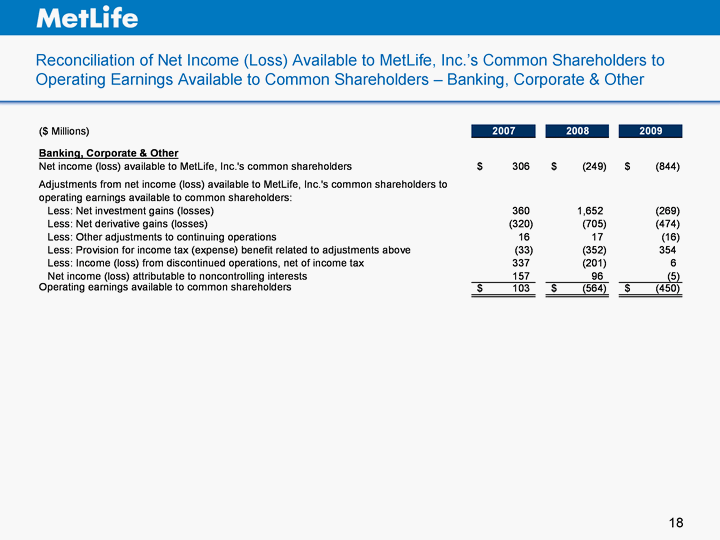
| Reconciliation of Net Income (Loss) Available to MetLife, Inc.'s Common Shareholders to Operating Earnings Available to Common Shareholders - Banking, Corporate & Other Operating Earnings Available to Common Shareholders - Banking, Corporate & Other Operating Earnings Available to Common Shareholders - Banking, Corporate & Other |
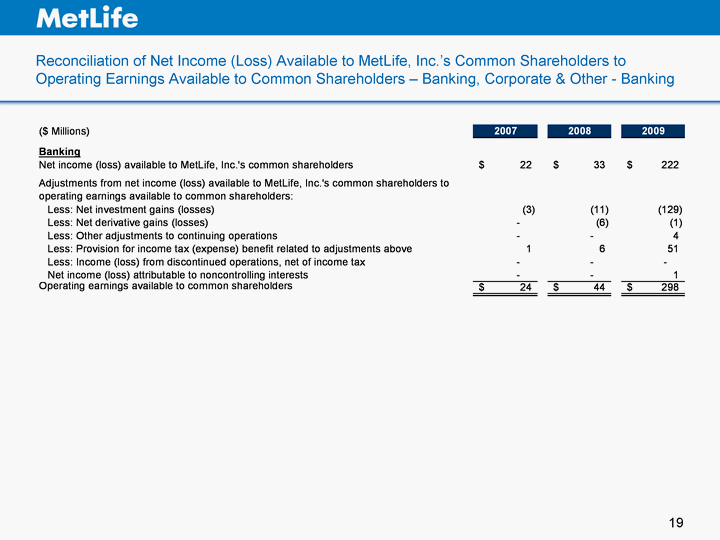
| Reconciliation of Net Income (Loss) Available to MetLife, Inc.'s Common Shareholders to Operating Earnings Available to Common Shareholders - Banking, Corporate & Other - Banking Operating Earnings Available to Common Shareholders - Banking, Corporate & Other - Banking Operating Earnings Available to Common Shareholders - Banking, Corporate & Other - Banking |
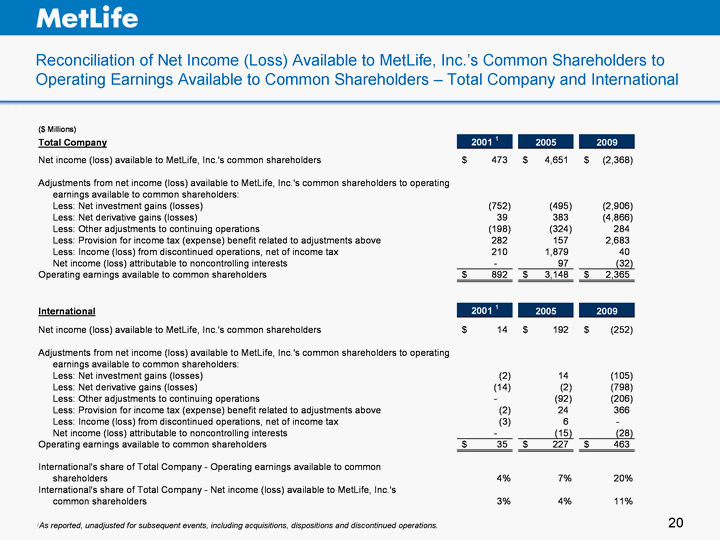
| Reconciliation of Net Income (Loss) Available to MetLife, Inc.'s Common Shareholders to Operating Earnings Available to Common Shareholders - Total Company and International 1As reported, unadjusted for subsequent events, including acquisitions, dispositions and discontinued operations. 1As reported, unadjusted for subsequent events, including acquisitions, dispositions and discontinued operations. |
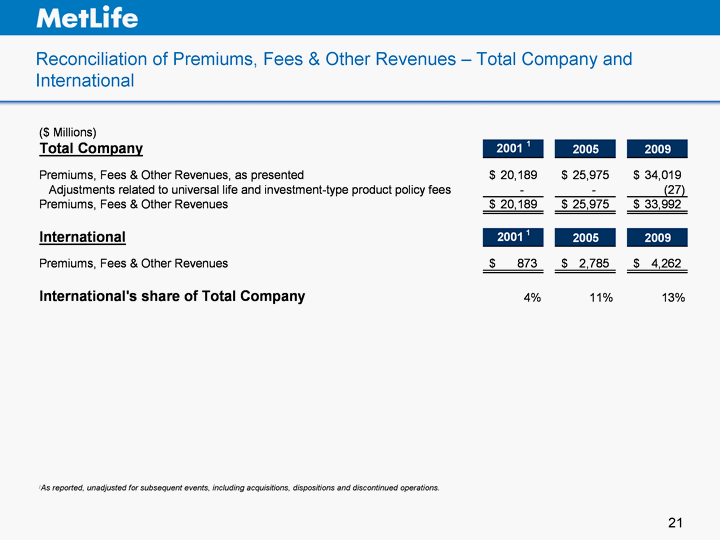
| Reconciliation of Premiums, Fees & Other Revenues - Total Company and International 1As reported, unadjusted for subsequent events, including acquisitions, dispositions and discontinued operations. 1As reported, unadjusted for subsequent events, including acquisitions, dispositions and discontinued operations. |
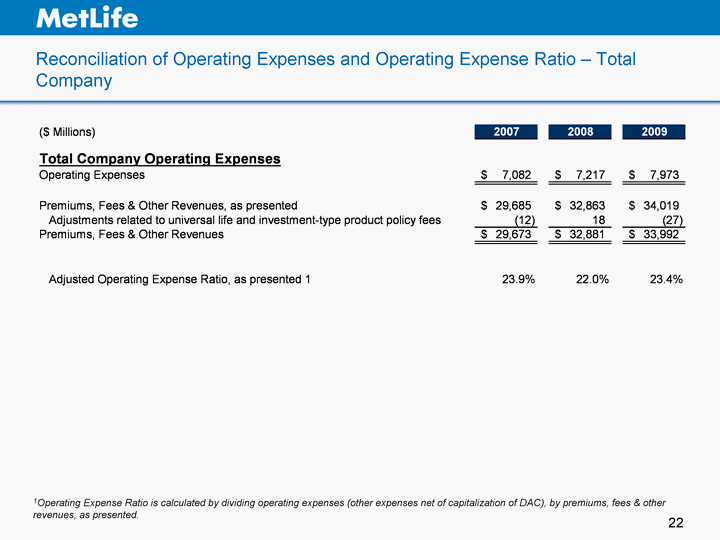
| Reconciliation of Operating Expenses and Operating Expense Ratio - Total Company 1Operating Expense Ratio is calculated by dividing operating expenses (other expenses net of capitalization of DAC), by premiums, fees & other revenues, as presented. revenues, as presented. revenues, as presented. |
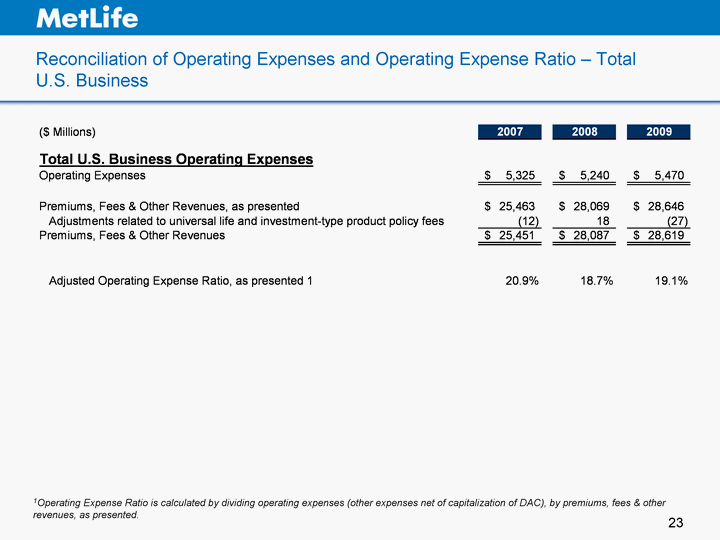
| Reconciliation of Operating Expenses and Operating Expense Ratio - Total U.S. Business 1Operating Expense Ratio is calculated by dividing operating expenses (other expenses net of capitalization of DAC), by premiums, fees & other revenues, as presented. revenues, as presented. revenues, as presented. |
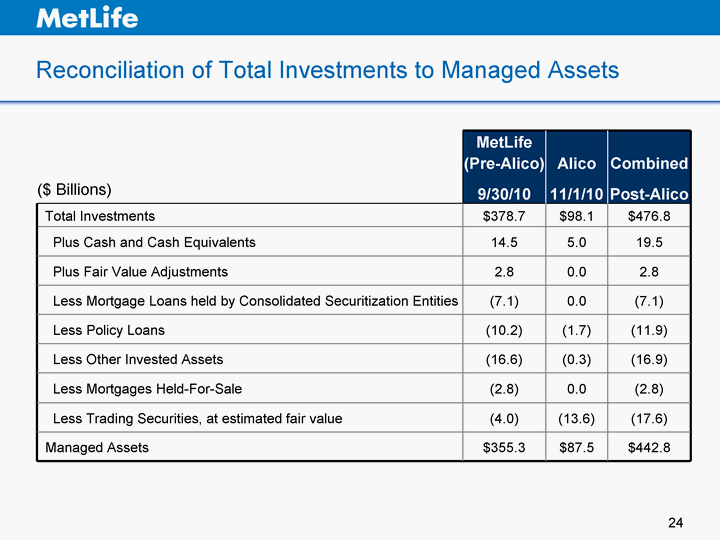
| Reconciliation of Total Investments to Managed Assets MetLife (Pre-Alico) 9/30/10 Alico 11/1/10 Combined Post-Alico ($ Billions) MetLife (Pre-Alico) 9/30/10 Alico 11/1/10 Combined Post-Alico Total Investments $378.7 $98.1 $476.8 Plus Cash and Cash Equivalents 14.5 5.0 19.5 Plus Fair Value Adjustments 2.8 0.0 2.8 Less Mortgage Loans held by Consolidated Securitization Entities (7.1) 0.0 (7.1) Less Policy Loans (10.2) (1.7) (11.9) Less Other Invested Assets (16.6) (0.3) (16.9) Less Mortgages Held-For-Sale (2.8) 0.0 (2.8) Less Trading Securities, at estimated fair value (4.0) (13.6) (17.6) Managed Assets $355.3 $87.5 $442.8 |
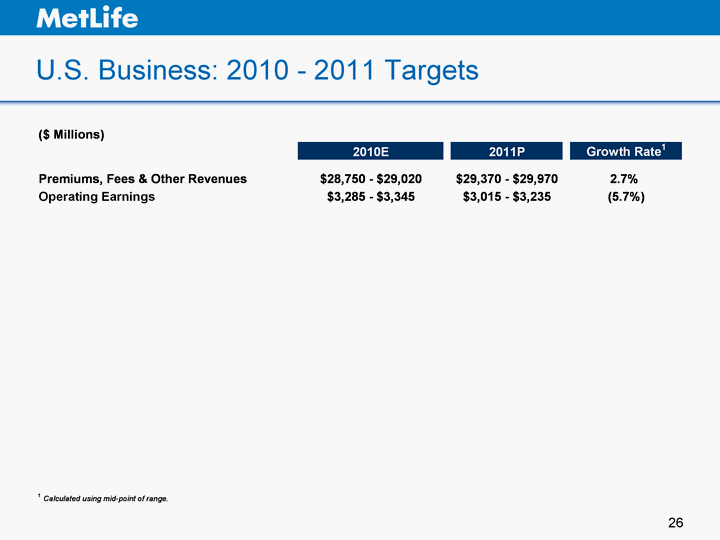
| U.S. Business: 2010 - 2011 Targets U.S. Business: 2010 - 2011 Targets |
| Insurance Products Metrics |
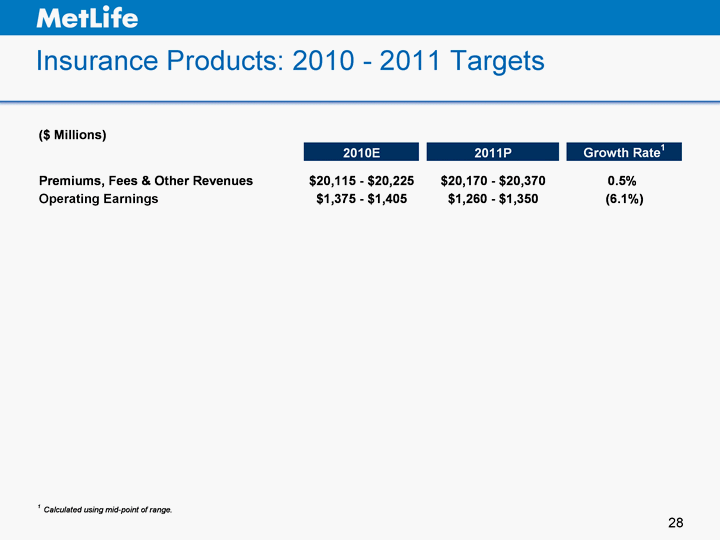
| Insurance Products: 2010 - 2011 Targets Insurance Products: 2010 - 2011 Targets |
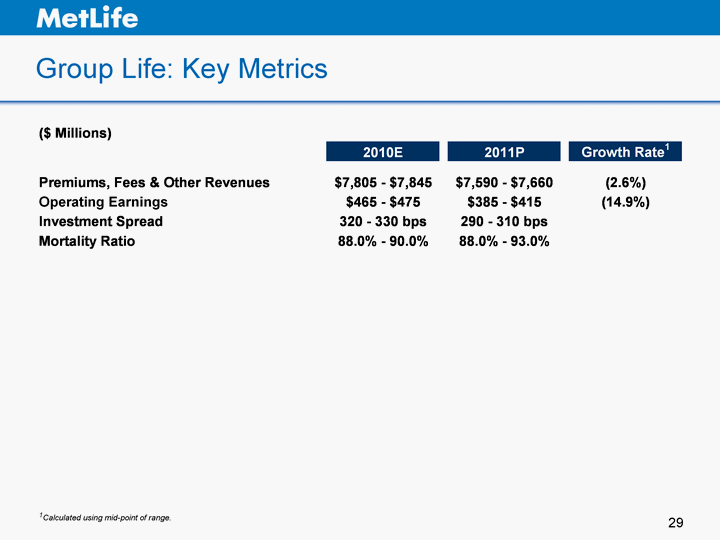
| Group Life: Key Metrics Group Life: Key Metrics 1Calculated using mid-point of range. |
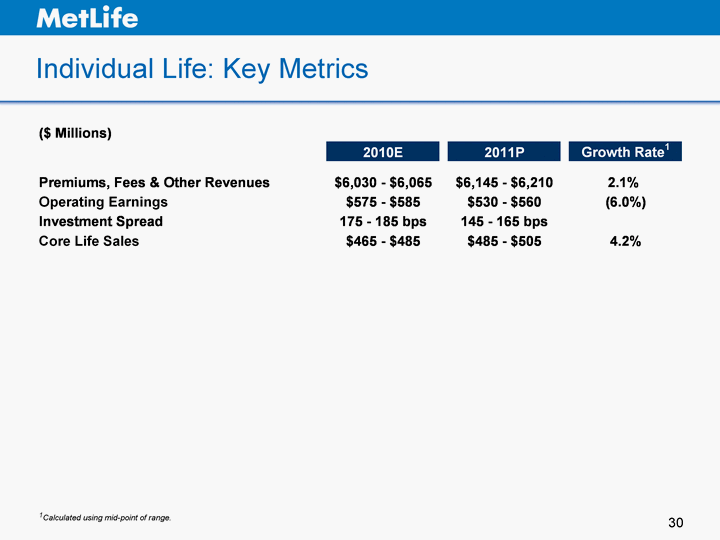
| Individual Life: Key Metrics Individual Life: Key Metrics 1Calculated using mid-point of range. |
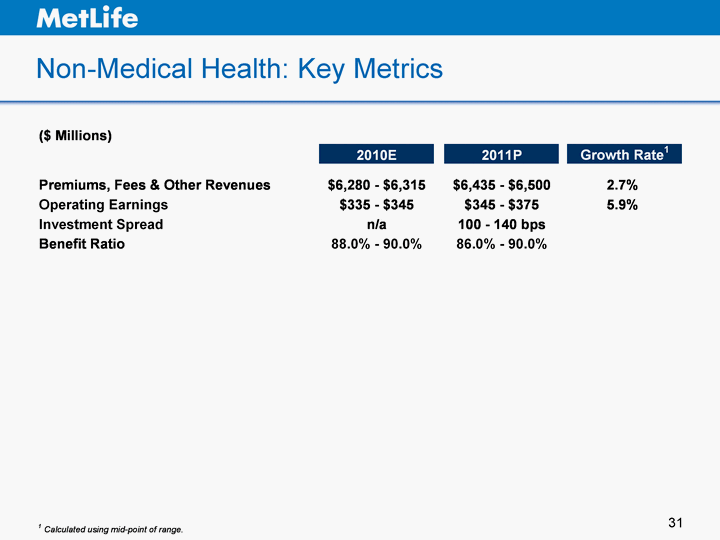
| Non-Medical Health: Key Metrics Non-Medical Health: Key Metrics |
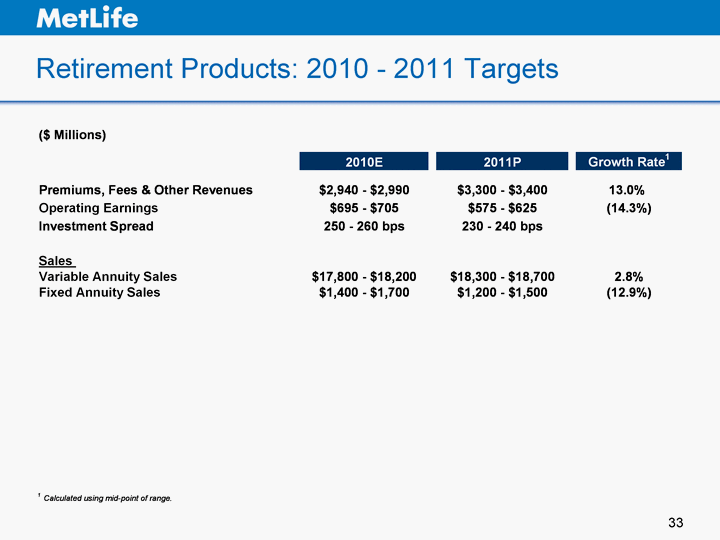
| Retirement Products: 2010 - 2011 Targets Retirement Products: 2010 - 2011 Targets |
| Corporate Benefit Funding |
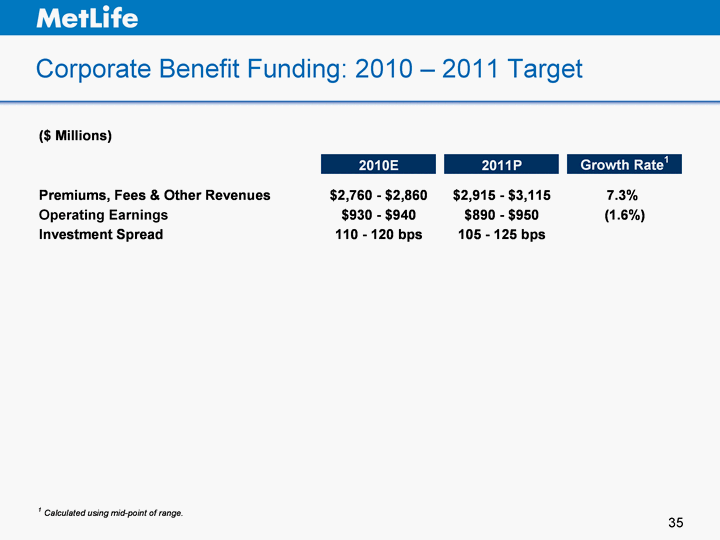
| Corporate Benefit Funding: 2010 - 2011 Target Corporate Benefit Funding: 2010 - 2011 Target |
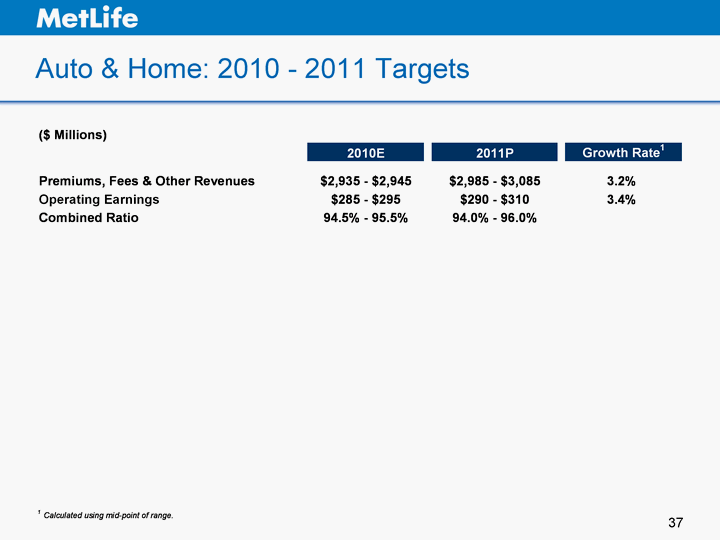
| Auto & Home: 2010 - 2011 Targets Auto & Home: 2010 - 2011 Targets |
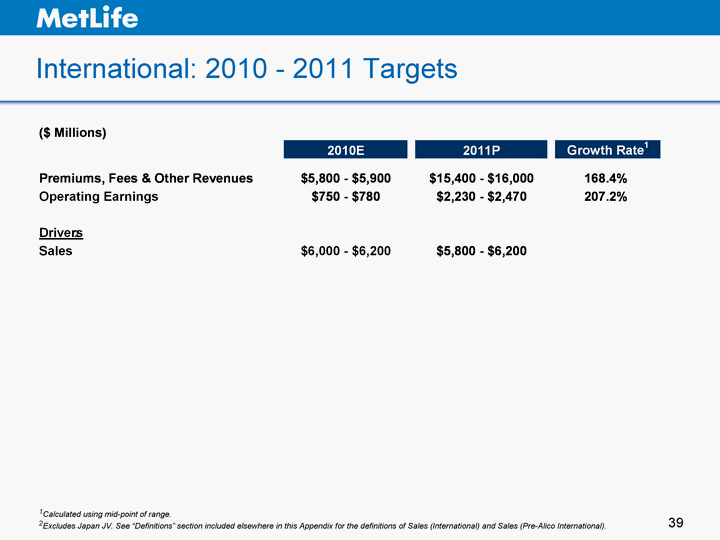
| International: 2010 - 2011 Targets International: 2010 - 2011 Targets 2 1Calculated using mid-point of range. 2Excludes Japan JV. See "Definitions" section included elsewhere in this Appendix for the definitions of Sales (International) and Sales (Pre-Alico International). |
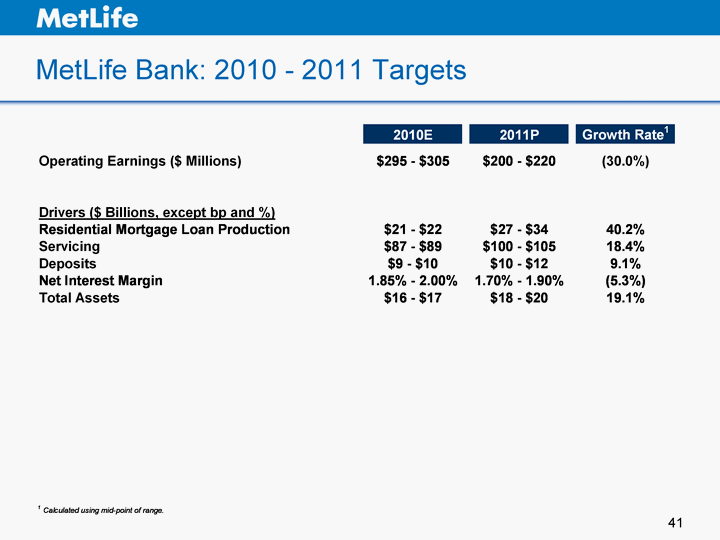
| MetLife Bank: 2010 - 2011 Targets MetLife Bank: 2010 - 2011 Targets |
Gwenn L. Carr
Executive Vice President, Office of the Chairman
MetLife, Inc.
Gwenn L. Carr is executive vice president, Office of the Chairman, for MetLife, Inc. In addition to serving as chief of staff for MetLife’s chairman and CEO, C. Robert Henrikson, Carr is responsible for the shareholder services, corporate communications, executive services and corporate contributions organizations. She also is chairman of the board of MetLife Foundation.
In addition to providing counsel to MetLife’s CEO, Carr also has worked closely with MetLife’s board of directors over the course of her more than 10 year tenure at MetLife to provide counsel and direction on a number of strategic, corporate governance and communications initiatives. She also is the executive sponsor of MetLife’s issues management council, a cross-functional team of senior-level MetLife managers that identifies potential reputation risks and the effectiveness of controls to mitigate their impact on the company. Carr joined MetLife as corporate secretary in 1999, a position she held until 2009 when she became a member of MetLife’s executive group and assumed additional responsibilities. She was named chief of staff in 2007.
Prior to joining MetLife, Carr served as vice president, secretary and associate general counsel of ITT Corporation. She joined ITT in 1988 as senior counsel, corporate development, providing legal advice with respect to ITT’s corporate acquisitions, divestures and mergers before being elected vice president and secretary of ITT in 1990.
Carr also has been a member of the law departments of AT&T and American Natural Resources Company. At both companies, in addition to providing legal advice with respect to corporate governance matters, Carr was responsible for providing counsel on corporate finance transactions, acquisitions, divestitures and strategic alliances, as well as compliance with federal securities laws. She also served as vice president and secretary of American Natural. Earlier in her career, she served as an assistant United States attorney for the Eastern District of Michigan.
Carr is a former director of the Lawyers Alliance for New York, a member of the Advisory Board of the Corporate Governance Institute at the University of Delaware and a former member of the IRRC Advisory Board. Carr has spoken frequently about corporate governance issues at seminars and conferences and has been a guest lecturer at Pace University Law School. Carr is a former chairman of the American Society of Corporate Secretaries, a former chairman of the Investor Responsibility Research Center and a former president of the Stockholder Relations Society of New York. She also previously was a director of the YWCA of the City of New York and the United Way of New York City. Carr is a graduate of Michigan State University and the MSU College of Law.
# # #
Kathleen A. Henkel
Executive Vice President, Human Resources
MetLife, Inc.
Kathleen A. Henkel is executive vice president, human resources for MetLife, Inc. She was named head of human resources in July 2008, appointed executive vice president in March 2010 and is responsible for the global human resources operations of the company, which has more than 60,000 associates worldwide.
Previously, Henkel was a senior vice president in MetLife’s Institutional Business from 2005 to 2008. In this role, she had profit and loss responsibility for the development, management and servicing of the following individual and group products: long-term care insurance, critical illness insurance, 401(k) and income annuities. She also had oversight of Hyatt Legal Plans, a MetLife company and the nation’s largest provider of group legal plans, as well as MetLife’s former subsidiary, Texas Life Insurance Company.
In 2005, Henkel led the successful integration of Travelers Life & Annuity and certain international insurance businesses, which MetLife acquired from Citigroup Inc. She also oversaw the negotiation of the 2006 sale of MetLife’s 401(k) business to Great West Life and Annuity.
Henkel has spent her entire career at MetLife. She joined the company in 1966 as a clerk in the actuarial division of the group department and, since then, has held a number of leadership roles. From 1999 through 2004, Henkel served as the vice president in charge of MetLife’s retirement & savings operations. Prior to that, she was, from 1992 to 1999, the vice president in charge of human resources and strategic planning for MetLife’s pension business. In a previous role, Henkel assisted in the successful merger of MetLife’s group, pension, small market and worksite marketing segments into what subsequently became MetLife’s Institutional Business segment. She also oversaw MetLife’s defined benefit operations.
Henkel is a board member of MetLife Global Operations Support Center Private Limited and MetLife Services East Private Limited. Previously, she served as the CEO and chairman of the board of Benefit Service Corporation, a former subsidiary of MetLife. She also has previously served as a board member of SPARK, the American Benefits Council and Long Term Care Partners, LLC. Henkel is a FINRA registered principal and a FLMA.
# # #
C. Robert (Rob) Henrikson
Chairman, President & Chief Executive Officer
MetLife, Inc.
C. Robert (Rob) Henrikson is chairman of the board, president and chief executive officer of MetLife, Inc. (NYSE: MET), a leading provider of insurance, annuities and employee benefit programs to 90 million customers worldwide.
Since becoming chairman and CEO in 2006, Henrikson has led MetLife to achieve record financial results, positioned the company to expand its leadership positions, and capitalized on emerging life, annuity and retirement markets around the globe. In November 2010, MetLife completed its acquisition of Alico. The transaction was the largest in MetLife’s history and affirmed the company’s position as an insurance and employee benefits powerhouse by expanding its presence to more than 60 countries. Today, MetLife counts over 90 of the top one hundred FORTUNE 500® companies among its corporate clients and is the largest life insurer in the U.S. and Mexico. MetLife also holds leading market positions in Japan, Latin America, Asia Pacific, Europe and the Middle East. For 2009, MetLife had $49.1 billion in operating revenue and ranked 51st on the FORTUNE 500®. MetLife was named byForbesas the best managed insurance company in the U.S. for 2008.
In July 2010, Henrikson was appointed by President Barack Obama to the President’s Export Council, the principal national advisory committee on international trade. He is the former chairman of the Financial Services Forum, immediate past chairman of the American Council of Life Insurers and currently serves on the boards of both organizations. Henrikson is also a board member of The New York Botanical Garden, the New York Philharmonic, the Partnership for New York City, and is a trustee of the American Museum of Natural History. He is a board member emeritus of the American Benefits Council.
Henrikson received a B.A. from the University of Pennsylvania and a J.D. from Emory University School of Law. His dedication to both institutions continues, serving as chairman of the board of Wharton’s S.S. Huebner Foundation for Insurance Education and as a trustee of Emory University.
He resides in Connecticut with his wife of more than 30 years, Mary. They have two sons and two grandsons.
# # #
Steven A. Kandarian
Executive Vice President & Chief Investment Officer
MetLife, Inc.
Steven A. Kandarian is executive vice president and chief investment officer of MetLife, Inc. He joined the company in April 2005. As CIO, Kandarian is responsible for MetLife’s investment department and the company’s more than $400 billion general account portfolio.
Since joining MetLife, Kandarian has overseen a number of initiatives and strategies that have benefited MetLife’s investment portfolio and contributed to MetLife’s bottom line. He has enhanced the company’s focus on effective risk management and diversified its investment portfolio, in part through the $5.4 billion sale of Peter Cooper Village/Stuyvesant Town in 2006. Under Kandarian’s leadership, MetLife identified the housing bubble early and reduced its exposure to sub-prime mortgage-backed securities, raised the overall quality of its corporate credit portfolio and increased its focus on low loan-to-value commercial and agricultural mortgages. In 2009, Kandarian assumed responsibility for MetLife’s Global Brand and Marketing Services department. He also is overseeing MetLife’s enterprise-wide corporate strategy work.
Prior to joining MetLife, Kandarian was the executive director of the Pension Benefit Guaranty Corporation (PBGC) from 2001 to 2004. He made the public case for comprehensive reform of the pension funding rules to put the defined benefit system and the PBGC on a sound financial footing. In addition, under Kandarian’s leadership, the PBGC adopted a new investment policy ensuring that, going forward, its assets be structured to better match liability durations.
Before joining the PBGC, Kandarian was founder and managing partner of Orion Partners, LP. From 1990 to 1993, he served as president and founder of Eagle Capital Holdings, where he formed a private merchant bank to sponsor equity investments in small and mid-sized businesses. From 1984 to 1990, he was managing director of Lee Capital Holdings, a private equity firm based in Boston. Kandarian began his career as an investment banker with Houston-based Rotan Mosle, Inc.
Kandarian is a member of the board of directors of MetLife Bank. He also is a member of the Economic Club of New York and is an advisory board member of the Center for Retirement Research at Boston College. He previously served as a member of the board of trustees for MassMutual Corporate Investors, MassMutual Participation Investors and MassMutual Premier Funds. He received a B.A. from Clark University, a J.D. from Georgetown University Law Center, and a M.B.A. from Harvard Business School.
# # #
Nicholas D. Latrenta
Executive Vice President & General Counsel
MetLife, Inc.
Nicholas D. Latrenta is executive vice president and general counsel for MetLife, Inc. He was appointed to this position in May 2010. In addition to leading the company’s global legal operations, he also oversees MetLife’s corporate secretary’s office, government and industry relations department and the corporate ethics and compliance group.
Prior to becoming general counsel, Latrenta served as senior chief counsel for MetLife’s insurance group and had oversight of legal matters for MetLife’s U.S. Business and International operations. Previously, he had served as chief counsel for MetLife’s Institutional Business, ERISA and product tax legal group.
From October 2000 through June 2004, he was senior vice president, Institutional Business. In this role, he was responsible for the management, product development initiatives and positioning of MetLife’s group life, disability, dental, long-term care and legal plans businesses and related marketing, planning, and business development activities. In 1999, Latrenta headed MetLife’s International operations with responsibility for insurance operations in 11 countries outside of the U.S.
Prior to leading MetLife’s international operations, Latrenta held several leadership roles in Institutional Business, including the company’s Small Business Center, defined contribution group, structured settlement annuity business and certain other payout annuity businesses. He was promoted to senior vice president in 1997 after serving as a vice president in the business development and compliance unit of Institutional Business beginning in 1996. Prior to this role, he oversaw a segment of MetLife’s retirement & savings business from 1993 to 1996.
In 1991, Latrenta was appointed vice president and secretary of the company after previously serving in key roles in MetLife’s Strategic Research Group, which was responsible for researching and making recommendations on issues of strategic importance to the company, and the company’s International operations. Latrenta also served as a vice president in the actuarial department and held several positions in MetLife’s law department. He joined MetLife in 1969.
Latrenta received a B.B.A. degree, summa cum laude, in business administration from the College of Insurance in 1974 and a J.D. degree, cum laude, from Seton Hall Law School in 1979. He is a fellow of the Life Management Institute (FLMI), a chartered life underwriter (CLU) and is admitted to practice law in both New York and New Jersey.
# # #
Maria R. Morris
Executive Vice President,
Technology & Operations
MetLife, Inc.
Maria R. Morris is executive vice president and head of MetLife’s global Technology & Operations organization. She was appointed to this position in January 2008. In this role, Morris oversees MetLife’s information technology group, the customer sales and service group, global capability sourcing, global procurement, corporate real estate, internal audit and business and operations management. She is accountable for a $1.5 billion IT portfolio and oversees over $2.5 billion in procurable and real estate occupancy spend for MetLife.
Under Morris’ stewardship, Technology & Operations has been a strong contributor to MetLife’s Operational Excellence initiative and has increased capacity and operational capabilities for the enterprise. Her organization is responsible for managing aspects of the integration of the Alico acquisition — including governance, program management, the replatforming of technology applications and infrastructure and expense synergies.
In her career, Morris has successfully led and transformed large organizations to grow businesses and expand profitability. She previously served as executive vice president, employee benefits sales and had oversight of the group insurance and retirement and savings sales forces. Under Morris’s leadership, the business achieved record sales and drove strong revenue and earnings growth.
Beginning in 2003, Morris served as senior vice president of group insurance and voluntary benefits sales and service operations. She also led the individual disability business. As the vice president of MetLife’s group disability business from 2000 to 2003, Morris had profit and loss responsibility overseeing product development and management as well as claims operations. From 1996 to 2000, Morris had similar responsibilities for MetLife’s dental product and also managed the preferred dentist network. Under her leadership, both revenue and profitability grew and an efficient claims model was implemented. Morris joined MetLife in 1984.
Morris serves as a member of the board of directors for MetLife Global Operations Support Center Private Limited, MetLife Securities, Inc., MetLife Property and Casualty and MetLife Foundation. She serves as chairman of the board of directors for INROADS, Inc. and also serves on the board of the All Stars Project, Inc. Morris is a selected member of the YWCA Academy of Women Achievers. In 2005, she was recognized byProfiles in Diversity Journalmagazine as one of a number of “Women to Watch.” She holds a B.A. from Franklin and Marshall College, magna cum laude, where she was elected to Phi Beta Kappa.
# # #
William J. Mullaney
President, U.S. Business
MetLife, Inc.
William J. Mullaney is president, U.S. Business, for MetLife, Inc. Mullaney — who was named to this position in August 2009 — oversees all of MetLife’s insurance, retirement and corporate benefit funding businesses in the United States.
MetLife is a leading provider of life insurance, annuities, dental and disability insurance as well as retirement and savings products. The U.S. Business serves over 60,000 group customers, including over 90 of the top one hundred FORTUNE 500® companies, and provides protection and retirement solutions to millions of individuals. In 2009, U.S. Business — which consists of Insurance Products, Retirement Products, Corporate Benefit Funding and Auto & Home — had $42.1 billion in operating revenues.
From January 2007 through July 2009, Mullaney was president, Institutional Business, which provided insurance and retirement benefits to employers of all sizes in the United States. During his first year as the head of Institutional Business, Mullaney oversaw the achievement of record top- and bottom-line results. At the end of 2008, according to LIMRA, MetLife continued to hold the number one position in many group insurance markets, including group life, group dental, institutional annuities and group disability.
Previously, Mullaney served as the president of Auto & Home, MetLife’s personal lines property & casualty subsidiary that insures nearly 4 million autos and homes nationwide. Under his leadership, Auto & Home delivered record operating earnings despite some of the worst hurricanes in U.S. history. At the same time, the company distinguished itself for its quick and compassionate response to customers affected by these natural disasters. From 2002 through 2004, Mullaney served as senior vice president for claims and customer service at Auto & Home, where he oversaw claims, business operations and customer service. From 1998 to 2002, he was responsible for MetLife’s voluntary benefits business. He joined MetLife in 1982.
Mullaney serves as a member of the board of directors for MetLife Auto & Home, MetLife Europe Limited, MetLife Bank and MetLife Foundation. He also was the chairman of the New York Blood Center’s Volunteer Leadership Campaign from 2007 to 2009. In 2007, 2008 and 2009, Mullaney was named toIrish America Magazine’s“Business 100,” recognizing the top 100 Irish-American business leaders in the United States. He received a B.A. from the University of Pittsburgh, his M.B.A. from Pace University and a chartered life underwriter designation from The American College.
# # #
Conor Murphy
Vice President, Investor Relations
MetLife
Conor Murphy is vice president and head of investor relations for MetLife. He was appointed to this position in November 2007.
In this role, Murphy manages and coordinates the presentation of MetLife’s financial results, messages and strategies to the analyst and investor community.
Before being named to his current position, Murphy was vice president and chief financial officer for MetLife’s investments department since July 2002. His various responsibilities included financial reporting and analysis, investment income projections, performance measurement and attribution, portfolio valuation and the Sarbanes-Oxley processes for investments.
Prior to joining the investments department, Murphy served in MetLife’s internal audit department, where he was responsible for various groups, including investments and investment affiliate auditing operations. Affiliate operations included investment advisor, mutual fund, broker-dealer and trust company subsidiaries. He was also responsible for the Reinsurance Group of America, Incorporated (RGA) audit functions. MetLife, Inc. was the beneficial owner of approximately 52% of RGA’s outstanding shares before divesting its majority stake in the company in September 2008.
Murphy joined MetLife in October 2000 after seven years with PricewaterhouseCoopers LLP, where he served in the New York Financial Services Industry Practice. Prior to PricewaterhouseCoopers, he spent five years with Grant Thornton LLP in Dublin, Ireland.
Murphy is a founding trustee of Cristo Rey New York High School and a past president of the Association of Chartered Accountants in the United States. In 2008, 2009 and 2010, Murphy was among a select group of 50 Irish-American business leaders honored at the annual “Wall Street 50” awards.
He is a certified public accountant and a member of the Massachusetts Society of CPAs. Murphy is also a chartered accountant and a fellow of the Institute of Chartered Accountants in Ireland.
# # #
William J. Toppeta
President, International
MetLife, Inc.
William J. Toppeta is president, International, for MetLife, Inc. He was named to this position in July 2001 and is responsible for all of the company’s insurance and employee benefits businesses outside the United States.
Toppeta is leading the integration of the largest acquisition in MetLife’s history, combining the international organization of MetLife and Alico. With the acquisition of Alico, MetLife now holds leading market positions in Japan, Latin America, Asia Pacific, Europe and the Middle East. MetLife’s international network now comprises more than 60 countries and the company serves some 90 million customers.
Since Toppeta was named president, International’s operating revenues have grown from $1.2 billion in 2001 to $4.9 billion in the first nine months of 2010. He has focused MetLife’s International business on growth — both organically and through acquisitions. He was the principal architect of MetLife’s acquisition and integration of Aseguradora Hidalgo S.A. in Mexico, where MetLife is now the largest life insurer. Toppeta led the international integration of MetLife’s 2005 acquisition of substantially all of Citigroup Inc.’s international insurance businesses significantly expanding the company’s presence outside the U.S. Under his leadership, MetLife has grown its operations in Korea, Chile, Brazil, India and China.
Prior to assuming his role leading International, Toppeta served as MetLife’s president of client services and chief administrative officer from 1999 to 2001. Prior to this position, he oversaw MetLife’s Individual Business segment after having led the U.S. career agency sales force for three years. In 1995, he was named senior vice president to lead MetLife’s corporate reengineering department.
After being named vice president and deputy general manager of MetLife’s Canadian operations in 1992, he became president and CEO of Metropolitan Life’s Canadian operations in 1993. Early in his career, Toppeta served as executive assistant to former CEO Richard R. Shinn. He began his career at MetLife in 1973 as an attorney in the law department.
Toppeta is chairman of the Coalition of Services Industries, chairman of the International Committee of the American Council of Life Insurers and a member of the Executive Committee of the U.S. — Korea Business Council. He also serves on the boards of directors of the Council of the Americas and of the Korea Society. He is a director of the MetLife Foundation and several MetLife subsidiaries. Toppeta serves as a member of the Executive Committee of the Fordham University President’s Council. He holds a B.A. from Fordham College as well as a J.D. and a L.L.M from New York University’s School of Law.
# # #
William J. Wheeler
Executive Vice President & Chief Financial Officer
MetLife, Inc.
William J. Wheeler is executive vice president and chief financial officer of MetLife, Inc. He was named to this position in December 2003.
As chief financial officer, Wheeler is responsible for overseeing all financial management matters for MetLife, including financial reporting, treasury, corporate actuarial, risk management, tax, investor relations and mergers and acquisitions. Wheeler is also the executive officer responsible for MetLife Bank, which offers retail banking products, including money market accounts, certificates of deposit, residential mortgages and reverse mortgages.
Most recently, Wheeler was a key architect of MetLife’s acquisition of Alico, the largest transaction in MetLife’s history. He also has led several other strategic transactions, including the company’s tax-free split-off of its majority stake in Reinsurance Group of America, Incorporated in 2008 and the acquisition of Travelers Life & Annuity and related international insurance businesses from Citigroup Inc. in 2005. Wheeler oversaw a number of capital management strategies and related transactions that enhanced MetLife’s financial strength and increased its liquidity at a time of severe capital market constraints, while simultaneously achieving significant annualized expense savings and implementing a number of risk management initiatives.
Prior to becoming CFO, Wheeler oversaw business development, product management and marketing activities for the company’s Individual Business segment and also served as chief financial officer of Institutional Business, overseeing financial reporting and planning, as well as expense management for that segment. Wheeler joined MetLife in 1997 as treasurer and played a key role in preparing MetLife to become a public company. He oversaw certain aspects of the demutualization, the development of the investor relations and shareholder services organizations, and management of the initial public offering process.
Before joining MetLife, Wheeler was an investment banker for ten years at Donaldson, Lufkin & Jenrette (DLJ). During his career at DLJ, he managed a variety of transactions, including equity and debt financings, mergers and acquisitions, leveraged buyouts, financial advisory and restructurings in a number of different industries, including the insurance industry.
Wheeler is a member of Wabash College’s board of trustees. He holds an M.B.A. from Harvard Business School and also received an A.B., magna cum laude, from Wabash College and was elected to Phi Beta Kappa.
# # #


