 Eric Steigerwalt Executive Vice President & Interim Chief Financial Officer March 23, 2012 Exhibit 99.1 |
 Safe Harbor These materials may contain or incorporate by reference information that includes or is based upon forward-looking statements within the meaning of the Private Securities Litigation Reform Act of 1995. Forward-looking statements give expectations or forecasts of future events. These statements can be identified by the fact that they do not relate strictly to historical or current facts. They use words such as “anticipate,” “estimate,” “expect,” “project,” “intend,” “plan,” “believe” and other words and terms of similar meaning in connection with a discussion of future operating or financial performance. In particular, these include statements relating to future actions, prospective services or products, future performance or results of current and anticipated services or products, sales efforts, expenses, the outcome of contingencies such as legal proceedings, trends in operations and financial results. Any or all forward-looking statements may turn out to be wrong. They can be affected by inaccurate assumptions or by known or unknown risks and uncertainties. Many such factors will be important in determining the actual future results of MetLife, Inc., its subsidiaries and affiliates. These statements are based on current expectations and the current economic environment. They involve a number of risks and uncertainties that are difficult to predict. These statements are not guarantees of future performance. Actual results could differ materially from those expressed or implied in the forward-looking statements. Risks, uncertainties, and other factors that might cause such differences include the risks, uncertainties and other factors identified in MetLife, Inc.’s filings with the U.S. Securities and Exchange Commission (the “SEC”). These factors include: (1) difficult conditions in the global capital markets; (2) concerns over U.S. fiscal policy and the trajectory of the national debt of the U.S., as well as rating agency downgrades of U.S. Treasury securities; (3) uncertainty about the effectiveness of governmental and regulatory actions to stabilize the financial system, the imposition of fees relating thereto, or the promulgation of additional regulations; (4) increased volatility and disruption of the capital and credit markets, which may affect our ability to seek financing or access our credit facilities; (5) impact of comprehensive financial services regulation reform on us; (6) economic, political, legal, currency and other risks relating to our international operations, including with respect to fluctuations of exchange rates; (7) exposure to financial and capital market risk, including as a result of the disruption in Europe and possible withdrawal of one or more countries from the Euro zone; (8) changes in general economic conditions, including the performance of financial markets and interest rates, which may affect our ability to raise capital, generate fee income and market-related revenue and finance statutory reserve requirements and may require us to pledge collateral or make payments related to declines in value of specified assets; (9) potential liquidity and other risks resulting from our participation in a securities lending program and other transactions; (10) investment losses and defaults, and changes to investment valuations; (11) impairments of goodwill and realized losses or market value impairments to illiquid assets; (12) defaults on our mortgage loans; (13) the defaults or deteriorating credit of other financial institutions that could adversely affect us; (14) our ability to address unforeseen liabilities, asset impairments, or rating actions arising from acquisitions or dispositions, including our acquisition of American Life Insurance Company and Delaware American Life Insurance Company (collectively, “ALICO”) and to successfully integrate and manage the growth of acquired businesses with minimal disruption; (15) uncertainty with respect to the outcome of the closing agreement entered into with the United States Internal Revenue Service in connection with the acquisition of ALICO; (16) the dilutive impact on our stockholders resulting from the settlement of common equity units issued in connection with the acquisition of ALICO or otherwise; (17) MetLife, Inc.’s primary reliance, as a holding company, on dividends from its subsidiaries to meet debt payment obligations and the applicable regulatory restrictions on the ability of the subsidiaries to pay such dividends; (18) downgrades in our claims paying ability, financial strength or credit ratings; (19) ineffectiveness of risk management policies and procedures; (20) availability and effectiveness of reinsurance or indemnification arrangements, as well as default or failure of counterparties to perform; (21) discrepancies between actual claims experience and assumptions used in setting prices for our products and establishing the liabilities for our obligations for future policy benefits and claims; (22) catastrophe losses; (23) heightened competition, including with respect to pricing, entry of new competitors, consolidation of distributors, the development of new products by new and existing competitors, distribution of amounts available under U.S. government programs, and for personnel; (24) unanticipated changes in industry trends; (25) changes in assumptions related to investment valuations, deferred policy acquisition costs, deferred sales inducements, value of business acquired or goodwill; (26) changes in accounting standards, practices and/or policies; (27) increased expenses relating to pension and postretirement benefit plans, as well as health care and other employee benefits; (28) exposure to losses related to variable annuity guarantee benefits, including from significant and sustained downturns or extreme volatility in equity markets, reduced interest rates, unanticipated policyholder behavior, mortality or longevity, and the adjustment for nonperformance risk; (29) deterioration in the experience of the “closed block” established in connection with the reorganization of Metropolitan Life Insurance Company; (30) adverse results or other consequences from litigation, arbitration or regulatory investigations; (31) inability to protect our intellectual property rights or claims of infringement of the intellectual property rights of others; (32) discrepancies between actual experience and assumptions used in establishing liabilities related to other contingencies or obligations; (33) regulatory, legislative or tax changes relating to our insurance, banking, international, or other operations that may affect the cost of, or demand for, our products or services, or increase the cost or administrative burdens of providing benefits to employees; (34) the effects of business disruption or economic contraction due to disasters such as terrorist attacks, cyberattacks, other hostilities, or natural catastrophes, including any related impact on our disaster recovery systems, cyber-or other information security systems and management continuity planning; (35) the effectiveness of our programs and practices in avoiding giving our associates incentives to take excessive risks; and (36) other risks and uncertainties described from time to time in MetLife, Inc.’s filings with the SEC. MetLife, Inc. does not undertake any obligation to publicly correct or update any forward-looking statement if MetLife, Inc. later becomes aware that such statement is not likely to be achieved. Please consult any further disclosures MetLife, Inc. makes on related subjects in reports to the SEC. |
 Explanatory Note on Non-GAAP Financial Information All references in this presentation (except in this Explanatory Note on Non-GAAP Financial slide) to net income (loss), net income (loss) per share, operating earnings, operating earnings per share, book value per share, and operating return on equity, should be read as net income (loss) available to MetLife, Inc.'s common shareholders, net income (loss) available to MetLife, Inc.'s common shareholders per diluted common share, operating earnings available to common shareholders, operating earnings available to common shareholders per diluted common share, book value per common share, excluding accumulated other comprehensive income (loss) ("AOCI"), and operating return on MetLife, Inc.’s common equity, excluding AOCI, respectively. Operating earnings is the measure of segment profit or loss that MetLife uses to evaluate segment performance and allocate resources. Consistent with accounting principles generally accepted in the United States of America ("GAAP") accounting guidance for segment reporting, operating earnings is MetLife's measure of segment performance. Operating earnings is also a measure by which MetLife senior management's and many other employees' performance is evaluated for the purposes of determining their compensation under applicable compensation plans. Operating earnings is defined as operating revenues less operating expenses, both net of income tax. Operating earnings available to common shareholders is defined as operating earnings less preferred stock dividends. Operating revenues and operating expenses exclude results of discontinued operations and other businesses that have been or will be sold or exited by MetLife, Inc. (“Divested Businesses”). Operating revenues also excludes net investment gains (losses) (“NIGL”) and net derivative gains (losses) (“NDGL”). The following additional adjustments are made to GAAP revenues, in the line items indicated, in calculating operating revenues: • Universal life and investment-type product policy fees excludes the amortization of unearned revenue related to NIGL and NDGL and certain variable annuity guaranteed minimum income benefits ("GMIB") fees ("GMIB Fees"); • Net investment income: (i) includes amounts for scheduled periodic settlement payments and amortization of premium on derivatives that are hedges of investments but do not qualify for hedge accounting treatment, (ii) includes income from discontinued real estate operations, (iii) excludes post-tax operating earnings adjustments relating to insurance joint ventures accounted for under the equity method, (iv) excludes certain amounts related to contractholder-directed unit-linked investments, and (v) excludes certain amounts related to securitization entities that are variable interest entities ("VIEs") consolidated under GAAP; and • Other revenues are adjusted for settlements of foreign currency earnings hedges. |
 The following additional adjustments are made to GAAP expenses, in the line items indicated, in calculating operating expenses: Policyholder benefits and claims and policyholder dividends excludes: (i) changes in the policyholder dividend obligation related to NIGL and NDGL, (ii) inflation-indexed benefit adjustments associated with contracts backed by inflation-indexed investments and amounts associated with periodic crediting rate adjustments based on the total return of a contractually referenced pool of assets, (iii) benefits and hedging costs related to GMIBs ("GMIB Costs"), and (iv) market value adjustments associated with surrenders or terminations of contracts ("Market Value Adjustments"); Interest credited to policyholder account balances includes adjustments for scheduled periodic settlement payments and amortization of premium on derivatives that are hedges of policyholder account balances but do not qualify for hedge accounting treatment and excludes amounts related to net investment income earned on contractholder-directed unit-linked investments; Amortization of deferred policy acquisition costs (“DAC”) and value of business acquired ("VOBA") excludes amounts related to: (i) NIGL and NDGL, (ii) GMIB Fees and GMIB Costs, and (iii) Market Value Adjustments; Amortization of negative VOBA excludes amounts related to Market Value Adjustments; Interest expense on debt excludes certain amounts related to securitization entities that are VIEs consolidated under GAAP; and Other expenses excludes costs related to: (i) noncontrolling interests, (ii) implementation of new insurance regulatory requirements, and (iii) business combinations. Operating return on MetLife, Inc. common equity is defined as operating earnings available to common shareholders divided by average GAAP common equity. MetLife believes the presentation of operating earnings and operating earnings available to common shareholders as MetLife measures it for management purposes enhances the understanding of the company's performance by highlighting the results of operations and the underlying profitability drivers of the business. Operating revenues, operating expenses, operating earnings, operating earnings available to common shareholders, operating earnings available to common shareholders per diluted common share, book value per common share, excluding AOCI, book value per diluted common share, excluding AOCI, operating return on MetLife, Inc.’s common equity and operating return on MetLife, Inc.’s common equity, excluding AOCI, should not be viewed as substitutes for the following financial measures calculated in accordance with GAAP: GAAP revenues, GAAP expenses, GAAP income (loss) from continuing operations, net of income tax, GAAP net income (loss) available to MetLife, Inc.'s common shareholders, GAAP net income (loss) available to MetLife, Inc.'s common shareholders per diluted common share, book value per common share, book value per diluted common share, return on MetLife, Inc.’s common equity and return on MetLife, Inc.’s common equity, excluding AOCI, respectively. Explanatory Note on Non-GAAP Financial Information (Continued) |
 Explanatory Note on Non-GAAP Financial Information (Continued) For the historical periods presented, reconciliations of non-GAAP measures used in this presentation to the most directly comparable GAAP measures are included in the Appendix to the presentation materials and are on the Investor Relations portion of our Internet website. Additional information about our historical results is also available on our Internet website in our Quarterly Financial Supplements for the corresponding periods. Managed Assets (as defined below) is a financial measure based on methodologies other than GAAP. MetLife utilizes “Managed Assets” to describe assets in its investment portfolio which are actively managed and reflected at estimated fair value. MetLife believes the use of Managed Assets enhances the understanding and comparability of its investment portfolio by excluding assets such as policy loans, other invested assets, mortgage loans held-for-sale, and mortgage loans held by consolidated securitization entities, as substantially all of those assets are not actively managed in MetLife’s investment portfolio. Trading and other securities are also excluded as this amount is primarily comprised of contractholder-directed unit-linked investments, where the contractholder, and not the Company, directs the investment of these funds. Mortgage loans and certain real estate investments have also been adjusted from carrying value to estimated fair value. Additional information about each of MetLife’s investments is available in MetLife, Inc.’s Quarterly Financial Supplement for the quarter ended December 31, 2011, which may be accessed through MetLife’s Investor Relations Web page at http://investor.metlife.com and MetLife’s Annual Report on Form 10-K for the period ended December 31, 2011. The non-GAAP measures used in this presentation should not be viewed as substitutes for the most directly comparable GAAP measures. In this presentation, we sometimes refer to sales activity for various products. These sales statistics do not correspond to revenues under GAAP, but are used as relevant measures of business activity. In this presentation, we provide guidance on our future earnings, earnings per diluted common share and return on common equity on an operating basis. A reconciliation of the non-GAAP measures to the most directly comparable GAAP measures is not accessible on a forward-looking basis because we believe it is not possible to provide other than a range of net investment gains and losses and net derivative gains and losses, which can fluctuate significantly within or without the range and from period to period and may have a significant impact on GAAP net income. |
 6 Overview Solid financial results, despite macro headwinds Focused on creating long-term shareholder value A global and growing franchise Strong capital position Prudent risk management |
 Financial Performance |
 8 MetLife’s 2011 Results Solid year in a challenging environment Operating earnings per share grew 16% year over year, despite: – Low interest rates – Volatile equity markets – Record natural disasters Alico providing expected value; integration on-track |
 9 2011 Plan 2011 Actual Operating Earnings (in $ millions) $5,060 - $5,490 $5,358 Operating Earnings per Share $4.75 - $5.15 $5.02 Operating Return on Equity 10.6% - 11.4% 11.0% Book Value* (excluding AOCI) $46.80 - $47.65 $49.02 * Book Value per Common Share, actual common shares outstanding 9 Full Year 2011 Financial Overview See Explanatory Note on Non-GAAP Financial Information slide. See also Appendix for Non-GAAP reconciliations. |
 A Global and Growing Franchise |
 11 A Global and Growing Franchise Global Presence Leadership positions in large established markets Strong and growing presence in high growth markets with favorable demographics and high margins Risk Management Disciplined risk management to protect our customers and shareholders Diversified Distribution & Products Broad and diverse distribution channels and product offerings to meet customer needs worldwide Financial Strength Solid balance sheet and capital generation |
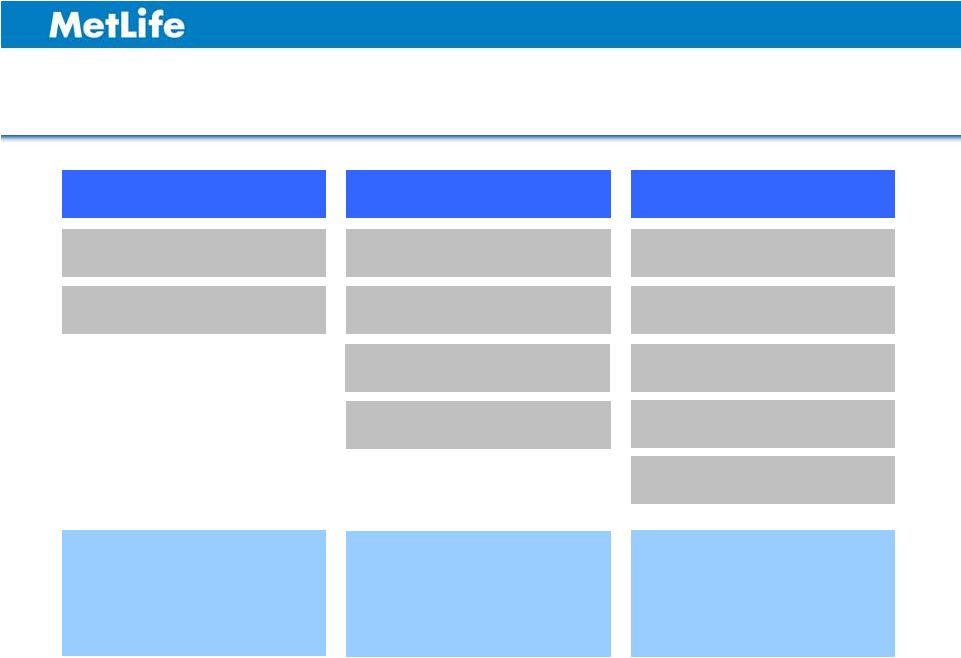 12 Leadership Positions in Markets of Today and Tomorrow Established Significant & Growing Emerging United States Japan Mexico Korea Poland Chile Russia Brazil China India Turkey High Margins with Attractive Growth Prospects Largest Global Markets with Strong Cash Generation Fast Growing with Good Margins |
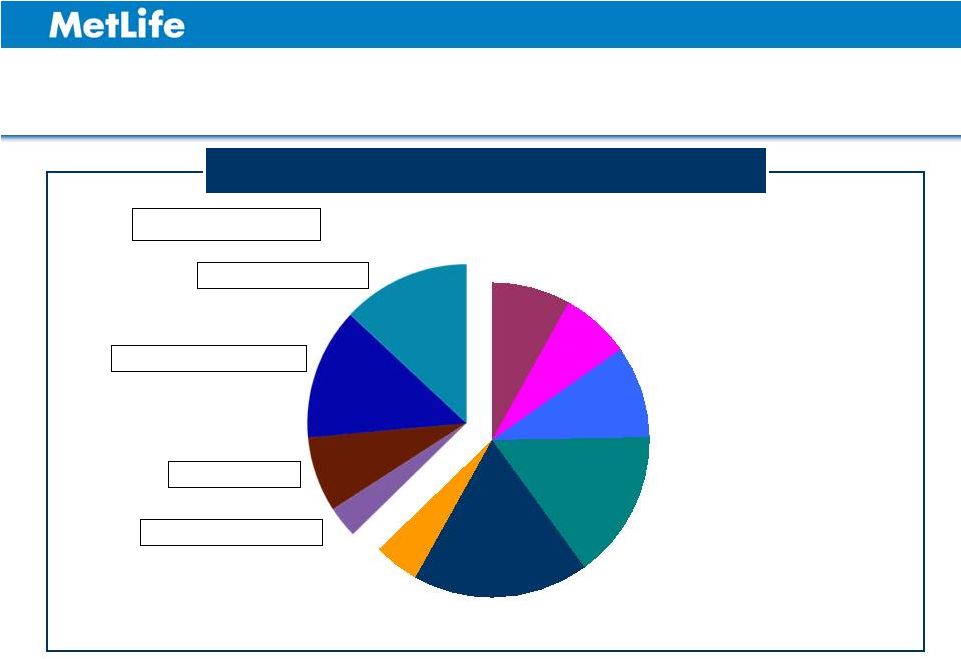 Diversified Products to Meet Customers Needs 13 2012 Plan Operating Earnings by Product¹ International United States Individual Life Auto & Home Non-Medical Health Retirement Group Insurance Group Life Corporate Benefit Funding Retirement Individual Life 1. Calculated using mid-point of range, excluding MetLife Bank and Corporate & Other. See Explanatory Note on Non-GAAP Financial Information slide. Accident & Health |
 14 Take a portfolio view of our businesses Continuously assess our strategy Balance growth, profitability and risk Optimize the use of capital Guiding Principles for Building on Our Strengths |
 15 Retail Key Themes 1 2 3 4 Commitment to Face-to-Face Profitable Growth Investing for Return Organizational Alignment |
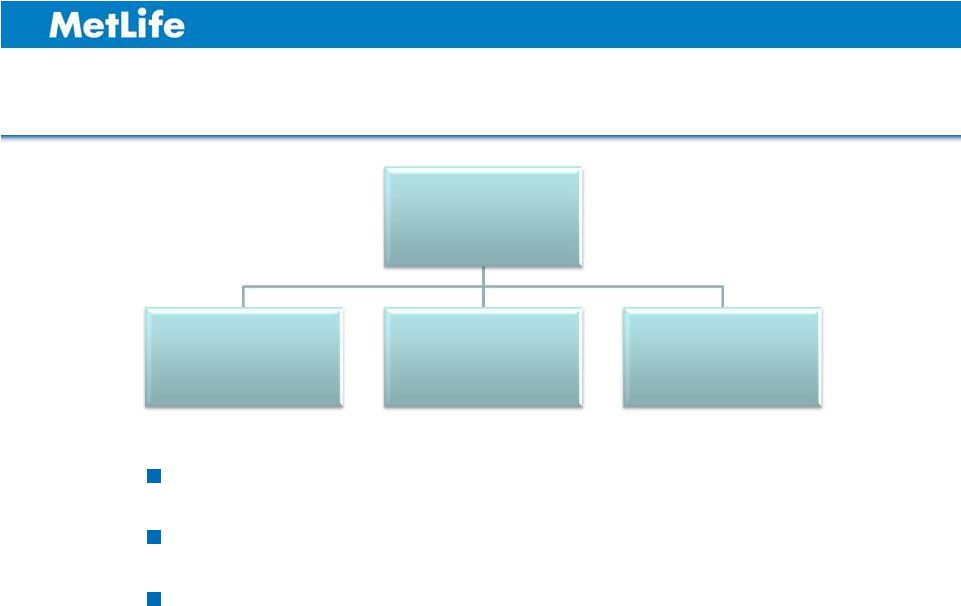 16 Retail Organization Structure Retail Business Product Distribution Administration/ Marketing Promotes accountability Aligns strategy across Product and Distribution Drives efficiency gains |
 17 Variable Annuity Highlights Well diversified block – Over one-third of our VA block has no living benefits – Dollar cost averaged over time - never stopped writing – By channel Proven risk management practices – Product design – Hedging 2012 Variable Annuity sales $17.5B to $18.5B – Plan developed based on self funding levels – Approximately 35% reduction from 2011 sales |
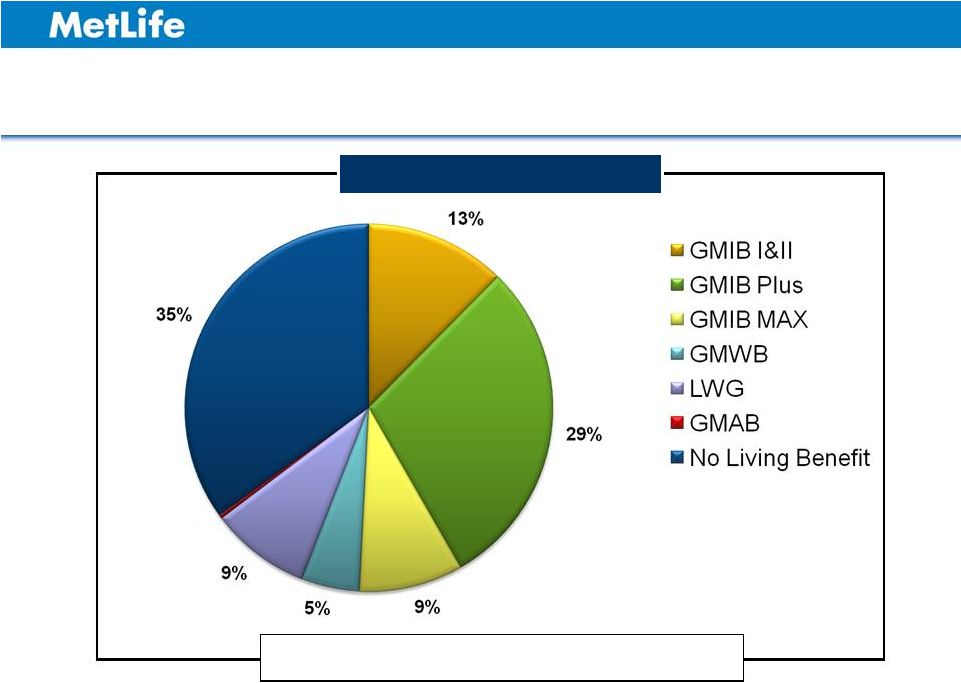 18 Variable Annuity Account Value by Guarantee Type (Domestic) Living Benefits Total VA Account Balance¹ = $139 Billion 1. Deferred Variable Annuities account balance as of December 31, 2011 |
 GMIB MAX Protected Growth Strategy (“PGS”) funds provide more stable fee base More capital efficient Improved distribution of returns 19 |
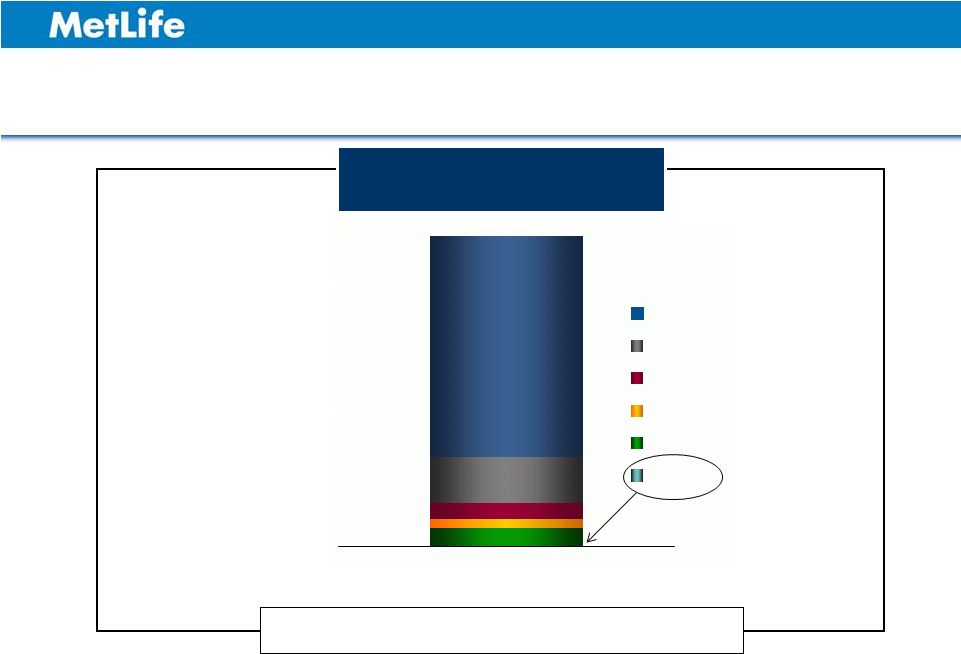 20 GMIB MAX: Distribution of Returns Return on Investment (ROI) Distribution No scenarios observed below 0% ROI 1 1. GMIB MAX (5% Rollup) launched on Jan 2, 2012. The pricing results were based on market conditions as of Oct 31, 2011. Incidences of ROIs reflected in the chart above are the results of roughly 1,000 stochastic scenarios observed. GMIB MAX (5% Rollup) > 15% 12% - 15% 10% - 12% 8% - 10% 0% - 8% < 0% |
 Risk Management |
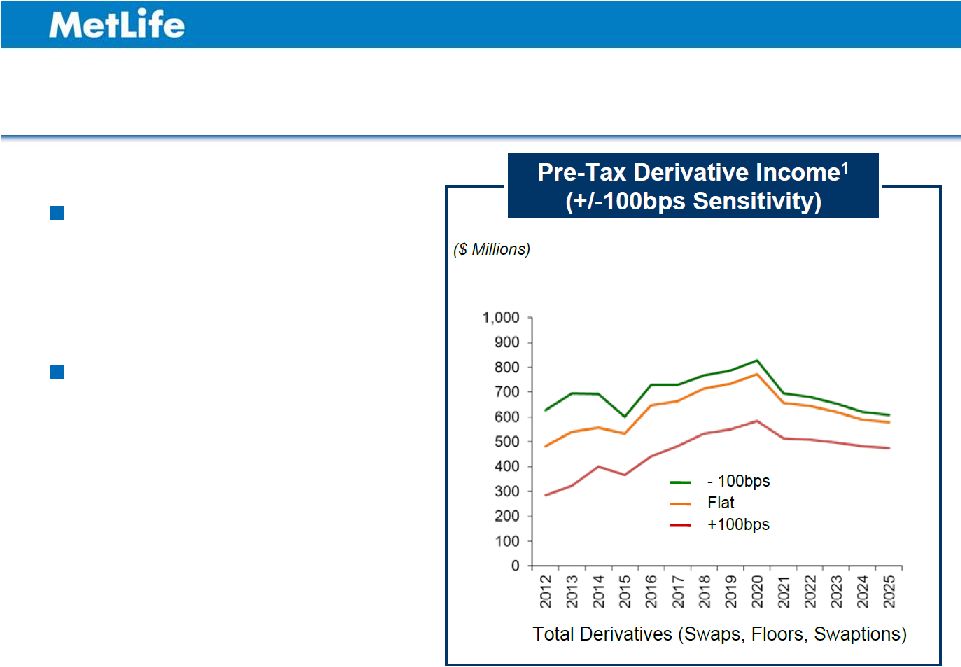 Actively Managing Interest Rate Risk Approximately $47 billion notional² to hedge against low rates Protection extending into next decade 22 1. Estimated based on August 31, 2011 rates, assuming parallel curve shift. 2. MetLife investment portfolio (excluding International and VA hedging program and MetLife Bank) as of August 31, 2011. |
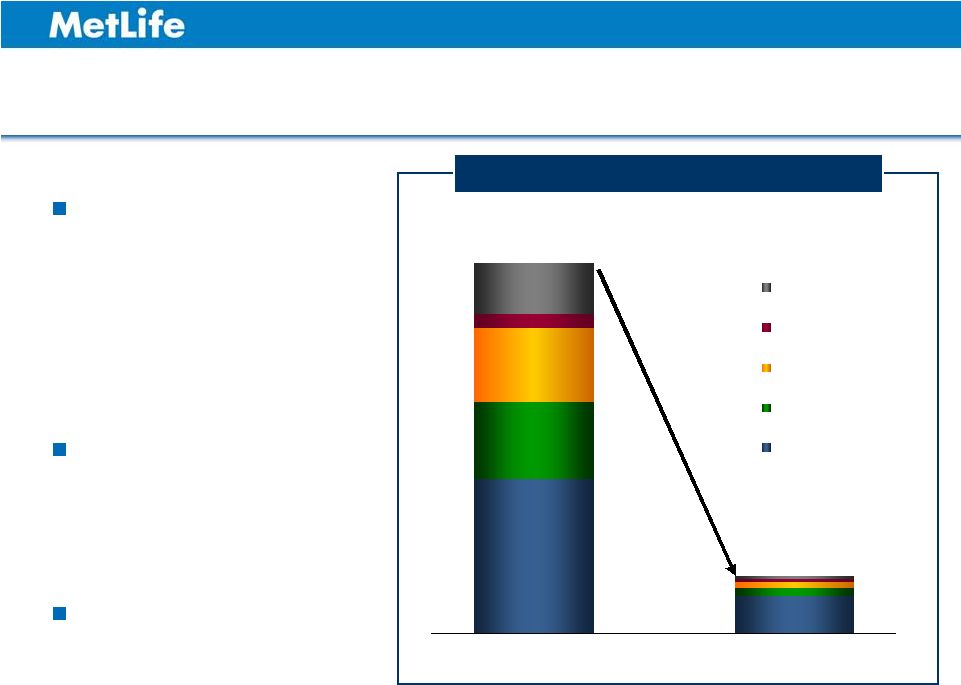 Peripheral European Sovereign Exposure Total Peripheral European Sovereign exposure is 0.1% of total Managed Assets, as of 12/31/11 Net Impairment and Losses of $272 million, after-tax in 2011 Remaining Greece exposure manageable See Explanatory Note on Non-GAAP Financial Information slide. ($ Millions) 23 $682 $165 12/31/2010 12/31/2011 Spain Ireland Portugal Italy Greece U.S. GAAP Book Value $1,644 $254 |
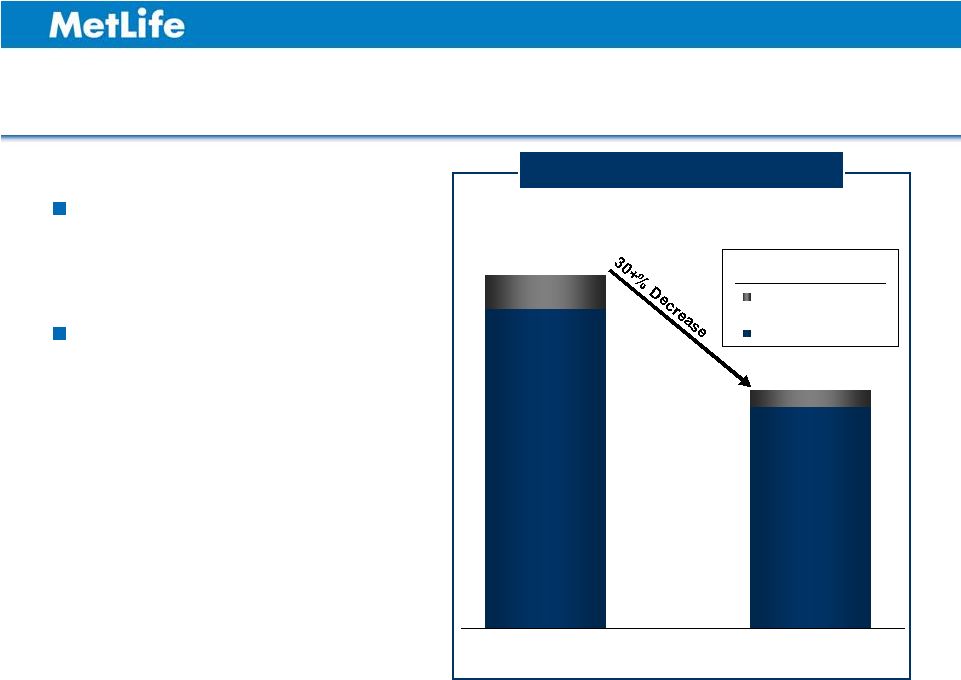 European Bank Exposure 12/31/2010 12/31/2011 Peripherals¹ Non-Peripherals U.S. GAAP Book Value $9,279 $6,263 Country of Domicile ($ Millions) 1 Spain, Ireland, Portugal, Italy and Greece. The exposures presented above are based on MetLife Inc. 4Q 2011 financials and therefore include 11/30/11 figures for Alico. 24 Proactively reduced exposure during 2011 Remaining holdings primarily in large “national champion” banks in core Europe and U.K. |
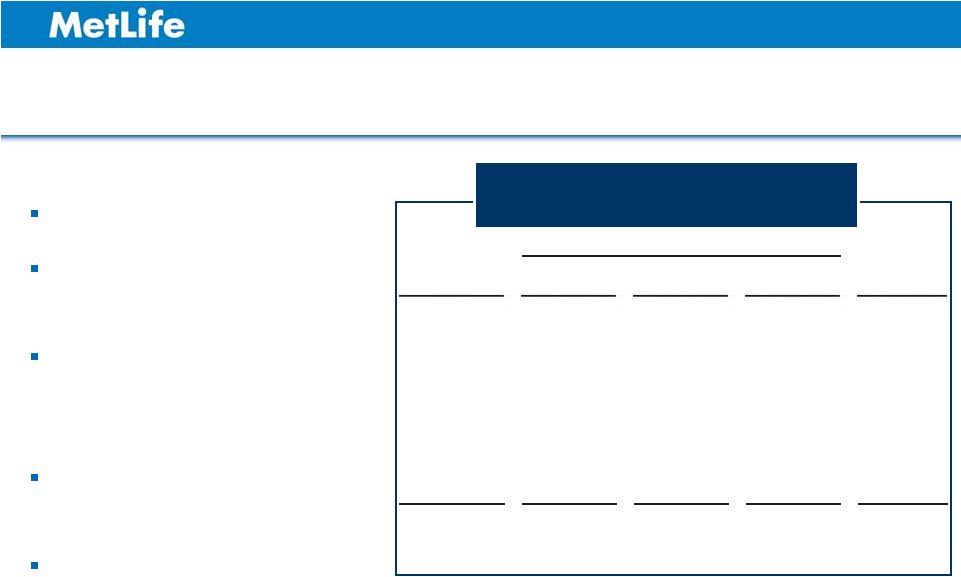 Commercial Mortgages LTV and DSCR Matrix $42.1 Billion 61% Loan to Value (LTV) 2.1x average Debt Service Coverage Ratio (DSCR) Commercial mortgage valuation allowance of $398 million Delinquency rate of 16 basis points Low losses in 2011 of $12 million LTV >1.2x 1.0-1.2x <1.0x Total < 65% 61.8% 1.1% 1.4% 64.3% 65-75% 20.5% 0.8% 1.0% 22.3% 76-80% 2.8% 0.2% 0.6% 3.6% > 80% 6.7% 2.2% 0.9% 9.8% Total 91.8% 4.3% 3.9% 100.0% Based on rolling four quarter valuation process. 1. Estimated Fair Market value as of December 31, 2011. 25 1 1 |
 Capital Position |
 27 Comprehensive Capital Analysis and Review (“CCAR”) One of the 19 Bank Holding Companies (“BHCs”) Federal Reserve objected to 2012 capital plan – Share repurchases of $2.0 billion – Common stock dividend increase to $1.10 per share from $0.74 per share MetLife submitted its own calculations above required minimums for all four BHC capital ratios Our plan is not to be a BHC by the end of the second quarter 2012 |
 28 Life Insurance -vs- BHC Profile CCAR methodology designed for banks Risk profile unique compared to BHC – Investment portfolio composition driven by liability profile – Corporate bonds “penalized” in risk-weighted assets – Separate accounts “penalized” by inclusion in Tier 1 Leverage Ratio MetLife is well capitalized and well positioned |
 29 Strong Capital Position Strong capitalization at operating subsidiaries at year-end 2011 – U.S. combined risk based capital (RBC): 450% – Japan solvency margin ratio (SMR): 881% Deployable capital at Holding Companies – $3.5 billion at year-end 2011 – Estimated $6 to $7 billion at year-end 2012 ¹ Committed to returning capital to shareholders 1. 2012 deployable capital is prior to common stock dividends and any other capital actions. |
 30 Delivering solid financial results in a challenging environment Strong presence in established and high growth markets Focused on profitable growth Strong capital generation to fuel growth and deliver shareholder value Summary |
 Appendix |
 Reconciliation of Net Income (Loss) Available to MetLife, Inc.’s Common Shareholders to Operating Earnings Available to Common Shareholders and Reconciliation of Net Income (Loss) Available to MetLife, Inc.’s Common Shareholders Per Common Share – Diluted to Operating Earnings Available to Common Shareholders Per Common Share – Diluted ($ Millions, except per share data) Total Company 2011 Net income (loss) available to MetLife, Inc.'s common shareholders 6,713 $ Adjustments from net income (loss) available to MetLife, Inc.'s common shareholders to operating earnings available to common shareholders: Less: Net investment gains (losses) (867) Less: Net derivative gains (losses) 4,824 Less: Other adjustments to continuing operations (1,641) Less: Provision for income tax (expense) benefit (845) Less: Income (loss) from discontinued operations, net of income tax 20 Add: Net income (loss) attributable to noncontrolling interests (10) Add: Preferred stock redemption premium 146 Operating earnings available to common shareholders 5,358 $ Net income (loss) available to MetLife, Inc.'s common shareholders per common share - diluted 6.29 $ Adjustments from net income (loss) available to MetLife, Inc.'s common shareholders per common share - diluted to operating earnings available to common shareholders per diluted common share: Less: Net investment gains (losses) (0.81) Less: Net derivative gains (losses) 4.52 Less: Other adjustments to continuing operations (1.54) Less: Provision for income tax (expense) benefit (0.79) Less: Income (loss) from discontinued operations, net of income tax 0.02 Add: Net income (loss) attributable to noncontrolling interests (0.01) Add: Preferred stock redemption premium 0.14 Operating earnings available to common shareholders per common share - diluted 5.02 $ Weighted average common shares outstanding - diluted 1,068.1 |
 Reconciliation of MetLife, Inc.’s Common Equity and Reconciliation of MetLife, Inc.’s Book Value per Common Share Total Company 2011 Return on MetLife, Inc.'s common equity 12.8% Return on MetLife, Inc.'s common equity, excluding AOCI 13.8% Operating return on MetLife, Inc.'s common equity 10.2% Operating return on MetLife, Inc.'s common equity, excluding AOCI 11.0% Book value per common share - (actual common shares outstanding) 54.59 $ Less: Accumulated other comprehensive income (loss) per common share 5.57 Book value per common share, excluding accumulated other comprehensive income (loss) - (actual common shares outstanding) 49.02 $ Common shares outstanding (in millions) 1,058.0 |
 |