Exhibit 99.1

MetLife
© PNTS
John McCallion
Vice President Investor Relations
INVESTOR DAY 2012
MetLife
Safe Harbor Statement
These materials may contain or incorporate by reference information that includes or is based upon forward-looking statements within the meaning of the Private Securities Litigation Reform Act of 1995. Forward-looking statements give expectations or forecasts of future events. These statements can be identified by the fact that they do not relate strictly to historical or current facts. They use words such as “anticipate,” “estimate,” “expect,” “project,” “intend,” “plan,” “believe” and other words and terms of similar meaning in connection with a discussion of future operating or financial performance. In particular, these include statements relating to future actions, prospective services or products, future performance or results of current and anticipated services or products, sales efforts, expenses, the outcome of contingencies such as legal proceedings, trends in operations and financial results.
Any or all forward-looking statements may turn out to be wrong. They can be affected by inaccurate assumptions or by known or unknown risks and uncertainties. Many such factors will be important in determining the actual future results of MetLife, Inc., its subsidiaries and affiliates. These statements are based on current expectations and the current economic environment. They involve a number of risks and uncertainties that are difficult to predict. These statements are not guarantees of future performance. Actual results could differ materially from those expressed or implied in the forward-looking statements. Risks, uncertainties, and other factors that might cause such differences include the risks, uncertainties and other factors identified in MetLife, Inc.’s filings with the U.S. Securities and Exchange Commission (the “SEC”). These factors include: (1) difficult conditions in the global capital markets; (2) concerns over U.S. fiscal policy and the trajectory of the national debt of the U.S., as well as rating agency downgrades of U.S. Treasury securities; (3) uncertainty about the effectiveness of governmental and regulatory actions to stabilize the financial system, the imposition of fees relating thereto, or the promulgation of additional regulations; (4) increased volatility and disruption of the capital and credit markets, which may affect our ability to seek financing or access our credit facilities; (5) impact of comprehensive financial services regulation reform on us; (6) economic, political, legal, currency and other risks relating to our international operations, including with respect to fluctuations of exchange rates; (7) exposure to financial and capital market risk, including as a result of the disruption in Europe and possible withdrawal of one or more countries from the Euro zone; (8) changes in general economic conditions, including the performance of financial markets and interest rates, which may affect our ability to raise capital, generate fee income and market-related revenue and finance statutory reserve requirements and may require us to pledge collateral or make payments related to declines in value of specified assets; (9) potential liquidity and other risks resulting from our participation in a securities lending program and other transactions; (10) investment losses and defaults, and changes to investment valuations; (11) impairments of goodwill and realized losses or market value impairments to illiquid assets; (12) defaults on our mortgage loans; (13) the defaults or deteriorating credit of other financial institutions that could adversely affect us; (14) our ability to address unforeseen liabilities, asset impairments, or rating actions arising from acquisitions or dispositions, including our acquisition of American Life Insurance Company and Delaware American Life Insurance Company (collectively, “ALICO”) and to successfully integrate and manage the growth of acquired businesses with minimal disruption; (15) uncertainty with respect to the outcome of the closing agreement entered into with the United States Internal Revenue Service in connection with the acquisition of ALICO;
2
MetLife
Safe Harbor Statement (continued)
(16) the dilutive impact on our stockholders resulting from the settlement of common equity units issued in connection with the acquisition of ALICO or otherwise; (17) MetLife, Inc.’s primary reliance, as a holding company, on dividends from its subsidiaries to meet debt payment obligations and the applicable regulatory restrictions on the ability of the subsidiaries to pay such dividends; (18) downgrades in our claims paying ability, financial strength or credit ratings; (19) ineffectiveness of risk management policies and procedures; (20) availability and effectiveness of reinsurance or indemnification arrangements, as well as default or failure of counterparties to perform; (21) discrepancies between actual claims experience and assumptions used in setting prices for our products and establishing the liabilities for our obligations for future policy benefits and claims; (22) catastrophe losses; (23) heightened competition, including with respect to pricing, entry of new competitors, consolidation of distributors, the development of new products by new and existing competitors, distribution of amounts available under U.S. government programs, and for personnel; (24) unanticipated changes in industry trends; (25) changes in assumptions related to investment valuations, deferred policy acquisition costs, deferred sales inducements, value of business acquired or goodwill; (26) changes in accounting standards, practices and/or policies; (27) increased expenses relating to pension and postretirement benefit plans, as well as health care and other employee benefits; (28) exposure to losses related to variable annuity guarantee benefits, including from significant and sustained downturns or extreme volatility in equity markets, reduced interest rates, unanticipated policyholder behavior, mortality or longevity, and the adjustment for nonperformance risk; (29) deterioration in the experience of the “closed block” established in connection with the reorganization of Metropolitan Life Insurance Company; (30) adverse results or other consequences from litigation, arbitration or regulatory investigations; (31) inability to protect our intellectual property rights or claims of infringement of the intellectual property rights of others; (32) discrepancies between actual experience and assumptions used in establishing liabilities related to other contingencies or obligations; (33) regulatory, legislative or tax changes relating to our insurance, banking, international, or other operations that may affect the cost of, or demand for, our products or services, or increase the cost or administrative burdens of providing benefits to employees; (34) the effects of business disruption or economic contraction due to disasters such as terrorist attacks, cyberattacks, other hostilities, or natural catastrophes, including any related impact on our disaster recovery systems, cyber- or other information security systems and management continuity planning; (35) the effectiveness of our programs and practices in avoiding giving our associates incentives to take excessive risks; and (36) other risks and uncertainties described from time to time in MetLife, Inc.’s filings with the SEC.
MetLife, Inc. does not undertake any obligation to publicly correct or update any forward-looking statement if MetLife, Inc. later becomes aware that such statement is not likely to be achieved. Please consult any further disclosures MetLife, Inc. makes on related subjects in reports to the SEC.
3
MetLife
Explanatory Note on Non-GAAP Financial Information
All references in these presentations (except in this Explanatory Note on Non-GAAP Financial Information slide) to operating earnings, premiums, fees and other revenues and return on equity, should be read as operating earnings available to common shareholders, premiums, fees and other revenues (operating) and operating return on MetLife, Inc.’s common equity, excluding AOCI, respectively.
Operating earnings is the measure of segment profit or loss that MetLife uses to evaluate segment performance and allocate resources. Consistent with accounting principles generally accepted in the United States of America (“GAAP”) accounting guidance for segment reporting, operating earnings is MetLife’s measure of segment performance. Operating earnings is also a measure by which MetLife senior management’s and many other employees’ performance is evaluated for the purposes of determining their compensation under applicable compensation plans.
Operating earnings is defined as operating revenues less operating expenses, both net of income tax. Operating earnings available to common shareholders is defined as operating earnings less preferred stock dividends.
Operating revenues and operating expenses exclude results of discontinued operations and other businesses that have been or will be sold or exited by MetLife, Inc. (“Divested Businesses”). Operating revenues also excludes net investment gains (losses) (“NIGL”) and net derivative gains (losses) (“NDGL”).
The following additional adjustments are made to GAAP revenues, in the line items indicated, in calculating operating revenues:
Universal life and investment-type product policy fees excludes the amortization of unearned revenue related to NIGL and NDGL and certain variable annuity guaranteed minimum income benefits (“GMIB”) fees (“GMIB Fees”);
Net investment income: (i) includes amounts for scheduled periodic settlement payments and amortization of premium on derivatives that are hedges of investments but do not qualify for hedge accounting treatment, (ii) includes income from discontinued real estate operations, (iii) excludes post-tax operating earnings adjustments relating to insurance joint ventures accounted for under the equity method, (iv) excludes certain amounts related to contractholder-directed unit-linked investments, and (v) excludes certain amounts related to securitization entities that are variable interest entities (“VIEs”) consolidated under GAAP; and
Other revenues are adjusted for settlements of foreign currency earnings hedges.
4
MetLife
Explanatory Note on Non-GAAP Financial Information (Continued)
The following additional adjustments are made to GAAP expenses, in the line items indicated, in calculating operating expenses:
• Policyholder benefits and claims and policyholder dividends excludes: (i) changes in the policyholder dividend obligation related to NIGL and NDGL, (ii) inflation-indexed benefit adjustments associated with contracts backed by inflation-indexed investments and amounts associated with periodic crediting rate adjustments based on the total return of a contractually referenced pool of assets, (iii) benefits and hedging costs related to GMIBs (“GMIB Costs”), and (iv) market value adjustments associated with surrenders or terminations of contracts (“Market Value Adjustments”);
• Interest credited to policyholder account balances includes adjustments for scheduled periodic settlement payments and amortization of premium on derivatives that are hedges of policyholder account balances but do not qualify for hedge accounting treatment and excludes amounts related to net investment income earned on contractholder-directed unit-linked investments;
• Amortization of deferred policy acquisition costs (“DAC”) and value of business acquired (“VOBA”) excludes amounts related to: (i) NIGL and NDGL, (ii) GMIB Fees and GMIB Costs, and (iii) Market Value Adjustments;
• Amortization of negative VOBA excludes amounts related to Market Value Adjustments;
• Interest expense on debt excludes certain amounts related to securitization entities that are VIEs consolidated under GAAP; and
• Other expenses excludes costs related to: (i) noncontrolling interests, (ii) implementation of new insurance regulatory requirements, and (iii) acquisition and integration costs.
Operating return on MetLife, Inc. common equity is defined as operating earnings available to common shareholders divided by average GAAP common equity.
MetLife believes the presentation of operating earnings and operating earnings available to common shareholders as MetLife measures it for management purposes enhances the understanding of the company’s performance by highlighting the results of operations and the underlying profitability drivers of the business. Operating revenues, operating expenses, operating earnings, operating earnings available to common shareholders, operating earnings available to common shareholders per diluted common share, operating return on MetLife, Inc.’s common equity and operating return on MetLife, Inc.’s common equity, excluding AOCI, should not be viewed as substitutes for the following financial measures calculated in accordance with GAAP: GAAP revenues, GAAP expenses, GAAP income (loss) from continuing operations, net of income tax, GAAP net income (loss) available to MetLife, Inc.’s common shareholders, GAAP net income (loss) available to MetLife, Inc.’s common shareholders per diluted common share, return on MetLife, Inc.’s common equity and return on MetLife, Inc.’s common equity, excluding AOCI, respectively.
5

MetLife
Explanatory Note on Non-GAAP Financial Information (Continued)
For the historical periods presented, reconciliations of non-GAAP measures used in this presentation to the most directly comparable GAAP measures are included in this Appendix to the presentation materials and are on the Investor Relations portion of our Internet website. Additional information about our historical results is also available on our Internet website in our Quarterly Financial Supplements for the corresponding periods.
The non-GAAP measures used in this presentation should not be viewed as substitutes for the most directly comparable GAAP measures.
In these presentations, we sometimes refer to sales activity for various products. These sales statistics do not correspond to revenues under GAAP, but are used as relevant measures of business activity.
In these presentations, we provide guidance on our future earnings, premiums, fees and other revenues, and return on common equity on an operating or non-GAAP basis. A reconciliation of the non-GAAP measures to the most directly comparable GAAP measures is not accessible on a forward-looking basis because we believe it is not possible to provide other than a range of net investment gains and losses and net derivative gains and losses, which can fluctuate significantly within or without the range and from period to period and may have a significant impact on GAAP net income.
6
MetLife
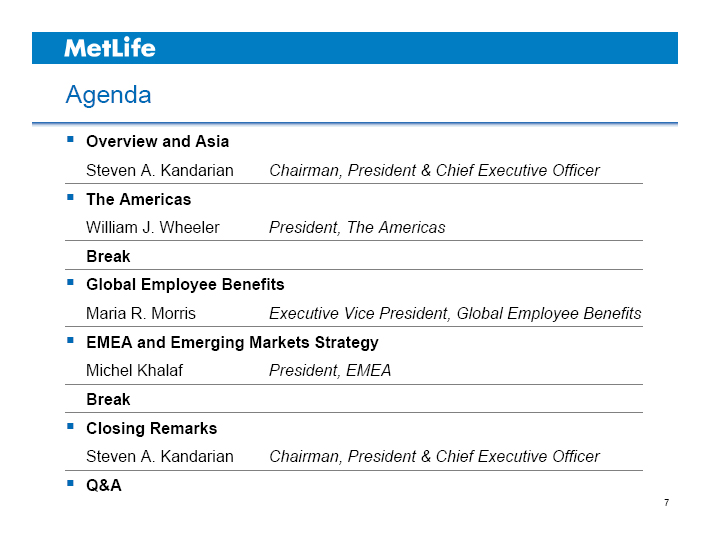
Agenda
Overview and Asia
Steven A. Kandarian Chairman, President & Chief Executive Officer
The Americas
William J. Wheeler President, The Americas
Break
Global Employee Benefits
Maria R. Morris Executive Vice President, Global Employee Benefits
EMEA and Emerging Markets Strategy
Michel Khalaf President, EMEA
Break
Closing Remarks
Steven A. Kandarian Chairman, President & Chief Executive Officer
Q&A
7

MetLife

MetLife
© PNTS
Steven A. Kandarian
Chairman, President & Chief Executive Officer
INVESTOR DAY 2012
MetLife
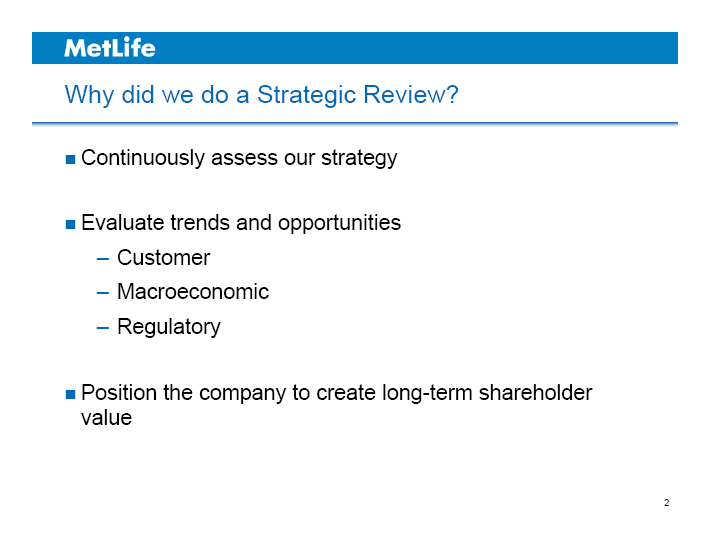
Why did we do a Strategic Review?
Continuously assess our strategy
Evaluate trends and opportunities
– Customer
– Macroeconomic
– Regulatory
Position the company to create long-term shareholder value
2
MetLife
Built to Embrace Challenges and Opportunities
Strong Foundation
Challenging Environment
Significant Opportunities
Leading presence in large markets
Strong positions in several high-growth countries
Strong distribution
Sound investment portfolio and proven risk management
Well established brand
Persistent low rates
Regulatory uncertainty
Insurance share of wallet has declined
Consumers want to do business in new ways
Insurance penetration is increasing in emerging markets
Corporations are becoming more global
3
MetLife
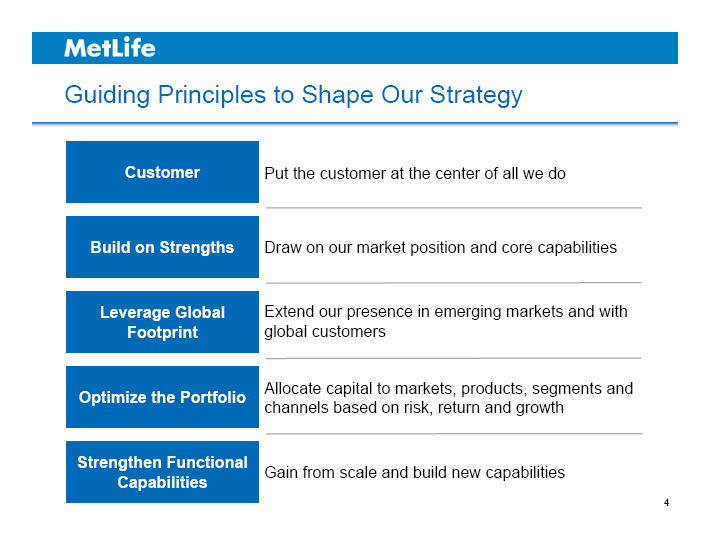
Guiding Principles to Shape Our Strategy
Customer Put the customer at the center of all we do
Build on Strengths Draw on our market position and core capabilities
Leverage Global Footprint Extend our presence in emerging markets and with global customers
Optimize the Portfolio Allocate capital to markets, products, segments and channels based on risk, return and growth
Strengthen Functional Capabilities Gain from scale and build new capabilities
4
MetLife
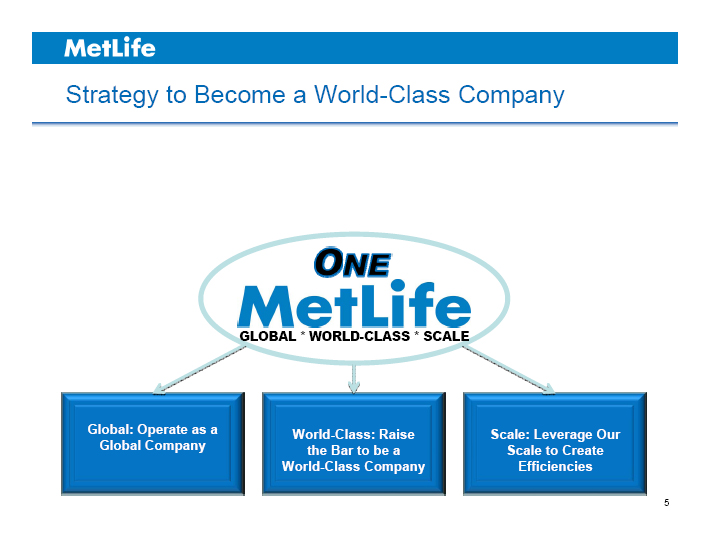
Strategy to Become a World-Class Company
ONE MetLife
GLOBAL * WORLD-CLASS * SCALE
Global: Operate as a Global Company
World-Class: Raise the Bar to be a World-Class Company
Scale: Leverage Our Scale to Create Efficiencies
5
MetLife
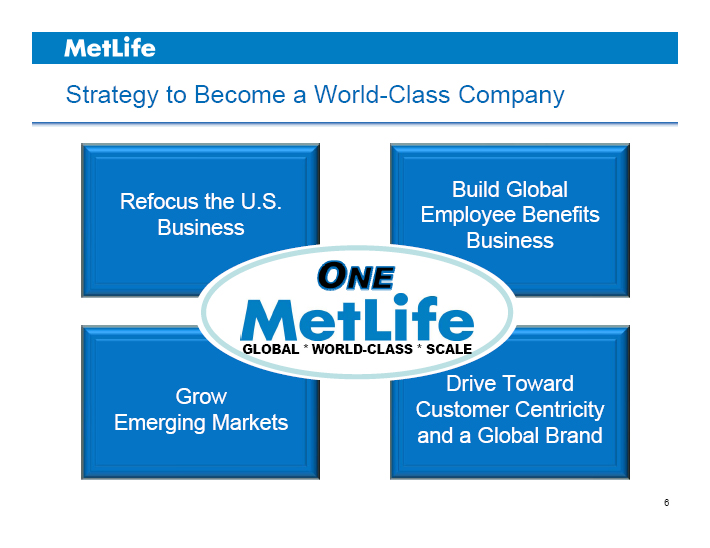
Strategy to Become a World-Class Company
ONE MetLife
GLOBAL * WORLD-CLASS * SCALE
Refocus the U.S. Business
Build Global Employee Benefits Business
Grow Emerging Markets
Drive Toward Customer Centricity and a Global Brand
6
MetLife
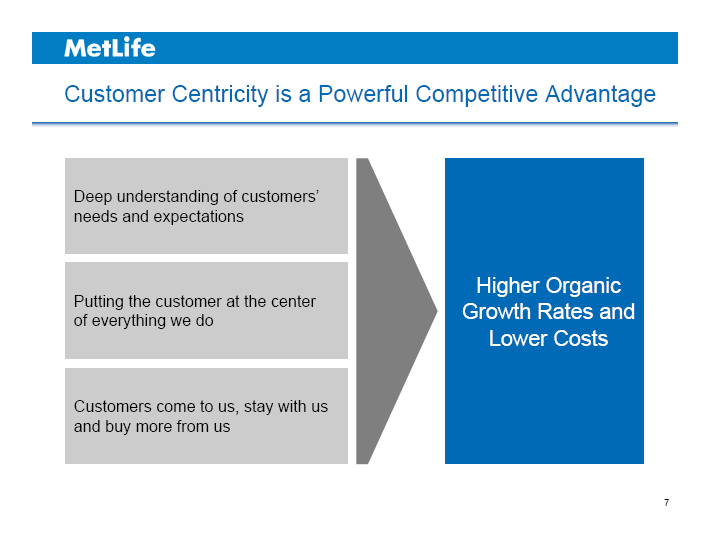
Customer Centricity is a Powerful Competitive Advantage
Deep understanding of customers’ needs and expectations
Putting the customer at the center of everything we do
Customers come to us, stay with us and buy more from us
Higher Organic Growth Rates and Lower Costs
7
MetLife
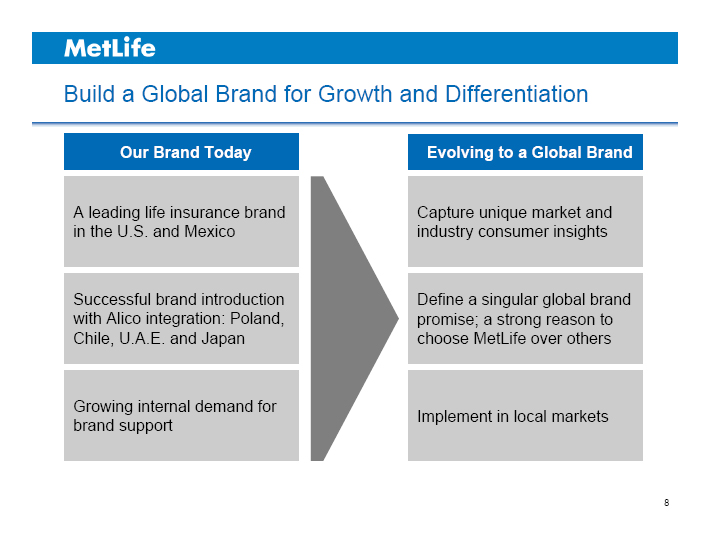
Build a Global Brand for Growth and Differentiation
Our Brand Today Evolving to a Global Brand
A leading life insurance brand in the U.S. and Mexico
Successful brand introduction with Alico integration: Poland, Chile, U.A.E. and Japan
Growing internal demand for brand support
Capture unique market and industry consumer insights
Define a singular global brand promise; a strong reason to choose MetLife over others
Implement in local markets
8
MetLife
© PNTS
Strategic Goals
MetLife
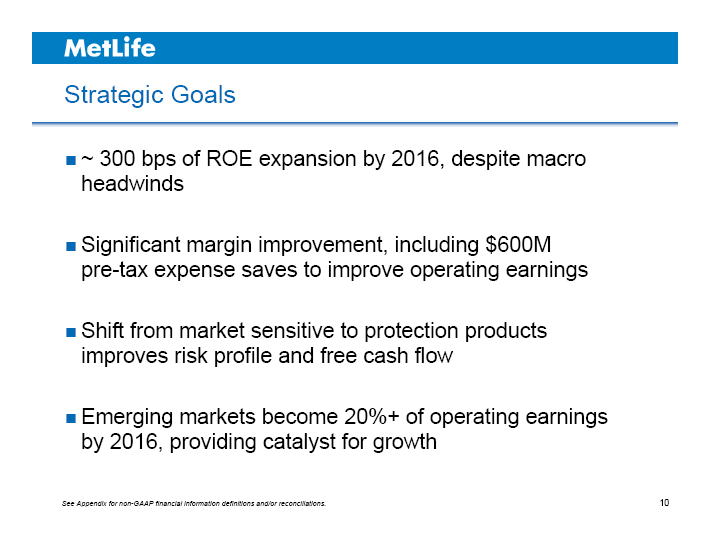
Strategic Goals
~ 300 bps of ROE expansion by 2016, despite macro headwinds
Significant margin improvement, including $600M pre-tax expense saves to improve operating earnings
Shift from market sensitive to protection products improves risk profile and free cash flow
Emerging markets become 20%+ of operating earnings by 2016, providing catalyst for growth
See Appendix for non-GAAP financial information definitions and/or reconciliations.
10
MetLife
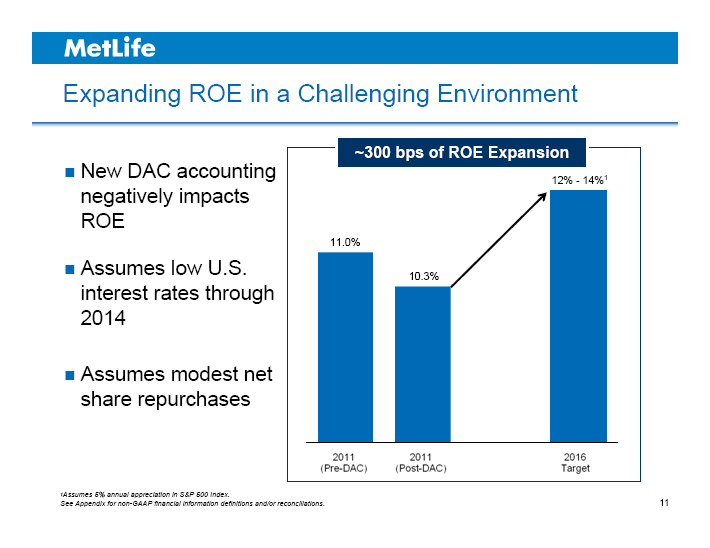
Expanding ROE in a Challenging Environment
New DAC accounting negatively impacts ROE
Assumes low U.S. interest rates through 2014
Assumes modest net share repurchases
~300 bps of ROE Expansion
12% - 14%1
11.0%
10.3%
2011 (Pre-DAC) 2011 (Post-DAC) 2016 Target
1Assumes 5% annual appreciation in S&P 500 Index.
See Appendix for non-GAAP financial information definitions and/or reconciliations. 11
MetLife
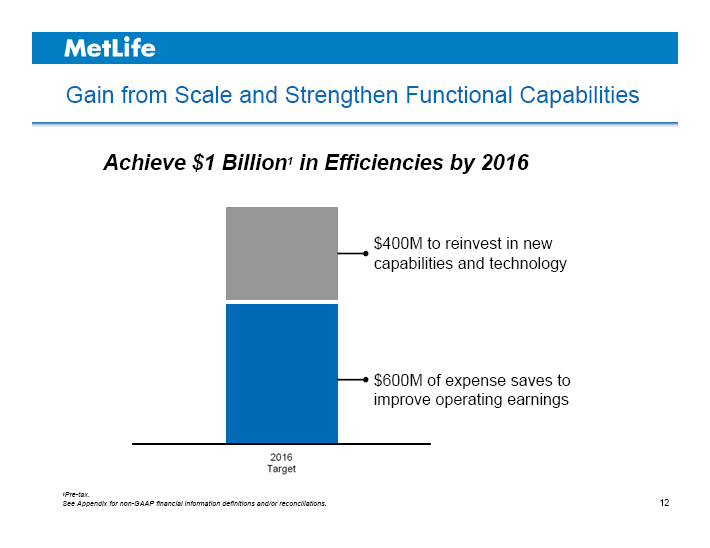
Gain from Scale and Strengthen Functional Capabilities
Achieve $1 Billion1 in Efficiencies by 2016
$400M to reinvest in new capabilities and technology
$600M of expense saves to improve operating earnings
2016 Target
1Pre-tax.
See Appendix for non-GAAP financial information definitions and/or reconciliations. 12
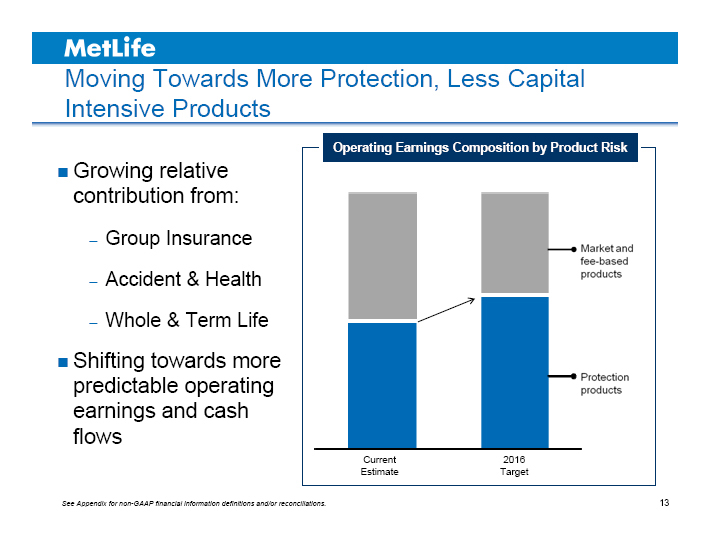
MetLife
Moving Towards More Protection, Less Capital Intensive Products
Growing relative contribution from:
– Group Insurance
– Accident & Health
– Whole & Term Life
Shifting towards more predictable operating earnings and cash flows
Operating Earnings Composition by Product Risk
Market and fee-based products
Protection products
Current Estimate
2016 Target
See Appendix for non-GAAP financial information definitions and/or reconciliations. 13
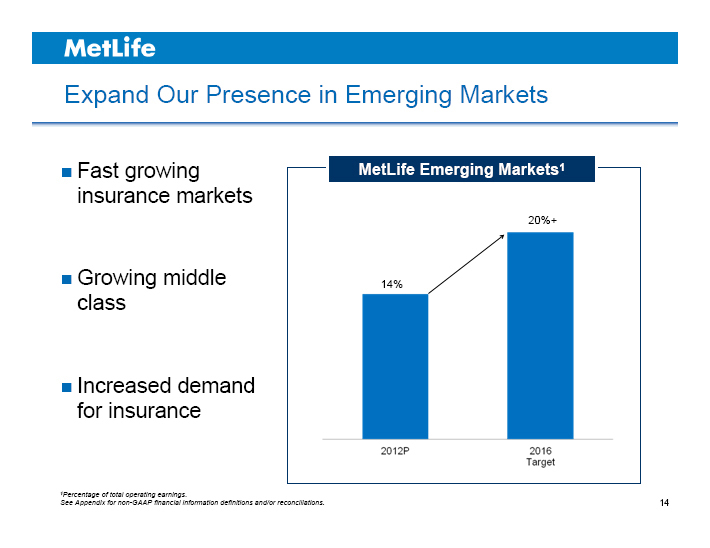
MetLife
Expand Our Presence in Emerging Markets
Fast growing insurance markets
Growing middle class
Increased demand for insurance
MetLife Emerging Markets1
20%+
14%
2012P 2016 Target
1Percentage of total operating earnings.
See Appendix for non-GAAP financial information definitions and/or reconciliations.
14
MetLife
© PNTS
Asia
MetLife
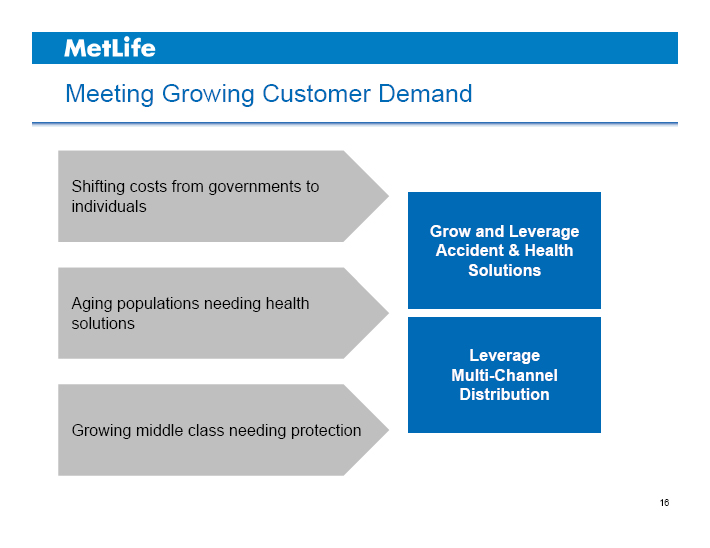
Meeting Growing Customer Demand
Shifting costs from governments to individuals
Grow and Leverage Accident & Health Solutions
Aging populations needing health solutions
Leverage Multi-Channel Distribution
Growing middle class needing protection
16
MetLife
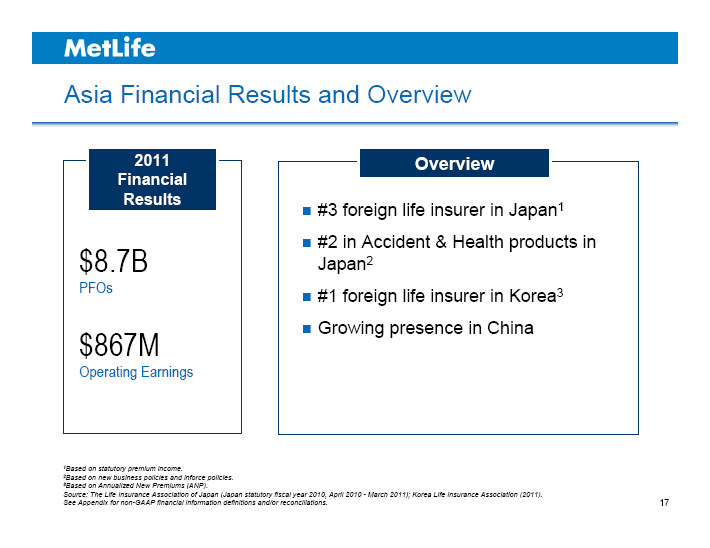
Asia Financial Results and Overview
2011 Financial Results
$8.7B PFOs
$867M Operating Earnings
Overview
#3 foreign life insurer in Japan1
#2 in Accident & Health products in Japan2
#1 foreign life insurer in Korea3
Growing presence in China
1Based on statutory premium income.
2Based on new business policies and inforce policies.
3Based on Annualized New Premiums (ANP).
Source: The Life Insurance Association of Japan (Japan statutory fiscal year 2010, April 2010 - March 2011); Korea Life Insurance Association (2011).
See Appendix for non-GAAP financial information definitions and/or reconciliations.
17
MetLife
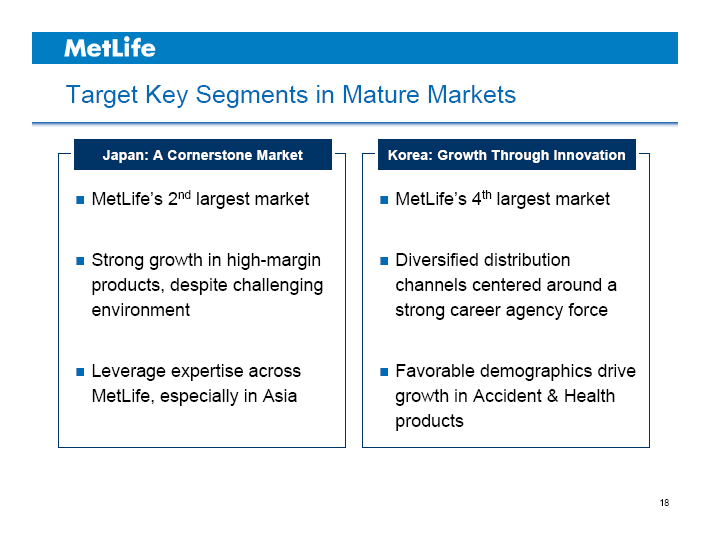
Target Key Segments in Mature Markets
Japan: A Cornerstone Market
MetLife’s 2nd largest market
Strong growth in high-margin products, despite challenging environment
Leverage expertise across MetLife, especially in Asia
Korea: Growth Through Innovation
MetLife’s 4th largest market
Diversified distribution channels centered around a strong career agency force
Favorable demographics drive growth in Accident & Health products
18
MetLife
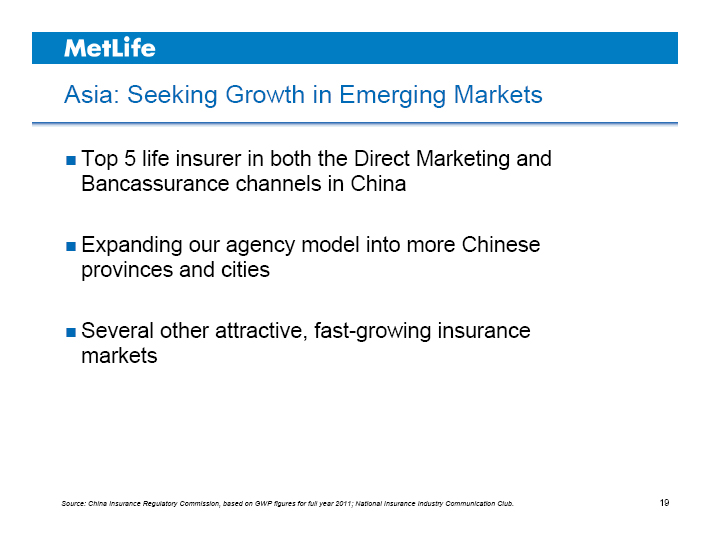
Asia: Seeking Growth in Emerging Markets
Top 5 life insurer in both the Direct Marketing and Bancassurance channels in China
Expanding our agency model into more Chinese provinces and cities
Several other attractive, fast-growing insurance markets
Source: China Insurance Regulatory Commission, based on GWP figures for full year 2011; National Insurance Industry Communication Club.
19
MetLife
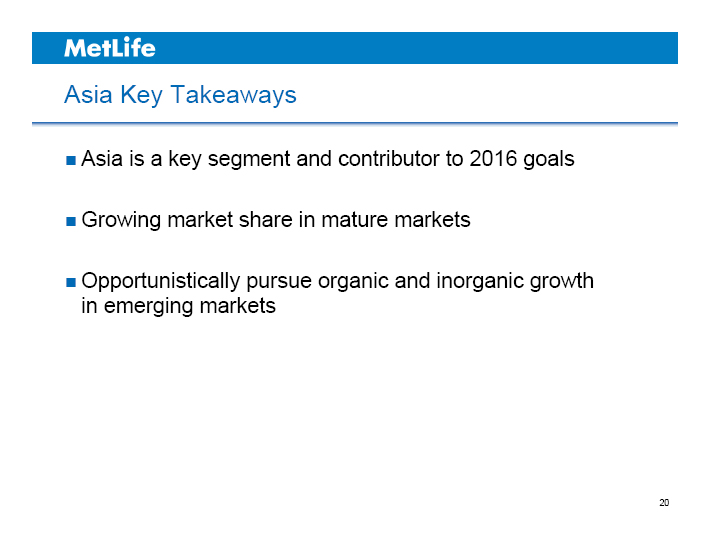
Asia Key Takeaways
Asia is a key segment and contributor to 2016 goals
Growing market share in mature markets
Opportunistically pursue organic and inorganic growth in emerging markets
20
MetLife
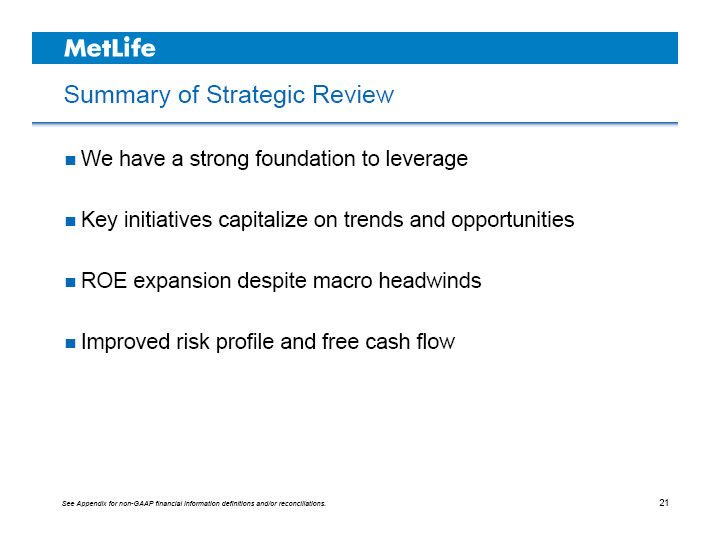
Summary of Strategic Review
We have a strong foundation to leverage
Key initiatives capitalize on trends and opportunities
ROE expansion despite macro headwinds
Improved risk profile and free cash flow
See Appendix for non-GAAP financial information definitions and/or reconciliations.
21

MetLife
MetLife
William J. Wheeler
President
The Americas
INVESTOR DAY 2012
MetLife
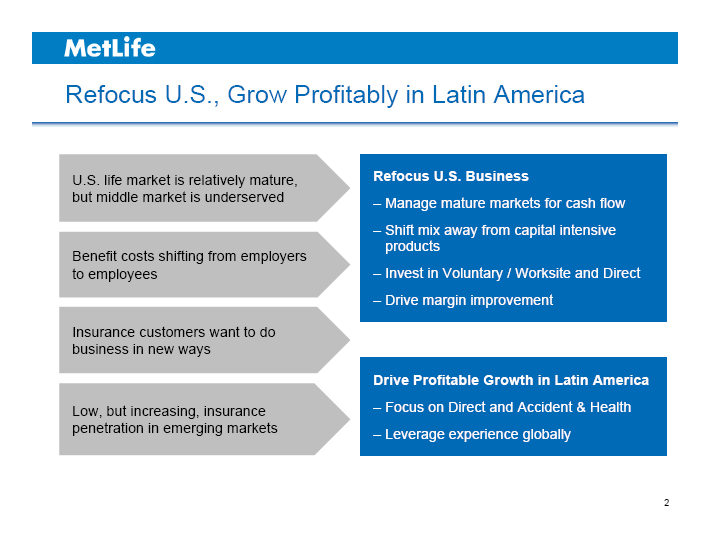
Refocus U.S., Grow Profitably in Latin America
U.S. life market is relatively mature, but middle market is underserved
Benefit costs shifting from employers to employees
Insurance customers want to do business in new ways
Low, but increasing, insurance penetration in emerging markets
Refocus U.S. Business
– Manage mature markets for cash flow
– Shift mix away from capital intensive products
– Invest in Voluntary / Worksite and Direct
– Drive margin improvement
Drive Profitable Growth in Latin America
– Focus on Direct and Accident & Health
– Leverage experience globally
2
MetLife
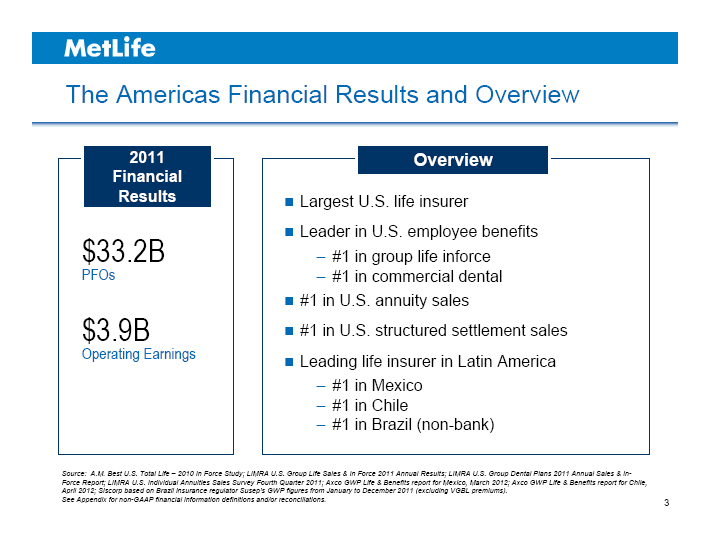
The Americas Financial Results and Overview
2011 Financial Results
$33.2B PFOs
$3.9B Operating Earnings
Overview
Largest U.S. life insurer
Leader in U.S. employee benefits
– #1 in group life inforce
– #1 in commercial dental
#1 in U.S. annuity sales
#1 in U.S. structured settlement sales
Leading life insurer in Latin America
– #1 in Mexico
– #1 in Chile
– #1 in Brazil (non-bank)
Source: A.M. Best U.S. Total Life – 2010 In Force Study; LIMRA U.S. Group Life Sales & In Force 2011 Annual Results; LIMRA U.S. Group Dental Plans 2011 Annual Sales & In-Force Report; LIMRA U.S. Individual Annuities Sales Survey Fourth Quarter 2011; Axco GWP Life & Benefits report for Mexico, March 2012; Axco GWP Life & Benefits report for Chile, April 2012; Siscorp based on Brazil insurance regulator Susep’s GWP figures from January to December 2011 (excluding VGBL premiums).
See Appendix for non-GAAP financial information definitions and/or reconciliations.
3
MetLife
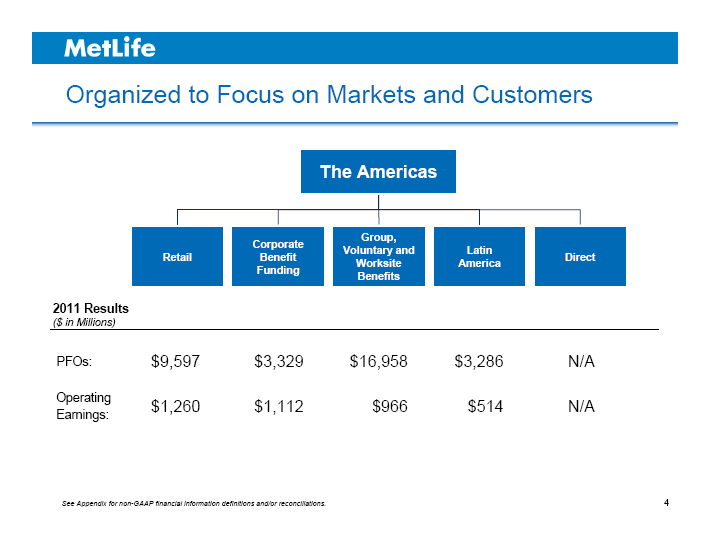
Organized to Focus on Markets and Customers
The Americas
Retail
Corporate Benefit Funding
Group, Voluntary and Worksite Benefits
Latin America
Direct
2011 Results
($ in Millions)
PFOs: $9,597 $3,329 $16,958 $3,286 N/A
Operating Earnings: $1,260 $1,112 $966 $514 N/A
See Appendix for non-GAAP financial information definitions and/or reconciliations.
4
MetLife
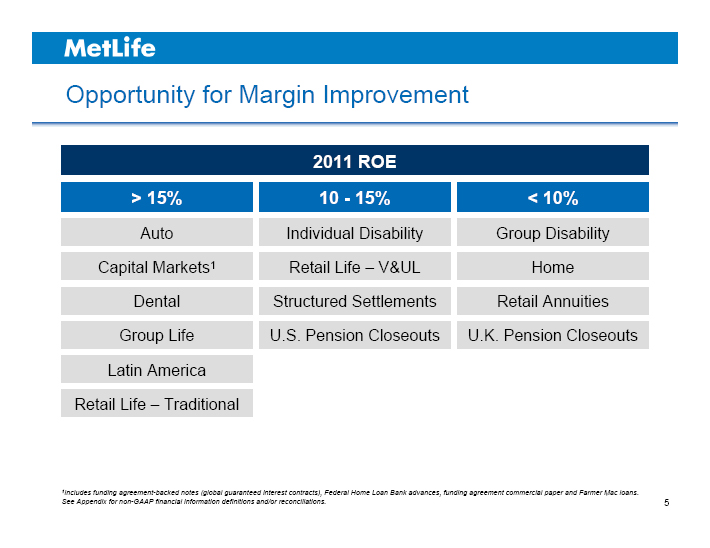
Opportunity for Margin Improvement
2011 ROE
> 15% 10 - 15% < 10%
Auto Individual Disability Group Disability
Capital Markets1 Retail Life – V&UL Home
Dental Structured Settlements Retail Annuities
Group Life U.S. Pension Closeouts U.K. Pension Closeouts
Latin America
Retail Life – Traditional
1Includes funding agreement-backed notes (global guaranteed interest contracts), Federal Home Loan Bank advances, funding agreement commercial paper and Farmer Mac loans.
See Appendix for non-GAAP financial information definitions and/or reconciliations.
5
MetLife
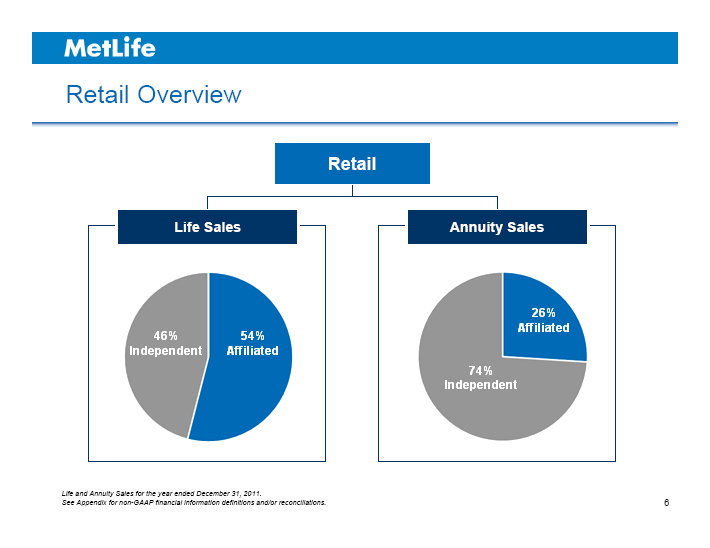
Retail Overview
Retail
Life Sales
46% Independent
54% Affiliated
Annuity Sales
26% Affiliated
74% Independent
Life and Annuity Sales for the year ended December 31, 2011.
See Appendix for non-GAAP financial information definitions and/or reconciliations.
6
MetLife
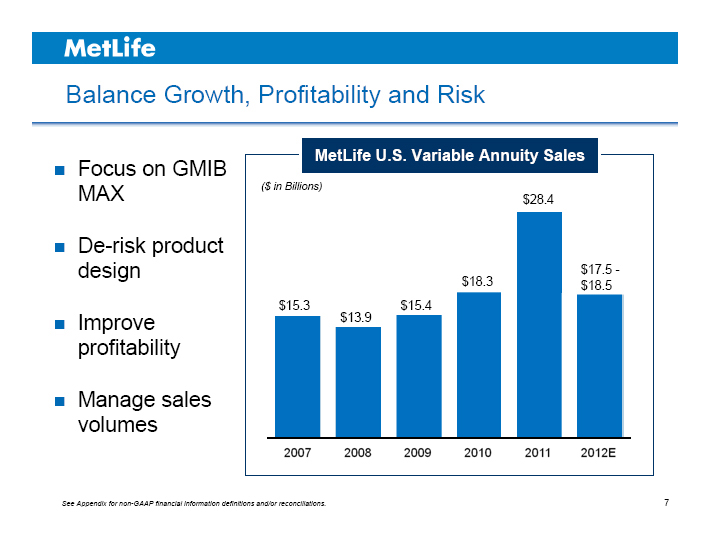
Balance Growth, Profitability and Risk
Focus on GMIB MAX
De-risk product design
Improve profitability
Manage sales volumes
MetLife U.S. Variable Annuity Sales
($ in Billions)
$15.3 $13.9 $15.4 $18.3 $28.4 $17.5 - $18.5
2007 2008 2009 2010 2011 2012E
See Appendix for non-GAAP financial information definitions and/or reconciliations.
7
MetLife
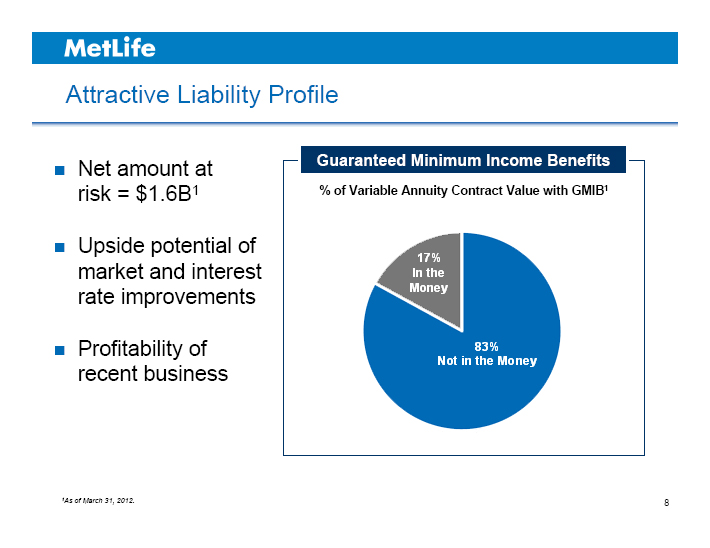
Attractive Liability Profile
Net amount at risk = $1.6B1
Upside potential of market and interest rate improvements
Profitability of recent business
Guaranteed Minimum Income Benefits
% of Variable Annuity Contract Value with GMIB1
17% In the Money
83% Not in the Money
1As of March 31, 2012.
8
MetLife
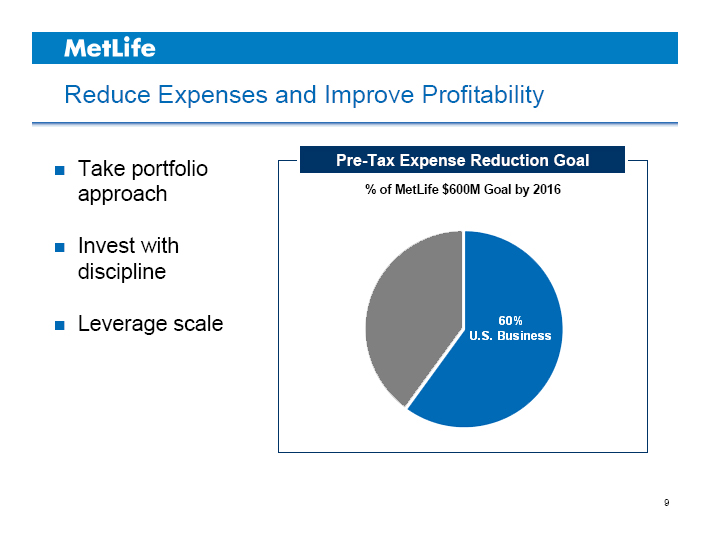
Reduce Expenses and Improve Profitability
Take portfolio approach
Invest with discipline
Leverage scale
Pre-Tax Expense Reduction Goal
% of MetLife $600M Goal by 2016
60% U.S. Business
9
MetLife
Retail: Manage Margins and Capital
Leading franchise
Rebalance risk and growth
Improve profitability and ROE
See Appendix for non-GAAP financial information definitions and/or reconciliations.
10
MetLife
Corporate Benefit Funding Overview
Significant source of operating earnings
Increased focus on pricing and returns
Opportunities across market segments
Corporate Benefit Funding Assets
% of $177B in Total Assets1
Pension Closeouts 22%
Structured Settlements 13%
Stable Value 24%
Capital Markets2 25%
Benefit Funding 16%
1 As of March 31, 2012.
2 Includes funding agreement-backed notes (global guaranteed interest contracts), Federal Home Loan Bank advances, funding agreement commercial paper and Farmer Mac loans.
See Appendix for non-GAAP financial information definitions and/or reconciliations.
11
MetLife
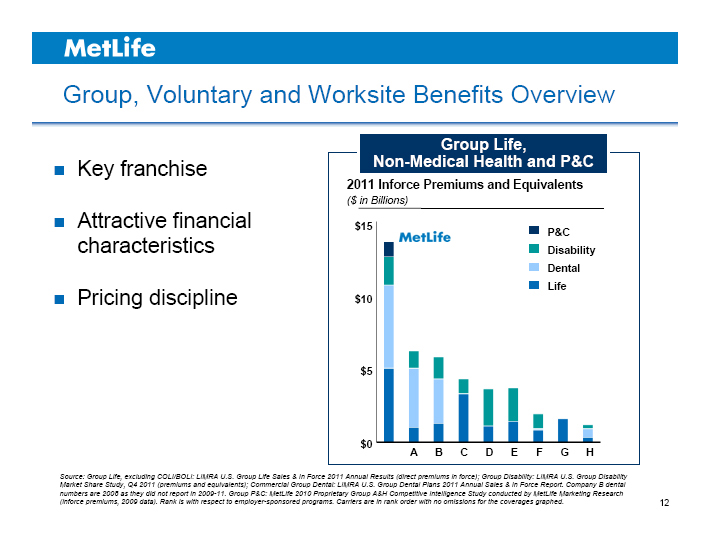
Group, Voluntary and Worksite Benefits Overview
Key franchise
Attractive financial characteristics
Pricing discipline
Group Life,
Non-Medical Health and P&C
2011 Inforce Premiums and Equivalents
($ in Billions)
$15
$10
$5
$0
A B C D E F G H
P&C
Disability
Dental
Life
Source: Group Life, excluding COLI/BOLI: LIMRA U.S. Group Life Sales & In Force 2011 Annual Results (direct premiums in force); Group Disability: LIMRA U.S. Group Disability Market Share Study, Q4 2011 (premiums and equivalents); Commercial Group Dental: LIMRA U.S. Group Dental Plans 2011 Annual Sales & In Force Report. Company B dental numbers are 2008 as they did not report in 2009-11. Group P&C: MetLife 2010 Proprietary Group A&H Competitive Intelligence Study conducted by MetLife Marketing Research (inforce premiums, 2009 data). Rank is with respect to employer-sponsored programs. Carriers are in rank order with no omissions for the coverages graphed.
12
MetLife
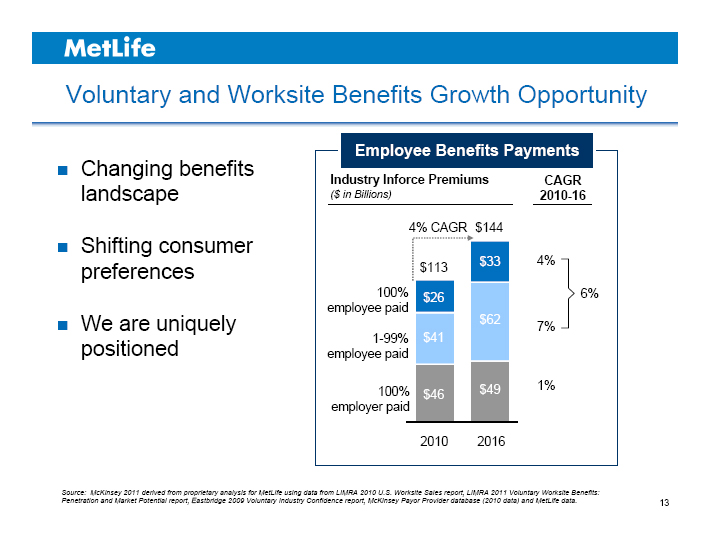
Voluntary and Worksite Benefits Growth Opportunity
Changing benefits landscape
Shifting consumer preferences
We are uniquely positioned
Employee Benefits Payments
Industry Inforce Premiums
($ in Billions)
4% CAGR $144
$113 $33
100% employee paid $26 $62
1-99% employee paid $41
100% employer paid $46 $49
2010 2016
CAGR
2010-16
4%
7%
1%
6%
Source: McKinsey 2011 derived from proprietary analysis for MetLife using data from LIMRA 2010 U.S. Worksite Sales report, LIMRA 2011 Voluntary Worksite Benefits:
Penetration and Market Potential report, Eastbridge 2009 Voluntary Industry Confidence report, McKinsey Payor Provider database (2010 data) and MetLife data.
13
MetLife
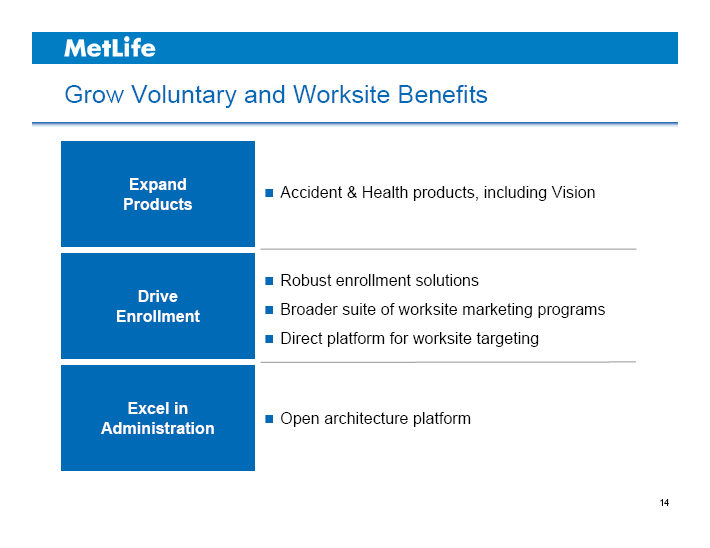
Grow Voluntary and Worksite Benefits
Expand Products
Accident & Health products, including Vision
Drive Enrollment
Robust enrollment solutions
Broader suite of worksite marketing programs
Direct platform for worksite targeting
Excel in Administration
Open architecture platform
14
MetLife
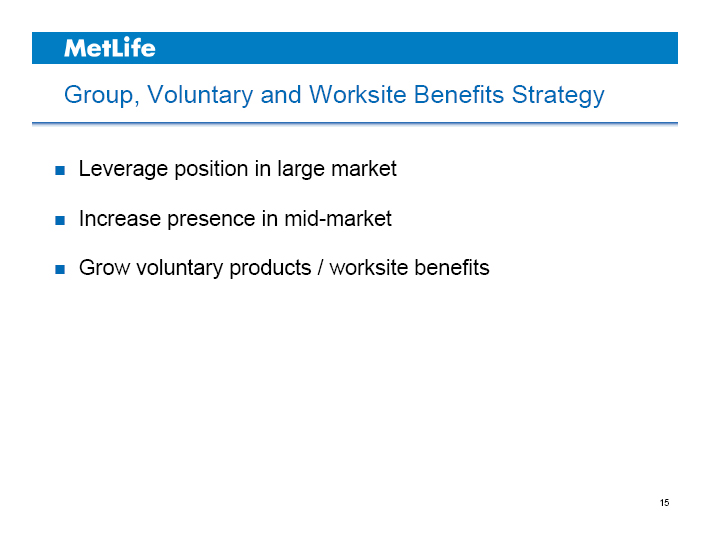
Group, Voluntary and Worksite Benefits Strategy
Leverage position in large market
Increase presence in mid-market
Grow voluntary products / worksite benefits
15
MetLife
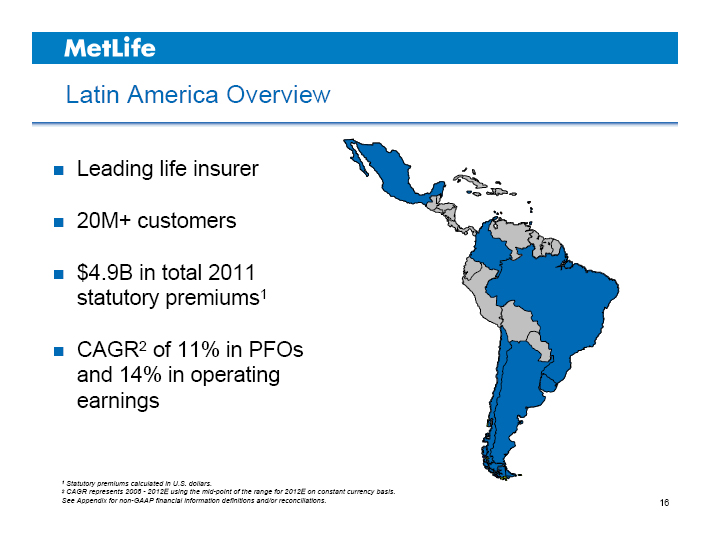
Latin America Overview
Leading life insurer
20M+ customers
$4.9B in total 2011 statutory premiums1
CAGR2 of 11% in PFOs and 14% in operating earnings
1 Statutory premiums calculated in U.S. dollars.
2 CAGR represents 2008 - 2012E using the mid-point of the range for 2012E on constant currency basis.
See Appendix for non-GAAP financial information definitions and/or reconciliations.
16
MetLife
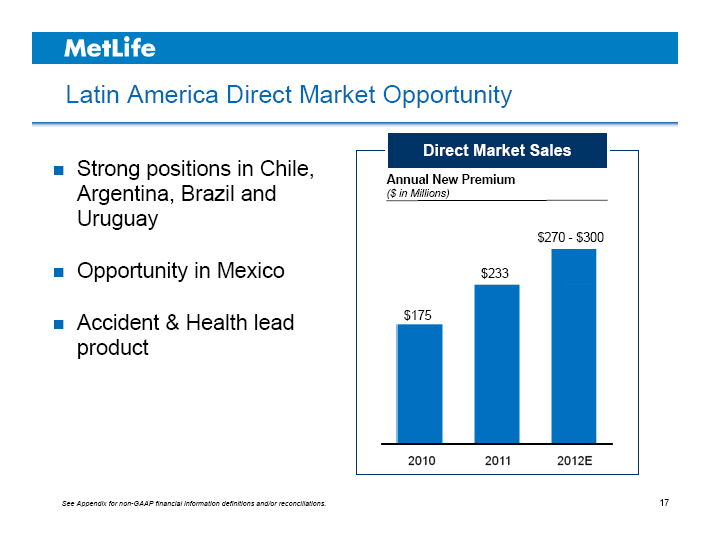
Latin America Direct Market Opportunity
Strong positions in Chile, Argentina, Brazil and Uruguay
Opportunity in Mexico
Accident & Health lead product
Direct Market Sales
Annual New Premium
($ in Millions)
$175 $233 $270 - $300
2010 2011 2012E
See Appendix for non-GAAP financial information definitions and/or reconciliations.
17
MetLife
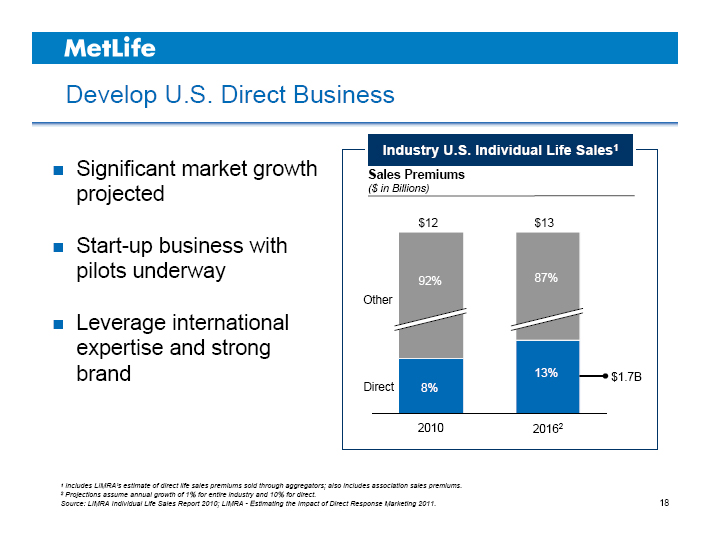
Develop U.S. Direct Business
Significant market growth projected
Start-up business with pilots underway
Leverage international expertise and strong brand
Industry U.S. Individual Life Sales1
Sales Premiums
($ in Billions)
$12 $13
Other 92% 87%
Direct 8% 13% $1.7B
2010 20162
1 Includes LIMRA’s estimate of direct life sales premiums sold through aggregators; also includes association sales premiums.
2 Projections assume annual growth of 1% for entire industry and 10% for direct.
Source: LIMRA Individual Life Sales Report 2010; LIMRA - Estimating the Impact of Direct Response Marketing 2011.
18
MetLife
Key Takeaways
Focus more energy and resources on growth areas while managing mature businesses for cash flow
Improve margins through expense reductions in mature businesses
Reduce market-based risk, increase protection risk
Drive operating earnings growth and meaningful improvement in ROE
See Appendix for non-GAAP financial information definitions and/or reconciliations.
19

MetLife
MetLife © PNTS
Maria R. Morris
Executive Vice President Global Employee Benefits
INVESTOR DAY 2012
MetLife
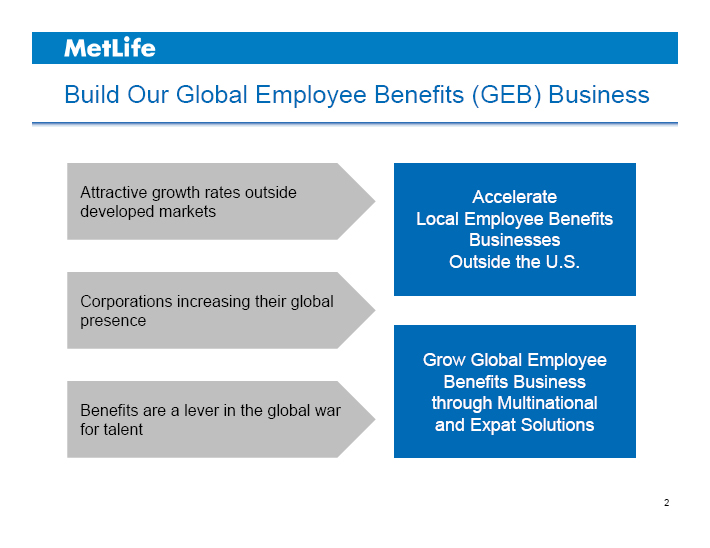
Build Our Global Employee Benefits (GEB) Business
Attractive growth rates outside developed markets
Corporations increasing their global presence
Benefits are a lever in the global war for talent
Accelerate Local Employee Benefits Businesses Outside the U.S.
Grow Global Employee Benefits Business through Multinational and Expat Solutions
2
MetLife
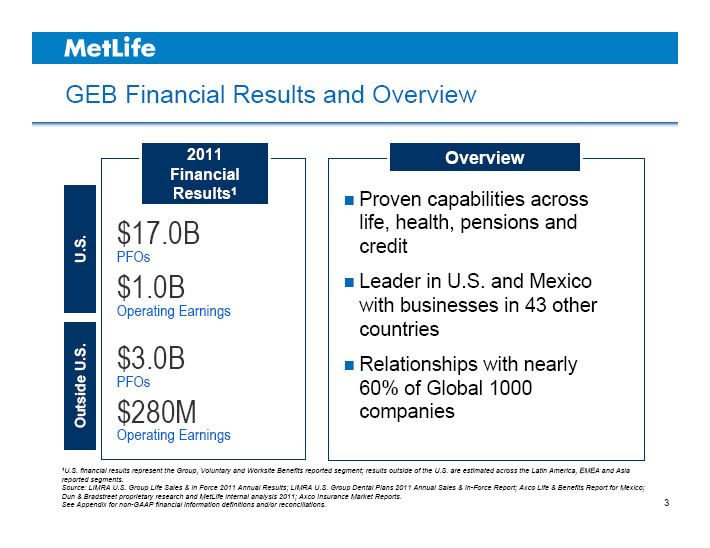
GEB Financial Results and Overview
U.S.
Outside U.S.
2011 Financial Results1
$17.0B
PFOs
$1.0B
Operating Earnings
$3.0B
PFOs
$280M
Operating Earnings
Overview
Proven capabilities across life, health, pensions and credit
Leader in U.S. and Mexico with businesses in 43 other countries
Relationships with nearly
60% of Global 1000 companies
1U.S. financial results represent the Group, Voluntary and Worksite Benefits reported segment; results outside of the U.S. are estimated across the Latin America, EMEA and Asia reported segments.
Source: LIMRA U.S. Group Life Sales & In Force 2011 Annual Results; LIMRA U.S. Group Dental Plans 2011 Annual Sales & In-Force Report; Axco Life & Benefits Report for Mexico; Dun & Bradstreet proprietary research and MetLife internal analysis 2011; Axco Insurance Market Reports.
See Appendix for non-GAAP financial information definitions and/or reconciliations. 3
MetLife
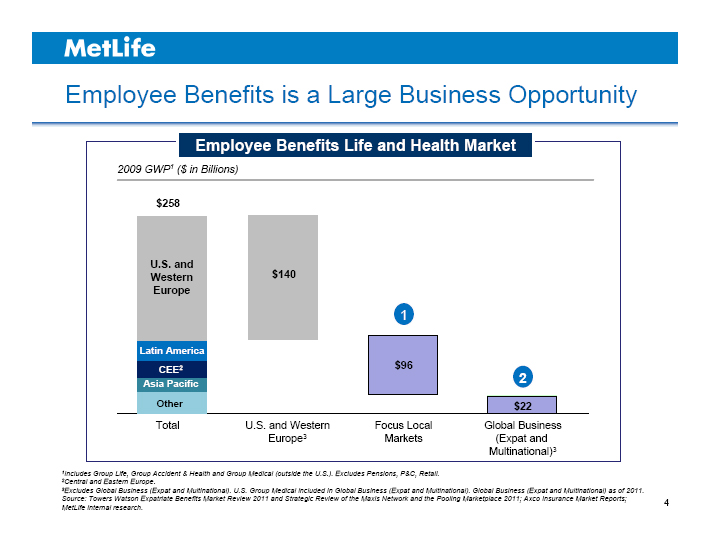
Employee Benefits is a Large Business Opportunity
Employee Benefits Life and Health Market
2009 GWP1 ($ in Billions)
$258
U.S. and Western Europe
Latin America CEE2 Asia Pacific Other
Total
$140
U.S. and Western Europe3
1 $96
Focus Local Markets
2 $22
Global Business (Expat and Multinational)3
1Includes Group Life, Group Accident & Health and Group Medical (outside the U.S.). Excludes Pensions, P&C, Retail.
2Central and Eastern Europe.
3Excludes Global Business (Expat and Multinational). U.S. Group Medical included in Global Business (Expat and Multinational). Global Business (Expat and Multinational) as of 2011.
Source: Towers Watson Expatriate Benefits Market Review 2011 and Strategic Review of the Maxis Network and the Pooling Marketplace 2011; Axco Insurance Market Reports; MetLife internal research.
4
MetLife
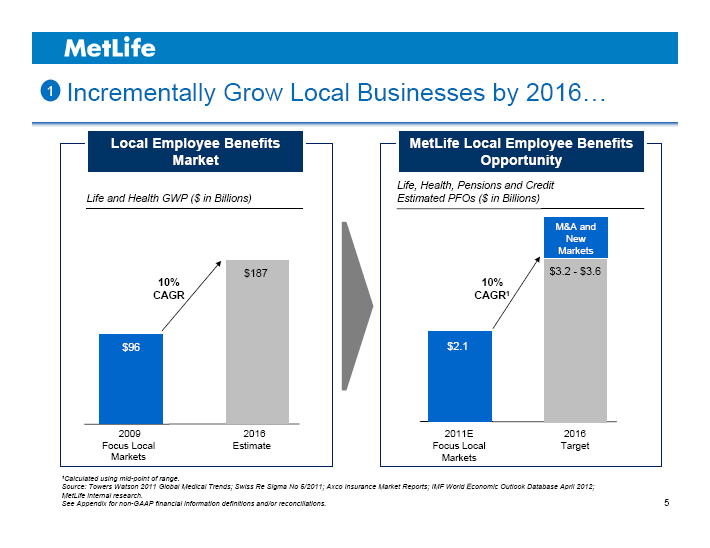
1 Incrementally Grow Local Businesses by 2016…
Local Employee Benefits Market
Life and Health GWP ($ in Billions)
$187
10%
CAGR
$96
2009
Focus Local Markets
2016 Estimate
MetLife Local Employee Benefits Opportunity
Life, Health, Pensions and Credit Estimated PFOs ($ in Billions)
M&A and New Markets
$3.2 - $3.6
10% CAGR1
$2.1
2011E Focus Local Markets
2016 Target
1Calculated using mid-point of range.
Source: Towers Watson 2011 Global Medical Trends; Swiss Re Sigma No 5/2011; Axco Insurance Market Reports; IMF World Economic Outlook Database April 2012;
MetLife internal research.
See Appendix for non-GAAP financial information definitions and/or reconciliations.
5
MetLife
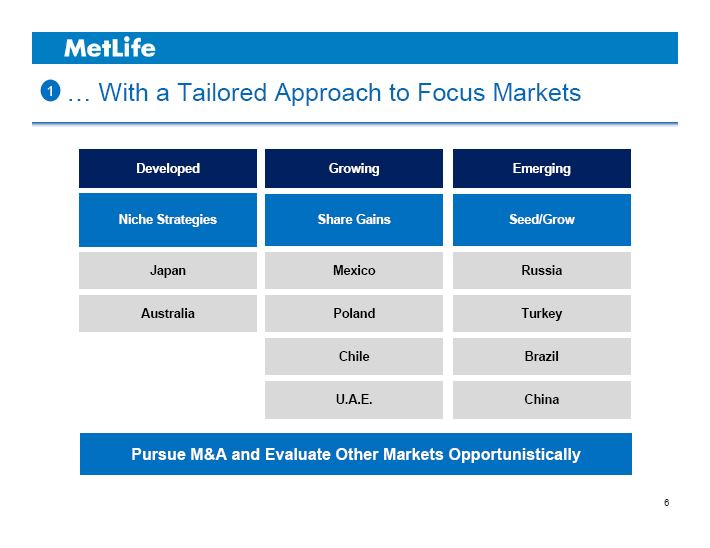
1 … With a Tailored Approach to Focus Markets
Developed Niche Strategies Japan Australia
Growing Share Gains Mexico Poland Chile U.A.E.
Emerging Seed/Grow Russia Turkey Brazil China
Pursue M&A and Evaluate Other Markets Opportunistically
6
MetLife
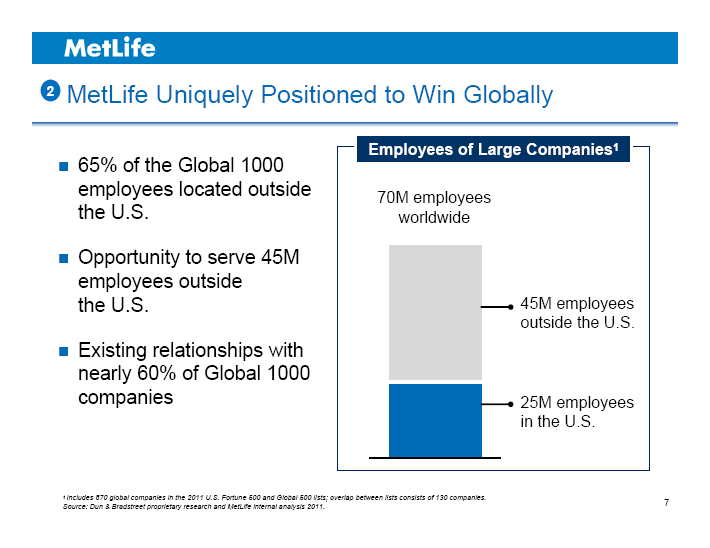
2 MetLife Uniquely Positioned to Win Globally
65% of the Global 1000 employees located outside the U.S.
Opportunity to serve 45M employees outside the U.S.
Existing relationships with nearly 60% of Global 1000 companies
Employees of Large Companies1
70M employees worldwide
45M employees outside the U.S.
25M employees in the U.S.
1 Includes 870 global companies in the 2011 U.S. Fortune 500 and Global 500 lists; overlap between lists consists of 130 companies.
Source: Dun & Bradstreet proprietary research and MetLife internal analysis 2011. 7
MetLife
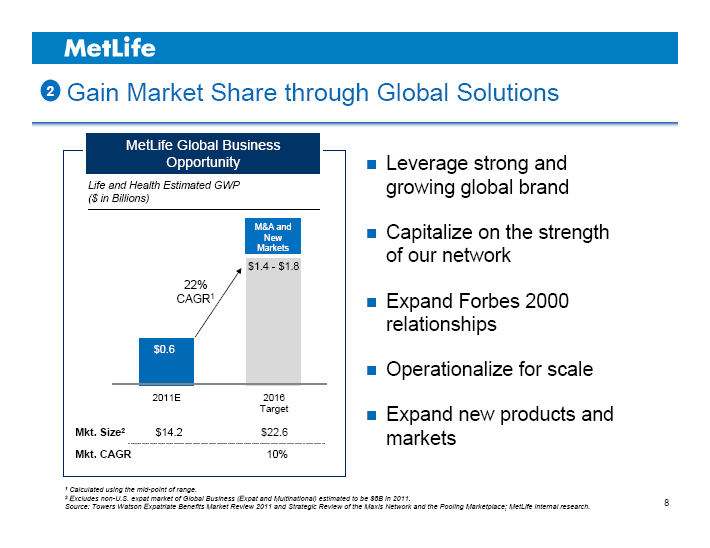
2 Gain Market Share through Global Solutions
MetLife Global Business Opportunity
Life and Health Estimated GWP ($ in Billions)
M&A and New Markets
$1.4 - $1.8
22% CAGR1
$0.6
2011E 2016 Target
Mkt. Size2 $14.2 $22.6
Mkt. CAGR 10%
Leverage strong and growing global brand
Capitalize on the strength of our network
Expand Forbes 2000 relationships
Operationalize for scale
Expand new products and markets
1 Calculated using the mid-point of range.
2 Excludes non-U.S. expat market of Global Business (Expat and Multinational) estimated to be $8B in 2011.
Source: Towers Watson Expatriate Benefits Market Review 2011 and Strategic Review of the Maxis Network and the Pooling Marketplace; MetLife internal research. 8
MetLife
Key Takeaways
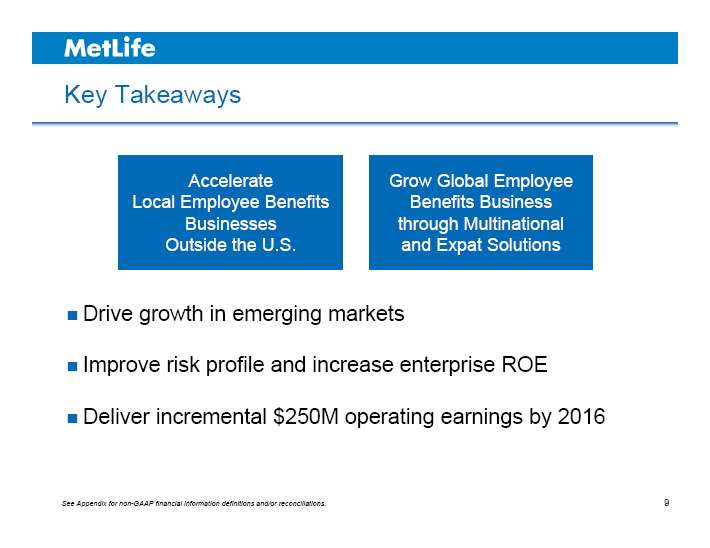
Accelerate Local Employee Benefits Businesses Outside the U.S.
Grow Global Employee Benefits Business through Multinational and Expat Solutions
Drive growth in emerging markets
Improve risk profile and increase enterprise ROE
Deliver incremental $250M operating earnings by 2016
See Appendix for non-GAAP financial information definitions and/or reconciliations. 9

MetLife
MetLife © PNTS
Michel Khalaf
President
Europe, Middle East and Africa
INVESTOR DAY 2012
MetLife
Agenda
Europe, Middle East and Africa (EMEA)
Emerging Markets Strategy
2
MetLife
Succeeding in Diverse Markets
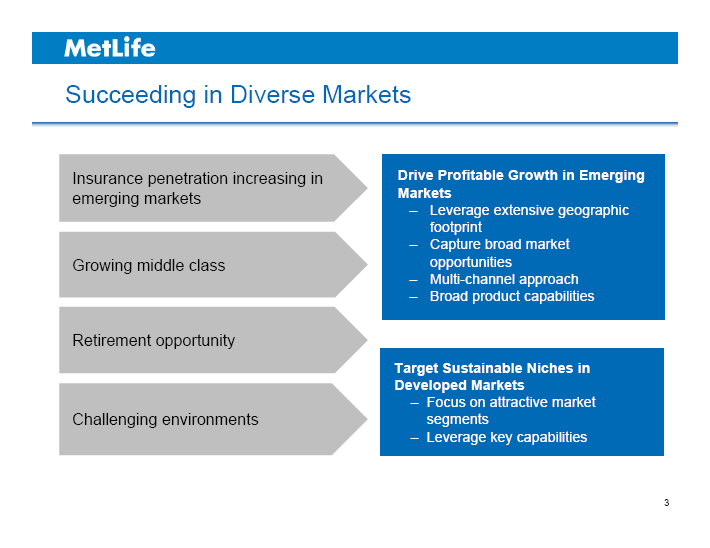
Insurance penetration increasing in emerging markets
Growing middle class
Retirement opportunity
Challenging environments
Drive Profitable Growth in Emerging Markets
– Leverage extensive geographic footprint
– Capture broad market opportunities
– Multi-channel approach
– Broad product capabilities
Target Sustainable Niches in Developed Markets
– Focus on attractive market segments
– Leverage key capabilities
3
MetLife
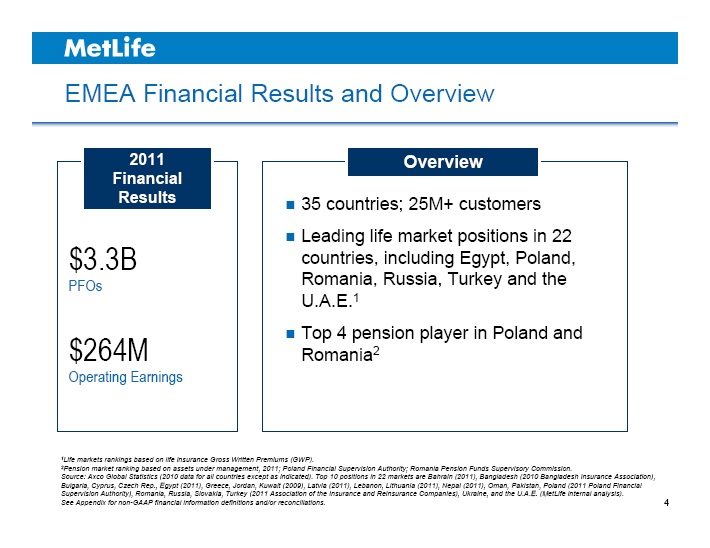
EMEA Financial Results and Overview
2011 Financial Results
$3.3B PFOs
$264M Operating Earnings
Overview
35 countries; 25M+ customers
Leading life market positions in 22 countries, including Egypt, Poland, Romania, Russia, Turkey and the U.A.E.1
Top 4 pension player in Poland and Romania2
1Life markets rankings based on life insurance Gross Written Premiums (GWP).
2Pension market ranking based on assets under management, 2011; Poland Financial Supervision Authority; Romania Pension Funds Supervisory Commission.
Source: Axco Global Statistics (2010 data for all countries except as indicated). Top 10 positions in 22 markets are Bahrain (2011), Bangladesh (2010 Bangladesh Insurance Association), Bulgaria, Cyprus, Czech Rep., Egypt (2011), Greece, Jordan, Kuwait (2009), Latvia (2011), Lebanon, Lithuania (2011), Nepal (2011), Oman, Pakistan, Poland (2011 Poland Financial Supervision Authority), Romania, Russia, Slovakia, Turkey (2011 Association of the Insurance and Reinsurance Companies), Ukraine, and the U.A.E. (MetLife internal analysis).
See Appendix for non-GAAP financial information definitions and/or reconciliations. 4
MetLife
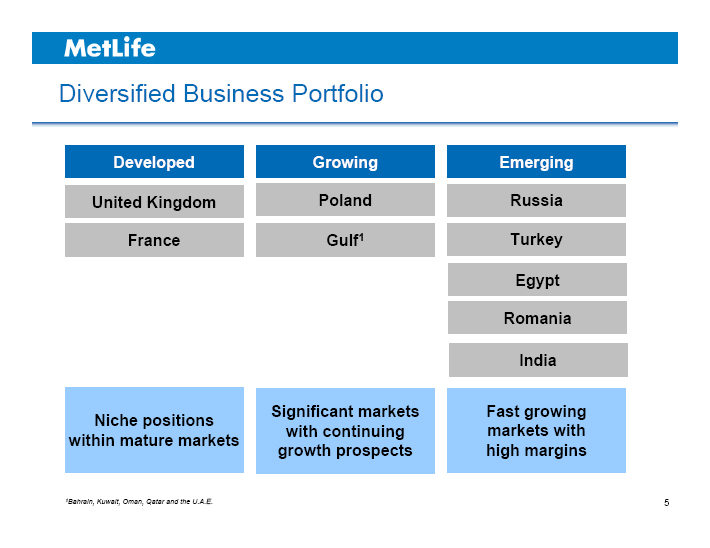
Diversified Business Portfolio
Developed United Kingdom France Niche positions within mature markets
Growing Poland Gulf1 Significant markets with continuing growth prospects
Emerging Russia Turkey Egypt Romania India Fast growing markets with high margins
1Bahrain, Kuwait, Oman, Qatar and the U.A.E. 5
MetLife
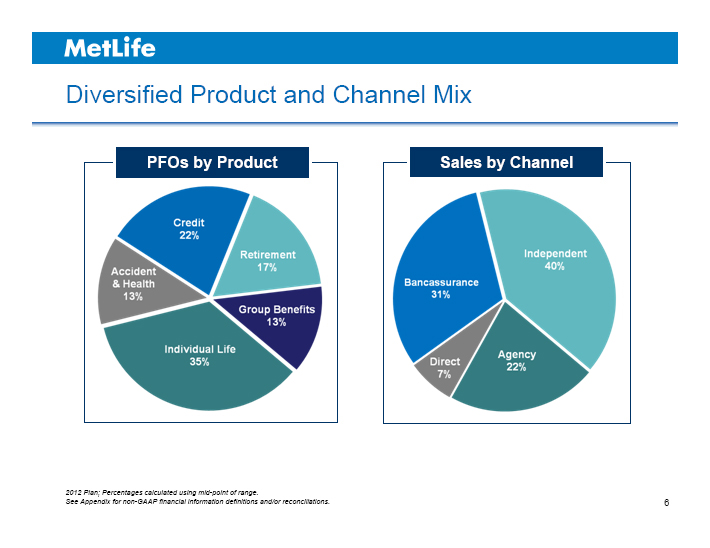
Diversified Product and Channel Mix
PFOs by Product
Accident & Health 13%
Credit 22%
Retirement 17%
Group Benefits 13%
Individual Life 35%
Sales by Channel
Bancassurance 31%
Independent 40%
Agency 22%
Direct 7%
2012 Plan; Percentages calculated using mid-point of range.
See Appendix for non-GAAP financial information definitions and/or reconciliations.
6
MetLife
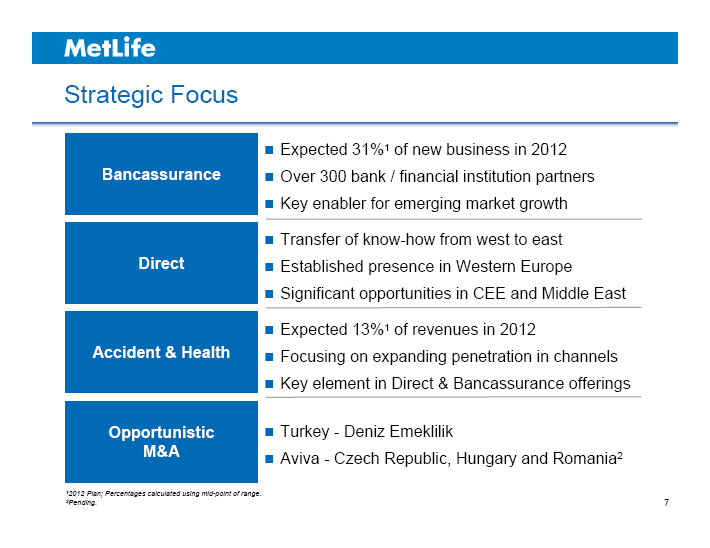
Strategic Focus
Bancassurance
Expected 31%1 of new business in 2012
Over 300 bank / financial institution partners
Key enabler for emerging market growth
Direct
Transfer of know-how from west to east
Established presence in Western Europe
Significant opportunities in CEE and Middle East
Accident & Health
Expected 13%1 of revenues in 2012
Focusing on expanding penetration in channels
Key element in Direct & Bancassurance offerings
Opportunistic M&A
Turkey - Deniz Emeklilik
Aviva - Czech Republic, Hungary and Romania2
12012 Plan; Percentages calculated using mid-point of range.
2Pending.
7
MetLife
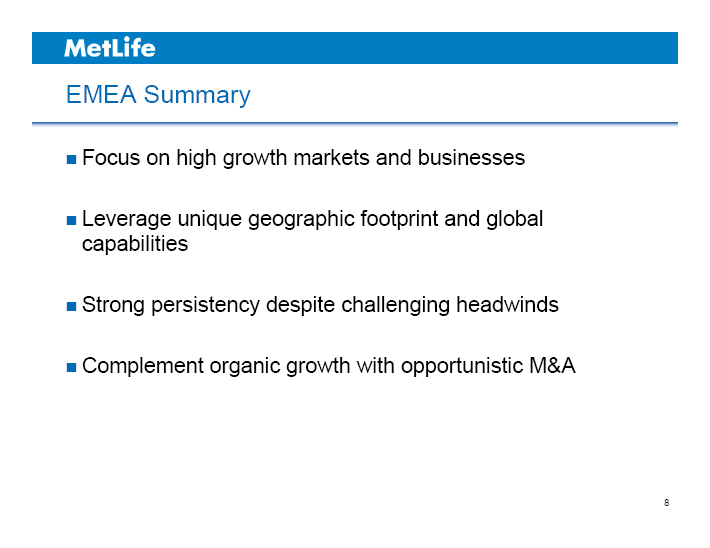
EMEA Summary
Focus on high growth markets and businesses
Leverage unique geographic footprint and global capabilities
Strong persistency despite challenging headwinds
Complement organic growth with opportunistic M&A
8
MetLife © PNTS
Growing Our Emerging Markets Presence
MetLife
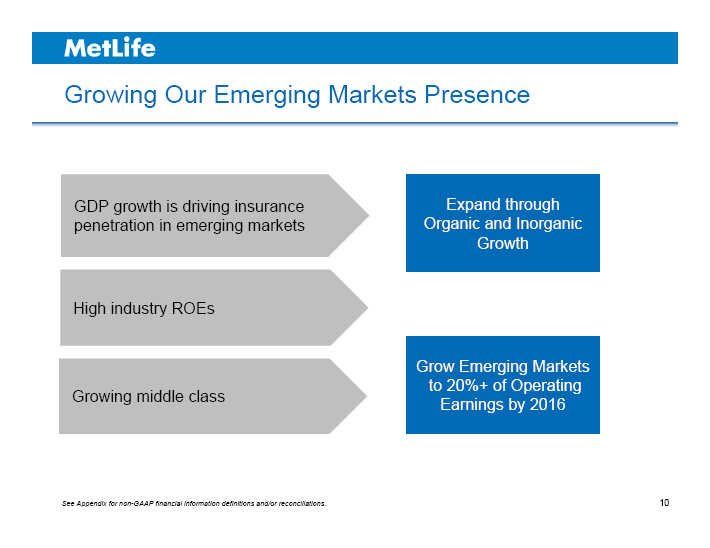
Growing Our Emerging Markets Presence
GDP growth is driving insurance penetration in emerging markets
High industry ROEs
Growing middle class
Expand through Organic and Inorganic Growth
Grow Emerging Markets to 20%+ of Operating Earnings by 2016
See Appendix for non-GAAP financial information definitions and/or reconciliations. 10
MetLife
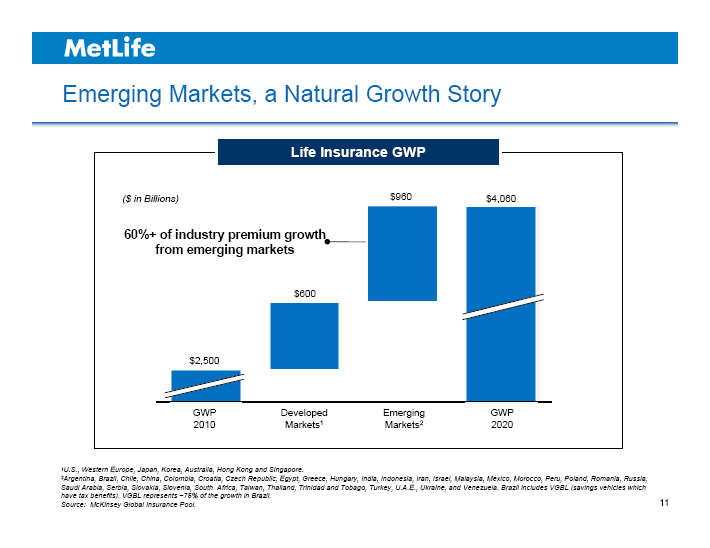
Emerging Markets, a Natural Growth Story
Life Insurance GWP
($ in Billions) $960 $4,060
60%+ of industry premium growth from emerging markets
$600
$2,500
GWP 2010
Developed Markets1
Emerging Markets2
GWP 2020
1U.S., Western Europe, Japan, Korea, Australia, Hong Kong and Singapore.
2Argentina, Brazil, Chile, China, Colombia, Croatia, Czech Republic, Egypt, Greece, Hungary, India, Indonesia, Iran, Israel, Malaysia, Mexico, Morocco, Peru, Poland, Romania, Russia, Saudi Arabia, Serbia, Slovakia, Slovenia, South Africa, Taiwan, Thailand, Trinidad and Tobago, Turkey, U.A.E., Ukraine, and Venezuela. Brazil includes VGBL (savings vehicles which have tax benefits). VGBL represents ~75% of the growth in Brazil.
Source: McKinsey Global Insurance Pool. 11
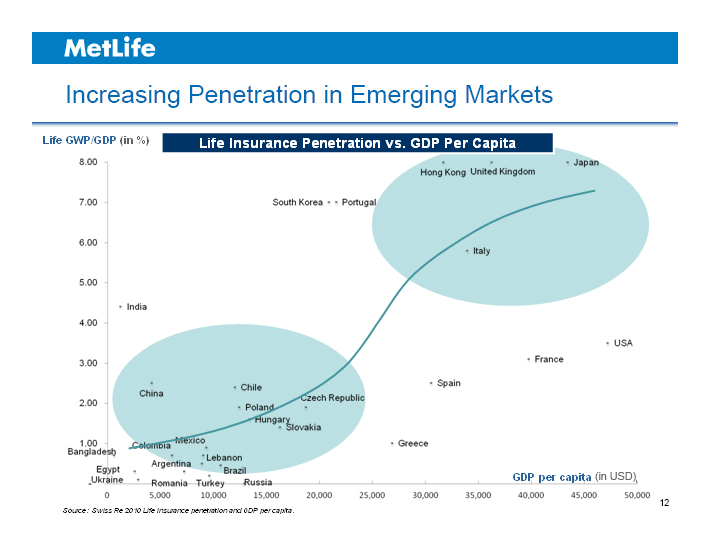
MetLife
Increasing Penetration in Emerging Markets
Life GWP/GDP (in %) Life Insurance Penetration vs. GDP Per Capita
8.00 7.00 6.00 5.00 4.00 3.00 2.00 1.00
Bangladesh
Egypt
Ukraine
India
China
Colombia
Argentina
Romania
Mexico
Lebanon
Brazil
Turkey
Russia
Chile
Poland
Hungary
Slovakia
Czech Republic
South Korea Portugal
Spain
Greece
Hong Kong United Kingdom
Japan Italy
France USA
GDP per capita (in USD)
0 5,000 10,000 15,000 20,000 25,000 30,000 35,000 40,000 45,000 50,000
Source: Swiss Re 2010 Life insurance and GDP per capita. 12
MetLife
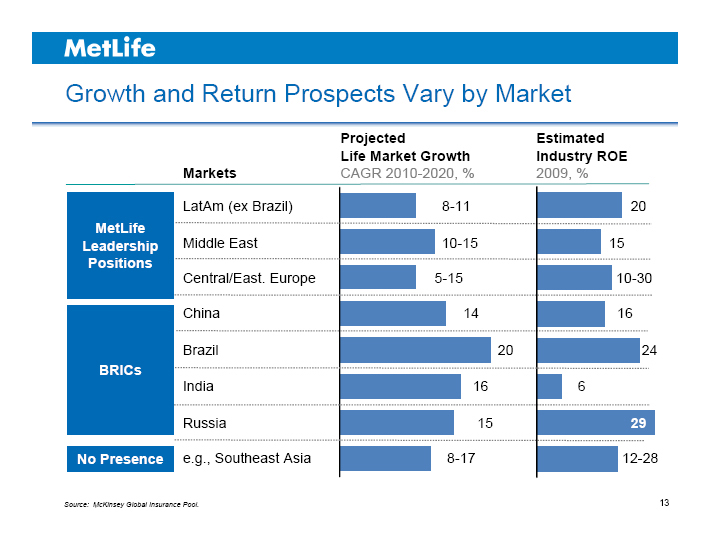
Growth and Return Prospects Vary by Market
MetLife Leadership Positions
BRICs
No Presence
Markets
LatAm (ex Brazil) Middle East Central/East. Europe China Brazil India Russia e.g., Southeast Asia
Projected Life Market Growth
CAGR 2010-2020, %
8-11 10-15 5-15 14 20 16 15 8-17
Estimated Industry ROE 2009, %
20 15 10-30 16 24 6 29 12-28
Source: McKinsey Global Insurance Pool. 13
MetLife
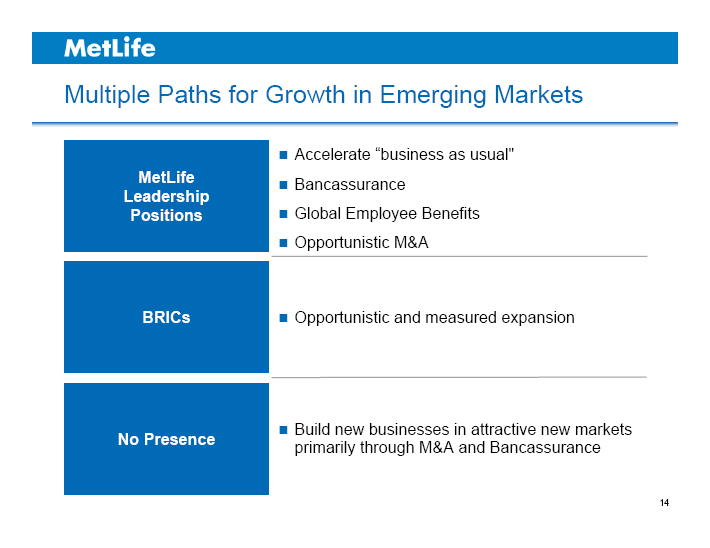
Multiple Paths for Growth in Emerging Markets
MetLife Leadership Positions
Accelerate “business as usual” Bancassurance Global Employee Benefits Opportunistic M&A
BRICs
Opportunistic and measured expansion
No Presence
Build new businesses in attractive new markets primarily through M&A and Bancassurance
14
MetLife
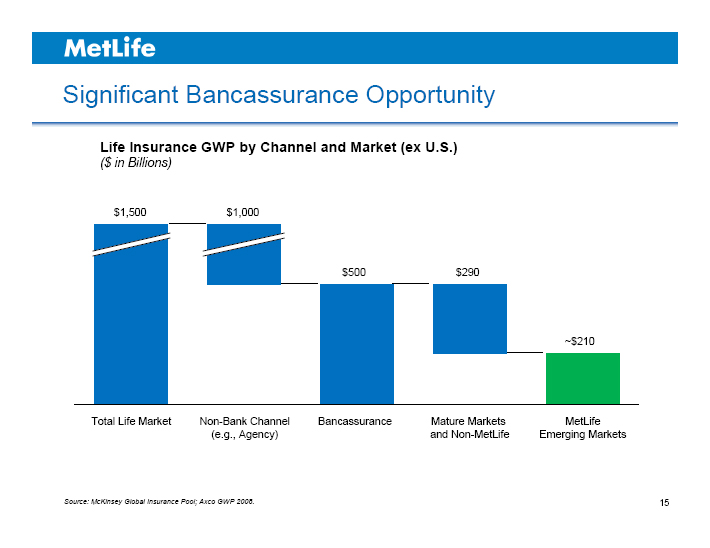
Significant Bancassurance Opportunity
Life Insurance GWP by Channel and Market (ex U.S.)
($ in Billions)
$1,500
Total Life Market
$1,000
Non-Bank Channel (e.g., Agency)
$500
Bancassurance
$290
Mature Markets and Non-MetLife
~$210
MetLife Emerging Markets
Source: McKinsey Global Insurance Pool; Axco GWP 2008. 15
MetLife
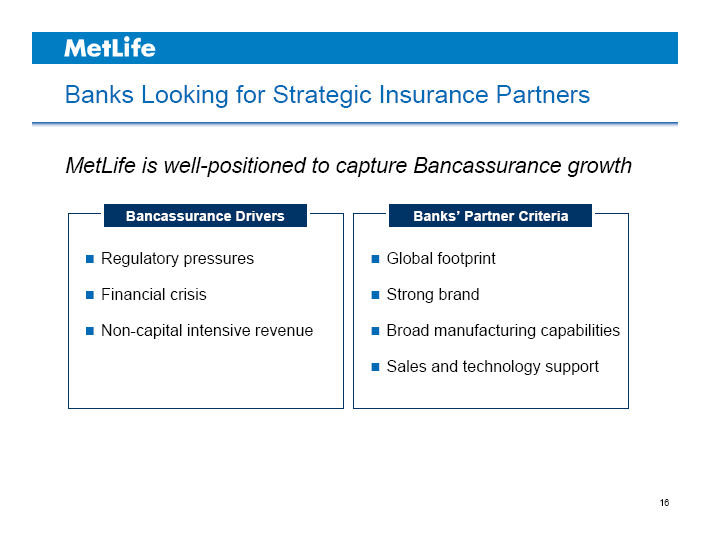
Banks Looking for Strategic Insurance Partners
MetLife is well-positioned to capture Bancassurance growth
Bancassurance Drivers
Regulatory pressures
Financial crisis
Non-capital intensive revenue
Banks’ Partner Criteria
Global footprint
Strong brand
Broad manufacturing capabilities
Sales and technology support
16
MetLife
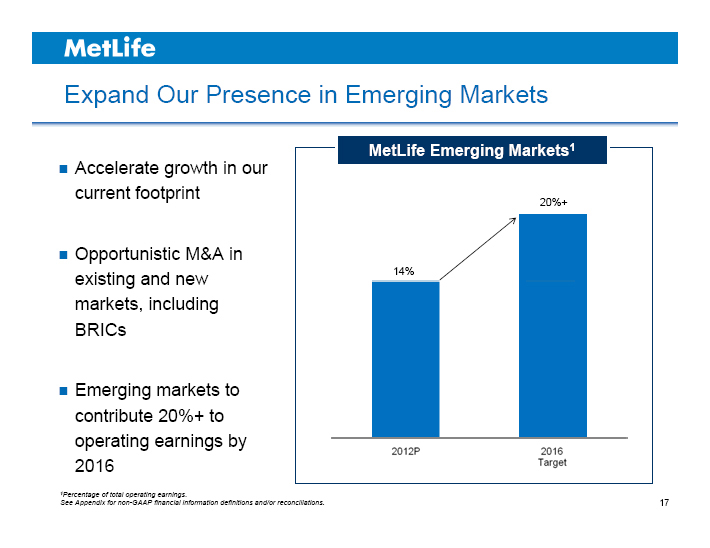
Expand Our Presence in Emerging Markets
Accelerate growth in our current footprint
Opportunistic M&A in existing and new markets, including BRICs
Emerging markets to contribute 20%+ to operating earnings by 2016
MetLife Emerging Markets1
14%
20%+
2012P
2016 Target
1Percentage of total operating earnings.
See Appendix for non-GAAP financial information definitions and/or reconciliations.
17
MetLife
MetLife
© PNTS
Steven A. Kandarian
Chairman, President & Chief Executive Officer
INVESTOR DAY 2012

MetLife
Strategy to Become a World-Class Company
Refocus the U.S. Business
Build Global Employee Benefits Business
One MetLife
Global * World-Class * Scale
Grow Emerging Markets
Drive Toward Customer Centricity and a Global Brand
2
MetLife
What Sets Us Apart
Our global platform
Leader in U.S. Employee Benefits
Proven risk management
Strong and growing global brand
3
MetLife
MetLife in 2016
Better positioned to meet customer needs
Higher ROE driven by underlying operating earnings growth, despite macro headwinds
20%+ of operating earnings from emerging markets
Sustainable competitive advantage through global platform and scale
Improved risk profile and free cash flow
See Appendix for non-GAAP financial information definitions and/or reconciliations. 4

MetLife
MetLife
© PNTS
Appendix
INVESTOR DAY 2012

MetLife
Explanatory Note on Non-GAAP Financial Information
All references in these presentations (except in this Explanatory Note on Non-GAAP Financial Information slide) to operating earnings, premiums, fees and other revenues and return on equity, should be read as operating earnings available to common shareholders, premiums, fees and other revenues (operating) and operating return on MetLife, Inc.’s common equity, excluding AOCI, respectively.
Operating earnings is the measure of segment profit or loss that MetLife uses to evaluate segment performance and allocate resources. Consistent with accounting principles generally accepted in the United States of America (“GAAP”) accounting guidance for segment reporting, operating earnings is MetLife’s measure of segment performance. Operating earnings is also a measure by which MetLife senior management’s and many other employees’ performance is evaluated for the purposes of determining their compensation under applicable compensation plans.
Operating earnings is defined as operating revenues less operating expenses, both net of income tax. Operating earnings available to common shareholders is defined as operating earnings less preferred stock dividends.
Operating revenues and operating expenses exclude results of discontinued operations and other businesses that have been or will be sold or exited by MetLife, Inc. (“Divested Businesses”). Operating revenues also excludes net investment gains (losses) (“NIGL”) and net derivative gains (losses) (“NDGL”).
The following additional adjustments are made to GAAP revenues, in the line items indicated, in calculating operating revenues:
• Universal life and investment-type product policy fees excludes the amortization of unearned revenue related to NIGL and NDGL and certain variable annuity guaranteed minimum income benefits (“GMIB”) fees (“GMIB Fees”);
• Net investment income: (i) includes amounts for scheduled periodic settlement payments and amortization of premium on derivatives that are hedges of investments but do not qualify for hedge accounting treatment, (ii) includes income from discontinued real estate operations, (iii) excludes post-tax operating earnings adjustments relating to insurance joint ventures accounted for under the equity method, (iv) excludes certain amounts related to contractholder-directed unit-linked investments, and (v) excludes certain amounts related to securitization entities that are variable interest entities (“VIEs”) consolidated under GAAP; and
• Other revenues are adjusted for settlements of foreign currency earnings hedges.
2

MetLife
Explanatory Note on Non-GAAP Financial Information (Continued)
The following additional adjustments are made to GAAP expenses, in the line items indicated, in calculating operating expenses:
• Policyholder benefits and claims and policyholder dividends excludes: (i) changes in the policyholder dividend obligation related to NIGL and NDGL, (ii) inflation-indexed benefit adjustments associated with contracts backed by inflation-indexed investments and amounts associated with periodic crediting rate adjustments based on the total return of a contractually referenced pool of assets, (iii) benefits and hedging costs related to GMIBs (“GMIB Costs”), and (iv) market value adjustments associated with surrenders or terminations of contracts (“Market Value Adjustments”);
• Interest credited to policyholder account balances includes adjustments for scheduled periodic settlement payments and amortization of premium on derivatives that are hedges of policyholder account balances but do not qualify for hedge accounting treatment and excludes amounts related to net investment income earned on contractholder-directed unit-linked investments;
• Amortization of deferred policy acquisition costs (“DAC”) and value of business acquired (“VOBA”) excludes amounts related to: (i) NIGL and NDGL, (ii) GMIB Fees and GMIB Costs, and (iii) Market Value Adjustments;
• Amortization of negative VOBA excludes amounts related to Market Value Adjustments;
• Interest expense on debt excludes certain amounts related to securitization entities that are VIEs consolidated under GAAP; and
• Other expenses excludes costs related to: (i) noncontrolling interests, (ii) implementation of new insurance regulatory requirements, and (iii) acquisition and integration costs.
Operating return on MetLife, Inc. common equity is defined as operating earnings available to common shareholders divided by average GAAP common equity.
MetLife believes the presentation of operating earnings and operating earnings available to common shareholders as MetLife measures it for management purposes enhances the understanding of the company’s performance by highlighting the results of operations and the underlying profitability drivers of the business. Operating revenues, operating expenses, operating earnings, operating earnings available to common shareholders, operating earnings available to common shareholders per diluted common share, operating return on MetLife, Inc.’s common equity and operating return on MetLife, Inc.’s common equity, excluding AOCI, should not be viewed as substitutes for the following financial measures calculated in accordance with GAAP: GAAP revenues, GAAP expenses, GAAP income (loss) from continuing operations, net of income tax, GAAP net income (loss) available to MetLife, Inc.’s common shareholders, GAAP net income (loss) available to MetLife, Inc.’s common shareholders per diluted common share, return on MetLife, Inc.’s common equity and return on MetLife, Inc.’s common equity, excluding AOCI, respectively.
3
MetLife
Explanatory Note on Non-GAAP Financial Information (Continued)
For the historical periods presented, reconciliations of non-GAAP measures used in this presentation to the most directly comparable GAAP measures are included in this Appendix to the presentation materials and are on the Investor Relations portion of our Internet website. Additional information about our historical results is also available on our Internet website in our Quarterly Financial Supplements for the corresponding periods.
The non-GAAP measures used in this presentation should not be viewed as substitutes for the most directly comparable GAAP measures.
In these presentations, we sometimes refer to sales activity for various products. These sales statistics do not correspond to revenues under GAAP, but are used as relevant measures of business activity.
In these presentations, we provide guidance on our future earnings, premiums, fees and other revenues, and return on common equity on an operating or non-GAAP basis. A reconciliation of the non-GAAP measures to the most directly comparable GAAP measures is not accessible on a forward-looking basis because we believe it is not possible to provide other than a range of net investment gains and losses and net derivative gains and losses, which can fluctuate significantly within or without the range and from period to period and may have a significant impact on GAAP net income.
4
MetLife
© PNTS
Definitions
MetLife
Definitions
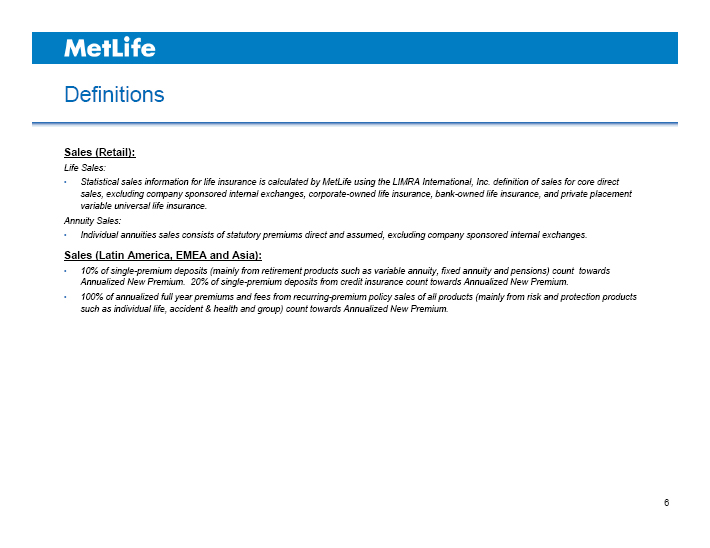
Sales (Retail):
Life Sales:
• Statistical sales information for life insurance is calculated by MetLife using the LIMRA International, Inc. definition of sales for core direct sales, excluding company sponsored internal exchanges, corporate-owned life insurance, bank-owned life insurance, and private placement variable universal life insurance.
Annuity Sales:
• Individual annuities sales consists of statutory premiums direct and assumed, excluding company sponsored internal exchanges.
Sales (Latin America, EMEA and Asia):
• 10% of single-premium deposits (mainly from retirement products such as variable annuity, fixed annuity and pensions) count towards Annualized New Premium. 20% of single-premium deposits from credit insurance count towards Annualized New Premium.
• 100% of annualized full year premiums and fees from recurring-premium policy sales of all products (mainly from risk and protection products such as individual life, accident & health and group) count towards Annualized New Premium.
6
MetLife
© PNTS
Reconciliations
MetLife
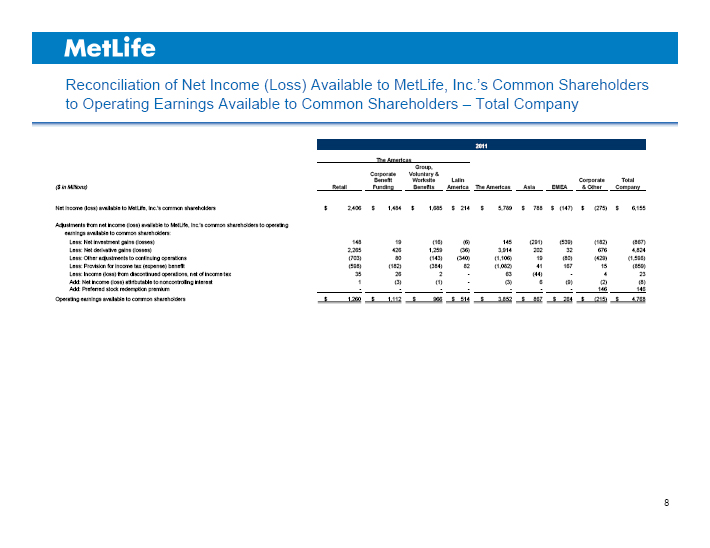
Reconciliation of Net Income (Loss) Available to MetLife, Inc.’s Common Shareholders to Operating Earnings Available to Common Shareholders – Total Company
2011
The Americas
($ in Millions) Retail Corporate Benefit Funding Group, Voluntary & Worksite Benefits Latin America The Americas Asia EMEA Corporate & Other Total Company
Net income (loss) available to MetLife, Inc.’s common shareholders $ 2,406 $ 1,484 $ 1,685 $ 214 $ 5,789 $ 788 $ (147) $ (275) $ 6,155
Adjustments from net income (loss) available to MetLife, Inc.’s common shareholders to operating earnings available to common shareholders:
Less: Net investment gains (losses) 148 19 (16) (6) 145 (291) (539) (182) ( 867)
Less: Net derivative gains (losses) 2,265 426 1,259 (36) 3,914 202 32 676 4,824
Less: Other adjustments to continuing operations (703) 80 (143) (340) (1,106) 19 (80) (429) (1,596)
Less: Provision for income tax (expense) benefit (598) (182) (384) 82 (1,082) 41 167 15 (859)
Less: Income (loss) from discontinued operations, net of income tax 35 26 2 - 63 (44) - 4 23
Add: Net income (loss) attributable to noncontrolling interest 1 (3) (1) - (3) 6 (9) (2) (8)
Add: Preferred stock redemption premium - - - - - - - 146 146
Operating earnings available to common shareholders $ 1,260 $ 1,112 $ 966 $ 514 $ 3,852 $ 867 $ 264 $ (215) $ 4,768
8
MetLife
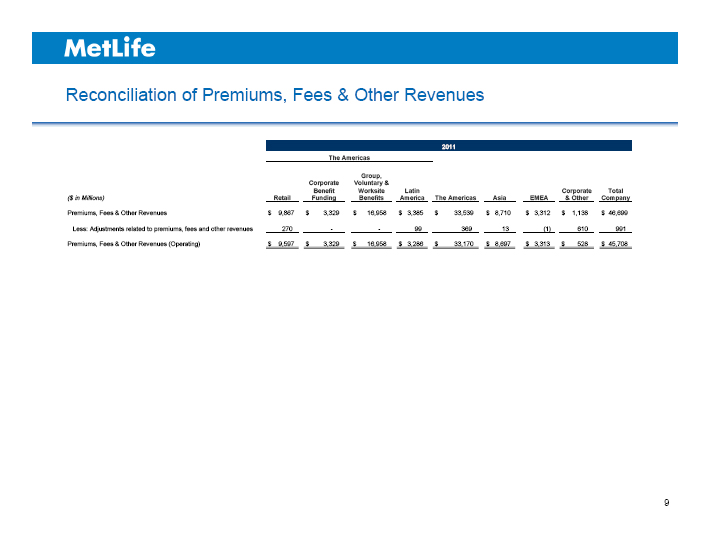
Reconciliation of Premiums, Fees & Other Revenues
2011
The Americas
($ in Millions)
Retail
Corporate Benefit Funding
Group, Voluntary & Worksite Benefits
Latin America
The Americas
Asia
EMEA
Corporate & Other
Total Company
Premiums, Fees & Other Revenues $ 9,867 $ 3,329 $ 16,958 $ 3,385 $ 33,539 $ 8,710 $ 3,312 $ 1,138 $ 46,699
Less: Adjustments related to premiums, fees and other revenues 270 - - 99 369 13 (1) 610 991
Premiums, Fees & Other Revenues (Operating) $ 9,597 $ 3,329 $ 16,958 $ 3,286 $ 33,170 $ 8,697 $ 3,313 $ 528 $ 45,708
9
MetLife
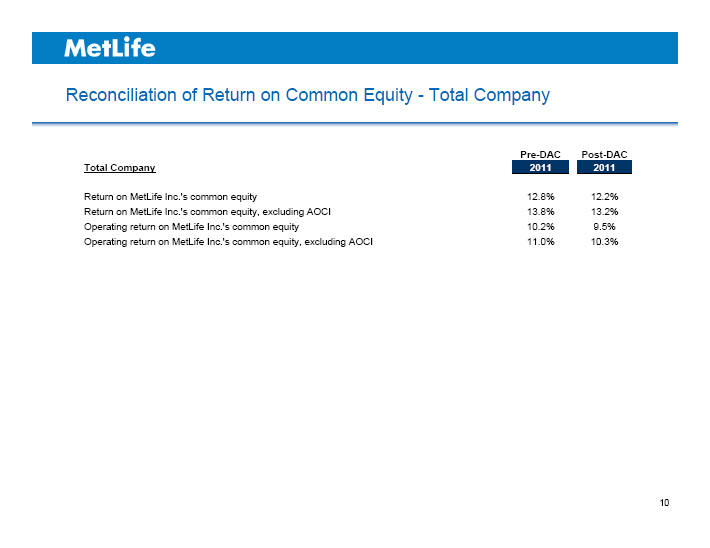
Reconciliation of Return on Common Equity - Total Company
Total Company
Pre-DAC 2011 Post-DAC 2011
Return on MetLife Inc.’s common equity 12.8% 12.2%
Return on MetLife Inc.’s common equity, excluding AOCI 13.8% 13.2%
Operating return on MetLife Inc.’s common equity 10.2% 9.5%
Operating return on MetLife Inc.’s common equity, excluding AOCI 11.0% 10.3%
10

MetLife
Steven A. Kandarian
Chairman, President & Chief Executive Officer
MetLife, Inc.

Steven A. Kandarian is chairman of the board, president and chief executive officer of MetLife, Inc. a leading global provider of insurance, annuities and employee benefit programs serving 90 million customers. He became president and CEO on May 1, 2011 and chairman of the board of directors on January 1, 2012. For 2011, MetLife had $70.2 billion in revenue and ranks 34th on the FORTUNE 500®.
Kandarian joined MetLife in April 2005 as executive vice president and chief investment officer (CIO). Since 2007, he has also overseen MetLife’s enterprise-wide strategy, which identified key areas of focus for the company. Specifically, his direction contributed to MetLife’s recent global expansion and led to significant cost savings, as well as efforts to address the insurance needs of the underserved U.S. middle market.
As CIO, Kandarian oversaw the company’s more than $450 billion general account portfolio and led a number of initiatives that strengthened the portfolio and contributed to MetLife’s bottom line. He enhanced the company’s focus on effective risk management and diversified MetLife’s investment portfolio, in part through the $5.4 billion sale of Peter Cooper Village/Stuyvesant Town in 2006. Under Kandarian’s leadership, MetLife identified the housing bubble early and reduced its exposure to sub-prime mortgage-backed securities, raised the overall quality of its corporate credit portfolio, and increased its focus on low loan-to-value commercial and agricultural mortgages. His efforts helped MetLife emerge from the 2008 credit crisis with the financial strength to complete the company’s $16 billion purchase of Alico in 2010.
From 2001 to 2004, Kandarian was executive director of the Pension Benefit Guaranty Corporation (PBGC). During his tenure, he made the public case for comprehensive reform of the pension funding rules to put the defined benefit system and the PBGC on a sound financial footing, helping to lay the groundwork for the enactment of the Pension Protection Act of 2006.
Previously, Kandarian was founder and managing partner of Orion Partners, LP, a private equity firm based in the Boston area. Earlier, he was managing director of Lee Capital Holdings. Kandarian began his career as an investment banker with Houston-based Rotan Mosle, Inc.
Kandarian is a board member of the Damon Runyon Cancer Research Foundation and a member of the Economic Club of New York and the Financial Services Forum. He earned his B.A. from Clark University, J.D. from Georgetown University Law Center, and M.B.A. from Harvard Business School.
# # #
William J. Wheeler
President, The Americas
MetLife, Inc.

William J. Wheeler is president of The Americas division of MetLife, Inc., a leading global provider of insurance, annuities and employee benefit programs serving 90 million customers. He was appointed to this position in November 2011.
As president, Wheeler oversees MetLife’s insurance and retirement businesses in the United States and Latin America. MetLife is the largest life insurer in both the U.S. and Mexico, and the company also holds leading market positions in Chile, Brazil and Argentina.
Prior to his current role, Wheeler was executive vice president and chief financial officer since December 2003. As CFO, Wheeler was responsible for overseeing all financial management matters, including financial reporting, treasury, corporate actuarial, risk management, tax, investor relations and mergers and acquisitions. Wheeler was a key architect of MetLife’s 2010 acquisition of Alico, the largest transaction in MetLife’s history, and the acquisition of Travelers Life & Annuity and related international insurance businesses in 2005. Wheeler also oversaw a number of capital management strategies and related transactions that enhanced MetLife’s financial strength and increased its liquidity at a time of severe capital market constraints, while simultaneously achieving significant annualized expense savings and implementing a number of risk management initiatives.
Prior to becoming CFO, Wheeler oversaw business development, product management and marketing activities for the company’s Individual Business and also served as chief financial officer of Institutional Business, overseeing financial reporting and planning, as well as expense management. Wheeler joined MetLife in 1997 as treasurer and played a key role in preparing MetLife to become a public company. He oversaw certain aspects of the demutualization, the development of the investor relations and shareholder services organizations, and management of the initial public offering process.
Before joining MetLife, Wheeler was an investment banker for ten years at Donaldson, Lufkin & Jenrette (DLJ). During his career at DLJ, he managed a variety of transactions, including equity and debt financings, mergers and acquisitions, leveraged buyouts, and financial advisory and restructurings in a number of different industries, including the insurance industry.
Wheeler is a member of Wabash College’s board of trustees. He holds an M.B.A. from Harvard Business School and received an A.B., magna cum laude, from Wabash College where he was elected to Phi Beta Kappa.
# # #
Maria R. Morris
Executive Vice President
Global Employee Benefits
Integration
MetLife, Inc.

Maria R. Morris is executive vice president and head of MetLife’s Global Employee Benefits business unit of MetLife Inc., the first global business unit established by the company. MetLife, Inc. is a leading global provider of insurance, annuities and employee benefit programs serving 90 million customers. Morris, who was appointed to this position in November 2011, is also responsible for integrating MetLife’s $16 billion acquisition of Alico, acquired from AIG in 2010.
Prior to her current role, Morris served as head of global technology and operations, overseeing a $1.6 billion IT portfolio and over $2.5 billion in procurable and real estate occupancy spend. Under her leadership, global technology and operations delivered a 64 basis point improvement to MetLife’s expense ratio.
In her career, Morris has successfully led and transformed large organizations to grow businesses and expand profitability. Morris previously served as executive vice president, employee benefits sales. In this role, she had oversight of the group insurance and retirement and savings sales and service teams. Under her direction, these teams achieved record sales and generated over $14 billion in annual revenue. Beginning in 2003, Morris served as senior vice president of group insurance and voluntary benefits sales and service operations. From 2000 to 2003, as the vice president of MetLife’s group and individual disability businesses, overseeing product development, management and operations, Morris nearly doubled group disability profits. As the head of the dental business from 1996 to 2000, she transformed the operating model to increase profits by 200%. Morris joined MetLife in 1984.
Morris serves as a member of the board of directors of MetLife Securities, Inc., MetLife Property and Casualty Insurance Company and MetLife Foundation. She serves as chairman of the board of directors for INROADS, Inc., the first woman in this role, and also serves on the board of the All Stars Project, Inc. She was recognized byProfiles in Diversity Journal magazine as one of a number of “Women to Watch.” She holds a B.A. from Franklin and Marshall College, where she was elected to Phi Beta Kappa.
# # #
Michel Khalaf
President, EMEA
MetLife, Inc.

Michel Khalaf is president of MetLife, Inc.’s EMEA (Europe, the Middle East and Africa) region and a member of the executive group of MetLife, Inc., a leading global provider of insurance, annuities and employee benefit programs serving 90 million customers. He was appointed to this position in November 2011.
Prior to assuming his current position, Khalaf was executive vice president and chief executive officer of MetLife’s Middle East, Africa and South Asia (MEASA) region.
Previously, Khalaf was deputy president and chief operating officer of Philamlife, AIG’s operating company in the Philippines.
Since joining Alico’s investment department in 1989, Khalaf has held a number of leadership roles in various markets around the world, including the Caribbean, France and Italy. In 1996, he assumed the position of regional senior vice president in charge of Alico’s life, pension and mutual fund operations in Poland, Romania and the Baltics as well as president and chief executive officer of Amplico Life. In 1994, he was named the first general manager of Alico’s operation in Egypt.
Khalaf is a graduate of Syracuse University with a B.S. in engineering and an M.B.A. in finance. He is a fellow of the Life Management Institute (FLMI).
# # #
John D. McCallion
Vice President, Investor Relations
MetLife

John D. McCallion is vice president and head of investor relations of MetLife, Inc., a leading global provider of insurance, annuities and employee benefit programs serving 90 million customers. Appointed to this position in February 2011, McCallion manages and coordinates the presentation of MetLife’s financial results, messages and strategies to the analyst and investor community.
Prior to overseeing MetLife’s investor relations department, McCallion was vice president and chief financial officer of the company’s investments department. In this role, he was responsible for managing the financial analysis and reporting, as well as the income and expense plan and projection process for the company’s more than $450 billion investment portfolio. He also had oversight of the impairment and valuation process for MetLife’s investments.
McCallion joined MetLife in July 2006 after spending 10 years in PricewaterhouseCoopers’ insurance audit practice, where he worked with multinational and U.S. clients in the life and property/casualty insurance industries.
McCallion received a B.S. degree in accounting from Syracuse University and an M.B.A from the University of Pennsylvania, The Wharton School. He is a certified public accountant and a member of the American Institute of Certified Public Accountants.
# # #