 ASIA INVESTOR DAY 2012 John McCallion Vice President Investor Relations Exhibit 99.1 |
 Safe Harbor Statement 2 These materials may contain or incorporate by reference information that includes or is based upon forward-looking statements within the meaning of the Private Securities Litigation Reform Act of 1995. Forward-looking statements give expectations or forecasts of future events. These statements can be identified by the fact that they do not relate strictly to historical or current facts. They use words such as “anticipate,” “estimate,” “expect,” “project,” “intend,” “plan,” “believe” and other words and terms of similar meaning in connection with a discussion of future operating or financial performance. In particular, these include statements relating to future actions, prospective services or products, future performance or results of current and anticipated services or products, sales efforts, expenses, the outcome of contingencies such as legal proceedings, trends in operations and financial results. Any or all forward-looking statements may turn out to be wrong. They can be affected by inaccurate assumptions or by known or unknown risks and uncertainties. Many such factors will be important in determining the actual future results of MetLife, Inc., its subsidiaries and affiliates. These statements are based on current expectations and the current economic environment. They involve a number of risks and uncertainties that are difficult to predict. These statements are not guarantees of future performance. Actual results could differ materially from those expressed or implied in the forward-looking statements. Risks, uncertainties, and other factors that might cause such differences include the risks, uncertainties and other factors identified in MetLife, Inc.’s filings with the U.S. Securities and Exchange Commission (the “SEC”). These factors include: (1) difficult conditions in the global capital markets; (2) concerns over U.S. fiscal policy and the “fiscal cliff” in the U.S., as well as rating agency downgrades of U.S. Treasury securities; (3) uncertainty about the effectiveness of governmental and regulatory actions to stabilize the financial system, the imposition of fees relating thereto, or the promulgation of additional regulations; (4) increased volatility and disruption of the capital and credit markets, which may affect our ability to seek financing or access our credit facilities; (5) impact of comprehensive financial services regulation reform on us; (6) economic, political, legal, currency and other risks relating to our international operations, including with respect to fluctuations of exchange rates; (7) exposure to financial and capital market risk, including as a result of the disruption in Europe and possible withdrawal of one or more countries from the Euro zone; (8) changes in general economic conditions, including the performance of financial markets and interest rates, which may affect our ability to raise capital, generate fee income and market-related revenue and finance statutory reserve requirements and may require us to pledge collateral or make payments related to declines in value of specified assets; (9) potential liquidity and other risks resulting from our participation in a securities lending program and other transactions; (10) investment losses and defaults, and changes to investment valuations; (11) impairments of goodwill and realized losses or market value impairments to illiquid assets; (12) defaults on our mortgage loans; (13) the defaults or deteriorating credit of other financial institutions that could adversely affect us; (14) our ability to address unforeseen liabilities, asset impairments, or rating actions arising from acquisitions or dispositions, including our acquisition of American Life Insurance Company and Delaware American Life Insurance Company (collectively, “ALICO”) and to successfully integrate and manage the growth of acquired businesses with minimal disruption; (15) uncertainty with respect to the outcome of the closing agreement entered into with the United States Internal Revenue Service in connection with the acquisition of ALICO; (16) the dilutive impact on our stockholders resulting from the settlement of common equity units issued in connection with the acquisition of ALICO or otherwise; (17) MetLife, Inc.’s primary reliance, as a holding company, on dividends from its subsidiaries to meet debt payment obligations and the applicable regulatory restrictions on the ability of the subsidiaries to pay such dividends; (18) downgrades in our claims paying ability, financial strength or credit ratings; (19) ineffectiveness of risk management policies and procedures; (20) availability and effectiveness of reinsurance or indemnification arrangements, as well as default or failure of counterparties to perform; (21) discrepancies between actual claims experience and assumptions used in setting prices for our products and establishing the liabilities for our obligations for future policy benefits and claims; (22) catastrophe losses; (23) heightened competition, including with respect to pricing, entry of new competitors, consolidation of distributors, the development of new products by new and existing competitors, distribution of amounts available under U.S. government programs, and for personnel; (24) unanticipated changes in industry trends; (25) changes in assumptions related to investment valuations, deferred policy acquisition costs, deferred sales inducements, value of business acquired or goodwill; (26) changes in accounting standards, practices and/or policies; (27) increased expenses relating to pension and postretirement benefit plans, as well as health care and other employee benefits; (28) exposure to losses related to variable annuity guarantee benefits, |
 Safe Harbor Statement (Continued) 3 including from significant and sustained downturns or extreme volatility in equity markets, reduced interest rates, unanticipated policyholder behavior, mortality or longevity, and the adjustment for nonperformance risk; (29) deterioration in the experience of the “closed block” established in connection with the reorganization of Metropolitan Life Insurance Company; (30) adverse results or other consequences from litigation, arbitration or regulatory investigations; (31) inability to protect our intellectual property rights or claims of infringement of the intellectual property rights of others; (32) discrepancies between actual experience and assumptions used in establishing liabilities related to other contingencies or obligations; (33) regulatory, legislative or tax changes relating to our insurance, banking, international, or other operations that may affect the cost of, or demand for, our products or services, or increase the cost or administrative burdens of providing benefits to employees; (34) the effects of business disruption or economic contraction due to disasters such as terrorist attacks, cyberattacks, other hostilities, or natural catastrophes, including any related impact on our disaster recovery systems, cyber- or other information security systems and management continuity planning; (35) the effectiveness of our programs and practices in avoiding giving our associates incentives to take excessive risks; and (36) other risks and uncertainties described from time to time in MetLife, Inc.’s filings with the SEC. MetLife, Inc. does not undertake any obligation to publicly correct or update any forward-looking statement if MetLife, Inc. later becomes aware that such statement is not likely to be achieved. Please consult any further disclosures MetLife, Inc. makes on related subjects in reports to the SEC. |
 Explanatory Note on Non-GAAP Financial Information All references in these presentations (except in this Explanatory Note on Non-GAAP Financial Information slide) to operating earnings, premiums, fees and other revenues and operating return on equity, should be read as operating earnings available to common shareholders, premiums, fees and other revenues (operating) and operating return on MetLife, Inc.’s common equity, excluding AOCI, respectively. Operating earnings is the measure of segment profit or loss that MetLife uses to evaluate segment performance and allocate resources. Consistent with accounting principles generally accepted in the United States of America ("GAAP") accounting guidance for segment reporting, operating earnings is MetLife's measure of segment performance. Operating earnings is also a measure by which MetLife senior management's and many other employees' performance is evaluated for the purposes of determining their compensation under applicable compensation plans. Operating earnings is defined as operating revenues less operating expenses, both net of income tax. Operating earnings available to common shareholders is defined as operating earnings less preferred stock dividends. Operating revenues and operating expenses exclude results of discontinued operations and other businesses that have been or will be sold or exited by MetLife, Inc. (“Divested Businesses”). Operating revenues also excludes net investment gains (losses) (“NIGL”) and net derivative gains (losses) (“NDGL”). The following additional adjustments are made to GAAP revenues, in the line items indicated, in calculating operating revenues: • Universal life and investment-type product policy fees excludes the amortization of unearned revenue related to NIGL and NDGL and certain variable annuity guaranteed minimum income benefits ("GMIB") fees ("GMIB Fees"); • Net investment income: (i) includes amounts for scheduled periodic settlement payments and amortization of premium on derivatives that are hedges of investments but do not qualify for hedge accounting treatment, (ii) includes income from discontinued real estate operations, (iii) excludes post-tax operating earnings adjustments relating to insurance joint ventures accounted for under the equity method, (iv) excludes certain amounts related to contractholder-directed unit-linked investments, and (v) excludes certain amounts related to securitization entities that are variable interest entities ("VIEs") consolidated under GAAP; and • Other revenues are adjusted for settlements of foreign currency earnings hedges. 4 |
 Explanatory Note on Non-GAAP Financial Information (Continued) The following additional adjustments are made to GAAP expenses, in the line items indicated, in calculating operating expenses: • Policyholder benefits and claims and policyholder dividends excludes: (i) changes in the policyholder dividend obligation related to NIGL and NDGL, (ii) inflation-indexed benefit adjustments associated with contracts backed by inflation-indexed investments and amounts associated with periodic crediting rate adjustments based on the total return of a contractually referenced pool of assets, (iii) benefits and hedging costs related to GMIBs ("GMIB Costs"), and (iv) market value adjustments associated with surrenders or terminations of contracts ("Market Value Adjustments"); • Interest credited to policyholder account balances includes adjustments for scheduled periodic settlement payments and amortization of premium on derivatives that are hedges of policyholder account balances but do not qualify for hedge accounting treatment and excludes amounts related to net investment income earned on contractholder-directed unit-linked investments; • Amortization of deferred policy acquisition costs (“DAC”) and value of business acquired ("VOBA") excludes amounts related to: (i) NIGL and NDGL, (ii) GMIB Fees and GMIB Costs, and (iii) Market Value Adjustments; • Amortization of negative VOBA excludes amounts related to Market Value Adjustments; • Interest expense on debt excludes certain amounts related to securitization entities that are VIEs consolidated under GAAP; and • Other expenses excludes costs related to: (i) noncontrolling interests, (ii) implementation of new insurance regulatory requirements, and (iii) acquisition and integration costs. Operating return on MetLife, Inc.’s common equity is defined as operating earnings available to common shareholders divided by average GAAP common equity. Operating expense ratio is calculated by dividing operating expenses (other expenses net of capitalization of DAC) by premiums, fees and other revenues (operating). MetLife believes the presentation of operating earnings and operating earnings available to common shareholders as MetLife measures it for management purposes enhances the understanding of the company's performance by highlighting the results of operations and the underlying profitability drivers of the business. Operating revenues, operating expenses, operating earnings, operating earnings available to common shareholders, operating return on MetLife, Inc.’s common equity, operating return on MetLife, Inc.’s common equity, excluding AOCI, investment portfolio gains (losses) and derivative gains (losses) should not be viewed as substitutes for the following financial measures calculated in accordance with GAAP: GAAP revenues, GAAP expenses, GAAP income (loss) from continuing operations, net of income tax, GAAP net income (loss) available to MetLife, Inc.'s common shareholders, return on MetLife, Inc.’s common equity, return on MetLife, Inc.’s common equity, excluding AOCI, net investment gains (losses) and net derivative gains (losses), respectively. 5 |
 Explanatory Note on Non-GAAP Financial Information (Continued) 6 Managed Assets is a financial measure based on methodologies other than GAAP. MetLife utilizes “Managed Assets” to describe assets in its investment portfolio which are actively managed and reflected at estimated fair value. MetLife believes the use of Managed Assets enhances the understanding and comparability of its investment portfolio by excluding assets such as policy loans, other invested assets, mortgage loans held- for-sale, and mortgage loans held by consolidated securitization entities, as substantially all of those assets are not actively managed in MetLife’s investment portfolio. Trading and other securities are also excluded as this amount is primarily comprised of contractholder-directed unit-linked investments, where the contractholder, and not the company, directs the investment of these funds. Mortgage loans and certain real estate investments have also been adjusted from carrying value to estimated fair value. For the historical periods presented, reconciliations of non-GAAP measures used in this presentation to the most directly comparable GAAP measures are included in the Appendix to the presentation materials and are on the Investor Relations portion of our Internet website. Additional information about our historical results is also available on our Internet website in our Quarterly Financial Supplements for the corresponding periods. The non-GAAP measures used in this presentation should not be viewed as substitutes for the most directly comparable GAAP measures. In these presentations, we sometimes refer to sales activity for various products. These sales statistics do not correspond to revenues under GAAP, but are used as relevant measures of business activity. In these presentations, we provide guidance on our future earnings, premiums, fees and other revenues, and return on common equity on an operating or non-GAAP basis. A reconciliation of the non-GAAP measures to the most directly comparable GAAP measures is not accessible on a forward-looking basis because we believe it is not possible to provide other than a range of net investment gains and losses and net derivative gains and losses, which can fluctuate significantly within or without the range and from period to period and may have a significant impact on GAAP net income. |
 Agenda Asia Overview Christopher Townsend President, Asia Japan William Hogan Chairman & CEO, MetLife Alico Japan Sachin Shah EVP & COO, MetLife Alico Japan Hiroyoshi Kitamura EVP, Profit Center & Products, MetLife Alico Japan Atsushi Yagai EVP, Strategy & Marketing, MetLife Alico Japan Break Korea and China Jong Kim CEO, MetLife Korea Bob Pei CEO, Sino-US United MetLife Asia Financial Overview Toby Brown CFO, Asia Break Q&A 7 |
 ASIA INVESTOR DAY 2012 Christopher Townsend President Asia |
 Strategy to Become a World-Class Company Drive Toward Customer Centricity and a Global Brand Grow Emerging Markets Build Global Employee Benefits Business Refocus the U.S. Business 9 GLOBAL * WORLD-CLASS * SCALE |
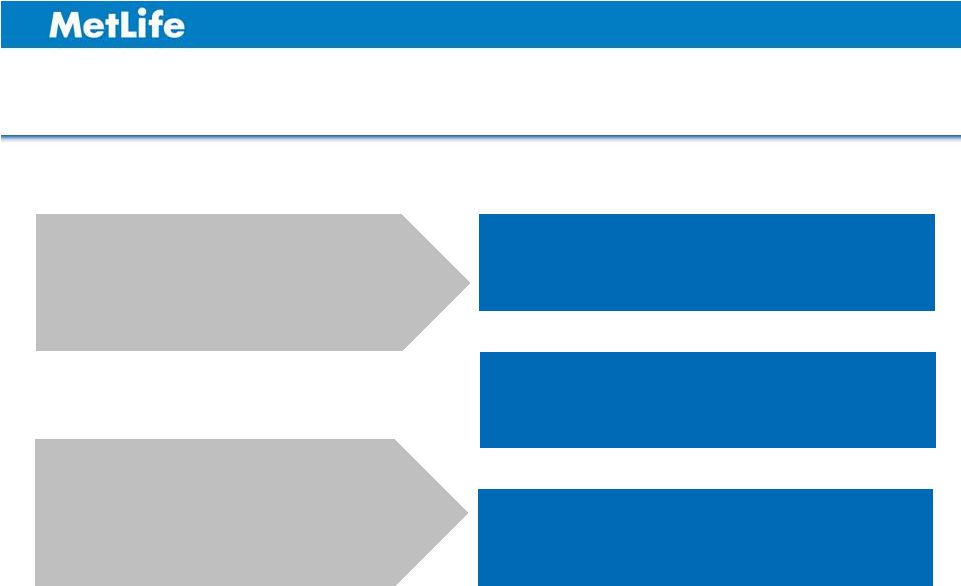
 Meeting Growing Customer Demand Grow and Leverage Accident & Health Solutions Leverage Multi-Channel Distribution Shifting costs from governments to individuals Aging populations needing health solutions Growing middle class needing protection 10 |
 Asia Financial Results and Overview #2 foreign life insurer in Japan¹ #2 in Accident & Health products in Japan² #1 foreign life insurer in Korea³ Growing presence in China $8.7B Premiums, Fees and Other Revenues $867M Operating Earnings 11 Overview 2011 Financial Results 1 2 3 Based on Annualized New Premiums (ANP) in Statutory filings (MetLife Alico Japan statutory fiscal year 2011, April 1, 2011 - March 31, 2012). Based on new business policies and inforce policies (MetLife Alico Japan statutory fiscal year 2011, April 1, 2011 - March 31, 2012). Based on ANP in Statutory filings (MetLife Korea statutory fiscal year 2011, January 1, 2011 - December 31, 2011). Source: The Life Insurance Association of Japan; Korea Life Insurance Association. See Appendix for non-GAAP financial information, definitions and/or reconciliations. |
 Target Key Segments in Mature Markets MetLife’s 2 largest market Strong growth in high-margin products, despite challenging environment Leverage expertise across MetLife, especially in Asia Japan: A Cornerstone Market MetLife’s 4 largest market Diversified distribution channels centered around a strong career agency force Favorable demographics drive growth in Accident & Health products Korea: Growth Through Innovation 12 th nd |
 Asia: Seeking Growth in Emerging Markets Top 5 life insurer in both the Direct Marketing and Bancassurance channels in China Expanding our agency model into more Chinese provinces and cities Several other attractive, fast-growing insurance markets 13 Source: China Insurance Regulatory Commission, based on Gross Written Premiums (GWP) for full year 2011; National Insurance Industry Communication Club. |
 Asia Key Takeaways Asia is a key segment and contributor to 2016 goals Growing market share in mature markets Opportunistically pursue organic and inorganic growth in emerging markets 14 |
 ASIA INVESTOR DAY 2012 William Hogan Chairman & Chief Executive Officer MetLife Alico Japan |
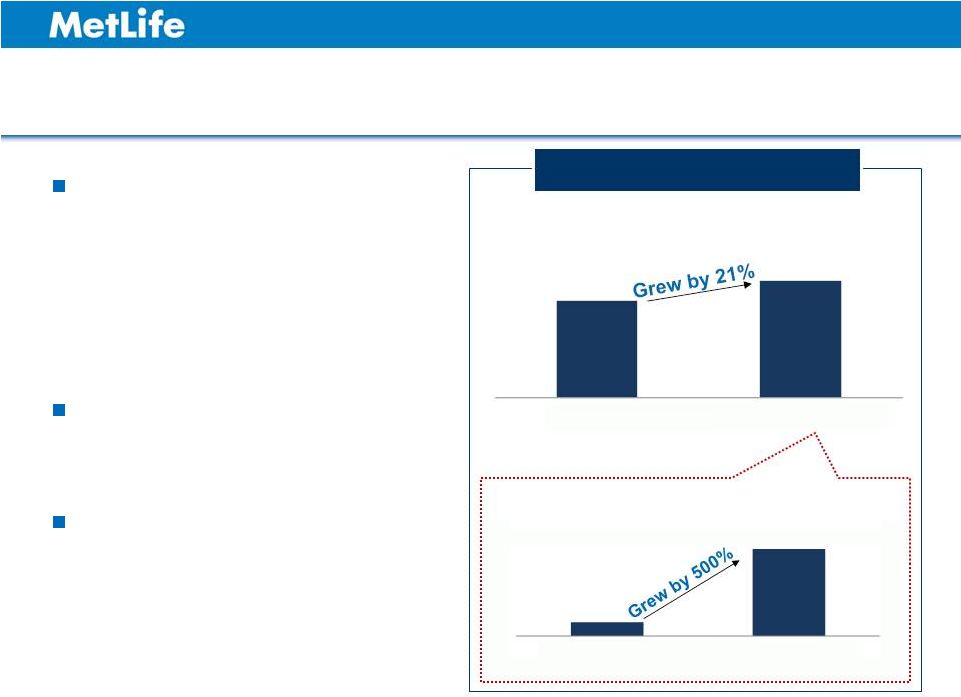
 Why MetLife Alico Macro trends creating attractive opportunities to take share and capture growing segments Competitive products and multi-distribution platform Current positioning allows room for additional market share gains Growing significantly faster than market and building scale Strong culture focused on profitable growth 16 |
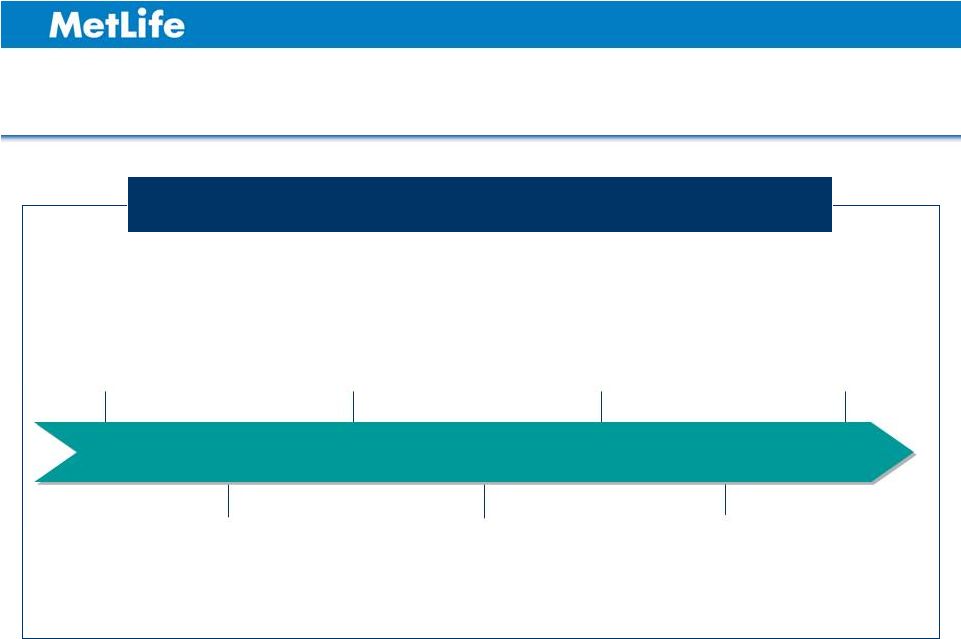
 Growing distribution productivity Enhanced investment capability Improving operating efficiency Improving persistency Growing brand preference Acquiring new customers Cross-selling Broad product portfolio We are Addressing Key Performance Drivers Growth Value Multiplier 17 |
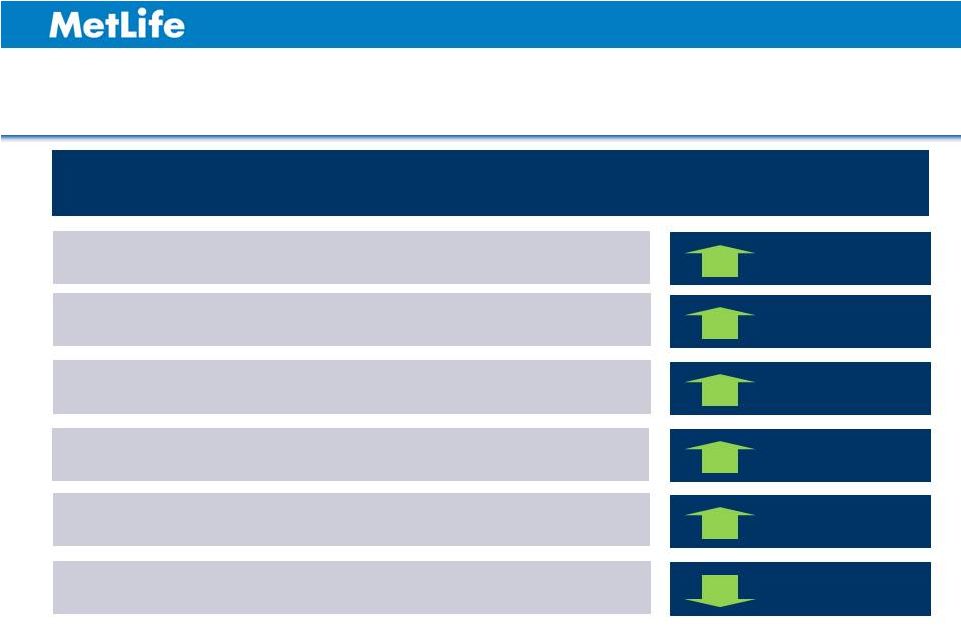 Japan Performance on the Right Trajectory Operating Earnings Operating Expense Ratio Premiums, Fees and Other Revenues Annualized New Premiums (ANP) Persistency³ Operating Earnings, 31% 9% 50% 28% 124 192 18 as adjusted ² 1 2 3 (1H 2012 vs. 1H 2011)¹ Key Metrics MetLife ALICO Japan has a fiscal year-end Nov. 30. Therefore, the results presented for the first half of 2012 and 2011 reflect its operating results for the six months ended May 31, 2012 and 2011, respectively. Reflects $44 million in claims and expenses related to Japan earthquake and tsunami, $24 million of higher than planned variable investment income, partially offset by a net $5 million in DAC and other actuarial items. Excludes non-core $ Endowment and Retirement Assurance products. bps bps See Appendix for non-GAAP financial information, definitions and/or reconciliations. |
 ASIA INVESTOR DAY 2012 Sachin N. Shah Executive Vice President & Chief Operating Officer MetLife Alico Japan |
 Japan Offers Attractive Growth Opportunities World’s 2 largest insurance market¹ Changing consumer needs Consumers becoming more selective Multi-channel access and service Needs based advisory model Opportunity to grow market share Strain in social healthcare & pension systems Increased need for private insurance 20 Swiss Re Research (2011). 1 nd |
 Married Small / Medium Enterprises Pre-Retirees Retirees Retirees Singles Married A Comprehensive Life Insurance Solutions Provider Face-to-Face Bancassurance Direct Marketing Large & Growing Customer Segments Diverse Distribution Channels Broad Product Portfolio Primary Solutions Ancillary Solutions Protection Life Accident & Health Savings Whole Life Annuities Accident & Health Group Insurance Annuities Protection Life Accident & Health Protection Life 21 |
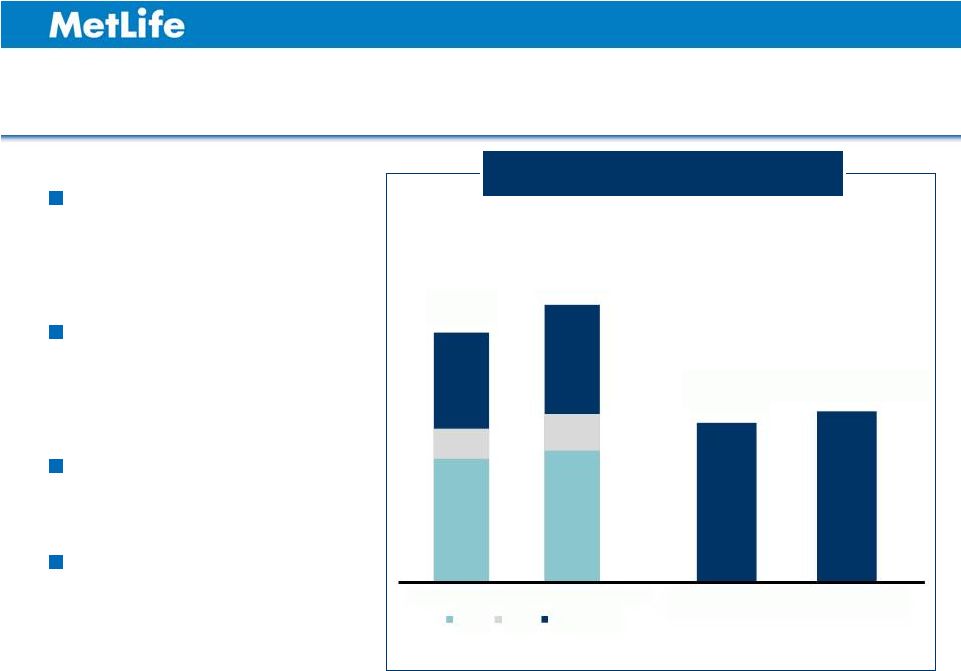
 We are Gaining Market Share MetLife Alico Premiums ¹ Market Share Trend ($ in Billions) ($ in Billions) 22 MetLife Alico ANP Market Share Trend 0 0 0.0% 1.0% 2.0% 3.0% 4.0% 50 100 150 200 250 300 350 400 450 500 2008 2009 2010 2011 0.0% 1.0% 2.0% 3.0% 4.0% 5.0% 6.0% 5 10 15 20 25 30 35 40 45 2008 2009 2010 2011 Industry ANP MetLife Alico Market Share Industry Premiums MetLife Alico Market Share Note : MetLife Plan FX rate of $1 = JPY 78.20. Statutory premiums. Source: Statistics of Life Insurance Business in Japan (for 2008-2010 data), Life Insurance Association of Japan (for 2011 data). See Appendix for non-GAAP financial information, definitions and/or reconciliations. 1 |
 Strong Foundation Focused on Profitable Growth Segments Multiple advice-based distribution channels Broad, innovative protection and savings solutions Strong execution culture, focused on growth and profitability Powerful brand assets of “U.S. No.1” , Snoopy and Blimp Solid balance-sheet, strong compliance and risk management culture 1 Statistical study report of AM Best (Oct 2011). 23 1 |
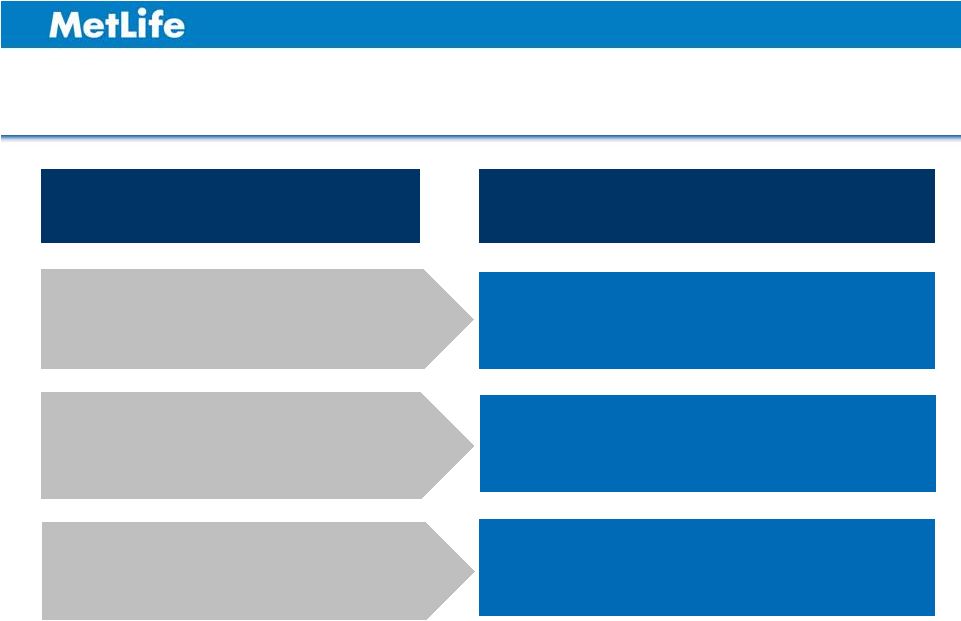
 Strategy Designed to Enhance Performance 24 Brand Enhancement Value Growth Customer Centricity Distribution Growth |
 Strategy Designed to Enhance Performance 25 Brand Enhancement Value Growth Customer Centricity Atsushi Yagai Hiroyoshi Kitamura Atsushi Yagai Distribution Growth Sachin N. Shah |
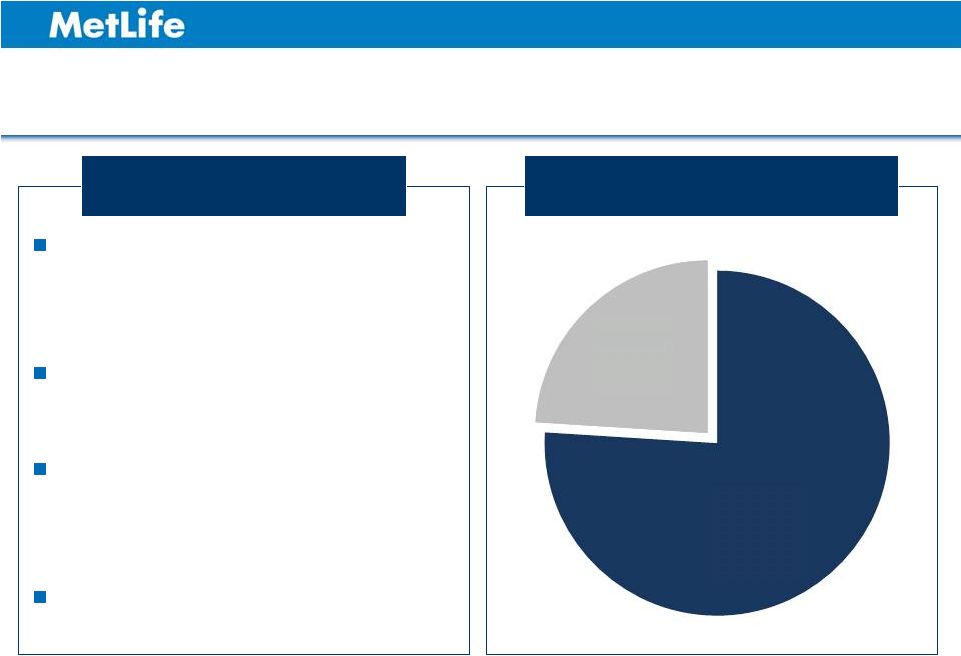
 Multiple Distribution Channels, Greater Customer Access Prominent professional career agency channel Strong independent agent channel Access to nearly 90% of bank deposit assets and customers Leading Direct Marketing player Distribution Mix 1H 2012 1 Statutory Premiums, Deposits and Other Considerations. Highlights 26 Career 22% Direct Marketing, 13% Independent Agents, 25% Bancassurance, 40% Agents, 1 |
 Face-to-Face Distribution: A Leader in Productivity Metrics June 1, 2011 – May 31, 2012 Career Agency Independent Agency Sales Productivity per Active Agent per month $11,200 $12,100 Policy Productivity per Active Agent per month 6.2 6.4 Accident & Health Cross-Sell Ratio ¹ 71% 60% 27 1 Note : MetLife Plan FX rate of $1 = JPY 78.20. Percentage of new policies (among six core whole life products) sold with stand-alone Accident & Health products and riders. |
 Continued Growth from Face-to-Face Channels Note : MetLife Plan FX rate of $1 = JPY 78.20. See Appendix for non-GAAP financial information, definitions and/or reconciliations. Increase penetration in Brokerage General Agency segment Expand unique Independent Agency Federation Improve productivity & cross-sell Re-align sales support resources and reduce expenses Growth Priorities Face-to-Face ANP Trend ($ in Millions) 28 0 200 400 600 800 1,000 1,200 1,400 2008 2009 2010 2011 Others Pure Protection |
 Larger Banks Offer Higher-End Customer Base 101 partner financial institutions Multi-layer wholesaling model / needs based sales approach Full-service training and unique e-learning capabilities Competitive multi-currency products Highlights Individual Bank Deposits in Japan (Total = $7.1 Trillion) 29 1 Note : MetLife Plan FX rate of $1 = JPY 78.20. Individual bank deposits exclude small credit unions and foreign banks. 1 Source: Kinzai, Nikkin Report and bank disclosure (as of March 31, 2012). Japan Post, 31% Mega Banks, 27% Regional & Other Banks, 31% Non Partners, 11% - - |
 Bancassurance: Focused on Profitable Segments MetLife Alico Industry Single premium whole life driving recent growth Mostly JPY denominated products Low interest rates and aggressive competition pressuring margins 30 A leader in more profitable foreign currency segment A leader in Accident & Health, growing double-digits annually since 2008 Growing protection opportunity |
 Direct Marketing: Large, Highly Profitable Business Industry pioneer in direct marketing Large sponsor base Best-in-class call center capabilities Source of leads for face-to-face channel Highlights Direct Marketing Product Mix 1H 2012 31 Statutory Premiums, Deposits and Other Considerations. 1 1 Accident & Health, 76% Life, 24% |
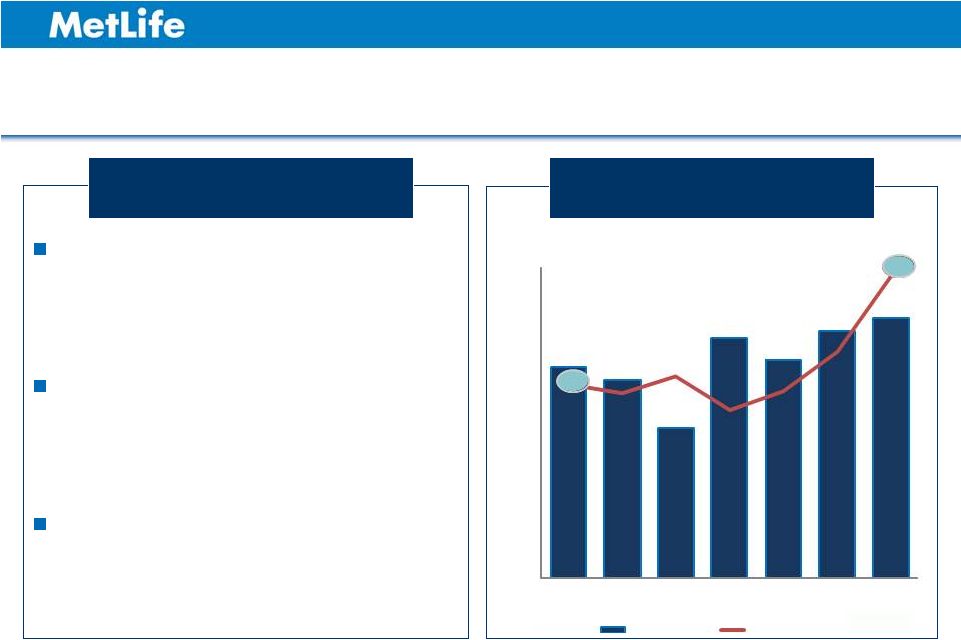 Direct Marketing Business Repositioning Direct Marketing ANP & Marketing Efficiency Trend ($ in Millions) Note : MetLife Plan FX rate of $1 = JPY 78.20. 1 Campaign Sales / Marketing Spend in MetLife Alico. 1H 2009 Marketing Spend Efficiency rebased to $100M. See Appendix for non-GAAP financial information, definitions and/or reconciliations. Leverage and grow sponsor business Shift media mix to improve efficiency Expand existing online sales capabilities 32 Direct Marketing Priorities 0 20 40 60 80 100 120 140 160 1H-2009 2H-2009 1H-2010 2H-2010 1H-2011 2H-2011 1H-2012 Sales Marketing Spend Efficiency 100 155 1 |
 Key Takeaways: Japan Distribution Market offers attractive growth opportunities Well positioned to capture profitable growth Face-to-Face increasing productivity and profitable product mix Leveraging bank relationships for emerging protection opportunity Direct Marketing repositioning improving efficiency and growth 33 |
 ASIA INVESTOR DAY 2012 Hiroyoshi Kitamura Executive Vice President, Profit Center & Products MetLife Alico Japan |
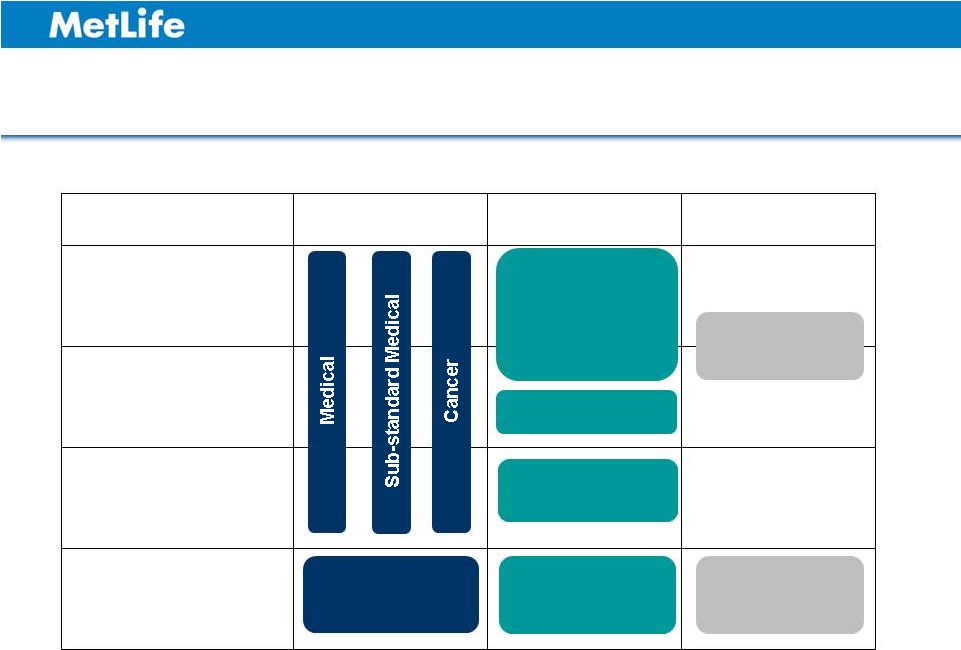 Broad Suite of Products Accident & Health Life Annuity Bancassurance U.S.$ Whole Life Yen Whole Life Level Term Sub-Standard Whole Life U.S.$ and Yen Single Premium Whole Life Foreign Currency Fixed Annuity Foreign Currency Fixed Annuity 35 Independent Agents Direct Marketing Career Agents Single Premium Medical |
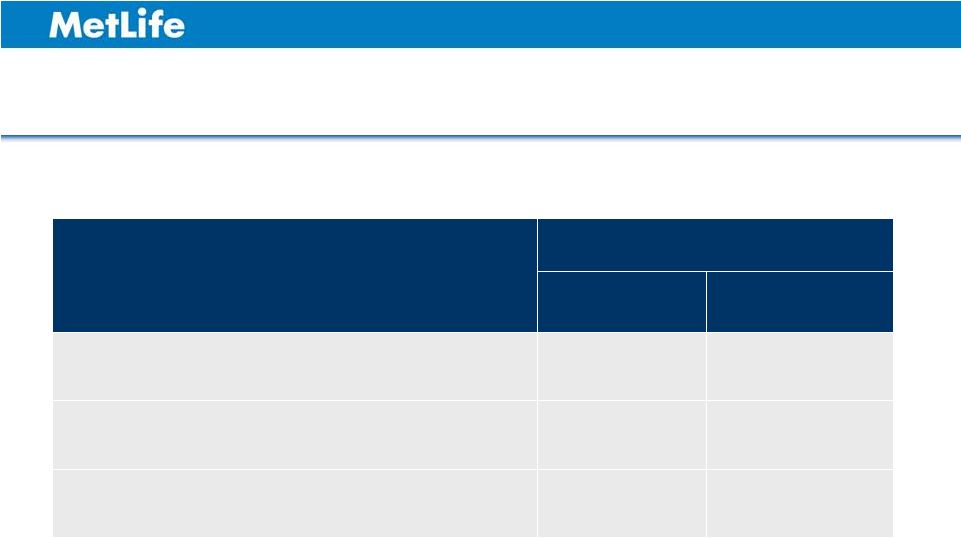
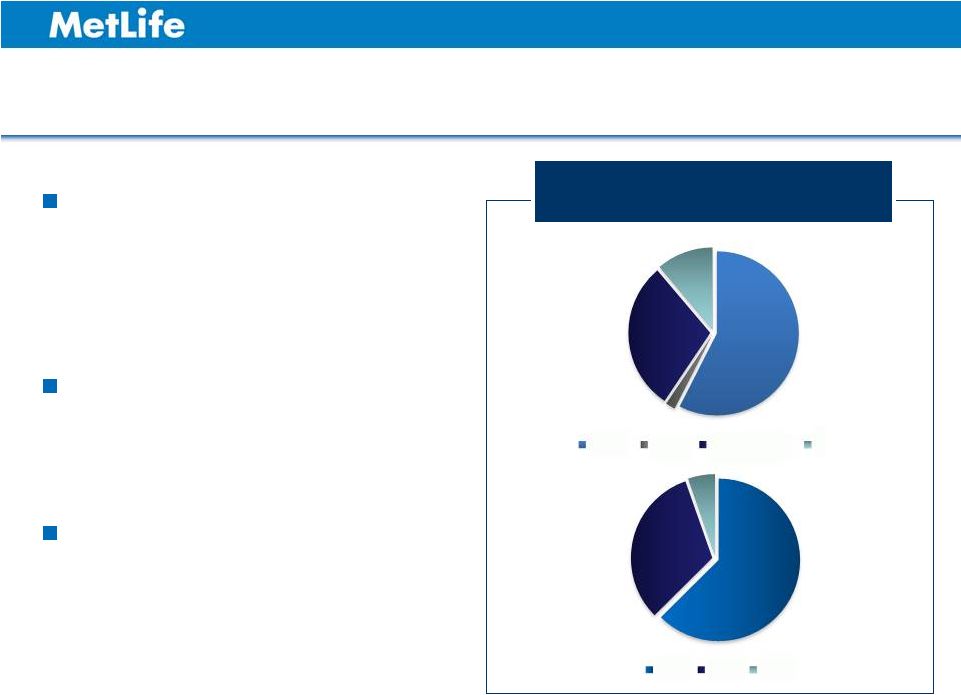
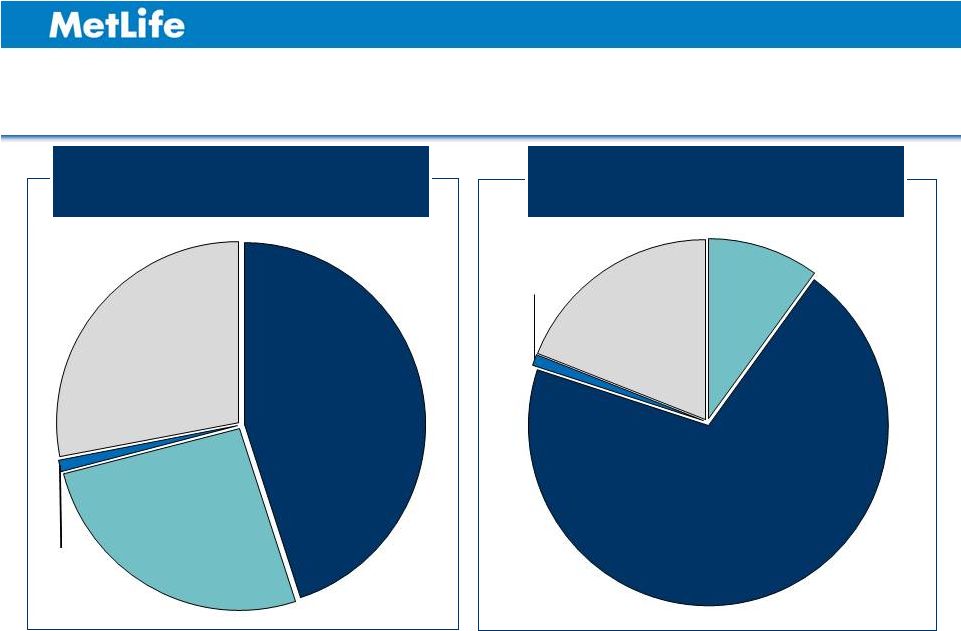 Diversified Product Mix Weighted toward Protection Statutory Premiums, Deposits and Other Considerations 1H 2012 See Appendix for non-GAAP financial information, definitions and/or reconciliations. 36 Operating Earnings 1H 2012 Accident & Health, 26% Group & Credit, 1% Annuities, 28% Life Insurance, 45% Life Insurance, 10% Accident & Health, 70% Group & Credit, 1% Annuities, 19% |
 Proactively Growing Value Relatively low in-force penetration Volatile investment markets Low interest rates Asset diversification Re-price, manage product mix and enhance investment yields Emphasize cross-selling / packaging Increased competition and medical technology advances Continued product innovation Leveraging global scale Driving expense efficiency 37 |
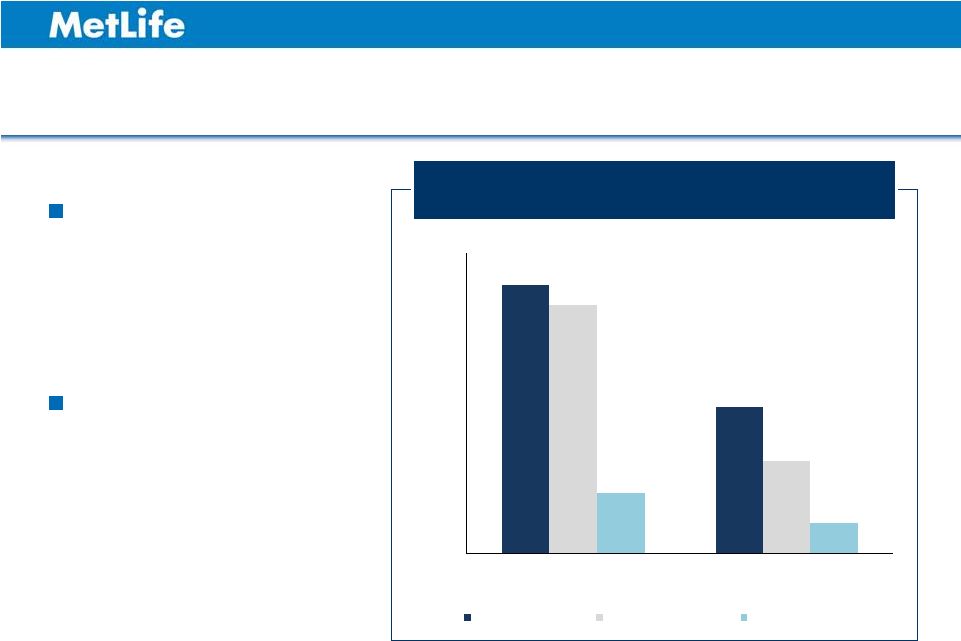
 Minimal Impact of Lower Interest Rates Product ANP Share Sales Impact Profitability Impact Level Premium Life 36% Low Medium Accident & Health 29% Low Low Fixed Annuity 25% High Low Single Premium Life 9% Medium High 38 1 1 Percentages reflect share of annualized new premiums for fiscal year 2011. Excludes group insurance products, which accounts for approximately 1% of total ANP share. See Appendix for non-GAAP financial information, definitions and/or reconciliations. |
 Leveraging MetLife’s Global Investment Capabilities Total Investment Portfolio As of June 30, 2012 Improving Asset Diversity and Enhancing Investment Yields Invest in USD corporate bonds, swapped in AUD Source USD commercial mortgage loans Utilize private placement bonds in USD and AUD Lengthen duration in Japanese Government Bonds 39 |
 Cross-Sell for Both New and Existing Customers Maintain high cross-sell rates through advice-based model Mine existing customer database Direct marketing business generates leads to agents Cross-sell Opportunities Policies per Customer 1 From January 1, 2011 through June 30, 2012. 40 1.54 1.56 1.58 1.60 1.62 Q1-2011 Q2-2011 Q3-2011 Q4-2011 Q1-2012 Q2-2012 ~130,000 net policies cross-sold 1 |
 Culture of Product Innovation Dual-Currency Fixed Annuity $ Interest Sensitive Whole Life Single Premium Whole Life FIH Guaranteed Issue Full-in-Hospital (FIH) MetLife Alico has developed over 20 Industry First products Product Innovation Examples: Cancer Diagnosis Rider for SIFIHWL Simplified Issue FIH 41 Interest Sensitive Low Cash Value WL 2003 1999 2007 2000 2010 2006 2012 |
 Product Innovation Continues Advancing health care technology and government policy relaxing guidelines for mixed treatment Nov. 2011 Outpatient Treatment Rider for Sub-standard Medical Nov. 2011 Advanced Medical Treatment Rider for Sub-standard Medical Sep. 2012 Cancer Rider for Sub-standard Medical Government policy creating incentives for outpatient and in-home treatment 42 |
 Key Takeaways: Japan Products Broad product portfolio meeting customer lifetime needs Well-diversified and balanced Emphasis on lower capital intensive and high ROE products Leveraging global investment capability Continuing to innovate 43 |
 ASIA INVESTOR DAY 2012 Atsushi Yagai Executive Vice President, Strategy, Customer Marketing & Direct Marketing MetLife Alico Japan |
 Consumers Want a New Kind of Insurance Company Source: MetLife internal research. 70% of policyholders considering changing their current policy 68% of consumers consider two brands or less 85% of consumers think life insurance is too difficult and complicated Become easier to do business with Enhance brand recognition and preference Focus on post-sale follow-up 45 MetLife Alico Response Industry |
 Persistency Ratio Post-sale Follow-up Leads to Greater Retention Key Initiatives Agent notification system for unpaid and lapsed policies Increase credit card usage “Orphan” customer management Align incentives to persistency improvement 46 81% 82% 83% 84% 85% 86% 87% 88% 2008 2009 2010 2011 |
 Become Easier To Do Business With New Business Benefit Payment Relationship Management Enhance self-service capabilities Streamline and simplify claims process Redesign new business process and simplify forms 47 |
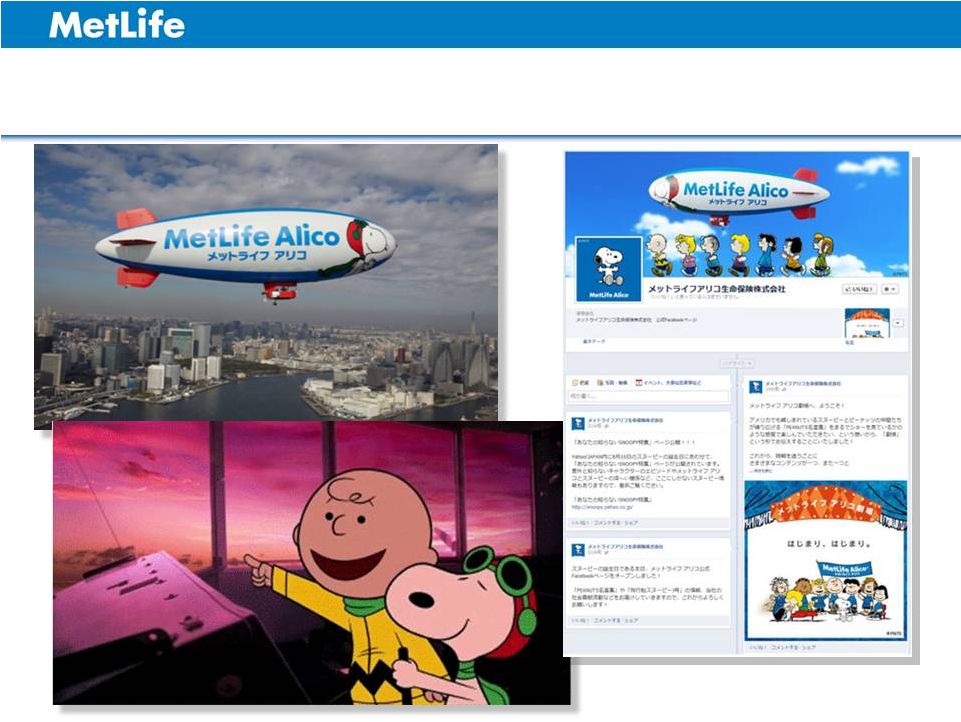 Enhance Brand Recognition and Preference 48 |
 Key Takeaways: Japan Customer Centricity & Brand Enhancement Customers want a new kind of insurance company Post-sale follow-up driving persistency improvements Becoming easier to do business with will drive growth and value creation Leveraging unique brand assets to enhance our brand Efficiency Persistency / Brand Preference Sales 49 |
 ASIA INVESTOR DAY 2012 William Hogan Chairman & Chief Executive Officer MetLife Alico Japan Summary |
 Growth Value Multiplier 51 Key Takeaways: MetLife Alico Japan |
 ASIA INVESTOR DAY 2012 Jong Kim Chief Executive Officer MetLife Korea |
 MetLife Korea – Building Value Through Discipline Focused on productivity and profitability Top-tier Career Agency Fast growing General Agency Successful launch of Accident & Health initiative 53 |
 Increasing demand for Accident & Health products General Agency is the fastest growing channel Rapidly aging society driving need for retirement solutions One of the first to launch individual retirement products Leverage Career Agency expertise to drive General Agency success Market growth is slowing Enhance sales skills and productivity in the Agency Channel; focus on margin improvement 54 Korea - Strategic Direction Continue successful A&H rollout |
 Korea – Demographic Trends Age Distribution in Korea Source: Statistics Korea; data as of Dec. 2011. Korea will become a “super- aged society” by 2026 Dependent population increasing, driving need for retirement and protection products MetLife one of the first to provide individual retirement products following regulation change 55 16% 13% 13% 73% 71% 63% 11% 16% 24% 0% 20% 40% 60% 80% 100% 2010 2020 2030 0-14 15-64 65+ |
 Focused on Margin Improvement Leveraging technology to drive persistency gains and improve productivity Revamped distributor compensation to better align incentives with persistency Maintain pricing discipline while offering competitive products 56 |
 Top-Tier Career Agency Drives Sales Growth Source : Korea Life Insurance Association and MetLife internal research. Note : MetLife Plan FX rate of $1 = 1,095 won. See Appendix for non-GAAP financial information, definitions and/or reconciliations. Strong growth in professional career agents Focus on agent productivity #1 in % of Million Dollar Round Table (MDRT) qualifiers Career Agency Channel New Sales ANP 57 |
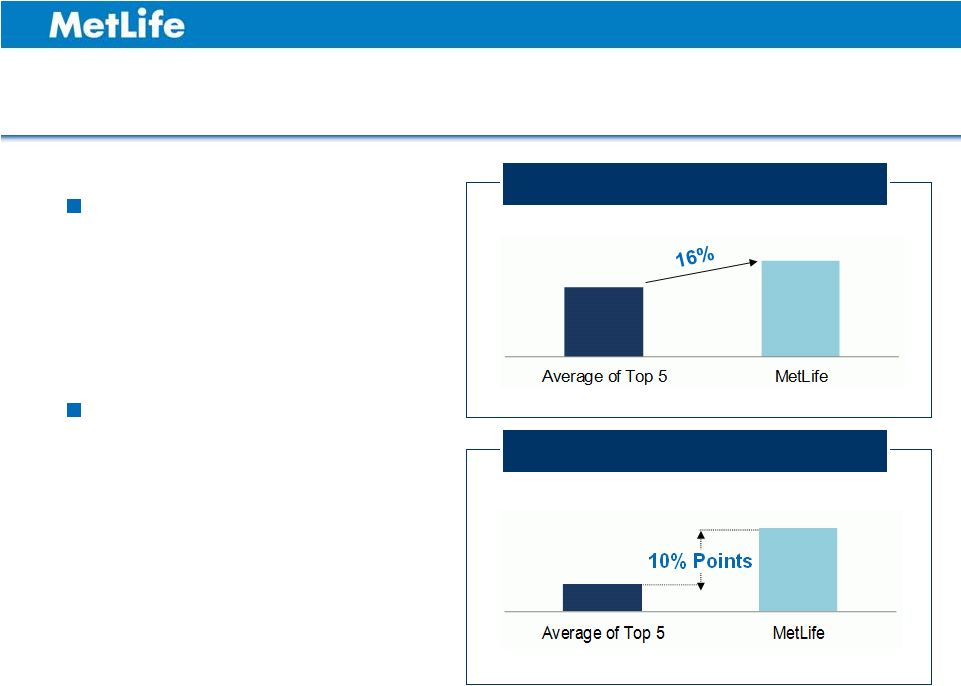 Career Agency – High-Quality Agents Highest agent productivity in the market 25% of agents qualified for MDRT Based on monthly new premiums per agent. Source : Korea Life Insurance Association and MetLife internal research. Note : MetLife Plan FX rate of $1 = 1,095 won. Agent Productivity 1 (2011) % MDRT Qualifiers (2011) 58 1 |
 “A Day in the Life of Two Agents” Launched a mobile sales system to over 4,500 agents Generated 8% of sales leads through mobile sales system Plan to roll out mobile service system to customers in January 2013 59 |
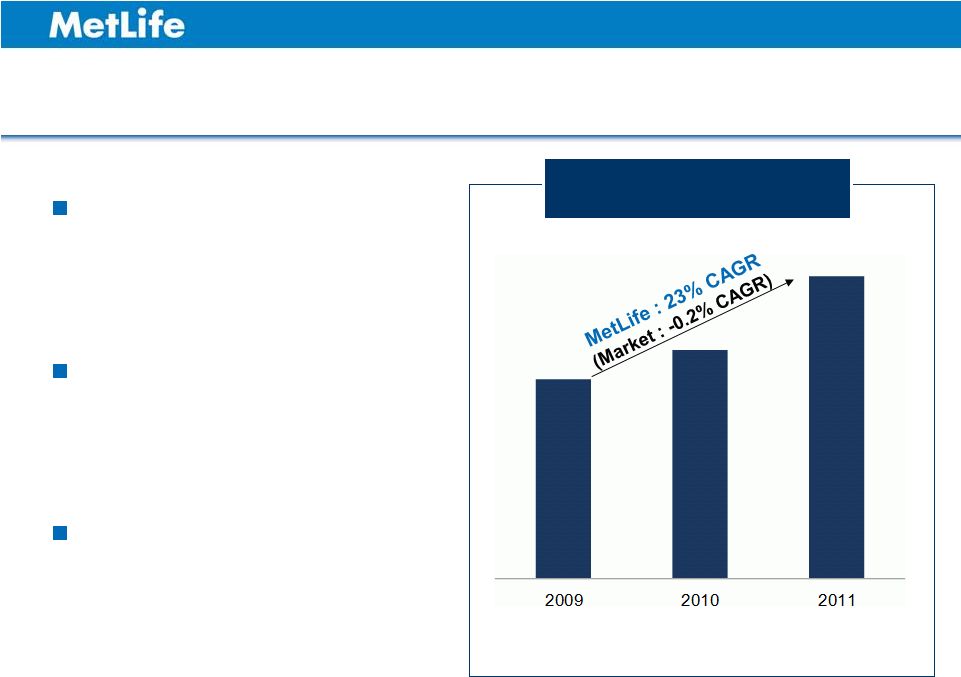
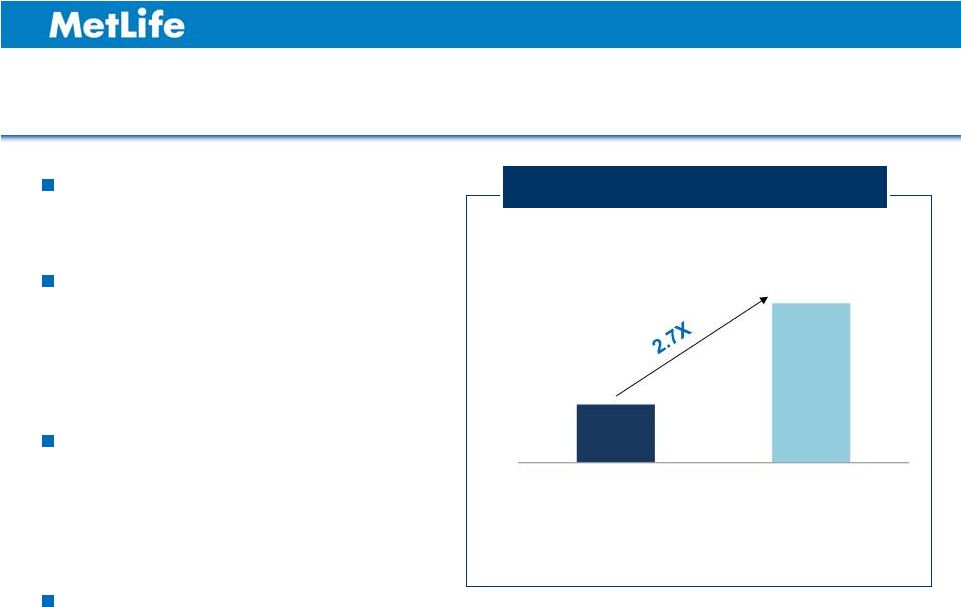
 General Agency – Fastest Growing Channel in the Market Source : Korea Life Insurance Association and MetLife internal research. Note : MetLife Plan FX rate of $1 = 1,095 won. See Appendix for non-GAAP financial information, definitions and/or reconciliations. General Agency Channel New Sales ANP MetLife’s General Agency business grew four times faster than the market Increasing number of General Agency partners Profitable mix of products 60 2009 2010 2011 |
 Successful Launch of Accident & Health Initiative Note : MetLife Plan FX rate of $1 = 1,095 won. See Appendix for non-GAAP financial information, definitions and/or reconciliations. Strong sales growth driven by: – “A&H Everything” initiative – Whole Life Cancer product launch, Sept. 2011 Innovative products leveraging MetLife Japan expertise Accident & Health products drive higher returns for the business 61 Monthly Average New Sales of A&H in 2011 (ANP, stand-alone only) 2010 2011 Jan-Aug Sep-Dec A&H New Sales ANP |
 Korea - Key Takeaways Focused on maximizing productivity and profitability Continued success in Career Agency Career Agency expertise leveraged in General Agency channel Positioned to capture retirement and Accident & Health opportunities 62 |
 ASIA INVESTOR DAY 2012 Bob Pei Chief Executive Officer Sino-US United MetLife |
 MetLife in China – Building a Strong Franchise for the Future Maintaining strong sales growth into 2012 Strategically expanding footprint in China Continuing to build on strong multi-channel distribution capabilities Disciplined marketing strategy Strong joint venture partner relationship 64 |
 Employee benefits market emerging Insurance penetration increasing in Tier 2 and Tier 3 cities Continue to expand into new provinces and cities Expand employee benefits offering Market growth is slowing; increasing regulation Continue leading position in Direct Marketing and expand agency penetration in existing cities Deepen relationship with banks 65 China - Strategic Direction Foreign insurers share remains low overall; higher in Tier 1 cities Continue disciplined marketing strategy and focus on target market segments |
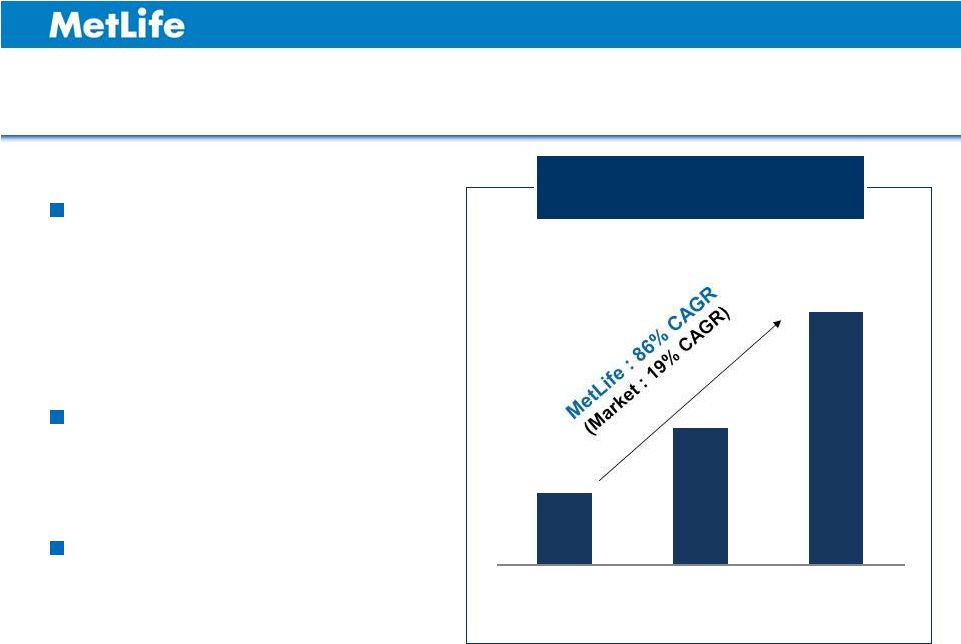
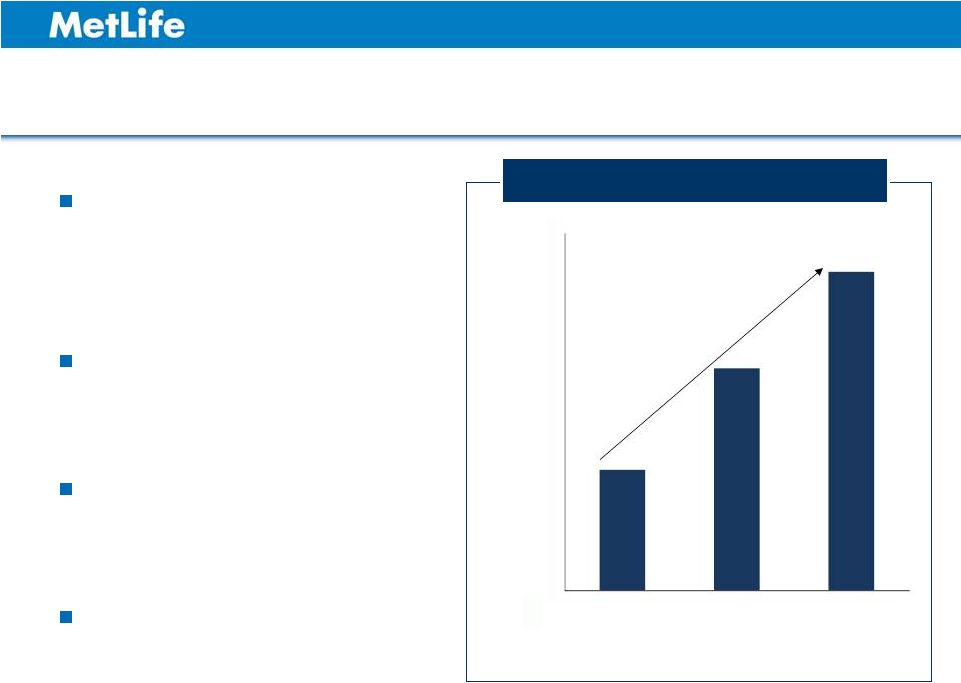
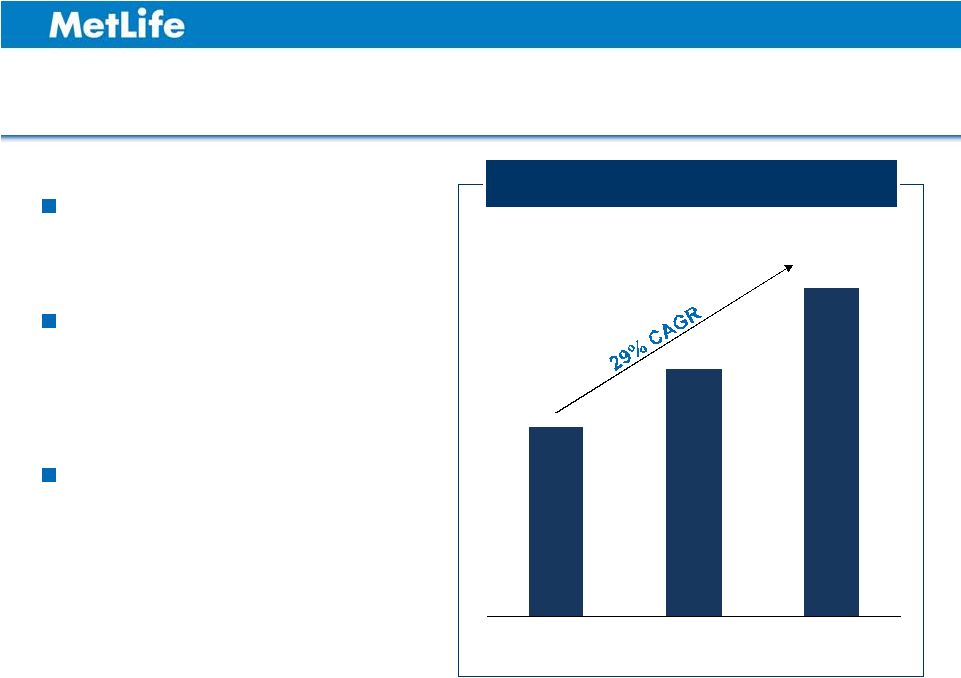 Strong Growth in China Source : MetLife Plan FX rate of $1 = 6.225 yuan. See Appendix for non-GAAP financial information, definitions and/or reconciliations. Geographic expansion Improving productivity of all channels Successful merger of joint ventures in 2011 Premiums, Fees and Other Revenues 66 2009 2010 2011 |
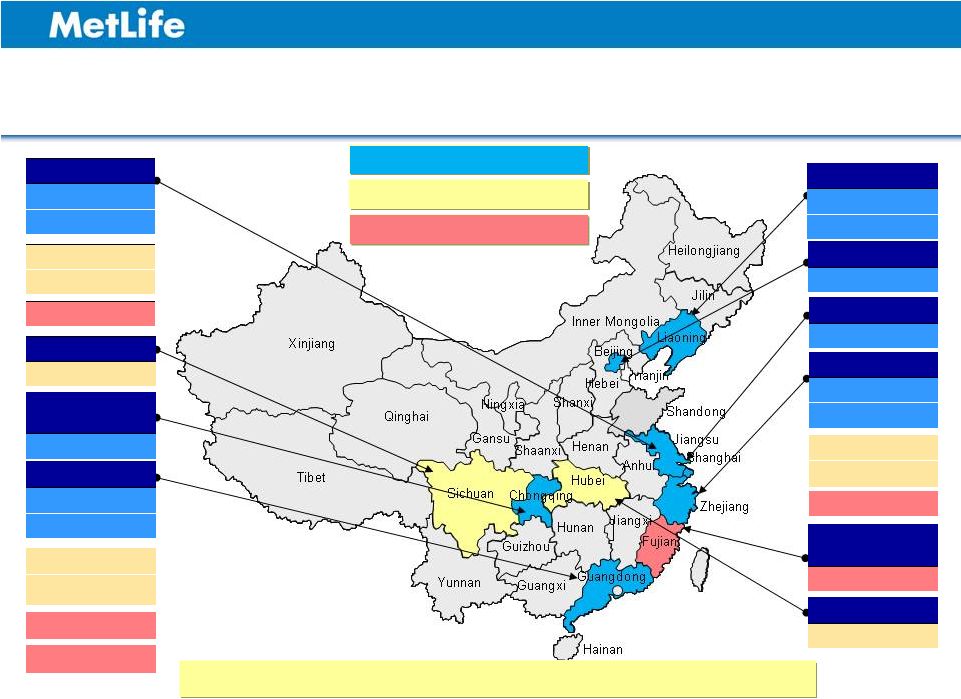 MetLife in China – Expanding Footprint 11 cities at 2009 end Chongqing Branch Chongqing Jiangsu Branch Nanjing Wuxi Guangdong Branch Guangzhou Shenzhen Beijing HO Beijing Liaoning Branch Dalian Shenyang Zhejiang Branch Hangzhou Ningbo Shanghai HO Shanghai 19 cities at 2010 end Sichuan Branch Chengdu Suzhou Nantong Foshan Dongguan Shaoxing Wenzhou Fujian Branch Fuzhou Changzhou Zhuhai Jinhua Hubei Branch Wuhan Shantou MetLife had access to 37% of the insurance market at YE 2011 Source: MetLife internal research. 67 24 cities at 2011 end |
 Diversified Channels and Balanced Business Direct Marketing and Bancassurance resulting in faster payback on new city entry Building Agency and Group as markets and operations mature Expanding beyond Tier 1 to capture higher growth in Tier 2 and Tier 3 cities Distribution Mix & Geographic Split ANP 1H 2012 68 See Appendix for non-GAAP financial information, definitions and/or reconciliations. DMTM Group Bancassurance Agency Tier 1 Tier 2 Tier 3 |
 Market Leader in Direct Marketing Over 3,000 Telemarketing Sales Representatives (TSRs), focused on Accident & Health Highest productivity among competitors Strong capability in generating leads Operate through sponsors and proprietary channels Rapidly Growing TSR Base 69 500 1,000 1,500 2,000 2,500 3,000 3,500 2009 2010 2011 0 1 1 National Life Insurers’ Direct Marketing / Telemarketing Data Exchange; data as of July 2012. |
 Leading insurer with foreign banks 1 Strong account / wholesaler management and best-in-class training Expertise in targeting mass affluent segment Balanced product portfolio with A&H, Life and Retirement Track record for product innovation in variable products Differentiated Bancassurance Model 1 Data as of June 2012 as provided by distribution partners. 70 |
 Highly Productive Agency Force Market leader in productivity Success based on selective recruiting process and compensation system Need based selling model and e-solution to differentiate from competitors Focused on protection products 1 National Insurance Industry Communication Club; data as of July 2012. 2 Includes only joint ventures operating in China. Agency Productivity 71 Peer Average MetLife 2 1 |
 China - Key Takeaways Growing faster than the market True multi-channel expertise Disciplined approach to expansion Optimize channel approach to city maturity & customer needs A diversified, balanced and disciplined business 72 |
 ASIA INVESTOR DAY 2012 Toby Brown Chief Financial Officer MetLife Asia |
  A Growing Financial Position in Asia 74 ($ in millions) 1H 2011 1H 2012 Change Operating Earnings $395 $572 45% Annualized New Premiums (ANP) $1,569 $1,780 13% Premiums, Fees and Other Revenues $4,300 $4,609 7% Operating Expense Ratio 26.4% 24.3% -210 bps Japan SMR 896% 896% - Capital Repatriation - $1,575 - 1 1 2 2 3 3 1 May 31, 2012 and 2011, respectively. 2 China operating earnings and ANP included at 50% for non-consolidated joint venture. 3 Excludes the China joint venture, which is recorded as net investment income in MetLife Asia’s consolidated financial statements. See Appendix for non-GAAP financial information, definitions and/or reconciliations. MetLife ALICO Japan has a fiscal year-end Nov. 30. Therefore, the results presented for the first half of 2012 and 2011 reflect its operating results for the six months ended |
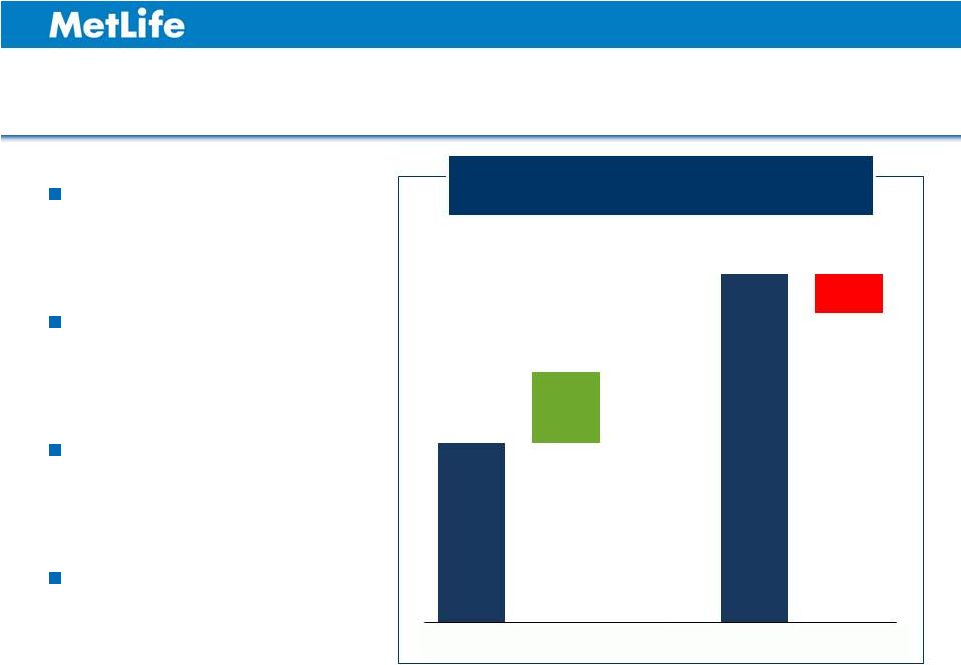 Operating Earnings Growth 75 Asia Operating Earnings up 45%; Up 26% on an Adjusted Basis 1 Reflects $44 million in claims and expenses related to Japan earthquake and tsunami. 2 Reflects $24 million of higher than planned variable investment income, partially offset by a net $5 million in DAC and other actuarial items. See Appendix for non-GAAP financial information, definitions and/or reconciliations. Strong core performance, improved operating margin Repositioning of Japan DM business 1H 2011 includes Japan earthquake & tsunami 1H 2012 includes variable investment income $ in Millions 1 2 1H 2011 Adjusting Items 1H 2012 Adjusting Items $395 $44 $572 ($19) |
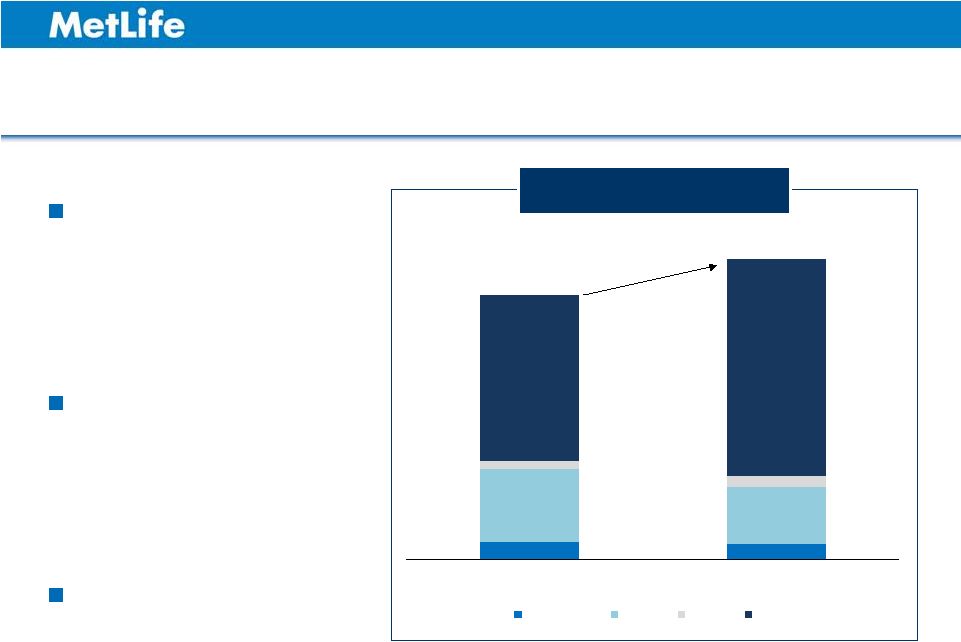 Strong New Business Growth 76 ANP up 13% $1,569 $1,780 ($ in Millions) MetLife has a strong and growing position in Japan Well positioned in Korea and emerging markets Our focus is on disciplined growth See Appendix for non-GAAP financial information, definitions and/or reconciliations. 1H 2011 1H 2012 Other Asia Korea China Japan |
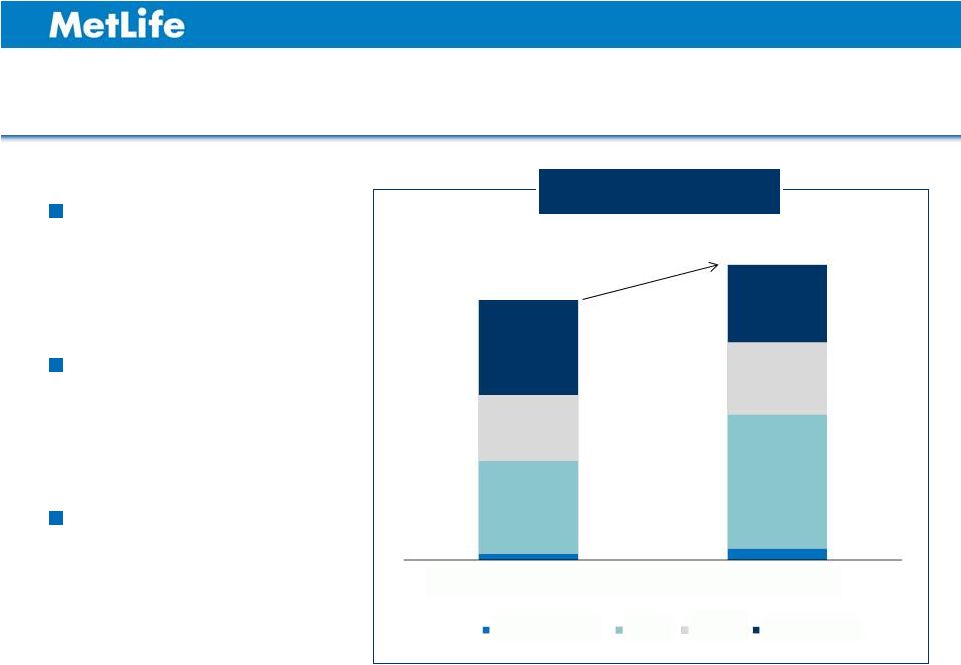 77 $1,569 $1,780 ANP up 13% ($ in Millions) Growth weighted towards protection Clear, disciplined pricing process Proactive portfolio management Broad Based Growth Across Product Segments See Appendix for non-GAAP financial information, definitions and/or reconciliations. 1H 2011 1H 2012 Group & Credit Life A&H Retirement |
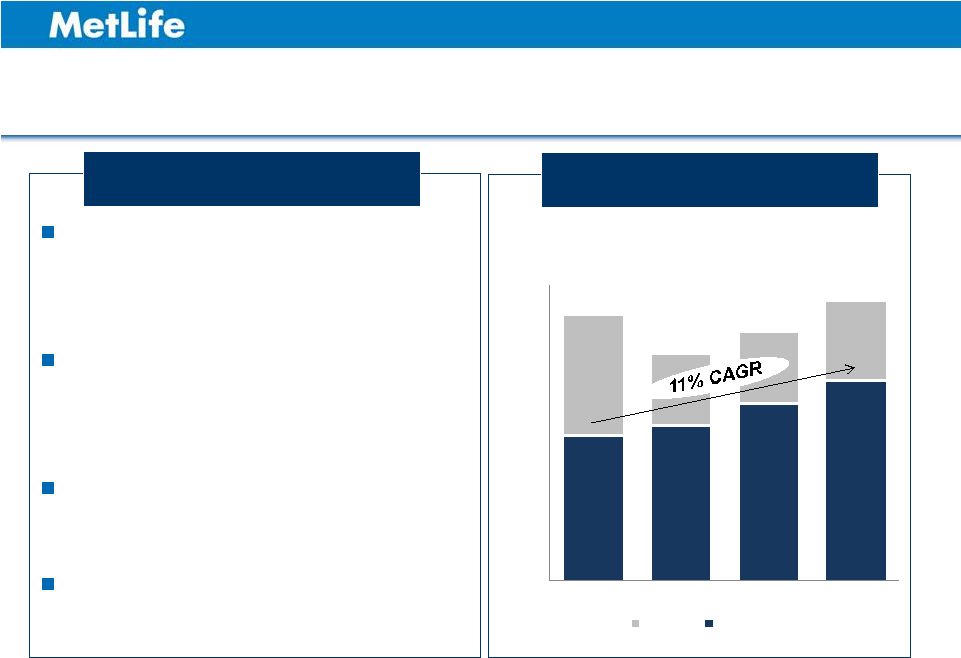
 78 PDOC up 11%, PFOs up 7% $9,963 $11,070 ($ in Millions) Double digit statutory renewal premiums growth Increasing brand activities in key markets Strong focus on customer centricity Increasing distribution efficiency Increased Multiplier from Persistency Initiatives $4,300 $4,609 Statutory Premiums, Deposits and Other Considerations Premiums, Fees and Other Revenues See Appendix for non-GAAP financial information, definitions and/or reconciliations. 1H 2011 1H 2012 RNP FYP Single P 1H 2011 1H 2012 |
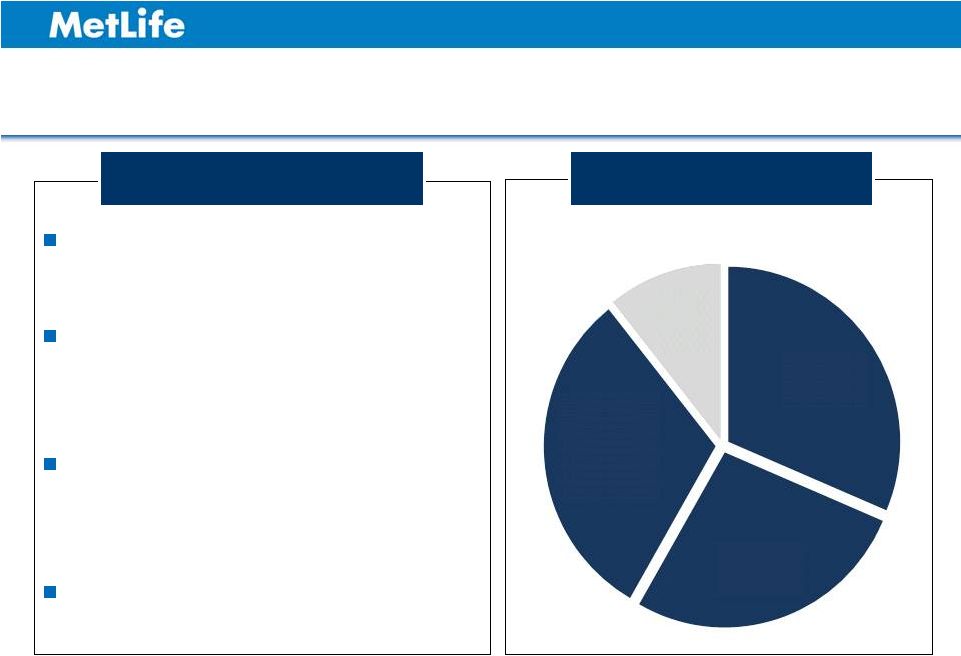
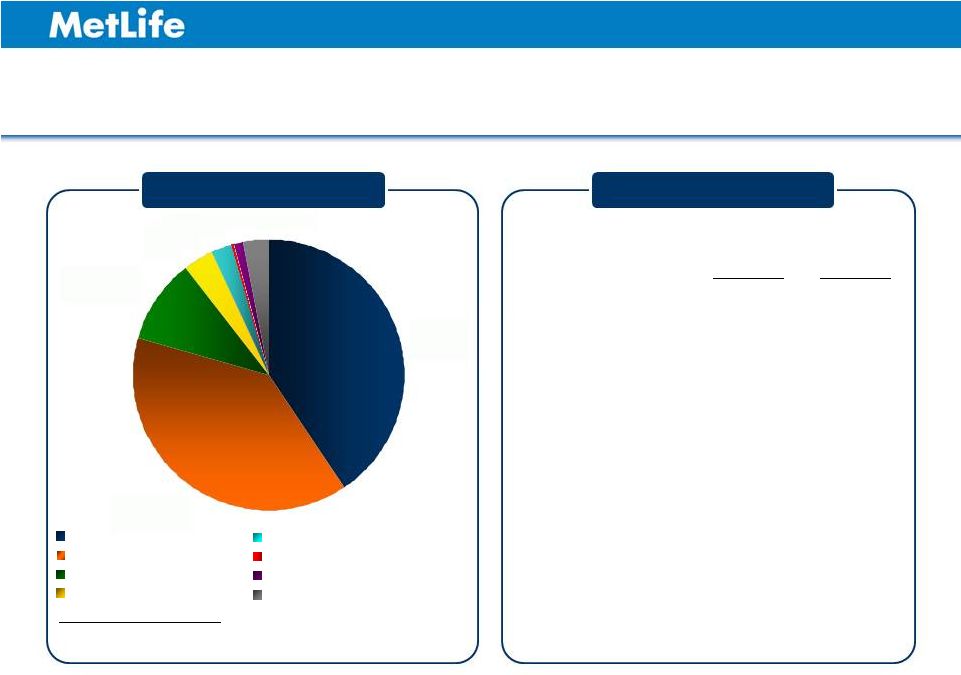 1H 2011 1H 2012 Net investment income $1,109 $1,383 Investment portfolio gains/(losses) ($68) ($127) Derivative gains/(losses) $41 $31 Managed Assets: $92.3 Billion 1 Asset Type Income 1 Estimated fair value as of June 30, 2012. See Appendix for non-GAAP financial information, definitions and/or reconciliations. Foreign Government Investment Grade Corps. Structured Finance U.S. Treasury & Agency Real Estate Below Investment Grade Corps. Corp. Equity Cash & Short-Term Investments 79 Asia Portfolio Credit Quality 91% A-rated or higher 99% investment grade 41% 10% 4% 2% <1% 39% 3% 1% |
 Macro and Strategic Overview Challenging Economic Environment Managing business / earnings impacts Maintaining credit quality Leveraging MetLife’s investment capabilities Investment Margin Expansion Strategies Leverage global credit skills Competitive advantage in private assets Cross-currency asset strategies Maintain Disciplined ALM Philosophy / Risk Management Highly diversified portfolio Liability-driven asset strategies Risk management focus 80 |
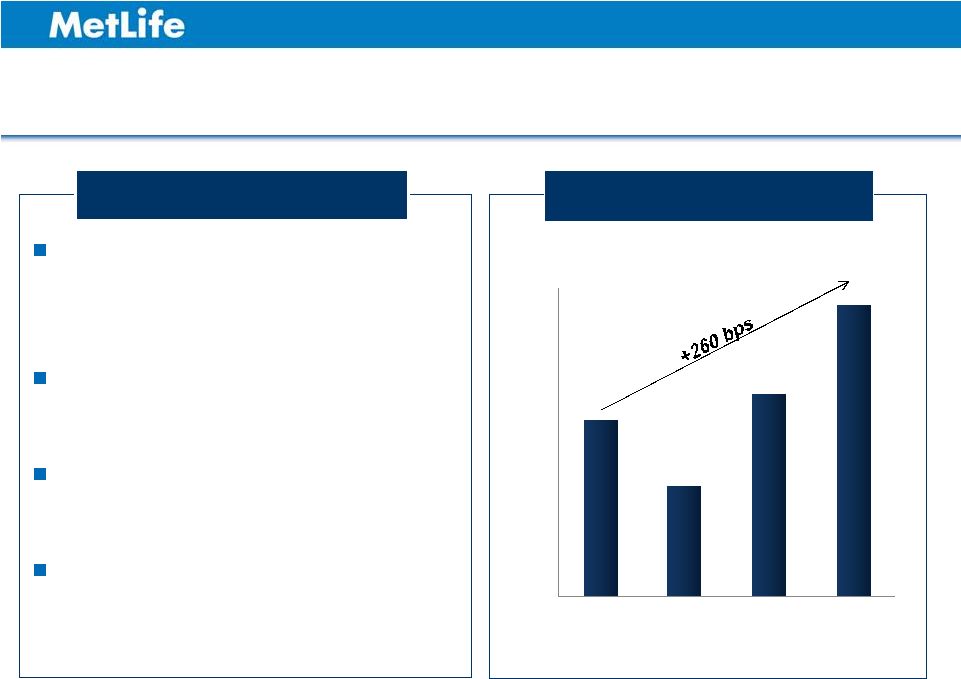
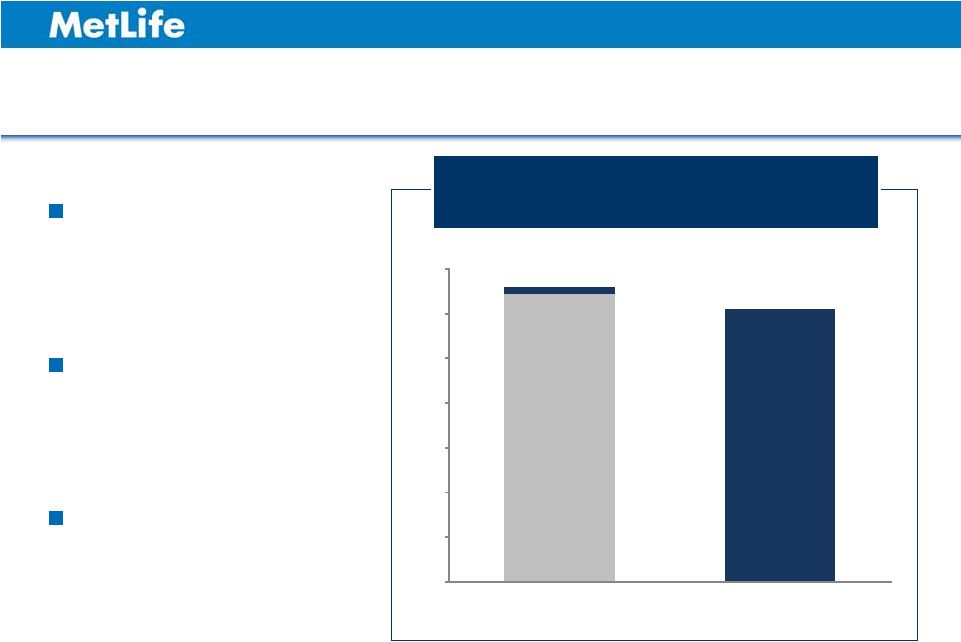 81 Operating Expense Ratio Improvement of ~210 bps; Expenses Nearly Flat YoY 1 Disciplined Expense Management Absolute spend levels nearly flat Increased sales and operating efficiency Impact of improved persistency on revenues 0% 4% 8% 12% 16% 20% 24% 28% 1H 2011 1H 2012 26.4% 25.7% 1 24.3% Excludes $28 million of expenses related to Japan earthquake and tsunami. See Appendix for non-GAAP financial information, definitions and/or reconciliations. |
 82 Strong Capital Position in Mature Markets Japan and Korea maintaining strong SMRs Subsidiary conversion in Japan completed, repatriated $1.57 billion Solvency Margin Ratio vs. Industry Average and Regulatory Minimum 1 0% 200% 400% 600% 800% 1000% Japan Korea Latest reported Industry Average Regulatory minimum Industry average is calculated using a simple average. Data from public filings as of June 30, 2012. 1 |
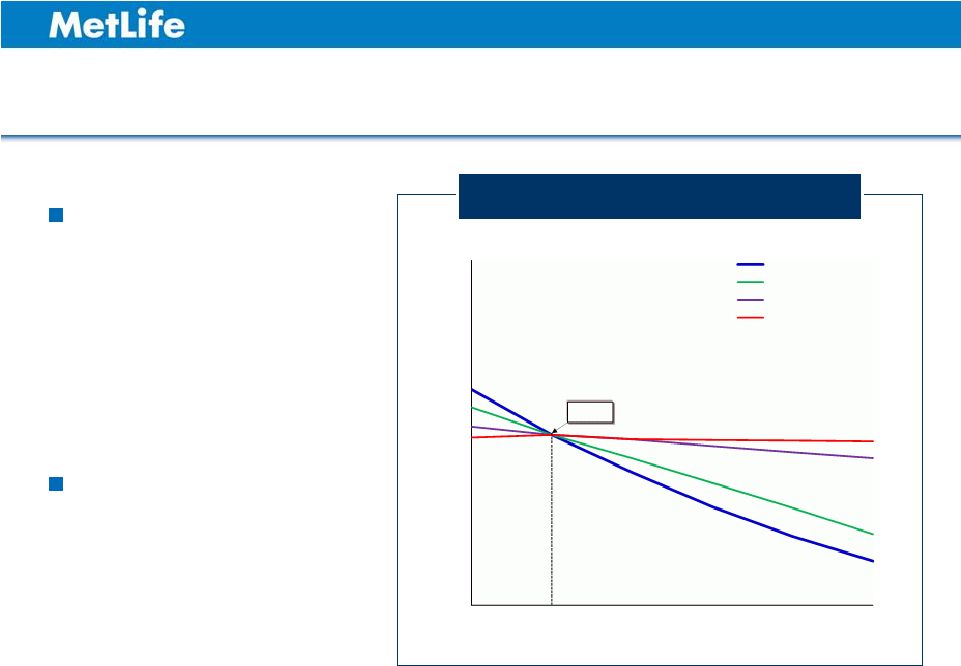 Sensitivity of Japan’s Solvency Margin Ratio to Interest Rate Movements 83 SMR expected to range between 600 - 700% for a 200 bps increase in Japanese interest rates Rising interest rates has a favorable economic impact on the business SMR Sensitivity to Interest Rates 1 As of June 30, 2012. 600% 700% 800% 900% 1000% 1100% 1200% -0.5% 0.0% 0.5% 1.0% 1.5% 2.0% Interest Rate Change Japan Rates Only US Rates Only Australian Rates Only Others 896% 1 |
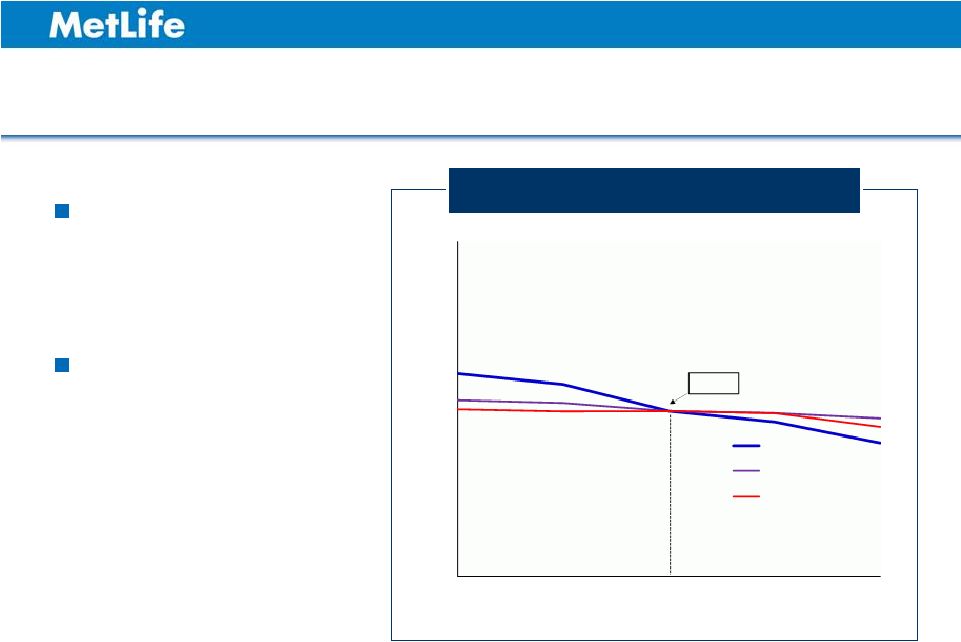 Sensitivity of Japan’s Solvency Margin Ratio to FX Rate Movements 84 FX has a modest impact on SMR ratio A strengthening Yen has a favorable economic impact on the business SMR Sensitivity to Exchange Rates 1 As of June 30, 2012. 600% 700% 800% 900% 1000% 1100% 1200% 100 90 79.31 70 60 $ / Yen Yen:USD Yen:AUD Yen:Others 896% 1 |
 Further Opportunities to Drive Value 85 Global scale and simplicity efficiency Increasing share of protection sales through our unique multi-channel touch points Increased investment margins Operational & sales efficiency Increased capital efficiency / deployment |
 Key Takeaways Asia is a core and growing contributor to MetLife Balance of mature, developing and emerging markets all with growth opportunities Maintaining profitability discipline despite macro headwinds Key initiatives capitalize on trends and opportunities Future opportunities to further increase value 86 |
 |
 ASIA INVESTOR DAY 2012 Appendix |
 Explanatory Note on Non-GAAP Financial Information 89 All references in these presentations (except in this Explanatory Note on Non-GAAP Financial Information slide) to operating earnings, premiums, fees and other revenues and operating return on equity, should be read as operating earnings available to common shareholders, premiums, fees and other revenues (operating) and operating return on MetLife, Inc.’s common equity, excluding AOCI, respectively. Operating earnings is the measure of segment profit or loss that MetLife uses to evaluate segment performance and allocate resources. Consistent with accounting principles generally accepted in the United States of America ("GAAP") accounting guidance for segment reporting, operating earnings is MetLife's measure of segment performance. Operating earnings is also a measure by which MetLife senior management's and many other employees' performance is evaluated for the purposes of determining their compensation under applicable compensation plans. Operating earnings is defined as operating revenues less operating expenses, both net of income tax. Operating earnings available to common shareholders is defined as operating earnings less preferred stock dividends. Operating revenues and operating expenses exclude results of discontinued operations and other businesses that have been or will be sold or exited by MetLife, Inc. (“Divested Businesses”). Operating revenues also excludes net investment gains (losses) (“NIGL”) and net derivative gains (losses) (“NDGL”). The following additional adjustments are made to GAAP revenues, in the line items indicated, in calculating operating revenues: • Universal life and investment-type product policy fees excludes the amortization of unearned revenue related to NIGL and NDGL and certain variable annuity guaranteed minimum income benefits ("GMIB") fees ("GMIB Fees"); • Net investment income: (i) includes amounts for scheduled periodic settlement payments and amortization of premium on derivatives that are hedges of investments but do not qualify for hedge accounting treatment, (ii) includes income from discontinued real estate operations, (iii) excludes post-tax operating earnings adjustments relating to insurance joint ventures accounted for under the equity method, (iv) excludes certain amounts related to contractholder-directed unit-linked investments, and (v) excludes certain amounts related to securitization entities that are variable interest entities ("VIEs") consolidated under GAAP; and • Other revenues are adjusted for settlements of foreign currency earnings hedges. |
 Explanatory Note on Non-GAAP Financial Information (Continued) 90 The following additional adjustments are made to GAAP expenses, in the line items indicated, in calculating operating expenses: • Policyholder benefits and claims and policyholder dividends excludes: (i) changes in the policyholder dividend obligation related to NIGL and NDGL, (ii) inflation-indexed benefit adjustments associated with contracts backed by inflation-indexed investments and amounts associated with periodic crediting rate adjustments based on the total return of a contractually referenced pool of assets, (iii) benefits and hedging costs related to GMIBs ("GMIB Costs"), and (iv) market value adjustments associated with surrenders or terminations of contracts ("Market Value Adjustments"); • Interest credited to policyholder account balances includes adjustments for scheduled periodic settlement payments and amortization of premium on derivatives that are hedges of policyholder account balances but do not qualify for hedge accounting treatment and excludes amounts related to net investment income earned on contractholder-directed unit-linked investments; • Amortization of deferred policy acquisition costs (“DAC”) and value of business acquired ("VOBA") excludes amounts related to: (i) NIGL and NDGL, (ii) GMIB Fees and GMIB Costs, and (iii) Market Value Adjustments; • Amortization of negative VOBA excludes amounts related to Market Value Adjustments; • Interest expense on debt excludes certain amounts related to securitization entities that are VIEs consolidated under GAAP; and • Other expenses excludes costs related to: (i) noncontrolling interests, (ii) implementation of new insurance regulatory requirements, and (iii) acquisition and integration costs. Operating return on MetLife, Inc.’s common equity is defined as operating earnings available to common shareholders divided by average GAAP common equity. Operating expense ratio is calculated by dividing operating expenses (other expenses net of capitalization of DAC) by premiums, fees and other revenues (operating). MetLife believes the presentation of operating earnings and operating earnings available to common shareholders as MetLife measures it for management purposes enhances the understanding of the company's performance by highlighting the results of operations and the underlying profitability drivers of the business. Operating revenues, operating expenses, operating earnings, operating earnings available to common shareholders, operating return on MetLife, Inc.’s common equity, operating return on MetLife, Inc.’s common equity, excluding AOCI, investment portfolio gains (losses) and derivative gains (losses) should not be viewed as substitutes for the following financial measures calculated in accordance with GAAP: GAAP revenues, GAAP expenses, GAAP income (loss) from continuing operations, net of income tax, GAAP net income (loss) available to MetLife, Inc.'s common shareholders, return on MetLife, Inc.’s common equity, return on MetLife, Inc.’s common equity, excluding AOCI, net investment gains (losses) and net derivative gains (losses), respectively. |
 Explanatory Note on Non-GAAP Financial Information (Continued) Managed Assets is a financial measure based on methodologies other than GAAP. MetLife utilizes “Managed Assets” to describe assets in its investment portfolio which are actively managed and reflected at estimated fair value. MetLife believes the use of Managed Assets enhances the understanding and comparability of its investment portfolio by excluding assets such as policy loans, other invested assets, mortgage loans held-for-sale, and mortgage loans held by consolidated securitization entities, as substantially all of those assets are not actively managed in MetLife’s investment portfolio. Trading and other securities are also excluded as this amount is primarily comprised of contractholder-directed unit-linked investments, where the contractholder, and not the company, directs the investment of these funds. Mortgage loans and certain real estate investments have also been adjusted from carrying value to estimated fair value. For the historical periods presented, reconciliations of non-GAAP measures used in this presentation to the most directly comparable GAAP measures are included in this Appendix to the presentation materials and are on the Investor Relations portion of our Internet website. Additional information about our historical results is also available on our Internet website in our Quarterly Financial Supplements for the corresponding periods. The non-GAAP measures used in this presentation should not be viewed as substitutes for the most directly comparable GAAP measures. In these presentations, we sometimes refer to sales activity for various products. These sales statistics do not correspond to revenues under GAAP, but are used as relevant measures of business activity. In these presentations, we provide guidance on our future earnings, premiums, fees and other revenues, and return on common equity on an operating or non-GAAP basis. A reconciliation of the non-GAAP measures to the most directly comparable GAAP measures is not accessible on a forward-looking basis because we believe it is not possible to provide other than a range of net investment gains and losses and net derivative gains and losses, which can fluctuate significantly within or without the range and from period to period and may have a significant impact on GAAP net income. 91 |
 Definitions |
 Definitions Sales / Annualized New Premiums: • 10% of single-premium deposits (mainly from retirement products such as variable annuity, fixed annuity and pensions) count towards Annualized New Premiums. 20% of single-premium deposits from credit insurance count towards Annualized New Premiums. • 100% of annualized full year premiums and fees from recurring-premium policy sales of all products (mainly from risk and protection products such as individual life, accident & health and group) count towards Annualized New Premiums. 93 |
 Reconciliations |
 95 MetLife ALICO Japan has a fiscal year-end Nov. 30. The results presented for the six months ended June 30, 2012 and 2011 reflect its operating results for the six months ended May 31, 2012 and 2011, respectively. Reconciliation of Operating Earnings Available to Common Shareholders to Net Income (Loss) Available to MetLife, Inc.’s Common Shareholders – Asia ($ in Millions) Six Months Ended June 30, 2011 2011 Operating earnings available to common shareholders $ 572 $ 395 $ 867 Adjustments from operating earnings available to common shareholders to net income (loss) available to MetLife, Inc.'s common shareholders: Add: Net investment gains (losses) (139) (158) (291) Add: Net derivative gains (losses) 20 61 202 Add: Other adjustments to continuing operations (1) 29 19 Add: Provision for income tax (expense) benefit 33 38 41 Add: Income (loss) from discontinued operations, net of income tax - (60) (44) Less: Net income (loss) attributable to noncontrolling interest 11 1 6 Net income (loss) available to MetLife, Inc.'s common shareholders $ 474 $ 304 $ 788 Six Months Ended June 30, 2012 |
 96 1 Other expenses (operating) net of capitalization of DAC. Reconciliation of Premiums, Fees & Other Revenues (Operating) to Premiums, Fees & Other Revenues (GAAP) and Reconciliation of Operating Expense Ratio – Asia MetLife ALICO Japan has a fiscal year-end Nov. 30. The results presented for the six months ended June 30, 2012 and 2011 reflect its operating results for the six months ended May 31, 2012 and 2011, respectively. ($ in Millions) Six Months Ended June 30, 2012 Six Months Ended June 30, 2011 2011 Premiums, fees & other revenues (operating) 4,609 $ 4,300 $ 8,697 $ Adjustments from premiums, fees & other revenues (operating) to premiums, fees & other revenues (GAAP): Add: Universal life and investment-type product policy fees (2) - - Add: Other revenues 11 3 13 Premiums, fees & other revenues (GAAP) 4,618 $ 4,303 $ 8,710 $ Operating expenses 1 $ 1,120 $ 1,135 Operating expense ratio 24.3% 26.4% |
 ($ in Billions) At June 30, 2012 Total investments 91.9 $ Add: Cash and cash equivalents 2.8 Add: Fair value adjustments 0.1 Less: Policy loans 1.7 Less: Other invested assets (4.6) Less: Trading and other securities 5.4 Managed assets 92.3 $ 97 MetLife ALICO Japan has a fiscal year-end Nov. 30. The results presented for the six months ended June 30, 2012 and 2011 reflect its operating results for the six months ended May 31, 2012 and 2011, respectively. Reconciliation of Total Investments to Managed Assets - Asia |
 98 ($ in Millions) Six Months Ended June 30, 2012 Six Months Ended June 30, 2011 Net investment income (operating) $ Adjustments from net investment income (operating) to net investment income (GAAP): Add: Joint venture adjustments Add: Net investment income on contractholder-directed unit-linked investments Net investment income (GAAP) $ $ Investment portfolio gains (losses) $ $ Adjustments from investment portofilio gains (losses) to net investment gains (losses): Add: Other gains (losses) reported in net investment gains (losses) on GAAP basis Net investment gains (losses) $ $ Derivatives gains (losses) $ $ Adjustments from derivative gains (losses) to net derivative gains (losses): Add: Joint venture adjustments Add: Settlement of foreign currency earnings hedges Net derivative gains (losses) $ $ MetLife ALICO Japan has a fiscal year-end Nov. 30. The results presented for the six months ended June 30, 2012 and 2011 reflect its operating results for the six months ended May 31, 2012 and 2011, respectively. 1,383 - 149 1,532 (127) (12) (139) 31 - (11) 20 $ 1,109 (23) 91 1,177 (68) (90) (158) 41 23 (3) 61 Reconciliation of Net Investment Income (Operating) to Net Investment Income (GAAP), Reconciliation of Investment Portfolio Gains (Losses) to Net Investment Gains (Losses) and Reconciliation of Derivative Gains (Losses) to Net Derivative Gains (Losses) – Asia |
 |
Christopher G. Townsend
President, Asia
MetLife, Inc.

Christopher Townsend is president of MetLife’s Asia region and a member of the company’s executive group. Appointed to this position in August 2012, Townsend oversees all of MetLife’s businesses in Japan, Korea, Australia, Hong Kong and China.
Prior to joining MetLife, Townsend was, since 2010, chief executive officer of the Asia Pacific region at Chartis, a leading insurance organization serving more than 70 million clients around the world. In addition to leading all aspects of the business across the region, which included 4,700 employees in 15 countries, he oversaw the company’s risk, audit, compliance and investment divisions. As CEO, Townsend drove capital optimization, cost efficiency and a focus on client needs as he implemented a strategy to take advantage of opportunities to drive an above average return on equity.
From 2007 to 2010, Townsend was chief executive officer of Chartis Australasia, with responsibility for the company’s businesses across Australia and New Zealand. Working with many of the company’s internal and external stakeholders, he developed and executed on a three-year plan to deliver a superior compound annual growth rate and solid combined operating ratios. In addition to reorganizing the business around its customers, he drove innovation through product development and the implementation of an ebusiness initiative that helped differentiate Chartis from many of its key competitors.
Earlier in his career, Townsend was the CEO of Chartis Hong Kong, served as senior vice president of mergers and acquisitions and also held a number of senior leadership roles in Hong Kong, London and Sydney. He joined Chartis in the United Kingdom in 1991 and spent more than half of his 21-year career in the company’s Asia Pacific region.
Townsend has previously served as a board member of the Hong Kong Federation of Insurers, governor of the American Chamber of Commerce and board member of the Insurance Council of Australia. He is a Chartered Insurer.
# # #
William R. Hogan
Director, Representative Statutory Executive Officer,
Chairman and Chief Executive Officer
MetLife Alico Life Insurance K. K.

William R. Hogan is Director, Representative Statutory Executive Officer, Chairman and Chief Executive Officer of MetLife Alico Life Insurance in Japan. He has been in this role since January 2011 and is responsible for overseeing the Japan operations.
Prior to his current role, Hogan was appointed senior vice president, International Product Management for MetLife. In this role, he was responsible for leading MetLife’s International Business’s product management efforts with a clear accountability for the development, management and measurements of all products, institutional, individual or inbound reinsurance, outside of the United States. He also had responsibility for international strategy and risk management.
Hogan joined MetLife in July 2005, following MetLife’s acquisition of The Travelers Insurance Company, excluding certain assets, and substantially all of Citigroup’s international insurance operations. Upon joining MetLife, he was responsible for all individually underwritten products sold through retail distribution including bancassurance, third-party distribution, direct and telemarketing, as well as through the company’s agency forces outside the United States.
Prior to joining MetLife, Hogan was regional head of Latin America for CitiInsurance, Citigroup’s international insurance division. As regional head, he was in charge of all insurance operations for CitiInsurance in Latin America, including managing four insurance companies and supporting Citibank insurance distribution in 12 countries.
Before taking responsibility for the Latin America region, Hogan was senior vice president, Travelers Life & Annuity, responsible for the P&L and operations of the life insurance and the retail annuities businesses. From 1997 to 2000, Hogan served as vice president and chief actuary for Travelers Life & Annuity, responsible for corporate risk oversight and all budgeting and financial reporting. In addition, he was chief actuary for the group annuity business. He started his career as an actuarial student with Travelers and held a variety of positions including that of actuary, individual annuities product development and asset liability.
Hogan received a B. A. degree in mathematics from Williams College. He is also a fellow in the Society of Actuaries.
# # #
Sachin N. Shah
Statutory Executive Officer and Executive Vice President, Chief Operating Officer
MetLife Alico Life Insurance K. K.

Sachin N. Shah is Statutory Executive Officer and Executive Vice President, COO of MetLife Alico Life Insurance in Japan. In this role, Shah is responsible for overall strategy, marketing, branding, all distribution channels and distribution support functions in Japan. He was the global leader for the integration of Alico into MetLife until closing of the transaction.
He was named to this position in 2011 and has held several leadership roles at MetLife since joining the company almost 14 years ago.
Prior to his current position, Shah was responsible for developing and executing business strategy for MetLife’s international business. In this role, Shah identified and managed key growth initiatives as well as mergers & acquisitions in the international markets where MetLife operates. Examples include entry into group dental business in Brazil, expansion of pensions business in Mexico, launching bancassurance and career agency in India, re-positioning the career agency channel in China, and expansion of general agency channel in Mexico.
Shah received a B.S. degree in electrical engineering and a master’s degree in technology and business management from Stevens Institute of Technology in New Jersey. He has been recognized byWho’s Who in Management Professionals and most recently inWho’s Who of National Business Leaders.
# # #
Hiroyoshi Kitamura
Statutory Executive Officer and Executive Vice President, Profit Center & Products
MetLife Alico Life Insurance K. K.

Hiroyoshi Kitamura is Statutory Executive Officer and Executive Vice President in charge of Profit Center & Products of MetLife Alico Life Insurance in Japan. In this role, he is responsible for top line and bottom line of all products sold in Japan, as well as product development and product management.
Prior to this role, Kitamura was Vice President in charge of the Insurance Profit Center, where he was responsible for Life, A&H and Group products.
From 2004 to 2007, he held positions of Regional Assistant Vice President in charge of Medical Profit Center at AIG Japan and its Korea Regional Office. In this role, he supervised A&H product development and product management at three life insurance companies in Japan and one in Korea.
Kitamura has worked in product development related positions since he became manager of the Medical Product Profit Center in 2002. In this role, not only did he develop various new products including Life-style Related Disease Insurance, but he also succeeded in packaging value added services with A&H products so to enhance product competitiveness.
Prior to his role at Medical Product Profit Center, in 1997 Kitamura started up data based marketing in Alico Japan to accelerate up-selling and cross-selling activities in face-to-face distributions. In this role, he worked closely with distribution, as well as information technology and operations.
Kitamura started his career at Alico Japan in direct marketing where he worked as an account manager for some of Alico Japan’s sponsors, including credit card companies.
Kitamura received a B.A. degree from Meiji Gakuin University and an MBA from New York University.
# # #
Atsushi Yagai
Executive Officer and Executive Vice President
Strategy, Customer Marketing & Direct Marketing
MetLife Alico Life Insurance K. K.

Atsushi Yagai is Executive Officer and Executive Vice President in charge of Strategy & Marketing and Direct Marketing for MetLife Alico Life Insurance in Japan. He has been in this role since January 2011, when he joined the company.
Prior to joining MetLife, he held various executive roles including President and Representative Director for Timberland Japan, Executive Vice President and Director of Marketing & Sales for AFLAC Japan, and President and Representative Director for Barilla Japan. Yagai began his career at Dentsu Inc. as an Account Executive. He also has consulting experience at McKinsey & Company.
Yagai graduated from Keio University with a Bachelor in Economics, and received an MBA from IMD-Lausanne.
# # #
Jong Kim
Chief Executive Officer
MetLife Korea

Jong Kim has been CEO of MetLife Korea since August 2009, and is concurrently serving as Chairman of the MetLife Welfare Foundation, established in 2005. As CEO, he is responsible for P&L of MetLife Korea, overseeing diverse distribution channels: Professional Agency, Bank Distribution and Institutional Business.
Prior to becoming CEO, Kim was the Chief Operating Officer from May 2007 to July 2009. In this role, he successfully grew the career agency from approximately 3,000 to 5,300 agents. The professional agency organization of MetLife Korea is highly regarded in the Korea life insurance industry and a critical component of MetLife Korea’s success.
Prior to re-joining MetLife Korea in May 2007, Kim served as Senior Vice President at Korea Life Insurance Co. from October 2005 to April 2007, responsible for the newly established professional agency channel.
Previously at MetLife, Kim served as Head of Corporate Pension Business from January to September 2005. Prior to this position, he was the Managing Director of the Individual Business Department of the Los Angeles division of MetLife U.S.A. from October 2003 to December 2004. Also, Kim played a key role as Head of Individual Business of MetLife Korea from 1998-2003, successfully building the professional sales agent organization to approximately 2,000 agents by year-end 2003. In this role, he also helped to increase the number of sales agency branch offices to 80. Prior to this position, he served as Director of the sales support team from 1989 to 1998.
Kim first joined MetLife at the company’s Concord, California sales agency. During 1986 to 1989, he worked as a sales representative and then branch manager. Before joining MetLife, he worked at California Korea Bank from 1983 to 1984 as operations manager in Los Angeles, California. He began his career at Chase Manhattan Bank in Korea 1981.
Kim received his Bachelor of Business Administration from Korea University and his MBA from the University of California, Berkeley.
# # #
Bob Pei
Chief Executive Officer
Board member
Asia Pacific Region / China
Sino-US United MetLife

Bob Pei is the CEO of Sino-US United MetLife, which was created as a result of the merger between United MetLife – SAIL JV and Sino-US MetLife in April 2011. He has held this position since the merger. His primary strategic focus has been growing the MetLife franchise in China.
Prior to this position, Pei was the acting CEO of Sino-US MetLife (May 2010 – April 2011) and the CEO of United MetLife (August 2005 – May 2010).
Prior to MetLife, Pei was the CEO of CitiInsurance, Citigroup’s international insurance division, from 2004 to 2005. Under his leadership, United MetLife successfully completed the transition from CitiInsurance to MetLife, with Shanghai Alliance Investment Ltd. as MetLife’s JV partner, and the merger between United MetLife – SAIL JV and Sino-US MetLife.
Prior to becoming CEO of CitiInsurance, Pei held several senior positions at Citigroup in Asia. He was Vice President, Asia Pacific Business Development of Citigroup Global Consumer (2001-2004) and Vice President and Country Manager of Citigroup, Global Consumer Business Taiwan (1998 to 2001).
Before Citigroup, Pei worked for CIGNA Taiwan, where he held several key and diverse roles. He served as Country Manager from 1996-1998 and held the positions of CFO and Chief Agency Officer from 1991-1996.
From 1984 to 1991 Pei worked as an Audit Supervisor and Acting Controller for Hospital Corporation of America, one of the leading providers of healthcare services in the U.S., where he developed insights into the healthcare industry.
Pei is a certified public accountant and a member of the American Institute of Public Accountants. He served as Chairman, Insurance Committee and board member of the American Chamber of Commerce, WTO acting committee member - American Chamber of Commerce, board member of Taiwan Life Insurance Association and on the Business Development Committee of Taiwan Life Insurance Association.
Pei holds a B.S. degree in accounting from Soochow University (Taiwan) and an MBA in accounting from North Texas State University.
# # #
Toby Srihiran Brown
Senior Vice President and Chief Financial Officer – Asia
MetLife, Inc.

Toby Brown is Senior Vice President and Chief Financial Officer - Asia, for MetLife, Inc. since May 2011. He also concurrently serves as Executive Vice President, Strategic Finance of MetLife Alico Japan.
As CFO for Asia, Brown is responsible for the overall financial leadership of all of Metlife’s businesses in Asia including the existing Japan and Asia Pacific sub regional CFO organizations, Risk Management, Actuarial Valuation, Capital Management, Reinsurance, Product and Pricing Management, Tax/Financial Accounting and Controls, and Financial Planning and Analysis. Brown joined MetLife when they acquired Alico in November 2010.
Brown joined AIG/Alico in 2000, working first for parent company American International Group, Inc., as part of the global audit and consulting team, traveling extensively in the emerging market territories of Latin America, Western Europe, and Central & Eastern Europe. He also spent time at AIG Private Bank in Zurich.
Brown transferred permanently to Alico in 2002, where he held a number of positions of increasing responsibility within the Central and Eastern Europe Region (13 countries / 22 Life, Pension, Asset Management, Mutual Fund, and Shared Service Operations), most recently as Regional Chief Financial Officer and Head of Strategy (2008-2011) and immediately prior to this as Regional Chief Operating Officer (2003-2008) for all of Alico’s operations in Poland, Romania and the Baltics.
Before joining AIG and Alico, Brown worked for Coopers & Lybrand (now PricewaterhouseCoopers) in the UK.
Brown holds a Bachelors degree in Accounting and Finance, and also a MBA from Manchester Business School, UK.
He is a fellow member of the Institute of Chartered Accountants in England & Wales (FCA), and a fellow member of the Association of International Accountants (FAIA). He was also one of only 20 global financial leaders to be chosen for and complete the AIG/NYU Stern Executive CFO development program.
# # #
John D. McCallion
Vice President, Investor Relations
MetLife, Inc.

John D. McCallion is vice president and head of investor relations of MetLife, Inc., a leading global provider of insurance, annuities and employee benefit programs serving 90 million customers. Appointed to this position in February 2011, McCallion manages and coordinates the presentation of MetLife’s financial results, messages and strategies to the analyst and investor community.
Prior to overseeing MetLife’s investor relations department, McCallion was vice president and chief financial officer of the company’s investments department. In this role, he was responsible for managing the financial analysis and reporting, as well as the income and expense plan and projection process for the company’s more than $450 billion investment portfolio. He also had oversight of the impairment and valuation process for MetLife’s investments.
McCallion joined MetLife in July 2006 after spending 10 years in PricewaterhouseCoopers’ insurance audit practice, where he worked with multinational and U.S. clients in the life and property/casualty insurance industries.
McCallion received a B.S. degree in accounting from Syracuse University and an MBA from the University of Pennsylvania, The Wharton School. He is a certified public accountant and a member of the American Institute of Certified Public Accountants.
# # #