 2 0 1 2 Agenda GUIDANCE PRESENTATION Exhibit 99.1 |
 This presentation may contain or incorporate by reference forward-looking statements. Forward-looking statements give expectations or forecasts of future events and use words such as “anticipate,” “estimate,” “expect,” “project” and other terms of similar meaning. Any or all forward-looking statements may turn out to be wrong, and actual results could differ materially from those expressed or implied in the forward-looking statements. Predictions of future performance are inherently difficult and are subject to numerous risks and uncertainties, including those identified in the “Risk Factors” section of MetLife, Inc.’s filings with the U.S. Securities and Exchange Commission. The company does not undertake any obligation to publicly correct or update any forward-looking statement if it later becomes aware that such statement is not likely to be achieved. Additional discussion of forward-looking statements may be included in other slides in this presentation; if so, please refer to those slides for more information. The presentation may also contain measures that are not calculated based on accounting principles generally accepted in the United States of America, also known as GAAP. Additional discussion of non-GAAP financial information may be included in other slides in this presentation, on the Investor Relations portion of MetLife's website (www.metlife.com), or elsewhere on that website; if so, please refer to those slides or the website for more information. Cautionary Statement on Forward Looking Statements and Non-GAAP Financial Information 2 |
 Agenda Overview Steven A. Kandarian Chairman, President & Chief Executive Officer Finance John C.R. Hele Chief Financial Officer Q&A Appendix 3 |
 GUIDANCE PRESENTATION 2 0 1 2 Steven A. Kandarian Chairman, President & Chief Executive Officer |
 Strategy to Become a World-Class Company 5 Build Global Employee Benefits Business Refocus the U.S. Business Grow Emerging Markets Drive Toward Customer Centricity and a Global Brand G LOBAL * W ORLD -C LASS * S CALE |
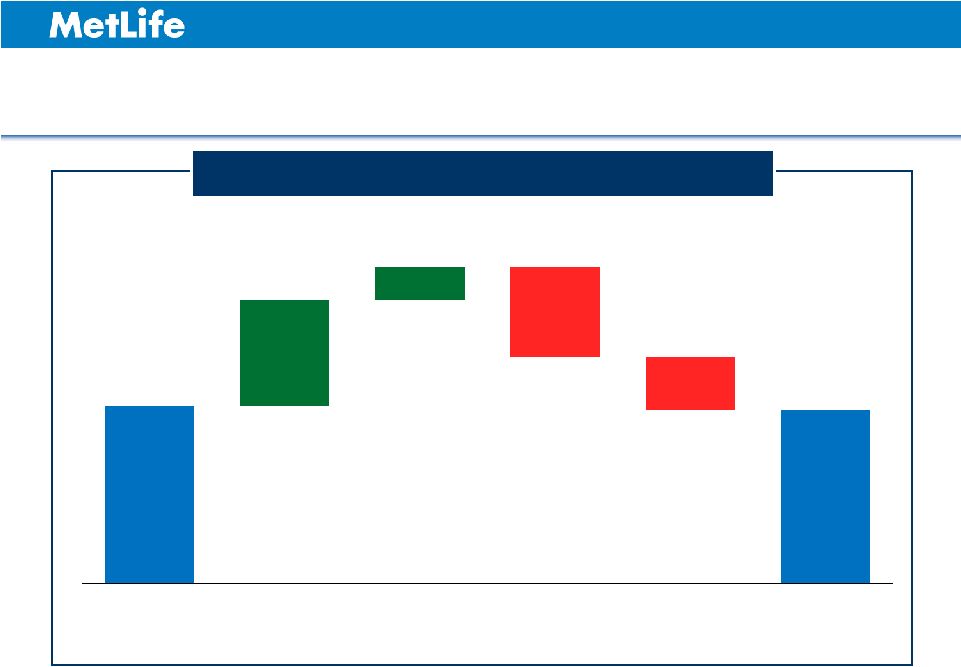
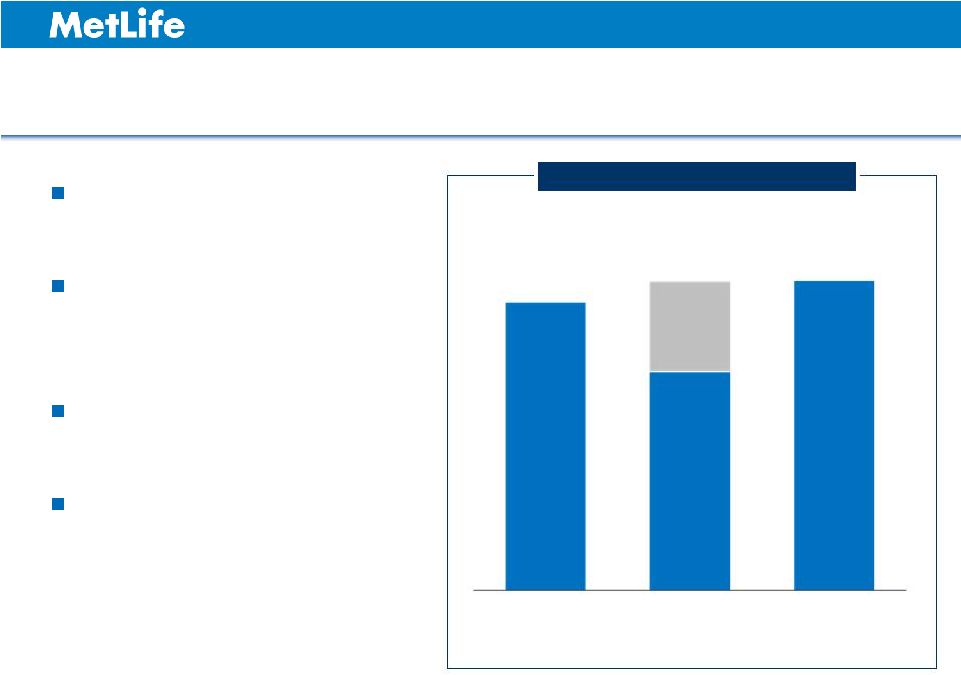 Full Year 2012 Financial Overview 6 $4.80 - $5.20 $4.03 3Q12 YTD 4Q12E $1.12 - $1.22 $5.15 - $5.25 (Operating Earnings per Share) 2012 Plan 2012E 2012E Normalized 2012 Plan vs Estimate 1 $5.22 - $5.32 1 The bars represent mid-points of ranges. See Appendix for non-GAAP financial information, definitions and/or reconciliations. 4Q12 estimate reflects impact from Superstorm Sandy Investment spreads benefit from variable investment income & interest rate hedges Improved underwriting margins Expenses remain under control |
 Mixed Global Economic Outlook Europe The Americas Japan Latin America U.S. Asia EMEA Asia (Ex-Japan) Low interest rates, regulatory and fiscal uncertainty, modest recovery Recession risk, increasing debt burden, high savings rate Sustainable growth, contained inflation, continued progress Cooling growth, moderate inflation, sound fiscal policy Recession, fiscal contraction, structural reforms proposed 7 |
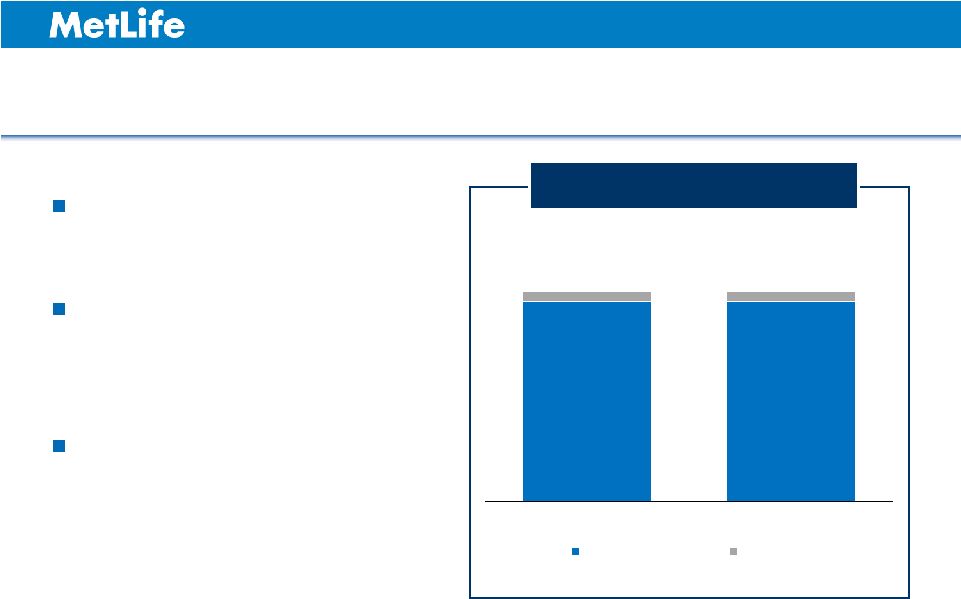
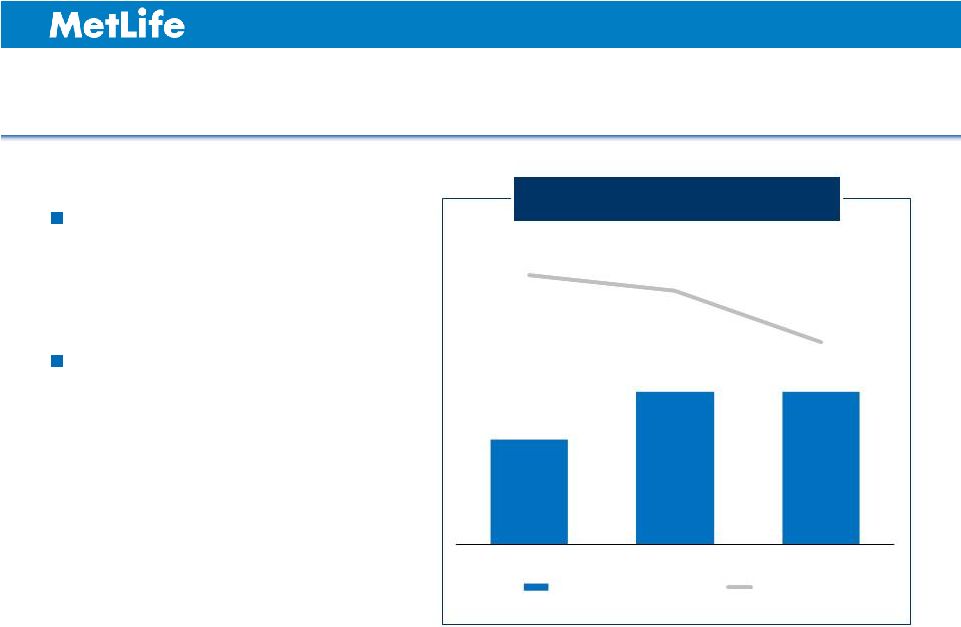 Interest Rate Hedge Income Flat, Portfolio Yield Declines Interest rate hedge income is estimated to be flat next year Effect of low reinvestment rates more evident in 2013 8 (Pre-tax $ in Millions) 1 Excludes Corporate & Other. 2012 Estimate and 2013 Plan represent mid-points of ranges. 2 Portfolio yield includes interest rate hedge income. 2 $370 $537 $537 5.66% 5.57% 5.27% 2011 2012 Estimate 2013 Plan Interest Rate Hedge Income Portfolio Yield U.S. Business 1 |
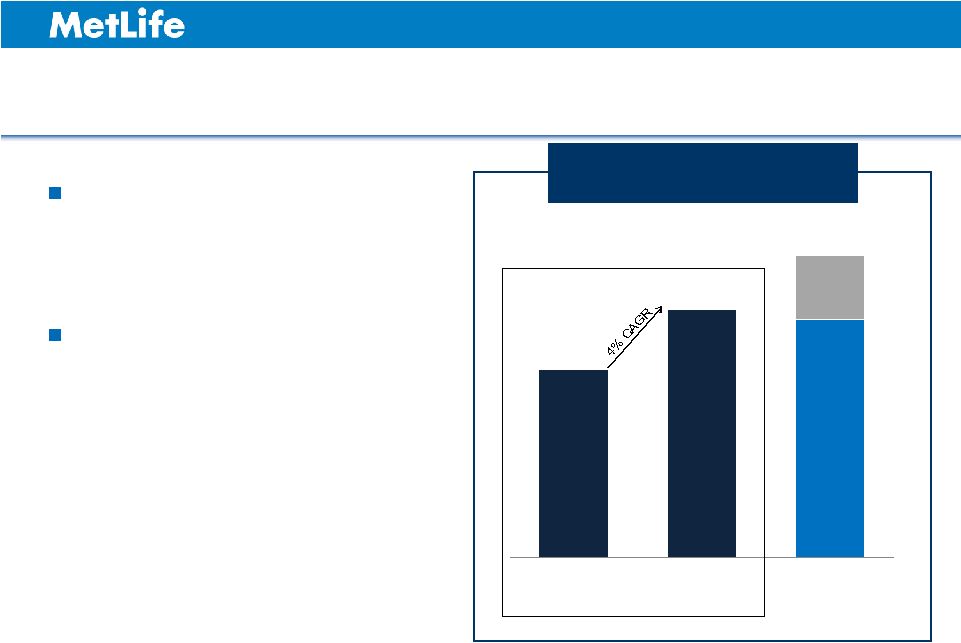 2013 Guidance Illustrates Resilience of Operating Earnings Low interest rate impact is consistent with what we have said previously Still project operating earnings growth over time even if rates remain low 2011 Normalized 2013 Low Rate Scenario 2013 Plan Low Rates Reducing Operating EPS Growth Rate as Expected $4.95 - $5.35 $5.07 2 $4.69 1 9 2 Represents a 4% compound annual growth rate, which is consistent with the hypothetical scenario (presented in the 3Q11 Earnings Call Supplement available on the Investor Relations portion of our Internet website (www.metlife.com)) where U.S. Treasury yields remain flat for five years. See Appendix for non-GAAP financial information, definitions and/or reconciliations. 1 Number not adjusted for divestment of bank. Adjusting for the divestment, 2011 normalized operating EPS is $4.61. |
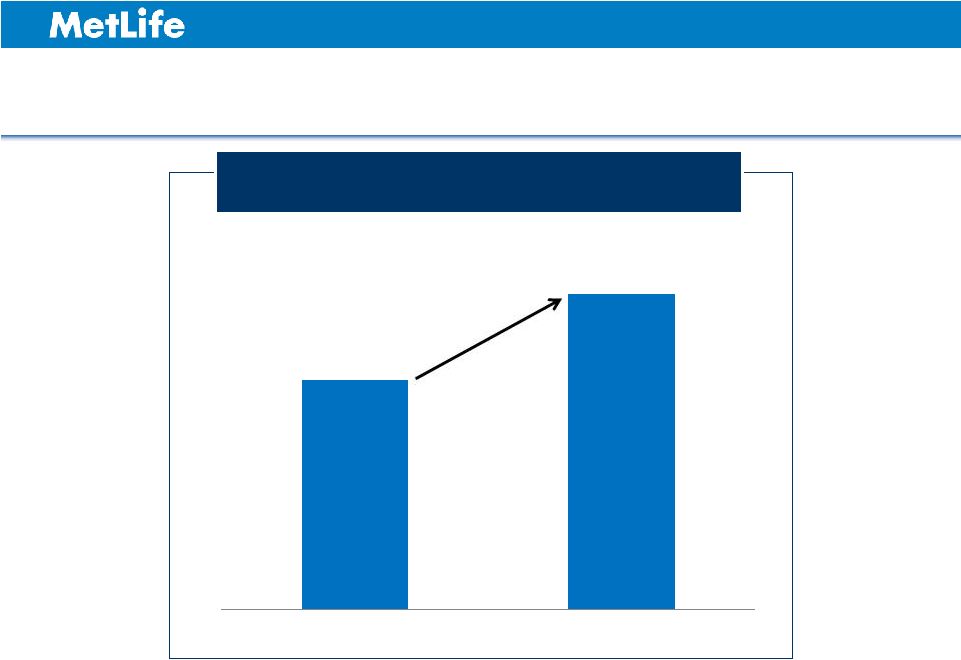 Expanding Operating ROE in a Challenging Environment Expect to Achieve 12% Operating ROE by 2016 Even if Interest Rates Remain Low 1 10 1 The bars represent mid-points of ranges. See Appendix for non-GAAP financial information, definitions and/or reconciliations. 12.0% - 14.0% 11.0% - 11.1% 2012 Estimate 2016 Target |
 Upward Trend in EPS and Operating ROE Despite Low Rates Growth in non-U.S. through 2016 should drive overall growth in operating earnings even if low interest rates persist Focused on what we can control, cost saves and strategic initiatives expected to contribute 200 bps to operating ROE by 2016 Sense of urgency around strategic initiatives considering elevated risk of lower-for-longer interest rate scenario 11 See Appendix for non-GAAP financial information, definitions and/or reconciliations. |
 Base Case is Business Generates Excess Capital Assuming regulatory capital rules reflect the insurance business model, MetLife should generate excess capital Shift from market sensitive to protection products improves our risk profile and free cash flow Goal is to increase free cash flow from approximately 40% of operating earnings to at least 50% over time We remain committed to returning capital to shareholders 12 See Appendix for non-GAAP financial information, definitions and/or reconciliations. |
 GUIDANCE PRESENTATION 2 0 1 2 John C. R. Hele Executive Vice President & Chief Financial Officer |
 Agenda Review of estimated results – Fourth quarter 2012 – Full year 2012 Review of 2013 plan 14 |
 Fourth Quarter 2012 Estimate See Appendix for non-GAAP financial information, definitions and/or reconciliations. 15 ($ in Millions, except per share data) Operating Earnings $1,215 - $1,320 Operating Earnings per Share 1.12 $ - 1.22 $ PY Development/CATs DAC and Other Assumption Items Reorganization Costs Variable Investment Income Q4 2012 "Normalized" Operating EPS 1.19 $ - 1.29 $ DAC and Other ($750) - ($550) Net Investment Gains/(Losses) ($200) - ($100) Net Derivative Gains/(Losses) ($300) - $300 Book Value per Share (including AOCI) $57.57 - $58.01 Book Value per Share (excluding AOCI) $46.97 - $47.41 4th Quarter 0.06 0.01 (0.05) 0.05 |
 4Q12 DAC and Other Actuarial Assumptions Update 16 Projected charge of $600 - $800 million after-tax for DAC and other actuarial assumption updates Reflects changes in variable annuity lapse rates Includes changes to long-term fixed income returns |
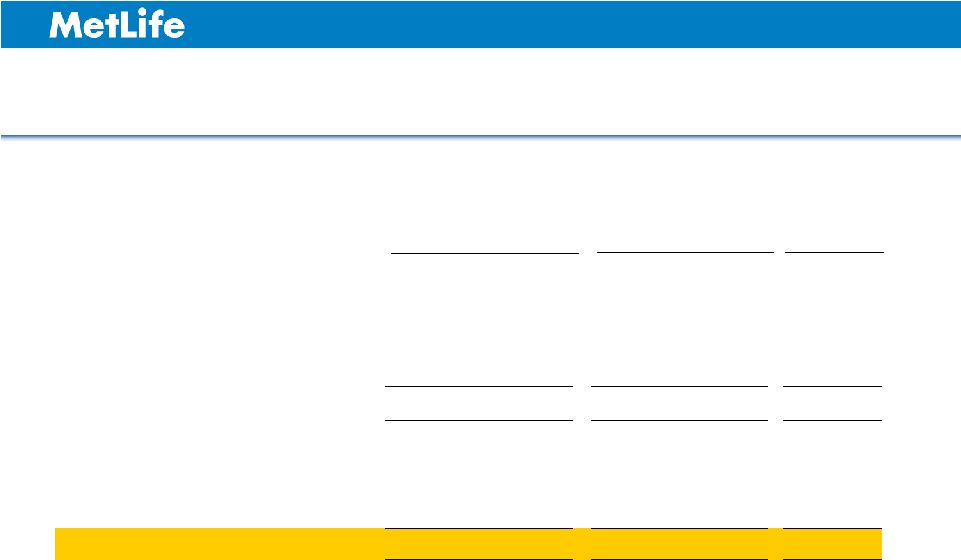
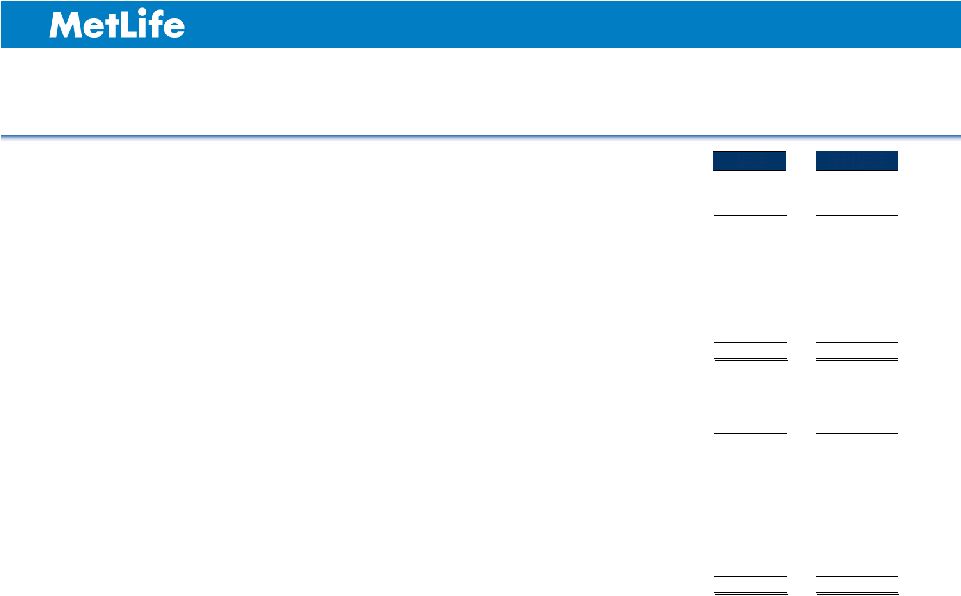
 Full Year 2012 Financial Overview See Appendix for non-GAAP financial information, definitions and/or reconciliations. ($ in Billions, except per share data) 17 2011 Actual 2012 Plan 2012 Estimate Premiums, Fees & Other Revenues (Operating) $45.4 $47.3 - $48.6 $47.3 - $47.7 Operating Earnings $4.7 $5.1 - $5.6 $5.5 - $5.6 Operating Earnings per Share $4.38 $4.80 - $5.20 $5.15 - $5.25 Operating Expense Ratio 24.4% 23.9% - 24.5% 23.9% - 24.1% Operating Return on Equity 10.1% 10.0% - 10.6% 11.0% - 11.1% |
 2012 MetLife Capital Position Year-End Estimate Enterprise capital levels remain strong – Combined U.S. RBC ratio 1 425% - 450% – Japan solvency margin ratio (SMR) 800% - 900% – $5.4 billion cash and liquid assets at holding companies Moody’s leverage ratio 2 of 27.0% 1 2 18 Calculated based on the Company’s principal U.S. insurance subsidiaries, excluding American Life Insurance Company. Reported leverage includes 3Q12 AOCI held constant, and $400 million maturing senior note repayment in December 2012. |
 2013 Plan Assumptions 5% annual S&P 500 Index growth – S&P 500 Index of 1,422 as of Dec. 31, 2012 U.S interest rates based on consensus – 10 year at 1.65% at Dec. 31, 2012 going to 2.38% at Dec. 31, 2013 Exchange rates at consensus – Yen/$ at 79 at Dec. 31, 2012; 84 at Dec. 31, 2013 No stock buybacks assumed Effective corporate tax rate of 28.5% 19 |
  2013 Plan ($ in Millions, except per share data) See Appendix for non-GAAP financial information, definitions and/or reconciliations. 20 Operating Earnings $5,500 - $5,940 Average Shares Outstanding (in Millions) Operating Earnings per Share 4.95 $ - 5.35 $ Operating Expense Ratio 23.6% - 24.5% Net Investment Gains/(Losses) ($600) - ($200) Book Value per Share (excluding AOCI) 50.48 $ - 51.66 $ Operating Return on Equity 10.2% - 10.9% 1,110.4 2013 Plan |
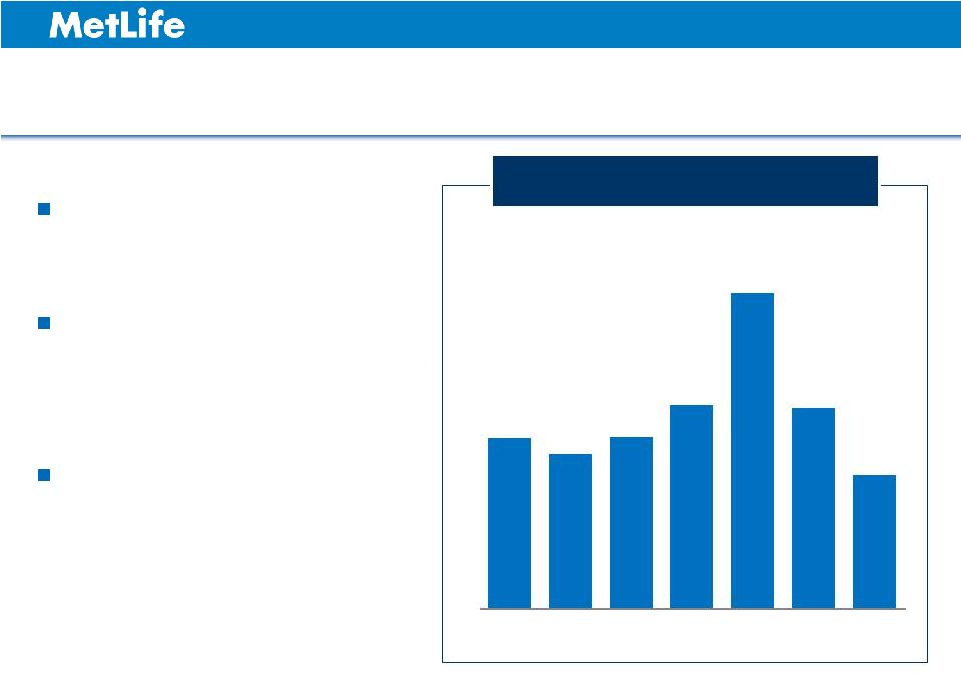
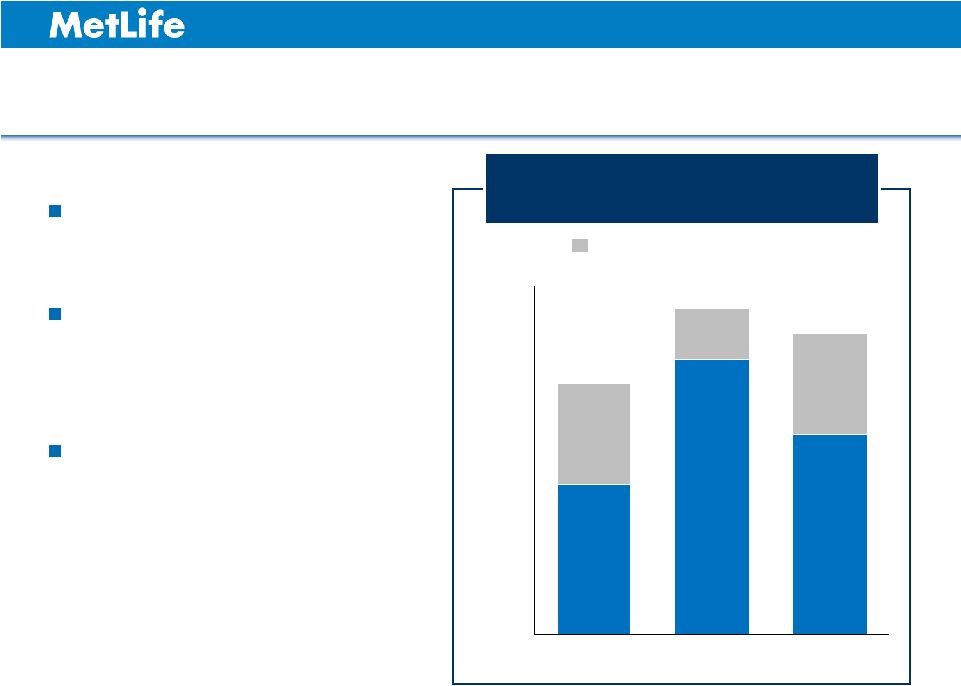 Variable Investment Income Outlook Alternative Investments Real Estate Funds and Other Joint Ventures Prepayments ($ in Millions) Variable Investment Income Plan $800M to $1.2B for 2013 21 Range 0 200 400 600 800 1,000 1,200 1,400 2012 Plan 2012 Estimate 2013 Plan $ |
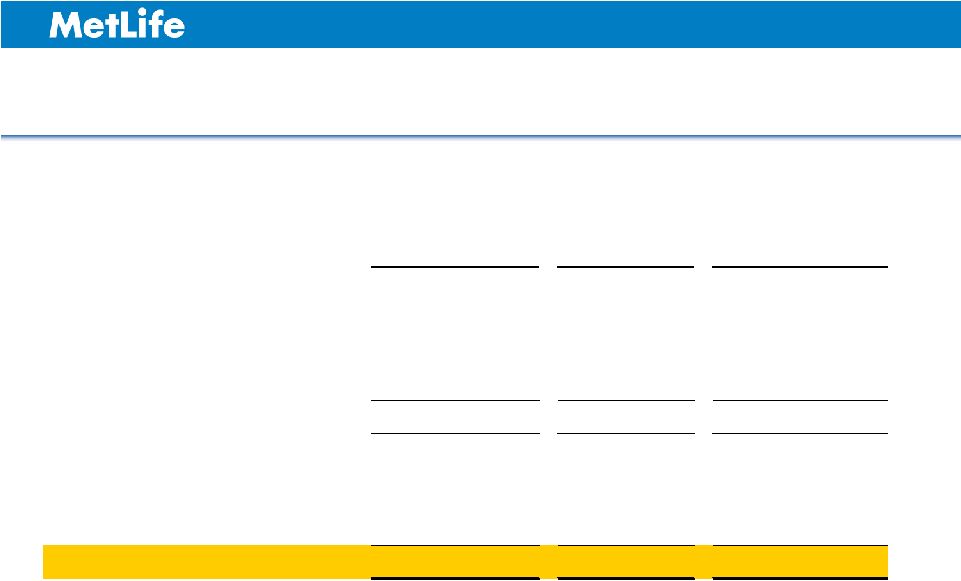
 2013 Operating Earnings by Line of Business ($ in Millions) 1 Calculated using mid-point of ranges before rounding. See Appendix for non-GAAP financial information, definitions and/or reconciliations. 22 Growth Rate 1 Retail $1,860 - $1,910 $1,910 - $2,010 4.0% Group, Voluntary & Worksite Benefits 990 - 1,000 995 - 1,055 3.0% Corporate Benefit Funding 1,160 - 1,170 1,095 - 1,155 (3.4%) Latin America 580 - 590 560 - 620 0.9% The Americas 4,590 - 4,670 4,560 - 4,840 1.5% Asia 1,075 - 1,090 1,130 - 1,230 8.9% EMEA 250 - 260 250 - 290 5.7% Corporate & Other (310) - (310) (440) - (420) nm Total $5,605 - $5,710 $5,500 - $5,940 1.1% 2012 Normalized Estimate 2013 Plan |
 2013 Cash and Liquid Assets Estimate at Holding Companies Holding Companies Cash Roll Forward 1 ($ in Billions) 2012E Subsidiary Dividends Mandatory Equity Units Expenses and Other Current Common Dividend and Debt Maturity 2013 Cash and Liquid Assets Before Incremental Capital Actions $5.4 $3.0 - $3.5 $1.0 ($1.6) $4.8 - $5.8 23 ($2.5 - $3.0) 1 2013 cash and liquid assets is prior to incremental capital actions such as M&A, common stock buybacks and common stock dividend increase. The bars represent mid-points of ranges. |
 Targeting more than a 40% decline in VA sales for 2013 Continued movement toward lower-risk product design and rationalizing distribution Consistent with strategy to shift mix toward less capital- intensive products Managing Variable Annuity Risk 24 1 Statutory premiums, direct and assumed, excluding company sponsored internal exchanges. ($ in Billions) MetLife U.S. Variable Annuity Sales 1 $15.3 $13.9 $15.4 $18.3 $28.4 2007 2008 2009 2010 2011 2012E 2013P $17.5 - $18.5 $10.0 - $11.0 |
 Key Takeaways 2012 was a good year with operating earnings growth expected to be in a range of 18% to 20% 2013 looks challenging, but still see double-digit operating ROE despite no assumption for capital management Focused on risk reduction and improving free cash flow Well positioned to manage in tough environment No material change in long-term outlook 25 See Appendix for non-GAAP financial information, definitions and/or reconciliations. |
 |
 Appendix 2 0 1 2 GUIDANCE PRESENTATION |
 Safe Harbor Statement 28 These materials may contain or incorporate by reference information that includes or is based upon forward-looking statements within the meaning of the Private Securities Litigation Reform Act of 1995. Forward-looking statements give expectations or forecasts of future events. These statements can be identified by the fact that they do not relate strictly to historical or current facts. They use words such as “anticipate,” “estimate,” “expect,” “project,” “intend,” “plan,” “believe” and other words and terms of similar meaning in connection with a discussion of future operating or financial performance. In particular, these include statements relating to future actions, prospective services or products, future performance or results of current and anticipated services or products, sales efforts, expenses, the outcome of contingencies such as legal proceedings, trends in operations and financial results. Any or all forward-looking statements may turn out to be wrong. They can be affected by inaccurate assumptions or by known or unknown risks and uncertainties. Many such factors will be important in determining the actual future results of MetLife, Inc., its subsidiaries and affiliates. These statements are based on current expectations and the current economic environment. They involve a number of risks and uncertainties that are difficult to predict. These statements are not guarantees of future performance. Actual results could differ materially from those expressed or implied in the forward-looking statements. Risks, uncertainties, and other factors that might cause such differences include the risks, uncertainties and other factors identified in MetLife, Inc.’s filings with the U.S. Securities and Exchange Commission (the “SEC”). These factors include: (1) difficult conditions in the global capital markets; (2) concerns over U.S. fiscal policy and the “fiscal cliff” in the U.S., as well as rating agency downgrades of U.S. Treasury securities; (3) uncertainty about the effectiveness of governmental and regulatory actions to stabilize the financial system, the imposition of fees relating thereto, or the promulgation of additional regulations; (4) increased volatility and disruption of the capital and credit markets, which may affect our ability to seek financing or access our credit facilities; (5) impact of comprehensive financial services regulation reform on us; (6) economic, political, legal, currency and other risks relating to our international operations, including with respect to fluctuations of exchange rates; (7) exposure to financial and capital market risk, including as a result of the disruption in Europe and possible withdrawal of one or more countries from the Euro zone; (8) changes in general economic conditions, including the performance of financial markets and interest rates, which may affect our ability to raise capital, generate fee income and market-related revenue and finance statutory reserve requirements and may require us to pledge collateral or make payments related to declines in value of specified assets; (9) potential liquidity and other risks resulting from our participation in a securities lending program and other transactions; (10) investment losses and defaults, and changes to investment valuations; (11) impairments of goodwill and realized losses or market value impairments to illiquid assets; (12) defaults on our mortgage loans; (13) the defaults or deteriorating credit of other financial institutions that could adversely affect us; (14) our ability to address unforeseen liabilities, asset impairments, or rating actions arising from acquisitions or dispositions, including our acquisition of American Life Insurance Company and Delaware American Life Insurance Company (collectively, “ALICO”) and to successfully integrate and manage the growth of acquired businesses with minimal disruption; (15) uncertainty with respect to the outcome of the closing agreement entered into with the United States Internal Revenue Service in connection with the acquisition of ALICO; (16) the dilutive impact on our stockholders resulting from the settlement of common equity units issued in connection with the acquisition of ALICO or otherwise; (17) regulatory and other restrictions affecting MetLife, Inc.’s ability to pay dividends and repurchase common stock; (18) MetLife, Inc.’s primary reliance, as a holding company, on dividends from its subsidiaries to meet debt payment obligations and the applicable regulatory restrictions on the ability of the subsidiaries to pay such dividends; (19) downgrades in our claims paying ability, financial strength or credit ratings; (20) ineffectiveness of risk management policies and procedures; (21) availability and effectiveness of reinsurance or indemnification arrangements, as well as default or failure of counterparties to perform; (22) discrepancies between actual claims experience and assumptions used in setting prices for our products and establishing the liabilities for our obligations for future policy benefits and claims; (23) catastrophe losses; (24) heightened competition, including with respect to pricing, entry of new competitors, consolidation of distributors, the development of new products by new and existing competitors, distribution of amounts available under U.S. government programs, and for personnel; (25) unanticipated changes in industry trends; (26) changes in assumptions related to investment valuations, deferred policy acquisition costs, deferred sales inducements, value of business acquired or goodwill; (27) changes in accounting standards, practices and/or policies; (28) increased expenses relating to pension and postretirement benefit plans, as well as health care and other employee benefits; (29) exposure to losses related to variable annuity guarantee benefits, |
 Safe Harbor Statement (Continued) 29 including from significant and sustained downturns or extreme volatility in equity markets, reduced interest rates, unanticipated policyholder behavior, mortality or longevity, and the adjustment for nonperformance risk; (30) deterioration in the experience of the “closed block” established in connection with the reorganization of Metropolitan Life Insurance Company; (31) adverse results or other consequences from litigation, arbitration or regulatory investigations; (32) inability to protect our intellectual property rights or claims of infringement of the intellectual property rights of others; (33) discrepancies between actual experience and assumptions used in establishing liabilities related to other contingencies or obligations; (34) regulatory, legislative or tax changes relating to our insurance, banking, international, or other operations that may affect the cost of, or demand for, our products or services, or increase the cost or administrative burdens of providing benefits to employees; (35) the effects of business disruption or economic contraction due to disasters such as terrorist attacks, cyberattacks, other hostilities, or natural catastrophes, including any related impact on our disaster recovery systems, cyber- or other information security systems and management continuity planning; (36) the effectiveness of our programs and practices in avoiding giving our associates incentives to take excessive risks; and (37) other risks and uncertainties described from time to time in MetLife, Inc.’s filings with the SEC. MetLife, Inc. does not undertake any obligation to publicly correct or update any forward-looking statement if MetLife, Inc. later becomes aware that such statement is not likely to be achieved. Please consult any further disclosures MetLife, Inc. makes on related subjects in reports to the SEC. . |
 Explanatory Note on Non-GAAP Financial Information All references in this presentation (except in this Explanatory Note on Non-GAAP Financial Information slide and the Appendix) to net income (loss), net income (loss) per share, operating earnings, operating earnings per share, book value per common share, premiums, fees and other revenues and operating return on equity, should be read as net income (loss) available to MetLife, Inc.'s common shareholders, net income (loss) available to MetLife, Inc.'s common shareholders per diluted common share, operating earnings available to common shareholders, operating earnings available to common shareholders per diluted common share, book value per common share, excluding accumulated other comprehensive income (loss) ("AOCI"), premiums, fees and other revenues (operating) and operating return on MetLife, Inc.’s common equity, excluding AOCI, respectively. Operating earnings is the measure of segment profit or loss that MetLife uses to evaluate segment performance and allocate resources. Consistent with accounting principles generally accepted in the United States of America ("GAAP") accounting guidance for segment reporting, operating earnings is MetLife's measure of segment performance. Operating earnings is also a measure by which MetLife senior management's and many other employees' performance is evaluated for the purposes of determining their compensation under applicable compensation plans. Operating earnings is defined as operating revenues less operating expenses, both net of income tax. Operating earnings available to common shareholders is defined as operating earnings less preferred stock dividends. Operating revenues and operating expenses exclude results of discontinued operations and other businesses that have been or will be sold or exited by MetLife, Inc. (“Divested Businesses”). Operating revenues also excludes net investment gains (losses) (“NIGL”) and net derivative gains (losses) (“NDGL”). Operating expenses also excludes goodwill impairments. The following additional adjustments are made to GAAP revenues, in the line items indicated, in calculating operating revenues: • Universal life and investment-type product policy fees excludes the amortization of unearned revenue related to NIGL and NDGL and certain variable annuity guaranteed minimum income benefits ("GMIB") fees ("GMIB Fees"); • Net investment income: (i) includes amounts for scheduled periodic settlement payments and amortization of premium on derivatives that are hedges of investments but do not qualify for hedge accounting treatment, (ii) includes income from discontinued real estate operations, (iii) excludes post-tax operating earnings adjustments relating to insurance joint ventures accounted for under the equity method, (iv) excludes certain amounts related to contractholder-directed unit-linked investments, and (v) excludes certain amounts related to securitization entities that are variable interest entities ("VIEs") consolidated under GAAP; and • Other revenues are adjusted for settlements of foreign currency earnings hedges. 30 |
 The following additional adjustments are made to GAAP expenses, in the line items indicated, in calculating operating expenses: Policyholder benefits and claims and policyholder dividends excludes: (i) changes in the policyholder dividend obligation related to NIGL and NDGL, (ii) inflation-indexed benefit adjustments associated with contracts backed by inflation-indexed investments and amounts associated with periodic crediting rate adjustments based on the total return of a contractually referenced pool of assets, (iii) benefits and hedging costs related to GMIBs ("GMIB Costs"), and (iv) market value adjustments associated with surrenders or terminations of contracts ("Market Value Adjustments"); Interest credited to policyholder account balances includes adjustments for scheduled periodic settlement payments and amortization of premium on derivatives that are hedges of policyholder account balances but do not qualify for hedge accounting treatment and excludes amounts related to net investment income earned on contractholder-directed unit-linked investments; Amortization of deferred policy acquisition costs (“DAC”) and value of business acquired ("VOBA") excludes amounts related to: (i) NIGL and NDGL, (ii) GMIB Fees and GMIB Costs, and (iii) Market Value Adjustments; Amortization of negative VOBA excludes amounts related to Market Value Adjustments; Interest expense on debt excludes certain amounts related to securitization entities that are VIEs consolidated under GAAP; and Other expenses excludes costs related to: (i) noncontrolling interests, (ii) implementation of new insurance regulatory requirements, and (iii) acquisition and integration costs. Operating return on MetLife, Inc.'s common equity is defined as operating earnings available to common shareholders divided by average GAAP common equity. Operating expense ratio is calculated by dividing operating expenses (other expenses net of capitalization of DAC) by premiums, fees and other revenues (operating). MetLife believes the presentation of operating earnings and operating earnings available to common shareholders as MetLife measures it for management purposes enhances the understanding of the company's performance by highlighting the results of operations and the underlying profitability drivers of the business. Operating revenues, operating expenses, operating earnings, operating earnings available to common shareholders, operating earnings available to common shareholders per diluted common share, book value per common share, excluding AOCI, book value per diluted common share, excluding AOCI, operating return on MetLife, Inc.’s common equity, operating return on MetLife, Inc.’s common equity, excluding AOCI, investment portfolio gains (losses) and derivative gains (losses) should not be viewed as substitutes for the following financial measures calculated in accordance with GAAP: GAAP revenues, GAAP expenses, GAAP income (loss) from continuing operations, net of income tax, GAAP net income (loss) available to MetLife, Inc.'s common shareholders, GAAP net income (loss) available to MetLife, Inc.'s common shareholders per diluted common share, book value per common share, book value per diluted common share, return on MetLife, Inc.’s common equity, return on MetLife, Inc.’s common equity, excluding AOCI, net investment gains (losses) and net derivative gains (losses), respectively. Explanatory Note on Non-GAAP Financial Information (Continued) 31 |
 Explanatory Note on Non-GAAP Financial Information (Continued) 32 For the historical periods presented, reconciliations of non-GAAP measures used in this presentation to the most directly comparable GAAP measures may be included in an Appendix to the presentation materials and/or are on the Investor Relations portion of our Internet website. Additional information about our historical results is also available on our Internet website in our Quarterly Financial Supplements for the corresponding periods. Managed Assets (as defined below) is a financial measure based on methodologies other than GAAP. MetLife utilizes “Managed Assets” to describe assets in its investment portfolio which are actively managed and reflected at estimated fair value. MetLife believes the use of Managed Assets enhances the understanding and comparability of its investment portfolio by excluding assets such as policy loans, other invested assets, mortgage loans held-for-sale, and mortgage loans held by consolidated securitization entities, as substantially all of those assets are not actively managed in MetLife’s investment portfolio. Trading and other securities are also excluded as this amount is primarily comprised of contractholder- directed unit-linked investments, where the contractholder, and not the company, directs the investment of these funds. Mortgage loans and certain real estate investments have also been adjusted from carrying value to estimated fair value. The non-GAAP measures used in this presentation should not be viewed as substitutes for the most directly comparable GAAP measures. In this presentation, we may refer to sales activity for various products. These sales statistics do not correspond to revenues under GAAP, but are used as relevant measures of business activity. The impact of changes in foreign currency exchange rates is calculated using the average foreign currency exchange rates for the current period and is applied to the prior period. In this presentation, we may provide guidance on our future earnings, premiums, fees and other revenues, earnings per diluted common share, book value per common share and return on common equity on an operating or non-GAAP basis. A reconciliation of the non-GAAP measures to the most directly comparable GAAP measures is not accessible on a forward-looking basis because we believe it is not possible to provide other than a range of net investment gains and losses and net derivative gains and losses, which can fluctuate significantly within or without the range and from period to period and may have a significant impact on GAAP net income. |
 Reconciliations 2 0 1 2 GUIDANCE PRESENTATION |
 Reconciliation of Operating Earnings Available to Common Shareholders to Income (Loss) from Continuing Operations, Net of Income Tax 34 ($ in Millions, except per share data) 2011 3Q12 YTD Operating earnings available to common shareholders 4,677 4,313 Add: Preferred stock dividends 122 91 Operating earnings 4,799 4,404 Adjustments from operating earnings to income (loss) from continuing operations, net of income tax: Add: Net investment gains (losses) (867) (152) Add: Net derivative gains (losses) 4,824 (604) Add: Goodwill impairment - (1,868) Add: Other adjustments to continuing operations (1,451) (1,619) Add: Provision for income tax (expense) benefit (914) 1,048 Income (loss) from continuing operations, net of income tax 6,391 1,209 $ Operating earnings available to common shareholders per diluted common share 4.38 4.03 Add: Preferred stock dividends 0.11 0.09 Operating earnings per diluted common share 4.49 4.12 Adjustments from operating earnings per diluted common share to income (loss) from continuing operations, net of income tax per diluted common share: Add: Net investment gains (losses) (0.81) (0.14) Add: Net derivative gains (losses) 4.52 (0.57) Add: Goodwill impairment - (1.75) Add: Other adjustments to continuing operations (1.36) (1.51) Add: Provision for income tax (expense) benefit (0.86) 0.98 Income (loss) from continuing operations, net of income tax per diluted common share 5.98 $ 1.13 $ 1,068.1 1,070.0 Weighted Average Shares Outstanding - Diluted $ $ $ $ $ $ $ $ $ |
 Reconciliation of Premiums, Fees & Other Revenues (Operating) to Premiums, Fees & Other Revenues (GAAP) and Calculation of Operating Expense Ratio 35 ($ in Millions) 2011 Premiums, fees & other revenues (operating) 45,449 $ Adjustments from premiums, fees & other revenues (operating) to premiums, fees & other revenues (GAAP): Add: Premiums 92 Add: Universal life and investment-type product policy fees 278 Add: Other revenues 880 Premiums, fees & other revenues (GAAP) 46,699 $ Operating expenses (1) 11,071 $ Operating expense ratio 24.4% (1) Other expenses (operating) net of capitalization of DAC. |
 Reconciliation of Return on Common Equity 36 2011 Return on MetLife, Inc.'s Common Equity (1) Return on MetLife, Inc.'s common equity (2) 12.2% Return on MetLife, Inc.'s common equity, excluding AOCI (2) 13.2% Operating return on MetLife, Inc.'s common equity (3) 9.3% Operating return on MetLife, Inc.'s common equity, excluding AOCI (3) 10.1% (1) Annualized using year-to date results. (2) Return on MetLife, Inc.'s common equity is defined as net income available to common shareholders divided by average GAAP common equity. (3) Operating return on MetLife, Inc.'s common equity is defined as operating earnings available to common shareholders divided by average GAAP common equity. |
 Outlook 2 0 1 2 GUIDANCE PRESENTATION |
 2012 Normalized Operating Earnings ($ in Millions) 38 Normalized Adjustments 1 Retail $1,875 - $1,925 ($15) $1,860 - $1,910 Group, Voluntary & Worksite Benefits 955 - 965 34 990 - 1,000 Corporate Benefit Funding 1,195 - 1,205 (37) 1,160 - 1,170 Latin America 580 - 590 0 580 - 590 The Americas 4,605 - 4,685 (18) 4,590 - 4,670 Asia 1,060 - 1,075 14 1,075 - 1,090 EMEA 265 - 275 (12) 250 - 260 Corporate & Other (400) - (400) 87 (310) - (310) Total $5,530 - $5,635 $71 $5,605 - $5,710 2012 Estimate 2012 Normalized Estimate 1 See “2012 Schedule of Normalized Adjustments” elsewhere in this Appendix. See “Explanatory Note on Non-GAAP Financial Information” elsewhere in this Appendix. |
 Normalized Operating Earnings Per Share 39 Operating Earnings per Share Operating Earnings per Share $5.15 - 5.25 $ Variable Investment Income Variable Investment Income Prior Year Development/CATS Prior Year Development/CATS DAC & Other DAC & Other Reserve Adjustments Reorganization Costs Japan Earthquake Other Japan Re Market ELNY Liquidation "Normalized" Operating EPS $5.22 - 5.32 $ Alico Integration Other "Normalized" Operating EPS MetLife Bank Divested Business "Normalized" Operating EPS 0.08 $4.69 0.05 0.02 0.03 0.04 0.05 (0.02) $4.61 2012 Estimate (0.12) 0.04 0.08 2011 (0.13) 0.14 (0.03) 0.11 0.04 $4.38 See “Explanatory Note on Non-GAAP Financial Information” elsewhere in this Appendix. |
 2012 Schedule of Normalized Adjustments 40 Variable Investment Income Prior Year Development/ CATS DAC & Other Reorganization Costs Other Normalized Adjustments Retail ($9) $28 ($60) $0 $26 ($15) Group, Voluntary & Worksite Benefits 0 12 22 0 0 34 Corporate Benefit Funding (37) 0 0 0 0 (37) Latin America 0 0 0 0 0 0 The Americas (46) 40 (38) 0 26 (18) Asia (28) 0 37 0 5 14 EMEA 0 0 0 0 (12) (12) Corporate & Other (57) 0 50 82 12 87 Total ($131) $40 $49 $82 $31 $71 See “Explanatory Note on Non-GAAP Financial Information” elsewhere in this Appendix. |
 2013 Premiums, Fees & Other Revenues 1 Growth ($ in Billions) 1 Operating. 2 Calculated using mid-point of ranges before rounding. 41 Growth Rate Retail $11.9 - $12.0 $12.1 - $12.5 2.8% Group, Voluntary & Worksite Benefits 15.8 - 15.9 16.3 - 16.8 4.6% Corporate Benefit Funding 3.5 - 3.6 2.7 - 2.9 (22.1%) Latin America 3.4 - 3.4 3.7 - 3.9 10.6% The Americas 34.6 - 34.9 34.8 - 36.1 1.8% Asia 9.7 - 9.8 10.1 - 10.3 4.0% EMEA 2.8 - 2.8 2.7 - 2.8 (2.0%) Corporate & Other 0.2 - 0.2 0.3 - 0.5 nm Total $47.3 - $47.7 $47.9 - $49.7 2.7% 2012 Estimate 2013 Plan 2 See “Explanatory Note on Non-GAAP Financial Information” elsewhere in this Appendix. |
 2013 Operating Expense Ratio Expense discipline continues Maintaining focus on Alico integration Pension/PRB cost has a negative impact of $90 million 2012E 2013P Excl. Pension/PRB Pension/PRB Operating Expense Ratio 23.6% - 24.5% 23.9% - 24.1% 22.5% - 23.4% 22.9% - 23.1% 42 See “Explanatory Note on Non-GAAP Financial Information” elsewhere in this Appendix. |
 |