 Steven A. Kandarian Chairman, President & Chief Executive Officer February 14, 2013 Bank of America Merrill Lynch 2013 Insurance Conference Exhibit 99.1 |
 This presentation may contain or incorporate by reference forward-looking statements. Forward-looking statements give expectations or forecasts of future events and use words such as “anticipate,” “estimate,” “expect,” “project” and other terms of similar meaning. Any or all forward-looking statements may turn out to be wrong, and actual results could differ materially from those expressed or implied in the forward-looking statements. Predictions of future performance are inherently difficult and are subject to numerous risks and uncertainties, including those identified in the “Risk Factors” section of MetLife, Inc.’s filings with the U.S. Securities and Exchange Commission. The company does not undertake any obligation to publicly correct or update any forward-looking statement if it later becomes aware that such statement is not likely to be achieved. Additional discussion of forward-looking statements may be included in other slides in this presentation; if so, please refer to those slides for more information. The presentation may also contain measures that are not calculated based on accounting principles generally accepted in the United States of America, also known as GAAP. Additional discussion of non-GAAP financial information may be included in other slides in this presentation, on the Investor Relations portion of MetLife's website (www.metlife.com), or elsewhere on that website; if so, please refer to those slides or the website for more information. Cautionary Statement on Forward Looking Statements and Non-GAAP Financial Information 2 |
 A Strong Year in a Challenging Environment See Appendix for non-GAAP financial information, definitions and/or reconciliations. ($ in millions, except per share data) 2011 2012 Variance Operating Earnings $4,677 $5,686 22% Operating Earnings Per Share $4.38 $5.28 21% Premiums, Fees & Other Revenues $45,449 $47,879 5% Operating Expense Ratio 24.4% 23.8% (60) bps Book Value per Share, excluding AOCI $46.69 $46.73 - Operating ROE 10.1% 11.3% 120 bps 3 |
 Strategy to Become a World-Class Company Drive Toward Customer Centricity and a Global Brand Grow Emerging Markets Build Global Employee Benefits Business Refocus the U.S. Business GLOBAL * WORLD-CLASS * SCALE 4 |
 Refocus the U.S. business – VA strategy Grow emerging markets – Provida acquisition Creating shareholder value – Increase operating ROE, lower cost of equity capital (COEC) Executing on our Strategy 5 See Appendix for non-GAAP financial information, definitions and/or reconciliations. |
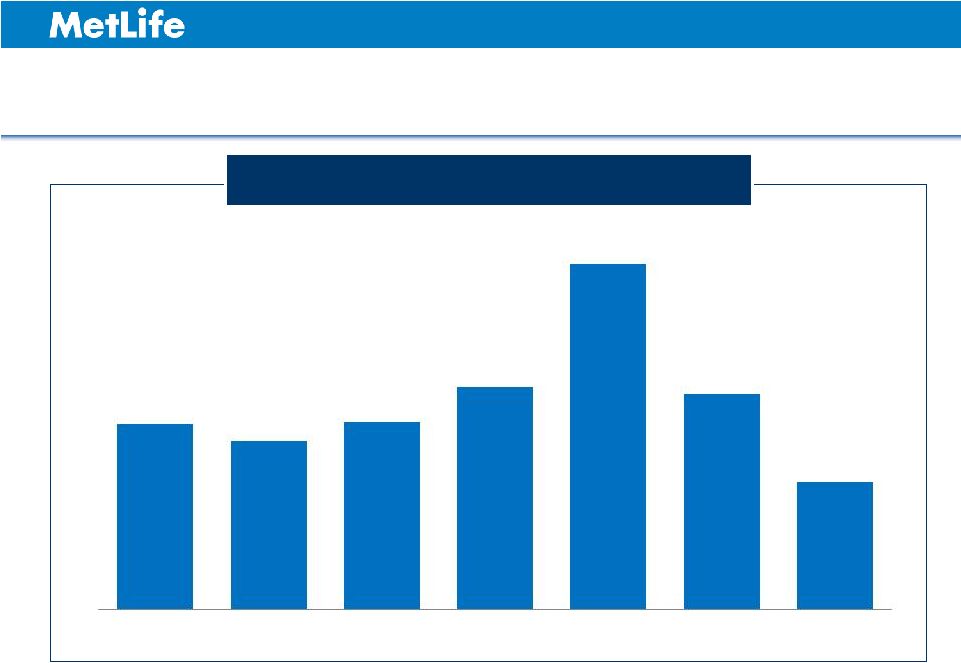 Managing for Another Material Drop in VA Sales 6 1 Statutory premiums, direct and assumed, excluding company sponsored internal exchanges. 2 Represents midpoint of the guidance range of $10 to $11 billion. ($ in Billions) MetLife U.S. Variable Annuity Sales¹ 2 $15.3 $13.9 $15.4 $18.3 $28.4 $17.7 $10.5 2007 2008 2009 2010 2011 2012 2013P |
 Introduced new guaranteed minimum income benefit (GMIB) variable annuity effective February 4, 2013 – Reduced roll-up rate from 5.0% to 4.0% – Reduced withdrawal rate from range of 4.5%-5.0% to 4.0% Products under consideration would further improve annuity risk profile Competitive landscape has changed for VAs Further Actions to Improve Annuity Risk/Return Profile 7 |
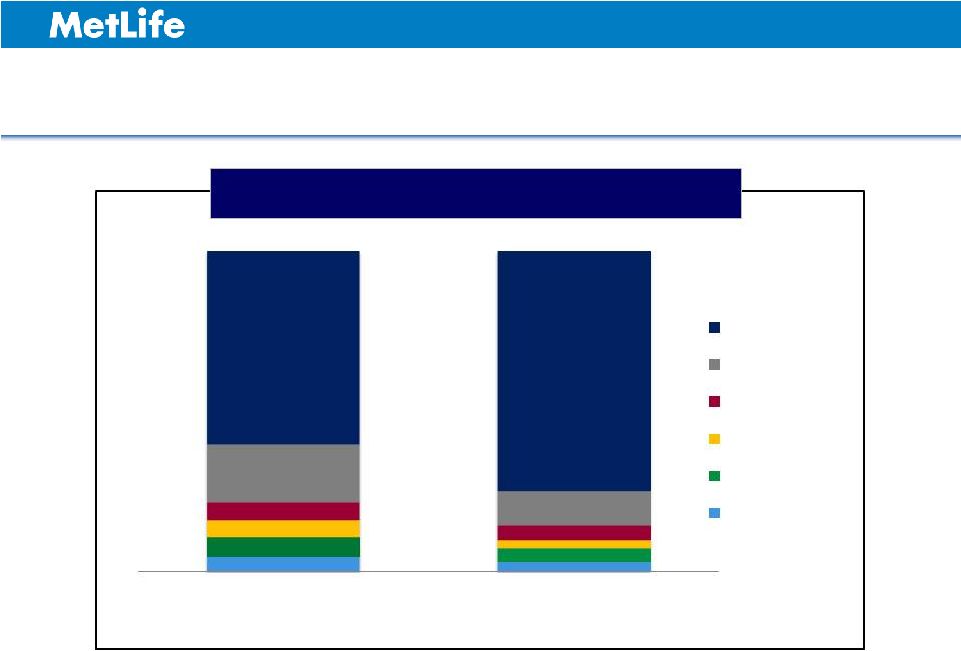 More Favorable Return on Investment for New VA Product 1 GMIB MAX IV (5% Rollup) launched on Aug. 20, 2012 and GMIB Max V (4% Rollup) launched on Feb. 4, 2013. The pricing results were based on market conditions as of December 31, 2012. Incidences of ROIs reflected in the chart above are the results of roughly 1,000 stochastic scenarios observed. 8 61% 75% GMIB Max IV (5% Rollup) GMIB Max V (4% Rollup) >15% 12% to 15% 10% to 12% 8% to 10% 0% to 8% <0% Distribution of Potential Return Scenarios 1 |
 Refocus the U.S. business – VA strategy Grow emerging markets – Provida acquisition Creating shareholder value – Increase operating ROE, lower cost of equity capital (COEC) Executing on our Strategy 9 See Appendix for non-GAAP financial information, definitions and/or reconciliations. |
 Acquiring AFP Provida for approximately $2 billion in cash, funded with on balance sheet resources Price is approximately 10x forward earnings expectation, expect operating EPS accretion of approximately $0.05 in 2013, $0.15 in 2014 Acquisition creates value assuming 75% equity, 25% debt funding mix Free cash flow generation for acquired business expected to be roughly 70% of operating earnings Provida Acquisition a Positive for Shareholder Value 10 See Appendix for non-GAAP financial information, definitions and/or reconciliations. |
 Provida: A Growth Opportunity in an Attractive Market Highest rated country in region 1 , government surplus position 5-year projected GDP growth rate of 4.7% 2 Provida ranked #1 (29% market share) in concentrated market 3 Employees required to contribute fixed percentage of salaries Chile Economics of the Pension Business AFP Market 11 1 Sovereign debt ratings of A+/A+/Aa3 (S&P/Moody’s/Fitch). 2 Economic Intelligence Unit for the period 2013 – 2017. 3 Company filings and FactSet. Note: Local currency figures converted at spot rate of $471.1 CLP/USD as of January 22, 2013. Figure denotes rank and market share by mandatory AUM. Fees charged as a percentage of contributions, not AUM Strong and predictable free cash flows |
 Provida Deal Aligns with Strategic Goals 1 Based on 5-year projected average PGAAP ROE assuming 75% equity / 25% debt capital structure. See Appendix for non-GAAP financial information, definitions and/or reconciliations. Pre-Tax Expense Savings 12 Grow Emerging Markets to 20%+ of Operating Earnings Shift from Market Sensitive to Protection Products Operating ROE Expansion ~15% (1) Levered Operating ROE Fees Based on Contributions 14% 17% |
 Refocus the U.S. business – VA strategy Grow emerging markets – Provida acquisition Creating shareholder value – Increase operating ROE, lower cost of equity capital (COEC) Executing on our Strategy 13 See Appendix for non-GAAP financial information, definitions and/or reconciliations. |
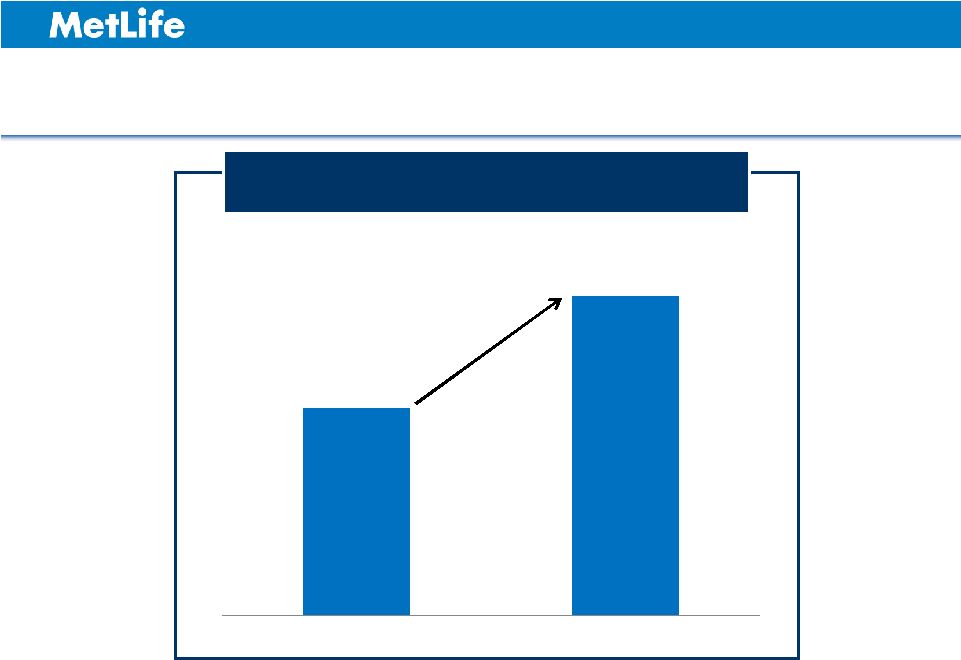 Goal is to Expand Operating ROE Expect to Achieve 12% Operating ROE by 2016 Even if Interest Rates Remain Low 1 14 1 The bars represent mid-points of ranges. See Appendix for non-GAAP financial information, definitions and/or reconciliations. 12.0% - 14.0% 10.2% - 10.9% 2013P 2016 Target |
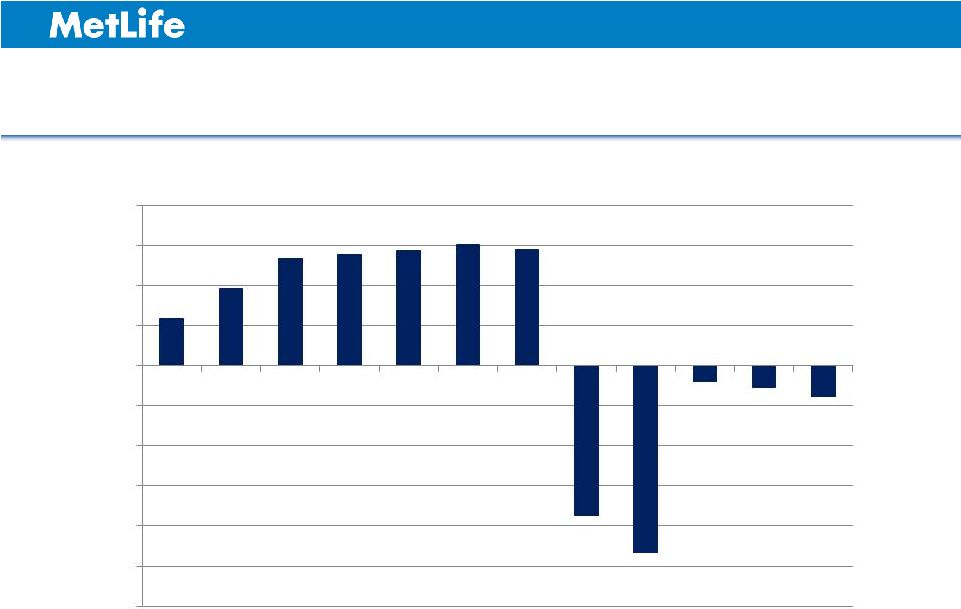 MetLife Operating ROE Spread to Cost of Equity Capital 15 Sources: BofA Merrill Lynch and Professor Aswath Damodaran, Stern School of Business (NYU). See Appendix for non-GAAP financial information, definitions and/or reconciliations. -12% -10% -8% -6% -4% -2% 0% 2% 4% 6% 8% 2001 2002 2003 2004 2005 2006 2007 2008 2009 2010 2011 2012 |
 Working on Both Sides of Value Creation Valuation is a function of both return on equity and cost of equity capital We are committed to increase operating ROE and decrease COEC over time We believe our VA strategy and the Provida acquisition lower COEC and increase operating ROE 16 See Appendix for non-GAAP financial information, definitions and/or reconciliations. |
 Key Takeaways Strong financial performance in 2012 Continue to execute on strategic initiatives despite macro and regulatory uncertainty Improving operating ROE and lowering cost of equity capital should drive shareholder value over time 17 See Appendix for non-GAAP financial information, definitions and/or reconciliations. |
 |
 Appendix 2 0 1 3 INSURANCE CONFERENCE |
 Safe Harbor Statement 20 These materials may contain or incorporate by reference information that includes or is based upon forward-looking statements within the meaning of the Private Securities Litigation Reform Act of 1995. Forward-looking statements give expectations or forecasts of future events. These statements can be identified by the fact that they do not relate strictly to historical or current facts. They use words such as “anticipate,” “estimate,” “expect,” “project,” “intend,” “plan,” “believe” and other words and terms of similar meaning in connection with a discussion of future operating or financial performance. In particular, these include statements relating to future actions, prospective services or products, future performance or results of current and anticipated services or products, sales efforts, expenses, the outcome of contingencies such as legal proceedings, trends in operations and financial results. Any or all forward-looking statements may turn out to be wrong. They can be affected by inaccurate assumptions or by known or unknown risks and uncertainties. Many such factors will be important in determining the actual future results of MetLife, Inc., its subsidiaries and affiliates. These statements are based on current expectations and the current economic environment. They involve a number of risks and uncertainties that are difficult to predict. These statements are not guarantees of future performance. Actual results could differ materially from those expressed or implied in the forward-looking statements. Risks, uncertainties, and other factors that might cause such differences include the risks, uncertainties and other factors identified in MetLife, Inc.’s filings with the U.S. Securities and Exchange Commission (the “SEC”). These factors include: (1) difficult conditions in the global capital markets; (2) concerns over U.S. fiscal policy and the “fiscal cliff” in the U.S., as well as rating agency downgrades of U.S. Treasury securities; (3) uncertainty about the effectiveness of governmental and regulatory actions to stabilize the financial system, the imposition of fees relating thereto, or the promulgation of additional regulations; (4) increased volatility and disruption of the capital and credit markets, which may affect our ability to seek financing or access our credit facilities; (5) impact of comprehensive financial services regulation reform on us; (6) economic, political, legal, currency and other risks relating to our international operations, including with respect to fluctuations of exchange rates; (7) exposure to financial and capital market risk, including as a result of the disruption in Europe and possible withdrawal of one or more countries from the Euro zone; (8) changes in general economic conditions, including the performance of financial markets and interest rates, which may affect our ability to raise capital, generate fee income and market-related revenue and finance statutory reserve requirements and may require us to pledge collateral or make payments related to declines in value of specified assets; (9) potential liquidity and other risks resulting from our participation in a securities lending program and other transactions; (10) investment losses and defaults, and changes to investment valuations; (11) impairments of goodwill and realized losses or market value impairments to illiquid assets; (12) defaults on our mortgage loans; (13) the defaults or deteriorating credit of other financial institutions that could adversely affect us; (14) our ability to address unforeseen liabilities, asset impairments, or rating actions arising from acquisitions or dispositions, including our acquisition of American Life Insurance Company and Delaware American Life Insurance Company (collectively, “ALICO”) and to successfully integrate and manage the growth of acquired businesses with minimal disruption; (15) uncertainty with respect to the outcome of the closing agreement entered into with the United States Internal Revenue Service in connection with the acquisition of ALICO; (16) the dilutive impact on our stockholders resulting from the settlement of common equity units issued in connection with the acquisition of ALICO or otherwise; (17) regulatory and other restrictions affecting MetLife, Inc.’s ability to pay dividends and repurchase common stock; (18) MetLife, Inc.’s primary reliance, as a holding company, on dividends from its subsidiaries to meet debt payment obligations and the applicable regulatory restrictions on the ability of the subsidiaries to pay such dividends; (19) downgrades in our claims paying ability, financial strength or credit ratings; (20) ineffectiveness of risk management policies and procedures; (21) availability and effectiveness of reinsurance or indemnification arrangements, as well as default or failure of counterparties to perform; (22) discrepancies between actual claims experience and assumptions used in setting prices for our products and establishing the liabilities for our obligations for future policy benefits and claims; (23) catastrophe losses; (24) heightened competition, including with respect to pricing, entry of new competitors, consolidation of distributors, the development of new products by new and existing competitors, distribution of amounts available under U.S. government programs, and for personnel; (25) unanticipated changes in industry trends; (26) changes in assumptions related to investment valuations, deferred policy acquisition costs, deferred sales inducements, value of business acquired or goodwill; (27) changes in accounting standards, practices and/or policies; (28) increased expenses relating to pension and postretirement benefit plans, as well as health care and other employee benefits; (29) exposure to losses related to variable annuity guarantee benefits, |
 Safe Harbor Statement (Continued) 21 including from significant and sustained downturns or extreme volatility in equity markets, reduced interest rates, unanticipated policyholder behavior, mortality or longevity, and the adjustment for nonperformance risk; (30) deterioration in the experience of the “closed block” established in connection with the reorganization of Metropolitan Life Insurance Company; (31) adverse results or other consequences from litigation, arbitration or regulatory investigations; (32) inability to protect our intellectual property rights or claims of infringement of the intellectual property rights of others; (33) discrepancies between actual experience and assumptions used in establishing liabilities related to other contingencies or obligations; (34) regulatory, legislative or tax changes relating to our insurance, banking, international, or other operations that may affect the cost of, or demand for, our products or services, or increase the cost or administrative burdens of providing benefits to employees; (35) the effects of business disruption or economic contraction due to disasters such as terrorist attacks, cyberattacks, other hostilities, or natural catastrophes, including any related impact on our disaster recovery systems, cyber- or other information security systems and management continuity planning; (36) the effectiveness of our programs and practices in avoiding giving our associates incentives to take excessive risks; and (37) other risks and uncertainties described from time to time in MetLife, Inc.’s filings with the SEC. MetLife, Inc. does not undertake any obligation to publicly correct or update any forward-looking statement if MetLife, Inc. later becomes aware that such statement is not likely to be achieved. Please consult any further disclosures MetLife, Inc. makes on related subjects in reports to the SEC. |
 Explanatory Note on Non-GAAP Financial Information Any references in this presentation (except in this Explanatory Note on Non-GAAP Financial Information slide and the Appendix) to net income (loss), net income (loss) per share, operating earnings, operating earnings per share, book value per common share, premiums, fees and other revenues and operating return on equity, should be read as net income (loss) available to MetLife, Inc.'s common shareholders, net income (loss) available to MetLife, Inc.'s common shareholders per diluted common share, operating earnings available to common shareholders, operating earnings available to common shareholders per diluted common share, book value per common share, excluding accumulated other comprehensive income (loss) ("AOCI"), premiums, fees and other revenues (operating) and operating return on MetLife, Inc.’s common equity, excluding AOCI, respectively. Operating earnings is the measure of segment profit or loss that MetLife uses to evaluate segment performance and allocate resources. Consistent with accounting principles generally accepted in the United States of America ("GAAP") accounting guidance for segment reporting, operating earnings is MetLife's measure of segment performance. Operating earnings is also a measure by which MetLife senior management's and many other employees' performance is evaluated for the purposes of determining their compensation under applicable compensation plans. Operating earnings is defined as operating revenues less operating expenses, both net of income tax. Operating earnings available to common shareholders is defined as operating earnings less preferred stock dividends. Operating revenues and operating expenses exclude results of discontinued operations and other businesses that have been or will be sold or exited by MetLife, Inc. (“Divested Businesses”). Operating revenues also excludes net investment gains (losses) (“NIGL”) and net derivative gains (losses) (“NDGL”). Operating expenses also excludes goodwill impairments. The following additional adjustments are made to GAAP revenues, in the line items indicated, in calculating operating revenues: • Universal life and investment-type product policy fees excludes the amortization of unearned revenue related to NIGL and NDGL and certain variable annuity guaranteed minimum income benefits ("GMIB") fees ("GMIB Fees"); • Net investment income: (i) includes amounts for scheduled periodic settlement payments and amortization of premium on derivatives that are hedges of investments but do not qualify for hedge accounting treatment, (ii) includes income from discontinued real estate operations, (iii) excludes post-tax operating earnings adjustments relating to insurance joint ventures accounted for under the equity method, (iv) excludes certain amounts related to contractholder-directed unit-linked investments, and (v) excludes certain amounts related to securitization entities that are variable interest entities ("VIEs") consolidated under GAAP; and • Other revenues are adjusted for settlements of foreign currency earnings hedges. 22 |
 Explanatory Note on Non-GAAP Financial Information (Continued) 23 The following additional adjustments are made to GAAP expenses, in the line items indicated, in calculating operating expenses: • Policyholder benefits and claims and policyholder dividends excludes: (i) changes in the policyholder dividend obligation related to NIGL and NDGL, (ii) inflation-indexed benefit adjustments associated with contracts backed by inflation-indexed investments and amounts associated with periodic crediting rate adjustments based on the total return of a contractually referenced pool of assets, (iii) benefits and hedging costs related to GMIBs ("GMIB Costs"), and (iv) market value adjustments associated with surrenders or terminations of contracts ("Market Value Adjustments"); • Interest credited to policyholder account balances includes adjustments for scheduled periodic settlement payments and amortization of premium on derivatives that are hedges of policyholder account balances but do not qualify for hedge accounting treatment and excludes amounts related to net investment income earned on contractholder-directed unit-linked investments; • Amortization of deferred policy acquisition costs (“DAC”) and value of business acquired ("VOBA") excludes amounts related to: (i) NIGL and NDGL, (ii) GMIB Fees and GMIB Costs, and (iii) Market Value Adjustments; • Amortization of negative VOBA excludes amounts related to Market Value Adjustments; • Interest expense on debt excludes certain amounts related to securitization entities that are VIEs consolidated under GAAP; and • Other expenses excludes costs related to: (i) noncontrolling interests, (ii) implementation of new insurance regulatory requirements, and (iii) acquisition and integration costs. Operating return on MetLife, Inc.'s common equity is defined as operating earnings available to common shareholders divided by average GAAP common equity. Operating expense ratio is calculated by dividing operating expenses (other expenses net of capitalization of DAC) by premiums, fees and other revenues (operating). MetLife believes the presentation of operating earnings and operating earnings available to common shareholders as MetLife measures it for management purposes enhances the understanding of the company's performance by highlighting the results of operations and the underlying profitability drivers of the business. Operating revenues, operating expenses, operating earnings, operating earnings available to common shareholders, operating earnings available to common shareholders per diluted common share, book value per common share, excluding AOCI, book value per diluted common share, excluding AOCI, operating return on MetLife, Inc.’s common equity, operating return on MetLife, Inc.’s common equity, excluding AOCI, investment portfolio gains (losses) and derivative gains (losses) should not be viewed as substitutes for the following financial measures calculated in accordance with GAAP: GAAP revenues, GAAP expenses, GAAP income (loss) from continuing operations, net of income tax, GAAP net income (loss) available to MetLife, Inc.'s common shareholders, GAAP net income (loss) available to MetLife, Inc.'s common shareholders per diluted common share, book value per common share, book value per diluted common share, return on MetLife, Inc.’s common equity, return on MetLife, Inc.’s common equity, excluding AOCI, net investment gains (losses) and net derivative gains (losses), respectively. |
 Explanatory Note on Non-GAAP Financial Information (Continued) 24 For the historical periods presented, reconciliations of non-GAAP measures used in this presentation to the most directly comparable GAAP measures may be included in an Appendix to the presentation materials and/or are on the Investor Relations portion of our Internet website. Additional information about our historical results is also available on our Internet website in our Quarterly Financial Supplements for the corresponding periods. Managed Assets (as defined below) is a financial measure based on methodologies other than GAAP. MetLife utilizes “Managed Assets” to describe assets in its investment portfolio which are actively managed and reflected at estimated fair value. MetLife believes the use of Managed Assets enhances the understanding and comparability of its investment portfolio by excluding assets such as policy loans, other invested assets, mortgage loans held-for-sale, and mortgage loans held by consolidated securitization entities, as substantially all of those assets are not actively managed in MetLife’s investment portfolio. Trading and other securities are also excluded as this amount is primarily comprised of contractholder- directed unit-linked investments, where the contractholder, and not the company, directs the investment of these funds. Mortgage loans and certain real estate investments have also been adjusted from carrying value to estimated fair value. The non-GAAP measures used in this presentation should not be viewed as substitutes for the most directly comparable GAAP measures. In this presentation, we may refer to sales activity for various products. These sales statistics do not correspond to revenues under GAAP, but are used as relevant measures of business activity. The impact of changes in foreign currency exchange rates is calculated using the average foreign currency exchange rates for the current period and is applied to the prior period. In this presentation, we may provide guidance on our future earnings, premiums, fees and other revenues, earnings per diluted common share, book value per common share and return on common equity on an operating or non-GAAP basis. A reconciliation of the non-GAAP measures to the most directly comparable GAAP measures is not accessible on a forward-looking basis because we believe it is not possible to provide other than a range of net investment gains and losses and net derivative gains and losses, which can fluctuate significantly within or without the range and from period to period and may have a significant impact on GAAP net income. |
 Reconciliations 2 0 1 3 INSURANCE CONFERENCE |
 Reconciliation of Operating Earnings Available to Common Shareholders to Income (Loss) from Continuing Operations, Net of Income Tax 26 (In millions, except per share data) Operating earnings available to common shareholders 5,686 $ $ 5.28 4,677 $ $ 4.38 Add: Preferred stock dividends 122 0.11 122 0.11 Operating earnings $ 5,808 $ 5.39 $ 4,799 $ 4.49 Adjustments from operating earnings to income (loss) from continuing operations, net of income tax: Add: Net investment gains (losses) (352) (0.33) (867) (0.81) Add: Net derivative gains (losses) (1,919) (1.78) 4,824 4.52 Add: Goodwill impairment (1,868) (1.73) - - Add: Other adjustments to continuing operations (2,550) (2.37) (1,451) (1.36) Add: Provision for income tax (expense) benefit 2,195 2.04 (914) (0.86) Income (loss) from continuing operations, net of income tax 1,314 $ 1.22 $ 6,391 $ 5.98 $ Weighted average common shares outstanding - diluted 1,076.8 1,068.1 2012 2011 |
 Reconciliation of Premiums, Fees & Other Revenues (Operating) to Premiums, Fees & Other Revenues (GAAP) (In millions) 2012 2011 Premiums, fees & other revenues (operating) 47,879 $ 45,449 $ Adjustments from premiums, fees & other revenues (operating) to premiums, fees & other revenues (GAAP): Add: Premiums 64 92 Add: Universal life and investment-type product policy fees 344 278 Add: Other revenues 150 880 Premiums, fees & other revenues (GAAP) 48,437 $ 46,699 $ 27 |
 Reconciliation of Return on Common Equity 2012 2011 Return on MetLife, Inc.'s Common Equity Operating return on MetLife, Inc.'s common equity, excluding AOCI (1) 11.3% 10.1% Operating return on MetLife, Inc.'s common equity (1) 9.6% 9.3% Return on MetLife, Inc.'s common equity, excluding AOCI (2) 2.4% 13.2% Return on MetLife, Inc.'s common equity (2) 2.0% 12.2% Book Value Per Common Share (3) Book value per common share, excluding accumulated other comprehensive income (loss) - (actual common shares outstanding) 46.73 $ 46.69 $ 10.44 5.74 Book value per common share - (actual common shares outstanding) 57.17 $ 52.43 $ Common shares outstanding, end of period (in millions) 1,091.7 1,058.0 (1) Operating return on MetLife, Inc.'s common equity is defined as operating earnings available to common shareholders divided by average GAAP common equity. (2) Return on MetLife, Inc.'s common equity is defined as net income available to common shareholders divided by average GAAP common equity. (3) Book value per common share, book value per common share, excluding accumulated other comprehensive income (loss) and MetLife, Inc.'s common equity exclude $2,043 million of equity. Add: Accumulated other comprehensive income (loss) per common share 28 |
 |