|
Edward A. Spehar Senior Vice President & Head of Investor Relations June 10, 2014 INVESTOR DAY 2014 Exhibit 99.1 |
|
Cautionary Statement on Forward-Looking Statements and Non-GAAP Financial Information 2 This presentation may contain or incorporate by reference forward-looking statements. Forward-looking statements give expectations or forecasts of future events and use words such as “anticipate,” “estimate,” “expect,” “project” and other terms of similar meaning, or are tied to future periods. Any or all forward-looking statements may turn out to be wrong, and actual results could differ materially from those expressed or implied in the forward-looking statements. Predictions of future performance are inherently difficult and are subject to numerous risks and uncertainties, including those identified in the “Risk Factors” section of MetLife, Inc.’s filings with the U.S. Securities and Exchange Commission. The company does not undertake any obligation to publicly correct or update any forward-looking statement if it later becomes aware that such statement is not likely to be achieved. Additional discussion of forward-looking statements may be included in other slides in this presentation; if so, please refer to those slides for more information. This presentation may also contain measures that are not calculated based on accounting principles generally accepted in the United States of America, also known as GAAP. Additional discussion of non-GAAP financial information may be included in other slides in these materials, on the Investor Relations portion of MetLife's website (www.metlife.com), or elsewhere on that website; if so, please refer to those slides or the website for more information. |
|
Agenda Overview – Focus on Capital Efficient Growth Steven A. Kandarian Chairman, President & CEO Americas William J. Wheeler President, Americas Todd Katz EVP, Group, Voluntary & Worksite Benefits Oscar Schmidt EVP, Latin America First Q&A Break Asia Chris Townsend President, Asia EMEA Michel Khalaf President, Europe, Middle East and Africa Global Employee Benefits Maria R. Morris EVP, Global Employee Benefits Break Final Q&A Closing Remarks Steven A. Kandarian Chairman, President & CEO 3 |
|
Steven A. Kandarian Chairman, President & Chief Executive Officer June 10, 2014 INVESTOR DAY 2014 |
|
Strategy Unveiled in May 2012 Drive Toward Customer Centricity and a Global Brand Grow Emerging Markets Build Global Employee Benefits Business Refocus the U.S. Business GLOBAL * WORLD-CLASS * SCALE 6 |
|
Key Commitments to Deliver by 2016 Shift from market-sensitive to protection products to improve risk profile Grow emerging markets to 20% of operating earnings Achieve $1 billion in gross expense savings Increase operating return on equity (ROE) to 12-14%; drive down the cost of equity capital (COEC) See Appendix for non-GAAP financial information, definitions, and/or reconciliations. 7 |
|
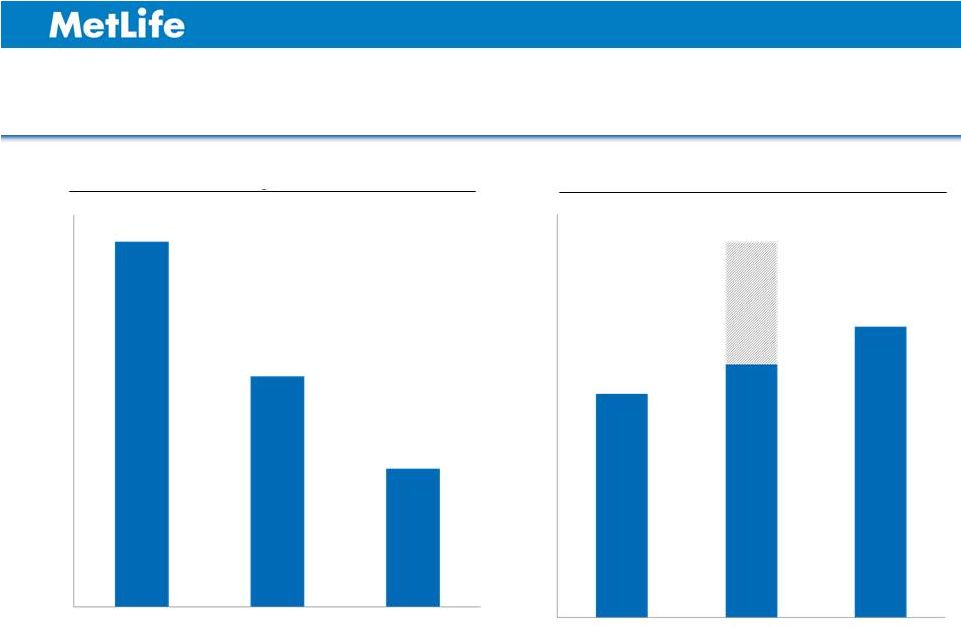
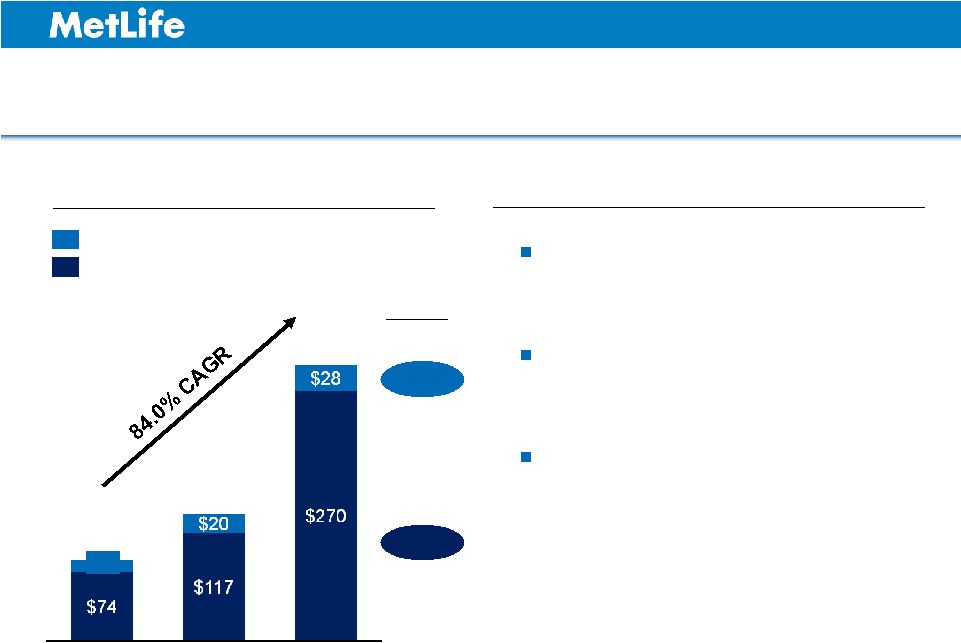
8 1 1 GVWB sales for 2012 exclude a single $550 million sale from winning the TRICARE Dental business. Total GVWB sales with TRICARE were $1.7 billion. See Appendix for non-GAAP financial information, definitions, and/or reconciliations. $0.0 $0.2 $0.4 $0.6 $0.8 $1.0 $1.2 $1.4 $1.6 $1.8 2011 2012 2013 $0 $5 $10 $15 $20 $25 $30 2011 2012 2013 Variable Annuity Sales ($ in billions) GVWB Sales ($ in billions) $28.4 $17.7 $1.0 $1.3 $1.1 Shift Toward Protection-Oriented Products $10.6 |
|
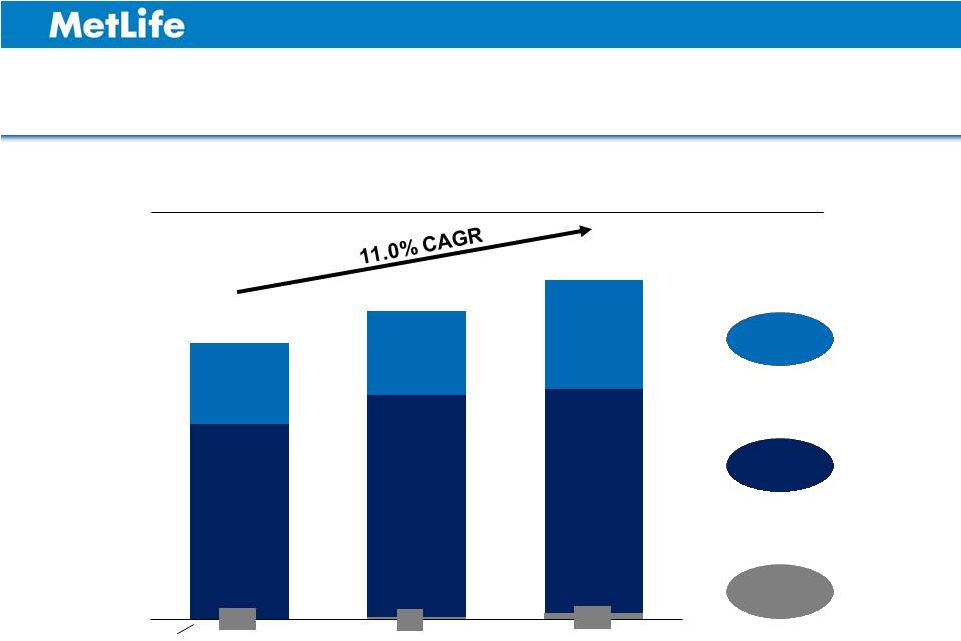
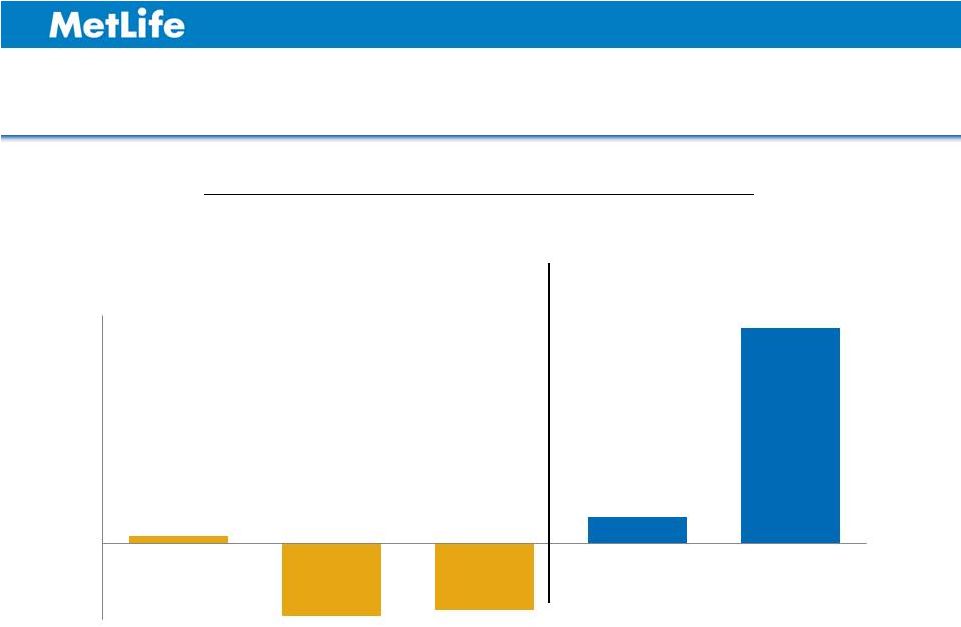
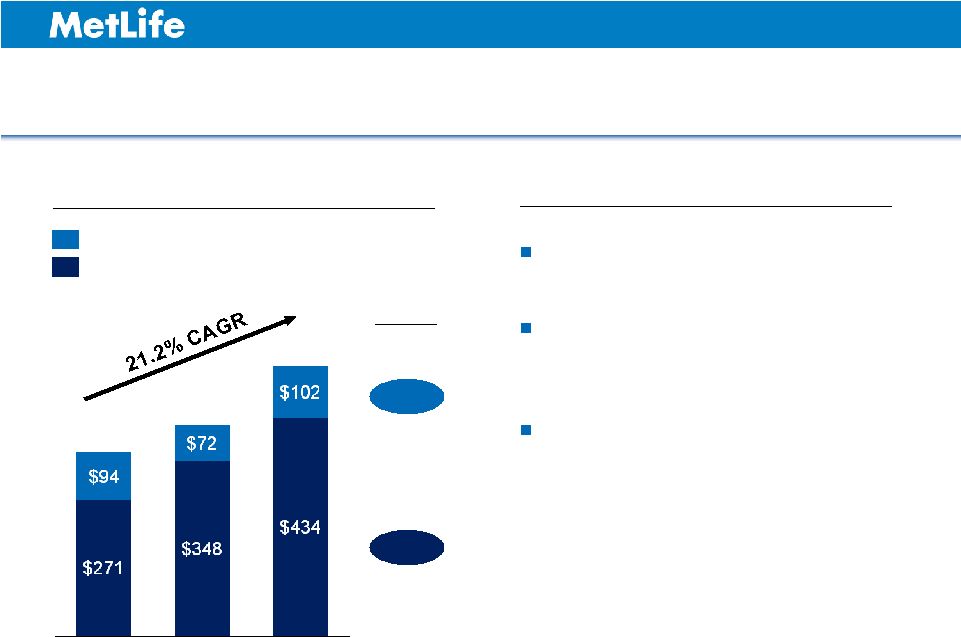
Operating Earnings Growth from Emerging Markets $7 $894 EMEA 1 $812 $726 Asia 3 2013 2012 $17 2011 Latin America 2 $(1) Operating Earnings ($ in millions) 1 Excludes Western Europe. 2 Excludes U.S. sponsored direct (as reported in Latin America). 3 Excludes Japan, Korea, Hong Kong and Australia. See Appendix for non-GAAP financial information, definitions, and/or reconciliations. 16.1% 7.1% NA 9 CAGR (2011 - 2013) $514 $583 $590 $213 $222 $287 |
|
On Track to Achieve $1 Billion of Gross Expense Saves 2014E 2013 $571 2012 $1,000 2015 Target Identified Saves ($ in millions) 10 $830-$860 Approximately half of reinvestment spend on Customer Centricity Improving technology and data analytics Upgrading and redesigning claims processing Reinvestment Highlights $135 |
|
11 $4,654 $5,649 $6,261 Improvement in Operating ROE and Reduction in Risk Operating ROE 10.0% 11.2% 11.9% May 2012 May 2014 One-year Beta 2 2011 2012 2013 MET S&P Life Peers Operating Earnings 1 ($ in millions) 1.78 1.47 1.53 1.32 1 Total company results reflect the recently completed disposition of MetLife Assurance Limited (MAL) by excluding operating earnings of $23 million, $37 million and $26 million for the years ended December 31, 2011, 2012 and 2013, respectively. Operating ROE on a historical reported basis (before the disposition of MAL) was 10.1%, 11.3% and 12.0% for the years ended December 31, 2011, 2012 and 2013, respectively. 2 Bloomberg, Standard & Poor’s (S&P). See Appendix for non-GAAP financial information, definitions, and/or reconciliations. |
|
Prudent Capital Management 12 Used internal resources to acquire ProVida (fee-based, emerging markets business) for $2 billion or 10x earnings Increased annual common stock dividend by 89% since early 2013 Announcing resumption of share repurchase program – Existing $1.3 billion authorization – Plan to repurchase up to $1 billion |
|
Key Takeaways Strong progress toward our 2016 goals Continuing to execute strategy to create value Diversified business with attractive growth profile Managing capital despite regulatory uncertainty 13 |
|
William J. Wheeler President Americas June 10, 2014 INVESTOR DAY 2014 |
|
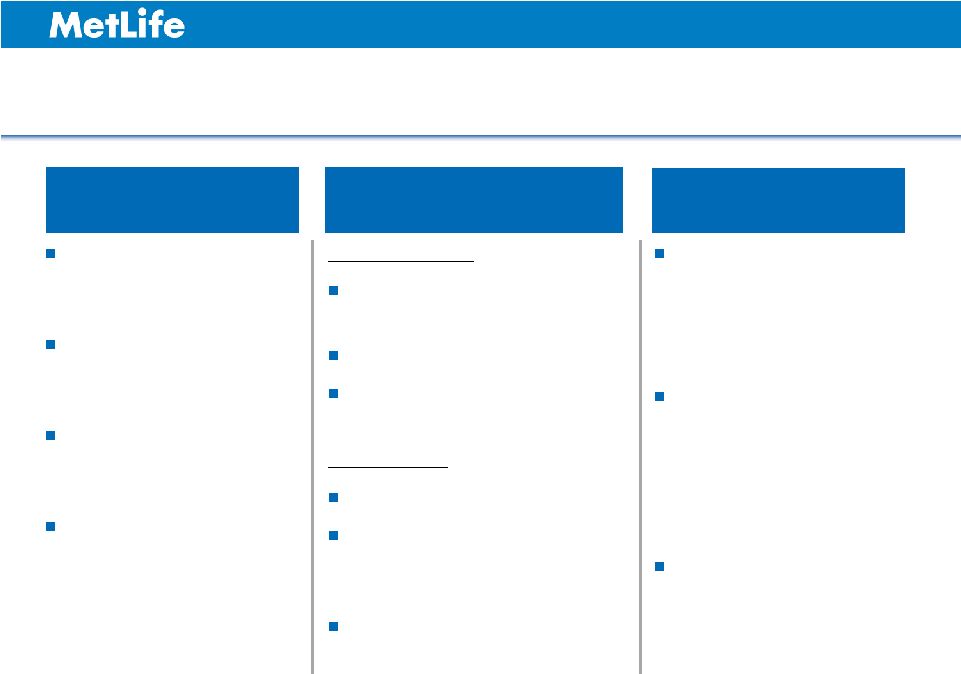
16 Americas – Key Strategies Accelerate growth in Group, Voluntary & Worksite Benefits Expand in Latin America Pursue U.S. pension closeouts Reposition Retail business Build U.S. Direct business |
|
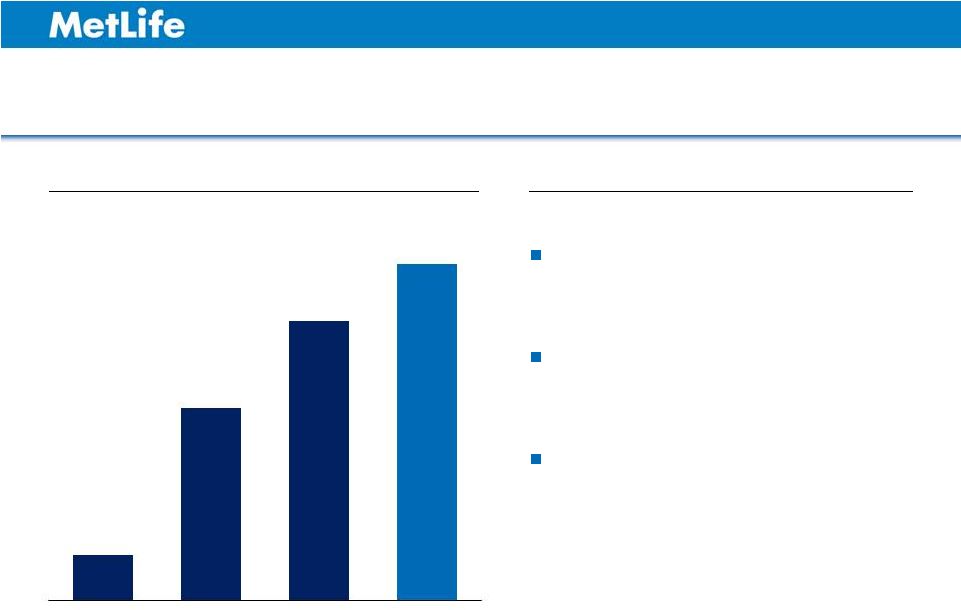
Americas – Corporate Benefit Funding 17 Estimate potential U.S. pension closeout market at $800 billion 1 U.S. pension closeout market share leader in 2013 with 45% of $3.8 billion market 2 Asset intensive business $1,100 $1,203 $1,295 Operating Earnings ($ in millions) Highlights 2011 2012 2013 1 Mercer S&P 1500 Funded Status (October 2, 2013), MetLife internal analysis. 2 LIMRA U.S. Group Annuity Risk Transfer Survey, 4Q13. See Appendix for non-GAAP financial information, definitions, and/or reconciliations. |
|
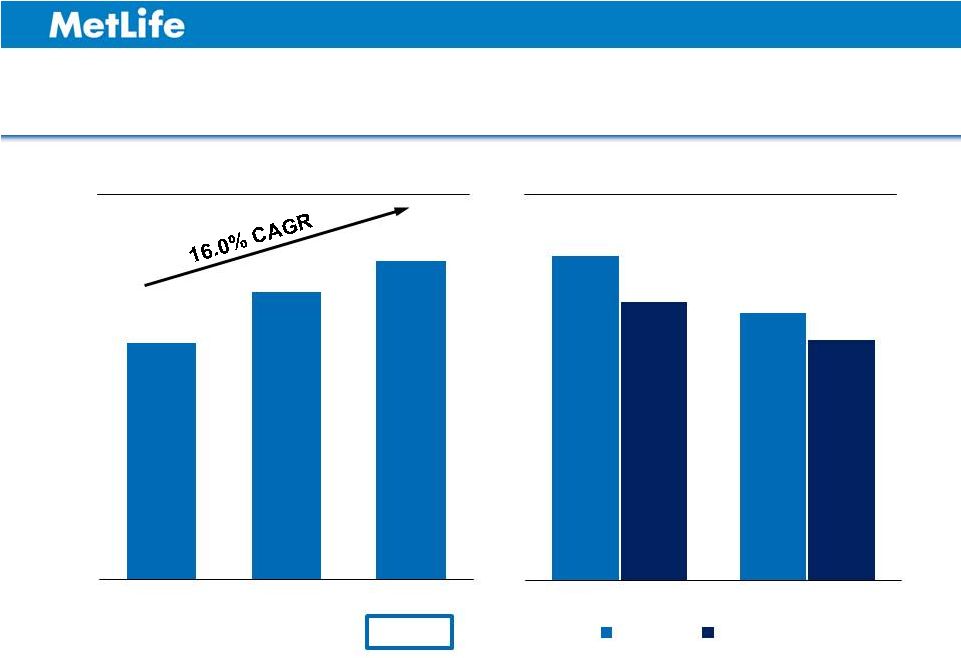
Americas – Retail 18 See Appendix for non-GAAP financial information, definitions, and/or reconciliations. Major transformational change in Retail Substantial cost reduction De-risked product offerings, positioning for future growth Driving enhancements to advisor productivity $1,335 $2,002 $2,524 Operating Earnings ($ in millions) Highlights 2011 2012 2013 |
|
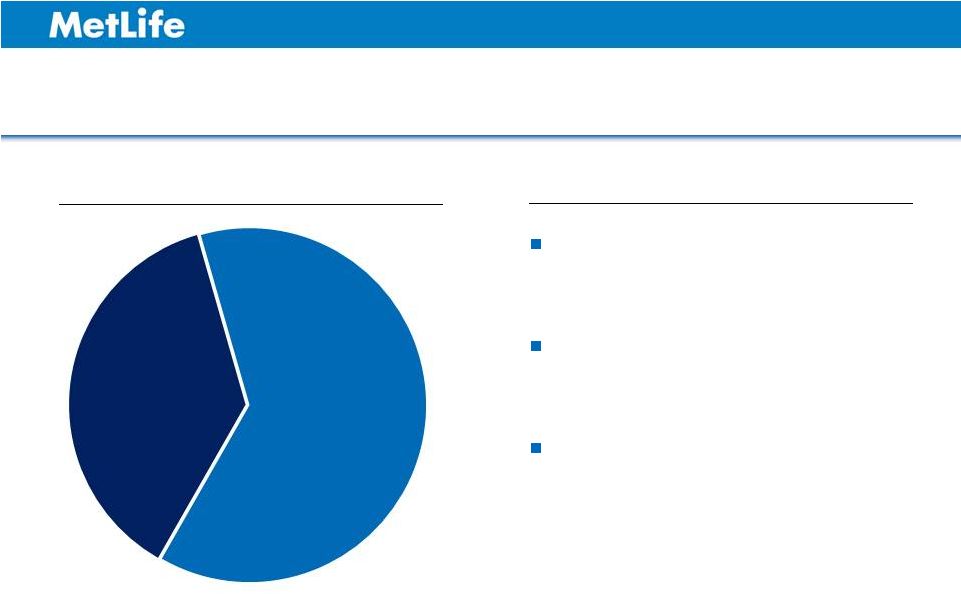
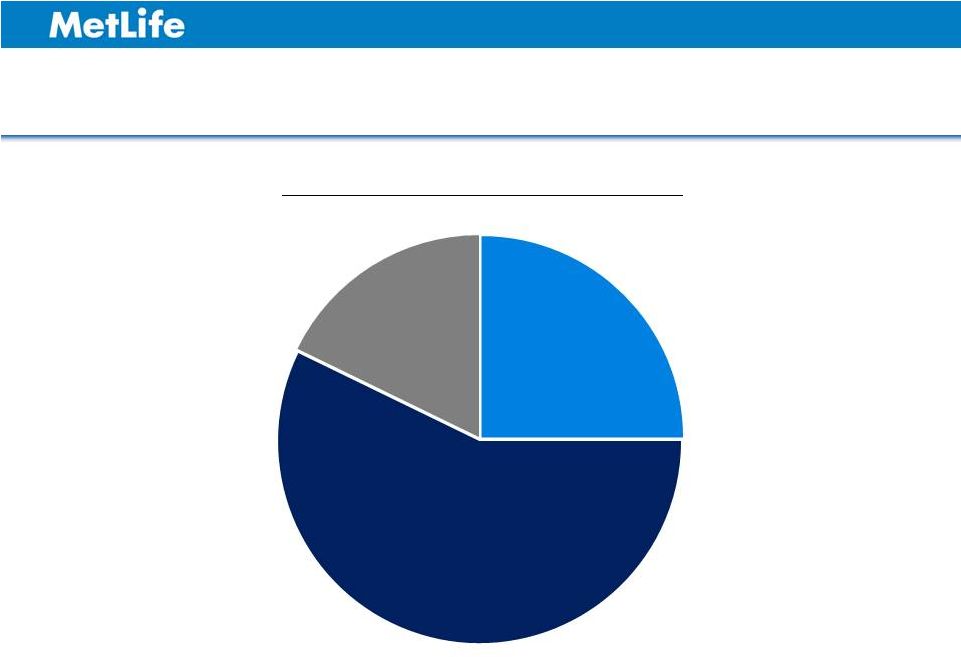
Americas – U.S. Direct Market 19 44 million U.S. households do not have life insurance 35 million of insured U.S. households are underinsured Estimated $15 trillion U.S. life insurance gap Life Insurance Coverage 1 Highlights Uninsured 37% Life Insurance 63% 1 Percentage of U.S. households. Source: LIMRA, “Closing the Life Insurance Gap: One Household at a Time” (2012), MetLife internal analysis. |
|
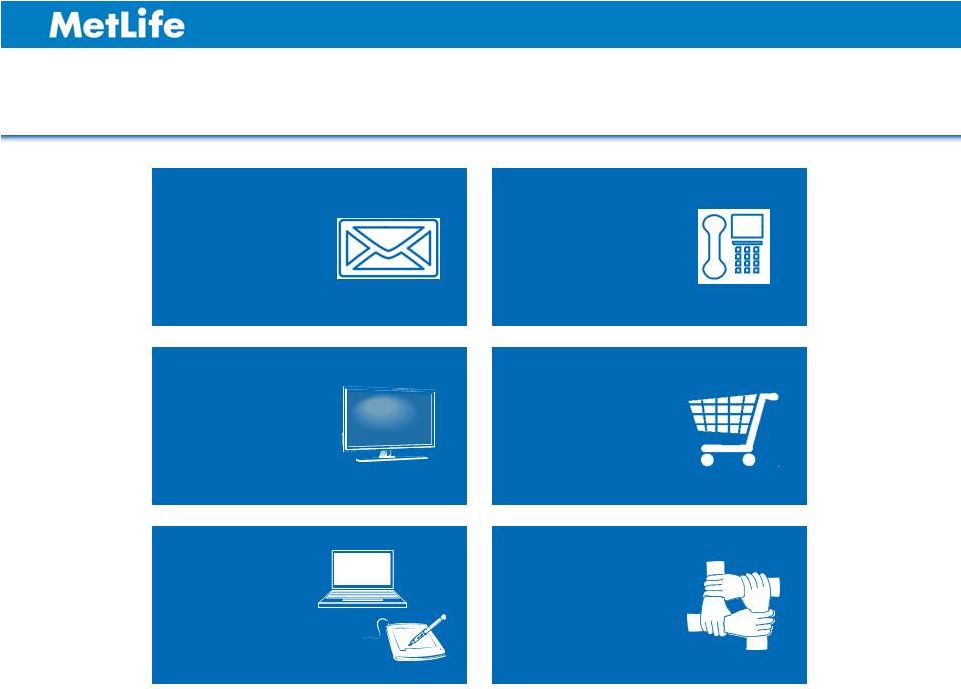
Americas – U.S. Direct Channels 20 Direct Mail Direct Response Television Digital Call Centers Retail Stores Sponsors |
|
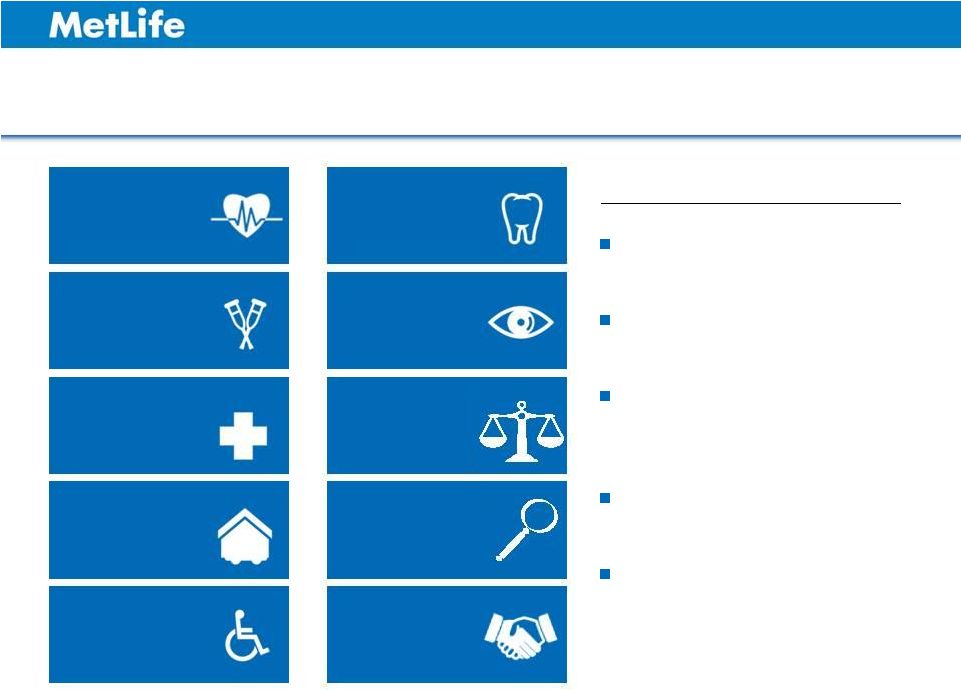
Americas – U.S. Direct Product Portfolio Life 21 Broad set of offerings Insurance & Non-insurance Simple design based on segment needs Focus on protection Limited underwriting Accident Supplemental Health Auto & Home Disability Dental Vision Legal Identity Assistance Highlights |
|
Americas – Direct Response TV 22 Simplified Issue Term Television Advertising “Marlon” The full video is available at http://investor.metlife.com. All other information contained on MetLife’s website is not a part of this presentation. |
|
Americas – Identity Protection 23 MetLife Defender “Busy Life” www.metlifedefender.com The full video is available at http://investor.metlife.com. All other information contained on MetLife’s website is not a part of this presentation. |
|
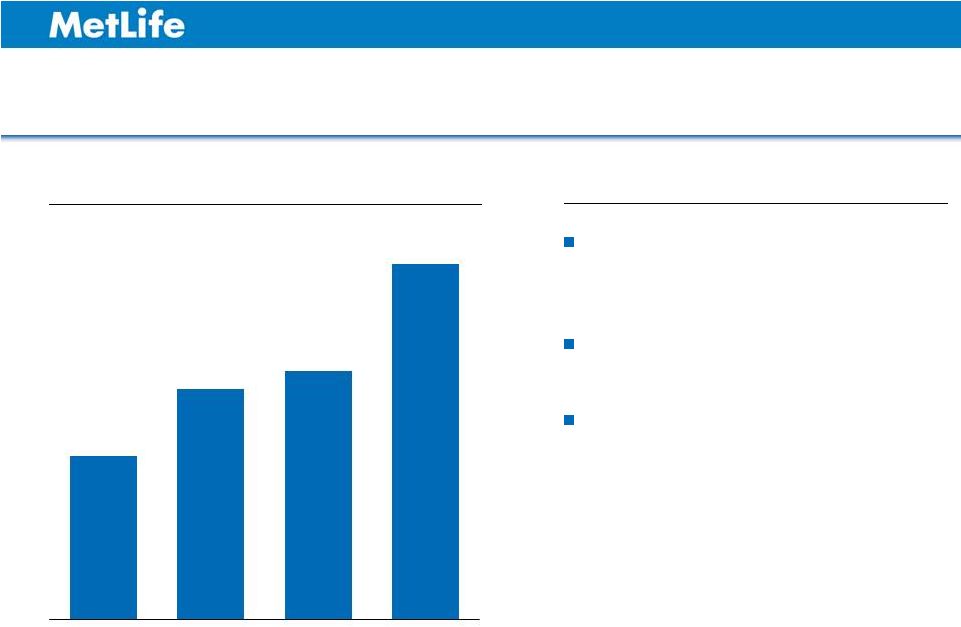
Insurance Sales 1 ($ in millions) Americas – U.S. Direct Sales 24 Invest to grow across products, channels and capabilities Forecast 2014 sales of $130 million Expect 2014 $(40) million post-tax loss Highlights $11 $15 $24 $17 2Q13 3Q13 4Q13 1Q14 1 Includes U.S. direct to consumer (as reported in Corporate & Other) and U.S. sponsored direct (as reported in Latin America) (collectively, U.S. Direct). U.S. sponsored direct excludes funding agreements of $0, $0, $1 million and $22 million in 2Q13, 3Q13, 4Q13 and 1Q14, respectively. See Appendix for non-GAAP financial information, definitions, and/or reconciliations. |
|
25 Americas Key Takeaways Upside in Corporate Benefit Funding in pension risk transfer Low single digit growth in Retail Promising opportunity in Direct Mid to high single digit growth in GVWB Low to mid-teen growth in Latin America Overall mid-single digit operating earnings growth over long term 1 1 Long term is the secular growth trend from 2016 onward. See Appendix for non-GAAP financial information, definitions and/or reconciliations. |
|
Todd Katz Executive Vice President Group, Voluntary & Worksite Benefits June 10, 2014 INVESTOR DAY 2014 |
|
28 GVWB Overview Protect and grow Large Market 1 franchise Invest to increase share in the Middle Market 2 Expand P&C business Invest to become a significant Voluntary/ Worksite player Demand for voluntary/non- medical products as responsibility shifts to employees Emergence of private exchanges Increase share in the mid-sized employer market Uncertainty due to health care reform Aggressive competitor pricing Continued slow growth in wages and jobs in the U.S. Target market growth for group insurance industry is 2-4% 3 Premiums, fees and other revenues (PFOs) growth expected to be 4-7% Operating earnings growth expected to be 6-8% 1 Large Market is defined as 5,000 eligible lives. 2 Middle Market is defined as 100 to 4,999 eligible lives. 3 MetLife internal analysis based on 2008-2012 LIMRA and Eastbridge reports. See Appendix for non-GAAP financial information, definitions and/or reconciliations. Key Strategies Opportunities and Challenges Long-Term Outlook Opportunities: Challenges: |
|
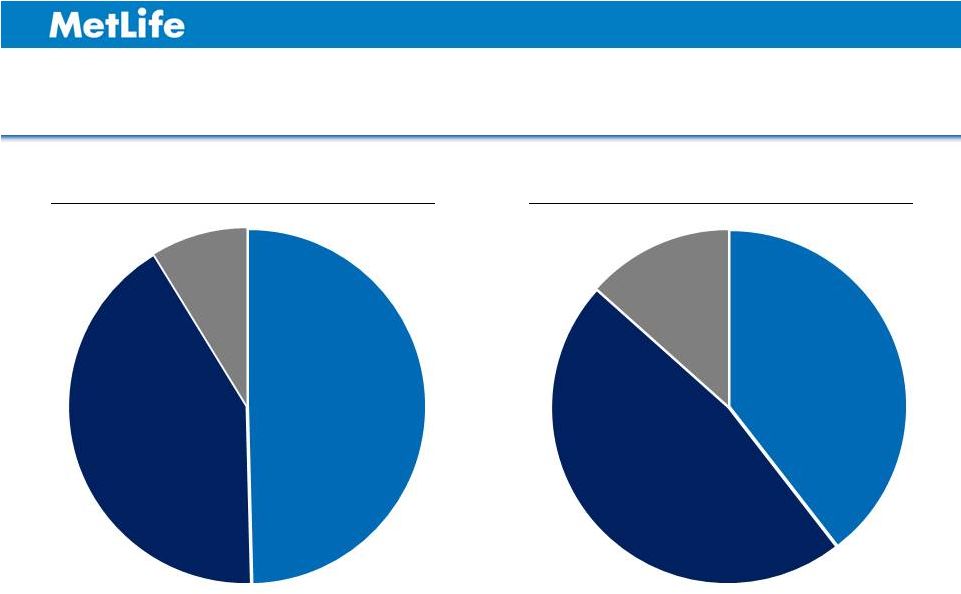
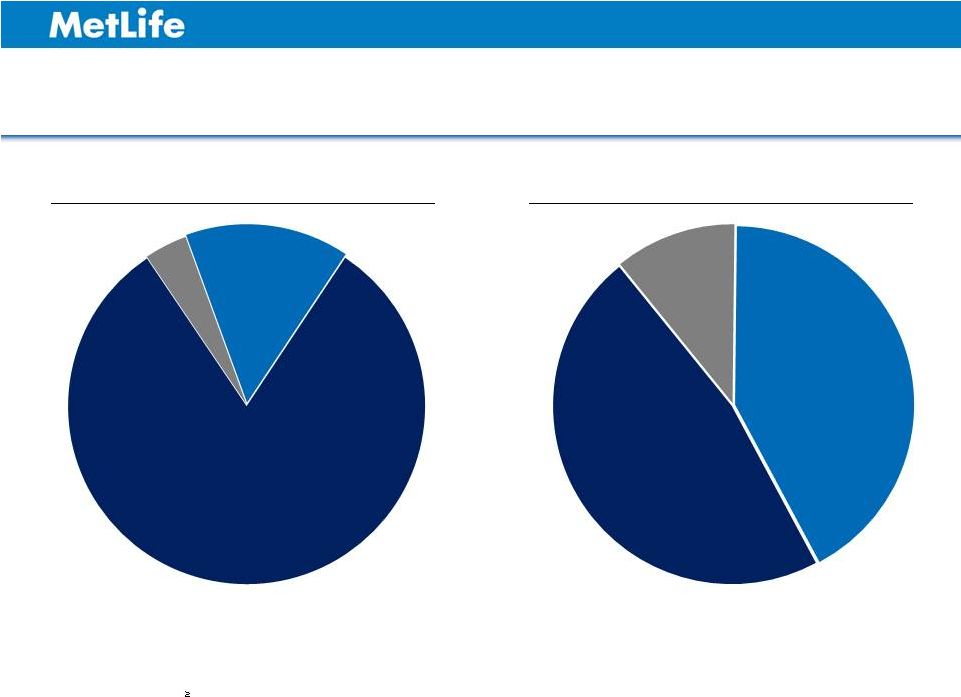
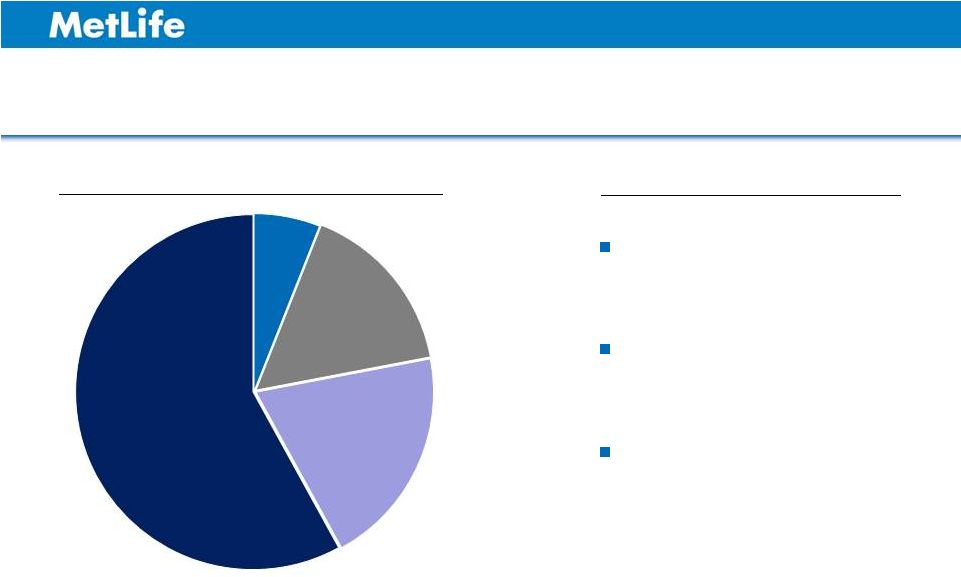
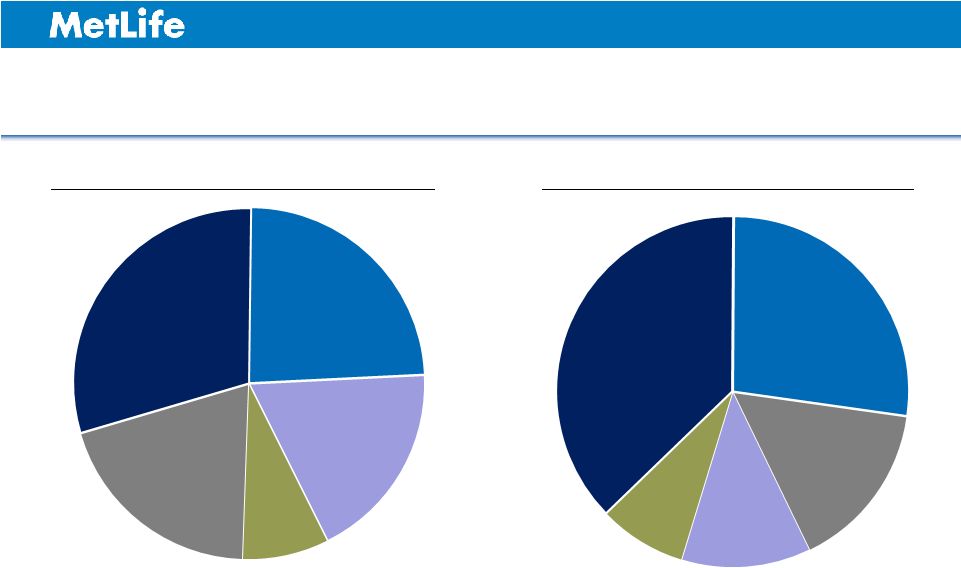
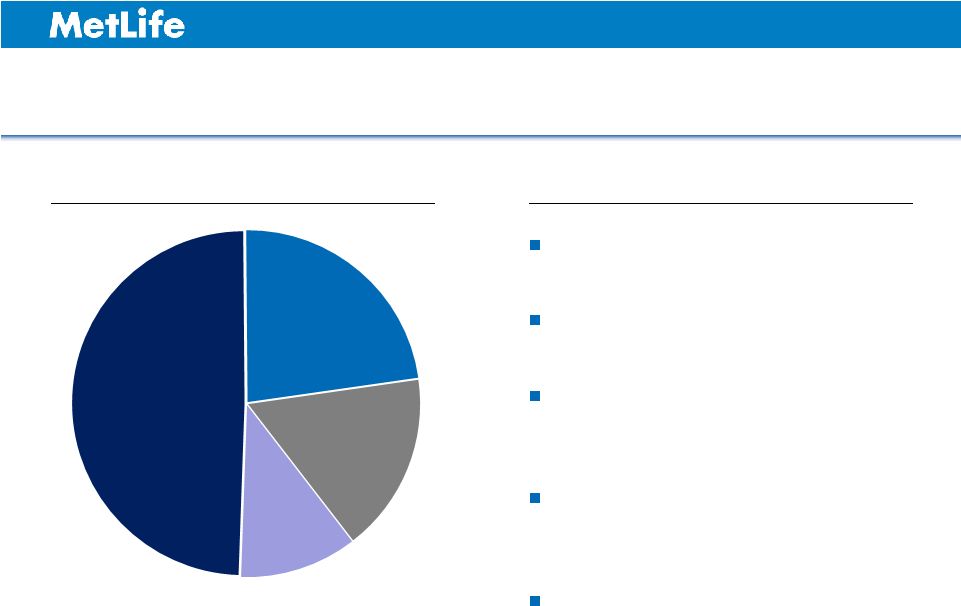
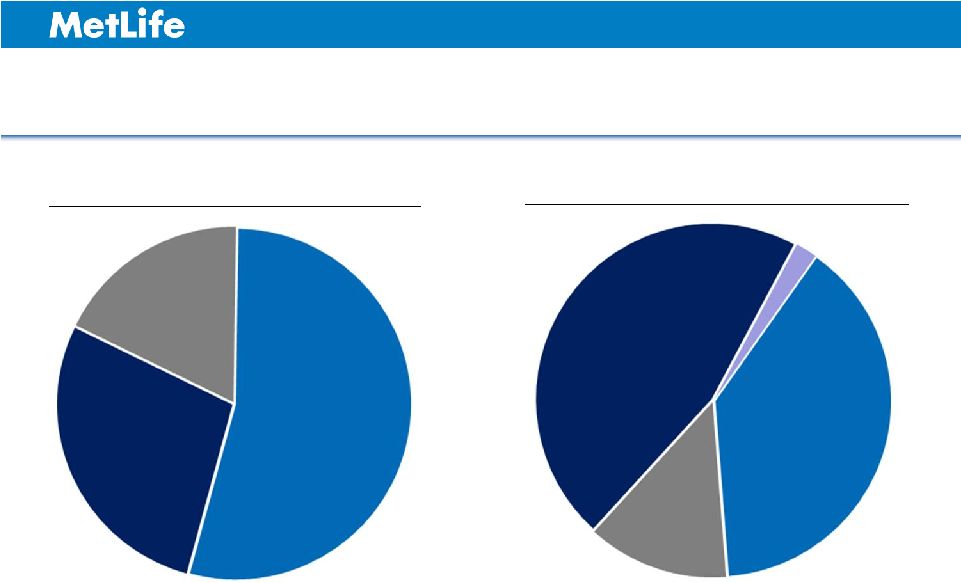
2013: GVWB Financial Results PFOs by Product Operating Earnings by Product Total PFOs: $16.4B Total Operating Earnings: $1.0B 29 Life 2 49% Non-Medical Health 1 42% P&C 9% Non-Medical Health 47% Life 40% P&C 13% Includes dental, disability, long-term care (LTC), accidental death & dismemberment (AD&D), critical illness, vision and other health. 2 Excludes AD&D and includes certain experience-rated contracts. See Appendix for non-GAAP financial information, definitions and/or reconciliations. 1 |
|
2013: GVWB Sales Total Sales: $1.3B Sales by Product 30 See Appendix for non-GAAP financial information, definitions and/or reconciliations. Life 25% Non Medical Health 57% P&C 18% - |
|
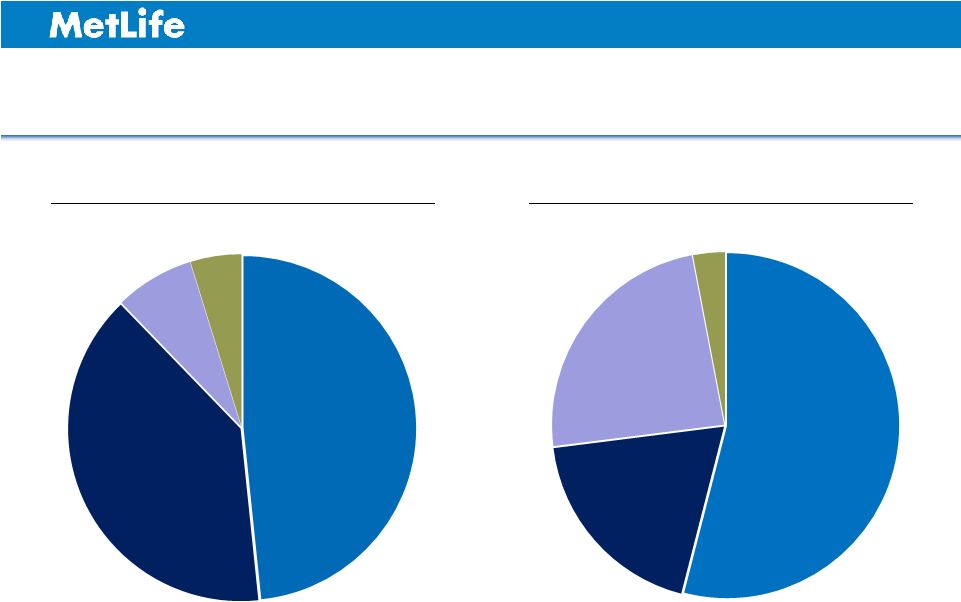
2013: GVWB PFOs and Sales Total PFOs: $16.4B 1 Large Market is defined as 5,000 eligible lives, Middle Market is defined as 100 to 4,999 eligible lives and Small Market is defined as 2 to 99 eligible lives. See Appendix for non-GAAP financial information, definitions and/or reconciliations. Total Sales: $1.3B PFOs by Case Size 1 Sales by Case Size 1 31 Small 11% Middle 42% Large 47% Middle 15% Large 81% Small 4% |
|
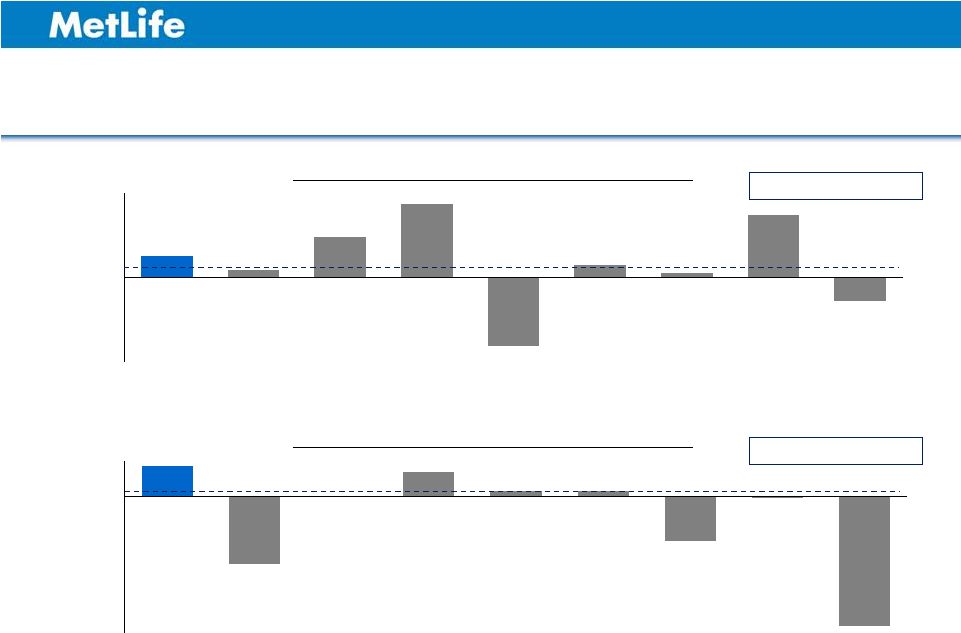
-20% -15% -10% -5% 0% 5% MetLife A B C D E F G H -10% -5% 0% 5% 10% MetLife A B C D E F G H Group Insurance 1 : 2010 – 2013 CAGR 1 PFOs and operating earnings as provided in companies’ respective statistical supplements. Excludes group medical insurance and P&C. See Appendix for non-GAAP financial information, definitions and/or reconciliations. Premiums, Fees & Other Revenues Operating Earnings 32 - - - Average 0.6% - - - Average 1.7% |
|
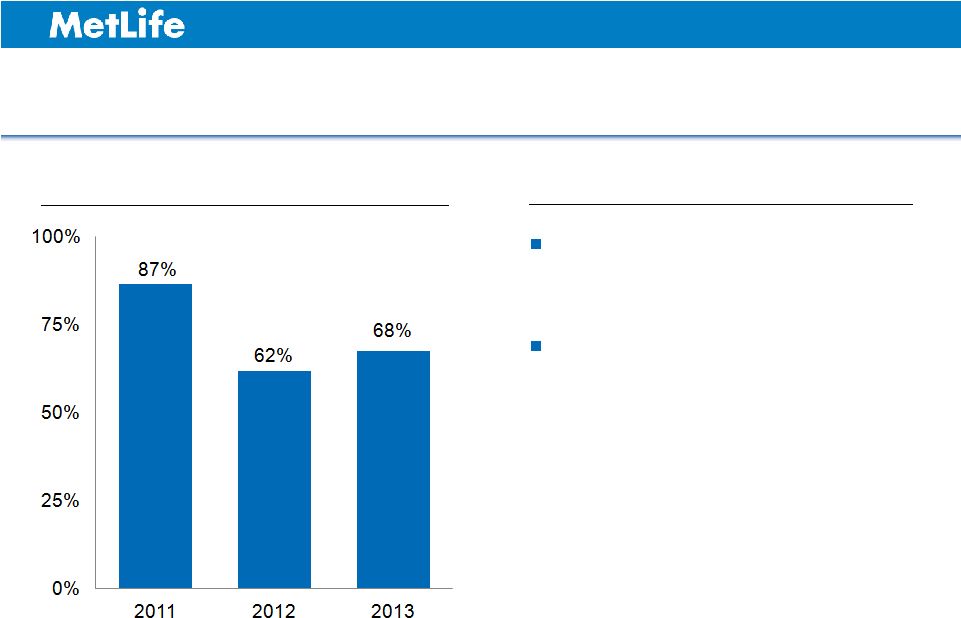
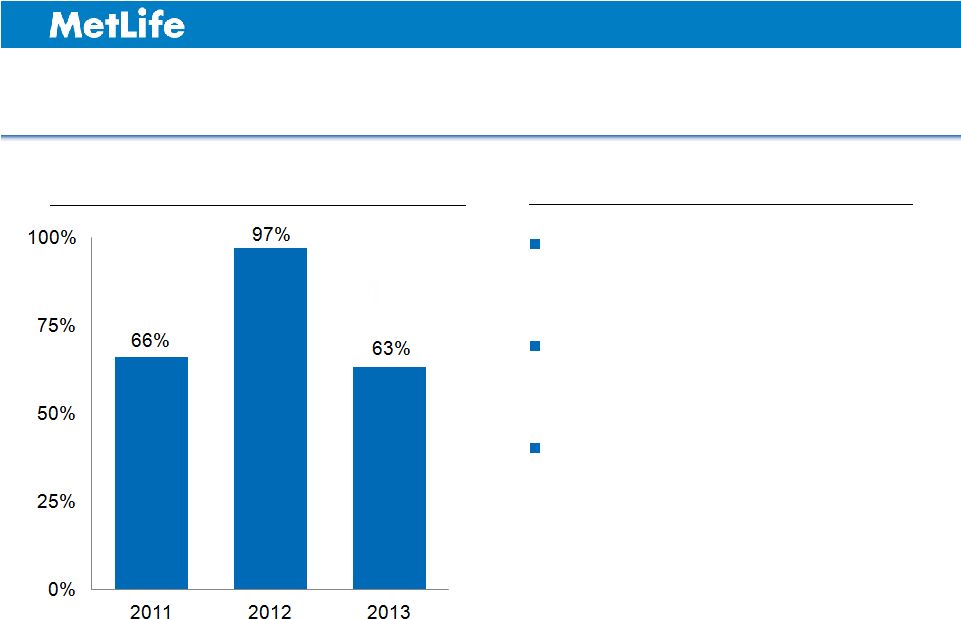
GVWB: Statutory to GAAP Ratio Strong Statutory Earnings 33 87% 92% 83% 1 Numerator is statutory net gain from operations. Denominator is operating earnings derived from GAAP. See Appendix for non-GAAP financial information, definitions and/or reconciliations. 0% 25% 50% 75% 100% 2011 2012 2013 Ongoing Operations (excludes LTC) 1 |
|
Protect and Grow Large Market Franchise Disciplined pricing Growth with existing customers Expansion opportunity in public sector business 2013 Total Industry Large Market Premiums, Fees & Other Revenues of $43B #1 Large Market Franchise 1 34 Highlights 1 Market share amounts are based solely on MetLife internal estimates using limited market share data reported by competitors. MetLife 30% Next Top 3 Carriers Combined 25% All Others 45% |
|
Invest to Increase Market Share in the Middle Market Integrated benefits solution Segmented broker strategy Focus on exchanges 2013 Total Industry Middle Market Premiums, Fees & Other Revenues of $46B Untapped Potential 1 35 Highlights 1 Market share amounts are based solely on MetLife internal estimates using limited market share data reported by competitors. MetLife 6% Next Top 3 Combined 16% Industry Leader 20% All Others 58% |
|
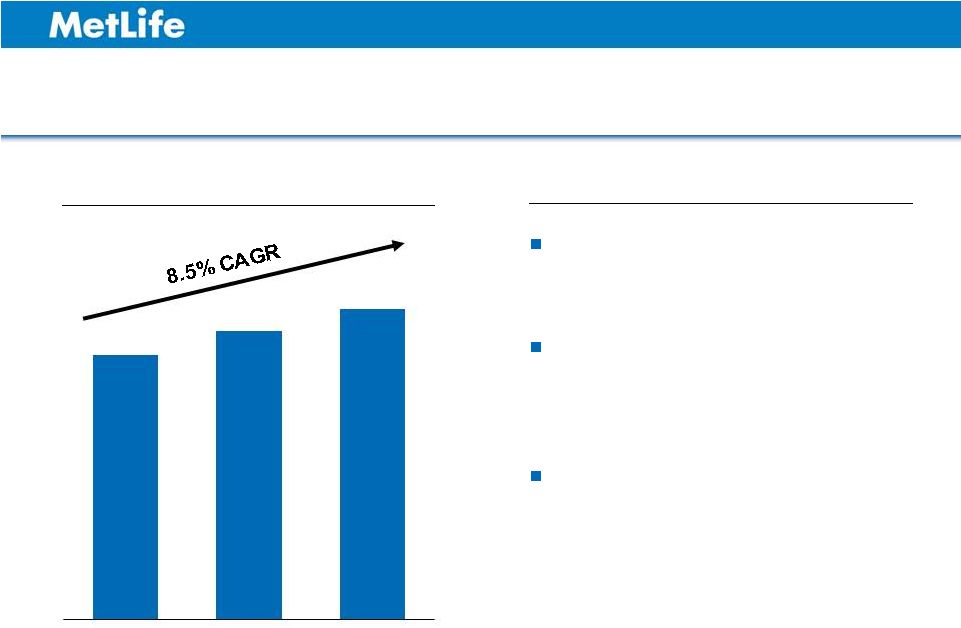
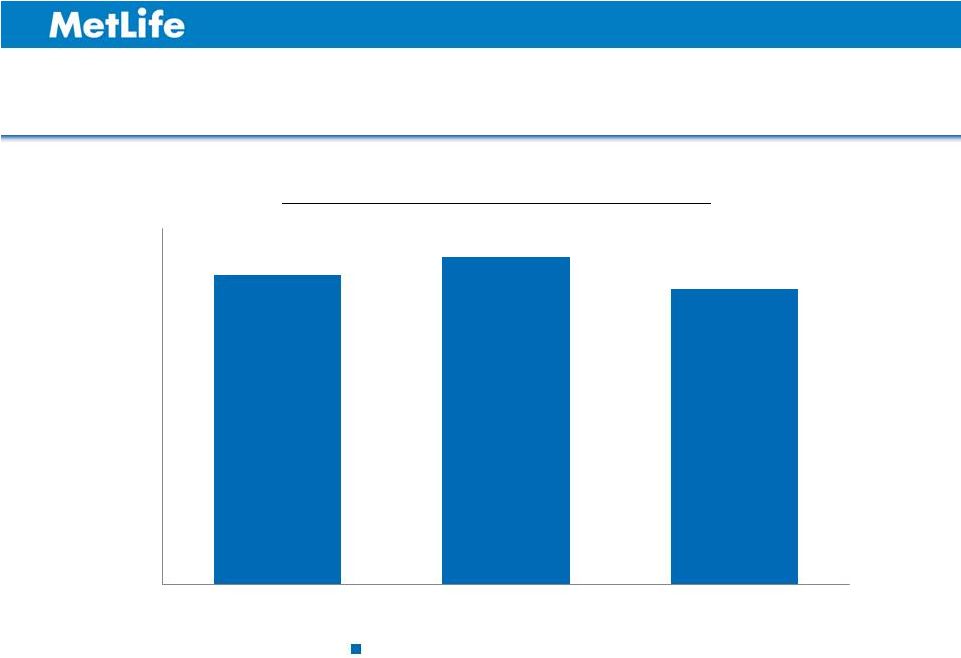
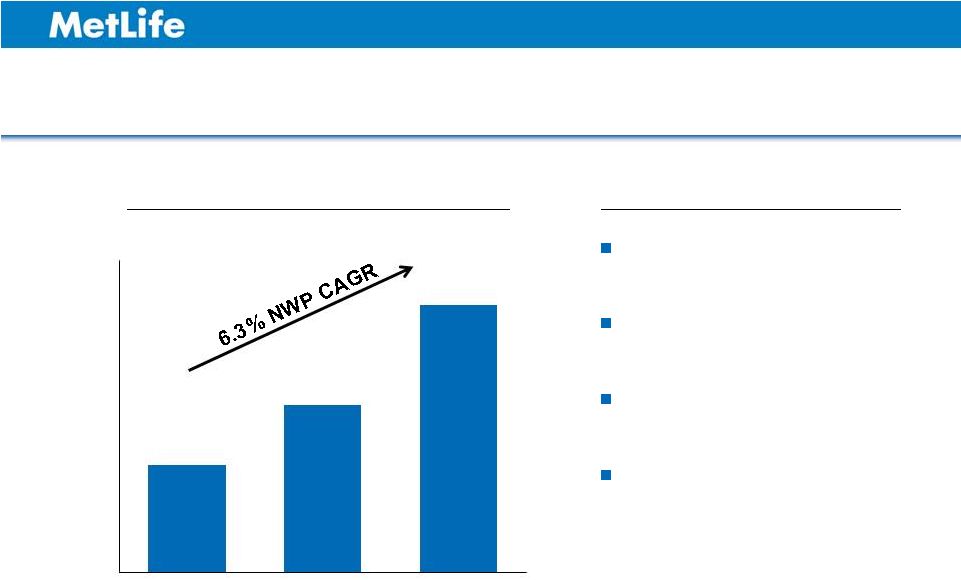
Expand Property & Casualty Business Market expansion Participation growth Enhanced marketing Risk management Combined Ratio 93.0 % Net Written Premiums (NWP) 1 and Combined Ratio 2 ($ in millions) 36 Highlights 1 Includes GVWB and U.S. sponsored direct (as reported in Latin America). 2 Includes payment fee credit and excludes catastrophe losses and prior year development. $1,371 $1,438 $1,550 $1,250 $1,300 $1,350 $1,400 $1,450 $1,500 $1,550 $1,600 2011 2012 2013 Combined 93.7 % Combined 91.4 % Ratio Ratio Combined Ratio 93.0 % |
|
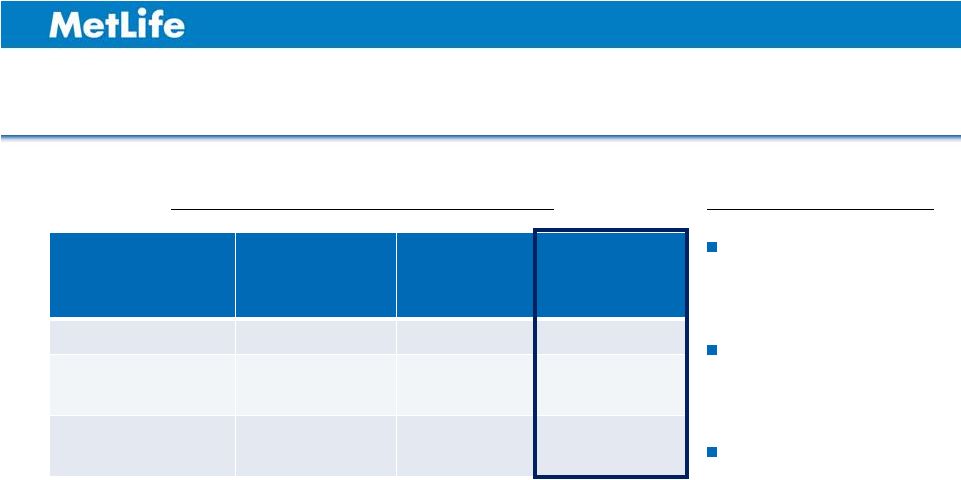
Invest to become a Significant Voluntary/Worksite Player Strong consumer brand Unmatched breadth of products Ease of purchase Life, Dental, & Disability Property & Casualty Other Voluntary/ Worksite Market Size $100.0 1 $3.5 2 $14.7 3 GVWB 2013 PFOs 4 $14.0 $1.4 $0.2 GVWB 2013 Market Share 14% 40% 1.4% The Opportunity ($ in billions) 37 Highlights 1 LIMRA, 2013; MetLife internal analysis. 2 MetLife P&C market estimate, 2013. 3 Eastbridge, 2013; MetLife internal analysis. 4 Excludes LTC. See Appendix for non-GAAP financial information, definitions and/or reconciliations. |
|
GVWB Key Takeaways Expect long-term growth in PFOs to be between 4-7%, while maintaining pricing discipline 1 – Core products 2 are expected to grow 3-6% – Voluntary products 3 are expected to grow 8-11% Operating earnings long-term growth expected to be 6-8% Strong operating ROE and cash generation 1 MetLife Group Insurance Markets Analysis based on 2008-2012 LIMRA and Eastbridge reports. 2 Life, dental & disability. 3 P&C, legal, accident & health (A&H) and critical illness. See Appendix for non-GAAP financial information, definitions and/or reconciliations. 38 |
|
Oscar Schmidt Executive Vice President Latin America June 10, 2014 INVESTOR DAY 2014 |
|
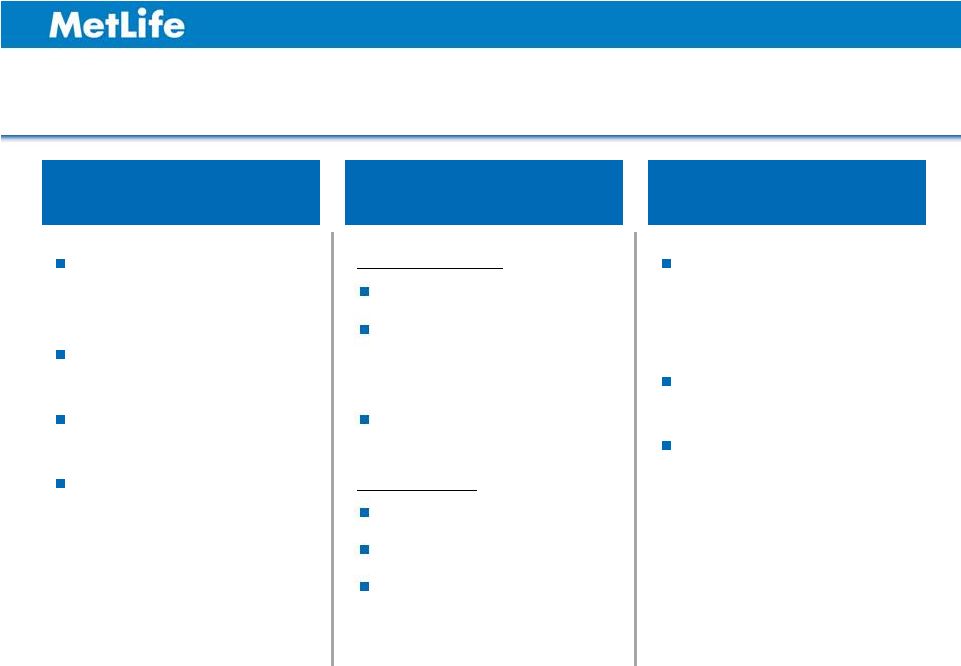
Latin America Overview Strengthen and expand worksite marketing and other agencies Complete integration and grow ProVida Build direct marketing as a regional growth engine Leverage global employee benefits Anticipate low double- digit growth in operating PFOs, consistent with market Modest reinvestment required Expect operating earnings growth in excess of growth in operating PFOs Key Strategies Long-Term Outlook Opportunities and Challenges 41 See Appendix for non-GAAP financial information, definitions and/or reconciliations. ProVida acquisition Growth in employee benefits and worksite marketing Growth in direct marketing Foreign exchange rates Chile tax reform Regulatory changes Opportunities: Challenges: |
|
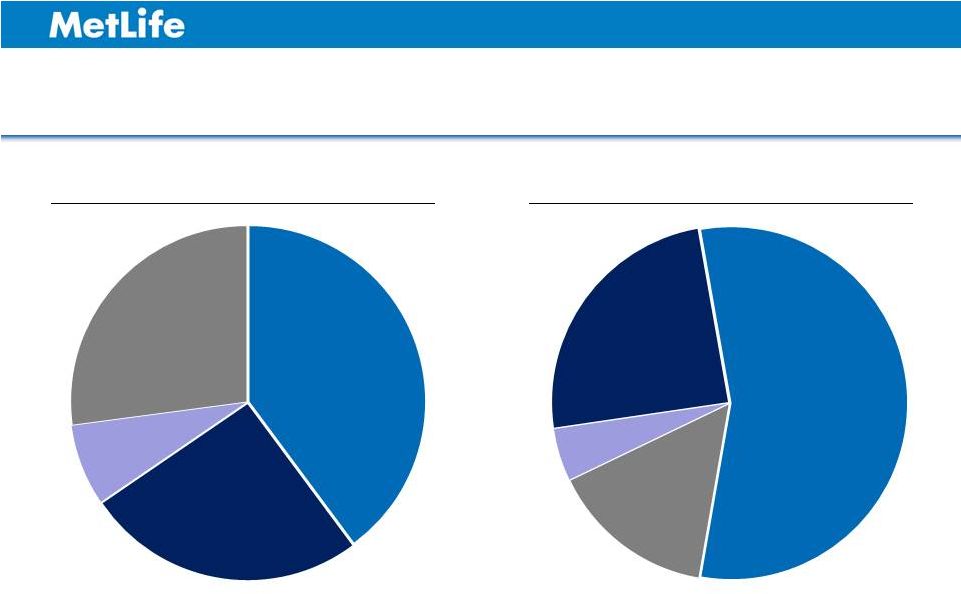
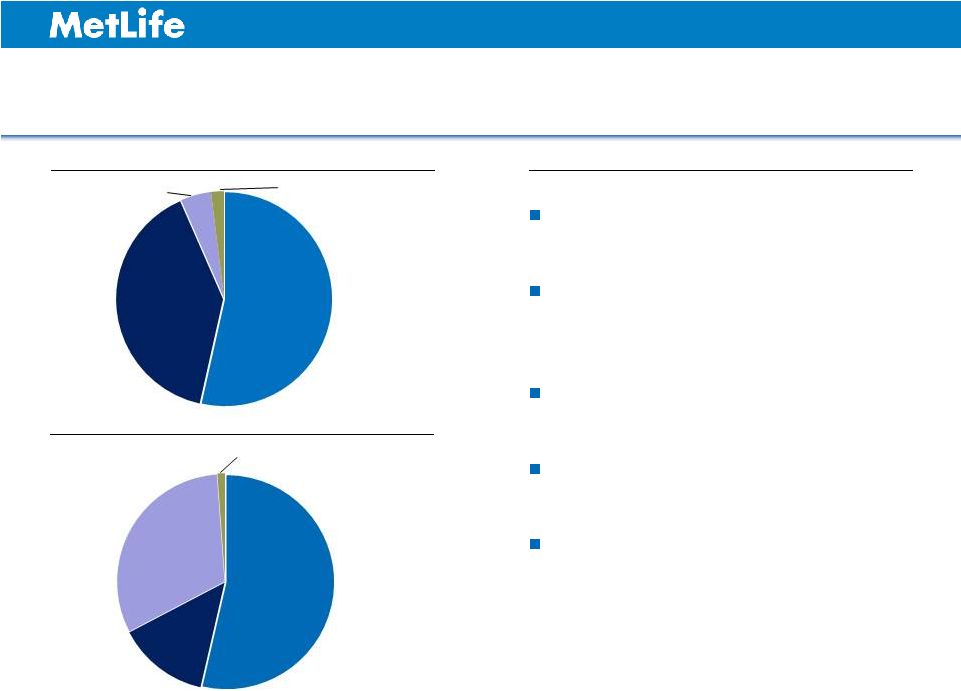
Sales by Distribution Channel 1 2013: Latin America Sales by Product and Distribution Channel 1 Excludes U.S. sponsored direct (as reported in Latin America). See Appendix for non-GAAP financial information, definitions and/or reconciliations. Sales by Product 1 A&H 26% Credit Life 7% Direct 25% Group 15% 42 Total Sales: $1.2B Life 40% Retirement 27% Retail 55% Mexico Public 5% |
|
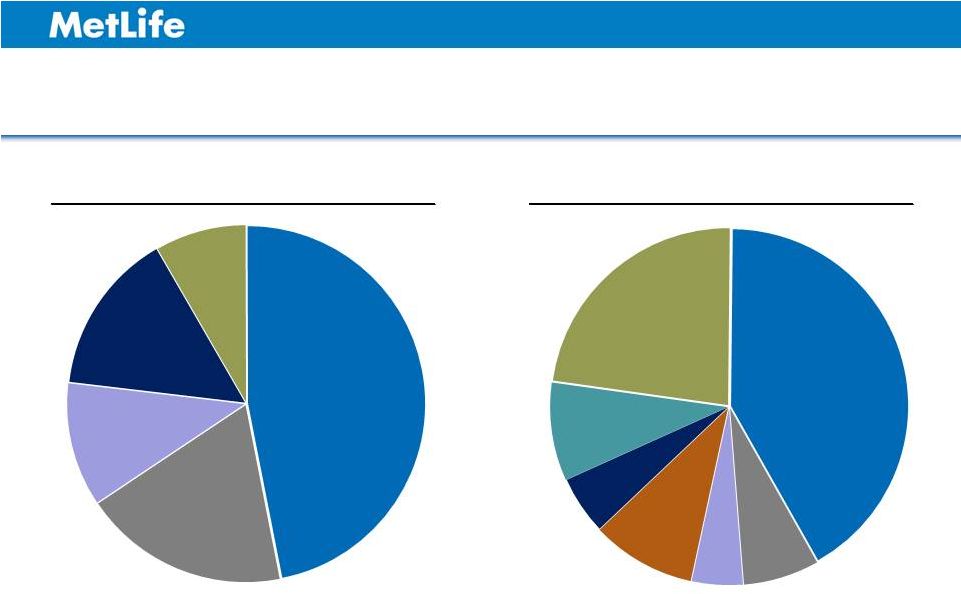
2014E: Latin America Financial Results 1 Excludes U.S. sponsored direct (as reported in Latin America) and corporate overhead allocations. See Appendix for non-GAAP financial information, definitions and/or reconciliations. Operating PFOs by Distribution Channel 1 Distribution Channel 1 43 ProVida 8% Retail 47% Group 19% Mexico Public 11% ProVida 23% Retail 42% Pension 9% Other 9% Direct 5% Group 7% Operating Earnings by Direct 15% Mexico Public 5% |
|
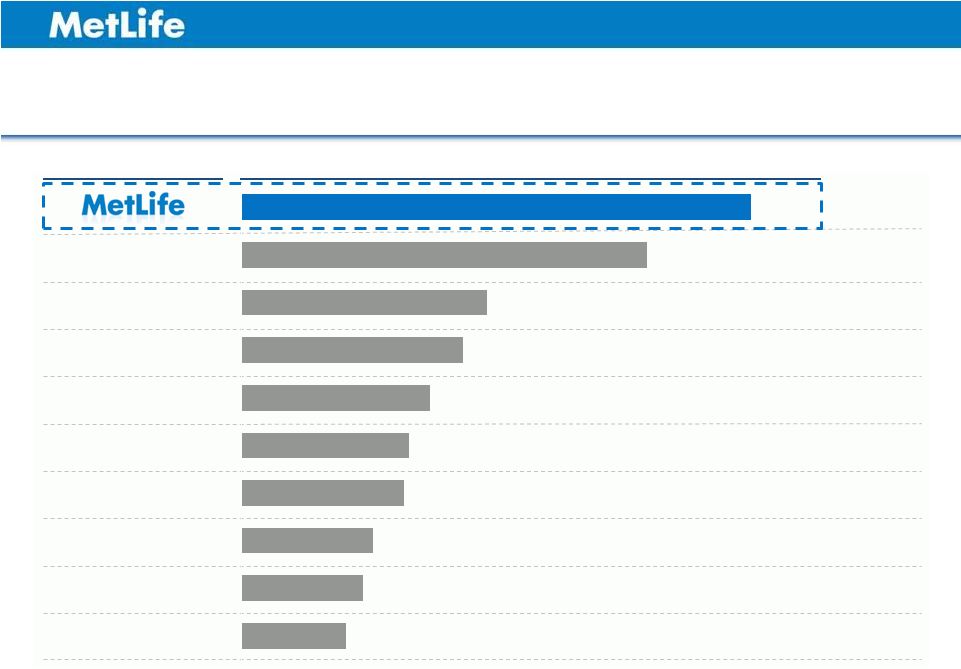
MetLife is the Largest Life Player in the Region Top Latin America Players 2013 Gross Written Premiums ($ in millions) Source: AXCO Global Statistics. A C B E D G F I H 44 $5,633 $4,476 $2,714 $2,454 $2,094 $1,862 $1,799 $1,466 $1,342 $1,151 |
|
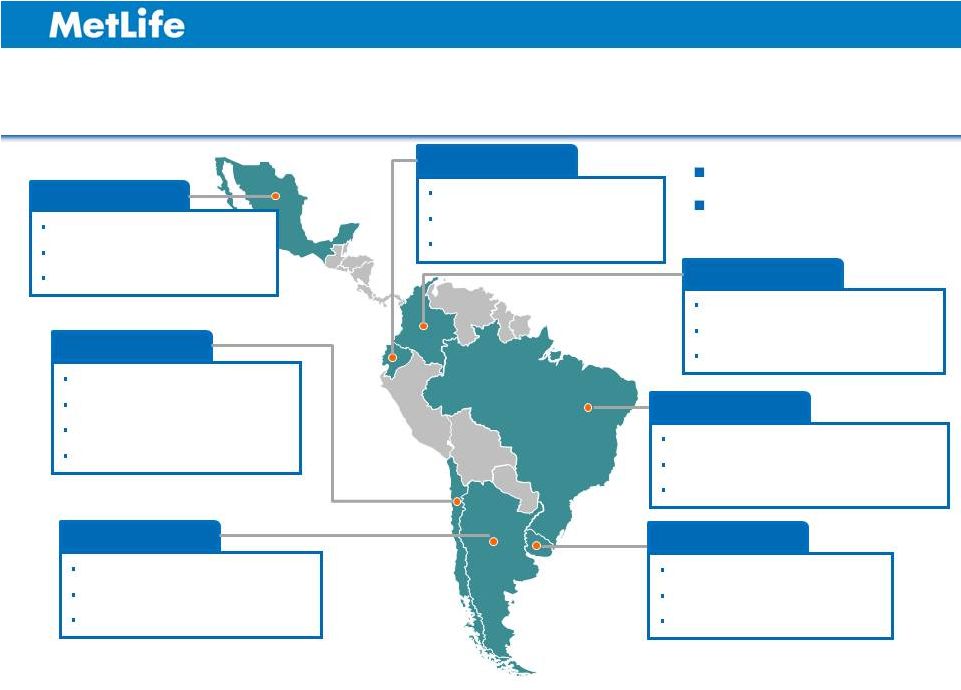
45 Significant Footprint in Scale and Market Share (MS) Mexico #1 Insurer 8 . MS 30.0% 7.7 Million Customers Population: 120 Million Colombia #10 Life Insurer . MS 2.5% 475 Thousand Customers Population: 47 Million Brazil #2 Non-Bank Life Insurer 3 . MS 3.5% 5.2 Million Customers Population: 198 Million Uruguay #1 Life Insurer 4 . MS 32.4% 785 Thousand Customers Population: 3.4 Million Argentina #1 Life Insurer 5 . MS 7.2% 4.3 Million Customers Population: 41 Million Chile #1 Life Insurer 6 . MS14.5% #1 AFP 7 . MS 27.9% 6.5 Million Customers Population: 17.4 Million Ecuador #1 AFP . MS 67.4% 266 Thousand Customers Population: 15 Million 25 million customers Over 9,500 employees 2 1 1 Ranked by AUM (Bolsa de Valores de Guayaquil – figures as of March 2014). 2 Colombia Life and A&H combined direct premium (Fasecolda, 4Q13). 3 Brazil Life and A&H combined direct premium w/o VGBL (SUSEP, Nov. 2013). 4 Uruguay Life and A&H combined direct premium, excludes D&S (Banco Central, Dec. 2013). 5 Argentina Life and A&H combined direct premium (Superintendencia de Seguros de la Nacion, 4Q13). 6 Chile Life, A&H, annuity and medical combined direct premium (Asoc. de Aseguradores de Chile 4Q13). 7 Chile ProVida AFP AUM (Superintendencia de Pensiones de Chile Dec. 2013) (Customers and employee figures as of Dec. 2013). 8 Mexico total life direct premium (EstadisticAMIS and FinanciAmis 4Q13). |
|
Strategy Tied to Favorable Regional Trends Grow employee benefits franchise by leveraging global employee benefits Large and mid-sized companies are underserved Build direct marketing as a regional engine of growth Strengthen and expand agency throughout the region Complete integration and grow ProVida Large emerging middle class Mass affluent class is growing 46 |
|
Agency as Growth Engine, Worksite Marketing as Pillar Overview – Difficult to replicate payroll deduction and agency network – Expansion of inforce via face amount increases/new riders – Changing employment demographics also contributing to growth See Appendix for non-GAAP financial information, definitions and/or reconciliations. 47 Largest distribution channel in Latin America in terms of operating earnings More than 8,000 career and independent agents Unique presence in worksite marketing in Mexico representing 30% of Latin America operating earnings: Expand other agencies in Chile, Mexico, and Colombia Business Outlook |
|
ProVida: A Key Growth Initiative Overview Business Outlook See Appendix for non-GAAP financial information, definitions and/or reconciliations. 48 Largest pension company in Chile and region based on AUM ($45 billion) Expected to contribute approximately 25% of Latin America operating earnings in 2014 Significant presence in the mass market Expand footprint by increasing the number of branches and agents Further penetrate high-income segments through a multi-product and voluntary savings approach |
|
ProVida: Net Salary Transfers Net Change in Monthly Salary Pool ($ in millions) 49 $0.5 $(4.8) $(4.4) $1.7 $14.2 $(5) $0 $5 $10 $15 1Q13 2Q13 3Q13 4Q13 1Q14 BBVA Controlled MetLife Controlled Acquisition Date Oct. 1, 2013 |
|
ProVida: Segmented Value Proposition Market Segment Active Contributors 1 Fee Income 1 Market Drivers Prime Market 1.4% 25K 5% Target: Affluent to upper income Multi-product (savings, tax incentive and mandatory) Greatest competition and acquisition cost Services tailored for affluent consumer Middle Market 12.0% 216K 29% Target: Middle income Broad distribution to reach middle market Sales force focused on mandatory and savings products Mass Market 86.6% 1.55M 66% Target: Low to middle income Extensive branch network Focus on mandatory product Quality service: simple, easy and efficient Lowest acquisition cost, highest profitability Percent and number of ProVida clients and fee income at September 2013. 50 1 |
|
Direct Marketing as a Regional Growth Engine Overview Key distribution channel to address the large emerging middle class opportunity 100+ sponsors throughout the region 10 million customers Business Outlook Broad portfolio of Accident & Health, Life and Property & Casualty products Expansion of sponsors and sponsor relationships From product provider to marketing and technology expert 51 |
|
Growing Employee Benefits Across the Region Overview Market leadership in key countries: Mexico, Brazil and Chile 13,000 group customers across the region Business Outlook Leverage U.S. relationships with Fortune 500 companies, multinational solutions and global network Expand voluntary/worksite marketing solutions Opportunities to serve mid-sized companies/brokers 52 |
|
Strong Capital Distributions Despite High Growth 53 Net Capital Distributions 1 as a Percentage of Operating Earnings Highlights Modest capital needs given product mix ProVida expected to maintain similar payout ratio 1 Subsidiary dividends and other capital distributions less capital contributions. See Appendix for non-GAAP financial information, definitions and/or reconciliations. |
|
Latin America Key Takeaways Significant presence in key Latin America markets Strong track record of double digit growth – Operating earnings CAGR of 20% for the last 10 years – Organic operating earnings 10-year CAGR of 12.5% in Mexico High margin capital efficient products Well diversified by product and distribution channel 54 See Appendix for non-GAAP financial information, definitions and/or reconciliations. |
|
Chris Townsend President Asia June 10, 2014 INVESTOR DAY 2014 * * * * |
|
Asia Overview Secure maximum operating earnings from Japan and Korea Build a value growth platform in China and India beyond 2016 Ensure solid operating earnings contribution from designated markets Enter high growth, high margin Southeast Asia markets Opportunities: Expansion and productivity enhancements in distribution Product portfolio optimization Employee benefits and investing in new capabilities Challenges: Regulatory restrictions Managing distribution through business model changes Brand awareness in Asia Key Strategies Long-Term Outlook Opportunities and Challenges Market growth 1 - Japan 2-3% - Korea 6-7% - Rest of Asia 10-12% MetLife growth in operating PFOs - Japan 5-7% - Korea 8-10% - Rest of Asia 12-15% Operating expenses grow at a slower rate than operating PFOs 1 Swiss Re, The Japanese Insurance Market (January 2013); Swiss Re, The South Korean Insurance Market (January 2013). See Appendix for non-GAAP financial information, definitions and/or reconciliations. 57 |
|
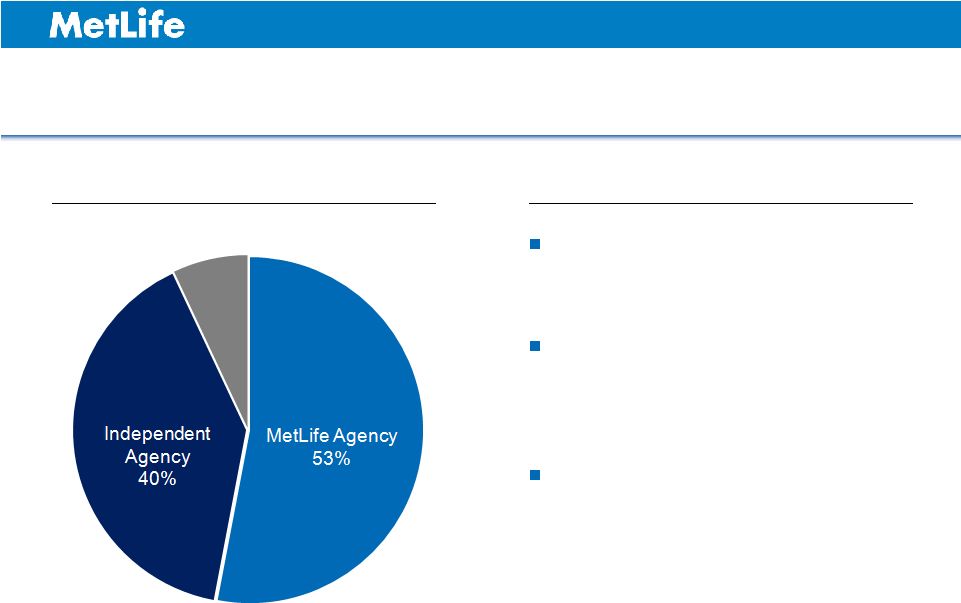
2013: Asia Sales by Product and Distribution Channel Group 8% Retirement 18% Accident & Health 25% Life: Protection 20% Life: Savings 29% Group 1 8% Direct 12% Bancassurance 16% MetLife Agency 27% Independent Agency 37% Total Sales: $4.0B 1 Group includes sales achieved by direct, agency and employee benefit brokers. See Appendix for non-GAAP financial information, definitions and/or reconciliations. 58 Sales by Product Sales by Distribution Channel |
|
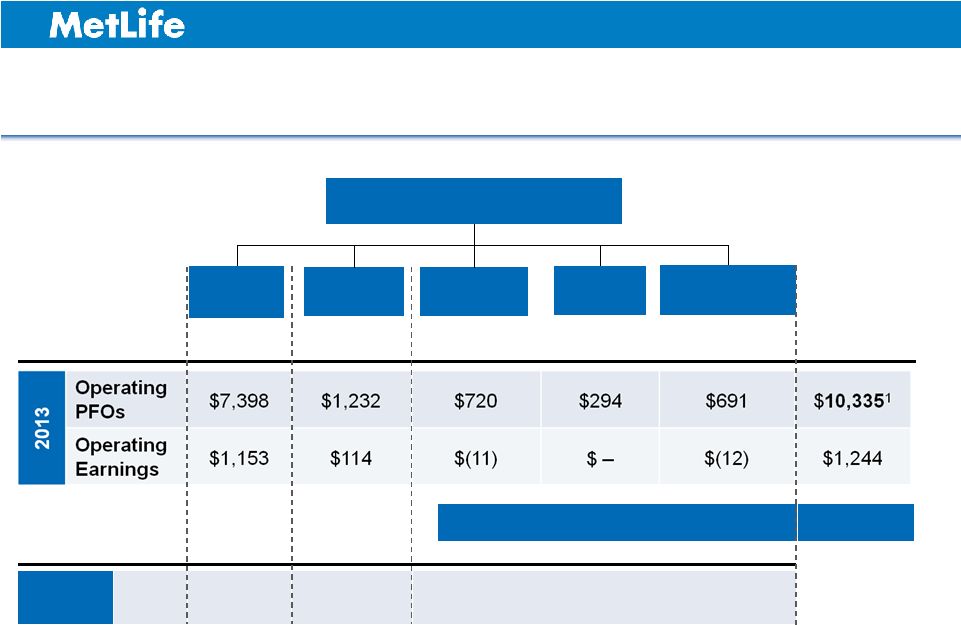
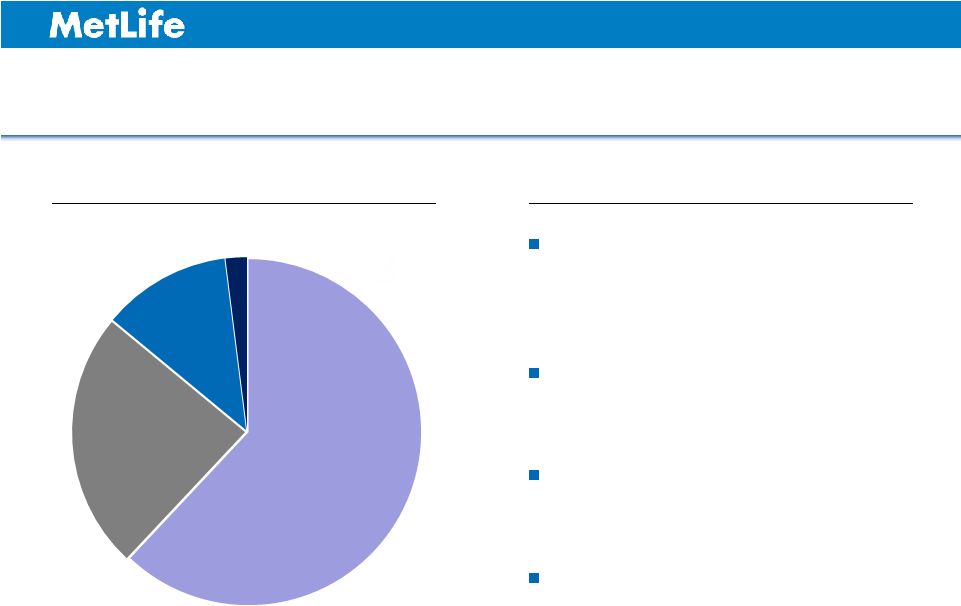
2013: Asia Financial Results Total Operating PFOs: $10.3B Total Baseline Operating Earnings: $1.2B 1 China is a non-consolidating joint venture. Therefore, Asia’s total operating PFOs of $9.6 billion, as reported, does not include China. 2 Adjusted for the following items: (i) decrease of $13 million (DAC and other unlockings); (ii) decrease of $57 million (reserve adjustment in Australia); (iii) increase of $68 million (Japan excess fixed annuity surrenders); and (iv) increase of $52 million (Japan investment income). See Appendix for non-GAAP financial information, definitions and/or reconciliations. 59 Operating PFOs by Product 1 Life 39% Group 5% Baseline Operating Earnings by Product 2 Group 3% Retirement 24% A&H 54% A&H 48% Retirement 8% Life 19% |
|
(% of total Asia) Operating Earnings 2016 Target 75-80% 10-15% 5-10% Asia Financial Contribution Overview Total ($ in millions) 1 China is a non-consolidating joint venture. Therefore, Asia’s total operating PFOs of $9,615 million, as reported, does not include China. 2 Designated Markets for 2013 include: Australia, Bangladesh, Hong Kong, Nepal, Pakistan and regional office and for 2016 also includes Malaysia, Vietnam and Myanmar. 3 Adjusted for the following items: (i) decrease of $13 million (DAC and other unlockings); (ii) decrease of $57 million (reserve adjustment in Australia); (iii) increase of $68 million (Japan excess fixed annuity surrenders); and (iv) increase of $52 million (Japan investment income). See Appendix for non-GAAP financial information, definitions and/or reconciliations. Baseline Operating Earnings $1,194 3 60 Asia Designated Markets 2 India China 1 Korea Japan |
|
Japan: Market Opportunity Higher reliance on private sector to pay for retirement and health care Affluent senior population increasing Shifting purchasing patterns among younger segments Potential growth opportunities from Abenomics 61 |
|
Multiple, scaled distribution channels A leader in productivity Consultative sales drive cross-selling opportunities Strong access to affluent and small and medium business markets Direct distribution channel leverage Japan 2013: Multiple Scaled Distribution Channels Providing Consumers Choice Total Sales: $2.5B 62 Highlights Sales by Distribution Channel Independent Agency 49% MetLife Agency 23% Bancassurance 17% Direct 11% See Appendix for non-GAAP financial information, definitions and/or reconciliations. |
|
1 Insurance Research Institute, Insurance Book 2012. See Appendix for non-GAAP financial information, definitions and/or reconciliations. Japan 2013: Diversified Product Mix with High Protection Share A leader in stand-alone A&H A leader in foreign currency life and annuity #1 in group by policy count 1 Balanced mix and risk diversification Continuing to innovate Total Operating Earnings: $1.2B 63 Highlights Operating PFOs by Product Operating Earnings by Product Retirement 5% Group 2% Group 1% Total Operating PFOs: $7.4B Retirement 31% A&H 54% Life 40% A&H 53% Life 14% |
|
Japan: Accelerating Value Creation Persistency ~90% 1 and improving Reducing expense ratios Technology investments driving further efficiency gains Investment in Brand 64 1 As of 1Q14. |
|
Korea 2013: Increased Distribution Diversification Continue to enhance market leading MetLife agency Diversifying distribution by growing independent agency with a powerful value proposition Portfolio enhancement with A&H ~20% of total sales Total Sales: $675M 65 Highlights Sales by Distribution Channel Bancassurance 7% See Appendix for non-GAAP financial information, definitions and/or reconciliations. |
|
China 2013: Leadership Position in Direct-Telemarketing Distribution across 24 cities in 10 provinces providing access to more than half of China’s total GDP 1 Largest foreign joint venture insurer in Direct with high productivity Direct-telemarketing channel is 75% protection sales Introducing digital capabilities to enhance customer reach Total Sales: $300M 66 Highlights Sales by Distribution Channel MetLife Agency 12% Independent Agency 2% 1 National Bureau of Statistics of China, China Statistical Yearbook 2013. See Appendix for non-GAAP financial information, definitions and/or reconciliations. Bancassurance 24% Direct 62% |
|
Southeast Asia: High Growth and High Margin Markets Vietnam BIDV, #2 bank in Vietnam 2 Greenfield joint venture – 60% MetLife, 40% BIDV Exclusive bancassurance distribution agreement Malaysia AMMB, # 5 bank in Malaysia 1 50% acquisition of existing multi-channel carrier 20-year exclusive bancassurance agreement Newly launched Takaful company Myanmar Representative office approved in October 2013 Market is expected to open in 2016 67 1 Website of AmBank Group (AMMB). 2 “Vietnam's second biggest lender to launch $2.5 Bln listing tomorrow,” TuoiTreNews (January 23, 2014); Bank for Investment and Development of Vietnam (BIDV). |
|
Asia: Expect Improving Capital Distributions 68 Net Capital Distributions 1 as a Percentage of Operating Earnings Highlights Net capital distributions to holding companies of $1.6 billion over the past three years Internally funding $250-$300 million of acquisitions in 2014 Over the long term, Japan dividends expected to be approximately 50% of its operating earnings 1 Subsidiary dividends and other capital distributions less capital contributions. See Appendix for non-GAAP financial information, definitions and/or reconciliations. |
|
Asia Key Takeaways Strong sustainable earnings base and investing for the future Successfully exporting expertise and leveraging scale Improving cash generation to the MetLife enterprise Well positioned to capture macro growth opportunities 69 |
|
Michel Khalaf President Europe, Middle East and Africa (EMEA) June 10, 2014 INVESTOR DAY 2014 * * * * |
|
EMEA Overview Maintain diversification and focus on protection products Drive growth in emerging markets Leverage global relationships in employee benefits Continue investing in Customer Centricity and a global brand Drive capital and expense efficiency Opportunities: Growing middle class Low levels of insurance penetration Diverse footprint and sources of operating earnings Challenges: Regulatory changes Political instability Building the Brand Key Strategies Long-Term Outlook Opportunities and Challenges Market growth 1 Munich Re, 2013. See Appendix for non-GAAP financial information, definitions and/or reconciliations. 72 – Developed markets 2-4% – Emerging markets 7-9% Operating PFOs 10-12% – Developed markets 4-6% – Emerging markets 12-15% Operating expense growth of mid to high single digits as more countries reach scale 1 |
|
2013: Diversified by Product and Distribution Channel Sales by Distribution Channel 1 Independent Agency 22% Direct 10% Bancassurance 36% Operating PFOs by Product 1 A&H 18% Retirement 10% 1 Excludes certain run-off and other operations, including Belgium (representing $62 million of operating PFOs). See Appendix for non-GAAP financial information, definitions and/or reconciliations. 73 Total Operating PFOs: $2.7B Total Sales: $1.0B Credit 26% Life 30% Group 15% MetLife Agency 17% Employee Benefits 16% |
|
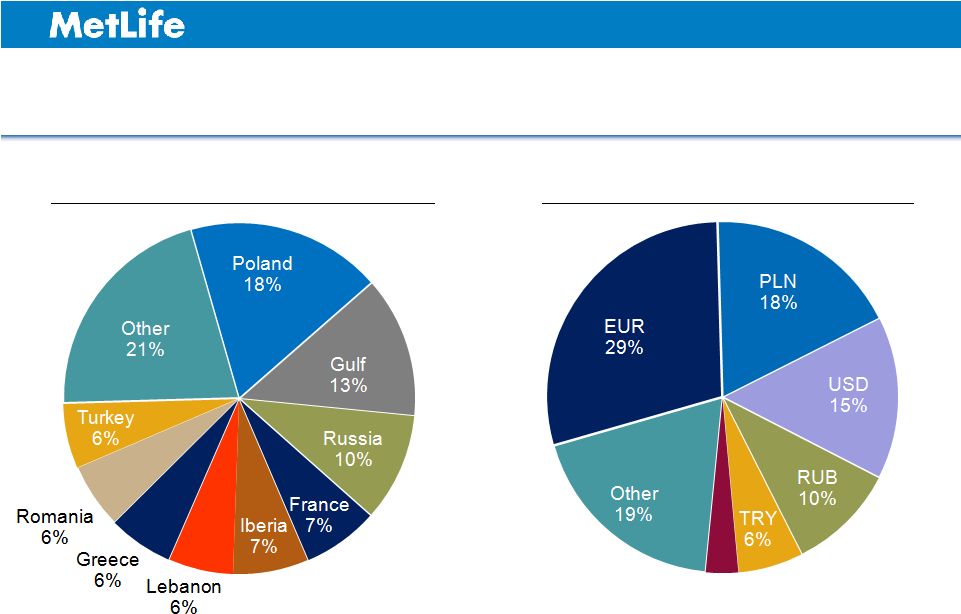
2014E: Diversified by Market and Currency Operating Earnings by Market Operating Earnings by Currency See Appendix for non-GAAP financial information, definitions and/or reconciliations. 74 GBP 3% |
|
Leading Position in Emerging Markets; Niche Approach to Developed Markets Emerging Markets Developed Markets Market Share 8% <1% 2% 5% 2% 6% 7% 6% 5% 7% Source: Market shares: AXCO Global Statistics by Country (2012) (except Turkey - Insurance Association of Turkey (2012), UAE - Swiss Re (2012)). A B C D 75 |
|
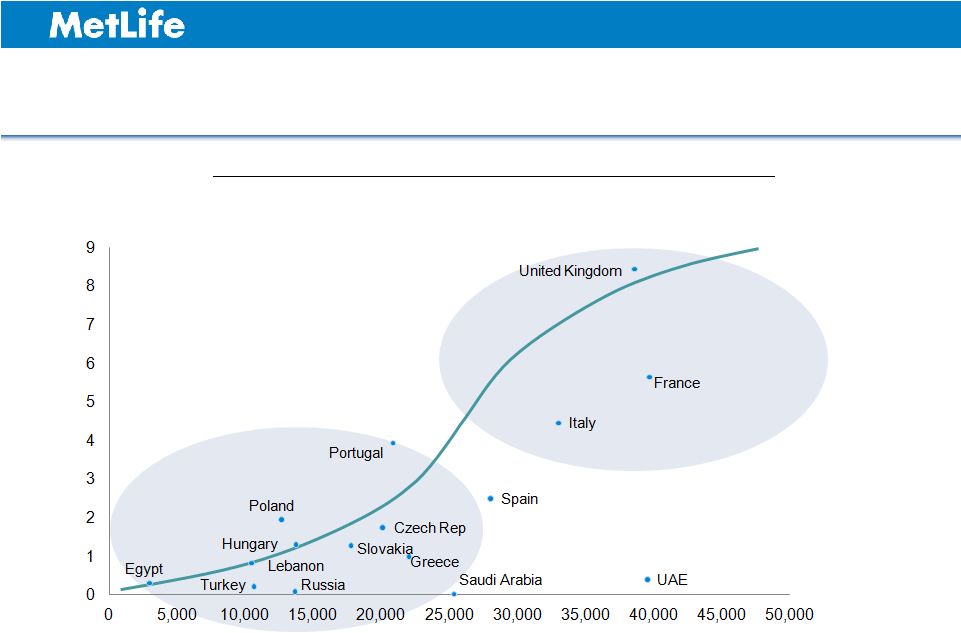
Emerging Markets Expected to Drive Future Growth Source: Swiss Re (Sigma 3/2013: 2012 Life insurance penetration and GDP per capita; UAE GDP per capita adjusted with World Bank population data, 5/2014). Life GWP/GDP (%) GDP per capita (in USD) Life Insurance Penetration vs. GDP Per Capita 76 |
|
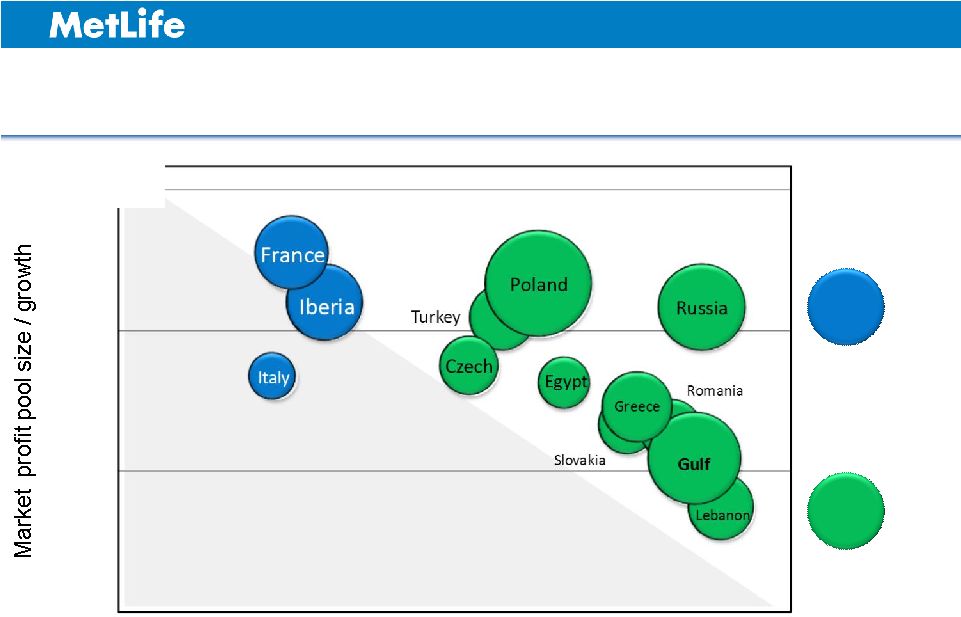
Well Positioned with Significant Operating Earnings from Emerging Markets Share of Market Low Medium High Low Medium High 2013 Developed Markets 2013 Operating Earnings Emerging Markets 2013 Operating Earnings See Appendix for non-GAAP financial information, definitions and/or reconciliations. 77 = $30M = $30M |
|
Country Market GWP 1 2010 - 2014E CAGR 2 MetLife GWP 1 2010 - 2014E CAGR Market Share 3 Rank 3 Gulf 4 12% 15% 24% Top 5 5 Poland 8% 10% 6% #5 Russia 39% 25% 9% #5 Turkey 6 12% 25% 4% #8 Strong Track Record of Growth in Key Operations 78 1 Statutory gross written premiums (GWP). 2 Swiss Re Sigma database (2013). (Actuals 2010-12, projections 2013-14). 3 Gulf (2012), AXCO reports with MetLife internal analysis; Poland (2013), Polish Financial Supervision Authority; Russia (2013), Federal Service on Financial Markets; Turkey (2013), Insurance Association of Turkey. 4 Bahrain, Kuwait, Oman, Qatar and UAE. 5 MetLife internal analysis; formal company rankings for life market not available in all markets. 6 Turkey 2011 (year of acquisition) – 2014E. |
|
Over 60 years in Lebanon #1 life insurer in the market #4 insurer in the market Market leader in employee benefits Unique Footprint, Difficult to Replicate 1 foreign insurer to enter market; over 2.5 million customers #2 in profitability 3 1 foreign insurer to enter market; over 5 million customers #3 in profitability 1 Over 50 years in the UAE 900,000 customers across the Gulf Market leader in A&H 2 Over 1.7 million customers 79 Russia Gulf Lebanon Poland Turkey Greece 5 1 Poland Insurance Association. 2 Insurance Association of Turkey, April 2014. 3 Expert RA Rating Agency. 4 AXCO report, 2014. 5 Insurance Association Booklet, 2013. See Appendix for non-GAAP financial information, definitions and/or reconciliations. 4 st st |
|
Key Drivers of Growth in Emerging Markets Expand Bancassurance Develop Direct to Consumer Focus on Protection Sales growth of 43% Knowledge transfer from developed to emerging markets 75% of sales in protection products Sales growth of 32% in A&H, 12% in employee benefits Sales growth of 49% Flexible partnership models Building the Brand and Driving Customer Centricity Rebranding to MetLife underway Region-wide rollout of Customer Centricity initiatives 80 1 Sales growth CAGR 2011-2013. 2 Includes low-capital intensive savings products with a protection component. Sales referenced above exclude certain run-off and other operations, including Belgium, and a large group customer in Turkey. See Appendix for non-GAAP financial information, definitions and/or reconciliations. 1 1 2 1 |
|
Operating Leverage and Flexible Expense Model Mid to high single-digit operating expense growth leading to margin expansion Ability to manage operating expenses for fluctuations in sales Drive efficiency gains through continued subsidiary restructuring 81 See Appendix for non-GAAP financial information, definitions and/or reconciliations. |
|
EMEA: Strong Capital Distributions Despite High Growth Highlights Modest capital needs given product mix Focus on capital efficiency creates higher payout ratio in near term 50+% payout ratio longer term Net Capital Distributions 1 as a Percentage of Operating Earnings 82 1 Subsidiary dividends and other capital distributions less capital contributions. See Appendix for non-GAAP financial information, definitions and/or reconciliations. |
|
EMEA Key Takeaways Solid progress toward 2016 objectives Near-term headwinds, long-term outlook intact Diversification a competitive advantage Well positioned in growth markets Modest retention of capital needed to fund growth 83 |
|
Maria R. Morris Executive Vice President Global Employee Benefits June 10, 2014 INVESTOR DAY 2014 * * * |
|
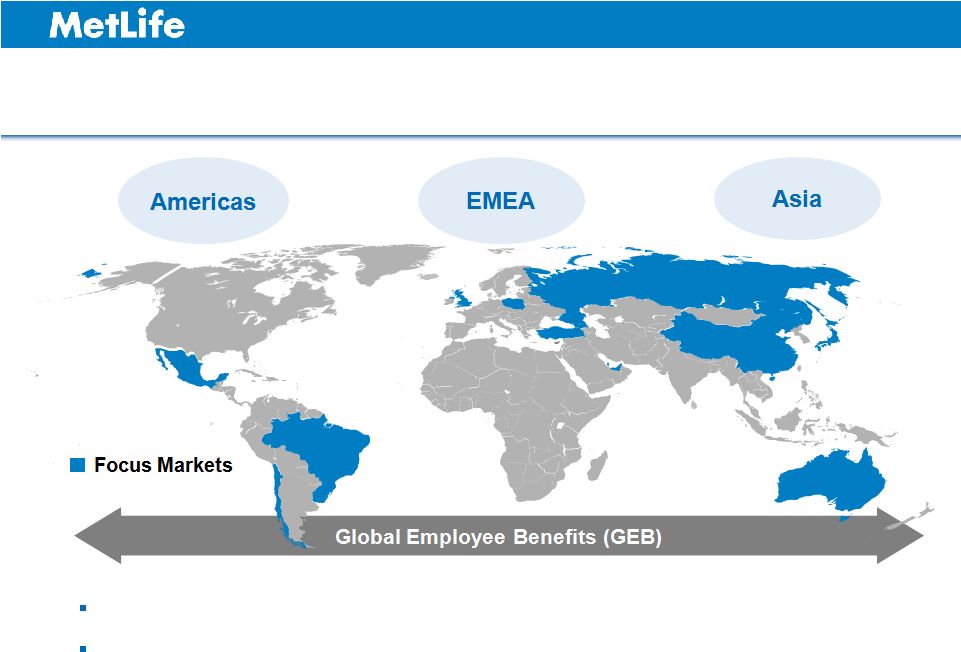
We are Organized to Capture the GEB Opportunity Share best practices and capabilities to accelerate local employee benefits businesses Leverage global relationships and innovate product offerings to grow outside the U.S. 86 |
|
Global sales CAGR 39% Delivering Profitable Top-Line Growth New business ROI 20+% 2 Pre-tax margin 12+% ` Deliver strong returns through solid margins and low required capital Life & Health sales CAGR 24% Grow employee benefits through multinational and expatriate solutions Accelerate local employee benefits businesses outside the U.S. 87 1 CAGR 2011-2013 shown on a constant currency basis (excluding dispositions) using 2014P foreign exchange rates. 2 Return on Investment (ROI) based on 2013 total GEB new business. 3 Pre-tax margin shown on a constant currency basis adjusted for 2013 normalizing items in Poland (2Q) and Australia (3Q). See Appendix for non-GAAP financial information, definitions and/or reconciliations. 1 1 3 |
|
2013: GEB Sales and Operating PFOs Sales by Product Total Sales: $1.0B 88 PFO Operating PFOs by Region 2 Total Operating PFOs: $3.3B 1 Includes expatriate employee benefits. 2 Financial results are estimated from operating segments, as well as Corporate & Other, as reported. See Appendix for non-GAAP financial information, definitions and/or reconciliations. Credit 28% Local Employee Benefits 54% Multinational Employee Benefits 1 18% Latin America 46% EMEA 39% Asia 13% Expatriate 2% |
|
GEB Opportunities 1 Based on expected 2013-2016 CAGR (excluding dispositions) on a constant currency basis. See Appendix for non-GAAP financial information, definitions and/or reconciliations. Double-digit sales, operating PFOs and operating earnings growth Business Outlook 1 (2013-2016) 89 Grow through niches in developed markets Grow and invest in emerging markets Diversify and innovate credit products |
|
Accelerate Growth through Life & Health Life & Health (2013–2016 CAGR) 1 – Sales 12–15% – Operating PFOs 17–20% 1 Based on expected 2013-2016 CAGR (excluding dispositions) on a constant currency basis. See Appendix for non-GAAP financial information, definitions and/or reconciliations. Business Outlook Drivers Expanded health and wellness offerings Strategic use of MetLife’s balance sheet Efficiencies through scale and technology 90 Double-digit growth in developed and emerging markets |
|
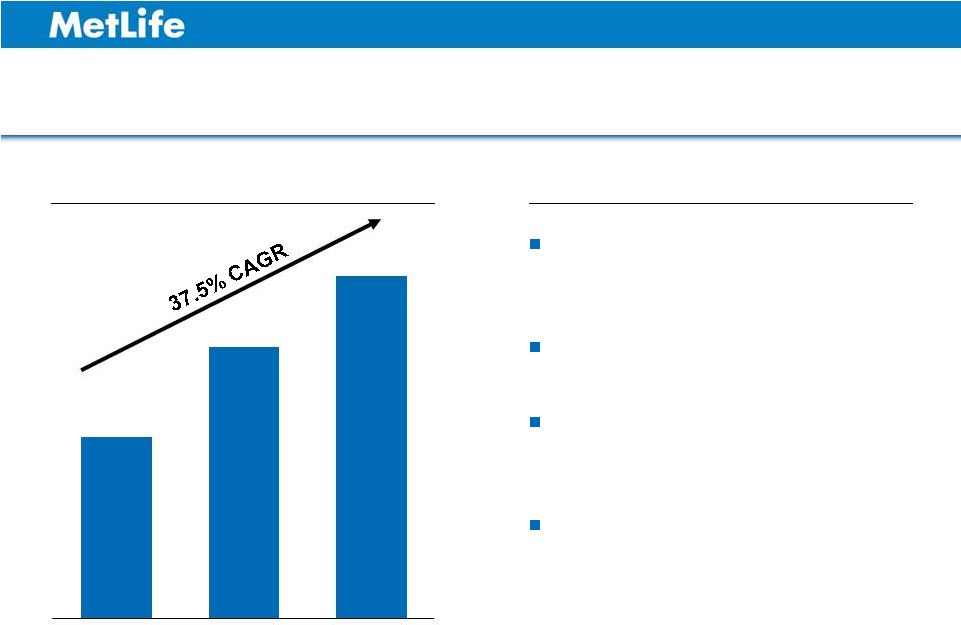
Growth in Developed Markets Drivers Launch new products and distribution channels Leverage global capabilities for local competitive advantage Re-engineer operating processes for productivity and efficiency 91 See Appendix for non-GAAP financial information, definitions and/or reconciliations. Developed Markets Sales (Life & Health, $ in millions) 2013 $298 2012 $137 2011 $14 Focus Markets Other Markets CAGR 41.4% 91.0% $88 |
|
Growth in Emerging Markets Drivers Diversifying distribution Investing in operations and technologies Innovating new products 92 1 Focus market data excludes Mexico Government sales. See Appendix for non-GAAP financial information, definitions and/or reconciliations. Emerging Markets Sales (Life & Health and Credit, $ in millions) 2013 $536 2012 $420 2011 $365 Focus Markets Other Markets CAGR 4.2% 26.5% 1 |
|
Leverage U.S. corporate relationships Expand global broker partnerships Deploy the strength of our multinational solutions network Broaden and Deepen Global Relationships Multinational and Expatriate Sales ($ in millions) Drivers See Appendix for non-GAAP financial information, definitions and/or reconciliations. 93 |
|
Global Relationships Driving Local Growth 94 Client Profile: Fortune 100 Company 100,000+ Employees 60+ Countries U.S. Client Since 1931 2010 $15M GWP 33K Employees 3 Countries 2011 $17M GWP 39K Employees 7 Countries 2012 $22M GWP 51K Employees 21 Countries 2013 $29M GWP 73K Employees 24 Countries |
|
GEB Key Takeaways Accelerating Life & Health growth across all regions Driving robust growth through multinational and expatriate solutions Delivering double-digit operating earnings growth Improving MetLife’s risk profile See Appendix for non-GAAP financial information, definitions and/or reconciliations. 95 |
|
Steven A. Kandarian Chairman, President & Chief Executive Officer June 10, 2014 INVESTOR DAY 2014 * * * * |
|
Strategy is working and even more relevant today Businesses with attractive growth and return characteristics also have favorable risk profiles Committed to delivering shareholder value Key Takeaways for the Day 98 |
|
Appendix June 10, 2014 INVESTOR DAY 2014 * * * * |
|
Safe Harbor Statement This presentation may contain or incorporate by reference information that includes or is based upon forward-looking statements within the meaning of the Private Securities Litigation Reform Act of 1995. Forward-looking statements give expectations or forecasts of future events. These statements can be identified by the fact that they do not relate strictly to historical or current facts. They use words such as “anticipate,” “estimate,” “expect,” “project,” “intend,” “plan,” “believe” and other words and terms of similar meaning, or are tied to future periods, in connection with a discussion of future operating or financial performance. In particular, these include statements relating to future actions, prospective services or products, future performance or results of current and anticipated services or products, sales efforts, expenses, the outcome of contingencies such as legal proceedings, trends in operations and financial results. Any or all forward-looking statements may turn out to be wrong. They can be affected by inaccurate assumptions or by known or unknown risks and uncertainties. Many such factors will be important in determining the actual future results of MetLife, Inc., its subsidiaries and affiliates. These statements are based on current expectations and the current economic environment. They involve a number of risks and uncertainties that are difficult to predict. These statements are not guarantees of future performance. Actual results could differ materially from those expressed or implied in the forward-looking statements. Risks, uncertainties, and other factors that might cause such differences include the risks, uncertainties and other factors identified in MetLife, Inc.’s filings with the U.S. Securities and Exchange Commission (the “SEC”). These factors include: (1) difficult conditions in the global capital markets; (2) increased volatility and disruption of the capital and credit markets, which may affect our ability to meet liquidity needs and access capital, including through our credit facilities, generate fee income and market-related revenue and finance statutory reserve requirements and may require us to pledge collateral or make payments related to declines in value of specified assets, including assets supporting risks ceded to certain of our captive reinsurers or hedging arrangements associated with those risks; (3) exposure to financial and capital market risks, including as a result of the disruption in Europe; (4) impact of comprehensive financial services regulation reform on us, as a potential non-bank systemically important financial institution, or otherwise; (5) numerous rulemaking initiatives required or permitted by the Dodd-Frank Wall Street Reform and Consumer Protection Act which may impact how we conduct our business, including those compelling the liquidation of certain financial institutions; (6) regulatory, legislative or tax changes relating to our insurance, international, or other operations that may affect the cost of, or demand for, our products or services, or increase the cost or administrative burdens of providing benefits to employees; (7) adverse results or other consequences from litigation, arbitration or regulatory investigations; (8) potential liquidity and other risks resulting from our participation in a securities lending program and other transactions; (9) investment losses and defaults, and changes to investment valuations; (10) changes in assumptions related to investment valuations, deferred policy acquisition costs, deferred sales inducements, value of business acquired or goodwill; (11) impairments of goodwill and realized losses or market value impairments to illiquid assets; (12) defaults on our mortgage loans; (13) the defaults or deteriorating credit of other financial institutions that could adversely affect us; (14) economic, political, legal, currency and other risks relating to our international operations, including with respect to fluctuations of exchange rates; (15) downgrades in our claims paying ability, financial strength or credit ratings; (16) a deterioration in the experience of the “closed block” established in connection with the reorganization of Metropolitan Life Insurance Company; (17) availability and effectiveness of reinsurance or indemnification arrangements, as well as any default or failure of counterparties to perform; (18) differences between actual claims experience and underwriting and reserving assumptions; (19) ineffectiveness of risk management 101 |
|
Safe Harbor Statement (Continued) policies and procedures; (20) catastrophe losses; (21) increasing cost and limited market capacity for statutory life insurance reserve financings; (22) heightened competition, including with respect to pricing, entry of new competitors, consolidation of distributors, the development of new products by new and existing competitors, and for personnel; (23) exposure to losses related to variable annuity guarantee benefits, including from significant and sustained downturns or extreme volatility in equity markets, reduced interest rates, unanticipated policyholder behavior, mortality or longevity, and the adjustment for nonperformance risk; (24) our ability to address difficulties, unforeseen liabilities, asset impairments, or rating agency actions arising from business acquisitions, including our acquisition of American Life Insurance Company and Delaware American Life Insurance Company, and integrating and managing the growth of such acquired businesses, or arising from dispositions of businesses or legal entity reorganizations; (25) the dilutive impact on our stockholders resulting from the settlement of our outstanding common equity units; (26) regulatory and other restrictions affecting MetLife, Inc.’s ability to pay dividends and repurchase common stock; (27) MetLife, Inc.’s primary reliance, as a holding company, on dividends from its subsidiaries to meet debt payment obligations and the applicable regulatory restrictions on the ability of the subsidiaries to pay such dividends; (28) the possibility that MetLife, Inc.’s Board of Directors may influence the outcome of stockholder votes through the voting provisions of the MetLife Policyholder Trust; (29) changes in accounting standards, practices and/or policies; (30) increased expenses relating to pension and postretirement benefit plans, as well as health care and other employee benefits; (31) inability to protect our intellectual property rights or claims of infringement of the intellectual property rights of others; (32) inability to attract and retain sales representatives; (33) provisions of laws and our incorporation documents may delay, deter or prevent takeovers and corporate combinations involving MetLife; (34) the effects of business disruption or economic contraction due to disasters such as terrorist attacks, cyberattacks, other hostilities, or natural catastrophes, including any related impact on the value of our investment portfolio, our disaster recovery systems, cyber- or other information security systems and management continuity planning; (35) the effectiveness of our programs and practices in avoiding giving our associates incentives to take excessive risks; and (36) other risks and uncertainties described from time to time in MetLife, Inc.’s filings with the SEC. MetLife, Inc. does not undertake any obligation to publicly correct or update any forward-looking statement if MetLife, Inc. later becomes aware that such statement is not likely to be achieved. Please consult any further disclosures MetLife, Inc. makes on related subjects in reports to the SEC. 102 |
|
Explanatory Note on Non-GAAP Financial Information Any references in this presentation (except in this Explanatory Note on Non-GAAP Financial Information slide and this Appendix) to net income (loss), net income (loss) per share, operating earnings, operating earnings per share, book value per share, book value per share, excluding accumulated other comprehensive income (loss) (“AOCI”) premiums, fees and other revenues and operating return on equity, should be read as net income (loss) available to MetLife, Inc.'s common shareholders, net income (loss) available to MetLife, Inc.'s common shareholders per diluted common share, operating earnings available to common shareholders, operating earnings available to common shareholders per diluted common share, book value per common share, book value per common share, excluding AOCI, premiums, fees and other revenues (operating) and operating return on MetLife, Inc.’s common equity, excluding AOCI, respectively. Operating earnings is the measure of segment profit or loss that MetLife uses to evaluate segment performance and allocate resources. Consistent with accounting principles generally accepted in the United States of America ("GAAP") accounting guidance for segment reporting, operating earnings is MetLife's measure of segment performance. Operating earnings is also a measure by which MetLife senior management's and many other employees' performance is evaluated for the purposes of determining their compensation under applicable compensation plans. Operating earnings is defined as operating revenues less operating expenses, both net of income tax. Operating earnings available to common shareholders is defined as operating earnings less preferred stock dividends. Operating revenues and operating expenses exclude results of discontinued operations and other businesses that have been or will be sold or exited by MetLife, Inc. (“Divested Businesses”). Operating revenues also excludes net investment gains (losses) (“NIGL”) and net derivative gains (losses) (“NDGL”). Operating expenses also excludes goodwill impairments. The following additional adjustments are made to GAAP revenues, in the line items indicated, in calculating operating revenues: • Universal life and investment-type product policy fees excludes the amortization of unearned revenue related to NIGL and NDGL and certain variable annuity guaranteed minimum income benefits ("GMIB") fees ("GMIB Fees"); • Net investment income: (i) includes amounts for scheduled periodic settlement payments and amortization of premium on derivatives that are hedges of investments or that are used to replicate certain investments, but do not qualify for hedge accounting treatment, (ii) includes income from discontinued real estate operations, (iii) excludes post-tax operating earnings adjustments relating to insurance joint ventures accounted for under the equity method, (iv) excludes certain amounts related to contractholder-directed unit-linked investments, and (v) excludes certain amounts related to securitization entities that are variable interest entities ("VIEs") consolidated under GAAP; and • Other revenues are adjusted for settlements of foreign currency earnings hedges. 103 |
|
The following additional adjustments are made to GAAP expenses, in the line items indicated, in calculating operating expenses: • Policyholder benefits and claims and policyholder dividends excludes: (i) changes in the policyholder dividend obligation related to NIGL and NDGL, (ii) inflation-indexed benefit adjustments associated with contracts backed by inflation-indexed investments and amounts associated with periodic crediting rate adjustments based on the total return of a contractually referenced pool of assets and other pass through adjustments, (iii) benefits and hedging costs related to GMIBs ("GMIB Costs"), and (iv) market value adjustments associated with surrenders or terminations of contracts ("Market Value Adjustments"); • Interest credited to policyholder account balances includes adjustments for scheduled periodic settlement payments and amortization of premium on derivatives that are hedges of policyholder account balances but do not qualify for hedge accounting treatment and excludes amounts related to net investment income earned on contractholder-directed unit-linked investments; • Amortization of deferred policy acquisition costs (“DAC”) and value of business acquired ("VOBA") excludes amounts related to: (i) NIGL and NDGL, (ii) GMIB Fees and GMIB Costs, and (iii) Market Value Adjustments; • Amortization of negative VOBA excludes amounts related to Market Value Adjustments; • Interest expense on debt excludes certain amounts related to securitization entities that are VIEs consolidated under GAAP; and • Other expenses excludes costs related to: (i) noncontrolling interests, (ii) implementation of new insurance regulatory requirements, and (iii) acquisition and integration costs. Operating earnings also excludes the recognition of certain contingent assets and liabilities that could not be recognized at acquisition or adjusted for during the measurement period under GAAP business combination accounting guidance. In addition, operating return on MetLife, Inc.'s common equity is defined as operating earnings available to common shareholders divided by average GAAP common equity. Operating expense ratio is calculated by dividing operating expenses (other expenses net of capitalization of DAC) by premiums, fees and other revenues (operating). Explanatory Note on Non-GAAP Financial Information (Continued) 104 |
|
Explanatory Note on Non-GAAP Financial Information (Continued) 105 MetLife believes the presentation of operating earnings and operating earnings available to common shareholders as MetLife measures it for management purposes enhances the understanding of the company's performance by highlighting the results of operations and the underlying profitability drivers of the business. Operating revenues, operating expenses, operating earnings, operating earnings available to common shareholders, operating earnings available to common shareholders per diluted common share, book value per common share, excluding AOCI, book value per diluted common share, excluding AOCI, operating return on MetLife, Inc.’s common equity, operating return on MetLife, Inc.’s common equity, excluding AOCI, investment portfolio gains (losses) and derivative gains (losses) should not be viewed as substitutes for the following financial measures calculated in accordance with GAAP: GAAP revenues, GAAP expenses, income (loss) from continuing operations, net of income tax, net income (loss) available to MetLife, Inc.'s common shareholders, net income (loss) available to MetLife, Inc.'s common shareholders per diluted common share, book value per common share, book value per diluted common share, return on MetLife, Inc.’s common equity, return on MetLife, Inc.’s common equity, excluding AOCI, net investment gains (losses) and net derivative gains (losses), respectively. For the historical periods presented, reconciliations of non-GAAP measures used in this presentation to the most directly comparable GAAP measures may be included in this Appendix to the presentation materials and/or are on the Investor Relations portion of our Internet website. Additional information about our historical results is also available on our Internet website in our Quarterly Financial Supplements for the corresponding periods. The non-GAAP measures used in this presentation should not be viewed as substitutes for the most directly comparable GAAP measures. In this presentation, we may refer to sales activity for various products. These sales statistics do not correspond to revenues under GAAP, but are used as relevant measures of business activity. The impact of changes in foreign currency exchange rates is calculated using the average foreign currency exchange rates for the current period and is applied to each of the comparable periods. In this presentation, we may provide forward-looking guidance on our future earnings, premiums, fees and other revenues, earnings per diluted common share, book value per common share and return on common equity on an operating or non-GAAP basis. A reconciliation of the non- GAAP measures to the most directly comparable GAAP measures is not accessible on a forward-looking basis because we believe it is not possible to provide other than a range of net investment gains and losses and net derivative gains and losses, which can fluctuate significantly within or outside the range and from period to period and may have a significant impact on GAAP net income. In addition, we may provide estimated historical operating results for business that is not within a single reportable segment or Corporate & Other in this presentation. A reconciliation of non-GAAP measures to the most directly comparable GAAP measures is not accessible for such results, as we calculate GAAP results only for our reportable segments and Corporate & Other. |
|
Definitions 107 Sales (Retail): Annuity Sales: • Individual annuities sales consist of statutory premiums direct and assumed, excluding company sponsored internal exchanges. • Sales of life and non-medical health products include 100% of annualized full year premiums and fees from recurring-premium policy. • Sales for P&C are based on first year direct written premium net of cancellation and endorsement activity. Sales (CBF): Pension Closeout Sales: Sales (Direct): Consumer Direct Individual Life Sales: • Statistical sales information for life insurance is calculated by using the LIMRA International, Inc. definition of sales for core direct sales, excluding company sponsored internal exchanges. Sponsored Direct Group Product Sales: • 100% of annualized full year premiums and fees from recurring-premium policy sales of all products (mainly from risk and protection products such as individual life, accident & health and group). • Sales for P&C are based on first year direct written premium net of cancellation and endorsement activity. Sales (Latin America, Asia, EMEA and GEB): • 10% of single-premium deposits (mainly from retirement products such as variable annuity, fixed annuity and pensions) and 20% of single-premium deposits from credit insurance. • 100% of annualized full year premiums and fees from recurring-premium policy sales of all products (mainly from risk and protection products such as individual life, accident & health and group). Sales (GVWB): • Pension closeout sales consist of statutory single-premiums received as payment to assume certain benefit liabilities of a U.S. pension plan. This is consistent with the LIMRA International, Inc. definition of sales for single-premium buy-outs. |
|
Reconciliation of Operating Earnings Available to Common Shareholders to Net Income (Loss) Available to MetLife, Inc.’s Common Shareholders - Total Company 2013 2012 2011 ($ in millions) Operating earnings available to common shareholders 6,261 $ 5,649 $ 4,654 $ Adjustments from operating earnings available to common shareholders to net income (loss) available to MetLife, Inc.'s common shareholders: Add: Net investment gains (losses) 161 (352) (867) Add: Net derivative gains (losses) (3,239) (1,919) 4,824 Add: Goodwill impairment - (1,868) - Add: Other adjustments to continuing operations (1,597) (2,492) (1,419) Add: Provision for income tax (expense) benefit 1,683 2,174 (923) Add: Income (loss) from discontinued operations, net of income tax 2 48 24 Less: Net income (loss) attributable to noncontrolling interests 25 38 (8) Less: Preferred stock redemption premium - - 146 Net income (loss) available to MetLife, Inc.'s common shareholders 3,246 $ 1,202 $ 6,155 $ 109 |
|
Reconciliation of Operating Earnings Available to Common Shareholders to Net Income (Loss) Available to MetLife, Inc.’s Common Shareholders Retail Group, Voluntary & Worksite Benefits Corporate Benefit Funding Retail Corporate Benefit Funding Retail Corporate Benefit Funding ($ in millions) Operating earnings available to common shareholders 2,524 $ 962 $ 1,295 $ 2,002 $ 1,203 $ 1,335 $ 1,100 $ Adjustments from operating earnings available to common shareholders to net income (loss) available to MetLife, Inc.'s common shareholders: Add: Net investment gains (losses) 70 (21) (8) 212 107 158 19 Add: Net derivative gains (losses) (724) (676) (235) 162 (157) 2,321 426 Add: Goodwill impairment - - - (1,692) - - - Add: Other adjustments to continuing operations (926) (172) 87 (1,260) 77 (709) 111 Add: Provision for income tax (expense) benefit 554 304 53 532 (10) (619) (194) Add: Income (loss) from discontinued operations, net of income tax 1 - - 33 11 35 27 Less: Net income (loss) attributable to noncontrolling interests - - - - 1 1 (3) Net income (loss) available to MetLife, Inc.'s common shareholders 1,499 $ 397 $ 1,192 $ (11) $ 1,230 $ 2,520 $ 1,492 $ 2013 2012 2011 110 |
|
Reconciliation of Operating Earnings Available to Common Shareholders to Net Income (Loss) Available to MetLife, Inc.’s Common Shareholders – Emerging Markets 111 Latin America 1 EMEA 2 Asia 3 Total Latin America 1 EMEA 2 Asia 3 Total Latin America 1 EMEA 2 Asia 3 Total ($ in millions) Operating earnings available to common shareholders 590 $ 287 $ 17 $ 894 $ 583 $ 222 $ 7 $ 812 $ 514 $ 213 $ (1) $ 726 $ Adjustments from operating earnings available to common shareholders to net income (loss) available to MetLife, Inc.'s common shareholders: Add: Net investment gains (losses) 21 11 (27) 5 (2) (3) (94) (99) (6) (428) (14) (448) Add: Net derivative gains (losses) (25) - 12 (13) 38 - - 38 (36) (1) - (37) Add: Other adjustments to continuing operations 168 29 17 214 (193) (13) 14 (192) (340) (24) (5) (369) Add: Provision for income tax (expense) benefit (71) 3 - (68) 53 52 (5) 100 82 138 3 223 Less: Net income (loss) attributable to noncontrolling interests 5 3 20 28 1 9 15 25 - (11) 3 (8) Net income (loss) available to MetLife, Inc.'s common shareholders 678 $ 327 $ (1) $ 1,004 $ 478 $ 249 $ (93) $ 634 $ 214 $ (91) $ (20) $ 103 $ 1 Excludes U.S. sponsored direct (as reported in Latin America). 2 Excludes Western Europe. 3 Excludes Japan, Korea, Hong Kong and Australia. 2012 2011 2013 |
|
Reconciliation of Operating Earnings Available to Common Shareholders to Net Income (Loss) Available to MetLife, Inc.’s Common Shareholders – Asia 112 Japan Korea China India Designated Markets Total ($ in millions) Operating earnings available to common shareholders 1,153 $ 114 $ (11) $ - $ (12) $ 1,244 $ Adjustments from operating earnings available to common shareholders to net income (loss) available to MetLife, Inc.'s common shareholders: Add: Net investment gains (losses) 330 36 2 (26) - 343 Add: Net derivative gains (losses) (1,063) (6) - 12 - (1,057) Add: Other adjustments to continuing operations (438) (13) (1) 20 (2) (435) Add: Provision for income tax (expense) benefit 495 (5) (2) - (2) 487 Add: Income (loss) from discontinued operations, net of income tax (3) - - - - (3) Less: Net income (loss) attributable to noncontrolling interests 1 - - 20 - 22 Net income (loss) available to MetLife, Inc.'s common shareholders 473 $ 126 $ (12) $ (14) $ (16) $ 557 $ 1 Designated Markets include Australia, Bangladesh, Hong Kong, Nepal, Pakistan and regional office. Asia 2013 1 |
|
Reconciliation of Premiums, Fees & Other Revenues (Operating) to Premiums, Fees & Other Revenues (GAAP) ($ in millions) Japan Korea China ¹ India Designated Markets Total Asia ¹ EMEA Premiums, fees & other revenues (operating) 7,398 $ 1,232 $ 720 $ 294 $ 691 $ 9,615 $ 2,780 $ Add: Adjustments to premiums, fees and other revenues (32) - - - - (32) 15 Premiums, fees & other revenues (GAAP) 7,366 $ 1,232 $ 720 $ 294 $ 691 $ 9,583 $ 2,795 $ 1 China is a non-consolidating joint venture. Therefore, Asia's total operating PFOs, as reported, do not include China. Asia 2013 113 |
|
Reconciliation of Return on Common Equity 114 2013 2012 2011 Return on MetLife, Inc.'s Common Equity Operating return on MetLife, Inc.'s common equity, excluding accumulated other comprehensive income (loss) (1) 11.9% 11.2% 10.0% Operating return on MetLife, Inc.'s common equity (1) 10.4% 9.5% 9.2% Return on MetLife, Inc.'s common equity, excluding accumulated other comprehensive income (loss) (2) 6.2% 2.4% 13.2% Return on MetLife, Inc.'s common equity (2) 5.4% 2.0% 12.2% (1) Operating return on MetLife, Inc.'s common equity is defined as operating earnings available to common shareholders divided by average GAAP common equity. (2) Return on MetLife, Inc.'s common equity is defined as net income available to MetLife, Inc.'s common shareholders divided by average GAAP common equity. |
| | |
 | | Steven A. Kandarian Chairman, President & Chief Executive Officer MetLife, Inc. Steven A. Kandarian is chairman of the board, president and chief executive officer of MetLife, Inc. (NYSE: MET), a leading provider of insurance, annuities and employee benefit programs to 90 million customers worldwide. He became president and CEO on May 1, 2011, and chairman of the board of directors on January 1, 2012. For 2013, MetLife had $68.2 billion in revenue and ranked 40th on the FORTUNE 500®. Kandarian joined MetLife in April 2005 as executive vice president and chief investment officer (CIO). Since 2007, he has also overseen MetLife’s enterprise-wide strategy, which identified key areas of focus for the company. Specifically, his direction contributed to MetLife’s recent global expansion and led to significant cost savings as well as efforts to address the insurance needs of the underserved U.S. middle market. |
| | As CIO, Kandarian oversaw the company’s more than $450 billion general account portfolio and led a number of initiatives that strengthened the portfolio and contributed to MetLife’s bottom line. He enhanced the company’s focus on effective risk management and diversified MetLife’s investment portfolio, in part through the |
$5.4 billion sale of Peter Cooper Village/Stuyvesant Town in 2006. Under Kandarian’s leadership, MetLife identified the housing bubble early and reduced its exposure to sub-prime mortgage-backed securities, raised the overall quality of its corporate credit portfolio, and increased its focus on low loan-to-value commercial and agricultural mortgages. His efforts helped MetLife emerge from the 2008 credit crisis with the financial strength to complete the company’s $16 billion purchase of Alico.
From 2001 to 2004, Kandarian was executive director of the Pension Benefit Guaranty Corporation (PBGC). During his tenure, he made the public case for comprehensive reform of the pension funding rules to put the defined benefit system and the PBGC on a sound financial footing, helping to lay the groundwork for the enactment of the Pension Protection Act of 2006.
Previously, Kandarian was founder and managing partner of Orion Partners, LP, a private equity firm based in the Boston area. Earlier he was managing director of Lee Capital Holdings. Kandarian began his career as an investment banker with Houston-based Rotan Mosle, Inc.
Kandarian is a board member of the Damon Runyon Cancer Research Foundation, the Institute of International Finance, the Lincoln Center for the Performing Arts and the Partnership for New York City. He is a member of the Business Council, the Business Roundtable and the Financial Services Forum. Kandarian earned his B.A. from Clark University, J.D. from Georgetown University Law Center, and M.B.A. from Harvard Business School.
# # #
| | |
 | | William J. Wheeler President, Americas MetLife, Inc. William J. Wheeler is president of the Americas region of MetLife, Inc., a leading provider of insurance, annuities and employee benefit programs to 90 million customers worldwide. He was appointed to this position in November 2011. As president, Wheeler oversees MetLife’s insurance and retirement businesses in the United States and Latin America. MetLife is the largest life insurer in both the U.S. and Mexico, and the company also holds leading market positions in Chile, Brazil and Argentina. |
| | Prior to his current role, Wheeler was executive vice president and chief financial officer since December 2003. As CFO, Wheeler was responsible for overseeing all financial management matters, including financial reporting, treasury, corporate actuarial, risk management, tax, investor relations and mergers and acquisitions. Wheeler was a key architect of MetLife’s 2010 acquisition of Alico, the largest transaction in MetLife’s history, and the acquisition of Travelers Life & Annuity and related international insurance businesses in 2005. Wheeler also oversaw a number of |
capital management strategies and related transactions that enhanced MetLife’s financial strength and increased its liquidity at a time of severe capital market constraints, while simultaneously achieving significant annualized expense savings and implementing a number of risk management initiatives.
Prior to becoming CFO, Wheeler oversaw business development, product management and marketing activities for the company’s Individual Business segment and also served as chief financial officer of Institutional Business, overseeing financial reporting and planning, as well as expense management for that segment. Wheeler joined MetLife in 1997 as treasurer and played a key role in preparing MetLife to become a public company. He oversaw certain aspects of the demutualization, the development of the investor relations and shareholder services organizations, and management of the initial public offering process.
Before joining MetLife, Wheeler was an investment banker for ten years at Donaldson, Lufkin & Jenrette (DLJ). During his career at DLJ, he managed a variety of transactions, including equity and debt financings, mergers and acquisitions, leveraged buyouts, financial advisory and restructurings in a number of different industries, including the insurance industry.
Wheeler serves on the board of directors for the American Council of Life Insurers (ACLI) and the Council of the Americas (COA). He is also a member of Wabash College’s board of trustees. He holds an M.B.A. from Harvard Business School and also received an A.B., magna cum laude, from Wabash College and was elected to Phi Beta Kappa.
# # #
| | |
 | | Todd B. Katz Executive Vice President, Group, Voluntary &Worksite Benefits MetLife, Americas Todd B. Katz is the executive vice president in MetLife’s Americas region responsible for the Group, Voluntary & Worksite Benefits organization in the United States. Katz is accountable for the strategic direction and management of the company’s U.S. group employee benefits business, which serves more than 50,000 group insurance customers, including 88 of the top 100 Fortune 500® companies and more than 80 percent of the Fortune 500® companies. The company offers a broad portfolio of products and services including: Group Life/AD&D, Disability, Dental, Vision, Property and Casualty, Legal Plans, and Accident and Health. In 2013, the organization generated nearly $1 billion in operating earnings and more than $16 billion in premiums, fees and other revenues. Prior to his current role, Katz led the U.S. Insurance Products organization |
where he was responsible for product manufacturing, underwriting, claims and administration for MetLife’s Group insurance business as well as its Individual Life insurance business. Before this, he held general management roles running the company’s group dental and group disability businesses. Katz started with MetLife in 1989 as a Group Sales trainee, and over the span of ten years held various positions of increasing responsibility at MetLife in the Institutional Sales organization, including five years as a top-producing account executive in the New York City group insurance market.
Katz serves on the Board of Directors of MetLife Alico Insurance K.K., MetLife’s insurance company in Japan, and the Board of Directors of MetLife’s Property and Casualty business. He has held prior Board roles including Chairman of the Board of SafeGuard Health Enterprises, Inc.
Katz holds a B.A. degree in Economics from Brandeis University.
# # #
| | |
 | | Oscar A. Schmidt Executive Vice President, CEO of Latin America and U.S. Sponsored Direct MetLife, Inc. Oscar Schmidt is executive vice president and CEO of Latin America and U.S. Sponsored Direct business. He has held the position of CEO of Latin America since July 2006 and became executive vice president in January 2010. Schmidt took charge of the Sponsored Direct Marketing business in the United States in January 2012. Prior to this, he was president and CEO for MetLife in Argentina and Uruguay where he led the market entry and growth strategies since the early 1990s among other numerous roles at MetLife. |
| | As CEO, Schmidt is responsible for MetLife’s operations in Latin America and the Sponsored Direct business in the U.S., which together generated $3.8 billion in operating premiums, fees and other revenues revenues and $574 million in operating earnings in 2013. Under his leadership, the company has grown to become the largest life insurer in the region. MetLife is the number one insurer in Mexico; the largest life insurer in Chile, Argentina and Uruguay; and the second largest non-bank life insurer in Brazil. In 2013, Schmidt executed the acquisition of ProVida |
AFP, which positioned MetLife as the largest pension fund administrator in Chile. Schmidt played a leading role in the execution of the Alico acquisition in 2010 and the international component of the Travelers acquisition in 2005. These three deals are the largest in MetLife history and have greatly increased the company’s global footprint. In his current role, Schmidt drives organic growth through innovative products and distribution while pursuing M&A opportunities across the Americas.
Throughout his tenure as CEO of Latin America, he has participated in a number of key projects to grow the business and define the strategy of the company. Working closely with the Harvard Business School, in 2007 he launched a global initiative to introduce a disciplined process to appraise local business opportunities and align them with the corporate strategy.
Schmidt is recognized as a thought leader for his experience in the life and pension industry. He led a global project in 2003 in the long-term savings and pension arena, which included exploring opportunities in Europe and Asia, launching the Afore business in Mexico and growing the business in Latin America. Between 1999 and 2003 he was elected President of AVIRA (Life and Annuity Insurers Association of Argentina) and during 2005 and 2006 President of the UAFJP (Argentina Retirement and Pension Fund Managers Association).
Prior to joining MetLife, Schmidt held executive positions at Arthur Andersen and Sul América Seguros. He is a CPA and graduated from the University of Buenos Aires.
# # #
| | |
 | | Christopher G. Townsend President, Asia MetLife, Inc. Christopher Townsend is president of MetLife’s Asia region and a member of the company’s executive group. Appointed to this position in August 2012, Townsend oversees all of MetLife’s businesses in Asia. In 2013, the Asia region generated $1.2 billion in operating earnings, as well as operating premiums, fees and other revenues of $9.6 billion. Prior to joining MetLife, Townsend was, since 2010, chief executive officer of the Asia Pacific region at AIG. In addition to leading all aspects of the business across the region, which included 4,700 employees in 15 countries, he oversaw the company’s risk, audit, compliance and investment divisions. As CEO, Townsend drove capital optimization, cost efficiency and a focus on client needs as he implemented a strategy to take advantage of opportunities to drive an above average return on equity. From 2007 to 2010, Townsend was chief executive officer of AIG Australasia, with responsibility for the company’s businesses across Australia and New Zealand. Working with many of the company’s internal and external stakeholders, he developed and executed on a three-year plan to deliver a superior compound annual growth rate and solid combined operating ratios. In addition to reorganizing the |
business around its customers, he drove innovation through product development and the implementation of an e-business initiative that helped differentiate AIG from many of its key competitors.
Earlier in his career, Townsend was the CEO of AIG Hong Kong, served as senior vice president of mergers and acquisitions and also held a number of senior leadership roles in Hong Kong, London and Sydney. He joined AIG in the United Kingdom in 1991 and spent more than half of his 21-year career in the company’s Asia Pacific region.
Townsend currently sits on the Board of Directors for MetLife’s philanthropic organization, the MetLife Foundation, and also serves as vice chairman of the U.S.-Korea Business Council. He has previously served as a board member of the Hong Kong Federation of Insurers, governor of the American Chamber of Commerce and board member of the Insurance Council of Australia. He is a Chartered Insurer.
# # #
| | |
 | | Michel Khalaf President EMEA MetLife, Inc. Michel Khalaf is president of MetLife, Inc.’s EMEA (Europe, Middle East and Africa) region and a member of the company’s executive group. He was appointed to this position in November 2011. Prior to assuming his current position, Khalaf was executive vice president and chief executive officer of MetLife’s Middle East, Africa and South Asia (MEASA) region. Previously, Khalaf was deputy president and chief operating officer of Philamlife, AIG’s operating company in the Philippines. Since joining Alico’s investment department in 1989, Khalaf has held a number of leadership roles in various markets around the world including the Caribbean, France and Italy. In 1996, he was named the first general manager of Alico’s operation in Egypt. In 2001, he assumed the position of regional senior vice president in charge of Alico’s life, pension and mutual fund operations in Poland, Romania and the Baltics as well as president and chief executive officer of Amplico Life. Khalaf is a graduate of Syracuse University with a B.S. in engineering and an M.B.A. in finance. He is a fellow of the Life Management Institute (FLMI). |
# # #
| | |
 | | Maria R. Morris Executive Vice President, Global EmployeeBenefits MetLife, Inc. Maria R. Morris, executive vice president, MetLife Inc., is a member of MetLife’s Executive Group and leads the Global Employee Benefits and Global Relationship Management organizations, and is the interim head of the Global Brand and Marketing organization. In this role, Morris is focused on doubling the company’s Group Life, Health, Pensions and Credit businesses outside of the United States by 2016. Morris is responsible for expanding MetLife’s employee benefits business in 40+ countries, and broadening relationships and fueling growth across the globe via partnerships with multinational corporations as well as through distribution relationships with financial institutions. In her interim role leading Global Brand and Marketing, Morris has responsibility for continuing to strengthen MetLife’s brand across the globe and leading MetLife to become a world-class marketing and customer centric organization. |
| | Morris has served in multiple leadership roles at MetLife since joining the company in 1984. Prior to her current role, she served as head of Global Technology and Operations, where she managed a $1.6 billion IT portfolio and a $2.5 billion |
procurement and real estate budget. In addition, she oversaw the successful integration of MetLife’s $16 billion acquisition of American Life Insurance Company (Alico).
As MetLife’s executive vice president for Employee Benefits Sales, Morris managed the Group Insurance and Retirement and Savings sales and service teams. Under her direction, they achieved record sales and generated more than $14 billion in annual revenue. From 2000 to 2003, as vice president and head of MetLife’s Group and Individual Disability businesses, Morris nearly doubled Group Disability profits. From 1996 to 2000, she led the Dental business to a 200 percent increase in profits by transforming the organization’s operating model.
Morris is a member of the board of directors of MetLife Property and Casualty Insurance Company and the MetLife Foundation. She was elected the first female chairman of the board of directors for INROADS, Inc. and served from 2010 to 2013. Morris is currently the Vice Chair of the All Stars Project, Inc.
Morris holds a B.A., magna cum laude, from Franklin and Marshall College, where she was elected to Phi Beta Kappa.
# # #
| | |
 | | Edward A. Spehar Senior Vice President, Investor Relations MetLife Edward A. Spehar is senior vice president and head of investor relations of MetLife, Inc., a leading global provider of insurance, annuities and employee benefit programs serving 90 million customers. Appointed to this position in November 2012, Spehar manages and coordinates the presentation of MetLife’s financial results, messages and strategies to the analyst and investor community. Before joining MetLife, Spehar spent over 20 years analyzing insurance companies with broad and diverse businesses as an equity research analyst. He joined MetLife from Bank of America Merrill Lynch, where he served as a sell-side equity research analyst covering the life insurance industry for approximately 19 years. In this role, he produced fundamental equity research on the industry and covered 15 publicly-traded insurers, including MetLife, American International Group and Prudential Financial. He also held similar roles at Lehman Brothers and Ameritrust Company. Spehar received a bachelor’s degree in management from Case Western Reserve University as well as a master’s in business administration degree from the Weatherhead School of Management at Case Western Reserve. |
He is a chartered financial analyst as well as a member of the New York Society of Security Analysts and the Association of Insurance and Financial Analysts. While at Bank of America Merrill Lynch, Spehar was repeatedly selected forInstitutional Investor magazine’s annual All-America Research Team.
# # #