Exhibit 99.1
Edward A. Spehar
Senior Vice President & Head of Investor Relations
September 17, 2014
ASIA INVESTOR DAY 2014
MetLife
Cautionary Statement on Forward-Looking Statements and Non-GAAP Financial Information
This presentation may contain or incorporate by reference forward-looking statements. Forward-looking statements give expectations or forecasts of future events and use words such as “anticipate,” “estimate,” “expect,” “project” and other terms of similar meaning, or are tied to future periods. Any or all forward-looking statements may turn out to be wrong, and actual results could differ materially from those expressed or implied in the forward-looking statements. Predictions of future performance are inherently difficult and are subject to numerous risks and uncertainties, including those identified in the “Risk Factors” section of MetLife, Inc.’s filings with the U.S. Securities and Exchange Commission. The company does not undertake any obligation to publicly correct or update any forward-looking statement if it later becomes aware that such statement is not likely to be achieved. Additional discussion of forward-looking statements may be included in other slides in this presentation; if so, please refer to those slides for more information.
This presentation and accompanying materials may also contain measures that are not calculated based on accounting principles generally accepted in the United States of America, also known as GAAP. Additional discussion of non-GAAP financial information may be included in other slides in these materials, on the Investor Relations portion of MetLife’s website (www.metlife.com), or elsewhere on that website; if so, please refer to those slides or the website for more information.
MetLife
Agenda
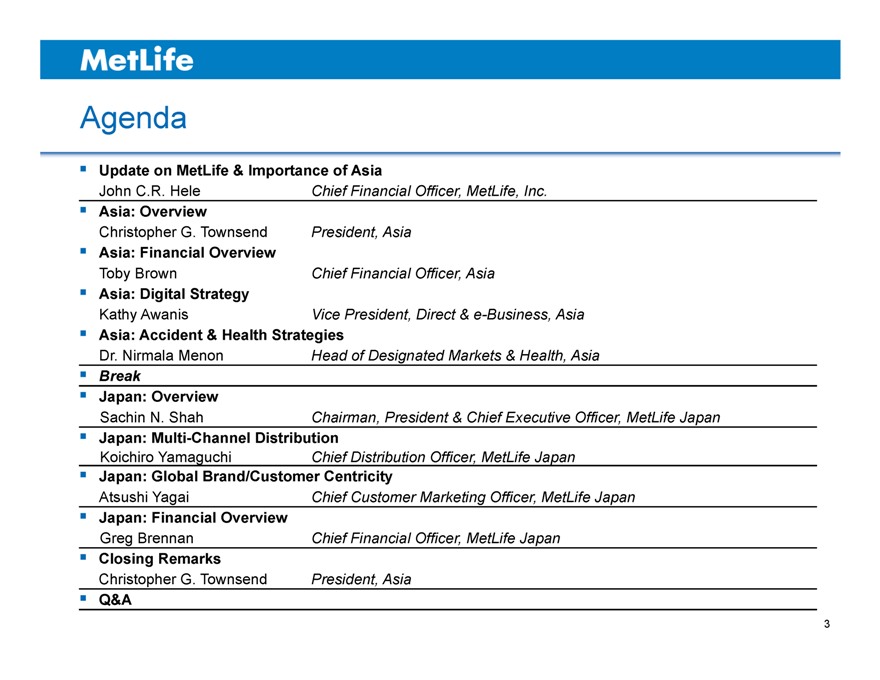
Update on MetLife & Importance of Asia
John C.R. Hele Chief Financial Officer, MetLife, Inc.
Asia: Overview
Christopher G. Townsend President, Asia
Asia: Financial Overview
Toby Brown Chief Financial Officer, Asia
Asia: Digital Strategy
Kathy Awanis Vice President, Direct & e-Business, Asia
Asia: Accident & Health Strategies
Dr. Nirmala Menon Head of Designated Markets & Health, Asia
Break
Japan: Overview
Sachin N. Shah Chairman, President & Chief Executive Officer, MetLife Japan
Japan: Multi-Channel Distribution
Koichiro Yamaguchi Chief Distribution Officer, MetLife Japan
Japan: Global Brand/Customer Centricity
Atsushi Yagai Chief Customer Marketing Officer, MetLife Japan
Japan: Financial Overview
Greg Brennan Chief Financial Officer, MetLife Japan
Closing Remarks
Christopher G. Townsend President, Asia
Q&A
MetLife
MetLife
John C.R. Hele
Chief Financial Officer MetLife, Inc.
September 17, 2014
ASIA INVESTOR DAY 2014
MetLife
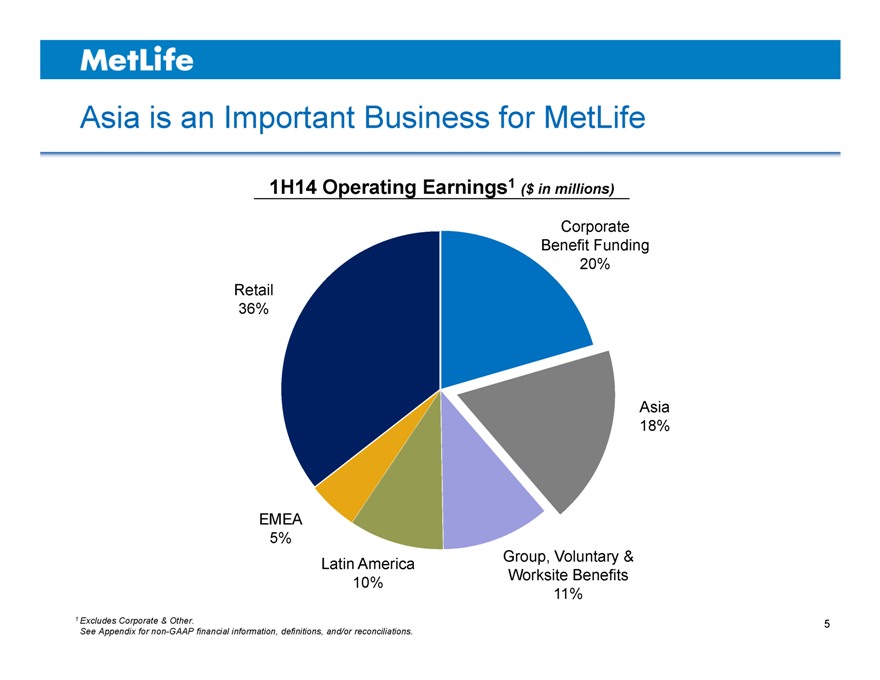
Asia is an Important Business for MetLife
1H14 Operating Earnings1 ($ in millions)
Corporate Benefit Funding 20% Retail 36%
Asia 18%
EMEA 5%
Group, Voluntary & Latin America Worksite Benefits 10% 11%
1 | | Excludes Corporate & Other. |
See Appendix for non-GAAP financial information, definitions, and/or reconciliations.
MetLife
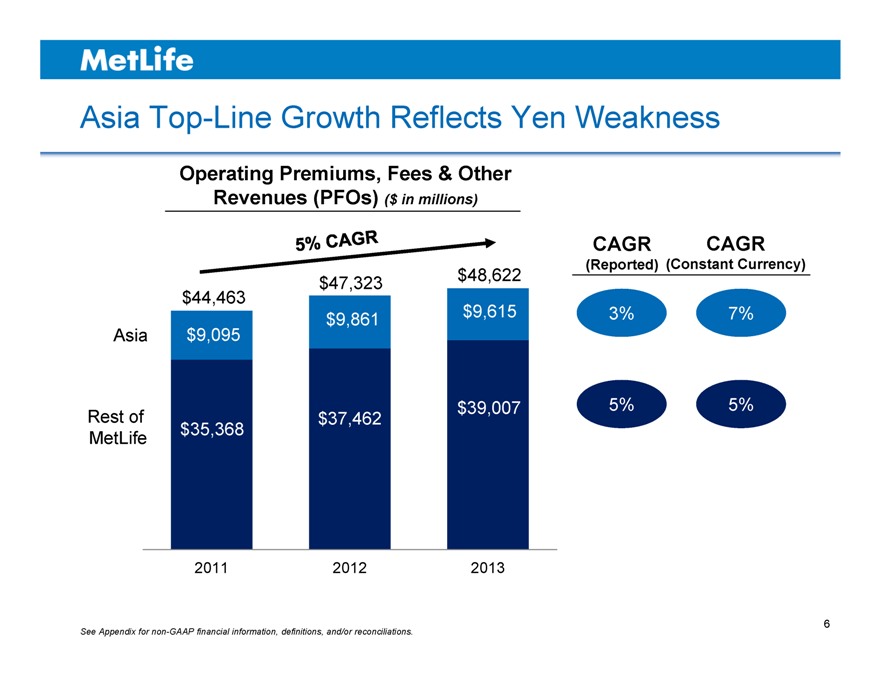
Asia Top-Line Growth Reflects Yen Weakness
Operating Premiums, Fees & Other Revenues (PFOs) ($ in millions)
CAGR CAGR
(Reported) (Constant Currency)
$47,323 $48,622
$44,463
$9,861 $9,615 3% 7%
Asia $9,095
Rest of $37,462 $39,007 5% 5%
MetLife $35,368
2011 2012 2013
See Appendix for non-GAAP financial information, definitions, and/or reconciliations.
MetLife
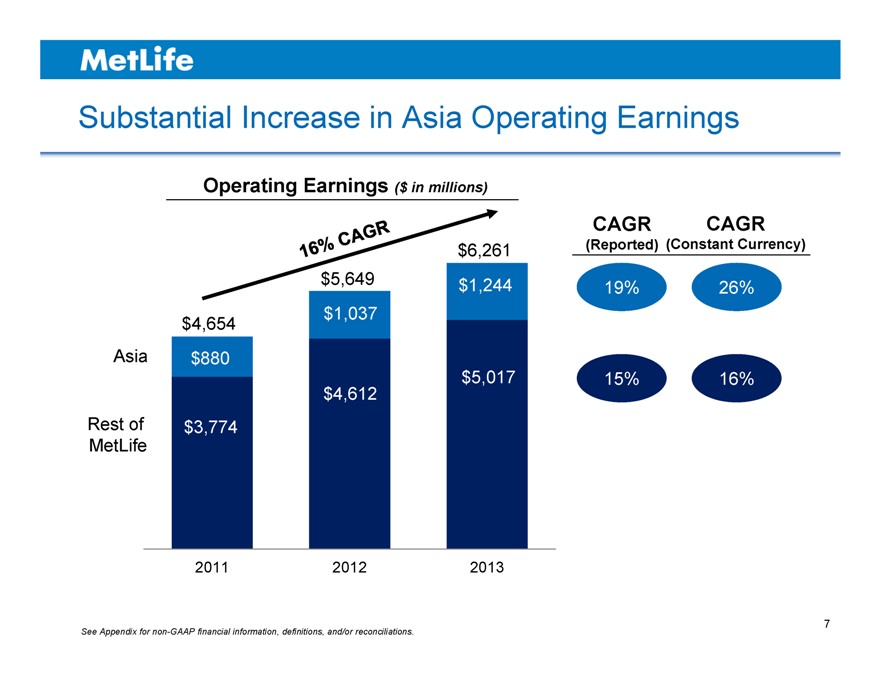
Substantial Increase in Asia Operating Earnings
Operating Earnings ($ in millions)
CAGR CAGR
$6,261 (Reported) (Constant Currency)
$5,649 $1,244 19% 26%
$4,654 $1,037
Asia $880
$5,017 15% 16%
$4,612
Rest of $3,774
MetLife
2011 2012 2013
See Appendix for non-GAAP financial information, definitions, and/or reconciliations.
MetLife
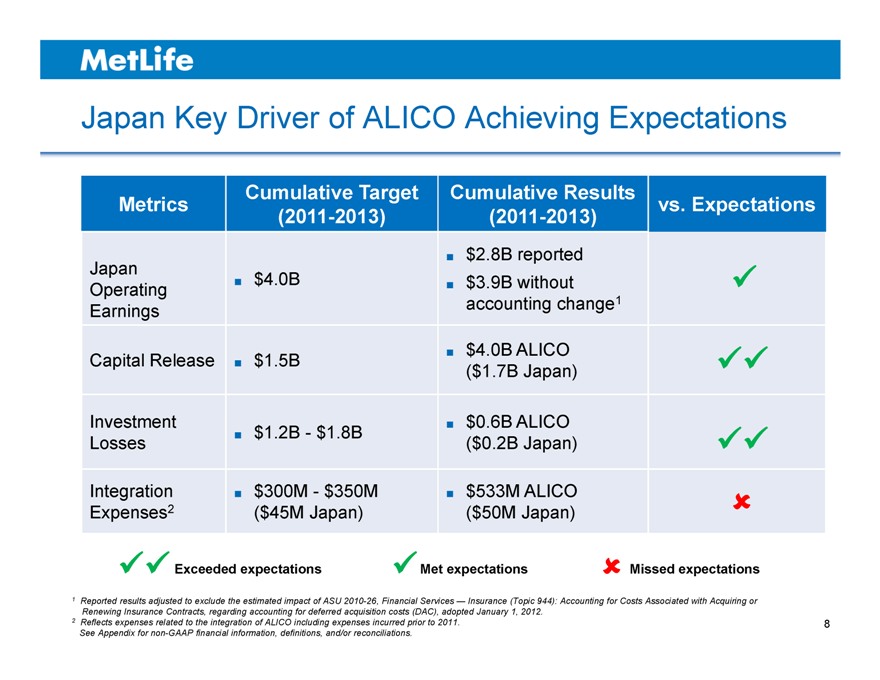
Japan Key Driver of ALICO Achieving Expectations
Cumulative Target Cumulative Results
Metrics vs. Expectations
(2011-2013) (2011-2013)
$2.8B reported
Japan $4.0B
Operating $3.9B without
Earnings accounting change1
Capital Release $1.5B $4.0B ALICO
($1.7B Japan)
Investment $0.6B ALICO
Losses $1.2B—$1.8B ($0.2B Japan)
Integration $300M—$350M $533M ALICO
Expenses2 ($45M Japan) ($50M Japan)
?Exceeded expectations ?Met expectations ?Missed expectations
1 Reported results adjusted to exclude the estimated impact of ASU 2010-26, Financial Services — Insurance (Topic 944): Accounting for Costs Associated with Acquiring or Renewing Insurance Contracts, regarding accounting for deferred acquisition costs (DAC), adopted January 1, 2012.
2 Reflects expenses related to the integration of ALICO including expenses incurred prior to 2011. See Appendix for non-GAAP financial information, definitions, and/or reconciliations.
MetLife
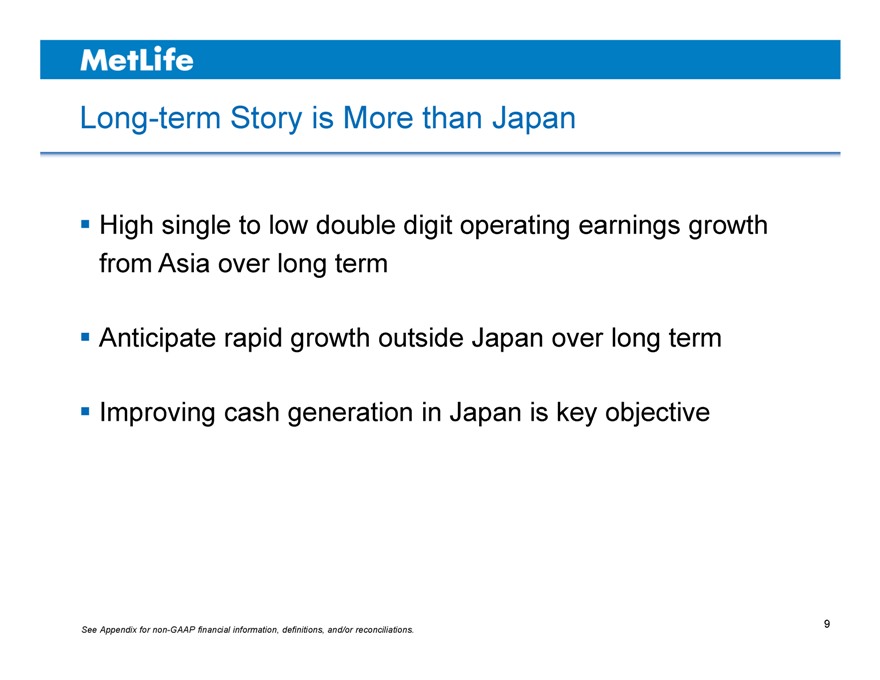
Long-term Story is More than Japan
High single to low double digit operating earnings growth from Asia over long term
Anticipate rapid growth outside Japan over long term
Improving cash generation in Japan is key objective
See Appendix for non-GAAP financial information, definitions, and/or reconciliations.
9
MetLife
Key Takeaways
Asia is an important market for MetLife
Japan results favorable relative to ALICO pricing expectations
Continued success in Japan, strong growth from rest of Asia
10
MetLife
MetLife
Christopher G. Townsend
President Asia
September 17, 2014
ASIA INVESTOR DAY 2014
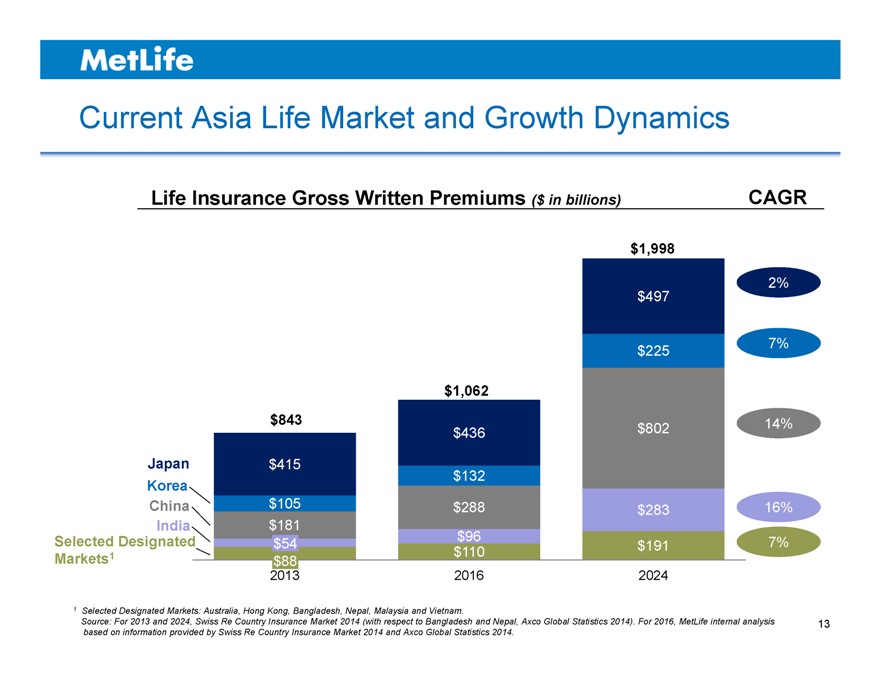
Current Asia Life Market and Growth Dynamics
Life Insurance Gross Written Premiums ($ in billions) CAGR
$1,998
2%
$497
$225 7%
$1,062
$843 $802 14%
$436
Japan $415
$132
Korea
China $105 $288 $283 16%
India $181
Selected Designated $54 $96 $191 7%
Markets1 $88 $110
2013 2016 2024
1 | | Selected Designated Markets: Australia, Hong Kong, Bangladesh, Nepal, Malaysia and Vietnam. |
Source: For 2013 and 2024, Swiss Re Country Insurance Market 2014 (with respect to Bangladesh and Nepal, Axco Global Statistics 2014). For 2016, MetLife internal analysis based on information provided by Swiss Re Country Insurance Market 2014 and Axco Global Statistics 2014.
13
MetLife
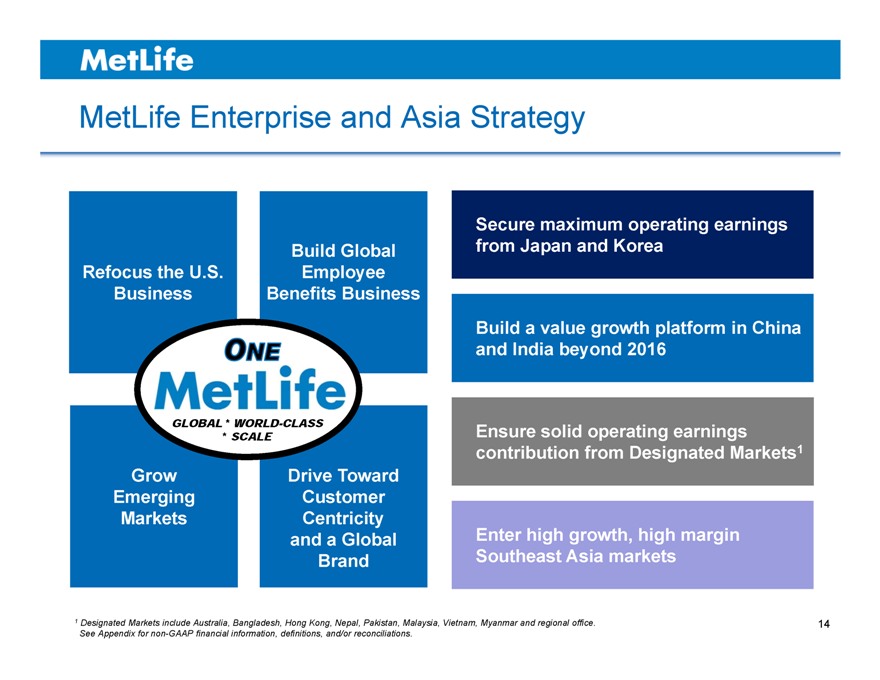
MetLife Enterprise and Asia Strategy
Secure maximum operating earnings
Build Global from Japan and Korea
Refocus the U.S. Employee
Business Benefits Business
Build a value growth platform in China
and India beyond 2016
GLOBAL * WORLD-CLASS
* | | SCALE Ensure solid operating earnings |
contribution from Designated Markets1
Grow Drive Toward
Emerging Customer
Markets Centricity
and a Global Enter high growth, high margin
Brand Southeast Asia markets
1 Designated Markets include Australia, Bangladesh, Hong Kong, Nepal, Pakistan, Malaysia, Vietnam, Myanmar and regional office. See Appendix for non-GAAP financial information, definitions, and/or reconciliations.
14
MetLife
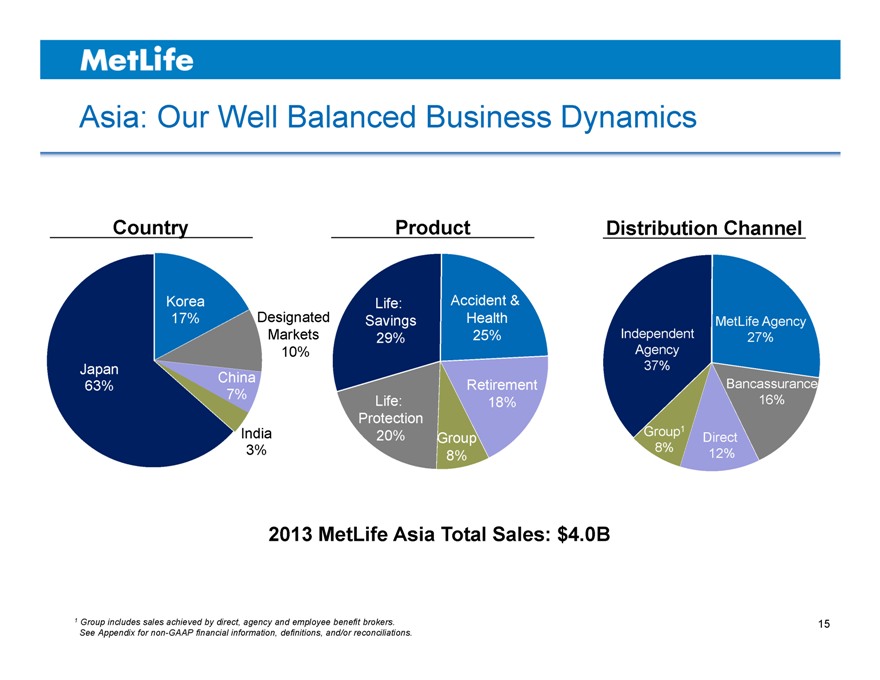
Asia: Our Well Balanced Business Dynamics
Country Product Distribution Channel
Korea Life: Accident &
17% Designated Savings Health MetLife Agency
Markets 29% 25% Independent 27%
10% Agency
Japan 37%
China
63% Retirement Bancassurance
7% Life: 18% 16%
Protection
India 20% Group1 Direct
Group
3% 8% 8% 12%
2013 MetLife Asia Total Sales: $4.0B
1 Group includes sales achieved by direct, agency and employee benefit brokers. See Appendix for non-GAAP financial information, definitions, and/or reconciliations.
15
MetLife
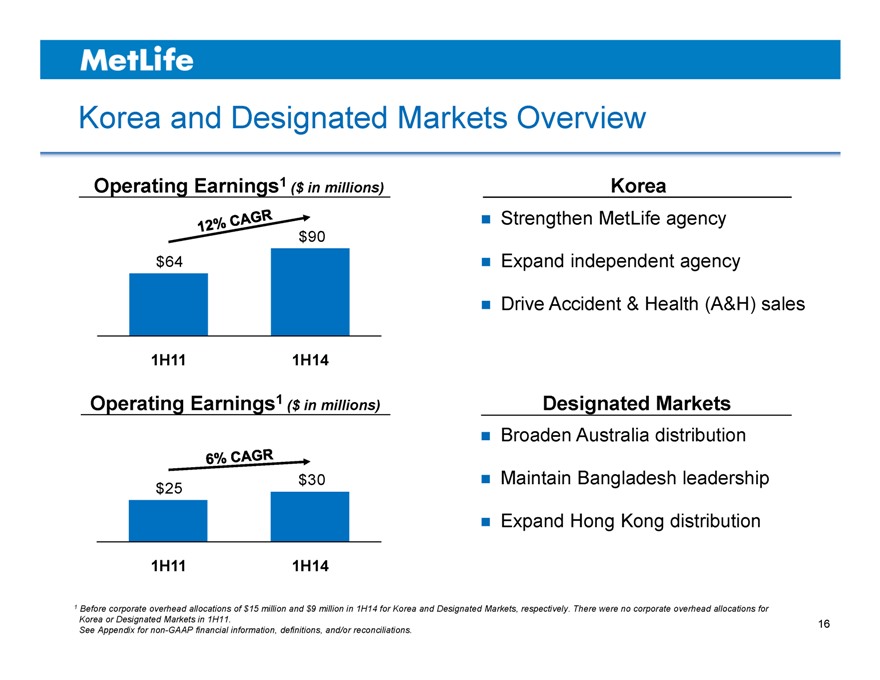
Korea and Designated Markets Overview
Operating Earnings1 ($ in millions)
$90
$64
1H11 1H14
Operating Earnings1 ($ in millions)
$25 $30
1H11 1H14
Korea
Strengthen MetLife agency Expand independent agency Drive Accident & Health (A&H) sales
Designated Markets
Broaden Australia distribution Maintain Bangladesh leadership Expand Hong Kong distribution
1 Before corporate overhead allocations of $15 million and $9 million in 1H14 for Korea and Designated Markets, respectively. There were no corporate overhead allocations for Korea or Designated Markets in 1H11.
See Appendix for non-GAAP financial information, definitions, and/or reconciliations.
16
MetLife
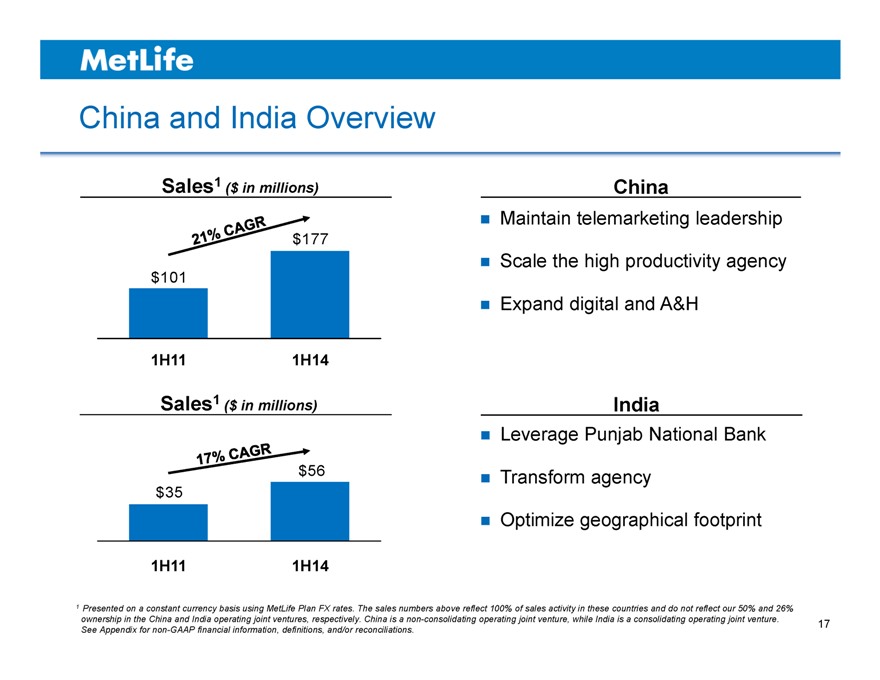
China and India Overview
Sales1 ($ in millions)
$177
$101
1H11 1H14
Sales1 ($ in millions)
$56
$35
1H11 1H14
China
Maintain telemarketing leadership Scale the high productivity agency Expand digital and A&H
India
Leverage Punjab National Bank Transform agency Optimize geographical footprint
1 Presented on a constant currency basis using MetLife Plan FX rates. The sales numbers above reflect 100% of sales activity in these countries and do not reflect our 50% and 26% ownership in the China and India operating joint ventures, respectively. China is a non-consolidating operating joint venture, while India is a consolidating operating joint venture. See Appendix for non-GAAP financial information, definitions, and/or reconciliations.
17
MetLife
Areas of Focus to Drive Value
Transform distribution to drive productivity Increase product profitability Focus on customer experience Improve efficiency and leverage scale
18
MetLife
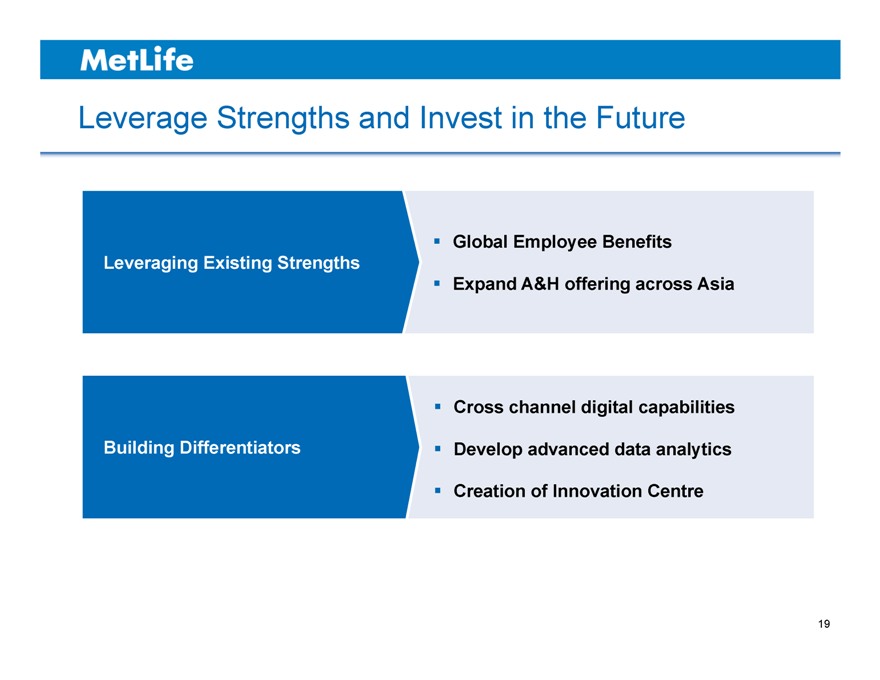
Leverage Strengths and Invest in the Future
Leveraging Existing Strengths
Building Differentiators
Global Employee Benefits
Expand A&H offering across Asia
Cross channel digital capabilities Develop advanced data analytics Creation of Innovation Centre
19
MetLife
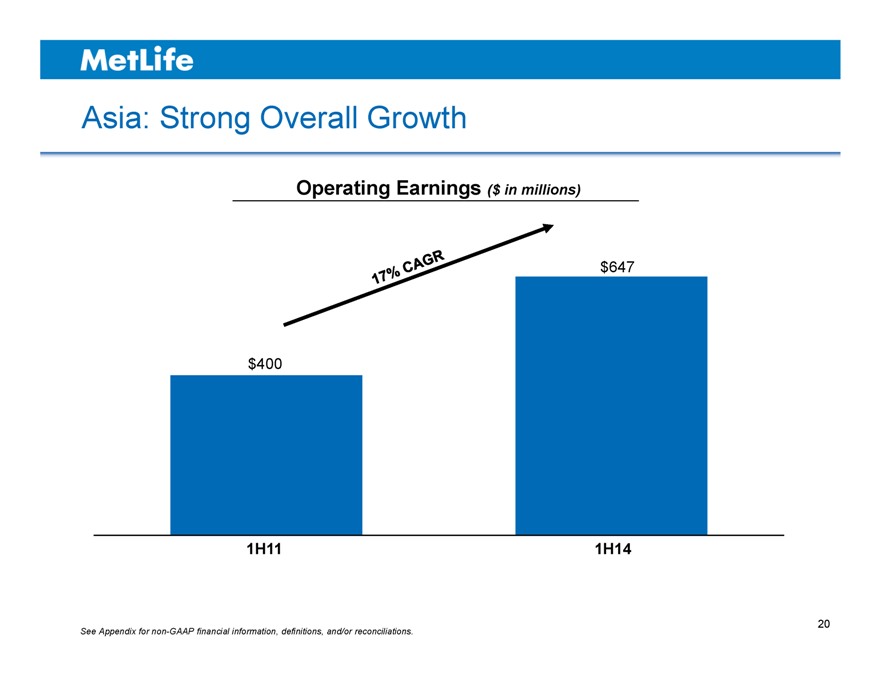
Asia: Strong Overall Growth
Operating Earnings ($ in millions)
$647
$400
1H11 1H14
See Appendix for non-GAAP financial information, definitions, and/or reconciliations.
20
MetLife
Key Takeaways
Asia – the industry’s most attractive growth opportunity Clear strategy and strong execution Proven capabilities to be leveraged across Asia Meaningful contributor to the MetLife Enterprise
21
MetLife
Metlife
Toby Brown
Chief Financial Officer Asia
September 17, 2014
ASIA INVESTOR DAY 2014
MetLife
Introduction
Solid year-to-date results Focus on operating efficiency Improve cash generation
Drive value creation through product mix, pricing discipline and capital management
24
MetLife
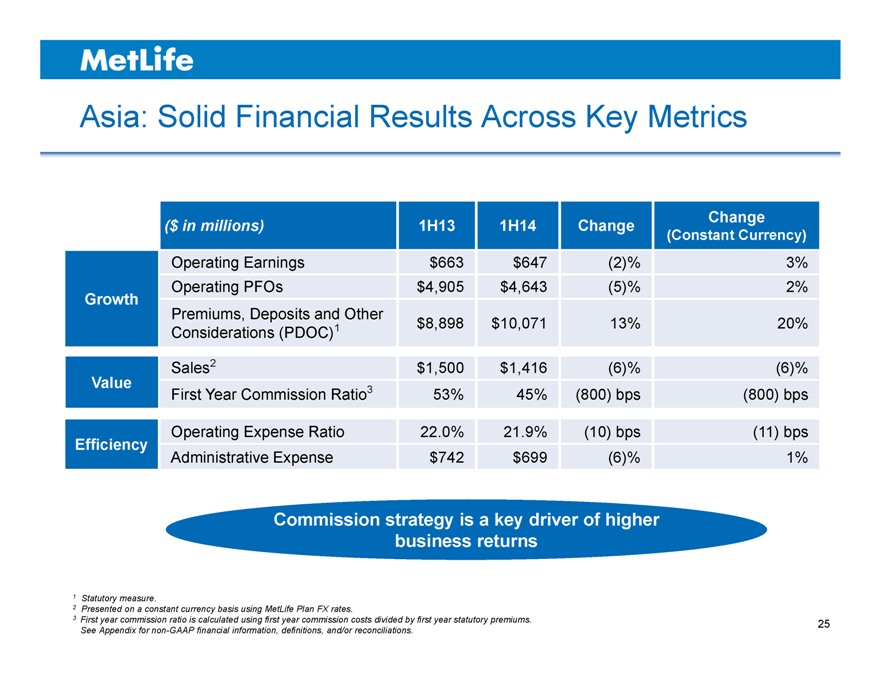
Asia: Solid Financial Results Across Key Metrics
($ in millions) 1H13 1H14 Change Change
(Constant Currency)
Operating Earnings $663 $647 (2)% 3%
Operating PFOs $4,905 $4,643 (5)% 2%
Growth
Premiums, Deposits and Other
Considerations (PDOC)1 $8,898 $10,071 13% 20%
Sales2 $1,500 $1,416 (6)% (6)%
Value First Year Commission Ratio3 53% 45% (800) bps (800) bps
Operating Expense Ratio 22.0% 21.9% (10) bps (11) bps
Efficiency
Administrative Expense $742 $699 (6)% 1%
Commission strategy is a key driver of higher business returns
2 | | Presented on a constant currency basis using MetLife Plan FX rates. |
3 First year commission ratio is calculated using first year commission costs divided by first year statutory premiums. See Appendix for non-GAAP financial information, definitions, and/or reconciliations.
25
MetLife
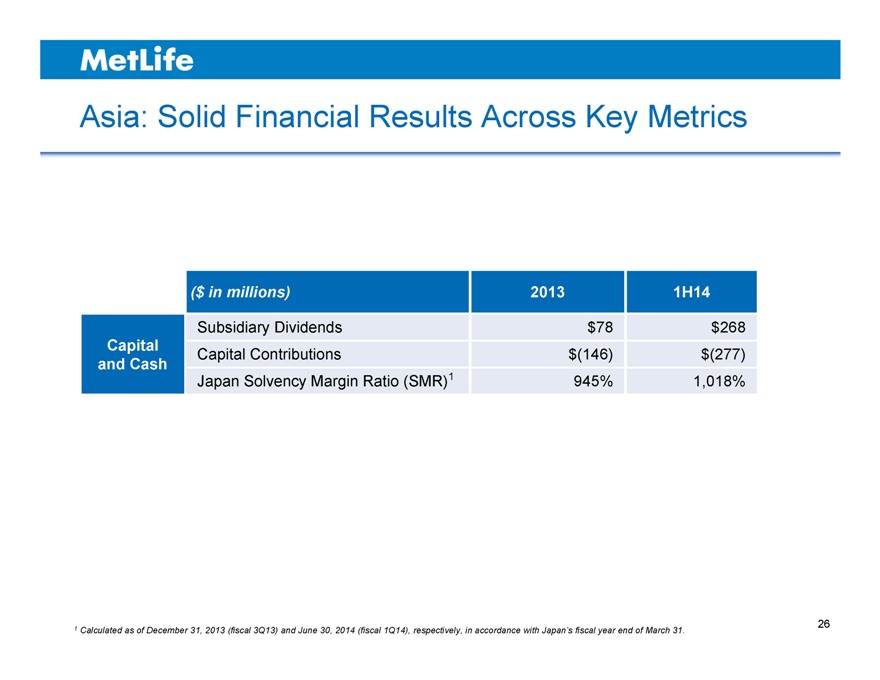
Asia: Solid Financial Results Across Key Metrics
($ in millions) 2013 1H14
Subsidiary Dividends $78 $268
Capital Capital Contributions $(146) $(277)
and Cash
Japan Solvency Margin Ratio (SMR)1 945% 1,018%
1 Calculated as of December 31, 2013 (fiscal 3Q13) and June 30, 2014 (fiscal 1Q14), respectively, in accordance with Japan’s fiscal year end of March 31.
26
MetLife
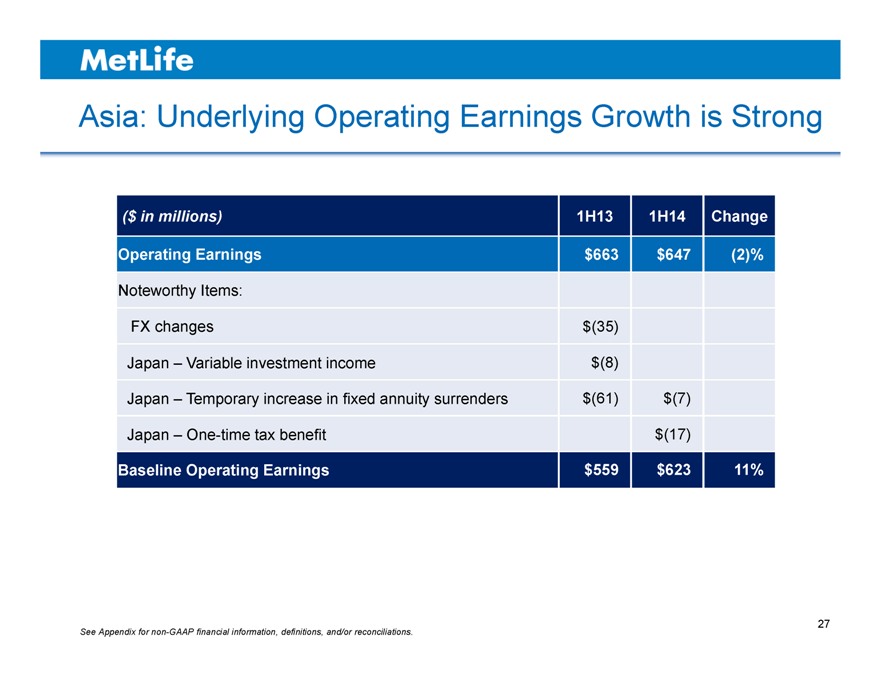
Asia: Underlying Operating Earnings Growth is Strong
($ in millions) 1H13 1H14 Change
Operating Earnings $663 $647 (2)%
Noteworthy Items:
FX changes $(35)
Japan – Variable investment income $(8)
Japan – Temporary increase in fixed annuity surrenders $(61) $(7)
Japan – One-time tax benefit $(17)
Baseline Operating Earnings $559 $623 11%
See Appendix for non-GAAP financial information, definitions, and/or reconciliations.
27
MetLife
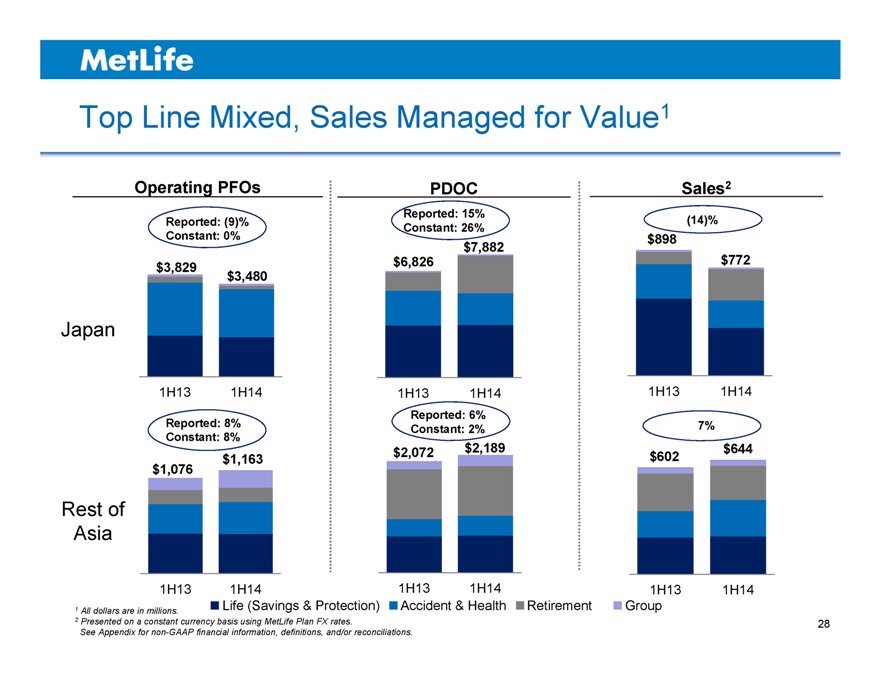
Top Line Mixed, Sales Managed for Value1
Operating PFOs PDOC Sales2
Reported: 15%
Reported: (9)% (14)%
Constant: 26%
Constant: 0% $898
$7,882
$3,829 $6,826 $772
$3,480
Japan
1H13 1H14 1H13 1H14 1H13 1H14
Reported: 6%
Reported: 8% Constant: 2% 7%
Constant: 8%
$2,072 $2,189 $602 $644
$1,163
$1,076
Rest of
Asia
1H13 1H14 1H13 1H14 1H13 1H14
Life (Savings & Protection) Accident & Health Retirement Group
1 | | All dollars are in millions. |
2 | | Presented on a constant currency basis using MetLife Plan FX rates. |
See Appendix for non-GAAP financial information, definitions, and/or reconciliations.
28
MetLife
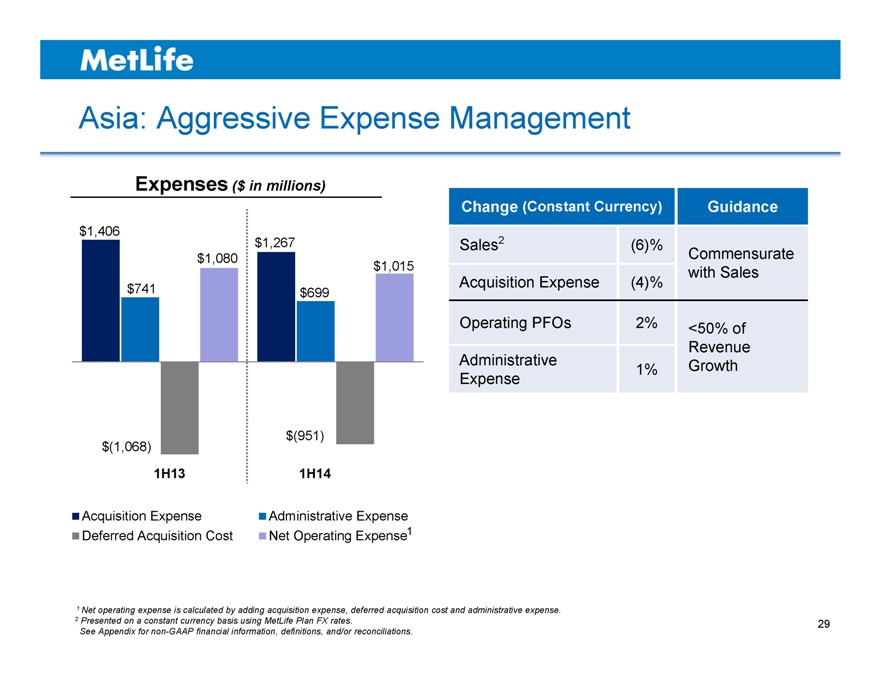
Asia: Aggressive Expense Management
Expenses ($ in millions)
$1,406
$1,267
$1,080 $1,015
$741 $699
$(951)
$(1,068)
1H13 1H14
Acquisition Expense Administrative Expense
Deferred Acquisition Cost Net Operating Expense1
Change (Constant Currency) Guidance
Sales2 (6)% Commensurate
Acquisition Expense (4)% with Sales
Operating PFOs 2% <50% of
Revenue
Administrative 1% Growth
Expense
1 Net operating expense is calculated by adding acquisition expense, deferred acquisition cost and administrative expense.
2 | | Presented on a constant currency basis using MetLife Plan FX rates. |
See Appendix for non-GAAP financial information, definitions, and/or reconciliations.
29
MetLife
Improving Cash Generation in Asia
Target to increase distributions to holding company
30% of Japan operating earnings in near-term and 50% long-term
Net positive cash flow from the rest of Asia, excluding inorganic growth
See Appendix for non-GAAP financial information, definitions, and/or reconciliations.
30
MetLife
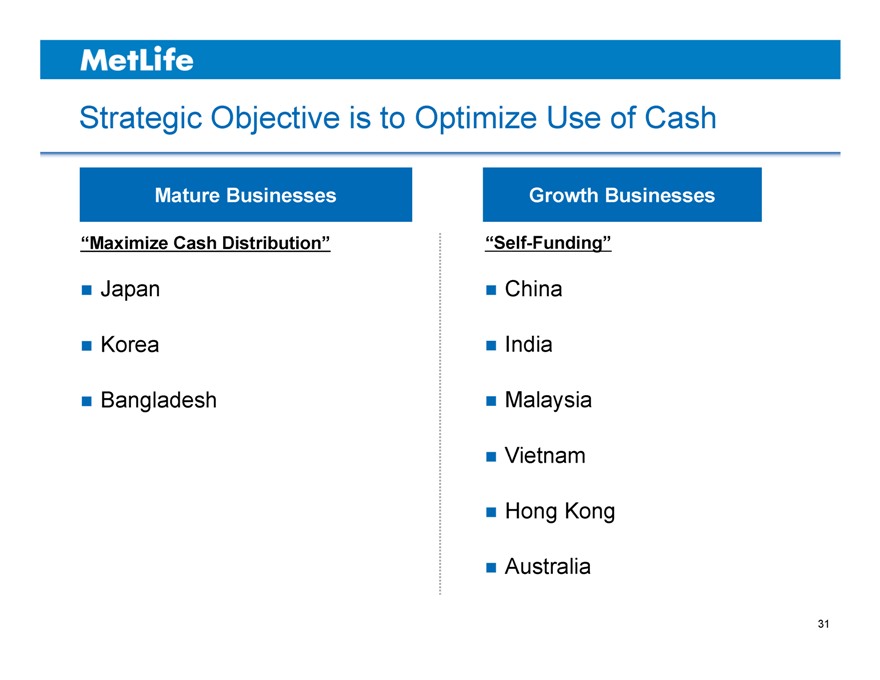
Strategic Objective is to Optimize Use of Cash
Mature Businesses
“Maximize Cash Distribution”
Japan Korea Bangladesh
Growth Businesses
“Self-Funding”
China India Malaysia Vietnam Hong Kong Australia
31
MetLife
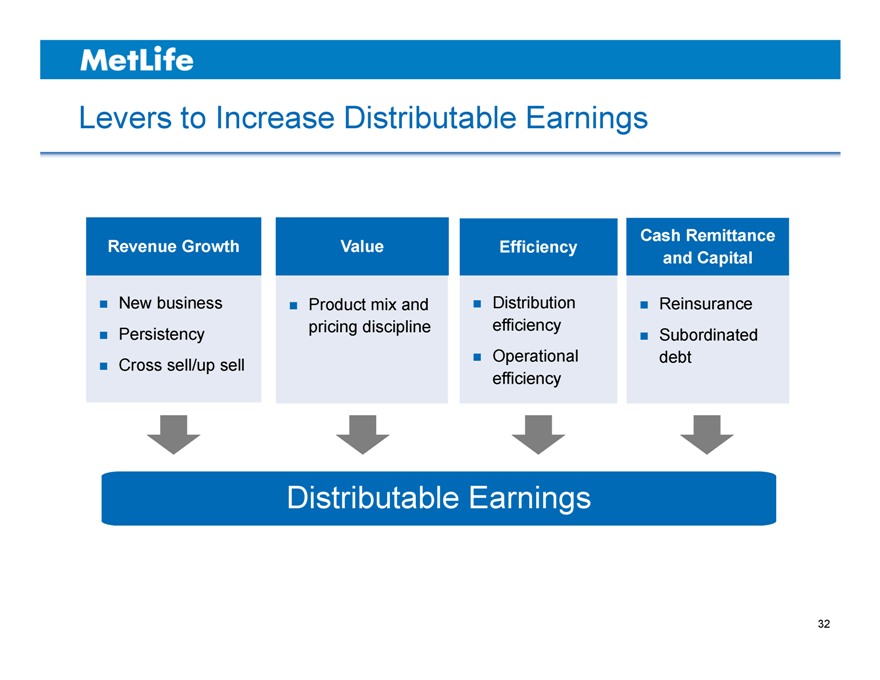
Levers to Increase Distributable Earnings
Revenue Growth
New business Persistency Cross sell/up sell
Value
Efficiency
Cash Remittance and Capital
Product mix and pricing discipline
Distribution efficiency Operational efficiency
Reinsurance Subordinated debt
Distributable Earnings
32
MetLife
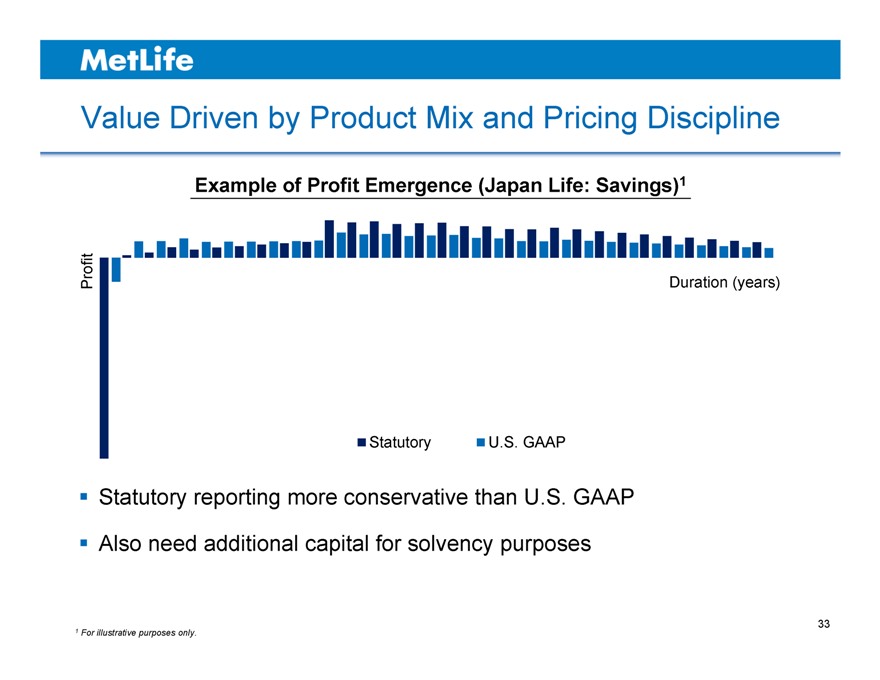
Value Driven by Product Mix and Pricing Discipline
Example of Profit Emergence (Japan Life: Savings)1
Profit Duration (years)
Statutory U.S. GAAP
Statutory reporting more conservative than U.S. GAAP
Also need additional capital for solvency purposes
1 | | For illustrative purposes only. |
33
MetLife
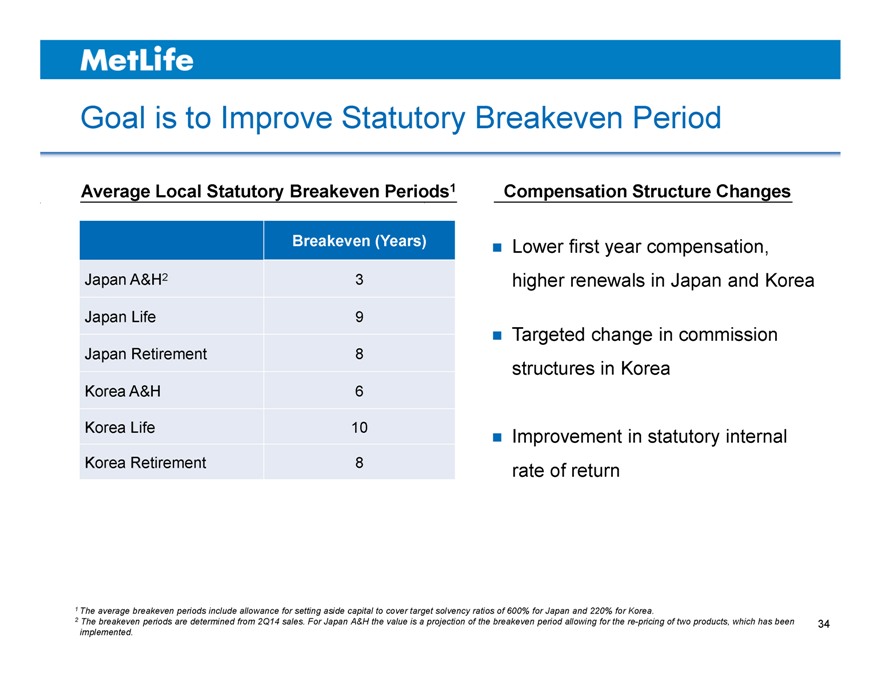
Goal is to Improve Statutory Breakeven Period
Average Local Statutory Breakeven Periods1
Breakeven (Years)
Japan A&H2 3
Japan Life 9
Japan Retirement 8
Korea A&H 6
Korea Life 10
Korea Retirement 8
Compensation Structure Changes
Lower first year compensation, higher renewals in Japan and Korea
Targeted change in commission structures in Korea
Improvement in statutory internal rate of return
1 The average breakeven periods include allowance for setting aside capital to cover target solvency ratios of 600% for Japan and 220% for Korea.
2 The breakeven periods are determined from 2Q14 sales. For Japan A&H the value is a projection of the breakeven period allowing for the re-pricing of two products, which has been implemented.
34
MetLife
Effective Use of Reinsurance in Japan
Executed transactions in 2011 and 2012 to accelerate the emergence of profits and cash flows in Japan
Utilized deferred tax assets of ~$450M and funded material cash remittance of ~$1.6B
Low cost of capital
Annual cost ~$200M today, declines to ~$100M in 2016 and zero in 2021
Reinsurance remains a valuable potential tool for the future
35
MetLife
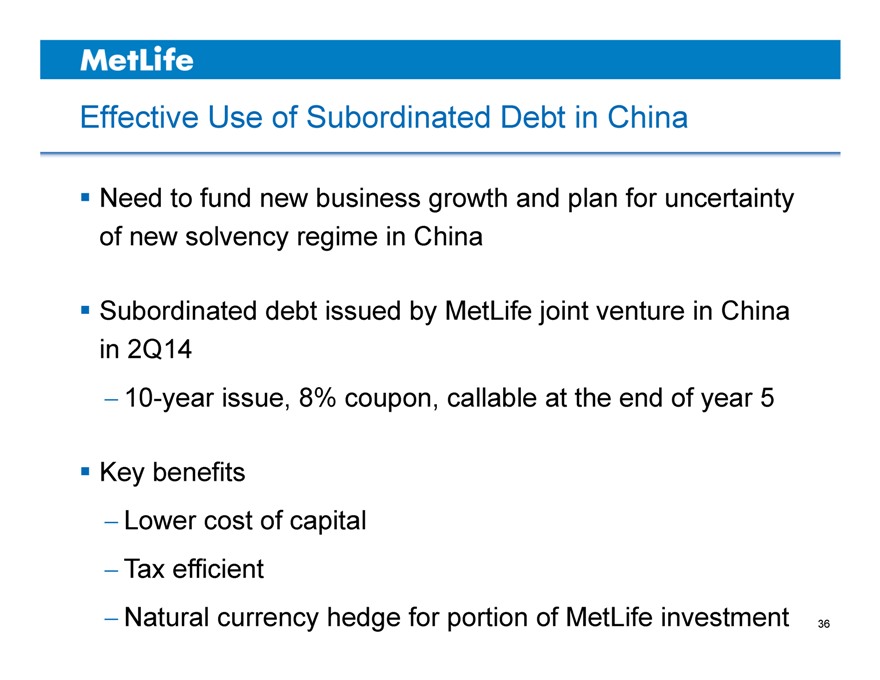
Effective Use of Subordinated Debt in China
Need to fund new business growth and plan for uncertainty of new solvency regime in China
Subordinated debt issued by MetLife joint venture in China in 2Q14
10-year issue, 8% coupon, callable at the end of year 5
Key benefits
Lower cost of capital Tax efficient
Natural currency hedge for portion of MetLife investment
36
MetLife
Key Takeaways
Solid year-to-date results Focus on operating efficiency Improve cash generation
Drive value creation through product mix, pricing discipline and capital management
37
MetLife
Metlife
Kathy Awanis
Vice President, Direct & e-Business Asia
September 17, 2014
ASIA INVESTOR DAY 2014
MetLife
Introduction
Digital in Asia is a significant opportunity
Consumer digital behavior is impacting offline purchasing Digital provides cross channel engagement to customers Digital is a differentiator for MetLife
40
MetLife
What is Digital?
Automation and augmentation of offline activities Ease and speed of access Integration of physical and digital operations
Customer data richness, transparency, big data analytics, social media
41
MetLife
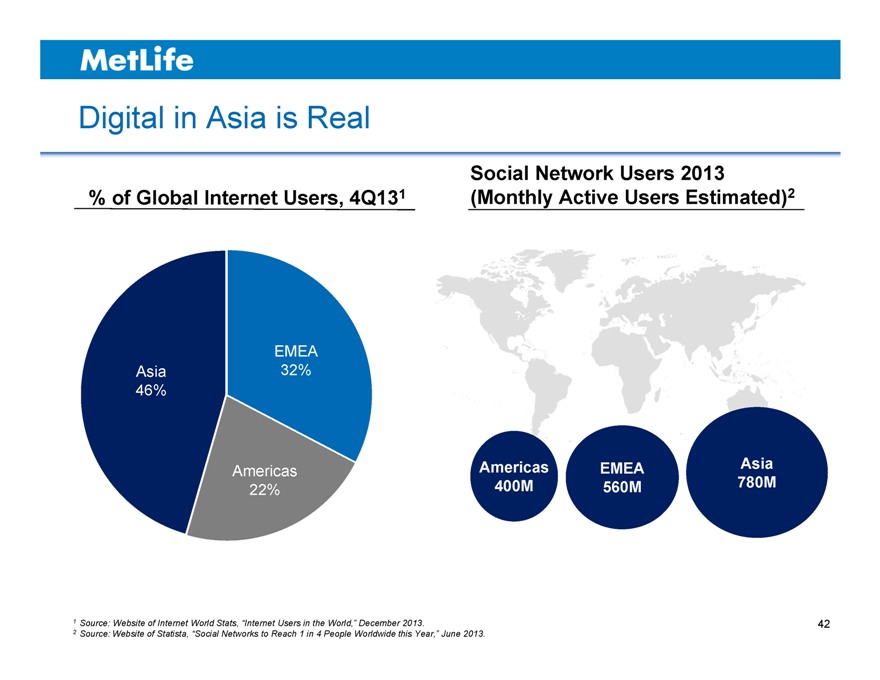
Digital in Asia is Real
% of Global Internet Users, 4Q131
Social Network Users 2013 (Monthly Active Users Estimated)2
EMEA Asia 32% 46%
Americas EMEA Asia
Americas
400M 560M 780M
22%
1 | | Source: Website of Internet World Stats, “Internet Users in the World,” December 2013. |
2 | | Source: Website of Statista, “Social Networks to Reach 1 in 4 People Worldwide this Year,” June 2013. |
42
MetLife
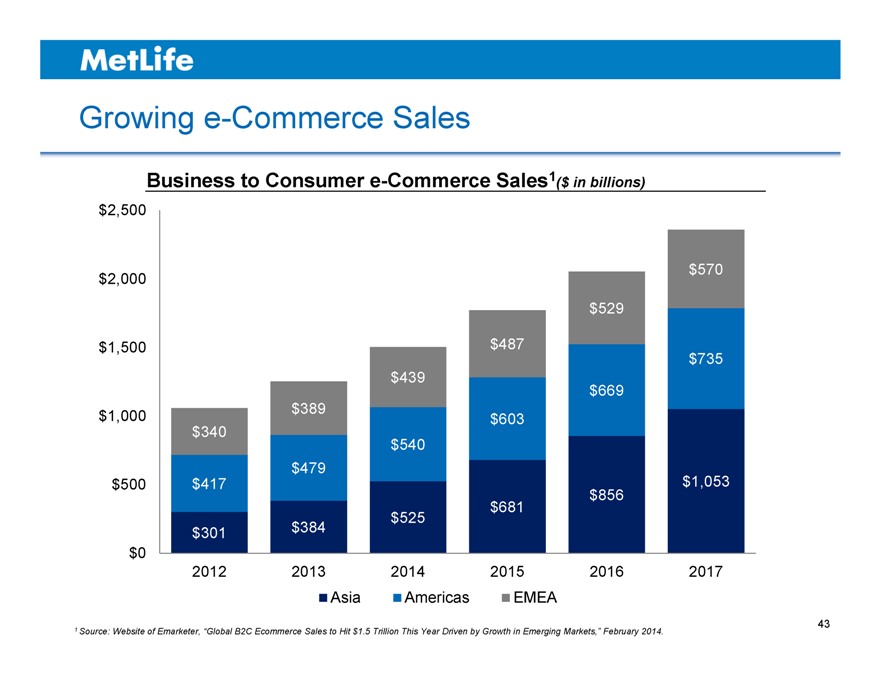
Growing e-Commerce Sales
Business to Consumer e-Commerce Sales1($ in billions)
$2,500
$2,000 $570
$ 529
$1,500 $ 487
$735
$ 439
$ 669
$ 389
$1,000 $ 603
$ 340
$ 540
$ 479
$500 $ 417 $1,053
$ 856
$ 681
$ 525
$ 301 $ 384
$0
2012 2013 2014 2015 2016 2017
Asia Americas EMEA
1 Source: Website of Emarketer, “Global B2C Ecommerce Sales to Hit $1.5 Trillion This Year Driven by Growth in Emerging Markets,” February 2014.
43
MetLife
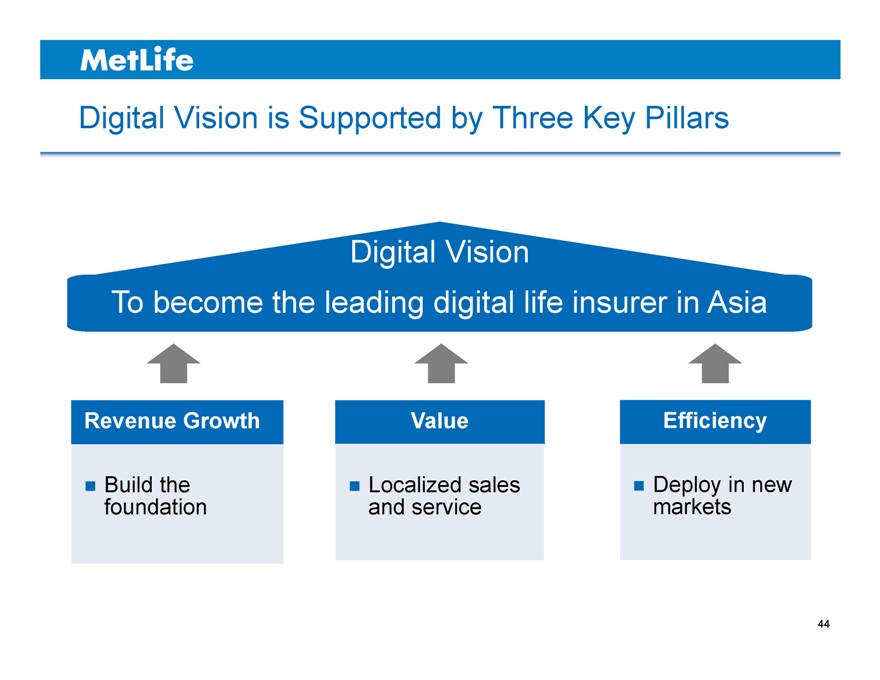
Digital Vision is Supported by Three Key Pillars
Digital Vision
To become the leading digital life insurer in Asia
Revenue Growth Value Efficiency
Build the Localized sales Deploy in new
foundation and service markets
44
MetLife
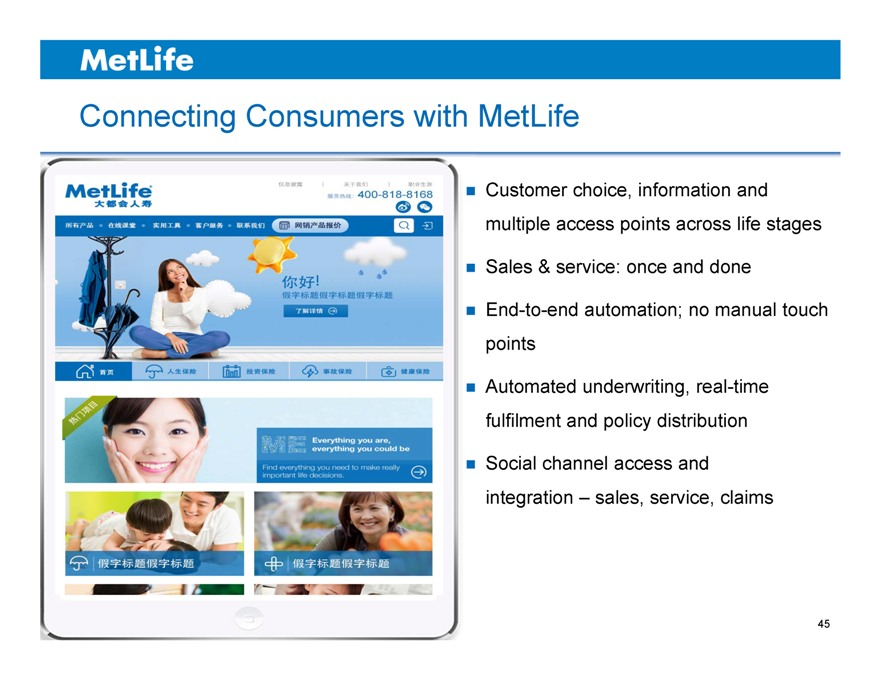
Connecting Consumers with MetLife
Customer choice, information and multiple access points across life stages
Sales & service: once and done
End-to-end automation; no manual touch points
Automated underwriting, real-time fulfilment and policy distribution
Social channel access and integration – sales, service, claims
45
MetLife
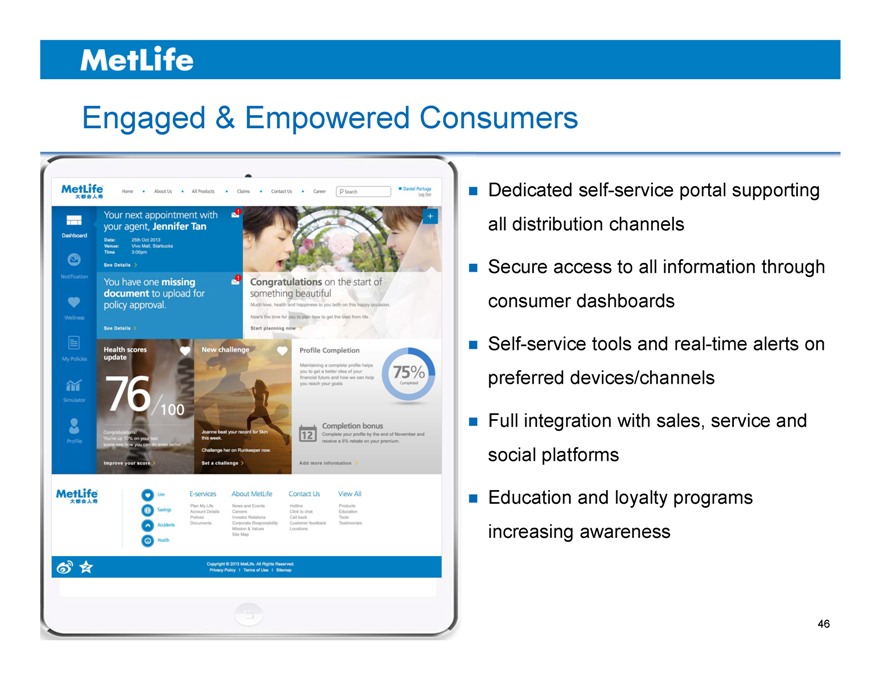
Engaged & Empowered Consumers
Dedicated self-service portal supporting all distribution channels
Secure access to all information through consumer dashboards
Self-service tools and real-time alerts on preferred devices/channels
Full integration with sales, service and social platforms
Education and loyalty programs increasing awareness
46
MetLife
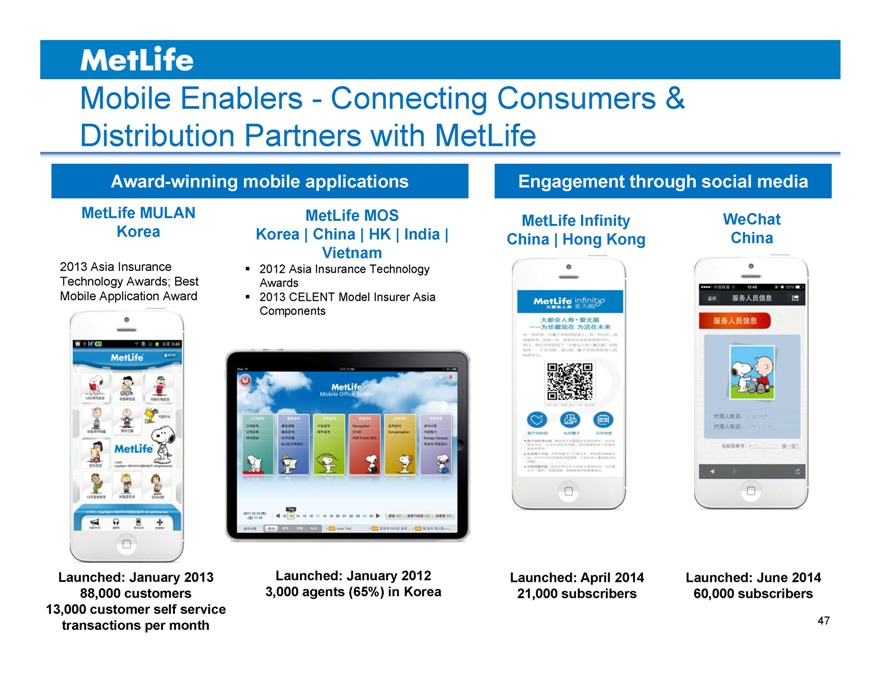
Mobile Enablers—Connecting Consumers & Distribution Partners with MetLife
Award-winning mobile applications Engagement through social media
MetLife MULAN MetLife MOS MetLife Infinity WeChat
Korea Korea | China | HK | India | China | Hong Kong China
Vietnam
2013 Asia Insurance 2012 Asia Insurance Technology
Technology Awards; Best Awards
Mobile Application Award 2013 CELENT Model Insurer Asia
Components
Launched: January 2013 Launched: January 2012 Launched: April 2014 Launched: June 2014
88,000 customers 3,000 agents (65%) in Korea 21,000 subscribers 60,000 subscribers
13,000 customer self service
transactions per month
47
MetLife
Key Takeaways
Digital in Asia is a significant opportunity
Consumer digital behavior is impacting offline purchasing Digital provides cross channel engagement to customers Digital is a differentiator for MetLife
48
MetLife
Metlife
Dr. Nirmala Menon
Head of Designated Markets & Health Asia
September 17, 2014
ASIA INVESTOR DAY 2014
MetLife
Introduction
A&H is an attractive business opportunity MetLife is well positioned in this market Strong track record Customer focused strategy
51
MetLife
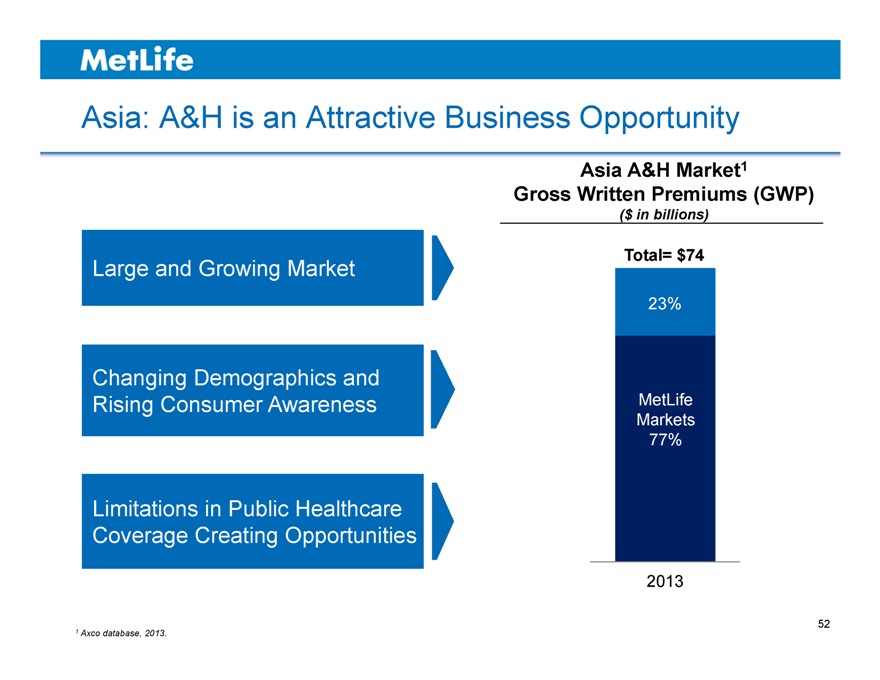
Asia: A&H is an Attractive Business Opportunity
Large and Growing Market
Changing Demographics and Rising Consumer Awareness
Limitations in Public Healthcare Coverage Creating Opportunities
Asia A&H Market1
Gross Written Premiums (GWP)
($ in billions)
Total= $74
23%
MetLife
Markets
77%
2013
52
MetLife
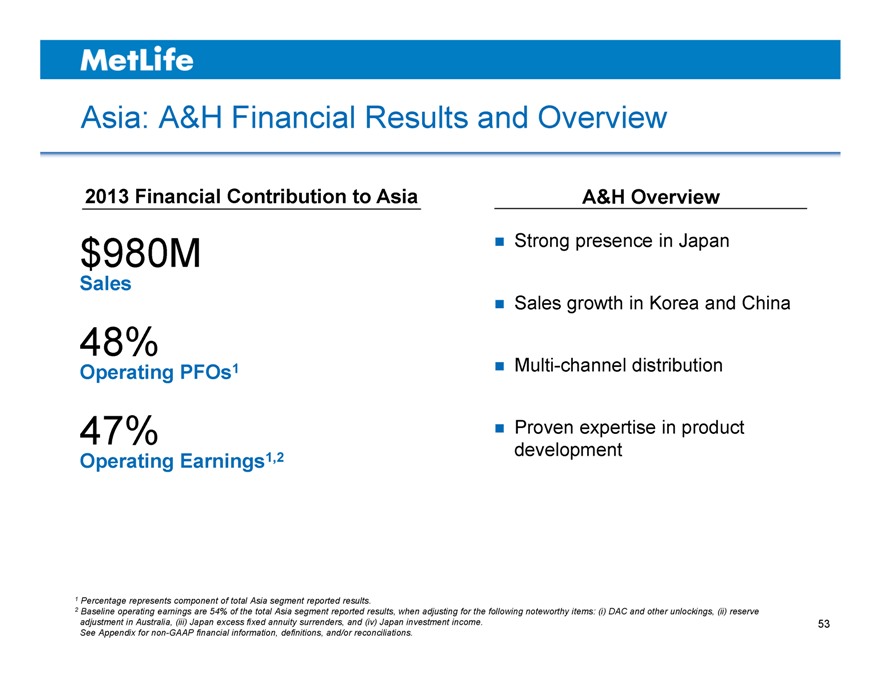
Asia: A&H Financial Results and Overview
2013 Financial Contribution to Asia
$980M
Sales
48%
Operating PFOs1
47%
Operating Earnings1,2
A&H Overview
Strong presence in Japan Sales growth in Korea and China Multi-channel distribution
Proven expertise in product development
1 | | Percentage represents component of total Asia segment reported results. |
2 Baseline operating earnings are 54% of the total Asia segment reported results, when adjusting for the following noteworthy items: (i) DAC and other unlockings, (ii) reserve adjustment in Australia, (iii) Japan excess fixed annuity surrenders, and (iv) Japan investment income.
See Appendix for non-GAAP financial information, definitions, and/or reconciliations.
53
MetLife
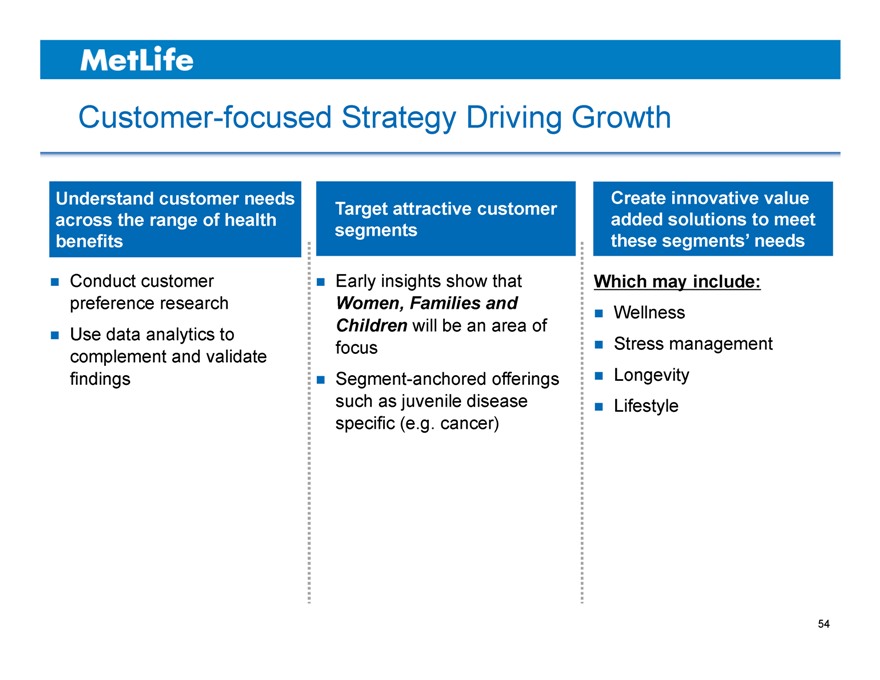
Customer-focused Strategy Driving Growth
Understand customer needs across the range of health benefits
Conduct customer preference research Use data analytics to complement and validate findings
Target attractive customer segments
Early insights show that
Women, Families and Children will be an area of focus Segment-anchored offerings such as juvenile disease specific (e.g. cancer)
Create innovative value added solutions to meet these segments’ needs
Which may include:
Wellness
Stress management Longevity Lifestyle
54
MetLife
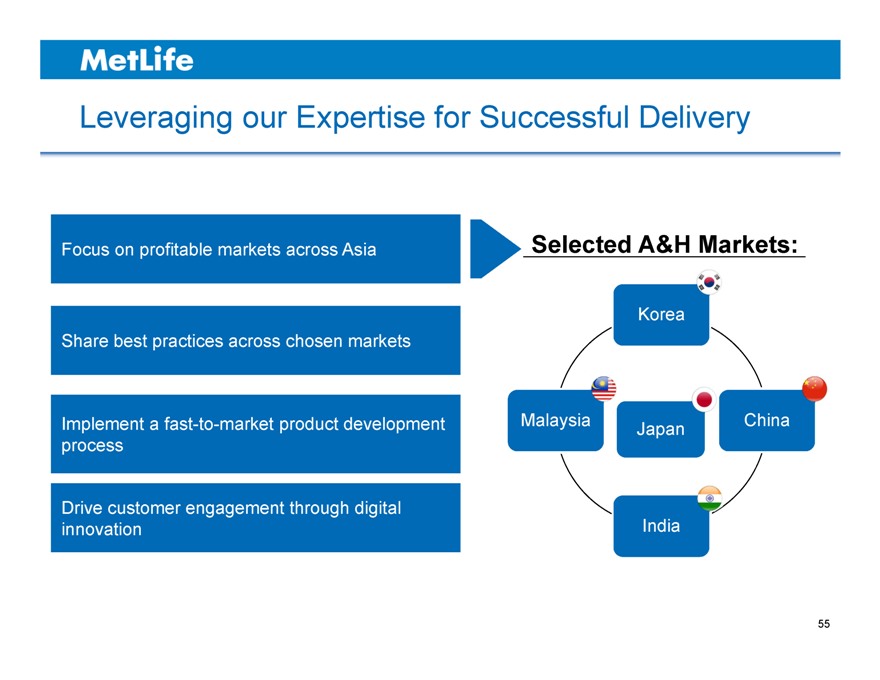
Leveraging our Expertise for Successful Delivery
Focus on profitable markets across Asia Selected A&H Markets:
Korea
Share best practices across chosen markets
Implement a fast-to-market product development Malaysia Japan China
process
Drive customer engagement through digital
innovation India
55
MetLife
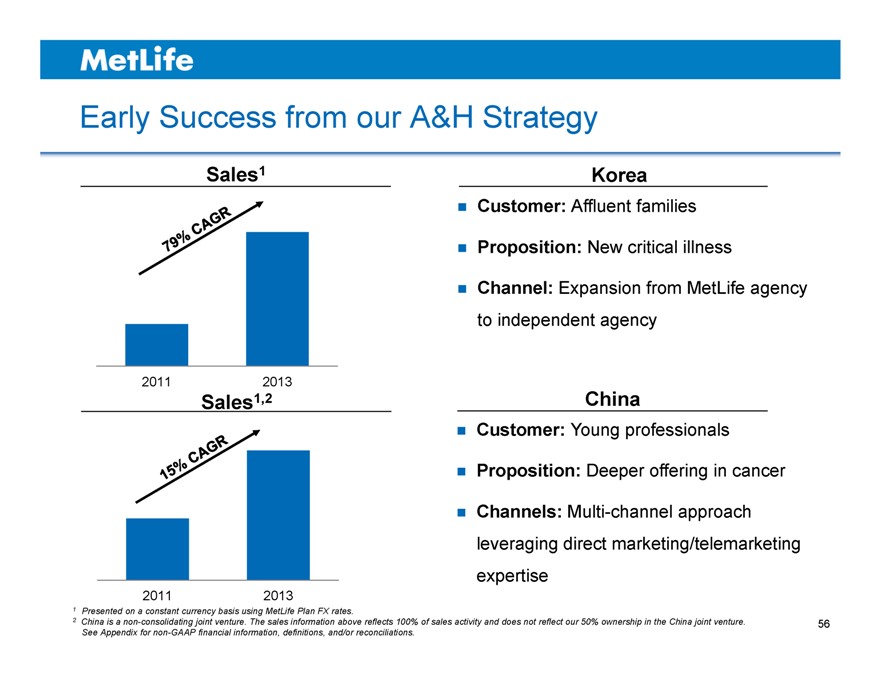
Early Success from our A&H Strategy
Sales1
2011 2013
Sales1,2
2011 2013
1 | | Presented on a constant currency basis using MetLife Plan FX rates. |
2 China is a non-consolidating joint venture. The sales information above reflects 100% of sales activity and does not reflect our 50% ownership in the China joint venture.
See Appendix for non-GAAP financial information, definitions, and/or reconciliations.
Korea
Customer: Affluent families
Proposition: New critical illness
Channel: Expansion from MetLife agency to independent agency
China
Customer: Young professionals
Proposition: Deeper offering in cancer
Channels: Multi-channel approach leveraging direct marketing/telemarketing expertise
56
MetLife
Key Takeaways
A&H is an attractive business opportunity
MetLife is well positioned to make the most of this opportunity
Drive profitable growth in our five key markets by creating a distinctive value proposition which is in line with customer needs
57
MetLife
Metlife
Sachin N. Shah
Chairman, President & Chief Executive Officer MetLife Japan
September 17, 2014
ASIA INVESTOR DAY 2014
MetLife
Introduction
MetLife Japan is unique platform with significant opportunities for sustainable profitable growth
We have a track record of outperforming the market
We are accelerating value creation through improved persistency, cost and capital management
These factors are steadily improving dividend capacity
60
MetLife
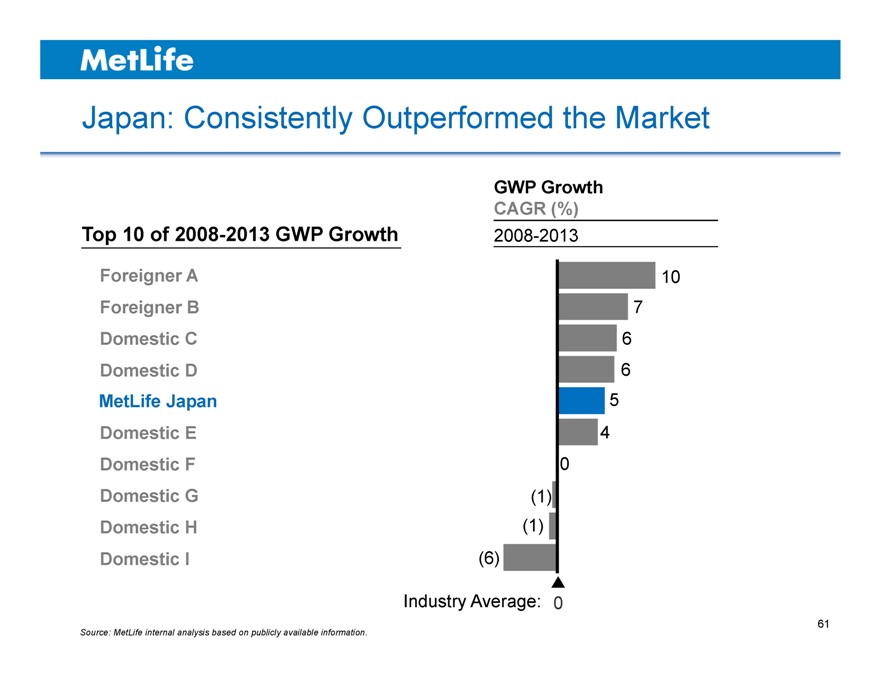
Japan: Consistently Outperformed the Market
GWP Growth
CAGR (%)
Top 10 of 2008-2013 GWP Growth 2008-2013
Foreigner A 10
Foreigner B 7
Domestic C 6
Domestic D 6
MetLife Japan 5
Domestic E 4
Domestic F 0
Domestic G (1)
Domestic H (1)
Domestic I (6)
Industry Average: 0
Source: MetLife internal analysis based on publicly available information.
61
MetLife
Japan: Macro Trends Driving Profitable Growth Opportunities
Social safety net under pressure
Growing reliance on private sector solutions Increasing affluent and senior population Shifting consumer purchasing patterns Potential growth opportunities from Abenomics
62
MetLife
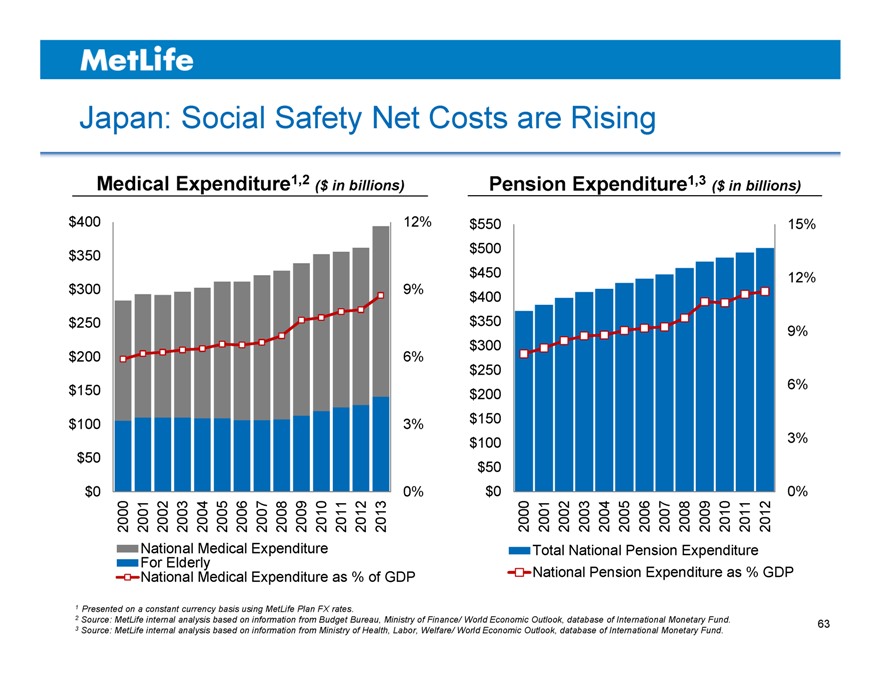
Japan: Social Safety Net Costs are Rising
Medical Expenditure1,2 ($ in billions) Pension Expenditure1,3 ($ in billions)
$400 12% $550 15%
$350 $500
$450 12%
$300 9% $400
$250 $350 9%
$300
$200 6%
$250
$150 $200 6%
$100 3% $150
$100 3%
$50 $50
$0 0% $0 0%
2000 2001 2002 2003 2004 2005 2006 2007 2008 2009 2010 2011 2012 2013 2000 2001 2002 2003 2004 2005 2006 2007 2008 2009 2010 2011 2012
National Medical Expenditure Total National Pension Expenditure
For Elderly
National Medical Expenditure as % of GDP National Pension Expenditure as % GDP
1 | | Presented on a constant currency basis using MetLife Plan FX rates. |
2 Source: MetLife internal analysis based on information from Budget Bureau, Ministry of Finance/ World Economic Outlook, database of International Monetary Fund.
3 Source: MetLife internal analysis based on information from Ministry of Health, Labor, Welfare/ World Economic Outlook, database of International Monetary Fund.
63
MetLife
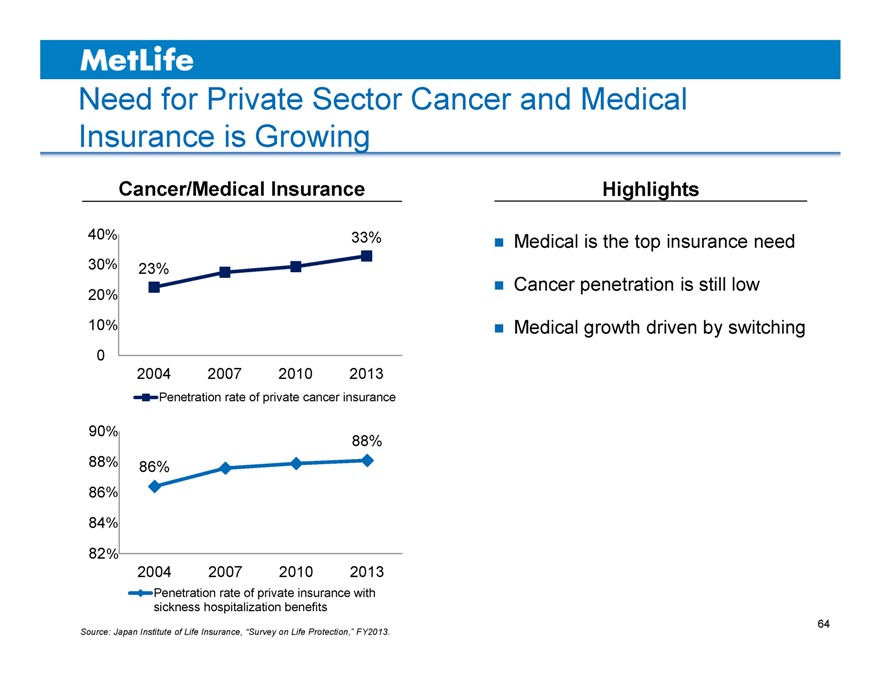
Need for Private Sector Cancer and Medical Insurance is Growing
Cancer/Medical Insurance
40% 33%
30% 23%
20%
10%
0
2004 2007 2010 2013
Penetration rate of private cancer insurance
90% 88%
88% 86%
86%
84%
82%
2004 2007 2010 2013
Penetration rate of private insurance with
sickness hospitalization benefits
Highlights
Medical is the top insurance need Cancer penetration is still low Medical growth driven by switching
Source: Japan Institute of Life Insurance, “Survey on Life Protection,” FY2013.
64
MetLife
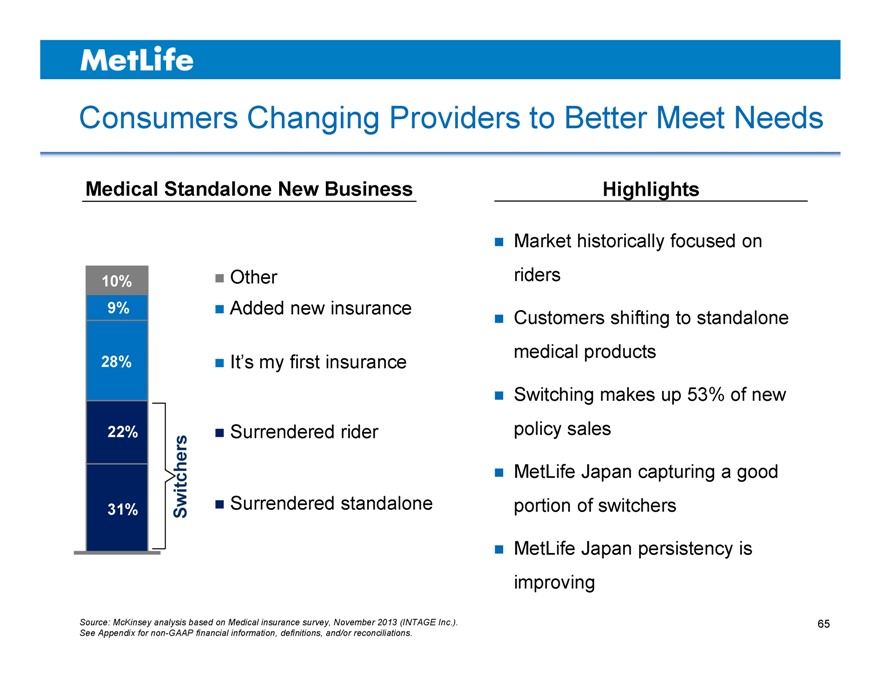
Consumers Changing Providers to Better Meet Needs
Medical Standalone New Business
10% Other
9% Added new insurance
28% It’s my first insurance
22% Surrendered rider
31% Switchers Surrendered standalone
Highlights
Market historically focused on riders
Customers shifting to standalone medical products
Switching makes up 53% of new policy sales
MetLife Japan capturing a good portion of switchers
MetLife Japan persistency is improving
Source: McKinsey analysis based on Medical insurance survey, November 2013 (INTAGE Inc.). See Appendix for non-GAAP financial information, definitions, and/or reconciliations.
65
MetLife
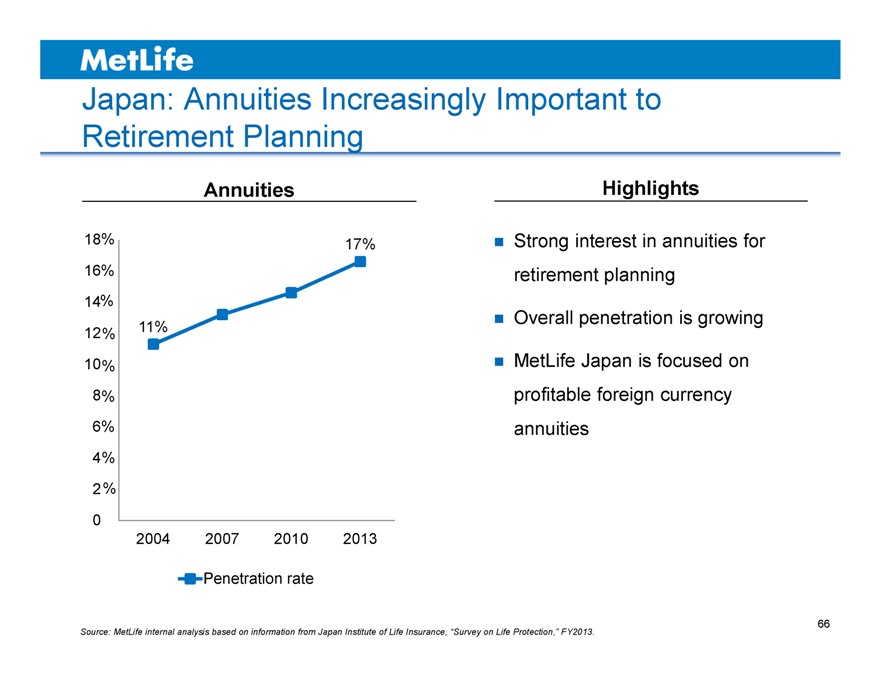
Japan: Annuities Increasingly Important to Retirement Planning
Annuities
18% 17%
16%
14%
12% 11%
10%
8%
6%
4%
0
2004 2007 2010 2013
Penetration rate
Highlights
Strong interest in annuities for retirement planning
Overall penetration is growing
MetLife Japan is focused on profitable foreign currency annuities
Source: MetLife internal analysis based on information from Japan Institute of Life Insurance, “Survey on Life Protection,” FY2013.
66
MetLife
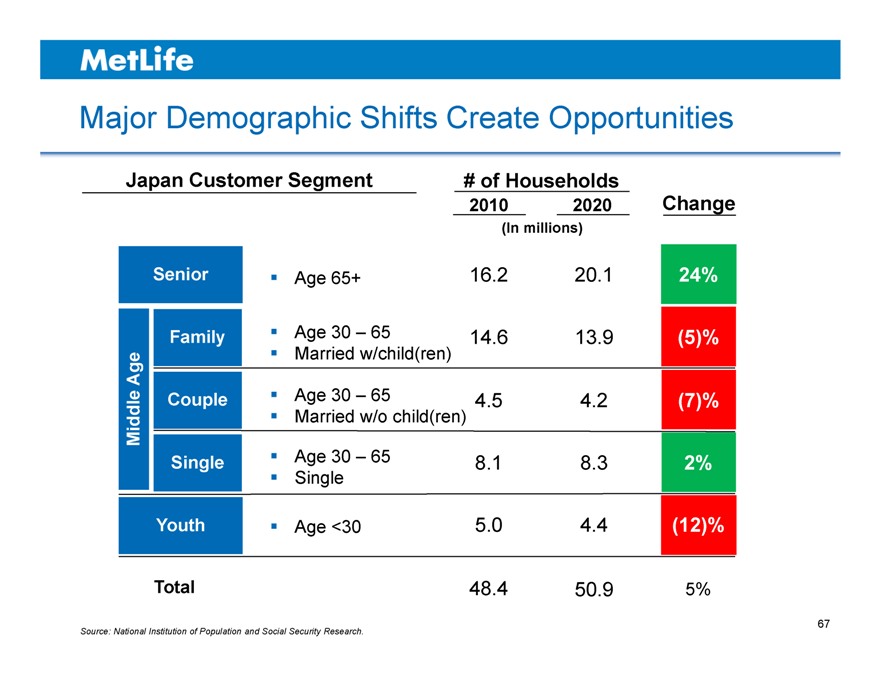
Major Demographic Shifts Create Opportunities
Japan Customer Segment # of Households
2010 2020 Change
(In millions)
Senior Age 65+ 16.2 20.1 24%
Family Age 30 – 65 14.6 13.9 (5)%
Married w/child(ren)
Age
Couple Age 30 – 65 4.5 4.2 (7)%
Middle Married w/o child(ren)
Single Age 30 – 65 8.1 8.3 2%
Single
Youth Age <30 5.0 4.4 (12)%
Total 48.4 50.9 5%
67
MetLife
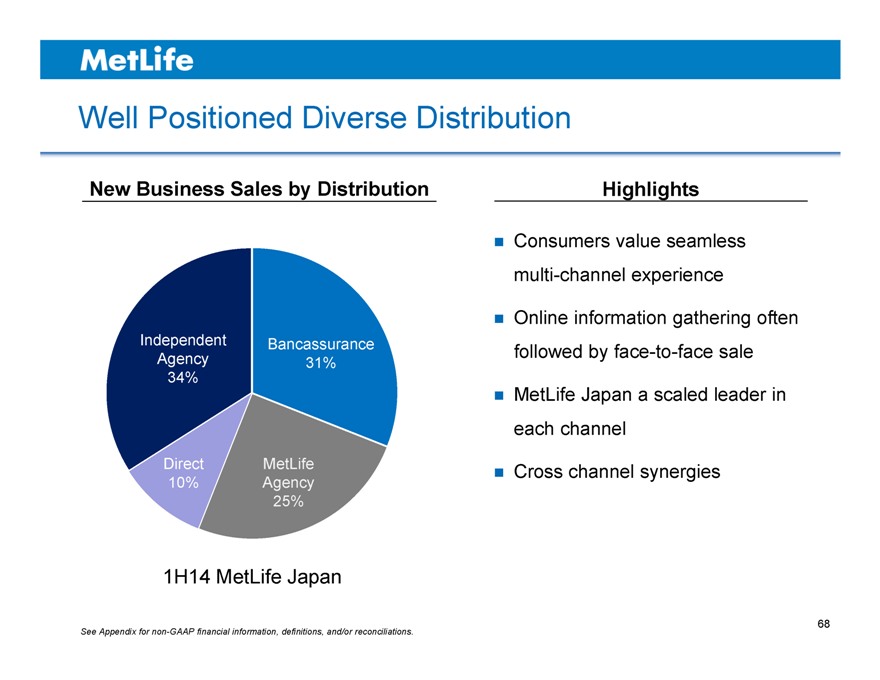
Well Positioned Diverse Distribution
New Business Sales by Distribution
Highlights
Independent Bancassurance
Agency 31%
34%
Direct MetLife
10% Agency
25%
1H14 MetLife Japan
Consumers value seamless multi-channel experience
Online information gathering often followed by face-to-face sale
MetLife Japan a scaled leader in each channel
Cross channel synergies
See Appendix for non-GAAP financial information, definitions, and/or reconciliations.
68
MetLife
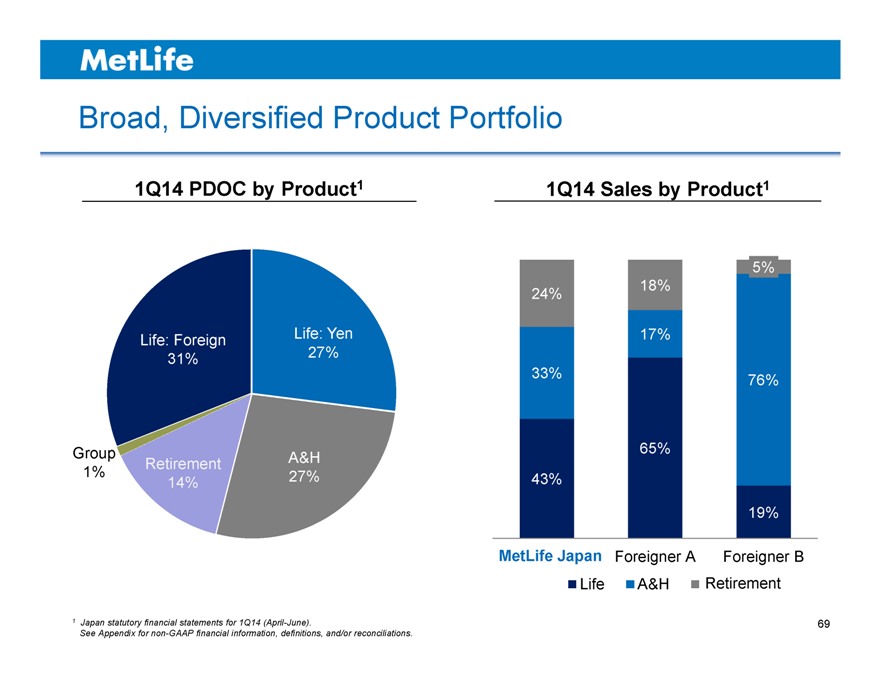
Broad, Diversified Product Portfolio
1Q14 PDOC by Product1
Life: Foreign Life: Yen 31% 27%
Group A&H Retirement
1% 27% 14%
1 | | Japan statutory financial statements for 1Q14 (April-June). |
See Appendix for non-GAAP financial information, definitions, and/or reconciliations.
1Q14 Sales by Product1
5%
24% 18%
17%
33% 76%
65%
43%
19%
MetLife Japan Foreigner A Foreigner B
Life A&H Retirement
69
MetLife
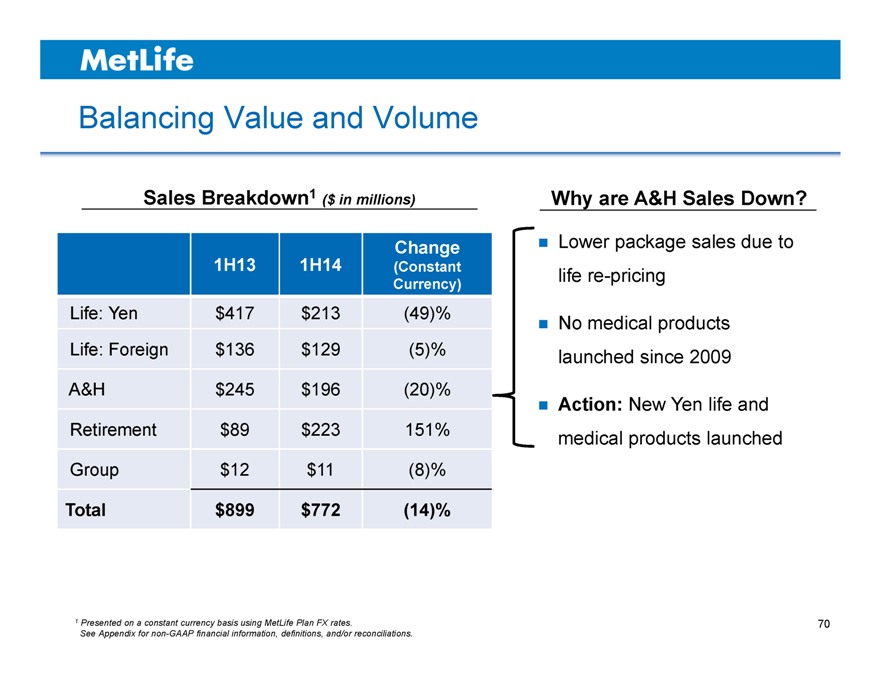
Balancing Value and Volume
Sales Breakdown1 ($ in millions)
Why are A&H Sales Down?
Change
1H13 1H14 (Constant
Currency)
Life: Yen $417 $213 (49)%
Life: Foreign $136 $129 (5)%
A&H $245 $196 (20)%
Retirement $89 $223 151%
Group $12 $11 (8)%
Total $899 $772 (14)%
Lower package sales due to life re-pricing
No medical products launched since 2009
Action: New Yen life and medical products launched
1 | | Presented on a constant currency basis using MetLife Plan FX rates. |
See Appendix for non-GAAP financial information, definitions, and/or reconciliations.
70
MetLife
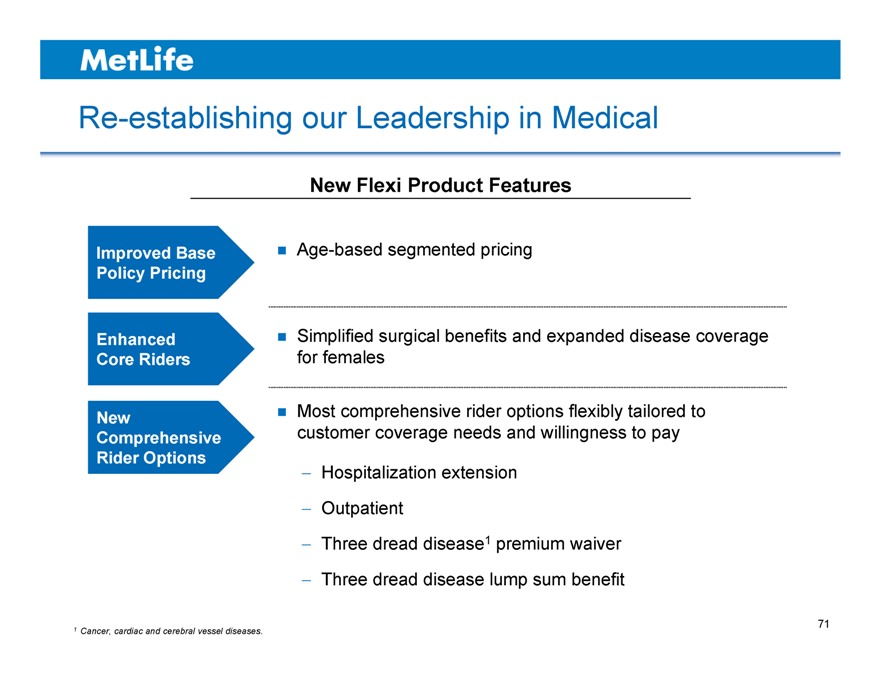
Re-establishing our Leadership in Medical
New Flexi Product Features
Improved Base Policy Pricing
Enhanced Core Riders
New
Comprehensive Rider Options
Age-based segmented pricing
Simplified surgical benefits and expanded disease coverage for females
Most comprehensive rider options flexibly tailored to customer coverage needs and willingness to pay
Hospitalization extension Outpatient
Three dread disease1 premium waiver Three dread disease lump sum benefit
71
MetLife
1 | | Cancer, cardiac and cerebral vessel diseases. |
71
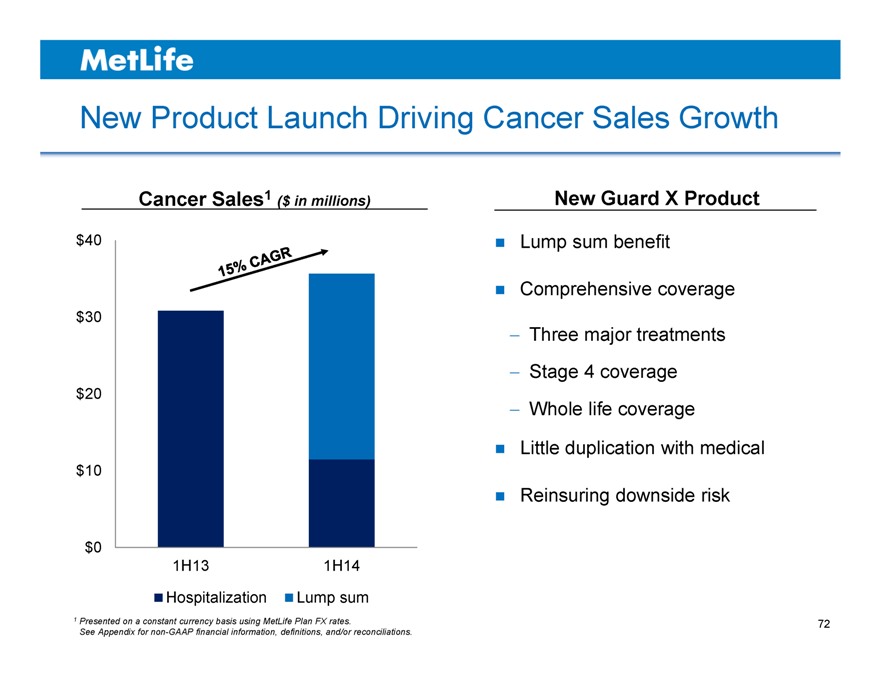
New Product Launch Driving Cancer Sales Growth
Cancer Sales1 ($ in millions)
$40
$30
$20
$10
$0
1H13 1H14
Hospitalization Lump sum
1 | | Presented on a constant currency basis using MetLife Plan FX rates. |
See Appendix for non-GAAP financial information, definitions, and/or reconciliations.
New Guard X Product
Lump sum benefit
Comprehensive coverage
Three major treatments Stage 4 coverage Whole life coverage
Little duplication with medical
Reinsuring downside risk
72
MetLife
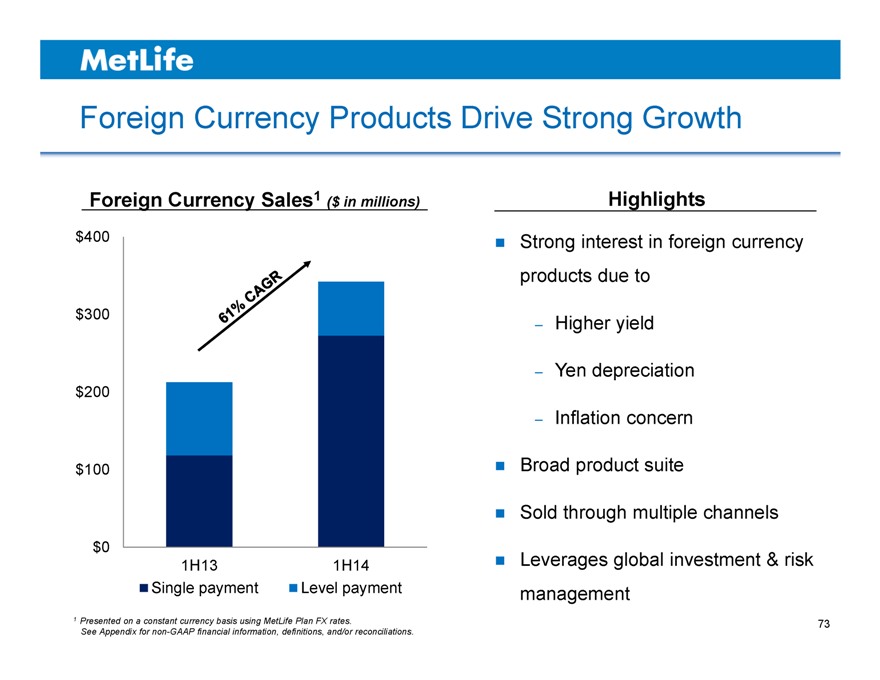
Foreign Currency Products Drive Strong Growth
Foreign Currency Sales1 ($ in millions)
$400
$300
$200
$100
$0
1H13 1H14
Single payment Level payment
Highlights
Strong interest in foreign currency products due to
– Higher yield
– Yen depreciation
– Inflation concern Broad product suite
Sold through multiple channels
Leverages global investment & risk management
1 | | Presented on a constant currency basis using MetLife Plan FX rates. |
See Appendix for non-GAAP financial information, definitions, and/or reconciliations.
73
MetLife
Key Takeaways
Significant opportunities for profitable growth Differentiated channel and product portfolio More focus on value and volume Growing in cancer and foreign currency products Re-establishing our leadership in medical
74
MetLife
Metlife
Koichiro Yamaguchi
Chief Distribution Officer MetLife Japan
September 17, 2014
ASIA INVESTOR DAY 2014
Metlife
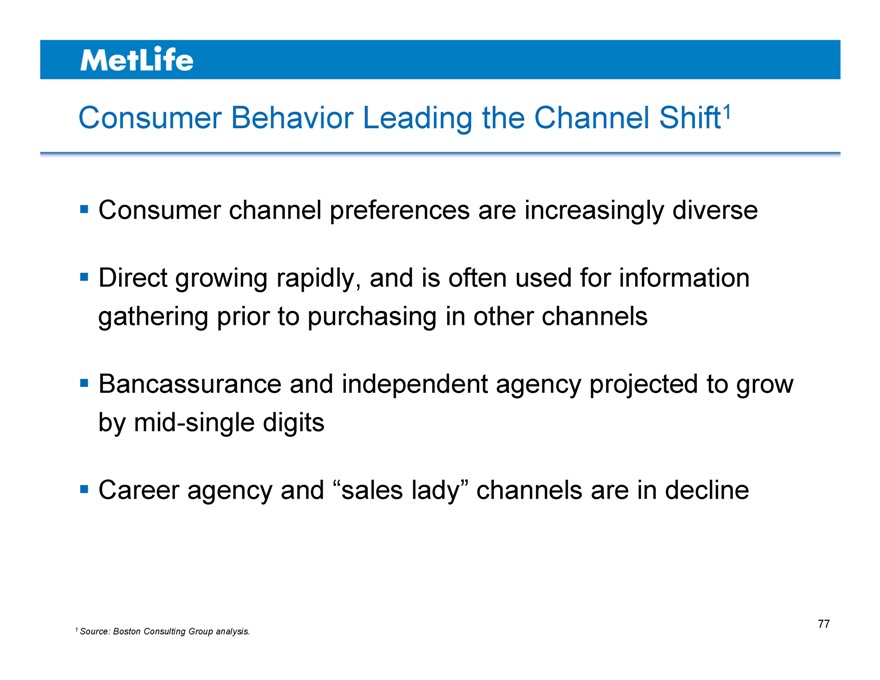
Consumer Behavior Leading the Channel Shift1
Consumer channel preferences are increasingly diverse
Direct growing rapidly, and is often used for information gathering prior to purchasing in other channels
Bancassurance and independent agency projected to grow by mid-single digits
Career agency and “sales lady” channels are in decline
1 | | Source: Boston Consulting Group analysis. |
77
Metlife
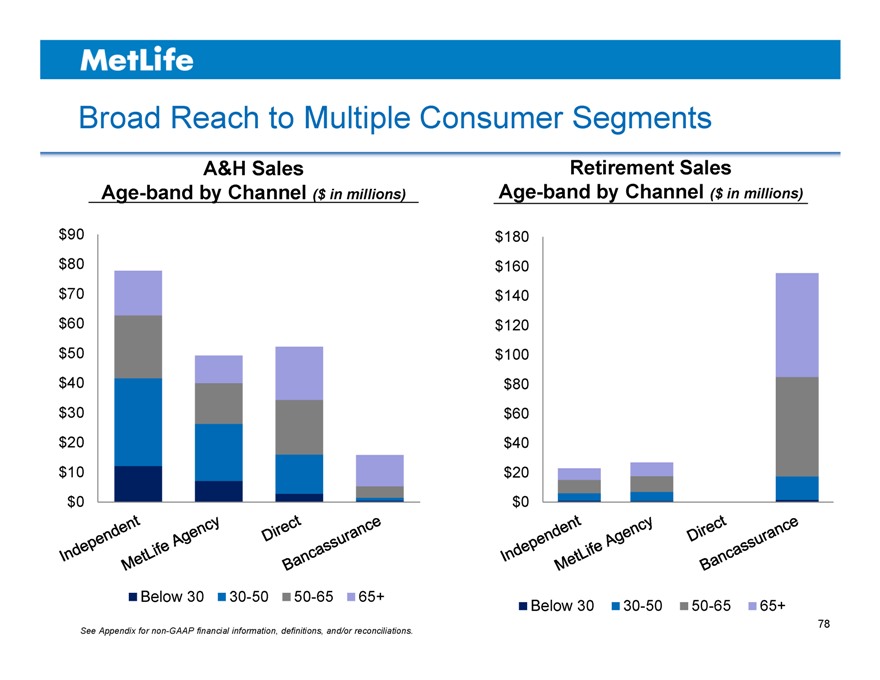
Broad Reach to Multiple Consumer Segments
A&H Sales
Age-band by Channel ($ in millions)
$90
$80
$70
$60
$50
$40
$30
$20
$10
$0
Below 30 30-50 50-65 65+
Retirement Sales
Age-band by Channel ($ in millions)
$180
$160
$140
$120
$100
$80
$60
$40
$20
$0
Below 30 30-50 50-65 65+
See Appendix for non-GAAP financial information, definitions, and/or reconciliations.
78
Metlife
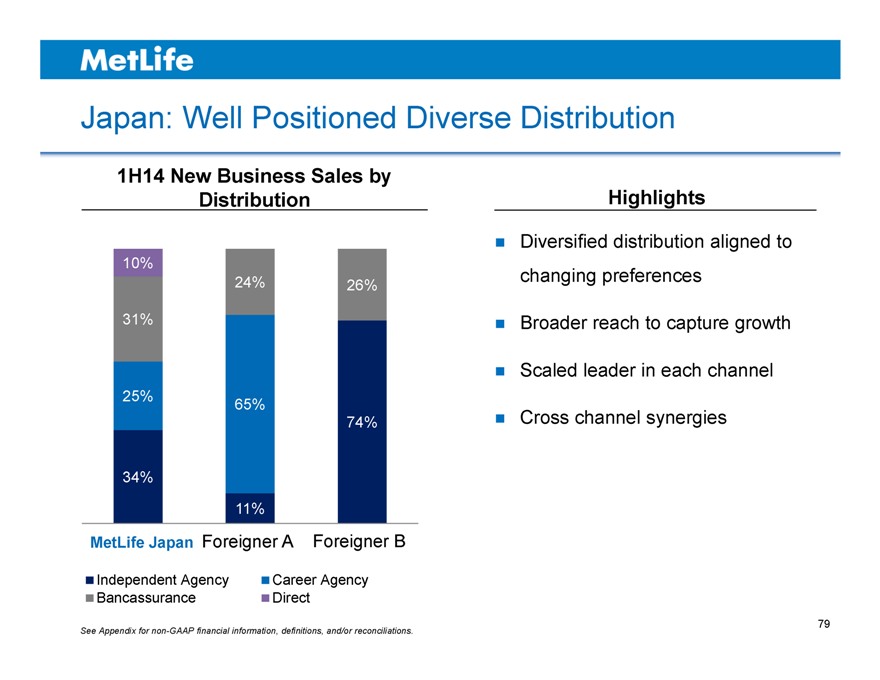
Japan: Well Positioned Diverse Distribution
1H14 New Business Sales by
Distribution
10%
24% 26%
31%
25% 65%
74%
34%
11%
MetLife Japan Foreigner A Foreigner B
Independent Agency Career Agency
Bancassurance Direct
See Appendix for non-GAAP financial information, definitions, and/or reconciliations.
Highlights
Diversified distribution aligned to changing preferences
Broader reach to capture growth Scaled leader in each channel Cross channel synergies
79
Metlife
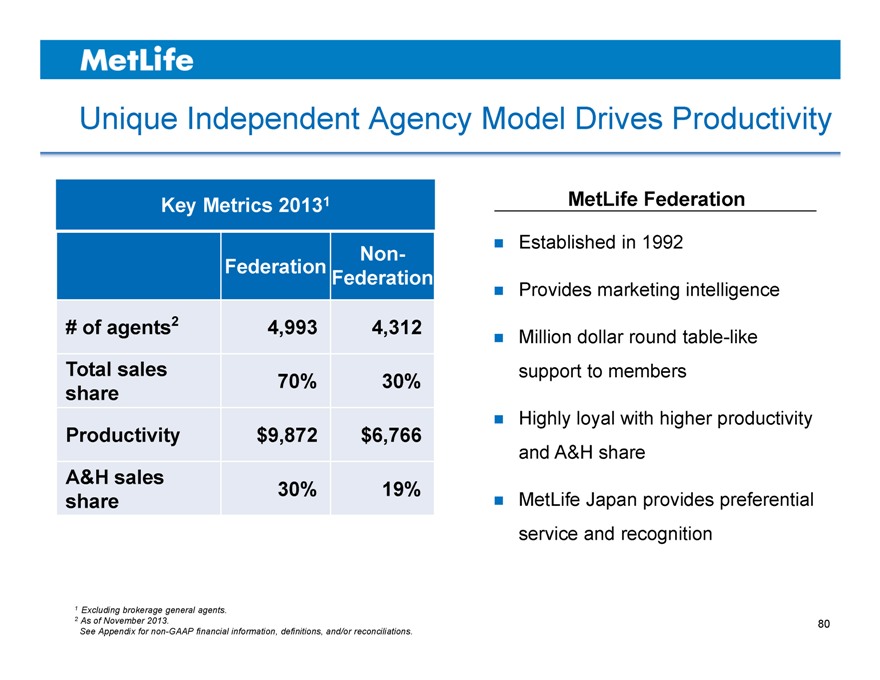
Unique Independent Agency Model Drives Productivity
Key Metrics 20131
Non-
Federation Federation
# of agents2 4,993 4,312
Total sales
share 70% 30%
Productivity $9,872 $6,766
A&H sales 30% 19%
share
MetLife Federation
Established in 1992
Provides marketing intelligence
Million dollar round table-like support to members
Highly loyal with higher productivity and A&H share
MetLife Japan provides preferential service and recognition
1 | | Excluding brokerage general agents. |
See Appendix for non-GAAP financial information, definitions, and/or reconciliations.
80
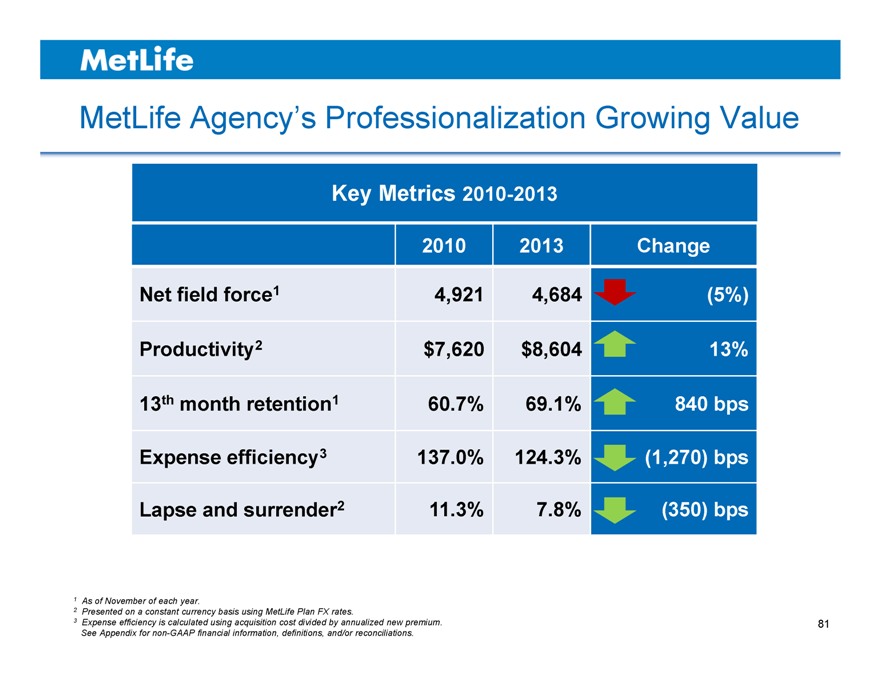
MetLife Agency’s Professionalization Growing Value
Key Metrics 2010-2013
2010 2013 Change
Net field force1 4,921 4,684 (5%)
Productivity2 $7,620 $8,604 13%
13th month retention1 60.7% 69.1% 840 bps
Expense efficiency3 137.0% 124.3% (1,270) bps
Lapse and surrender2 11.3% 7.8% (350) bps
1 As of November of each year.
2 Presented on a constant currency basis using MetLife Plan FX rates.
3 Expense efficiency is calculated using acquisition cost divided by annualized new premium. See Appendix for non-GAAP financial information, definitions, and/or reconciliations.
81
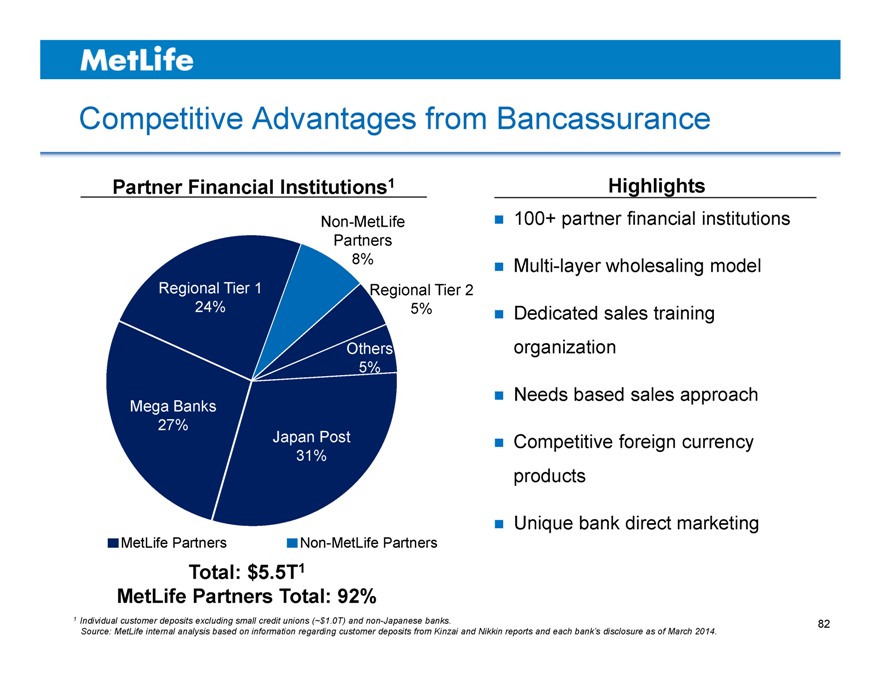
Competitive Advantages from Bancassurance
Partner Financial Institutions1
Non-MetLife Partners 8%
Regional Tier 2 5%
Regional Tier 1 24%
Others 5%
Mega banks 27%
Japan post 31%
Others 5%
Mega Banks 27%
Japan Post 31%
MetLife Partners Non-MetLife Partners
Highlights
100+ partner financial institutions
Multi-layer wholesaling model
Dedicated sales training organization
Needs based sales approach
Competitive foreign currency products
Unique bank direct marketing
Total: $5.5T1 MetLife Partners Total: 92%
1 Individual customer deposits excluding small credit unions (~$1.0T) and non-Japanese banks.
Source: MetLife internal analysis based on information regarding customer deposits from Kinzai and Nikkin reports and each bank’s disclosure as of March 2014.
82
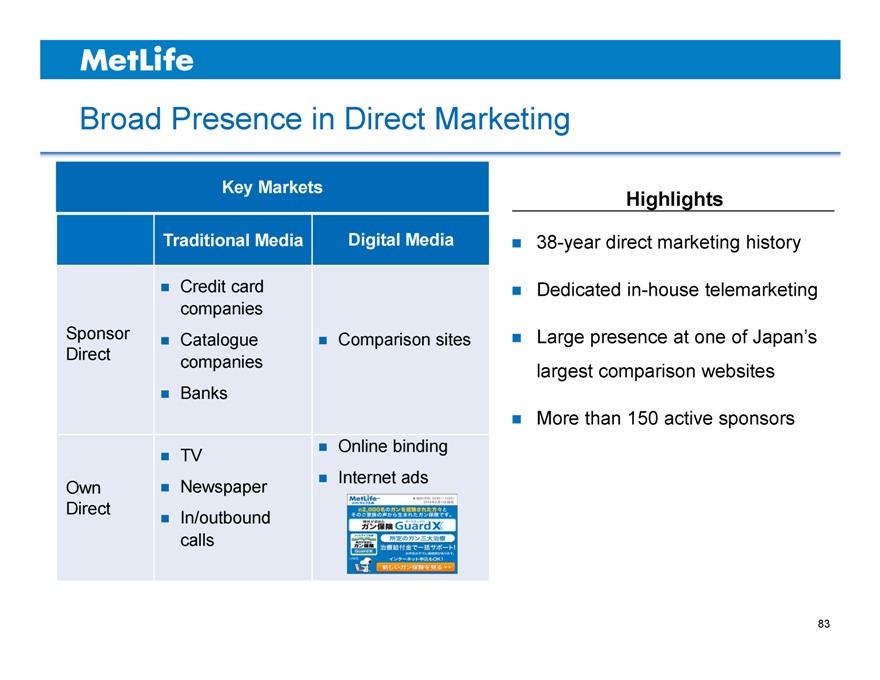
Broad Presence in Direct Marketing
Key Markets
Traditional Media Digital Media
Credit card
companies
Sponsor Catalogue Comparison sites
Direct companies
Banks
TV Online binding
Own Newspaper Internet ads
Direct In/outbound
calls
Highlights
38-year direct marketing history Dedicated in-house telemarketing
Large presence at one of Japan’s largest comparison websites
More than 150 active sponsors
83
Key Takeaways
Diversified multi-channel platform offers consumers choice Steady growth in direct marketing, both on- and offline High productivity from differentiated independent agency Professionalizing career agency to create value Accessing senior affluent market through bancassurance
84
MetLife
Atsushi Yagai
Chief Customer Marketing Officer MetLife Japan
September 17, 2014
ASIA INVESTOR DAY 2014
Rebranding to MetLife Accelerates Global Leverage
Bolshoi Ballet tour sponsorship Ladies Professional Golf Association sponsorship
Major League Baseball signage MetLife Badminton World Federation World Super Series
87
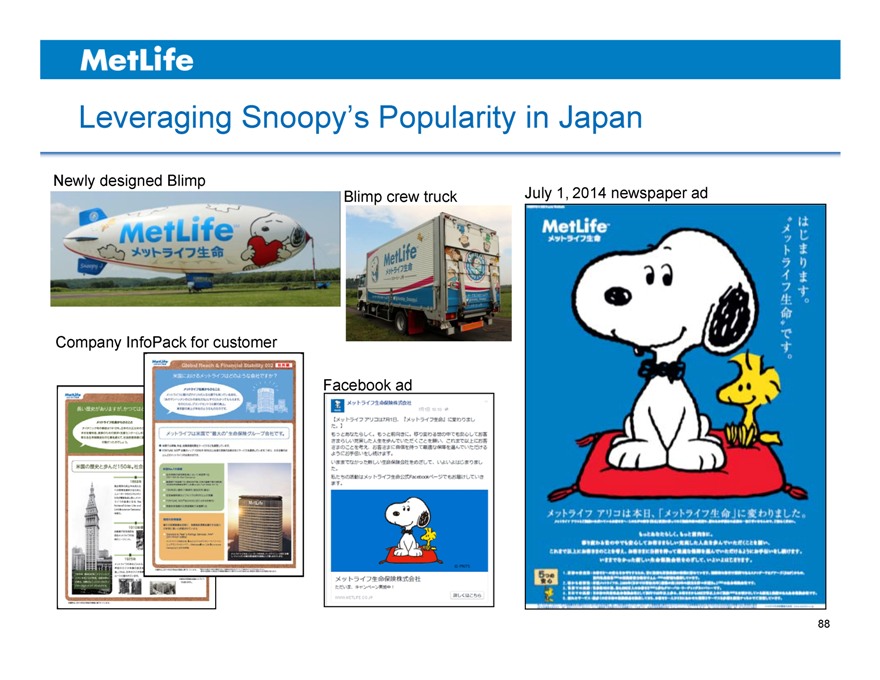
Leveraging Snoopy’s Popularity in Japan
Newly designed Blimp
Blimp crew truck July 1, 2014 newspaper ad
Company InfoPack for customer
Facebook ad
88
Commercial—Medical Insurance Flexi
The full video is available at http://investor.metlife.com. All other information contained on MetLife’s website is not a part of this presentation.
89
Commercial—Flexi Gold
The full video is available at http://investor.metlife.com. All other information contained on MetLife’s website is not a part of this presentation.
90
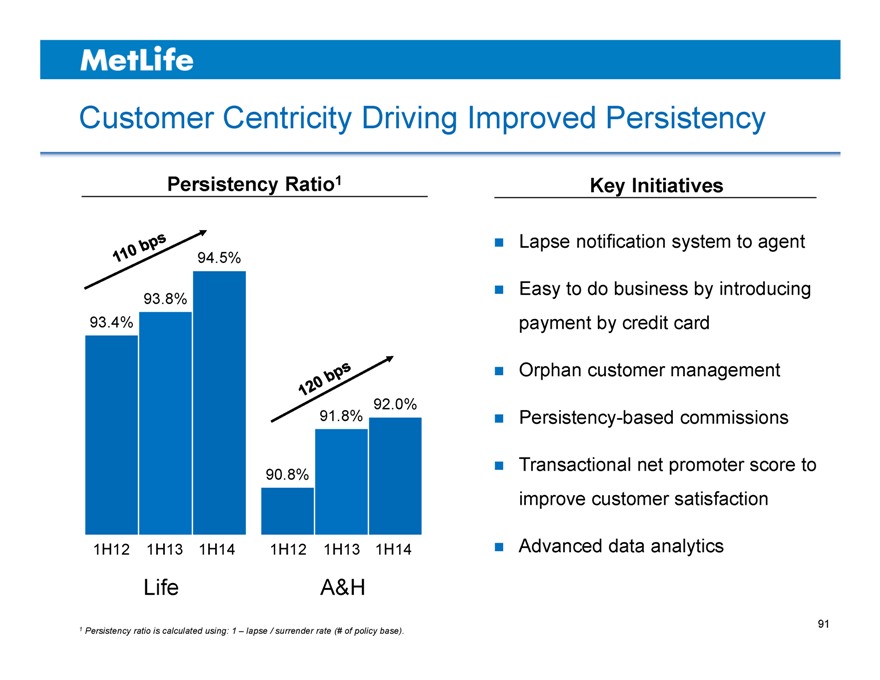
Customer Centricity Driving Improved Persistency
Persistency Ratio1
94.5%
93.8%
93.4%
91.8% 92.0%
90.8%
1H12 1H13 1H14 1H12 1H13 1H14
Key Initiatives
Lapse notification system to agent
Easy to do business by introducing payment by credit card
Orphan customer management
Persistency-based commissions
Transactional net promoter score to improve customer satisfaction
Advanced data analytics
Life A&H
1 Persistency ratio is calculated using: 1 – lapse / surrender rate (# of policy base).
91
Key Takeaways
Intense focus on improving persistency Persistency improving faster than the industry1 Room for further persistency improvements Rebranding better leverages our global brand assets Consumer affinity with Snoopy driving brand awareness
1 Source: Hoken Kenkyujo Ltd. Statistics of Life Insurance Business in Japan FY2008-2012 and LIAJ (Life Insurance Association of Japan), FY2013.
92
Metlife
Greg Brennan
Chief Financial Officer MetLife Japan
September 17, 2014
ASIA INVESTOR DAY 2014
Introduction
Core business performing solidly
Medical revenue growth driven by persistency Operating expense ratio continues to improve Japan SMR sound and well above minimum Interest rate sensitivities actively managed
See Appendix for non-GAAP financial information, definitions and/or reconciliations.
95
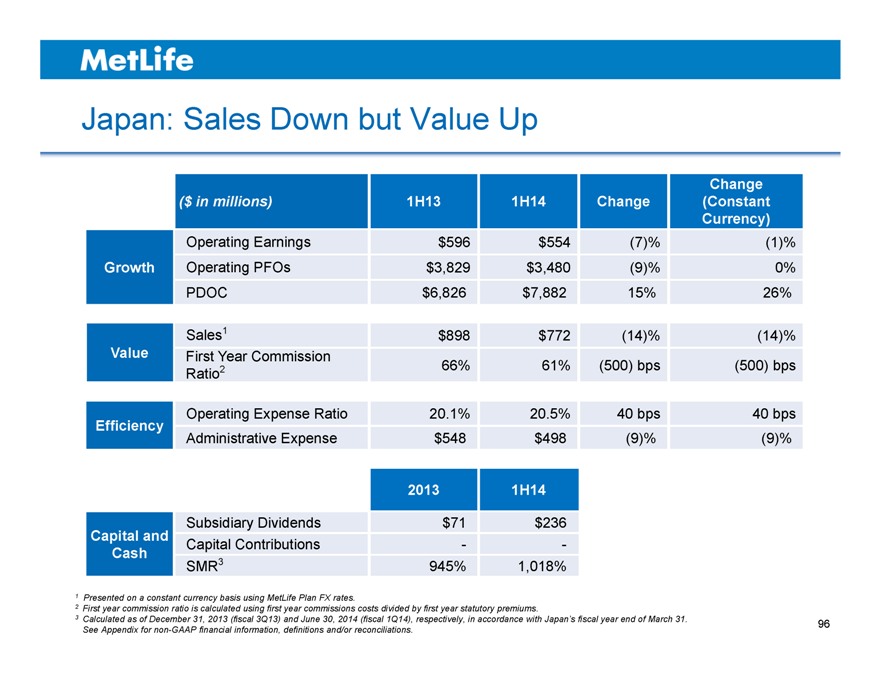
Japan: Sales Down but Value Up
Change
($ in millions) 1H13 1H14 Change (Constant
Currency)
Operating Earnings $596 $554 (7)% (1)%
Growth Operating PFOs $3,829 $3,480 (9)% 0%
PDOC $6,826 $7,882 15% 26%
Sales1 $898 $772 (14)% (14)%
Value First Year Commission
Ratio2 66% 61% (500) bps (500) bps
Operating Expense Ratio 20.1% 20.5% 40 bps 40 bps
Efficiency
Administrative Expense $548 $498 (9)% (9)%
2013 1H14
Subsidiary Dividends $71 $236
Capital and Capital Contributions ——
Cash
SMR3 945% 1,018%
1 Presented on a constant currency basis using MetLife Plan FX rates.
2 First year commission ratio is calculated using first year commissions costs divided by first year statutory premiums.
3 Calculated as of December 31, 2013 (fiscal 3Q13) and June 30, 2014 (fiscal 1Q14), respectively, in accordance with Japan’s fiscal year end of March 31. See Appendix for non-GAAP financial information, definitions and/or reconciliations.
96
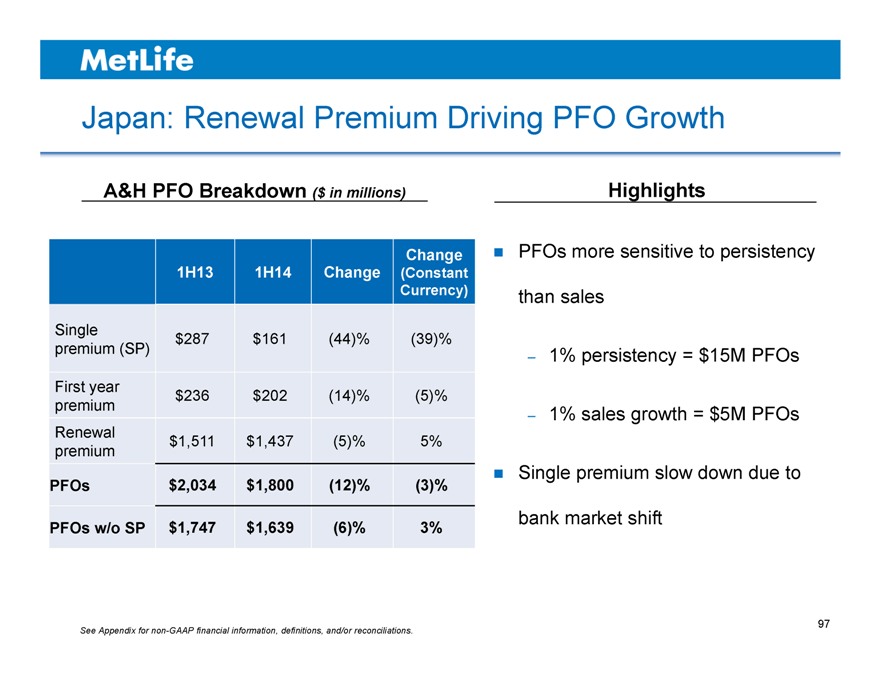
Japan: Renewal Premium Driving PFO Growth
A&H PFO Breakdown ($ in millions)
Change
1H13 1H14 Change (Constant
Currency)
Single $287 $161 (44)% (39)%
premium (SP)
First year $236 $202 (14)% (5)%
premium
Renewal $1,511 $1,437 (5)% 5%
premium
PFOs $2,034 $1,800 (12)% (3)%
PFOs w/o SP $1,747 $1,639 (6)% 3%
Highlights
PFOs more sensitive to persistency
than sales
– 1% persistency = $15M PFOs
– 1% sales growth = $5M PFOs
Single premium slow down due to
bank market shift
See Appendix for non-GAAP financial information, definitions, and/or reconciliations.
97
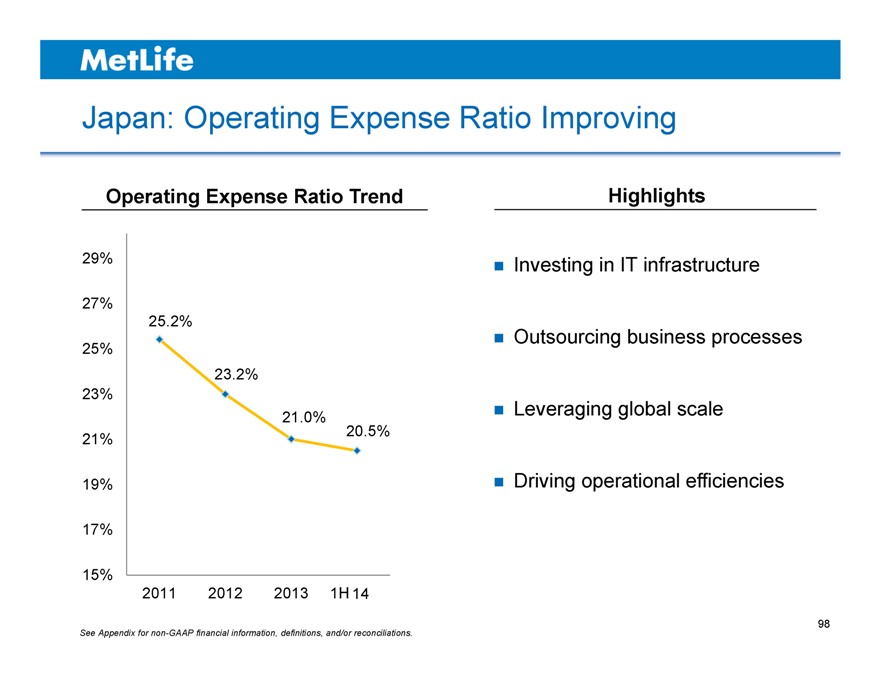
Japan: Operating Expense Ratio Improving
Operating Expense Ratio Trend
29%
27%
25.2%
25%
23.2%
23%
21.0%
21% 20.5%
19%
17%
15%
2011 2012 2013 1H 14
Highlights
Investing in IT infrastructure Outsourcing business processes Leveraging global scale Driving operational efficiencies
See Appendix for non-GAAP financial information, definitions, and/or reconciliations.
98
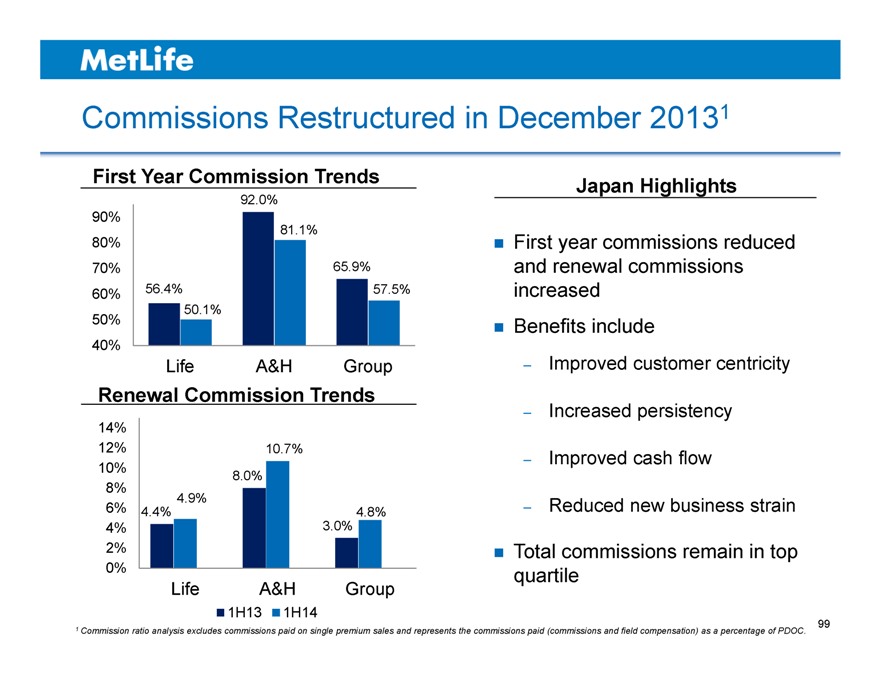
Commissions Restructured in December 20131
First Year Commission Trends
92.0%
90%
81.1%
80%
70% 65.9%
60% 56.4% 57.5%
50.1%
50%
40%
Life A&H Group
Renewal Commission Trends
14%
12% 10.7%
10% 8.0%
8%
4.9%
6% 4.4% 4.8%
4% 3.0%
2%
0%
Life A&H Group
1H13 1H14
Japan Highlights
First year commissions reduced and renewal commissions increased Benefits include
– Improved customer centricity
– Increased persistency
– Improved cash flow
– Reduced new business strain
Total commissions remain in top quartile
1 Commission ratio analysis excludes commissions paid on single premium sales and represents the commissions paid (commissions and field compensation) as a percentage of PDOC.
99
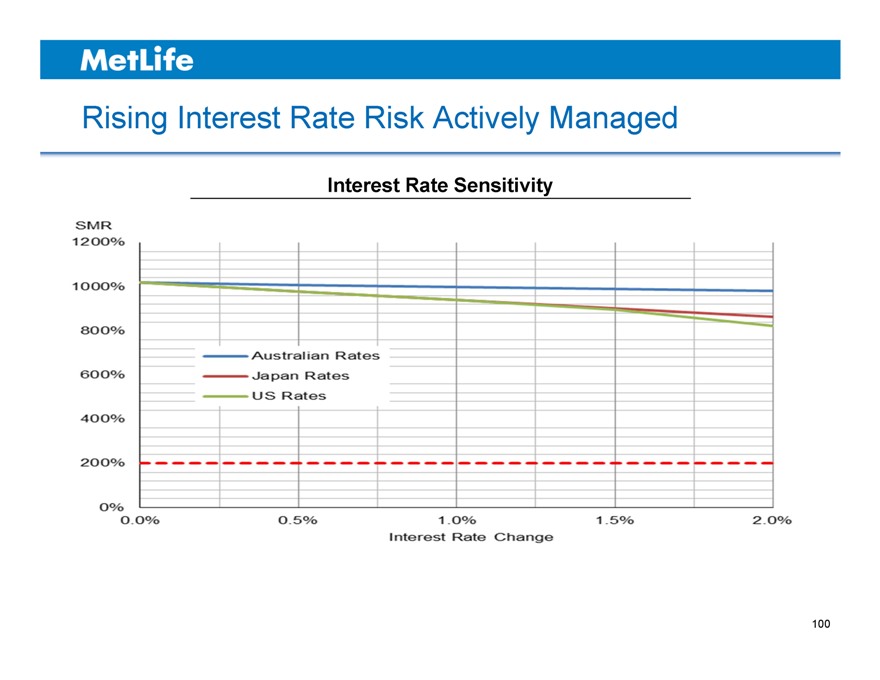
Rising Interest Rate Risk Actively Managed
Interest Rate Sensitivity
100
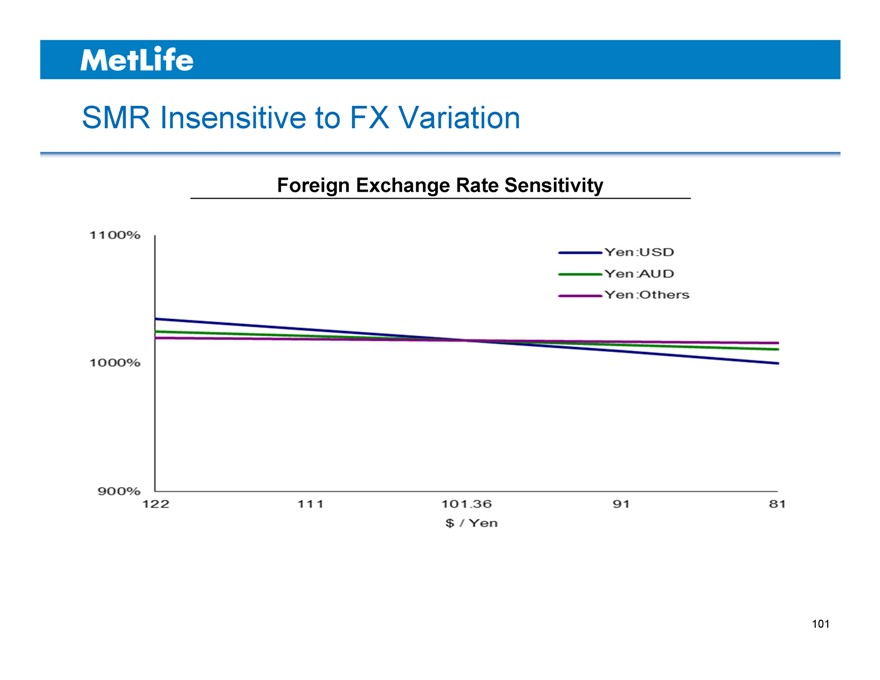
SMR Insensitive to FX Variation
Foreign Exchange Rate Sensitivity
101
Key Takeaways
Core business performing solidly
Medical revenue growth driven by persistency Operating expense ratio continues to improve Japan SMR sound and well above minimum Interest rate sensitivities actively managed
See Appendix for non-GAAP financial information, definitions and/or reconciliations.
102
MetLife
Christopher G. Townsend
President Asia
September 17, 2014
ASIA INVESTOR DAY 2014
Closing Remarks
Asia is the growth engine for the Industry
Well positioned in Japan; strong growth in key markets Investment in capabilities to win Consistent performance and improving cash generation
105
MetLife
Appendix
September 17, 2014
ASIA INVESTOR DAY 2014
Safe Harbor Statement
This presentation may contain or incorporate by reference information that includes or is based upon forward-looking statements within the meaning of the Private Securities Litigation Reform Act of 1995. Forward-looking statements give expectations or forecasts of future events. These statements can be identified by the fact that they do not relate strictly to historical or current facts. They use words such as “anticipate,” “estimate,” “expect,” “project,” “intend,” “plan,” “believe” and other words and terms of similar meaning, or are tied to future periods, in connection with a discussion of future operating or financial performance. In particular, these include statements relating to future actions, prospective services or products, future performance or results of current and anticipated services or products, sales efforts, expenses, the outcome of contingencies such as legal proceedings, trends in operations and financial results.
Any or all forward-looking statements may turn out to be wrong. They can be affected by inaccurate assumptions or by known or unknown risks and uncertainties. Many such factors will be important in determining the actual future results of MetLife, Inc., its subsidiaries and affiliates. These statements are based on current expectations and the current economic environment. They involve a number of risks and uncertainties that are difficult to predict. These statements are not guarantees of future performance. Actual results could differ materially from those expressed or implied in the forward-looking statements. Risks, uncertainties, and other factors that might cause such differences include the risks, uncertainties and other factors identified in MetLife, Inc.’s filings with the U.S. Securities and Exchange Commission (the “SEC”). These factors include: (1) difficult conditions in the global capital markets; (2) increased volatility and disruption of the capital and credit markets, which may affect our ability to meet liquidity needs and access capital, including through our credit facilities, generate fee income and market-related revenue and finance statutory reserve requirements and may require us to pledge collateral or make payments related to declines in value of specified assets, including assets supporting risks ceded to certain of our captive reinsurers or hedging arrangements associated with those risks; (3) exposure to financial and capital market risks, including as a result of the disruption in Europe; (4) impact of comprehensive financial services regulation reform on us, as a potential non-bank systemically important financial institution, or otherwise; (5) numerous rulemaking initiatives required or permitted by the Dodd-Frank Wall Street Reform and Consumer Protection Act which may impact how we conduct our business, including those compelling the liquidation of certain financial institutions; (6) regulatory, legislative or tax changes relating to our insurance, international, or other operations that may affect the cost of, or demand for, our products or services, or increase the cost or administrative burdens of providing benefits to employees; (7) adverse results or other consequences from litigation, arbitration or regulatory investigations; (8) potential liquidity and other risks resulting from our participation in a securities lending program and other transactions; (9) investment losses and defaults, and changes to investment valuations; (10) changes in assumptions related to investment valuations, deferred policy acquisition costs, deferred sales inducements, value of business acquired or goodwill; (11) impairments of goodwill and realized losses or market value impairments to illiquid assets; (12) defaults on our mortgage loans; (13) the defaults or deteriorating credit of other financial institutions that could adversely affect us; (14) economic, political, legal, currency and other risks relating to our international operations, including with respect to fluctuations of exchange rates; (15) downgrades in our claims paying ability, financial strength or credit ratings; (16) a deterioration in the experience of the “closed block” established in connection with the reorganization of Metropolitan Life Insurance Company; (17) availability and effectiveness of reinsurance or indemnification arrangements, as well as any default or failure of counterparties to perform; (18) differences between actual claims experience and underwriting and reserving assumptions; (19) ineffectiveness of risk management
108
Safe Harbor Statement (Continued)
policies and procedures; (20) catastrophe losses; (21) increasing cost and limited market capacity for statutory life insurance reserve financings; (22) heightened competition, including with respect to pricing, entry of new competitors, consolidation of distributors, the development of new products by new and existing competitors, and for personnel; (23) exposure to losses related to variable annuity guarantee benefits, including from significant and sustained downturns or extreme volatility in equity markets, reduced interest rates, unanticipated policyholder behavior, mortality or longevity, and the adjustment for nonperformance risk; (24) our ability to address difficulties, unforeseen liabilities, asset impairments, or rating agency actions arising from business acquisitions, including our acquisition of American Life Insurance Company and Delaware American Life Insurance Company, and integrating and managing the growth of such acquired businesses, or arising from dispositions of businesses or legal entity reorganizations; (25) the dilutive impact on our stockholders resulting from the settlement of our outstanding common equity units; (26) regulatory and other restrictions affecting MetLife, Inc.’s ability to pay dividends and repurchase common stock; (27) MetLife, Inc.’s primary reliance, as a holding company, on dividends from its subsidiaries to meet debt payment obligations and the applicable regulatory restrictions on the ability of the subsidiaries to pay such dividends; (28) the possibility that MetLife, Inc.’s Board of Directors may influence the outcome of stockholder votes through the voting provisions of the MetLife Policyholder Trust; (29) changes in accounting standards, practices and/or policies; (30) increased expenses relating to pension and postretirement benefit plans, as well as health care and other employee benefits; (31) inability to protect our intellectual property rights or claims of infringement of the intellectual property rights of others; (32) inability to attract and retain sales representatives; (33) provisions of laws and our incorporation documents may delay, deter or prevent takeovers and corporate combinations involving MetLife; (34) the effects of business disruption or economic contraction due to disasters such as terrorist attacks, cyberattacks, other hostilities, or natural catastrophes, including any related impact on the value of our investment portfolio, our disaster recovery systems, cyber- or other information security systems and management continuity planning; (35) the effectiveness of our programs and practices in avoiding giving our associates incentives to take excessive risks; and (36) other risks and uncertainties described from time to time in MetLife, Inc.’s filings with the SEC.
MetLife, Inc. does not undertake any obligation to publicly correct or update any forward-looking statement if MetLife, Inc. later becomes aware that such statement is not likely to be achieved. Please consult any further disclosures MetLife, Inc. makes on related subjects in reports to the SEC.
109
Explanatory Note on Non-GAAP Financial Information
Any references in this presentation (except in this Explanatory Note on Non-GAAP Financial Information slide and this Appendix) to net income (loss), net income (loss) per share, operating earnings, operating earnings per share, book value per share, book value per share, excluding accumulated other comprehensive income (loss) (“AOCI”) premiums, fees and other revenues and operating return on equity, should be read as net income (loss) available to MetLife, Inc.‘s common shareholders, net income (loss) available to MetLife, Inc.‘s common shareholders per diluted common share, operating earnings available to common shareholders, operating earnings available to common shareholders per diluted common share, book value per common share, book value per common share, excluding AOCI, premiums, fees and other revenues (operating) and operating return on MetLife, Inc.’s common equity, excluding AOCI, respectively.
Operating earnings is the measure of segment profit or loss that MetLife uses to evaluate segment performance and allocate resources. Consistent with accounting principles generally accepted in the United States of America (“GAAP”) accounting guidance for segment reporting, operating earnings is MetLife’s measure of segment performance. Operating earnings is also a measure by which MetLife senior management’s and many other employees’ performance is evaluated for the purposes of determining their compensation under applicable compensation plans.
Operating earnings is defined as operating revenues less operating expenses, both net of income tax. Operating earnings available to common shareholders is defined as operating earnings less preferred stock dividends.
Operating revenues and operating expenses exclude results of discontinued operations and other businesses that have been or will be sold or exited by MetLife, Inc. and are referred to as divested businesses. Operating revenues also excludes net investment gains (losses) (“NIGL”) and net derivative gains (losses) (“NDGL”). Operating expenses also excludes goodwill impairments.
The following additional adjustments are made to GAAP revenues, in the line items indicated, in calculating operating revenues:
Universal life and investment-type product policy fees excludes the amortization of unearned revenue related to NIGL and NDGL and certain variable annuity guaranteed minimum income benefits (“GMIB”) fees (“GMIB Fees”);
Net investment income: (i) includes amounts for scheduled periodic settlement payments and amortization of premium on derivatives that are hedges of investments or that are used to replicate certain investments, but do not qualify for hedge accounting treatment, (ii) includes income from discontinued real estate operations, (iii) excludes post-tax operating earnings adjustments relating to insurance joint ventures accounted for under the equity method, (iv) excludes certain amounts related to contractholder-directed unit-linked investments, and (v) excludes certain amounts related to securitization entities that are variable interest entities (“VIEs”) consolidated under GAAP; and
Other revenues are adjusted for settlements of foreign currency earnings hedges.
110
Explanatory Note on Non-GAAP Financial Information (Continued)
The following additional adjustments are made to GAAP expenses, in the line items indicated, in calculating operating expenses:
Policyholder benefits and claims and policyholder dividends excludes: (i) changes in the policyholder dividend obligation related to NIGL and NDGL, (ii) inflation-indexed benefit adjustments associated with contracts backed by inflation-indexed investments and amounts associated with periodic crediting rate adjustments based on the total return of a contractually referenced pool of assets and other pass through adjustments, (iii) benefits and hedging costs related to GMIBs (“GMIB Costs”), and (iv) market value adjustments associated with surrenders or terminations of contracts (“Market Value Adjustments”);
Interest credited to policyholder account balances includes adjustments for scheduled periodic settlement payments and amortization of premium on derivatives that are hedges of policyholder account balances but do not qualify for hedge accounting treatment and excludes amounts related to net investment income earned on contractholder-directed unit-linked investments;
Amortization of deferred policy acquisition costs (“DAC”) and value of business acquired (“VOBA”) excludes amounts related to: (i) NIGL and NDGL, (ii) GMIB Fees and GMIB Costs, and (iii) Market Value Adjustments;
Amortization of negative VOBA excludes amounts related to Market Value Adjustments;
Interest expense on debt excludes certain amounts related to securitization entities that are VIEs consolidated under GAAP; and
Other expenses excludes costs related to: (i) noncontrolling interests, (ii) implementation of new insurance regulatory requirements, and (iii) acquisition and integration costs.
Operating earnings also excludes the recognition of certain contingent assets and liabilities that could not be recognized at acquisition or adjusted for during the measurement period under GAAP business combination accounting guidance.
In addition, operating return on MetLife, Inc.‘s common equity is defined as operating earnings available to common shareholders divided by average GAAP common equity.
Operating expense ratio is calculated by dividing operating expenses (other expenses net of capitalization of DAC) by premiums, fees and other revenues (operating).
111
Explanatory Note on Non-GAAP Financial Information (Continued)
MetLife believes the presentation of operating earnings and operating earnings available to common shareholders as MetLife measures it for management purposes enhances the understanding of the company’s performance by highlighting the results of operations and the underlying profitability drivers of the business. Operating revenues, operating expenses, operating earnings, operating earnings available to common shareholders, operating earnings available to common shareholders per diluted common share, book value per common share, excluding AOCI, book value per diluted common share, excluding AOCI, operating return on MetLife, Inc.’s common equity, operating return on MetLife, Inc.’s common equity, excluding AOCI, investment portfolio gains (losses) and derivative gains (losses) should not be viewed as substitutes for the following financial measures calculated in accordance with GAAP: GAAP revenues, GAAP expenses, income (loss) from continuing operations, net of income tax, net income (loss) available to MetLife, Inc.‘s common shareholders, net income (loss) available to MetLife, Inc.‘s common shareholders per diluted common share, book value per common share, book value per diluted common share, return on MetLife, Inc.’s common equity, return on MetLife, Inc.’s common equity, excluding AOCI, net investment gains (losses) and net derivative gains (losses), respectively. For the historical periods presented, reconciliations of non-GAAP measures used in this presentation and accompanying materials to the most directly comparable GAAP measures may be included in this Appendix to the presentation materials and/or are on the Investor Relations portion of our Internet website. Additional information about our historical results is also available on our Internet website in our Quarterly Financial Supplements for the corresponding periods.
The non-GAAP measures used in this presentation and accompanying materials should not be viewed as substitutes for the most directly comparable GAAP measures.
In this presentation and accompanying materials, we may refer to sales activity for various products. These sales statistics do not correspond to revenues under GAAP, but are used as relevant measures of business activity.
The impact of changes in foreign currency exchange rates is calculated using the average foreign currency exchange rates for the current period and is applied to each of the comparable periods.
In this presentation, we may provide forward-looking guidance on our future earnings, premiums, fees and other revenues, earnings per diluted common share, book value per common share and return on common equity on an operating or non-GAAP basis. A reconciliation of the non-GAAP measures to the most directly comparable GAAP measures is not accessible on a forward-looking basis because we believe it is not possible to provide other than a range of net investment gains and losses and net derivative gains and losses, which can fluctuate significantly within or outside the range and from period to period and may have a significant impact on GAAP net income.
In addition, we may provide estimated historical operating results for business that is not within a single reportable segment or Corporate & Other in this presentation. A reconciliation of non-GAAP measures to the most directly comparable GAAP measures is not accessible for such results, as we calculate GAAP results only for our reportable segments and Corporate & Other.
112
Definitions
Definitions
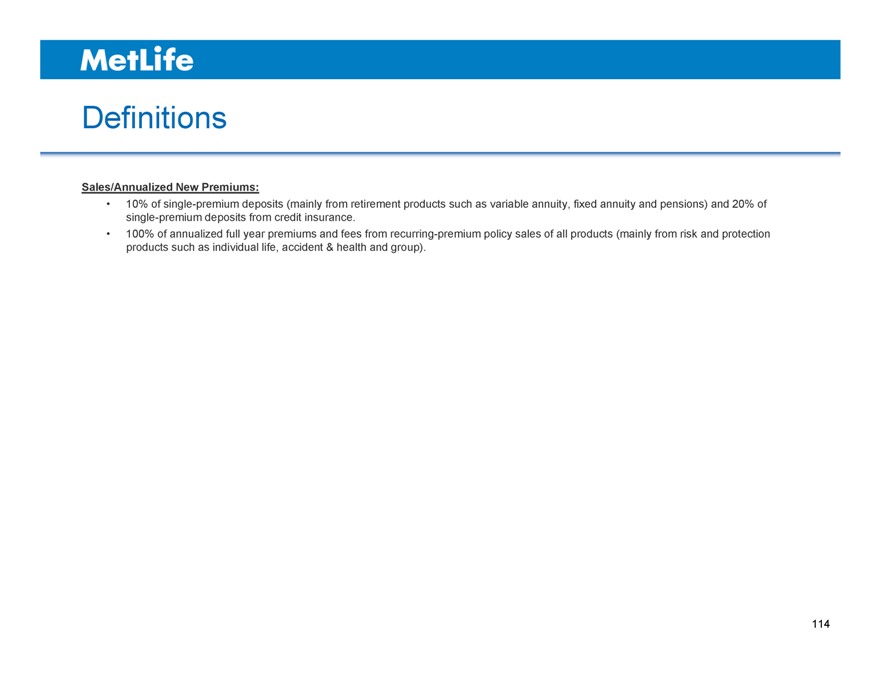
Sales/Annualized New Premiums:
10% of single-premium deposits (mainly from retirement products such as variable annuity, fixed annuity and pensions) and 20% of single-premium deposits from credit insurance.
100% of annualized full year premiums and fees from recurring-premium policy sales of all products (mainly from risk and protection products such as individual life, accident & health and group).
114
Reconciliations
Reconciliation of Operating Earnings Available to Common Shareholders to Net Income (Loss) Available to MetLife, Inc.’s Common Shareholders – Total Company
Six Months Ended June 30, 2014
Group, Voluntary Corporate Total Company
& Worksite Benefit Latin Corporate Total excluding
Retail Benefits Funding America Asia EMEA & Other Company Corporate & Other
($ in millions)
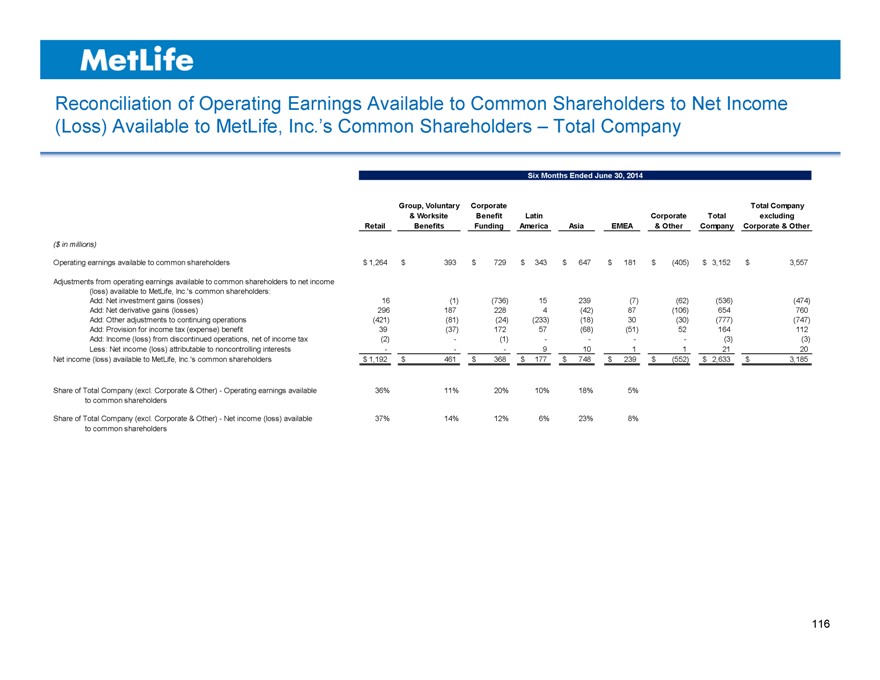
Operating earnings available to common shareholders $ 1,264 $ 393 $ 729 $ 343 $ 647 $ 181 $ (405) $ 3,152 $ 3,557
Adjustments from operating earnings available to common shareholders to net income
(loss) available to MetLife, Inc.‘s common shareholders:
Add: Net investment gains (losses) 16 (1) (736) 15 239 (7) (62) (536) (474)
Add: Net derivative gains (losses) 296 187 228 4 (42) 87 (106) 654 760
Add: Other adjustments to continuing operations (421) (81) (24) (233) (18) 30 (30) (777) (747)
Add: Provision for income tax (expense) benefit 39 (37) 172 57 (68) (51) 52 164 112
Add: Income (loss) from discontinued operations, net of income tax (2) — (1) ——— — (3) (3)
Less: Net income (loss) attributable to noncontrolling interests — —— 9 10 1 1 21 20
Net income (loss) available to MetLife, Inc.‘s common shareholders $ 1,192 $ 461 $ 368 $ 177 $ 748 $ 239 $ (552) $ 2,633 $ 3,185
Share of Total Company (excl. Corporate & Other)—Operating earnings available 36% 11% 20% 10% 18% 5%
to common shareholders
Share of Total Company (excl. Corporate & Other)—Net income (loss) available 37% 14% 12% 6% 23% 8%
to common shareholders
116
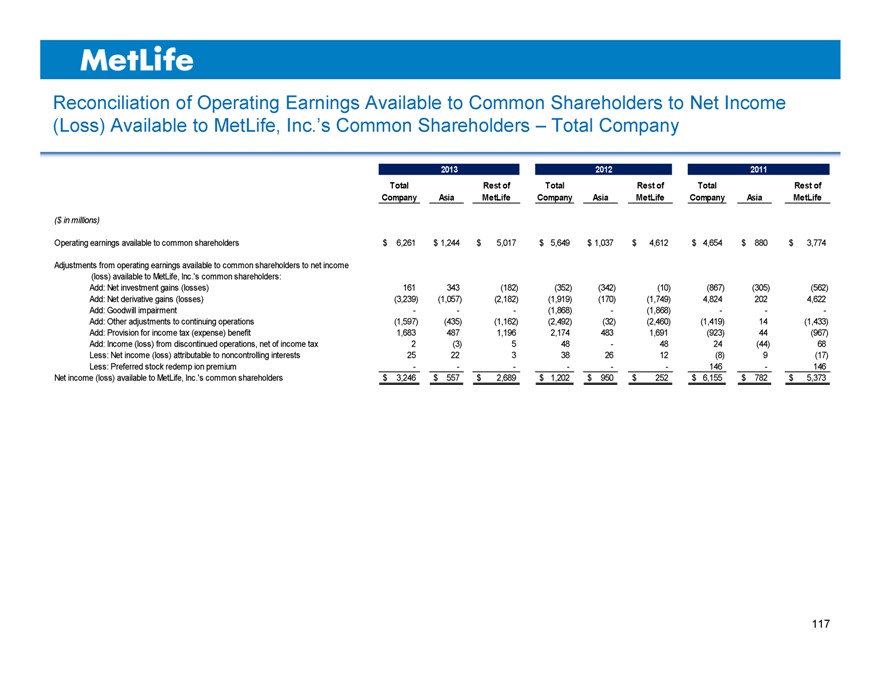
Reconciliation of Operating Earnings Available to Common Shareholders to Net Income (Loss) Available to MetLife, Inc.’s Common Shareholders – Total Company
2013 2012 2011
Total Rest of Total Rest of Total Rest of
Company Asia MetLife Company Asia MetLife Company Asia MetLife
($ in millions)
Operating earnings available to common shareholders $ 6,261 $ 1,244 $ 5,017 $ 5,649 $ 1,037 $ 4,612 $ 4,654 $ 880 $ 3,774
Adjustments from operating earnings available to common shareholders to net income
(loss) available to MetLife, Inc.‘s common shareholders:
Add: Net investment gains (losses) 161 343 (182) (352) (342) (10) (867) (305) (562)
Add: Net derivative gains (losses) (3,239) (1,057) (2,182) (1,919) (170) (1,749) 4,824 202 4,622
Add: Goodwill impairment ——— (1,868) — (1,868) —— -
Add: Other adjustments to continuing operations (1,597) (435) (1,162) (2,492) (32) (2,460) (1,419) 14 (1,433)
Add: Provision for income tax (expense) benefit 1,683 487 1,196 2,174 483 1,691 (923) 44 (967)
Add: Income (loss) from discontinued operations, net of income tax 2 (3) 5 48 — 48 24 (44) 68
Less: Net income (loss) attributable to noncontrolling interests 25 22 3 38 26 12 (8) 9 (17)
Less: Preferred stock redemp ion premium ————— — 146 — 146
Net income (loss) available to MetLife, Inc.‘s common shareholders $ 3,246 $ 557 $ 2,689 $ 1,202 $ 950 $ 252 $ 6,155 $ 782 $ 5,373
117
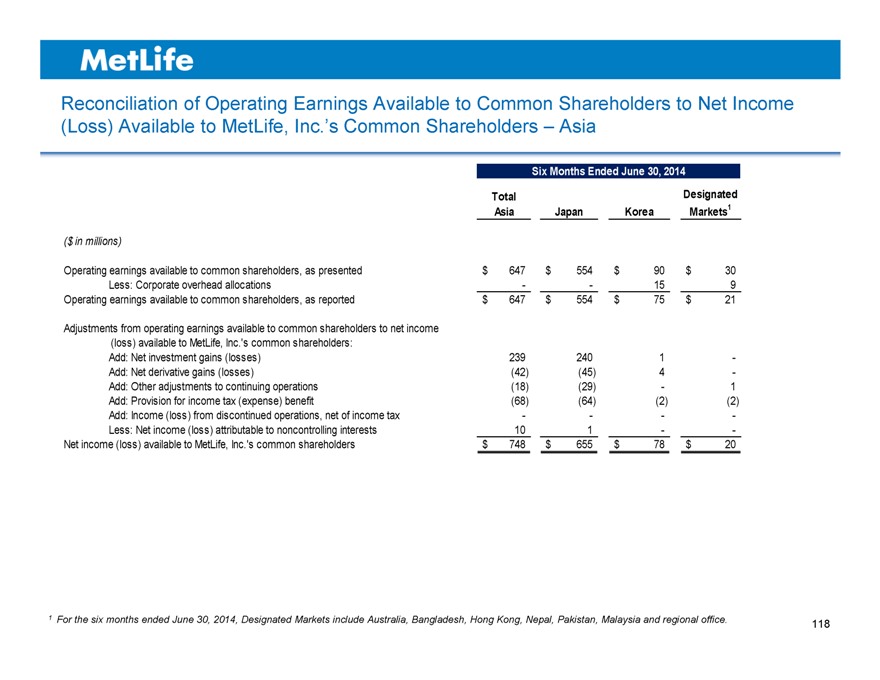
Reconciliation of Operating Earnings Available to Common Shareholders to Net Income (Loss) Available to MetLife, Inc.’s Common Shareholders – Asia
Six Months Ended June 30, 2014
Total Designated
Asia Japan Korea Markets1
($ in millions)
Operating earnings available to common shareholders, as presented $ 647 $ 554 $ 90 $ 30
Less: Corporate overhead allocations — — 15 9
Operating earnings available to common shareholders, as reported $ 647 $ 554 $ 75 $ 21
Adjustments from operating earnings available to common shareholders to net income
(loss) available to MetLife, Inc.‘s common shareholders:
Add: Net investment gains (losses) 239 240 1 -
Add: Net derivative gains (losses) (42) (45) 4 -
Add: Other adjustments to continuing operations (18) (29) — 1
Add: Provision for income tax (expense) benefit (68) (64) (2) (2)
Add: Income (loss) from discontinued operations, net of income tax — — — -
Less: Net income (loss) attributable to noncontrolling interests 10 1 — -
Net income (loss) available to MetLife, Inc.‘s common shareholders $ 748 $ 655 $ 78 $ 20
1 For the six months ended June 30, 2014, Designated Markets include Australia, Bangladesh, Hong Kong, Nepal, Pakistan, Malaysia and regional office.
118
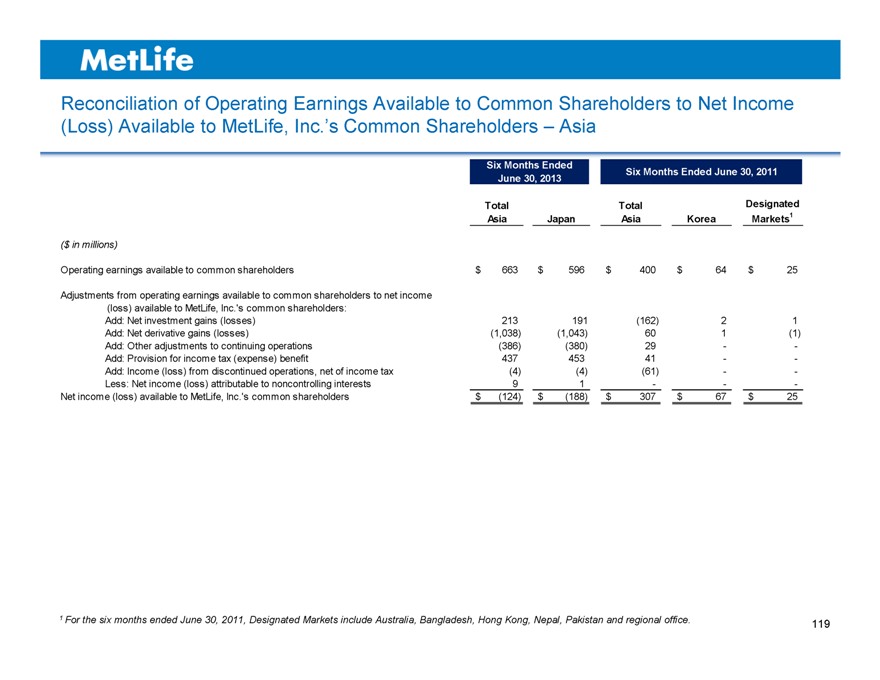
Reconciliation of Operating Earnings Available to Common Shareholders to Net Income (Loss) Available to MetLife, Inc.’s Common Shareholders – Asia
Six Months Ended Six Months Ended June 30, 2011
June 30, 2013
Total Total Designated
Asia Japan Asia Korea Markets1
($ in millions)
Operating earnings available to common shareholders $ 663 $ 596 $ 400 $ 64 $ 25
Adjustments from operating earnings available to common shareholders to net income
(loss) available to MetLife, Inc.‘s common shareholders:
Add: Net investment gains (losses) 213 191 (162) 2 1
Add: Net derivative gains (losses) (1,038) (1,043) 60 1 (1)
Add: Other adjustments to continuing operations (386) (380) 29 — -
Add: Provision for income tax (expense) benefit 437 453 41 — -
Add: Income (loss) from discontinued operations, net of income tax (4) (4) (61) — -
Less: Net income (loss) attributable to noncontrolling interests 9 1 — — -
Net income (loss) available to MetLife, Inc.‘s common shareholders $ (124) $ (188) $ 307 $ 67 $ 25
1 For the six months ended June 30, 2011, Designated Markets include Australia, Bangladesh, Hong Kong, Nepal, Pakistan and regional office.
119
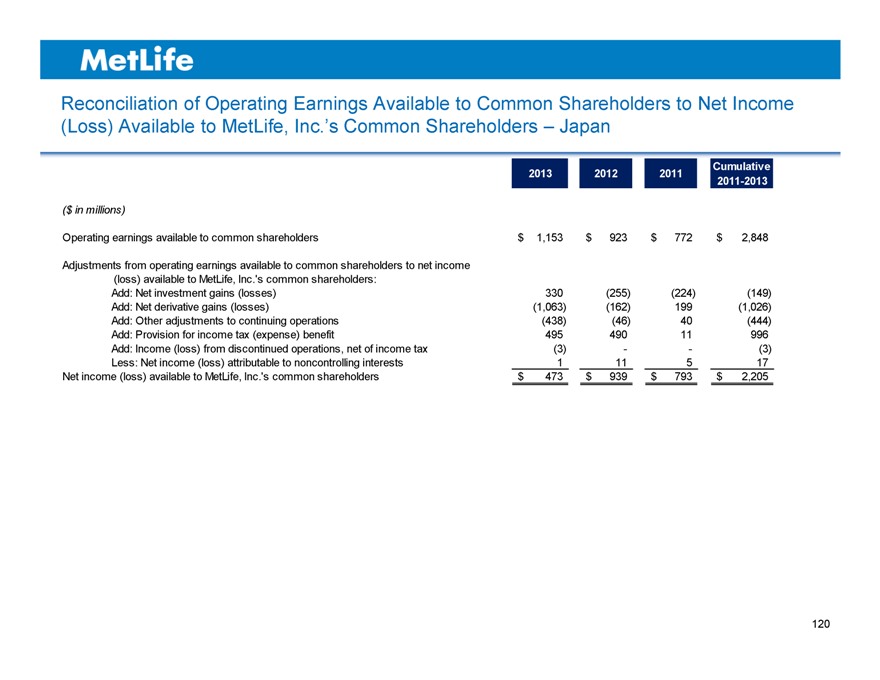
Reconciliation of Operating Earnings Available to Common Shareholders to Net Income (Loss) Available to MetLife, Inc.’s Common Shareholders – Japan
2013 2012 2011 Cumulative
2011-2013
($ in millions)
Operating earnings available to common shareholders $ 1,153 $ 923 $ 772 $ 2,848
Adjustments from operating earnings available to common shareholders to net income
(loss) available to MetLife, Inc.‘s common shareholders:
Add: Net investment gains (losses) 330 (255) (224) (149)
Add: Net derivative gains (losses) (1,063) (162) 199 (1,026)
Add: Other adjustments to continuing operations (438) (46) 40 (444)
Add: Provision for income tax (expense) benefit 495 490 11 996
Add: Income (loss) from discontinued operations, net of income tax (3) —— (3)
Less: Net income (loss) attributable to noncontrolling interests 1 11 5 17
Net income (loss) available to MetLife, Inc.‘s common shareholders $ 473 $ 939 $ 793 $ 2,205
120
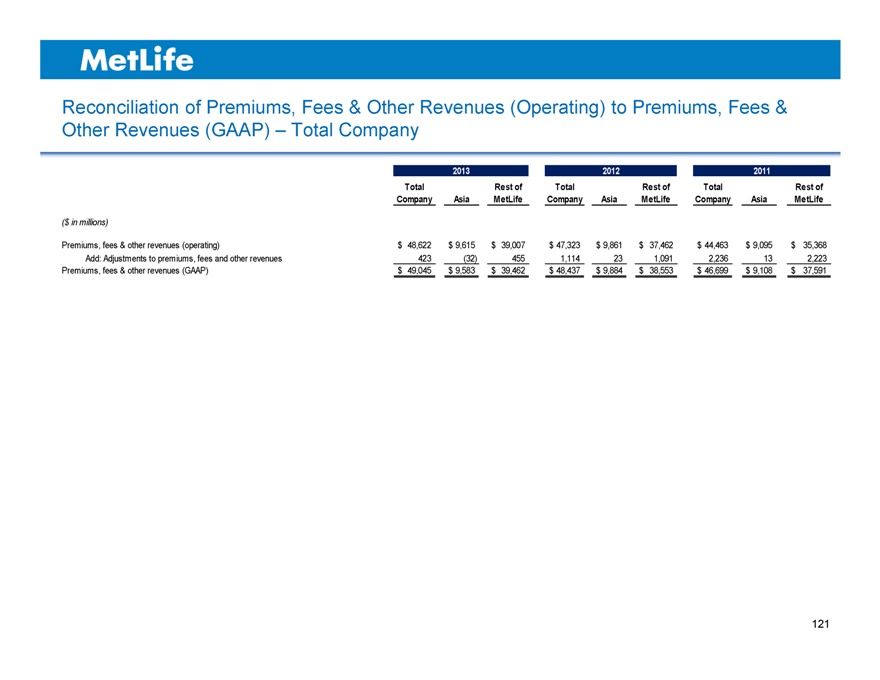
Reconciliation of Premiums, Fees & Other Revenues (Operating) to Premiums, Fees & Other Revenues (GAAP) – Total Company
2013 2012 2011
Total Rest of Total Rest of Total Rest of
Company Asia MetLife Company Asia MetLife Company Asia MetLife
($ in millions)
Premiums, fees & other revenues (operating) $ 48,622 $ 9,615 $ 39,007 $ 47,323 $ 9,861 $ 37,462 $ 44,463 $ 9,095 $ 35,368
Add: Adjustments to premiums, fees and other revenues 423 (32) 455 1,114 23 1,091 2,236 13 2,223
Premiums, fees & other revenues (GAAP) $ 49,045 $ 9,583 $ 39,462 $ 48,437 $ 9,884 $ 38,553 $ 46,699 $ 9,108 $ 37,591
121
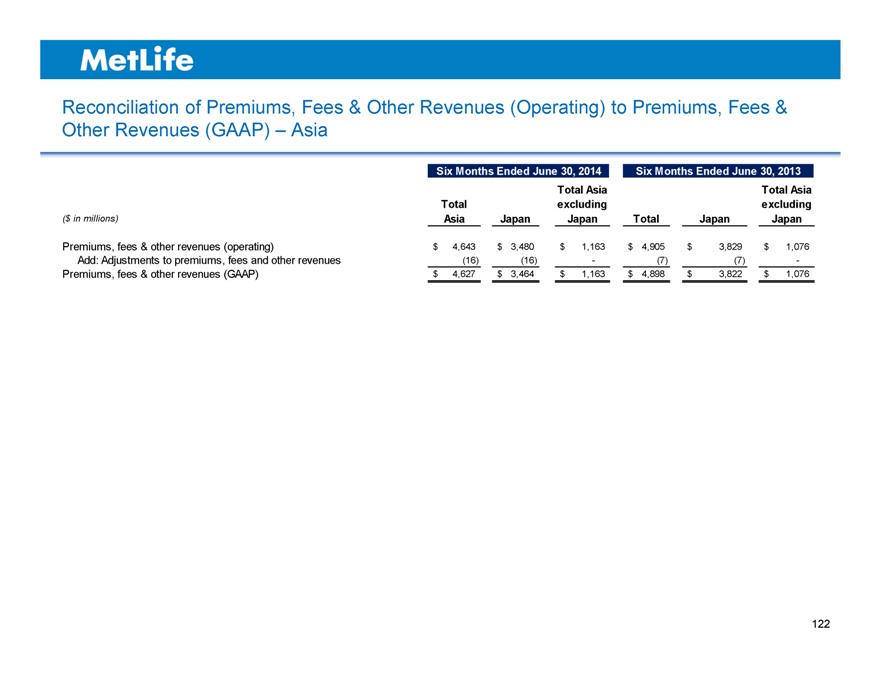
Reconciliation of Premiums, Fees & Other Revenues (Operating) to Premiums, Fees & Other Revenues (GAAP) – Asia
Six Months Ended June 30, 2014 Six Months Ended June 30, 2013
Total Asia Total Asia
Total excluding excluding
($ in millions) Asia Japan Japan Total Japan Japan
Premiums, fees & other revenues (operating) $ 4,643 $ 3,480 $ 1,163 $ 4,905 $ 3,829 $ 1,076
Add: Adjustments to premiums, fees and other revenues (16) (16) — (7) (7) -
Premiums, fees & other revenues (GAAP) $ 4,627 $ 3,464 $ 1,163 $ 4,898 $ 3,822 $ 1,076
122
MetLife
John C. R. Hele
Executive Vice President & Chief Financial Officer MetLife, Inc.
John Hele is executive vice president & chief financial officer for MetLife, Inc. and a member of the company’s executive group. Appointed to this position in September 2012, Hele oversees all financial management matters for MetLife, including financial reporting, treasury, corporate actuarial, tax, investor relations as well as mergers and acquisitions.
Prior to joining MetLife, Hele was executive vice president, chief financial officer and treasurer of Arch Capital Group Ltd., a public limited liability company that writes insurance and reinsurance globally through operations in Bermuda, the United States, Europe and Canada.
Prior to joining Arch Capital in 2009, Hele was chief financial officer and a member of the executive board of ING Group N.V., one of the largest global financial services companies. As CFO, Hele was based in Amsterdam and had responsibility for a financial function on five continents. He was also responsible for financial controls and reporting as well as capital management and tax reporting. During his six-year tenure at ING, Hele was also deputy chief financial officer, general manager, and chief insurance risk officer, responsible for global insurance risk management. Hele also served as group actuary.
Hele served as founder, president and chief executive officer of Worldinsure, Bermuda, a technology company that automated life insurance underwriting, from 1999 to 2003. Prior to that, he spent 11 years with Merrill Lynch in investment banking, marketing and finance positions in the U.S. In his last role at Merrill Lynch, Hele was responsible for providing strategic and financing advice to leading life insurance chief executive officers and chief financial officers in North and South America. Before joining Merrill Lynch, Hele held various actuarial, finance and business roles at Crown Life in Toronto.
Hele has been a member of the CFO Forum in Europe, the chair of the Chief Risk Officer Forum, and is a Fellow in the Society of Actuaries. He holds a bachelor’s degree in mathematics from the University of Waterloo, Ontario, Canada.
# # #
Christopher G. Townsend President, Asia MetLife, Inc.
Christopher Townsend is president of MetLife’s Asia region and a member of the company’s executive group. Appointed to this position in August 2012, Townsend oversees all of MetLife’s businesses in Asia. In 2013, the Asia region generated $1.2 billion in operating earnings, as well as operating premiums, fees and other revenues of $9.6 billion.
Prior to joining MetLife, Townsend was, since 2010, chief executive officer of the Asia Pacific region at AIG. In addition to leading all aspects of the business across the region, which included 4,700 employees in 15 countries, he oversaw the company’s risk, audit, compliance and investment divisions. As CEO, Townsend drove capital optimization, cost efficiency and a focus on client needs as he implemented a strategy to take advantage of opportunities to drive an above average return on equity.
From 2007 to 2010, Townsend was chief executive officer of AIG Australasia, with responsibility for the company’s businesses across Australia and New Zealand. Working with many of the company’s internal and external stakeholders, he developed and executed on a three-year plan to deliver a superior compound annual growth rate and solid combined operating ratios. In addition to reorganizing the business around its customers, he drove innovation through product development and the implementation of an e-business initiative that helped differentiate AIG from many of its key competitors.
Earlier in his career, Townsend was the CEO of AIG Hong Kong, served as senior vice president of mergers and acquisitions and also held a number of senior leadership roles in Hong Kong, London and Sydney. He joined AIG in the United Kingdom in 1991 and spent more than half of his 21-year career in the company’s Asia Pacific region.
Townsend currently sits on the board of directors for MetLife’s philanthropic organization, the MetLife Foundation, and also serves as vice chairman of the U.S.-Korea Business Council. He has previously served as a board member of the Hong Kong Federation of Insurers, governor of the American Chamber of Commerce and board member of the Insurance Council of Australia. He is a Chartered Insurer.
# # #
See Appendix for non-GAAP financial information, definitions, and/or reconciliations.
Toby Brown
Chief Financial Officer, Asia MetLife
Toby Brown is senior vice president and chief financial officer of MetLife’s Asia region. He was appointed to this position in May 2011. As chief financial officer for Asia, Brown is responsible for the overall financial leadership of MetLife’s business in Asia. His specific responsibilities include the country CFO organizations, actuarial, capital management, reinsurance, product pricing, tax, accounting and reporting, procurement financial planning and management analysis.
Brown joined MetLife when it acquired ALICO in November 2010. Prior to MetLife, he worked at American International Group (AIG) for over a decade in a range of roles, starting as an internal consultant advising and assessing both life and general insurance operations in the emerging market territories of Latin America and Central & Eastern Europe. He also spent time in Western Europe and at AIG Private Bank in Zurich.
Brown transferred permanently to the foreign AIG life business, ALICO, in 2002 where he held a number of positions of increasing responsibility within the Central & Eastern Europe Region (13 countries/22 life, pension, asset management, mutual fund, and shared service operations), most recently as regional chief financial officer and head of strategy, and immediately prior to that, as regional chief operating officer for all eight life, pension and asset management operations in Poland, Romania and the Baltics.
Before joining AIG/ALICO, Brown worked for Coopers & Lybrand (now Pricewaterhouse Coopers) in the U.K. He holds a BA degree in Accounting and Finance, and also an MBA from Manchester Business School, U.K. He is a fellow member of the Institute of Chartered Accountants in England & Wales (FCA), and a fellow member of the Association of International Accountants (FAIA). He has also completed the ALICO country management program, the AIG Financial Leadership program at NYU Stern School of Business, and the MetLife Executive Leadership program at Harvard Business School.
# # #
Kathy Awanis Vice President
Direct and e-Business, Asia MetLife
Kathy Awanis joined MetLife as vice president, direct and e-business for Asia in February 2013. She is responsible for the development and execution of regional direct sales and e-business strategy across the region. She works closely with the company’s Asia business partners to build capability and grow revenue in direct sales and in enhancing its digital business.
Awanis is a skillful business leader who, over the last 10 years, has held leadership positions across many industries including insurance, ticketing, mining and telecommunications and is a recognized expert in the development of digital platform capabilities for insurance in Asia.
Awanis has seven years of experience in the general insurance sector, commencing her insurance career at CGU Insurance Limited. Awanis has over 12 years of international experience across the e-business, marketing and technology disciplines in the ticketing (Ticketmaster), mining (BHP Billiton and Siberian-Urals Aluminum Company) and telecommunications (Ericsson) sectors in Australia, Sweden, Holland, U.K., U.S. and Russia.
Awanis joined MetLife from American Insurance Group in Singapore, where she served as the regional vice president for e-business, Asia Pacific region. In this role, she led the development of their Asia Pacific e-commerce assets. Before that, she served as their regional chief information officer and e-business for Australasia.
In her career, Awanis’ core focus has been in e-commerce, channel and distribution strategy across industries and customer segments, marketing, change management and bridging the gap in cross and multi-channel integration.
# # #
Dr. Nirmala Menon Head of Designated Markets
& Health, Asia MetLife
Dr. Nirmala Menon joined MetLife in May 2013 and currently serves as executive vice president and head of designated markets & health for MetLife’s Asia region. In this role she is responsible for leading and driving the regional business strategy in Hong Kong, Australia, and throughout South Asia. In addition, Menon leads the development and execution of MetLife’s Asia accident & health strategy.
Menon joined MetLife from ING Asia Pacific Ltd, where she served as the head of South Asia & regional TA/Direct Distribution based out of Hong Kong. Before that, she was ING’s head of Southeast Asia and president & CEO of ING’s operations in Malaysia. During her time at ING, she drove a multichannel distribution strategy of life bancassurance and employee benefits, overseeing an agency staff of over 9,000. She also established and launched a Takaful business in Malaysia.
Menon is a member of the American Association of Insurance Medicine, the Insurance Institute of Malaysia, a founding member of the Academy of Insurance Medicine of Asia, and has previously served as a committee member of the International Council of Life, Disability & Health Assurance Medicine (ICLAM). She is a certified medical practitioner and was also recognized as a “Leading Women in Finance & Investment in Asia” by the Women in Leadership (WIL) Awards in 2011.
# # #
Sachin N. Shah
Chairman, President & Chief Executive Officer
MetLife Insurance K.K. (MetLife Japan)
Sachin Shah is chairman, president and chief executive officer of MetLife Japan. He is also a member of the board of directors and representative statutory executive officer of MetLife Japan.
Shah has held these positions since August 2013 and is responsible for overseeing all of MetLife’s Japan operations. Prior to this role, he was most recently the chief operating officer for MetLife Japan. Since March 2014, has also been serving as a board member of the U.S.-Japan Business Council.
Before his assignments in Japan, Shah was the global leader for the integration of ALICO into MetLife until the closing of the transaction in November 2010.
From 2006 to 2010, Shah was responsible for developing and executing business strategy for MetLife’s International Business. In this role, Shah identified and managed key growth initiatives as well as mergers & acquisitions in the international markets where MetLife operated. Examples include entry into group dental business in Brazil, expansion of pensions business in Mexico, reestablishing bancassurance and career agency channels in India, re-positioning career agency channel in China, and expansion of general agency channel in Mexico.
From 2005 to 2006, Shah oversaw MetLife’s Employee Sales Center, a division of the company’s
U.S. Institutional Business. The Employee Sales Center, which generated approximately $250 million in annual sales, consisted of a team of more than 300 associates that sold life, auto, home and other voluntary benefit insurance solutions to employees of MetLife’s group insurance customers.
Shah joined MetLife in 1999 as a vice president in the company’s U.S. Institutional Business. He oversaw the launch of award-winning online resources, which were developed for group customers ranging from FORTUNE 500® clients to small businesses. Introduced in 2000, these capabilities – which are used by more than 30 million employees and distributors – were recognized by various industry organizations for their leading design and positive business impact.
Prior to joining MetLife, Shah was a vice president in the Global Institutional Services business of Bankers Trust. He has also worked for National Discount Brokers and Pershing, a division of Donaldson, Lufkin, and Jenrette Securities Corporation. Previously, he held engineering positions at Schindler Elevator, Allied Signal and Hewlett-Packard.
Shah received a B.S. degree in electrical engineering and a masters degree in technology and business management from Stevens Institute of Technology in New Jersey.
# # #
Koichiro (Koichi) Yamaguchi Chief Distribution Officer
MetLife Insurance K.K. (MetLife Japan)
Koichi Yamaguchi is statutory executive vice president and chief distribution officer at MetLife Japan, where he is responsible for the company’s sales and distribution channels.
Yamaguchi has extensive experience in the global life insurance industry, including in Japan, the U.S. and Europe. Before joining MetLife in February 2014, Yamaguchi was president, European region, at Prudential International Insurance, where he was responsible for developing Prudential’s European insurance presence. He was also senior vice president for Prudential International’s strategic initiatives unit, responsible for strategic projects in Asia and Latin America.
Earlier in his career, Yamaguchi was chief operations officer at Gibraltar Insurance Co. in Japan. He also led the insurance business of the Investment Banking Department at UBS Securities Japan Ltd. He spent 16 years at Nippon Life Insurance Co., where, among other roles, he was deputy general manager of the corporate planning department.
# # #
Atsushi Yagai
Chief Customer Marketing Officer MetLife Insurance K.K. (MetLife Japan)
Atsushi Yagai is statutory executive vice president and chief customer marketing officer at MetLife Japan, where his responsibilities include marketing and the company’s direct response business.
In this role, Yagai is also responsible for executing MetLife’s core strategy of customer centricity, including the improvement of persistency and customer satisfaction through the application of NPS (net promoter score) at a variety of customer touch-points.
Yagai also led the company’s successful rebranding to MetLife in the Japanese market through July 2014. Prior to assuming his current role in February 2014, Yagai served as executive vice president and chief marketing officer at MetLife Japan. He joined the company in January 2011.
Before joining MetLife, Yagai held various senior executive roles in Japan, including president and representative director at Timberland Japan, executive vice president and director of marketing and sales for AFLAC Japan, and president and representative director at Barilla Japan. Mr. Yagai began his career at Dentsu Inc. and has also worked as a consultant at McKinsey & Company.
Atsushi Yagai holds an MBA from IMD-Lausanne and a Bachelor’s degree in Economics from Keio University.
# # #
Greg Brennan
Chief Financial Officer
MetLife Insurance K.K. (MetLife Japan)
Greg Brennan joined MetLife Japan in July 2013 as executive vice president, strategic finance, and became statutory executive vice president and chief financial officer in October 2013.
Before he joined MetLife Japan, Brennan worked as chief financial officer, MetLife Insurance, Sydney, Australia since January 2011. He also served with Standard Chartered Bank, Singapore, as group head insurance between 2009 and 2010 and with Hartford Life International, Connecticut, U.S., as the international chief financial officer between 2006 and 2009.
Prior to working at Hartford Life International, Brennan worked as chief actuary with ING in Australia and then as regional chief actuary and regional chief insurance risk officer with ING Asia Pacific in Hong Kong for seven years (1999-2006) and also served in New Zealand with Tower Life and Tower Life Australia as chief actuary between 1992 and 1999. He also worked as an actuary with Hannover Life Reinsurance in Australia during 1989-1991, after working as an actuarial consultant at Towers Perrin in Sydney, Australia during 1982-1989. Brennan began his career as an actuarial analyst with the Australian Mutual Provident Society between 1970 and 1976.
Brennan has also worked as an Educational Psychologist, NSW Department of Education, during 1980-1982 and graduated in 1979 with a B.Sc. Hons. degree in cognitive psychology from University of New South Wales.
# # #
Edward A. Spehar
Senior Vice President, Investor Relations MetLife
Edward Spehar is a senior vice president and head of investor relations of MetLife, Inc., a global provider of life insurance, annuities, employee benefits and asset management, serving approximately 100 million customers. Appointed to this position in November 2012, Spehar manages and coordinates the presentation of MetLife’s financial results, messages and strategies to the analyst and investor community.
Before joining MetLife, Spehar spent over 20 years analyzing insurance companies with broad and diverse businesses as an equity research analyst. He joined MetLife from Bank of America Merrill Lynch, where he served as a sell-side equity research analyst covering the life insurance industry for approximately 19 years. In this role, he produced fundamental equity research on the industry and covered 15 publicly-traded insurers, including MetLife, American International Group and Prudential Financial. He also held similar roles at Lehman Brothers and Ameritrust Company.
Spehar received a bachelor’s degree in management from Case Western Reserve University as well as an MBA from the Weatherhead School of Management at Case Western Reserve.
He is a chartered financial analyst as well as a member of the New York Society of Security Analysts and the Association of Insurance and Financial Analysts. While at Bank of America Merrill Lynch, Spehar was repeatedly selected for Institutional Investor magazine’s annual All-America Research Team.
# # #