William C. O’Donnell
Executive Vice President and
Chief Accounting Officer
July 10, 2018
VIA EDGAR
Office of Healthcare & Insurance
Division of Corporation Finance
United States Securities and Exchange Commission
100 F Street, N.E.
Washington, D.C. 20549
Re: | MetLife, Inc. | |
Form10-K for the Year Ended December 31, 2017 Filed March 1, 2018 FileNo. 001-15787 |
Ladies and Gentlemen:
This letter sets forth the response of MetLife, Inc. (including its subsidiaries appropriate to the context, the “Company” or “MetLife”) to the comments contained in your letter dated June 11, 2018 regarding the Company’s Form10-K referenced above.
In response to your comments, we have reproduced your comments below in boldface, italic type and set forth our response immediately below each comment. All references to dollar amounts in this response are on apre-tax basis, unless otherwise noted.
Notes to the Consolidated Financial Statements
1. Business, Basis of Presentation and Summary of Significant Accounting Policies and Revisions, page 209
1. Please refer to your response to the first bullet of comment one. With respect to the group annuity reserves revision, tell us why the $30 million reservere-establishment in 2017 discussed in footnote (2) in your response was not considered a correction of an error in the 2017 quarterly periods.
Management’s Response:
The $301 million group annuity reservere-establishment corrected immaterial errors of $9 million, $9 million and $13 million for the first quarter, second quarter and third quarter of 2017, respectively. The $30 million adjustment did not correct an error for the12-month period ended December 31, 2017 because it was timely applied when that12-month period was first reported.
The Company revised previously reported amounts related to the immaterially misstated group annuity reserves and assumed variable annuity guarantee reserves, as well as adjustments for other unrelated immaterial errors. (See Note 1 of the Notes to the Consolidated Financial Statements in MetLife, Inc.’s Annual Report on Form10-K for the year ended December 31, 2017 (the “2017 Annual Report”).) The Company also revised quarterly amounts in Note 21, Quarterly Results of Operations (Unaudited) in the 2017 Annual Report for each of the quarterly periods in fiscal years 2017 and 2016. The revisions pertaining to the three months ended March 31, 2017 appear in a table in Note 1 of the Notes to the Interim Condensed Consolidated Financial Statements (Unaudited) included in MetLife, Inc.’s Form10-Q for the quarterly period ended March 31, 2018. The Company will continue to present a summary of the revisions to prior period net income (loss) available to MetLife, Inc.’s common shareholders for the 2017 quarters in a table within each remaining Form10-Q to be filed in 2018.
Please refer to our response below (Comment #4) for the materiality analysis for the group annuity and variable annuity revisions under the rollover and iron curtain method for each interim and annual period.
| 1 | Sum of the quarterly amounts not equal to $30 million due to rounding. |
Office of Healthcare & Insurance
Securities and Exchange Commission
July 10, 2018
Page 2
2. Refer to your response to the first bullet of comment one. With respect to the assumed variable annuity guarantee reserves revision, you state that the $214 million impact of the change in fair value subsequent to December 31, 2016 did not correct an error as it was appropriately reported in 2017.
| • | Tell us how much of the $214 million revision in 2017 related to each quarterly period. |
| • | As the $214 million revision was discovered subsequent to the quarterly periods being reported, please tell us why you believe the additional reserve for each quarter did not correct a material error in the interim periods. |
Management’s Response:
The $214 million assumed variable annuity guarantee revision in 2017 corrected immaterial errors of $14 million, $47 million and $67 million for the first quarter, second quarter and third quarter of 2017, respectively. The fourth quarter 2017 amount was $86 million and did not correct an error because it was timely applied when the quarter was first reported. Similarly, the $214 million adjustment did not correct an error for the12-month period ended December 31, 2017 because it was timely applied when that12-month period was first reported.
As noted in our response to Comment #1 above, the Company revised previously reported amounts related to the immaterially misstated assumed variable annuity guarantee reserves and group annuity reserves, as well as adjustments for other unrelated immaterial errors. (See Note 1 of the Notes to the Consolidated Financial Statements in the 2017 Annual Report). The Company also revised quarterly amounts in Note 21, Quarterly Results of Operations (Unaudited) in the 2017 Annual Report for each of the quarterly periods in fiscal years 2017 and 2016. The revisions pertaining to the three months ended March 31, 2017 appear in a table in Note 1 of the Notes to the Interim Condensed Consolidated Financial Statements (Unaudited) included in MetLife, Inc.’s Form10-Q for the quarterly period ended March 31, 2018. The Company will continue to present a summary of the revisions to prior period net income (loss) available to MetLife, Inc.’s common shareholders for the 2017 quarters in a table within each remaining Form10-Q to be filed in 2018.
Please refer to our response below to Comment #4 for the materiality analysis for the group annuity and variable annuity revisions under the rollover and iron curtain method for each interim and annual period.
3. Please refer to your response to the third bullet of comment one. Tell us how you considered whether or not the following qualitative factors, either individually or in aggregate with all qualitative factors, indicate that the revisions are material to any of the interim or annual periods.
| • | The misstatements appear to have arisen from an item capable of precise measurement. |
| • | The effect the misstatements had on analyst expectations. |
| • | The misstatements appear to have arisen with respect to a critical accounting policy that plays a significant role in your operations or profitability. |
| • | The effect the misstatements had on management’s compensation. |
| • | The effect management or the auditors expected the misstatements would have on the market reaction. |
Management’s Response:
In determining whether all identified uncorrected misstatements were material for the 2017 and 2016 interim periods and the annual periods ended December 31, 2016 and 2015, management of the Company considered the quantitative and qualitative factors set forth in Staff Accounting Bulletin (“SAB”) Topic 1.M., “Materiality.” Additionally, management considered SAB Topic 1.N., “Considering the effects of prior year misstatements when quantifying misstatements in the current year financial statements,” which requires that uncorrected misstatements be evaluated under both the rollover method and the iron curtain method.
Office of Healthcare & Insurance
Securities and Exchange Commission
July 10, 2018
Page 3
The analysis applied the qualitative considerations identified in SAB Topic 1.M. as follows:
| a. | Did the misstatement arise from an item capable of precise measurement or did it arise from an estimate and, if from an estimate, the degree of imprecision inherent in the estimate? |
The valuation of liabilities for amounts payable under insurance contracts (“insurance reserves”) and embedded derivative liabilities are critical accounting estimates for the Company. As disclosed in “Management’s Discussion and Analysis of Financial Condition and Results of Operations” in the 2017 Annual Report, there is a degree of imprecision inherent in the estimation of these reserves and liabilities, particularly as it relates to the underlying assumptions used in the valuations as they are based in part on management judgment.
However, the misstatements identified were not related to elements subject to the estimation process. With respect to the group annuity misstatement, the Company prematurely released reserves due to inadequate processes and procedures for identifying unresponsive and missing group annuitants and pension beneficiaries. With respect to the assumed variable annuity guarantees misstatement, the underlying policyholder data used in the valuation of the embedded derivative liabilities was incorrect.
| b. | Did the misstatement mask a change in earnings or other trends? |
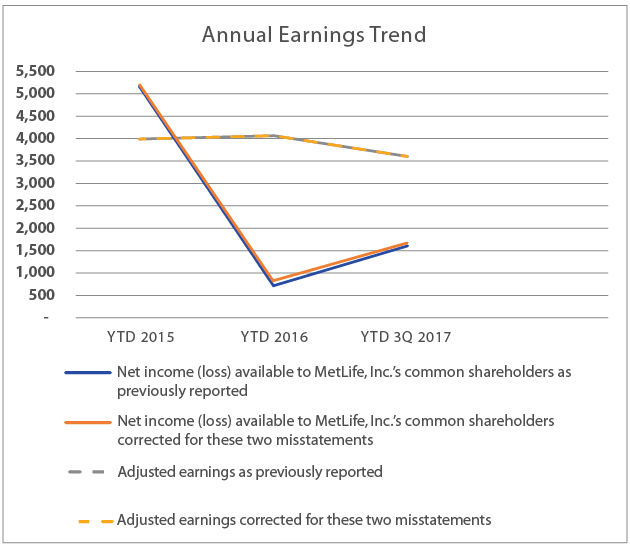
No. The identified misstatements did not mask a change in earning or other trends. The line item affected by the group annuity reserves item in the statement of operations was policyholder benefits and claims, and the impact on the balances in this line item was insignificant for all prior periods. The line item impacted by the variable annuity guarantee reserves item was net derivative gains (losses), which is excluded from adjusted earnings (the primary segment performance metric and an important metric used by analysts) and is subject to significant fluctuation from period to period due to changes in equity markets, foreign exchange rates, and interest rate markets and, therefore, not subject to a trend analysis.
The following charts2 show that the identified misstatements do not mask a change in after-tax earnings or other trends on a quarterly or annual basis. As noted above, the adjusted earnings trend lines are not significantly different because only the group annuity misstatement had an impact on adjusted earnings and that impact was not significant.
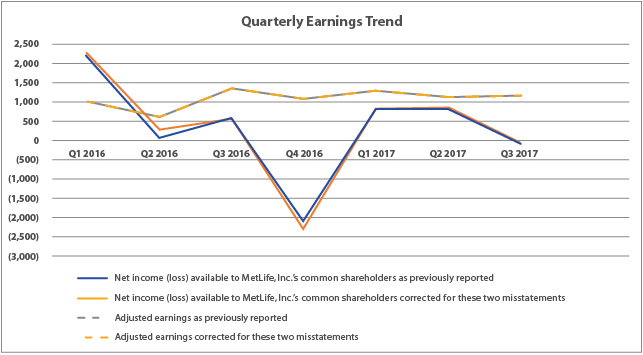
| 2 | See Appendix for supporting details. |
Office of Healthcare & Insurance
Securities and Exchange Commission
July 10, 2018
Page 4
Office of Healthcare & Insurance
Securities and Exchange Commission
July 10, 2018
Page 5
| c. | Did the misstatement hide a failure to meet analysts’ consensus expectations for the Registrant? |
No. Management does not believe these misstatements hid any failure to meet analyst expectations in prior periods impacted, as supported by the analysis below. Analysts commonly use adjusted earnings per share (adjusted EPS) to analyze the Company. The analysis below compares the amount by which adjusted earnings per share exceeded, or fell short, of analysts’ expectations at the time of our quarterly earnings release to the overstatement of adjusted earnings per share attributable to these two misstatements:
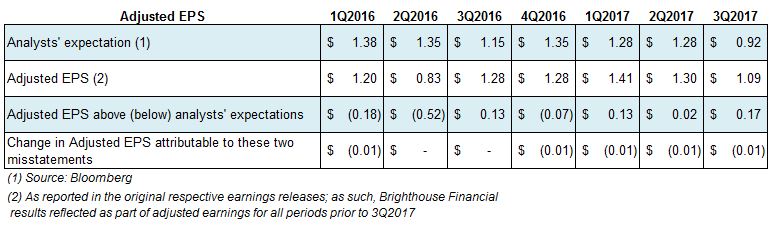
The above analysis illustrates that the correction of the misstatements did not hide a failure to meet analysts’ consensus expectations.
| d. | Did the misstatement change a loss into income or vice versa? |
No. There were no periods where the misstatements resulted in a change from a loss into income or vice versa, and the misstatements did not change the direction of any financial statement line item.
| e. | Did the misstatement impact a segment or other portion of the Registrant’s business identified as playing a significant role in the Registrant’s operations or profitability? |
The group annuity reserves misstatement impacted the Company’s U.S. reportable segment. However, the magnitude of the identified misstatement was not significant to the insurance reserves held within that segment, did not change, mask, or distort the trend in adjusted earnings for that segment, or hide a failure to meet analyst expectations of adjusted earnings for that segment.
The operations relating to the assumed variable annuity guarantees from the Company’s former operating joint venture in Japan are included within the MetLife Holdings reportable segment. However, the nature of the variable annuity guarantees misstatement did not impact segment results in any period because, as disclosed in Note 2 of the Notes to the Consolidated Financial Statements in the 2017 Annual Report, net derivative gains (losses) are excluded from the Company’s segment performance metric, adjusted earnings.
| f. | Did the misstatement affect the Registrant’s compliance with regulatory requirements? |
No. The Company’s regulatory requirements relate primarily to statutory requirements for its insurance subsidiaries. The misstatements had no effect on compliance with insurance regulatory requirements. The misstatements had minimal adverse impacts on the affected MetLife insurance subsidiaries’ solvency metrics used by insurance regulators to help assure adequately capitalized insurers.
Office of Healthcare & Insurance
Securities and Exchange Commission
July 10, 2018
Page 6
| g. | Did the misstatement affect the Registrant’s compliance with loan covenants or other contractual requirements? |
No. None of the misstatements affected the Company’s compliance with corporate debt covenants or other contractual requirements.
| h. | Did the misstatement have the effect of increasing management’s compensation (e.g., by satisfying requirements for the award of bonus or other forms of incentive compensation)? |
While the misstatement related to the group annuity reserves would have impacted the adjusted earnings used in the determination of the amount available for prior-year annual cash incentive compensation, it would not have significantly affected the adjusted earnings the Company used to determine the amount available for annual cash incentive compensation in any prior period had it been identified at the time. In addition, individual annual cash incentive awards are discretionary and depend on many factors, not solely on adjusted earnings. The misstatement related to the assumed variable annuity guarantee reserves would not have impacted the adjusted earnings used in the determination of the amount available for prior-year annual cash incentive compensation. With respect tonon-cash incentive compensation, the misstatements would have had an insignificant or no impact on the value of prior period awards.
| i. | Did the misstatement involve concealment of an unlawful transaction? |
No. The misstatements were inadvertent and there is no indication that either of these items was a result of fraud, illegal acts, violation of contracts, or conflicts of interest.
Other factors from SAB Topic 1.M.
SAB Topic 1.M. also notes that “[w]hen…management or the independent auditor expects (based, for example, on a pattern of market performance) that a known misstatement may result in a significant positive or negative market reaction, that expected reaction should be taken into account when considering whether a misstatement is material.” Management expected potential market reaction to the disclosure of the misstatements. However, management did not anticipate a significant long-term market reaction to these two misstatements, after giving consideration to the following factors:
| ◾ | In January 2018, the Companypre-released earnings for the fourth quarter of 2017 and estimated a range for the group annuitant reserve charge. However, at the same time, the Company announced that it was still in the process of conducting a global review of related processes and procedures, that it had a material weakness in internal control over financial reporting, that the Securities and Exchange Commission had made inquiries to the Company, and that it would delay its planned earnings release. Management believes that these uncertainties largely caused the subsequent short-term fluctuation in the Company’s common stock price; |
| ◾ | The amounts by which the restated adjusted earnings per share exceeded, or fell short of, analysts’ expectations at the time of the Company’s prior earnings releases were insignificant (see discussion under 3.c. above); |
| ◾ | The misstatements were the result of errors that were self-discovered and individually self-disclosed; and |
| ◾ | The impact of the misstatements on the Company’s then current book value individually amounted to less than 1.5% of the average market capitalization of the Company for the preceding120-day period, and less than 1.0% when netted together. |
Considering all of the qualitative factors discussed above, the magnitude and nature of the misstatements, individually and in the aggregate, is such that management believes it is unlikely that the judgment of a reasonable person relying upon the previously reported financial statements would have been changed or influenced by the inclusion or correction of the items if they had been identified timely.
Office of Healthcare & Insurance
Securities and Exchange Commission
July 10, 2018
Page 7
4. Your response to the third bullet of comment one indicates you assessed materiality based on a quantitative analysis of net income under the rollover approach, as well as a qualitative evaluation of the impact of the errors.
| • | Please revise your response to separately provide a materiality analysis for the group annuity and variable annuity revisions under the rollover and iron curtain method for each interim and annual period. Refer to SAB Topic 1.N. Specifically tell us why you believe the revisions, individually and in aggregate, are not material to the second quarter of 2016 and third quarter of 2017. Refer to page 384 of the10-K. |
| • | You state in footnote 1 on page 4 of your response that for purposes of determining the 4.5% amount you excluded a significantafter-tax charge of $2.0 billion related to the accelerated variable annuity assumption update, which was performed in anticipation of the planned separation of Brighthouse Financial. |
| o | Tell us why you believe it is appropriate to exclude the amount when evaluating materiality. |
| o | Address in your response why the charge would not otherwise have been recorded in the annual third quarter review had the assumption review update not been accelerated. |
Management’s Response:
The Company utilized both the rollover approach and the iron curtain approach to assess materiality of the identified misstatements on prior periods. In applying SAB Topic 1.N., we considered the application of the iron curtain and rollover methods to identified errors impacting prior periods as described in the December 8, 2008 speech by Mark Mahar, Associate Chief Accountant, Office of the Chief Accountant, Securities and Exchange Commission.3 Consistent with SAB Topic 1.N. and this clarification, management evaluated whether the balance sheet (iron curtain) and income statement (rollover) effect of the errors was quantitatively material to any prior period.
The Appendix to this response includes tables with quantitative analyses with respect to previously reported annual periods ending December 31, 2016 and 2015 and interim periods within 2016 and 2017, each of which reflects Brighthouse Financial reclassified as discontinued operations. The Company deconsolidated Brighthouse Financial and reclassified it as discontinued operations in its Form10-Q for quarterly period ended September 30, 2017. It also recast prior periods in two Current Reports on Form8-K submitted by the Company in November 2017. The Appendix tables provide quantitative analysis of the individual and aggregate impact of the two identified uncorrected misstatements on the consolidated balance sheet, statement of operations, and cash flows. In our materiality assessment, management evaluated GAAP metrics as well asnon-GAAP metrics management believes are important to the Company’s investors and that have been consistently communicated in press releases, earnings calls, or used by analysts in their valuation reports. Thesenon-GAAP metrics are (i) adjusted earnings (the primary segment performance metric) and (ii) book value per common share, excluding accumulated other comprehensive income other than foreign currency translation adjustments.
The variable annuity guarantees misstatement impacted a line item in the statements of operations, net derivative gains (losses), that is subject to significant fluctuation from period to period due to changes in equity markets, foreign exchange rates, and interest rate markets and, therefore, not subject to a trend analysis. The Company excludes net derivative gains (losses) from
| 3 | Excerpt from December 8, 2008 speech by Mark Mahar, Associate Chief Accountant, Office of the Chief Accountant, United States Securities and Exchange Commission: |
… Said another way, if a restatement of previously issued financial statements is required, but such restatement would not result in the previous year financial statements changing materially, than the company can restate those financial statements the next time they are presented without amendment to the previous filings or the issuance of an Item4-028-K.
In evaluating whether the Year 2, 3 or 4 financial statements are materially misstated, we understand that some look to the response in Question 2. That response states that a “separate analysis of the financial statements of the prior year (and any other prior year in which previously undiscovered errors existed) would need to be performed to determine whether such prior year financial statements weremateriallymisstated” (emphasis added). Despite the guidance, some registrants and auditors have interpreted this to mean that when evaluating Years 2, 3 or 4 separately, if the effect of correcting the error that exists in each balance sheet materially impacts the income statement of each year, then the registrant must amend those previously filed financial statements.
This is not how the staff applies SAB 108. The discovery of a material error generally requires restatement consistent with [ASC 250]. However, SAB 108 contemplated that in some circumstances restatements could be included in a company’s next filing rather than via an amendment to the previous filing or filings when the effect of restating the previously issued financial statements does not result in a material change to those financial statements.
Using my example, recall that the balance sheet and income statement affect of the error is not material to any given period however an out of period correction of the cumulative balance sheet error in any particular year might have been material. If that is true, then the restatements would not materially alter the previous financial statements, as reported, and therefore those financial statements could still be relied upon. Therefore, the registrant could include the restatement with the next filing without amending the previous filings.
Office of Healthcare & Insurance
Securities and Exchange Commission
July 10, 2018
Page 8
the Company’s segment performance reporting metric, adjusted earnings. As such, this misstatement did not impact segment results or adjusted earnings.
For purposes of the analysis in the Appendix, management assumed at a preliminary level that a deviation of less than 5% of the appropriate base is unlikely to be material on a quantitative basis. For any deviation that is greater than this threshold, the Company gave additional consideration to quantitative and qualitative factors that are discussed in further detail below.
In two interim periods (2Q2016 and 3Q2017), the impact of the misstatements on net income (loss) available to MetLife, Inc.’s common shareholders and income (loss) from continuing operations, net of income tax exceeded the preliminary level of deviation. However, in those same interim periods, the impact on adjusted earnings was not quantitatively material. While management believes that quarterly information is essential to providing financial statement users with timely information as to the progress of the Company, we considered the guidance of ASC250-10-45-27, which states, “In determining materiality for the purpose of reporting the correction of an error, amounts shall be related to the estimated income for the full fiscal year and also to the effect on the trend of earnings. Changes that are material with respect to an interim period but not material with respect to the estimated income for the full fiscal year or to the trend of earnings shall be separately disclosed in the interim period.”
See below for additional commentary with respect to the quantitative analyses provided in the Appendix for these particular periods. As shown in the charts in our response to Comment #3 in this letter, Analysis of Quarterly Earnings Impact, the misstatement adjustments individually or in the aggregate, did not distort an earnings trend. For the two interim periods (2Q2016 and 3Q2017), while the misstatements were quantitatively significant to the discrete quarter, further analysis, consistent with ASC 250 demonstrated that the misstatements were not quantitatively material to the full year. Nor did the misstatements distort trends for the full year as illustrated in Analysis of Annual Earnings Impact in chart contained in the response to Comment #3.
Three Months Ended June 30, 2016 and Year Ended December 31, 2016:
For these periods, the Company reported a low level of net income (loss) available to MetLife, Inc.’s common shareholders, primarily due to anon-cash adjustment to net income of $2.0 billion (after-tax), associated with the Company’s annual variable annuity actuarial assumption review. The Company removed this adjustment in assessing the quantitative materiality of these misstatements for these periods. The Company did not believe that financial statement users would include this item when assessing the Company’s financial performance because of the size of the adjustment relative to recent prior period assumption updates and because almost all of this amount was excluded from income (loss) from continuing operations, net of income tax (as it primarily related to Brighthouse Financial) and adjusted earnings.
As disclosed in the Company’s Form10-Q for the quarterly period ended June 30, 2016, the Company conducted its 2016 annual variable annuity actuarial assumption review in the second quarter, rather than the third quarter as it usually does, in anticipation of the Brighthouse Financial separation. The Company’s $2.0 billion adjustment was significantly greater than adjustments from annual assumption updates for the years 2013 through 2017 (excluding 2016), which ranged from a decrease of approximately $0.2 billion (after-tax) to an increase of approximately $0.1 billion (after-tax).
The 4.5%4 amount in footnote 1 on page 4 of our previous response was derived by excluding from 2016 net income (loss) available to MetLife, Inc.’s common shareholders the aforementioned $2.0 billion for the reasons discussed above. The $2.0 billion would have been recorded in the third quarter had the Company conducted its variable annuity assumption update then.
Quarter Ended September 30, 2017 and Year Ended December 31, 2017:
For the quarter ended September 30, 2017, the Company reported a low level of income (loss) from continuing operations, net of income tax, and net income (loss) available to MetLife, Inc.’s common shareholders, primarily due to a loss of approximately $1.0 billion (after-tax), associated with the Company’s separation of Brighthouse Financial, Inc. The Company removed this loss in assessing the quantitative materiality of these misstatements for this period. The Company did not believe that financial statement users
42016 net income available to MetLife, Inc.’s common shareholders was $697 million (per Appendix) + $2,013 million = $2,710 million. Understatement was $99 million (after-tax) (per Appendix). $99 million/$2,710 million = 3.7%. This 3.7% differs from the 4.5% as it does not include the impact of various unrelated immaterial adjustments, representing items that were errors in prior periods that were recorded as part of the revision for which the impact did not have more than an insignificant effect to any line item individually or in the aggregate.
Office of Healthcare & Insurance
Securities and Exchange Commission
July 10, 2018
Page 9
would include this item when assessing the Company’s financial performance because of the size of the loss relative to prior dispositions. While the Company has disposed of certain operations in the past, this transaction represented a significant portion of the Company’s operations and the Company has never executed a disposition of this scale. The Company also believed that financial statement users would not consider this item because the amount was excluded from adjusted earnings.
While the misstatements were quantitatively significant to the discrete quarter ended September 30, 2017, further analysis consistent with ASC 250 demonstrated that the misstatements were not quantitatively material to the full year 2017.5
Given the quantitative and qualitative analysis discussed, management concluded that the adjustments were immaterial to all prior interim and annual periods, did not distort trends and that there was not a substantial likelihood that the prior period matters would be viewed by the users of the financials as having significantly altered the ‘total mix’ of information made available. We believe our analysis of the issues (individually and in the aggregate) was reasonably thorough and comprehensive, and that we exercised reasonable judgement in concluding that the misstatements were immaterial to all prior periods. All misstatements have been corrected in the annual and quarterly periods and the Company provided transparent disclosure in its 2017 Annual Report of the annual impacts in Note 1 of the Notes to the Consolidated Financial Statements and quarterly impacts in Note 21 of the Notes to the Consolidated Financial Statements.
5 2017 net income available to MetLife, Inc.’s common shareholders was $3,907 million. Understatement was $64 million (after-tax) for the nine months ended September 30, 2017 (per Appendix). $64 million/$3,907 million = 1.6%.
2017 adjusted earnings available to common shareholders was $4,235 million. Overstatement was $20 million (after-tax) for the nine months ended September 30, 2017 (per Appendix). $20 million/$4,235 million = 0.5%.
Office of Healthcare & Insurance
Securities and Exchange Commission
July 10, 2018
Page 10
If we may be of assistance in answering any questions that may arise in connection with the staff’s review of our response letter, please call me at212-578-5353.
Sincerely, |
/s/ William C. O’Donnell |
William C. O’Donnell |
cc: | United States Securities and Exchange Commission Mary Mast, Division of Corporation Finance Angela Connell, Division of Corporation Finance
MetLife, Inc. Steven A. Kandarian, Chairman of the Board, President and Chief Executive Officer John D. McCallion, Executive Vice President and Chief Financial Officer and Treasurer Stephen W. Gauster, Executive Vice President and General Counsel |
APPENDIX
As of and for the year ended December 31, 2015
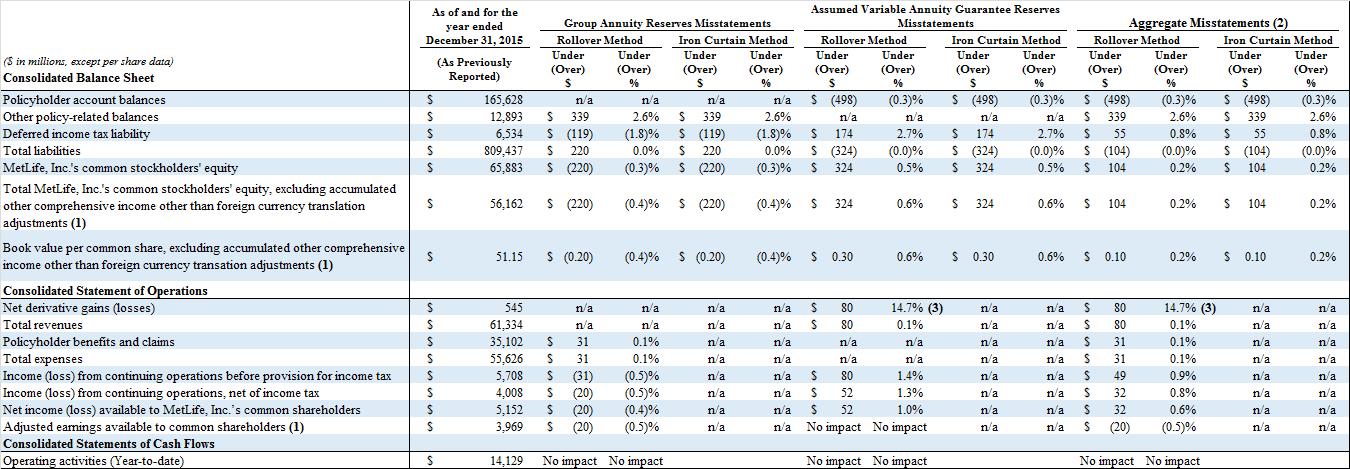
| (1) | Reconciliations of thesenon-GAAP measures to comparable GAAP measures can be found in Forms8-K containing the Company’s quarterly earnings releases. |
| (2) | “Aggregate Misstatements” represents the combined impact of the group annuity reserves and assumed variable annuity guarantee reserves misstatements only. It does not include the impact of various unrelated immaterial adjustments, representing items that were errors in prior periods that were recorded as part of the revision for which the impact did not have more than an insignificant effect to any line item individually or in the aggregate. |
| (3) | While the percentage exceeds the 5% threshold, it refers or directly relates to net derivative gains (losses) (“NDGL”). NDGL is subject to significant fluctuation from period to period due to changes in equity markets, foreign exchange rates, and interest rate market changes and, therefore, not subject to a trend analysis. In addition, the Company excludes NDGL from its segment performance reporting metric, adjusted earnings. Further, NDGL is only one component of total revenues. The percentage for total revenues did not exceed the 5% threshold. |
As of and for the year Assumed Variable Annuity Guarantee Reserves ended Group Annuity Reserves Misstatements Misstatements Aggregate Misstatements (2) December 31, 2015 Rollover Method Iron Curtain Method Rollover Method Iron Curtain Method Rollover Method Iron Curtain Method ($ in millions, except per share data) (As Previously Under Under Under Under Under Under Under Under Under Under Under Under (Over) (Over) (Over) (Over) (Over) (Over) (Over) (Over) (Over) (Over) (Over) (Over) Consolidated Balance Sheet Reported) $ % $ % $ % $ % $ % $ % Policyholder account balances $ 165,628 n/a n/a n/a n/a $ (498) (0.3)% $ (498) (0.3)% $ (498) (0.3)% $ (498) (0.3)% Other policy-related balances $ 12,893 $ 339 2.6% $ 339 2.6% n/a n/a n/a n/a $ 339 2.6% $ 339 2.6% Deferred income tax liability $ 6,534 $ (119) (1.8)% $ (119) (1.8)% $ 174 2.7% $ 174 2.7% $ 55 0.8% $ 55 0.8% Total liabilities $ 809,437 $ 220 0.0% $ 220 0.0% $ (324) (0.0)% $ (324) (0.0)% $ (104) (0.0)% $ (104) (0.0)% MetLife, Inc.’s common stockholders’ equity $ 65,883 $ (220) (0.3)% $ (220) (0.3)% $ 324 0.5% $ 324 # 0.5% $ 104 0.2% $ 104 0.2% Total MetLife, Inc.’s common stockholders’ equity, excluding accumulated other $ 56,162 $ (220) (0.4)% $ (220) (0.4)% $ 324 0.6% $ 324 # 0.6% $ 104 0.2% $ 104 0.2% comprehensive income other than foreign currency translation adjustments (1) Book value per common share, excluding accumulated other comprehensive $ 51.15 $ (0.20) (0.4)% $ (0.20) (0.4)% $ 0.30 0.6% $ 0.30 0.6% $ 0.10 0.2% $ 0.10 0.2% income other than foreign currency transation adjustments (1) Consolidated Statement of Operations Net derivative gains (losses) $ 545 n/a n/a n/a n/a $ 80 14.7% (3) n/a n/a $ 80 14.7% (3) n/a n/a Total revenues $ 61,334 n/a n/a n/a n/a $ 80 0.1% n/a n/a $ 80 0.1% n/a n/a Policyholder benefits and claims $ 35,102 $ 31 0.1% n/a n/a n/a n/a n/a n/a $ 31 0.1% n/a n/a Total expenses $ 55,626 $ 31 0.1% n/a n/a n/a n/a n/a n/a $ 31 0.1% n/a n/a Income (loss) from continuing operations before provision for income tax $ 5,708 $ (31) (0.5)% n/a n/a $ 80 1.4% n/a n/a $ 49 0.9% n/a n/a Income (loss) from continuing operations, net of income tax $ 4,008 $ (20) (0.5)% n/a n/a $ 52 1.3% n/a n/a $ 32 0.8% n/a n/a Net income (loss) available to MetLife, Inc.’s common shareholders $ 5,152 $ (20) (0.4)% n/a n/a $ 52 1.0% n/a n/a $ 32 0.6% n/a n/a Adjusted earnings available to common shareholders (1) $ 3,969 $ (20) (0.5)% n/a n/a No impact No impact n/a n/a $ (20) (0.5)% n/a n/a Consolidated Statements of Cash Flows Operating activities (Year-to-date) $ 14,129 No impact No impact No impact No impact No impact No impact
A-1
APPENDIX
As of and for the year ended December 31, 2016
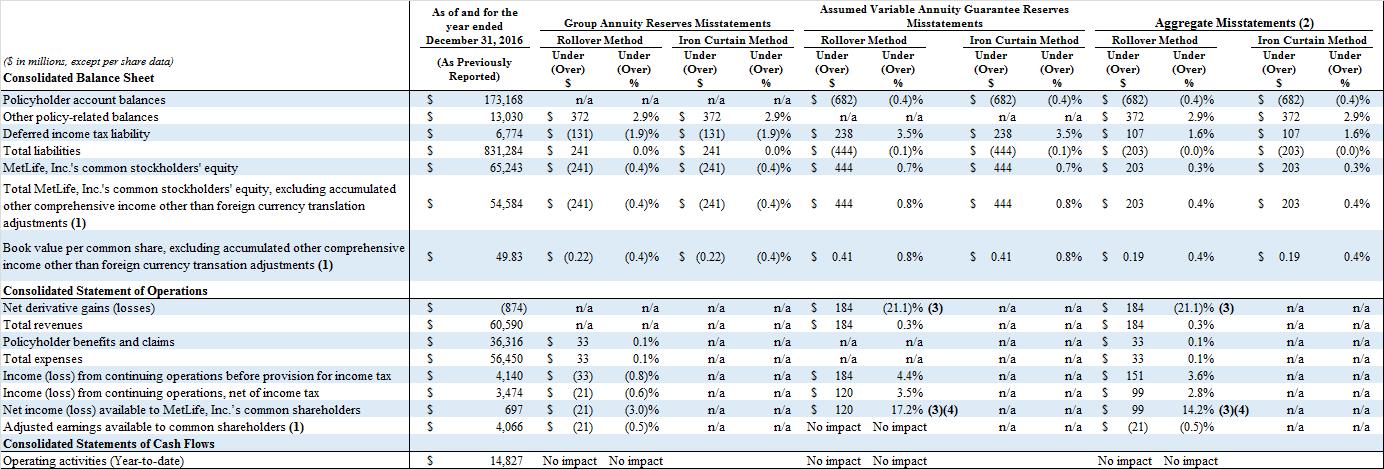
| (1) | Reconciliations of thesenon-GAAP measures to comparable GAAP measures can be found in Forms8-K containing the Company’s quarterly earnings releases. |
| (2) | “Aggregate Misstatements” represents the combined impact of the group annuity reserves and assumed variable annuity guarantee reserves misstatements only. It does not include the impact of various unrelated immaterial adjustments, representing items that were errors in prior periods that were recorded as part of the revision for which the impact did not have more than an insignificant effect to any line item individually or in the aggregate. |
| (3) | While the percentage exceeds the 5% threshold, it refers or directly relates to NDGL. NDGL is subject to significant fluctuation from period to period due to changes in equity markets, foreign exchange rates, and interest rate market changes and, therefore, not subject to a trend analysis. In addition, the Company excludes NDGL from its segment performance reporting metric, adjusted earnings. Further, NDGL is only one component of total revenues. The percentage for total revenues did not exceed the 5% threshold. |
| (4) | See the Company’s response to Comment #4 in the main body of this letter in the section titled, “Three Months Ended June 30, 2016 and Year Ended December 31, 2016” for additional analysis of adjustments affecting these periods. |
As of and for the year Assumed Variable Annuity Guarantee Reserves ended Group Annuity Reserves Misstatements Misstatements Aggregate Misstatements (2) December 31, 2016 Rollover Method Iron Curtain Method Rollover Method Iron Curtain Method Rollover Method Iron Curtain Method ($ in millions, except per share data) (As Previously Under Under Under Under Under Under Under Under Under Under Under Under (Over) (Over) (Over) (Over) (Over) (Over) (Over) (Over) (Over) (Over) (Over) (Over) Consolidated Balance Sheet Reported) $ % $ % $ % $ % $ % $ % Policyholder account balances $ 173,168 n/a n/a n/a n/a $ (682) (0.4)% $ (682) (0.4)% $ (682) (0.4)% $ (682) (0.4)% Other policy-related balances $ 13,030 $ 372 2.9% $ 372 2.9% n/a n/a n/a n/a $ 372 2.9% $ 372 2.9% Deferred income tax liability $ 6,774 $ (131) (1.9)% $ (131) (1.9)% $ 238 3.5% $ 238 3.5% $ 107 1.6% $ 107 1.6% Total liabilities $ 831,284 $ 241 0.0% $ 241 0.0% $ (444) (0.1)% $ (444) (0.1)% $ (203) (0.0)% $ (203) (0.0)% MetLife, Inc.’s common stockholders’ equity $ 65,243 $ (241) (0.4)% $ (241) (0.4)% $ 444 0.7% $ 444 # 0.7% $ 203 0.3% $ 203 0.3% Total MetLife, Inc.’s common stockholders’ equity, excluding accumulated other $ 54,584 $ (241) (0.4)% $ (241) (0.4)% $ 444 0.8% $ 444 # 0.8% $ 203 0.4% $ 203 0.4% comprehensive income other than foreign currency translation adjustments (1) Book value per common share, excluding accumulated other comprehensive $ 49.83 $ (0.22) (0.4)% $ (0.22) (0.4)% $ 0.41 0.8% $ 0.41 0.8% $ 0.19 0.4% $ 0.19 0.4% income other than foreign currency transation adjustments (1) Consolidated Statement of Operations Net derivative gains (losses) $ (874) n/a n/a n/a n/a $ 184 (21.1)% (3) n/a n/a $ 184 (21.1)% (3) n/a n/a Total revenues $ 60,590 n/a n/a n/a n/a $ 184 0.3% n/a n/a $ 184 0.3% n/a n/a Policyholder benefits and claims $ 36,316 $ 33 0.1% n/a n/a n/a n/a n/a n/a $ 33 0.1% n/a n/a Total expenses $ 56,450 $ 33 0.1% n/a n/a n/a n/a n/a n/a $ 33 0.1% n/a n/a Income (loss) from continuing operations before provision for income tax $ 4,140 $ (33) (0.8)% n/a n/a $ 184 4.4% n/a n/a $ 151 3.6% n/a n/a Income (loss) from continuing operations, net of income tax $ 3,474 $ (21) (0.6)% n/a n/a $ 120 3.5% n/a n/a $ 99 2.8% n/a n/a Net income (loss) available to MetLife, Inc.’s common shareholders $ 697 $ (21) (3.0)% n/a n/a $ 120 17.2% (4) n/a n/a $ 99 14.2% (4) n/a n/a Adjusted earnings available to common shareholders (1) $ 4,066 $ (21) (0.5)% n/a n/a No impact No impact n/a n/a $ (21) (0.5)% n/a n/a Consolidated Statements of Cash Flows Operating activities (Year-to-date) $ 14,827 No impact No impact No impact No impact No impact No impact
A-2
APPENDIX
As of and for the three months ended March 31, 2016
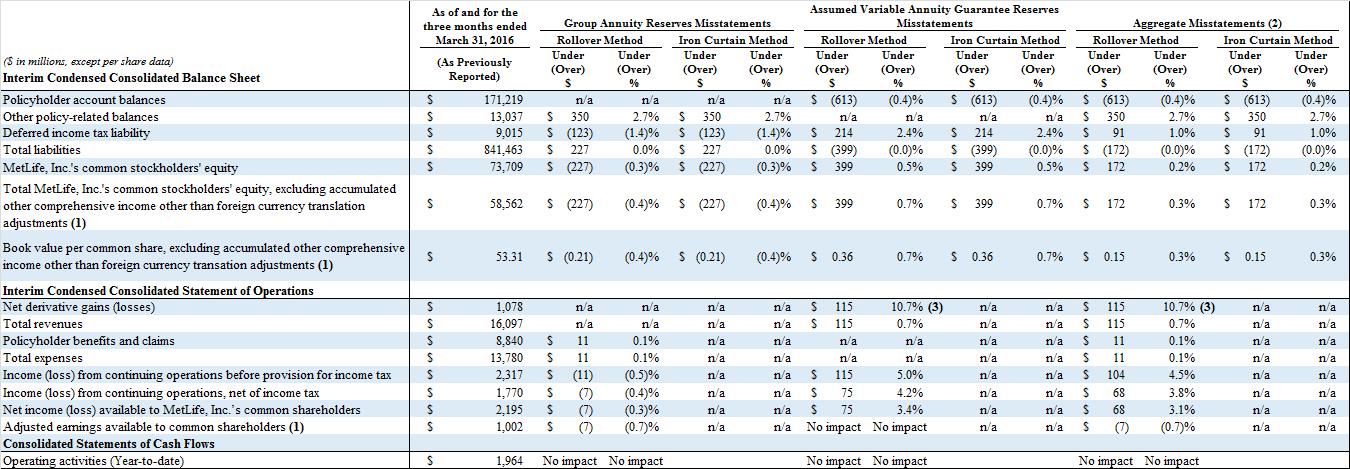
| (1) | Reconciliations of thesenon-GAAP measures to comparable GAAP measures can be found in Forms8-K containing the Company’s quarterly earnings releases. |
| (2) | “Aggregate Misstatements” represents the combined impact of the group annuity reserves and assumed variable annuity guarantee reserves misstatements only. It does not include the impact of various unrelated immaterial adjustments, representing items that were errors in prior periods that were recorded as part of the revision for which the impact did not have more than an insignificant effect to any line item individually or in the aggregate. |
| (3) | While the percentage exceeds the 5% threshold, it refers or directly relates to net NDGL. NDGL is subject to significant fluctuation from period to period due to changes in equity markets, foreign exchange rates, and interest rate market changes and, therefore, not subject to a trend analysis. In addition, the Company excludes NDGL from its segment performance reporting metric, adjusted earnings. Further, NDGL is only one component of total revenues. The percentage for total revenues did not exceed the 5% threshold. |
As of and for the three Assumed Variable Annuity Guarantee Reserves months ended Group Annuity Reserves Misstatements Misstatements Aggregate Misstatements (2) March 31, 2016 Rollover Method Iron Curtain Method Rollover Method Iron Curtain Method Rollover Method Iron Curtain Method ($ in millions, except per share data) (As Previously Under Under Under Under Under Under Under Under Under Under Under Under (Over) (Over) (Over) (Over) (Over) (Over) (Over) (Over) (Over) (Over) (Over) (Over) Interim Condensed Consolidated Balance Sheet Reported) $ % $ % $ % $ % $ % $ % Policyholder account balances $ 171,219 n/a n/a n/a n/a $ (613) (0.4)% $ (613) (0.4)% $ (613) (0.4)% $ (613) (0.4)% Other policy-related balances $ 13,037 $ 350 2.7% $ 350 2.7% n/a n/a n/a n/a $ 350 2.7% $ 350 2.7% Deferred income tax liability $ 9,015 $ (123) (1.4)% $ (123) (1.4)% $ 214 2.4% $ 214 2.4% $ 91 1.0% $ 91 1.0% Total liabilities $ 841,463 $ 227 0.0% $ 227 0.0% $ (399) (0.0)% $ (399) (0.0)% $ (172) (0.0)% $ (172) (0.0)% MetLife, Inc.’s common stockholders’ equity $ 73,709 $ (227) (0.3)% $ (227) (0.3)% $ 399 0.5% $ 399 # 0.5% $ 172 0.2% $ 172 0.2% Total MetLife, Inc.’s common stockholders’ equity, excluding accumulated other $ 58,562 $ (227) (0.4)% $ (227) (0.4)% $ 399 0.7% $ 399 # 0.7% $ 172 0.3% $ 172 0.3% comprehensive income other than foreign currency translation adjustments (1) Book value per common share, excluding accumulated other comprehensive $ 53.31 $ (0.21) (0.4)% $ (0.21) (0.4)% $ 0.36 0.7% $ 0.36 0.7% $ 0.15 0.3% $ 0.15 0.3% income other than foreign currency transation adjustments (1) Interim Condensed Consolidated Statement of Operations Net derivative gains (losses) $ 1,078 n/a n/a n/a n/a $ 115 10.7% (3) n/a n/a $ 115 10.7% (3) n/a n/a Total revenues $ 16,097 n/a n/a n/a n/a $ 115 0.7% n/a n/a $ 115 0.7% n/a n/a Policyholder benefits and claims $ 8,840 $ 11 0.1% n/a n/a n/a n/a n/a n/a $ 11 0.1% n/a n/a Total expenses $ 13,780 $ 11 0.1% n/a n/a n/a n/a n/a n/a $ 11 0.1% n/a n/a Income (loss) from continuing operations before provision for income tax $ 2,317 $ (11) (0.5)% n/a n/a $ 115 5.0% n/a n/a $ 104 4.5% n/a n/a Income (loss) from continuing operations, net of income tax $ 1,770 $ (7) (0.4)% n/a n/a $ 75 4.2% n/a n/a $ 68 3.8% n/a n/a Net income (loss) available to MetLife, Inc.’s common shareholders $ 2,195 $ (7) (0.3)% n/a n/a $ 75 3.4% n/a n/a $ 68 3.1% n/a n/a Adjusted earnings available to common shareholders (1) $ 1,002 $ (7) (0.7)% n/a n/a No impact No impact n/a n/a $ (7) (0.7)% n/a n/a Consolidated Statements of Cash Flows Operating activities (Year-to-date) $ 1,964 No impact No impact No impact No impact No impact No impact
A-3
APPENDIX
As of and for the three months ended June 30, 2016
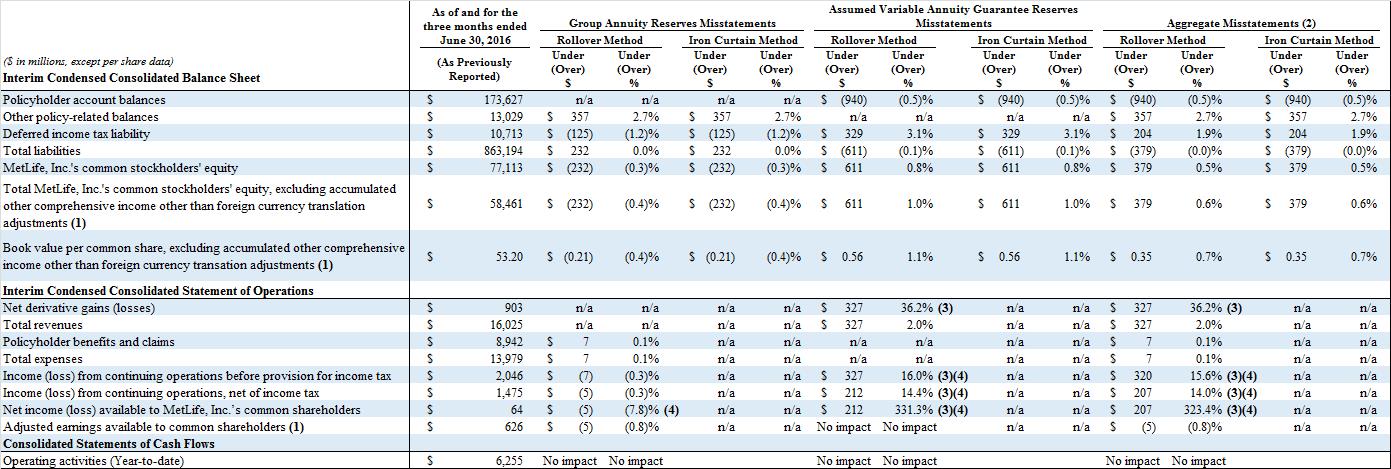
| (1) | Reconciliations of thesenon-GAAP measures to comparable GAAP measures can be found in Forms8-K containing the Company’s quarterly earnings releases. |
| (2) | “Aggregate Misstatements” represents the combined impact of the group annuity reserves and assumed variable annuity guarantee reserves misstatements only. It does not include the impact of various unrelated immaterial adjustments, representing items that were errors in prior periods that were recorded as part of the revision for which the impact did not have more than an insignificant effect to any line item individually or in the aggregate. |
| (3) | While the percentage exceeds the 5% threshold, it refers or directly relates to NDGL. NDGL is subject to significant fluctuation from period to period due to changes in equity markets, foreign exchange rates, and interest rate market changes and, therefore, not subject to a trend analysis. In addition, the Company excludes NDGL from its segment performance reporting metric, adjusted earnings. Further, NDGL is only one component of total revenues. The percentage for total revenues did not exceed the 5% threshold. |
| (4) | See the Company’s response to Comment #4 in the main body of this letter in the section titled, “Three Months Ended June 30, 2016 and Year Ended December 31, 2016” for additional analysis of adjustments affecting these periods. |
As of and for the three months ended Group Annuity Reserves Misstatements Assumed Variable Annuity Guarantee Reserves Misstatements Aggregate Misstatements (2) June 30, 2016 Rollover Method Iron Curtain Method Rollover Method Iron Curtain Method Rollover Method Iron Curtain Method ($ in millions, except per share data) (As Previously Under Under Under Under Under Under Under Under Under Under Under Under (Over) (Over) (Over) (Over) (Over) (Over) (Over) (Over) (Over) (Over) (Over) (Over) Interim Condensed Consolidated Balance Sheet Reported) $ % $ % $ % $ % $ % $ % Policyholder account balances $ 173,627 n/a n/a n/a n/a $ (940) (0.5)% $ (940) (0.5)% $ (940) (0.5)% $ (940) (0.5)% Other policy-related balances $ 13,029 $ 357 2.7% $ 357 2.7% n/a n/a n/a n/a $ 357 2.7% $ 357 2.7% Deferred income tax liability $ 10,713 $ (125) (1.2)% $ (125) (1.2)% $ 329 3.1% $ 329 3.1% $ 204 1.9% $ 204 1.9% Total liabilities $ 863,194 $ 232 0.0% $ 232 0.0% $ (611) (0.1)% $ (611) (0.1)% $ (379) (0.0)% $ (379) (0.0)% MetLife, Inc.’s common stockholders’ equity $ 77,113 $ (232) (0.3)% $ (232) (0.3)% $ 611 0.8% $ 611 # 0.8% $ 379 0.5% $ 379 0.5% Total MetLife, Inc.’s common stockholders’ equity, excluding accumulated other $ 58,461 $ (232) (0.4)% $ (232) (0.4)% $ 611 1.0% $ 611 # 1.0% $ 379 0.6% $ 379 0.6% comprehensive income other than foreign currency translation adjustments (1) Book value per common share, excluding accumulated other comprehensive $ 53.20 $ (0.21) (0.4)% $ (0.21) (0.4)% $ 0.56 1.1% $ 0.56 1.1% $ 0.35 0.7% $ 0.35 0.7% income other than foreign currency transation adjustments (1) Interim Condensed Consolidated Statement of Operations Net derivative gains (losses) $ 903 n/a n/a n/a n/a $ 327 36.2% (3) n/a n/a $ 327 36.2% (3) n/a n/a Total revenues $ 16,025 n/a n/a n/a n/a $ 327 2.0% n/a n/a $ 327 2.0% n/a n/a Policyholder benefits and claims $ 8,942 $ 7 0.1% n/a n/a n/a n/a n/a n/a $ 7 0.1% n/a n/a Total expenses $ 13,979 $ 7 0.1% n/a n/a n/a n/a n/a n/a $ 7 0.1% n/a n/a Income (loss) from continuing operations before provision for income tax $ 2,046 $ (7) (0.3)% n/a n/a $ 327 16.0% (3)(4) n/a n/a $ 320 15.6% (3)(4) n/a n/a Income (loss) from continuing operations, net of income tax $ 1,475 $ (5) (0.3)% n/a n/a $ 212 14.4% (3)(4) n/a n/a $ 207 14.0% (3)(4) n/a n/a Net income (loss) available to MetLife, Inc.’s common shareholders $ 64 $ (5) (7.8)% (4) n/a n/a $ 212 331.3% (3)(4) n/a n/a $ 207 323.4% (3)(4) n/a n/a Adjusted earnings available to common shareholders (1) $ 626 $ (5) (0.8)% n/a n/a No impact No impact n/a n/a $ (5) (0.8)% n/a n/a Consolidated Statements of Cash Flows Operating activities (Year-to-date) $ 6,255 No impact No impact No impact No impact No impact No impact
A-4
APPENDIX
As of and for the three months ended September 30, 2016
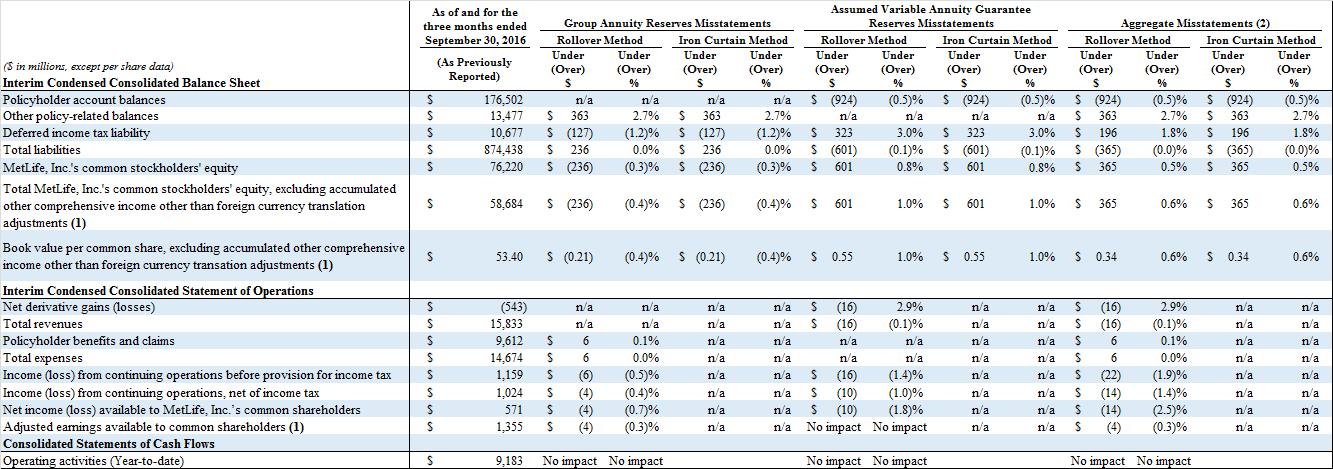
| (1) | Reconciliations of thesenon-GAAP measures to comparable GAAP measures can be found in Forms8-K containing the Company’s quarterly earnings releases. |
| (2) | “Aggregate Misstatements” represents the combined impact of the group annuity reserves and assumed variable annuity guarantee reserves misstatements only. It does not include the impact of various unrelated immaterial adjustments, representing items that were errors in prior periods that were recorded as part of the revision, for which the impact did not have more that an insignificant affect to any line item individually or in the aggregate. |
As of and for the three Assumed Variable Annuity Guarantee Reserves months ended Group Annuity Reserves Misstatements Misstatements Aggregate Misstatements (2) September 30, 2016 Rollover Method Iron Curtain Method Rollover Method Iron Curtain Method Rollover Method Iron Curtain Method Under Under Under Under Under Under Under Under Under Under Under Under ($ in millions, except per share data) (As Previously (Over) (Over) (Over) (Over) (Over) (Over) (Over) (Over) (Over) (Over) (Over) (Over) Interim Condensed Consolidated Balance Sheet Reported) $ % $ % $ % $ % $ % $ % Policyholder account balances $ 176,502 n/a n/a n/a n/a $ (924) (0.5)% $ (924) (0.5)% $ (924) (0.5)% $ (924) (0.5)% Other policy-related balances $ 13,477 $ 363 2.7% $ 363 2.7% n/a n/a n/a n/a $ 363 2.7% $ 363 2.7% Deferred income tax liability $ 10,677 $ (127) (1.2)% $ (127) (1.2)% $ 323 3.0% $ 323 3.0% $ 196 1.8% $ 196 1.8% Total liabilities $ 874,438 $ 236 0.0% $ 236 0.0% $ (601) (0.1)% $ (601) (0.1)% $ (365) (0.0)% $ (365) (0.0)% MetLife, Inc.’s common stockholders’ equity $ 76,220 $ (236) (0.3)% $ (236) (0.3)% $ 601 0.8% $ 601 0.8% $ 365 0.5% $ 365 0.5% Total MetLife, Inc.’s common stockholders’ equity, excluding accumulated other $ 58,684 $ (236) (0.4)% $ (236) (0.4)% $ 601 1.0% $ 601 1.0% $ 365 0.6% $ 365 0.6% comprehensive income other than foreign currency translation adjustments (1) Book value per common share, excluding accumulated other comprehensive $ 53.40 $ (0.21) (0.4)% $ (0.21) (0.4)% $ 0.55 1.0% $ 0.55 1.0% $ 0.34 0.6% $ 0.34 0.6% income other than foreign currency transation adjustments (1) Interim Condensed Consolidated Statement of Operations Net derivative gains (losses) $ (543) n/a n/a n/a n/a $ (16) 2.9% n/a n/a $ (16) 2.9% n/a n/a Total revenues $ 15,833 n/a n/a n/a n/a $ (16) (0.1)% n/a n/a $ (16) (0.1)% n/a n/a Policyholder benefits and claims $ 9,612 $ 6 0.1% n/a n/a n/a n/a n/a n/a $ 6 0.1% n/a n/a Total expenses $ 14,674 $ 6 0.0% n/a n/a n/a n/a n/a n/a $ 6 0.0% n/a n/a Income (loss) from continuing operations before provision for income tax $ 1,159 $ (6) (0.5)% n/a n/a $ (16) (1.4)% n/a n/a $ (22) (1.9)% n/a n/a Income (loss) from continuing operations, net of income tax $ 1,024 $ (4) (0.4)% n/a n/a $ (10) (1.0)% n/a n/a $ (14) (1.4)% n/a n/a Net income (loss) available to MetLife, Inc.’s common shareholders $ 571 $ (4) (0.7)% n/a n/a $ (10) (1.8)% n/a n/a $ (14) (2.5)% n/a n/a Adjusted earnings available to common shareholders (1) $ 1,355 $ (4) (0.3)% n/a n/a No impact No impact n/a n/a $ (4) (0.3)% n/a n/a Consolidated Statements of Cash Flows Operating activities (Year-to-date) $ 9,183 No impact No impact No impact No impact No impact No impact
A-5
APPENDIX
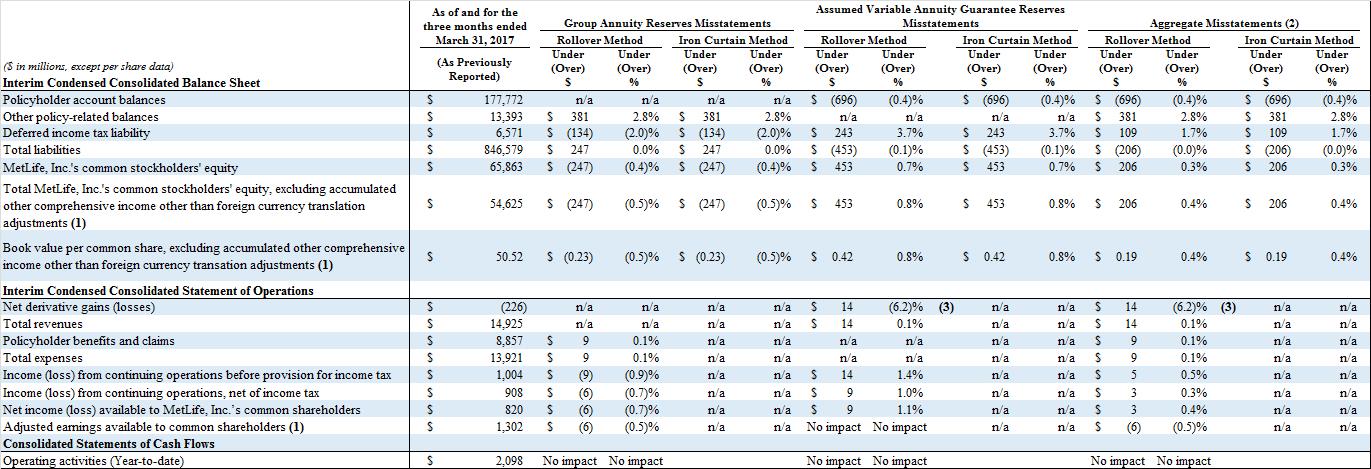
As of and for the three months ended March 31, 2017
| (1) | Reconciliations of thesenon-GAAP measures to comparable GAAP measures can be found in Forms8-K containing the Company’s quarterly earnings releases. |
| (2) | “Aggregate Misstatements” represents the combined impact of the group annuity reserves and assumed variable annuity guarantee reserves misstatements only. It does not include the impact of various unrelated immaterial adjustments, representing items that were errors in prior periods that were recorded as part of the revision, for which the impact did not have more that an insignificant affect to any line item individually or in the aggregate. |
| (3) | While the percentage exceeds the 5% threshold, it refers or directly relates to net NDGL. NDGL is subject to significant fluctuation from period to period due to changes in equity markets, foreign exchange rates, and interest rate market changes and, therefore, not subject to a trend analysis. In addition, the Company excludes NDGL from its segment performance reporting metric, adjusted earnings. Further, NDGL is only one component of total revenues. The percentage for total revenues did not exceed the 5% threshold. |
As of and for the three months ended Group Annuity Reserves Misstatements Assumed Variable Annuity Guarantee Reserves Misstatements Aggregate Misstatements (2) March 31, 2017 Rollover Method Iron Curtain Method Rollover Method Iron Curtain Method Rollover Method Iron Curtain Method Under Under Under Under Under Under Under Under Under Under Under Under ($ in millions, except per share data) (As Previously (Over) (Over) (Over) (Over) (Over) (Over) (Over) (Over) (Over) (Over) (Over) (Over) Interim Condensed Consolidated Balance Sheet Reported) $ % $ % $ % $ % $ % $ % Policyholder account balances $ 177,772 n/a n/a n/a n/a $ (696) (0.4)% $ (696) (0.4)% $ (696) (0.4)% $ (696) (0.4)% Other policy-related balances $ 13,393 $ 381 2.8% $ 381 2.8% n/a n/a n/a n/a $ 381 2.8% $ 381 2.8% Deferred income tax liability $ 6,571 $ (134) (2.0)% $ (134) (2.0)% $ 243 3.7% $ 243 3.7% $ 109 1.7% $ 109 1.7% Total liabilities $ 846,579 $ 247 0.0% $ 247 0.0% $ (453) (0.1)% $ (453) (0.1)% $ (206) (0.0)% $ (206) (0.0)% MetLife, Inc.’s common stockholders’ equity $ 65,863 $ (247) (0.4)% $ (247) (0.4)% $ 453 0.7% $ 453 # 0.7% $ 206 0.3% $ 206 0.3% Total MetLife, Inc.’s common stockholders’ equity, excluding accumulated other $ 54,625 $ (247) (0.5)% $ (247) (0.5)% $ 453 0.8% $ 453 # 0.8% $ 206 0.4% $ 206 0.4% comprehensive income other than foreign currency translation adjustments (1) Book value per common share, excluding accumulated other comprehensive $ 50.52 $ (0.23) (0.5)% $ (0.23) (0.5)% $ 0.42 0.8% $ 0.42 0.8% $ 0.19 0.4% $ 0.19 0.4% income other than foreign currency transation adjustments (1) Interim Condensed Consolidated Statement of Operations Net derivative gains (losses) $ (226) n/a n/a n/a n/a $ 14 (6.2)% (3) n/a n/a $ 14 (6.2)% (3) n/a n/a Total revenues $ 14,925 n/a n/a n/a n/a $ 14 0.1% n/a n/a $ 14 0.1% n/a n/a Policyholder benefits and claims $ 8,857 $ 9 0.1% n/a n/a n/a n/a n/a n/a $ 9 0.1% n/a n/a Total expenses $ 13,921 $ 9 0.1% n/a n/a n/a n/a n/a n/a $ 9 0.1% n/a n/a Income (loss) from continuing operations before provision for income tax $ 1,004 $ (9) (0.9)% n/a n/a $ 14 1.4% n/a n/a $ 5 0.5% n/a n/a Income (loss) from continuing operations, net of income tax $ 908 $ (6) (0.7)% n/a n/a $ 9 1.0% n/a n/a $ 3 0.3% n/a n/a Net income (loss) available to MetLife, Inc.’s common shareholders $ 820 $ (6) (0.7)% n/a n/a $ 9 1.1% n/a n/a $ 3 0.4% n/a n/a Adjusted earnings available to common shareholders (1) $ 1,302 $ (6) (0.5)% n/a n/a No impact No impact n/a n/a $ (6) (0.5)% n/a n/a Consolidated Statements of Cash Flows Operating activities (Year-to-date) $ 2,098 No impact No impact No impact No impact No impact No impact
A-6
APPENDIX
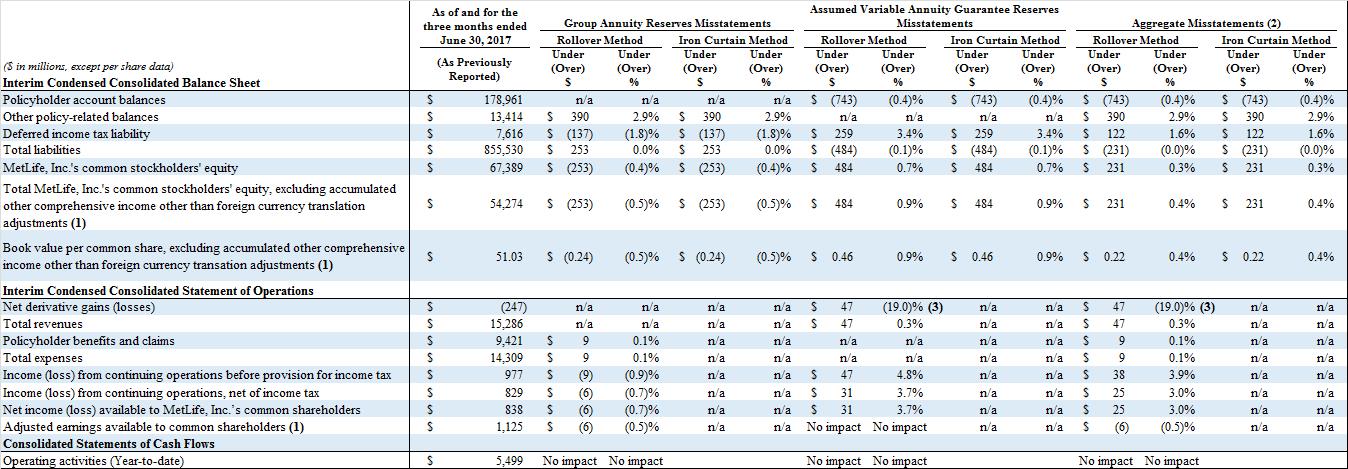
As of and for the three months ended June 30, 2017
| (1) | Reconciliations of thesenon-GAAP measures to comparable GAAP measures can be found in Forms8-K containing the Company’s quarterly earnings releases. |
| (2) | “Aggregate Misstatements” represents the combined impact of the group annuity reserves and assumed variable annuity guarantee reserves misstatements only. It does not include the impact of various unrelated immaterial adjustments, representing items that were errors in prior periods that were recorded as part of the revision, for which the impact did not have more that an insignificant affect to any line item individually or in the aggregate. |
| (3) | While the percentage exceeds the 5% threshold, it refers or directly relates to net NDGL. NDGL is subject to significant fluctuation from period to period due to changes in equity markets, foreign exchange rates, and interest rate market changes and, therefore, not subject to a trend analysis. In addition, the Company excludes NDGL from its segment performance reporting metric, adjusted earnings. Further, NDGL is only one component of total revenues. The percentage for total revenues did not exceed the 5% threshold. |
As of and for the three Assumed Variable Annuity Guarantee Reserves months ended Group Annuity Reserves Misstatements Misstatements Aggregate Misstatements (2) June 30, 2017 Rollover Method Iron Curtain Method Rollover Method Iron Curtain Method Rollover Method Iron Curtain Method Under Under Under Under Under Under Under Under Under Under Under Under ($ in millions, except per share data) (As Previously (Over) (Over) (Over) (Over) (Over) (Over) (Over) (Over) (Over) (Over) (Over) (Over) Interim Condensed Consolidated Balance Sheet Reported) $ % $ % $ % $ % $ % $ % Policyholder account balances $ 178,961 n/a n/a n/a n/a $ (743) (0.4)% $ (743) (0.4)% $ (743) (0.4)% $ (743) (0.4)% Other policy-related balances $ 13,414 $ 390 2.9% $ 390 2.9% n/a n/a n/a n/a $ 390 2.9% $ 390 2.9% Deferred income tax liability $ 7,616 $ (137) (1.8)% $ (137) (1.8)% $ 259 3.4% $ 259 3.4% $ 122 1.6% $ 122 1.6% Total liabilities $ 855,530 $ 253 0.0% $ 253 0.0% $ (484) (0.1)% $ (484) (0.1)% $ (231) (0.0)% $ (231) (0.0)% MetLife, Inc.’s common stockholders’ equity $ 67,389 $ (253) (0.4)% $ (253) (0.4)% $ 484 0.7% $ 484 # 0.7% $ 231 0.3% $ 231 0.3% Total MetLife, Inc.’s common stockholders’ equity, excluding accumulated other $ 54,274 $ (253) (0.5)% $ (253) (0.5)% $ 484 0.9% $ 484 # 0.9% $ 231 0.4% $ 231 0.4% comprehensive income other than foreign currency translation adjustments (1) Book value per common share, excluding accumulated other comprehensive $ 51.03 $ (0.24) (0.5)% $ (0.24) (0.5)% $ 0.46 0.9% $ 0.46 0.9% $ 0.22 0.4% $ 0.22 0.4% income other than foreign currency transation adjustments (1) Interim Condensed Consolidated Statement of Operations Net derivative gains (losses) $ (247) n/a n/a n/a n/a $ 47 (19.0)% (3) n/a n/a $ 47 (19.0)% (3) n/a n/a Total revenues $ 15,286 n/a n/a n/a n/a $ 47 0.3% n/a n/a $ 47 0.3% n/a n/a Policyholder benefits and claims $ 9,421 $ 9 0.1% n/a n/a n/a n/a n/a n/a $ 9 0.1% n/a n/a Total expenses $ 14,309 $ 9 0.1% n/a n/a n/a n/a n/a n/a $ 9 0.1% n/a n/a Income (loss) from continuing operations before provision for income tax $ 977 $ (9) (0.9)% n/a n/a $ 47 4.8% n/a n/a $ 38 3.9% n/a n/a Income (loss) from continuing operations, net of income tax $ 829 $ (6) (0.7)% n/a n/a $ 31 3.7% n/a n/a $ 25 3.0% n/a n/a Net income (loss) available to MetLife, Inc.’s common shareholders $ 838 $ (6) (0.7)% n/a n/a $ 31 3.7% n/a n/a $ 25 3.0% n/a n/a Adjusted earnings available to common shareholders (1) $ 1,125 $ (6) (0.5)% n/a n/a No impact No impact n/a n/a $ (6) (0.5)% n/a n/a Consolidated Statements of Cash Flows Operating activities (Year-to-date) $ 5,499 No impact No impact No impact No impact No impact No impact
A-7
APPENDIX
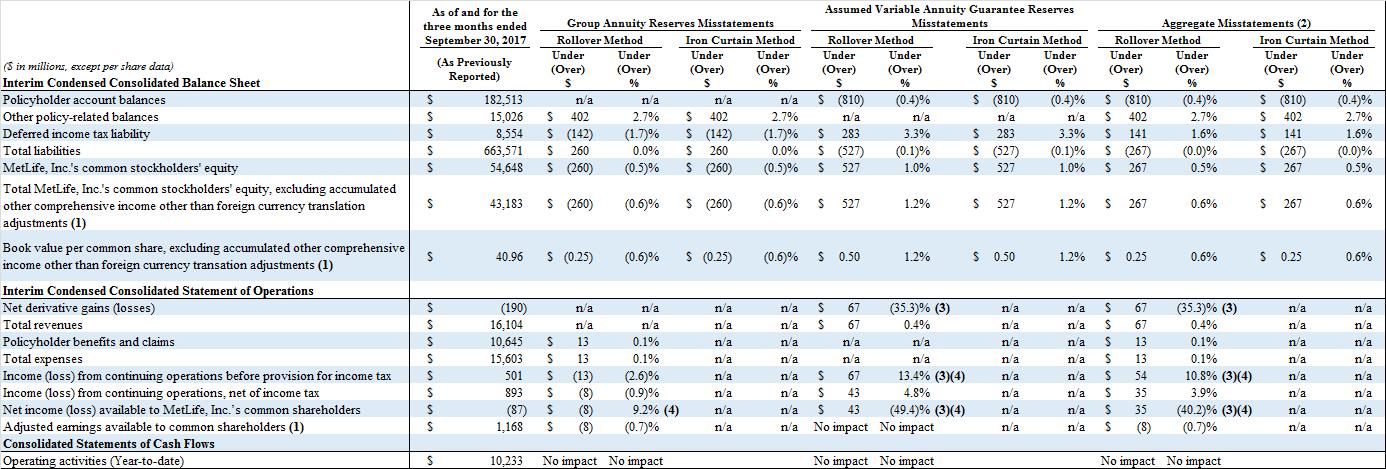
As of and for the three months ended September 30, 2017
| (1) | Reconciliations of thesenon-GAAP measures to comparable GAAP measures can be found in Forms8-K containing the Company’s quarterly earnings releases. |
| (2) | “Aggregate Misstatements” represents the combined impact of the group annuity reserves and assumed variable annuity guarantee reserves misstatements only. It does not include the impact of various unrelated immaterial adjustments, representing items that were errors in prior periods that were recorded as part of the revision, for which the impact did not have more that an insignificant affect to any line item individually or in the aggregate. |
| (3) | While the percentage exceeds the 5% threshold, it refers or directly relates to net NDGL. NDGL is subject to significant fluctuation from period to period due to changes in equity markets, foreign exchange rates, and interest rate market changes and, therefore, not subject to a trend analysis. In addition, the Company excludes NDGL from its segment performance reporting metric, adjusted earnings. Further, NDGL is only one component of total revenues. The percentage for total revenues did not exceed the 5% threshold. |
| (4) | See the Company’s response to Comment #4 in the main body of this letter in the section titled, “Three Months Ended September 30, 2017 and Year Ended December 31, 2017” for additional analysis. |
As of and for the three months ended Group Annuity Reserves Misstatements Assumed Variable Annuity Guarantee Reserves Misstatements Aggregate Misstatements (2) September 30, 2017 Rollover Method Iron Curtain Method Rollover Method Iron Curtain Method Rollover Method Iron Curtain Method Under Under Under Under Under Under Under Under Under Under Under Under ($ in millions, except per share data) (As Previously (Over) (Over) (Over) (Over) (Over) (Over) (Over) (Over) (Over) (Over) (Over) (Over) Interim Condensed Consolidated Balance Sheet Reported) $ % $ % $ % $ % $ % $ % Policyholder account balances $ 182,513 n/a n/a n/a n/a $ (810) (0.4)% $ (810) (0.4)% $ (810) (0.4)% $ (810) (0.4)% Other policy-related balances $ 15,026 $ 402 2.7% $ 402 2.7% n/a n/a n/a n/a $ 402 2.7% $ 402 2.7% Deferred income tax liability $ 8,554 $ (142) (1.7)% $ (142) (1.7)% $ 283 3.3% $ 283 3.3% $ 141 1.6% $ 141 1.6% Total liabilities $ 663,571 $ 260 0.0% $ 260 0.0% $ (527) (0.1)% $ (527) (0.1)% $ (267) (0.0)% $ (267) (0.0)% MetLife, Inc.’s common stockholders’ equity $ 54,648 $ (260) (0.5)% $ (260) (0.5)% $ 527 1.0% $ 527 # 1.0% $ 267 0.5% $ 267 0.5% Total MetLife, Inc.’s common stockholders’ equity, excluding accumulated other $ 43,183 $ (260) (0.6)% $ (260) (0.6)% $ 527 1.2% $ 527 # 1.2% $ 267 0.6% $ 267 0.6% comprehensive income other than foreign currency translation adjustments (1) Book value per common share, excluding accumulated other comprehensive $ 40.96 $ (0.25) (0.6)% $ (0.25) (0.6)% $ 0.50 1.2% $ 0.50 1.2% $ 0.25 0.6% $ 0.25 0.6% income other than foreign currency transation adjustments (1) Interim Condensed Consolidated Statement of Operations Net derivative gains (losses) $ (190) n/a n/a n/a n/a $ 67 (35.3)% (3) n/a n/a $ 67 (35.3)% (3) n/a n/a Total revenues $ 16,104 n/a n/a n/a n/a $ 67 0.4% n/a n/a $ 67 0.4% n/a n/a Policyholder benefits and claims $ 10,645 $ 13 0.1% n/a n/a n/a n/a n/a n/a $ 13 0.1% n/a n/a Total expenses $ 15,603 $ 13 0.1% n/a n/a n/a n/a n/a n/a $ 13 0.1% n/a n/a Income (loss) from continuing operations before provision for income tax $ 501 $ (13) (2.6)% n/a n/a $ 67 13.4% (3)(4) n/a n/a $ 54 10.8% (3)(4) n/a n/a Income (loss) from continuing operations, net of income tax $ 893 $ (8) (0.9)% n/a n/a $ 43 4.8% n/a n/a $ 35 3.9% n/a n/a Net income (loss) available to MetLife, Inc.’s common shareholders $ (87) $ (8) 9.2% (4) n/a n/a $ 43 (49.4)% (3)(4) n/a n/a $ 35 (40.2)% (3)(4) n/a n/a Adjusted earnings available to common shareholders (1) $ 1,168 $ (8) (0.7)% n/a n/a No impact No impact n/a n/a $ (8) (0.7)% n/a n/a Consolidated Statements of Cash Flows Operating activities (Year-to-date) $ 10,233 No impact No impact No impact No impact No impact No impact
A-8