UNITED STATES
SECURITIES AND EXCHANGE COMMISSION
Washington, D.C. 20549
FORM N-CSR
CERTIFIED SHAREHOLDER REPORT OF REGISTERED MANAGEMENT
INVESTMENT COMPANIES
| | |
| |
| Investment Company Act file number: | | 811-09999 |
| |
| Exact name of registrant as specified in charter: | | Prudential Investment Portfolios 2 |
|
| (This Form N-CSR relates solely to the Registrant’s: PGIM Core Short-Term Bond Fund, PGIM Core Ultra Short Bond Fund and PGIM Institutional Money Market Fund.) |
| |
| Address of principal executive offices: | | 655 Broad Street, 17th Floor Newark, New Jersey 07102 |
| |
| Name and address of agent for service: | | Deborah A. Docs 655 Broad Street, 17th Floor Newark, New Jersey 07102 |
| |
| Registrant’s telephone number, including area code: | | 973-367-7521 |
| |
| Date of fiscal year end: | | 1/31/2019 |
| |
| Date of reporting period: | | 7/31/2018 |
Item 1 – Reports to Stockholders

PGIM CORE SHORT-TERM BOND FUND
PGIM CORE ULTRA SHORT BOND FUND
PGIM INSTITUTIONAL MONEY MARKET FUND
(Formerly known as Prudential Core Short-Term Bond Fund, Prudential Core Ultra Short Bond Fund and Prudential Institutional Money Market Fund)
SEMIANNUAL REPORT
JULY 31, 2018

|
PGIM Core Short-Term Bond Fund—Objective: Income consistent with relative
stability of principal PGIM Core Ultra Short Bond Fund—Objective: Current income consistent with
the preservation of capital and the maintenance of liquidity PGIM Institutional Money Market Fund—Objective: Current income consistent
with the preservation of capital and the maintenance of liquidity |
This report is not authorized for distribution to prospective investors unless preceded or accompanied by a current prospectus.
The information about the Funds’ portfolio holdings is for the period covered by this report and is subject to change thereafter.
The accompanying financial statements as of July 31, 2018 were not audited and, accordingly, no auditor’s opinion is expressed on them.
Mutual funds are distributed by Prudential Investment Management Services LLC, a Prudential Financial company and member SIPC. PGIM Fixed Income is a unit of PGIM, Inc. (PGIM), a registered investment adviser. PGIM is a Prudential Financial company. © 2018 Prudential Financial, Inc. and its related entities. PGIM and the PGIM logo are service marks of Prudential Financial, Inc. and its related entities, registered in many jurisdictions worldwide.
| | |
| 2 | | Visit our website at pgiminvestments.com |
Table of Contents
| | | | |
| Prudential Investment Portfolios 2 | | | 3 | |
This Page Intentionally Left Blank
PGIM Core Short-Term Bond Fund
Your Fund’s Performance (unaudited)
Performance data quoted represent past performance. Past performance does not guarantee future results. The investment return and principal value of an investment will fluctuate, so that an investor’s shares, when redeemed, may be worth more or less than their original cost. Current performance may be lower or higher than the past performance data quoted. An investor may obtain performance data as of the most recent month-end by visiting our website at www.pgiminvestments.com or by calling (800) 225-1852.
| | | | | | | | |
| | | Total Returns as of 7/31/18 | | Average Annual Total Returns as of 7/31/18 |
| | | Six Months* (%) | | One Year (%) | | Five Years (%) | | Ten Years (%) |
| PGIM Core Short-Term Bond |
| | 1.16 | | 2.29 | | 1.75 | | 2.29 |
| Lipper Ultra Short Obligations Funds Average |
| | 0.87 | | 1.53 | | 0.88 | | 1.18 |
| 3 Month LIBOR IX |
| | | 1.10 | | 1.84 | | 0.78 | | 0.72 |
*Not annualized
Source: PGIM Investments LLC and Lipper Inc.
The returns in the table do not reflect the deduction of taxes that a shareholder would pay on Fund distributions or following the redemption of Fund shares.
Benchmark Definitions
Lipper Ultra Short Obligations Funds Average—The Lipper Ultra Short Obligation Funds Average (Lipper Average) is based on the average return of all funds in the Lipper Ultra Short Obligation Funds universe for the periods noted. Funds in the Lipper Average primarily invest in investment-grade debt issues or better and maintain a portfolio dollar-weighted average maturity between 91 days and 365 days.
3 Month LIBOR IX—The 3 Month London InterBank Offered Rate Index is the average rate at which a panel of leading banks borrowed US dollar funds from one another with a maturity of three months during the periods noted. LIBOR is the most widely used “benchmark” or reference rate for short term interest rates.
Investors cannot invest directly in an index. The returns for the Index would be lower if they included the effects of sales charges, operating expenses of a mutual fund, or taxes. Returns for the Lipper Average reflect the deduction of operating expenses, but not sales charges or taxes.
| | | | |
| Prudential Investment Portfolios 2 | | | 5 | |
PGIM Core Short-Term Bond Fund
Your Fund’s Performance (continued)
| | | | | | |
| Distributions and Yields as of 7/31/18 |
| | Total Distributions
Paid for
Six Months ($) | | SEC 30-Day
Subsidized
Yield* (%) | | SEC 30-Day
Unsubsidized
Yield** (%) |
| PGIM Core Short-Term Bond Fund | | 0.12 | | 2.63 | | 2.63 |
*SEC 30-Day Subsidized Yield (%)—A standardized yield calculation created by the Securities and Exchange Commission, it reflects the income earned during a 30-day period, after the deduction of the Fund’s net expenses (net of any expense waivers or reimbursements).
**SEC 30-Day Unsubsidized Yield (%)—A standardized yield calculation created by the Securities and Exchange Commission, it reflects the income earned during a 30-day period, after the deduction of the Fund’s gross expenses.
| | | | |
| Credit Quality expressed as a percentage of total investments as of 7/31/18 (%) | |
| AAA | | | 25.6 | |
| AA | | | 14.8 | |
| A | | | 19.3 | |
| BBB | | | 8.2 | |
| BB | | | 2.3 | |
| B | | | 0.6 | |
| D | | | 0.1 | |
| Not Rated | | | 0.3 | |
| Cash/Equivalents | | | 28.9 | |
| Total Investments | | | 100.0 | |
Source: PGIM Fixed Income
Credit ratings reflect the highest rating assigned by a nationally recognized statistical rating organization (NRSRO) such as Moody’s, S&P and Fitch. Moody’s Investor Service, Inc. (Moody’s), S&P Global Ratings (S&P), or Fitch, Inc. (Fitch). Credit ratings reflect the common nomenclature used by both S&P and Fitch. Where applicable, ratings are converted to the comparable S&P/Fitch rating tier nomenclature. These rating agencies are independent, and are widely used. The Not Rated category consists of securities that have not been rated by an NRSRO. Credit ratings are subject to change.
| | |
| 6 | | Visit our website at pgiminvestments.com |
PGIM Core Ultra Short Bond Fund
Your Fund’s Performance (unaudited)
Performance data quoted represent past performance. Past performance does not guarantee future results. The investment return and principal value of an investment will fluctuate, so that an investor’s shares, when redeemed, may be worth more or less than their original cost. Current performance may be lower or higher than the past performance data quoted. An investor may obtain performance data as of the most recent month-end by visiting our website at www.pgiminvestments.com or by calling (800) 225-1852.
| | | | | | | | |
| | | Total Returns as of 7/31/18 | | Average Annual Total Returns as of 7/31/18 |
| | | Six Months* (%) | | One Year (%) | | Five Years (%) | | Ten Years (%) |
| PGIM Core Ultra Short Bond Fund |
| | 0.96 | | 1.64 | | 0.64 | | 0.55 |
| iMoneyNet Prime Institutional Funds Average |
| | | 0.83 | | 1.36 | | 0.43 | | 0.36 |
*Not annualized
Source: PGIM Investments LLC and iMoneyNet Inc.
The returns in the table do not reflect the deduction of taxes that a shareholder would pay on Fund distributions or following the redemption of Fund shares.
Benchmark Definition
iMoneyNet Prime Institutional Funds Average—The iMoneyNet Prime Institutional Funds Average is based on the average return of all funds in the iMoneyNet Prime Institutional Funds universe for the periods noted. Funds in the iMoneyNet Prime Institutional Funds Average primarily invest in a variety of taxable short-term corporate and bank debt securities.
| | | | | | |
| Distributions and Yields as of 7/31/18 |
| | Total Distributions
Paid for
Six Months ($) | | SEC 30-Day
Subsidized
Yield* (%) | | SEC 30-Day
Unsubsidized
Yield** (%) |
| PGIM Core Ultra Short Bond Fund | | 0.01 | | 2.12 | | 2.12 |
*SEC 30-Day Subsidized Yield (%)—A standardized yield calculation created by the Securities and Exchange Commission, it reflects the income earned during a 30-day period, after the deduction of the Fund’s net expenses (net of any expense waivers or reimbursements).
**SEC 30-Day Unsubsidized Yield (%)—A standardized yield calculation created by the Securities and Exchange Commission, it reflects the income earned during a 30-day period, after the deduction of the Fund’s gross expenses.
| | | | |
| Prudential Investment Portfolios 2 | | | 7 | |
PGIM Core Ultra Short Bond Fund
Your Fund’s Performance (continued)
| | | | |
| Credit Quality expressed as a percentage of total investments as of 7/31/18 (%) | |
| A-1+/P-1 | | | 67.7 | |
| A-1/P-1 | | | 25.4 | |
| Not Rated | | | 6.9 | |
| Total Investments | | | 100.0 | |
Source: PGIM Fixed Income
Credit ratings reflect the highest rating assigned by an NRSRO such as Moody’s, S&P and Fitch. Moody’s Investor Service, Inc. (Moody’s), S&P Global Ratings (S&P), or Fitch, Inc. (Fitch). Credit ratings reflect the common nomenclature used by both S&P and Fitch. Where applicable, ratings are converted to the comparable S&P/Fitch rating tier nomenclature. These rating agencies are independent, and are widely used. The Not Rated category consists of securities that have not been rated by an NRSRO. Credit ratings are subject to change.
| | |
| 8 | | Visit our website at pgiminvestments.com |
PGIM Institutional Money Market Fund
Your Fund’s Performance (unaudited)
Performance data quoted represent past performance. Past performance does not guarantee future results. The investment return and principal value of an investment will fluctuate, so that an investor’s shares, when redeemed, may be worth more or less than their original cost. Current performance may be lower or higher than the past performance data quoted. An investor may obtain performance data as of the most recent month-end by visiting our website at www.pgiminvestments.com or by calling (800) 225-1852.
| | | | | | |
| | | Total Returns as of 7/31/18 | | Average Annual Total Returns as of 7/31/18 |
| | | Six Months* (%) | | One Year (%) | | Since Inception (%) |
| PGIM Institutional Money Market Fund |
| | 0.95 | | 1.62 | | 1.20 (7/19/16) |
| iMoneyNet Prime Institutional Funds Average |
| | | 0.83 | | 1.36 | | 0.98 |
*Not annualized
Source: PGIM Investments LLC and iMoneyNet Inc.
The returns in the tables do not reflect the deduction of taxes that a shareholder would pay on Fund distributions or following the redemption of Fund shares. Since Inception returns for the Average are measured from the closest month-end to the Fund’s inception date.
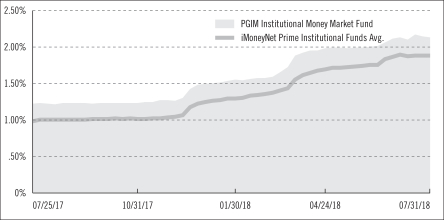
Institutional Money Market Fund Yield Comparison
| | | | |
| Prudential Investment Portfolios 2 | | | 9 | |
PGIM Institutional Money Market Fund
Your Fund’s Performance (continued)
Weighted Average Maturity* (WAM) Comparison
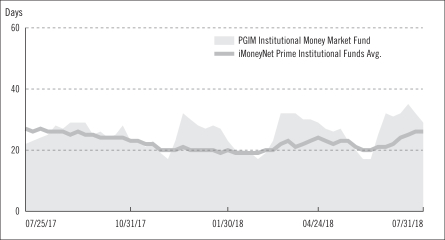
The graphs portray weekly 7-day current yields and weekly WAMs for PGIM Institutional Money Market Fund and the iMoneyNet Prime Institutional Funds Average every Tuesday from July 25, 2017 to July 31, 2018, the closest dates prior to the beginning and end of the Fund’s reporting period. Note: iMoneyNet, Inc. regularly reports a 7-day current yield and WAM on Tuesdays. As a result, the data portrayed for the Fund at the end of the reporting period in the graphs may not match the data portrayed in the Fund’s performance table as of July 31, 2018.
* Weighted Average Maturity is based on the dollar-weighted average length of time until principal payments are expected or until securities reach maturity, taking into account any maturity shortening feature such as a call, refunding, or redemption provision.
Benchmark Definition
iMoneyNet Prime Institutional Funds Average—The iMoneyNet Prime Institutional Funds Average is based on the average return of all funds in the iMoneyNet Prime Institutional Funds universe for the periods noted. Funds in the iMoneyNet Prime Institutional Funds Average primarily invest in a variety of taxable short-term corporate and bank debt securities.
| | |
| 10 | | Visit our website at pgiminvestments.com |
Fees and Expenses (unaudited)
As a shareholder of a Fund, you incur two types of costs: (1) transaction costs, including sales charges (loads) on purchase payments and redemptions, as applicable, and (2) ongoing costs, including management fees, distribution, and/or service (12b-1) fees, and other Fund expenses, as applicable. This example is intended to help you understand your ongoing costs (in dollars) of investing in the Fund and to compare these costs with the ongoing costs of investing in other mutual funds.
The example is based on an investment of $1,000 held through the six-month period ended July 31, 2018. The example is for illustrative purposes only; you should consult the Prospectus for information on initial and subsequent minimum investment requirements.
Actual Expenses
The first line for each share class in the table on the following page provides information about actual account values and actual expenses. You may use the information on this line, together with the amount you invested, to estimate the expenses that you paid over the period. Simply divide your account value by $1,000 (for example, an $8,600 account value ÷ $1,000 = 8.6), then multiply the result by the number on the first line under the heading “Expenses Paid During the Six-Month Period” to estimate the expenses you paid on your account during this period.
Hypothetical Example for Comparison Purposes
The second line for each share class in the table on the following page provides information about hypothetical account values and hypothetical expenses based on the Fund’s actual expense ratio and an assumed rate of return of 5% per year before expenses, which is not the Fund’s actual return. The hypothetical account values and expenses may not be used to estimate the actual ending account balance or expenses you paid for the period. You may use this information to compare the ongoing costs of investing in the Fund and other funds. To do so, compare this 5% hypothetical example with the 5% hypothetical examples that appear in the shareholder reports of the other funds.
Please note that the expenses shown in the table are meant to highlight your ongoing costs only and do not reflect any transactional costs such as sales charges (loads). Therefore, the second line for each share class in the table is useful in comparing ongoing costs only and will not help you determine the relative total costs of owning different funds. In addition, if these transactional costs were included, your costs would have been higher.
| | | | |
| Prudential Investment Portfolios 2 | | | 11 | |
Fees and Expenses (continued)
| | | | | | | | | | | | | | | | | | |
PGIM Core
Short-Term
Bond Fund | | Beginning Account
Value
February 1, 2018 | | | Ending Account
Value
July 31, 2018 | | | Annualized
Expense Ratio
Based on the
Six-Month Period | | | Expenses Paid
During the
Six-Month Period* | |
| Class A | | Actual | | $ | 1,000.00 | | | $ | 1,011.60 | | | | 0.03 | % | | $ | 0.15 | |
| | Hypothetical | | $ | 1,000.00 | | | $ | 1,024.65 | | | | 0.03 | % | | $ | 0.15 | |
| | | | | | | | | | | | | | | | | | |
PGIM Core
Ultra Short Bond Fund | | Beginning Account
Value
February 1, 2018 | | | Ending Account
Value
July 31, 2018 | | | Annualized
Expense Ratio
Based on the
Six-Month Period | | | Expenses Paid
During the
Six-Month Period* | |
| Class A | | Actual | | $ | 1,000.00 | | | $ | 1,009.60 | | | | 0.01 | % | | $ | 0.05 | |
| | Hypothetical | | $ | 1,000.00 | | | $ | 1,024.74 | | | | 0.01 | % | | $ | 0.05 | |
| | | | | | | | | | | | | | | | | | |
PGIM
Institutional Money
Market Fund | | Beginning Account
Value
February 1, 2018 | | | Ending Account
Value
July 31, 2018 | | | Annualized
Expense Ratio
Based on the
Six-Month Period | | | Expenses Paid
During the
Six-Month Period* | |
| Class A | | Actual | | $ | 1,000.00 | | | $ | 1,009.50 | | | | 0.07 | % | | $ | 0.35 | |
| | Hypothetical | | $ | 1,000.00 | | | $ | 1,024.45 | | | | 0.07 | % | | $ | 0.35 | |
*Series expenses (net of fee waivers or subsidies, if any) are equal to the annualized expense ratio (provided in the table), multiplied by the average account value over the period, multiplied by the 181 days in the six-month period ended July 31, 2018, and divided by the 365 days in the Series’ fiscal year ending January 31, 2019 (to reflect the six-month period). Expenses presented in the table include the expenses of any underlying portfolios in which the Fund may invest.
| | |
| 12 | | Visit our website at pgiminvestments.com |
PGIM Core Short-Term Bond Fund
Schedule of Investments (unaudited)
as of July 31, 2018
| | | | | | | | | | | | | | | | |
| Description | | Interest
Rate | | | Maturity
Date | | | Principal
Amount (000)# | | | Value | |
LONG-TERM INVESTMENTS 72.1% | | | | | | | | | | | | | | | | |
| | | | |
ASSET-BACKED SECURITIES 18.4% | | | | | | | | | | | | | | | | |
| | | | |
Automobiles 6.5% | | | | | | | | | | | | | | | | |
Ally Auto Receivables Trust, | | | | | | | | | | | | | | | | |
Series 2018-3, Class A3 | | | 3.000 | % | | | 01/17/23 | | | | 15,000 | | | $ | 14,986,335 | |
Ally Master Owner Trust, | | | | | | | | | | | | | | | | |
Series 2017-3, Class A1, 1 Month LIBOR + 0.430% | | | 2.502 | (c) | | | 06/15/22 | | | | 6,600 | | | | 6,619,496 | |
Series 2018-2, Class A | | | 3.290 | | | | 05/15/23 | | | | 9,100 | | | | 9,114,599 | |
Bank of The West Auto Trust, | | | | | | | | | | | | | | | | |
Series 2017-1, Class A2, 144A | | | 1.780 | | | | 02/15/21 | | | | 944 | | | | 939,401 | |
Series 2017-1, Class A3, 144A | | | 2.110 | | | | 01/15/23 | | | | 1,000 | | | | 982,061 | |
BMW Floorplan Master Owner Trust, | | | | | | | | | | | | | | | | |
Series 2018-1, Class A1, 144A | | | 3.150 | | | | 05/15/23 | | | | 5,000 | | | | 4,990,191 | |
CarMax Auto Owner Trust, | | | | | | | | | | | | | | | | |
Series 2017-4, Class A3 | | | 2.110 | | | | 10/17/22 | | | | 2,300 | | | | 2,264,245 | |
Series 2018-1, Class A3 | | | 2.480 | | | | 11/15/22 | | | | 2,900 | | | | 2,868,127 | |
Series 2018-2, Class A3 | | | 2.980 | | | | 01/17/23 | | | | 4,800 | | | | 4,781,966 | |
Series 2018-3, Class A3^ | | | 3.130 | | | | 06/15/23 | | | | 9,100 | | | | 9,098,760 | |
Ford Credit Auto Lease Trust, | | | | | | | | | | | | | | | | |
Series 2018-A, Class A2A | | | 2.710 | | | | 12/15/20 | | | | 8,600 | | | | 8,592,216 | |
Ford Credit Auto Owner Trust, | | | | | | | | | | | | | | | | |
Series 2014-2, Class A, 144A | | | 2.310 | | | | 04/15/26 | | | | 2,800 | | | | 2,777,283 | |
Series 2016-1, Class A, 144A | | | 2.310 | | | | 08/15/27 | | | | 3,250 | | | | 3,179,008 | |
Ford Credit Floorplan Master Owner Trust A, | | | | | | | | | | | | | | | | |
Series 2016-5, Class A1 | | | 1.950 | | | | 11/15/21 | | | | 4,500 | | | | 4,442,342 | |
Series 2016-5, Class A2, 1 Month LIBOR + 0.460% | | | 2.532 | (c) | | | 11/15/21 | | | | 3,915 | | | | 3,924,970 | |
Series 2017-2, Class A2, 1 Month LIBOR + 0.350% | | | 2.422 | (c) | | | 09/15/22 | | | | 7,500 | | | | 7,512,759 | |
GM Financial Automobile Leasing Trust, | | | | | | | | | | | | | | | | |
Series 2017-2, Class A2B, 1 Month LIBOR + 0.300% | | | 2.386 | (c) | | | 01/21/20 | | | | 1,872 | | | | 1,872,849 | |
Series 2017-3, Class A2B, 1 Month LIBOR + 0.240% | | | 2.326 | (c) | | | 01/21/20 | | | | 2,401 | | | | 2,402,229 | |
Series 2018-2, Class A2A | | | 2.830 | | | | 07/20/20 | | | | 11,000 | | | | 10,999,027 | |
GM Financial Consumer Automobile Receivables Trust, | | | | | | | | | | | | | | | | |
Series 2018-3, Class A3 | | | 3.020 | | | | 05/16/23 | | | | 4,100 | | | | 4,092,493 | |
GMF Floorplan Owner Revolving Trust, | | | | | | | | | | | | | | | | |
Series 2017-2, Class A2, 144A, 1 Month LIBOR + 0.430% | | | 2.502 | (c) | | | 07/15/22 | | | | 9,000 | | | | 9,022,892 | |
Honda Auto Receivables Owner Trust, | | | | | | | | | | | | | | | | |
Series 2018-2, Class A3 | | | 3.010 | | | | 05/18/22 | | | | 4,800 | | | | 4,798,420 | |
Hyundai Auto Lease Securitization Trust, | | | | | | | | | | | | | | | | |
Series 2017-A, Class A2B, 144A, 1 Month LIBOR + 0.300% | | | 2.372 | (c) | | | 07/15/19 | | | | 948 | | | | 948,293 | |
Mercedes-Benz Auto Receivables Trust, | | | | | | | | | | | | | | | | |
Series 2018-1, Class A3 | | | 3.030 | | | | 01/17/23 | | | | 4,300 | | | | 4,295,356 | |
See Notes to Financial Statements.
| | | | |
| Prudential Investment Portfolios 2/PGIM Core Short-Term Bond Fund | | | 13 | |
PGIM Core Short-Term Bond Fund
Schedule of Investments (unaudited) (continued)
as of July 31, 2018
| | | | | | | | | | | | | | | | |
| Description | | Interest
Rate | | | Maturity
Date | | | Principal
Amount (000)# | | | Value | |
ASSET-BACKED SECURITIES (Continued) | | | | | | | | | | | | | | | | |
| | | | |
Automobiles (cont’d.) | | | | | | | | | | | | | | | | |
Nissan Auto Lease Trust, | | | | | | | | | | | | | | | | |
Series 2017-A, Class A2B, 1 Month LIBOR + 0.200% | | | 2.272 | %(c) | | | 09/16/19 | | | | 5,657 | | | $ | 5,656,475 | |
Series 2017-B, Class A2B, 1 Month LIBOR + 0.210% | | | 2.282 | (c) | | | 12/16/19 | | | | 5,100 | | | | 5,100,807 | |
Nissan Auto Receivables Owner Trust, | | | | | | | | | | | | | | | | |
Series 2018-B, Class A3 | | | 3.060 | | | | 03/15/23 | | | | 4,300 | | | | 4,294,928 | |
Nissan Master Owner Trust Receivables, | | | | | | | | | | | | | | | | |
Series 2017-B, Class A, 1 Month LIBOR + 0.430% | | | 2.502 | (c) | | | 04/18/22 | | | | 20,000 | | | | 20,069,988 | |
Santander Retail Auto Lease Trust, | | | | | | | | | | | | | | | | |
Series 2017-A, Class A2A, 144A | | | 2.020 | | | | 03/20/20 | | | | 4,276 | | | | 4,259,009 | |
Series 2018-A, Class A2A, 144A | | | 2.710 | | | | 10/20/20 | | | | 9,900 | | | | 9,885,025 | |
World Omni Auto Receivables Trust, | | | | | | | | | | | | | | | | |
Series 2018-C, Class A3^ | | | 3.130 | | | | 11/15/23 | | | | 8,100 | | | | 8,099,244 | |
World Omni Automobile Lease Securitization Trust, | | | | | | | | | | | | | | | | |
Series 2018-A, Class A2 | | | 2.590 | | | | 11/16/20 | | | | 9,700 | | | | 9,682,312 | |
| | | | | | | | | | | | | | | | |
| | | | | | | | | | | | | | | 192,553,106 | |
| | | | | | | | | | | | | | | | |
| | | | |
Credit Cards 4.2% | | | | | | | | | | | | | | | | |
American Express Credit Account Master Trust, | | | | | | | | | | | | | | | | |
Series 2014-1, Class A, 1 Month LIBOR + 0.370% | | | 2.442 | (c) | | | 12/15/21 | | | | 10,000 | | | | 10,020,163 | |
Series 2018-6, Class A | | | 3.060 | | | | 02/15/24 | | | | 7,700 | | | | 7,686,734 | |
BA Credit Card Trust, | | | | | | | | | | | | | | | | |
Series 2014-A1, Class A, 1 Month LIBOR + 0.380% | | | 2.452 | (c) | | | 06/15/21 | | | | 15,129 | | | | 15,151,040 | |
Series 2016-A1, Class A, 1 Month LIBOR + 0.390% | | | 2.462 | (c) | | | 10/15/21 | | | | 14,400 | | | | 14,435,509 | |
Chase Issuance Trust, | | | | | | | | | | | | | | | | |
Series 2017-A1, Class A, 1 Month LIBOR + 0.300% | | | 2.372 | (c) | | | 01/18/22 | | | | 13,400 | | | | 13,435,775 | |
Discover Card Execution Note Trust, | | | | | | | | | | | | | | | | |
Series 2014-A1, Class A1, 1 Month LIBOR + 0.430% | | | 2.502 | (c) | | | 07/15/21 | | | | 27,100 | | | | 27,140,417 | |
Series 2014-A4, Class A4 | | | 2.120 | | | | 12/15/21 | | | | 17,400 | | | | 17,305,185 | |
Series 2016-A2, Class A2, 1 Month LIBOR + 0.540% | | | 2.612 | (c) | | | 09/15/21 | | | | 1,700 | | | | 1,703,672 | |
Series 2018-A4, Class A4 | | | 3.110 | | | | 01/16/24 | | | | 7,400 | | | | 7,393,179 | |
MBNA Credit Card Master Note Trust, | | | | | | | | | | | | | | | | |
Series 2004-A3, Class A3, 1 Month LIBOR + 0.260% | | | 2.332 | (c) | | | 08/16/21 | | | | 9,000 | | | | 9,007,599 | |
| | | | | | | | | | | | | | | | |
| | | | | | | | | | | | | | | 123,279,273 | |
| | | | | | | | | | | | | | | | |
| | | | |
Home Equity Loans 5.4% | | | | | | | | | | | | | | | | |
ABFC Trust, | | | | | | | | | | | | | | | | |
Series 2003-AHL1, Class A1 | | | 4.184 | | | | 03/25/33 | | | | 293 | | | | 291,492 | |
Series 2003-OPT1, Class A3, 1 Month LIBOR + 0.680% | | | 2.744 | (c) | | | 04/25/33 | | | | 765 | | | | 750,943 | |
See Notes to Financial Statements.
| | | | | | | | | | | | | | | | |
| Description | | Interest
Rate | | | Maturity
Date | | | Principal
Amount (000)# | | | Value | |
ASSET-BACKED SECURITIES (Continued) | | | | | | | | | | | | | | | | |
| | | | |
Home Equity Loans (cont’d.) | | | | | | | | | | | | | | | | |
ABFC Trust, (cont’d.) | | | | | | | | | | | | | | | | |
Series 2004-HE1, Class M1, 1 Month LIBOR + 0.900% | | | 2.964 | %(c) | | | 03/25/34 | | | | 752 | | | $ | 750,931 | |
Series 2004-OPT5, Class A4, 1 Month LIBOR + 1.250% | | | 3.314 | (c) | | | 06/25/34 | | | | 5,319 | | | | 5,370,530 | |
Accredited Mortgage Loan Trust, | | | | | | | | | | | | | | | | |
Series 2004-4, Class A2D, 1 Month LIBOR + 0.700% | | | 2.764 | (c) | | | 01/25/35 | | | | 1,303 | | | | 1,298,069 | |
ACE Securities Corp. Home Equity Loan Trust, | | | | | | | | | | | | | | | | |
Series 2003-HE1, Class M2, 1 Month LIBOR + 2.550% | | | 4.614 | (c) | | | 11/25/33 | | | | 54 | | | | 56,299 | |
Series 2003-OP1, Class M1, 1 Month LIBOR + 1.050% | | | 3.114 | (c) | | | 12/25/33 | | | | 1,753 | | | | 1,741,402 | |
Series 2004-OP1, Class M1, 1 Month LIBOR + 0.780% | | | 2.844 | (c) | | | 04/25/34 | | | | 3,464 | | | | 3,419,615 | |
Ameriquest Mortgage Securities, Inc., Asset-Backed Pass-Through Certificates, | | | | | | | | | | | | | | | | |
Series 2003-1, Class M1, 1 Month LIBOR + 1.350% | | | 3.414 | (c) | | | 02/25/33 | | | | 5,493 | | | | 5,429,968 | |
Series 2003-11, Class AV2, 1 Month LIBOR + 0.740% | | | 2.804 | (c) | | | 12/25/33 | | | | 269 | | | | 265,041 | |
Series 2003-12, Class M1, 1 Month LIBOR + 1.125% | | | 3.189 | (c) | | | 01/25/34 | | | | 286 | | | | 285,449 | |
Series 2003-8, Class M1, 1 Month LIBOR + 1.050% | | | 3.114 | (c) | | | 10/25/33 | | | | 1,901 | | | | 1,869,753 | |
Series 2003-9, Class AV2, 1 Month LIBOR + 0.680% | | | 2.744 | (c) | | | 09/25/33 | | | | 193 | | | | 191,695 | |
Argent Securities, Inc., Asset-Backed Pass-Through Certificates, | | | | | | | | | | | | | | | | |
Series 2003-W2, Class M4, 1 Month LIBOR + 5.625% | | | 7.689 | (c) | | | 09/25/33 | | | | 1,000 | | | | 949,142 | |
Series 2003-W3, Class M2, 1 Month LIBOR + 2.700% | | | 4.447 | (c) | | | 09/25/33 | | | | 9,692 | | | | 9,751,885 | |
Series 2003-W4, Class M1, 1 Month LIBOR + 1.200% | | | 3.264 | (c) | | | 10/25/33 | | | | 2,629 | | | | 2,588,484 | |
Series 2003-W5, Class M1, 1 Month LIBOR + 1.050% | | | 3.114 | (c) | | | 10/25/33 | | | | 24 | | | | 24,398 | |
Series 2004-W5, Class M1, 1 Month LIBOR + 0.900% | | | 2.964 | (c) | | | 04/25/34 | | | | 163 | | | | 162,705 | |
Series 2004-W6, Class AV2, 1 Month LIBOR + 0.900% | | | 2.964 | (c) | | | 05/25/34 | | | | 374 | | | | 372,495 | |
Series 2004-W6, Class M1, 1 Month LIBOR + 0.825% | | | 2.889 | (c) | | | 05/25/34 | | | | 361 | | | | 359,768 | |
Series 2004-W7, Class M1, 1 Month LIBOR + 0.825% | | | 2.889 | (c) | | | 05/25/34 | | | | 12,722 | | | | 12,737,971 | |
Series 2004-W8, Class A2, 1 Month LIBOR + 0.960% | | | 3.024 | (c) | | | 05/25/34 | | | | 62 | | | | 62,591 | |
Asset-Backed Securities Corp. Home Equity Loan Trust, | | | | | | | | | | | | | | | | |
Series 2003-HE6, Class A2, 1 Month LIBOR + 0.680% | | | 2.744 | (c) | | | 11/25/33 | | | | 193 | | | | 187,349 | |
Series 2004-HE3, Class M1, 1 Month LIBOR + 0.810% | | | 2.874 | (c) | | | 06/25/34 | | | | 259 | | | | 258,295 | |
Bear Stearns Asset-Backed Securities I Trust, | | | | | | | | | | | | | | | | |
Series 2004-HE07, Class M1, 1 Month LIBOR + 0.900% | | | 2.964 | (c) | | | 08/25/34 | | | | 4,293 | | | | 4,294,733 | |
Series 2004-HE10, Class M1, 1 Month LIBOR + 0.975% | | | 3.039 | (c) | | | 12/25/34 | | | | 1,216 | | | | 1,221,890 | |
Bear Stearns Asset-Backed Securities Trust, | | | | | | | | | | | | | | | | |
Series 2003-3, Class M1, 1 Month LIBOR + 1.230% | | | 3.294 | (c) | | | 06/25/43 | | | | 622 | | | | 614,126 | |
Series 2004-HE2, Class M1, 1 Month LIBOR + 0.900% | | | 2.964 | (c) | | | 03/25/34 | | | | 3,431 | | | | 3,440,715 | |
CDC Mortgage Capital Trust, | | | | | | | | | | | | | | | | |
Series 2003-HE3, Class M1, 1 Month LIBOR + 1.050% | | | 3.114 | (c) | | | 11/25/33 | | | | 2,160 | | | | 2,135,953 | |
Series 2003-HE4, Class M1, 1 Month LIBOR + 0.975% | | | 3.039 | (c) | | | 03/25/34 | | | | 809 | | | | 795,905 | |
Conseco Finance Corp., | | | | | | | | | | | | | | | | |
Series 2001-C, Class M1, 1 Month LIBOR + 0.700% | | | 2.772 | (c) | | | 08/15/33 | | | | 6 | | | | 6,339 | |
See Notes to Financial Statements.
| | | | |
| Prudential Investment Portfolios 2/PGIM Core Short-Term Bond Fund | | | 15 | |
PGIM Core Short-Term Bond Fund
Schedule of Investments (unaudited) (continued)
as of July 31, 2018
| | | | | | | | | | | | | | | | |
| Description | | Interest
Rate | | | Maturity
Date | | | Principal
Amount (000)# | | | Value | |
ASSET-BACKED SECURITIES (Continued) | | | | | | | | | | | | | | | | |
| | | | |
Home Equity Loans (cont’d.) | | | | | | | | | | | | | | | | |
Equifirst Mortgage Loan Trust, | | | | | | | | | | | | | | | | |
Series 2003-1, Class M2, 1 Month LIBOR + 2.850% | | | 4.914 | %(c) | | | 12/25/32 | | | | 77 | | | $ | 77,426 | |
Home Equity Asset Trust, | | | | | | | | | | | | | | | | |
Series 2002-3, Class M1, 1 Month LIBOR + 1.350% | | | 3.414 | (c) | | | 02/25/33 | | | | 627 | | | | 623,316 | |
Series 2002-4, Class M1, 1 Month LIBOR + 1.500% | | | 3.564 | (c) | | | 03/25/33 | | | | 452 | | | | 449,495 | |
Series 2003-2, Class M1, 1 Month LIBOR + 1.320% | | | 3.384 | (c) | | | 08/25/33 | | | | 1,090 | | | | 1,094,151 | |
Series 2003-3, Class M1, 1 Month LIBOR + 1.290% | | | 3.354 | (c) | | | 08/25/33 | | | | 1,112 | | | | 1,116,756 | |
Series 2003-4, Class M1, 1 Month LIBOR + 1.200% | | | 3.264 | (c) | | | 10/25/33 | | | | 5,755 | | | | 5,666,735 | |
Series 2003-8, Class M1, 1 Month LIBOR + 1.080% | | | 3.144 | (c) | | | 04/25/34 | | | | 423 | | | | 426,217 | |
MASTR Asset-Backed Securities Trust, | | | | | | | | | | | | | | | | |
Series 2004-OPT2, Class A1, 1 Month LIBOR + 0.700% | | | 2.764 | (c) | | | 09/25/34 | | | | 793 | | | | 786,899 | |
Series 2004-OPT2, Class A2, 1 Month LIBOR + 0.700% | | | 2.764 | (c) | | | 09/25/34 | | | | 170 | | | | 167,698 | |
Series 2004-WMC3, Class M1, 1 Month LIBOR + 0.825% | | | 2.889 | (c) | | | 10/25/34 | | | | 1,746 | | | | 1,752,125 | |
Merrill Lynch Mortgage Investors Trust, | | | | | | | | | | | | | | | | |
Series 2004-HE2, Class A1A, 1 Month LIBOR + 0.800% | | | 2.864 | (c) | | | 08/25/35 | | | | 51 | | | | 48,223 | |
Series 2004-HE2, Class M1, 1 Month LIBOR + 1.200% | | | 3.264 | (c) | | | 08/25/35 | | | | 504 | | | | 506,653 | |
Morgan Stanley ABS Capital I, Inc. Trust, | | | | | | | | | | | | | | | | |
Series 2002-NC6, Class M1, 1 Month LIBOR + 1.500% | | | 3.564 | (c) | | | 11/25/32 | | | | 337 | | | | 335,548 | |
Series 2003-HE1, Class M1, 1 Month LIBOR + 1.200% | | | 3.264 | (c) | | | 05/25/33 | | | | 1,323 | | | | 1,311,689 | |
Series 2003-NC05, Class M1, 1 Month LIBOR + 1.275% | | | 3.339 | (c) | | | 04/25/33 | | | | 2,277 | | | | 2,277,042 | |
Series 2003-NC05, Class M3, 1 Month LIBOR + 3.450% | | | 5.514 | (c) | | | 04/25/33 | | | | 88 | | | | 85,114 | |
Series 2003-NC08, Class M1, 1 Month LIBOR + 1.050% | | | 3.114 | (c) | | | 09/25/33 | | | | 1,248 | | | | 1,238,158 | |
Series 2003-NC08, Class M2, 1 Month LIBOR + 2.625% | | | 4.689 | (c) | | | 09/25/33 | | | | 61 | | | | 59,658 | |
Series 2003-NC10, Class M1, 1 Month LIBOR + 1.020% | | | 3.084 | (c) | | | 10/25/33 | | | | 235 | | | | 232,785 | |
Series 2004-HE05, Class M1, 1 Month LIBOR + 0.945% | | | 3.009 | (c) | | | 06/25/34 | | | | 803 | | | | 803,842 | |
Series 2004-HE1, Class A4, 1 Month LIBOR + 0.740% | | | 2.804 | (c) | | | 01/25/34 | | | | 1,253 | | | | 1,244,046 | |
Series 2004-HE7, Class M1, 1 Month LIBOR + 0.900% | | | 2.964 | (c) | | | 08/25/34 | | | | 3,578 | | | | 3,616,960 | |
Series 2004-HE8, Class M1, 1 Month LIBOR + 0.960% | | | 3.024 | (c) | | | 09/25/34 | | | | 18,259 | | | | 18,442,724 | |
Morgan Stanley Dean Witter Capital I, Inc., | | | | | | | | | | | | | | | | |
Series 2003-NC3, Class M1, 1 Month LIBOR + 1.350% | | | 3.414 | (c) | | | 03/25/33 | | | | 496 | | | | 496,674 | |
Morgan Stanley Dean Witter Capital I, Inc. Trust, | | | | | | | | | | | | | | | | |
Series 2002-NC5, Class M1, 1 Month LIBOR + 1.410% | | | 3.474 | (c) | | | 10/25/32 | | | | 469 | | | | 468,030 | |
Series 2002-NC5, Class M2, 1 Month LIBOR + 2.400% | | | 4.464 | (c) | | | 10/25/32 | | | | 51 | | | | 47,881 | |
New Century Home Equity Loan Trust, | | | | | | | | | | | | | | | | |
Series 2003-4, Class M1, 1 Month LIBOR + 1.125% | | | 3.189 | (c) | | | 10/25/33 | | | | 3,451 | | | | 3,449,627 | |
Series 2003-6, Class M1, 1 Month LIBOR + 1.080% | | | 3.144 | (c) | | | 01/25/34 | | | | 5,694 | | | | 5,710,351 | |
Series 2004-1, Class M1, 1 Month LIBOR + 0.885% | | | 2.949 | (c) | | | 05/25/34 | | | | 4,196 | | | | 4,170,437 | |
Series 2004-3, Class M1, 1 Month LIBOR + 0.930% | | | 2.994 | (c) | | | 11/25/34 | | | | 12,150 | | | | 12,174,852 | |
Series 2004-4, Class M1, 1 Month LIBOR + 0.765% | | | 2.829 | (c) | | | 02/25/35 | | | | 11,343 | | | | 11,278,498 | |
Option One Mortgage Loan Trust, | | | | | | | | | | | | | | | | |
Series 2004-1, Class M1, 1 Month LIBOR + 0.900% | | | 2.964 | (c) | | | 01/25/34 | | | | 1,362 | | | | 1,351,337 | |
See Notes to Financial Statements.
| | | | | | | | | | | | | | | | |
| Description | | Interest
Rate | | | Maturity
Date | | | Principal
Amount (000)# | | | Value | |
ASSET-BACKED SECURITIES (Continued) | | | | | | | | | | | | | | | | |
| | | | |
Home Equity Loans (cont’d.) | | | | | | | | | | | | | | | | |
Renaissance Home Equity Loan Trust, | | | | | | | | | | | | | | | | |
Series 2003-1, Class A, 1 Month LIBOR + 0.860% | | | 2.924 | %(c) | | | 06/25/33 | | | | 289 | | | $ | 278,598 | |
Residential Asset Securities Trust, | | | | | | | | | | | | | | | | |
Series 2004-KS1, Class AI5 | | | 5.721 | (cc) | | | 02/25/34 | | | | 2,420 | | | | 2,462,692 | |
Series 2004-KS5, Class AI5 | | | 4.904 | (cc) | | | 06/25/34 | | | | 7,892 | | | | 8,001,305 | |
Saxon Asset Securities Trust, | | | | | | | | | | | | | | | | |
Series 2001-2, Class M1, 1 Month LIBOR + 0.795% | | | 2.859 | (c) | | | 03/25/31 | | | | 377 | | | | 255,843 | |
Series 2001-3, Class M1, 1 Month LIBOR + 1.170% | | | 3.234 | (c) | | | 07/25/31 | | | | 38 | | | | 37,626 | |
Series 2003-3, Class M2, 1 Month LIBOR + 2.400% | | | 4.333 | (c) | | | 12/25/33 | | | | 67 | | | | 62,422 | |
Securitized Asset-Backed Receivables LLC Trust, | | | | | | | | | | | | | | | | |
Series 2004-NC1, Class M1, 1 Month LIBOR + 0.780% | | | 2.844 | (c) | | | 02/25/34 | | | | 3,274 | | | | 3,298,898 | |
Specialty Underwriting & Residential Finance Trust, | | | | | | | | | | | | | | | | |
Series 2004-BC1, Class M1, 1 Month LIBOR + 0.765% | | | 2.829 | (c) | | | 02/25/35 | | | | 1,736 | | | | 1,723,527 | |
| | | | | | | | | | | | | | | | |
| | | | | | | | | | | | | | | 159,317,789 | |
| | | | | | | | | | | | | | | | |
| | | | |
Residential Mortgage-Backed Securities 2.0% | | | | | | | | | | | | | | | | |
Ameriquest Mortgage Securities, Inc., Asset-Backed Pass-Through Certificates, | | | | | | | | | | | | | | | | |
Series 2004-R5, Class M1, 1 Month LIBOR + 0.870% | | | 2.934 | (c) | | | 07/25/34 | | | | 641 | | | | 642,501 | |
Series 2005-R09, Class AF5 | | | 4.461 | (cc) | | | 11/25/35 | | | | 1,109 | | | | 1,119,173 | |
Series 2005-R11, Class A2D, 1 Month LIBOR + 0.330% | | | 2.394 | (c) | | | 01/25/36 | | | | 29 | | | | 28,929 | |
Amortizing Residential Collateral Trust, | | | | | | | | | | | | | | | | |
Series 2002-BC5, Class M2, 1 Month LIBOR + 1.800% | | | 3.864 | (c) | | | 07/25/32 | | | | 80 | | | | 79,031 | |
Chase Funding Trust, | | | | | | | | | | | | | | | | |
Series 2002-2, Class 2A1, 1 Month LIBOR + 0.500% | | | 2.564 | (c) | | | 05/25/32 | | | | 403 | | | | 392,021 | |
Series 2003-1, Class 2A2, 1 Month LIBOR + 0.660% | | | 2.724 | (c) | | | 11/25/32 | | | | 540 | | | | 535,859 | |
Countrywide Asset-Backed Certificates, | | | | | | | | | | | | | | | | |
Series 2003-2, Class 3A, 1 Month LIBOR + 0.500% | | | 2.570 | (c) | | | 08/26/33 | | | | 372 | | | | 367,626 | |
Series 2003-BC4, Class M1, 1 Month LIBOR + 1.050% | | | 3.114 | (c) | | | 07/25/33 | | | | 212 | | | | 211,424 | |
Series 2004-ECC1, Class M1, 1 Month LIBOR + 0.945% | | | 3.009 | (c) | | | 11/25/34 | | | | 2,581 | | | | 2,529,860 | |
Credit-Based Asset Servicing & Securitization LLC, | | | | | | | | | | | | | | | | |
Series 2003-CB5, Class M1, 1 Month LIBOR + 1.020% | | | 3.084 | (c) | | | 11/25/33 | | | | 736 | | | | 718,531 | |
CWABS, Inc., Asset-Backed Certificates, | | | | | | | | | | | | | | | | |
Series 2004-1, Class M1, 1 Month LIBOR + 0.750% | | | 2.814 | (c) | | | 03/25/34 | | | | 513 | | | | 515,202 | |
Equity One Mortgage Pass-Through Trust, | | | | | | | | | | | | | | | | |
Series 2003-1, Class M1 | | | 4.860 | (cc) | | | 08/25/33 | | | | 98 | | | | 98,894 | |
Finance America Mortgage Loan Trust, | | | | | | | | | | | | | | | | |
Series 2004-3, Class M1, 1 Month LIBOR + 0.870% | | | 2.934 | (c) | | | 11/25/34 | | | | 7,762 | | | | 7,869,485 | |
First Franklin Mortgage Loan Trust, | | | | | | | | | | | | | | | | |
Series 2004-FF5, Class A1, 1 Month LIBOR + 0.720% | | | 2.784 | (c) | | | 08/25/34 | | | | 237 | | | | 230,463 | |
See Notes to Financial Statements.
| | | | |
| Prudential Investment Portfolios 2/PGIM Core Short-Term Bond Fund | | | 17 | |
PGIM Core Short-Term Bond Fund
Schedule of Investments (unaudited) (continued)
as of July 31, 2018
| | | | | | | | | | | | | | | | |
| Description | | Interest
Rate | | | Maturity
Date | | | Principal
Amount (000)# | | | Value | |
ASSET-BACKED SECURITIES (Continued) | | | | | | | | | | | | | | | | |
| | | | |
Residential Mortgage-Backed Securities (cont’d.) | | | | | | | | | | | | | | | | |
Fremont Home Loan Trust, | | | | | | | | | | | | | | | | |
Series 2003-B, Class M1, 1 Month LIBOR + 1.050% | | | 3.114 | %(c) | | | 12/25/33 | | | | 379 | | | $ | 372,186 | |
Series 2004-1, Class M1, 1 Month LIBOR + 0.675% | | | 2.739 | (c) | | | 02/25/34 | | | | 1,688 | | | | 1,693,725 | |
Series 2004-2, Class M1, 1 Month LIBOR + 0.855% | | | 2.919 | (c) | | | 07/25/34 | | | | 853 | | | | 867,908 | |
Series 2004-B, Class M1, 1 Month LIBOR + 0.870% | | | 2.934 | (c) | | | 05/25/34 | | | | 4,471 | | | | 4,412,356 | |
Series 2004-C, Class M1, 1 Month LIBOR + 0.975% | | | 3.039 | (c) | | | 08/25/34 | | | | 4,023 | | | | 4,025,530 | |
GSAMP Trust, | | | | | | | | | | | | | | | | |
Series 2003-FM1, Class M2, 1 Month LIBOR + 2.775% | | | 4.861 | (c) | | | 03/20/33 | | | | 64 | | | | 64,131 | |
Series 2004-FM1, Class M2, 1 Month LIBOR + 2.100% | | | 4.164 | (c) | | | 11/25/33 | | | | 11 | | | | 11,127 | |
Series 2004-NC1, Class M1, 1 Month LIBOR + 0.825% | | | 2.889 | (c) | | | 03/25/34 | | | | 2,130 | | | | 2,109,374 | |
HSI Asset Securitization Corp. Trust, | | | | | | | | | | | | | | | | |
Series 2006-OPT4, Class 2A4, 1 Month LIBOR + 0.250% | | | 2.314 | (c) | | | 03/25/36 | | | | 1,400 | | | | 1,328,795 | |
Long Beach Mortgage Loan Trust, | | | | | | | | | | | | | | | | |
Series 2003-3, Class M1, 1 Month LIBOR + 1.125% | | | 3.189 | (c) | | | 07/25/33 | | | | 1,093 | | | | 1,092,301 | |
Series 2003-4, Class M1, 1 Month LIBOR + 1.020% | | | 3.084 | (c) | | | 08/25/33 | | | | 859 | | | | 862,403 | |
Series 2004-1, Class M1, 1 Month LIBOR + 0.750% | | | 2.814 | (c) | | | 02/25/34 | | | | 12,395 | | | | 12,408,488 | |
Series 2004-2, Class M1, 1 Month LIBOR + 0.795% | | | 2.859 | (c) | | | 06/25/34 | | | | 3,386 | | | | 3,351,391 | |
Series 2004-3, Class M1, 1 Month LIBOR + 0.855% | | | 2.919 | (c) | | | 07/25/34 | | | | 3,213 | | | | 3,205,490 | |
Merrill Lynch Mortgage Investors Trust, | | | | | | | | | | | | | | | | |
Series 2003-WMC2, Class M2, 1 Month LIBOR + 2.850% | | | 4.914 | (c) | | | 02/25/34 | | | | 233 | | | | 230,057 | |
Series 2004-WMC1, Class M2, 1 Month LIBOR + 1.650% | | | 3.714 | (c) | | | 10/25/34 | | | | 1,098 | | | | 1,092,126 | |
Morgan Stanley ABS Capital I, Inc. Trust, | | | | | | | | | | | | | | | | |
Series 2004-NC05, Class M1, 1 Month LIBOR + 0.900% | | | 2.964 | (c) | | | 05/25/34 | | | | 533 | | | | 529,926 | |
Popular ABS Mortgage Pass-Through Trust, | | | | | | | | | | | | | | | | |
Series 2004-4, Class M1 | | | 4.377 | (cc) | | | 09/25/34 | | | | 812 | | | | 817,041 | |
Saxon Asset Securities Trust, | | | | | | | | | | | | | | | | |
Series 2004-2, Class AF3 | | | 4.328 | (cc) | | | 08/25/35 | | | | 1,017 | | | | 1,022,977 | |
Specialty Underwriting & Residential Finance Trust, | | | | | | | | | | | | | | | | |
Series 2003-BC1, Class M1, 1 Month LIBOR + 1.200% | | | 3.264 | (c) | | | 01/25/34 | | | | 127 | | | | 127,555 | |
Series 2003-BC3, Class M1, 1 Month LIBOR + 0.975% | | | 3.039 | (c) | | | 08/25/34 | | | | 3,934 | | | | 3,817,033 | |
Series 2004-BC4, Class A1B, 1 Month LIBOR + 0.800% | | | 2.864 | (c) | | | 10/25/35 | | | | 708 | | | | 691,397 | |
Structured Asset Investment Loan Trust, | | | | | | | | | | | | | | | | |
Series 2003-BC1, Class A2, 1 Month LIBOR + 0.680% | | | 2.744 | (c) | | | 01/25/33 | | | | 128 | | | | 127,233 | |
Structured Asset Securities Corp. Mortgage Loan Trust, | | | | | | | | | | | | | | | | |
Series 2006-OW1, Class A4, 144A, 1 Month LIBOR + 0.400% | | | 2.464 | (c) | | | 12/25/35 | | | | 72 | | | | 72,228 | |
| | | | | | | | | | | | | | | | |
| | | | | | | | | | | | | | | 59,671,777 | |
| | | | | | | | | | | | | | | | |
See Notes to Financial Statements.
| | | | | | | | | | | | | | | | |
| Description | | Interest
Rate | | | Maturity
Date | | | Principal
Amount (000)# | | | Value | |
ASSET-BACKED SECURITIES (Continued) | | | | | | | | | | | | | | | | |
| | | | |
Student Loans 0.3% | | | | | | | | | | | | | | | | |
Navient Student Loan Trust, | | | | | | | | | | | | | | | | |
Series 2016-2A, Class A1, 144A, 1 Month LIBOR + 0.750% | | | 2.814 | %(c) | | | 06/25/65 | | | | 197 | | | $ | 197,274 | |
Series 2016-3A, Class A1, 144A, 1 Month LIBOR + 0.600% | | | 2.664 | (c) | | | 06/25/65 | | | | 170 | | | | 169,817 | |
Series 2016-6A, Class A1, 144A, 1 Month LIBOR + 0.480% | | | 2.544 | (c) | | | 03/25/66 | | | | 535 | | | | 535,337 | |
Series 2017-1A, Class A1, 144A, 1 Month LIBOR + 0.400% | | | 2.464 | (c) | | | 07/26/66 | | | | 601 | | | | 601,480 | |
Series 2018-3A, Class A1, 144A, 1 Month LIBOR + 0.270% | | | 2.358 | (c) | | | 03/25/67 | | | | 7,500 | | | | 7,500,121 | |
| | | | | | | | | | | | | | | | |
| | | | | | | | | | | | | | | 9,004,029 | |
| | | | | | | | | | | | | | | | |
TOTAL ASSET-BACKED SECURITIES
(cost $510,031,707) | | | | | | | | | | | | | | | 543,825,974 | |
| | | | | | | | | | | | | | | | |
| | | | |
CERTIFICATES OF DEPOSIT 1.3% | | | | | | | | | | | | | | | | |
American Express National Bank | | | 1.650 | | | | 09/19/19 | | | | 20,000 | | | | 19,815,680 | |
Nordea Bank AB, 3 Month LIBOR + 0.300% | | | 2.621 | (c) | | | 06/05/20 | | | | 9,500 | | | | 9,503,363 | |
Nordea Bank AB, 3 Month LIBOR + 0.300% | | | 2.636 | (c) | | | 06/12/20 | | | | 10,000 | | | | 10,003,640 | |
| | | | | | | | | | | | | | | | |
TOTAL CERTIFICATES OF DEPOSIT
(cost $39,466,499) | | | | | | | | | | | | | | | 39,322,683 | |
| | | | | | | | | | | | | | | | |
| | | | |
COMMERCIAL MORTGAGE-BACKED SECURITIES 14.6% | | | | | | | | | | | | | | | | |
BANK, | | | | | | | | | | | | | | | | |
Series 2017-BNK5, Class A1 | | | 1.909 | | | | 06/15/60 | | | | 1,798 | | | | 1,751,923 | |
BX Commercial Mortgage Trust, | | | | | | | | | | | | | | | | |
Series 2018-BIOA, Class A, 144A, 1 Month LIBOR + 0.671% | | | 2.743 | (c) | | | 03/15/37 | | | | 35,000 | | | | 34,934,071 | |
CD Mortgage Trust, | | | | | | | | | | | | | | | | |
Series 2017-CD6, Class A1 | | | 2.168 | | | | 11/13/50 | | | | 3,849 | | | | 3,775,595 | |
Citigroup Commercial Mortgage Trust, | | | | | | | | | | | | | | | | |
Series 2013-GC15, Class A2 | | | 3.161 | | | | 09/10/46 | | | | 3,727 | | | | 3,726,006 | |
Series 2013-GC17, Class A2 | | | 2.962 | | | | 11/10/46 | | | | 7,801 | | | | 7,799,715 | |
Series 2015-GC27, Class A1 | | | 1.353 | | | | 02/10/48 | | | | 1,621 | | | | 1,612,897 | |
Series 2016-P4, Class A2 | | | 2.450 | | | | 07/10/49 | | | | 20,000 | | | | 19,560,818 | |
Cold Storage Trust, | | | | | | | | | | | | | | | | |
Series 2017-ICE3, Class A, 144A, 1 Month LIBOR + 1.000% | | | 3.072 | (c) | | | 04/15/36 | | | | 45,000 | | | | 45,139,959 | |
See Notes to Financial Statements.
| | | | |
| Prudential Investment Portfolios 2/PGIM Core Short-Term Bond Fund | | | 19 | |
PGIM Core Short-Term Bond Fund
Schedule of Investments (unaudited) (continued)
as of July 31, 2018
| | | | | | | | | | | | | | | | |
| Description | | Interest
Rate | | | Maturity
Date | | | Principal
Amount (000)# | | | Value | |
COMMERCIAL MORTGAGE-BACKED SECURITIES (Continued) | | | | | | | | | | | | | | | | |
Commercial Mortgage Trust, | | | | | | | | | | | | | | | | |
Series 2014-CR15, Class A2 | | | 2.928 | % | | | 02/10/47 | | | | 2,790 | | | $ | 2,790,368 | |
Series 2014-LC17, Class A1 | | | 1.381 | | | | 10/10/47 | | | | 1,250 | | | | 1,246,918 | |
Series 2014-UBS2, Class A2 | | | 2.820 | | | | 03/10/47 | | | | 15,920 | | | | 15,915,471 | |
Series 2014-UBS3, Class A2 | | | 2.844 | | | | 06/10/47 | | | | 2,170 | | | | 2,168,342 | |
Series 2014-UBS5, Class A2 | | | 3.031 | | | | 09/10/47 | | | | 5,126 | | | | 5,127,783 | |
Series 2015-CR25, Class A2 | | | 3.104 | | | | 08/10/48 | | | | 8,561 | | | | 8,543,371 | |
CSAIL Commercial Mortgage Trust, | | | | | | | | | | | | | | | | |
Series 2015-C1, Class A1 | | | 1.684 | | | | 04/15/50 | | | | 5,514 | | | | 5,473,224 | |
DBJPM Mortgage Trust, | | | | | | | | | | | | | | | | |
Series 2016-C1, Class A1 | | | 1.676 | | | | 05/10/49 | | | | 1,612 | | | | 1,584,823 | |
Series 2016-C3, Class A1 | | | 1.502 | | | | 09/10/49 | | | | 906 | | | | 884,673 | |
GE Business Loan Trust, | | | | | | | | | | | | | | | | |
Series 2006-2A, Class A, 144A, 1 Month LIBOR + 0.180% | | | 2.252 | (c) | | | 11/15/34 | | | | 1,791 | | | | 1,758,352 | |
GS Mortgage Securities Trust, | | | | | | | | | | | | | | | | |
Series 2013-GC16, Class A2 | | | 3.033 | | | | 11/10/46 | | | | 6,419 | | | | 6,416,405 | |
Hyatt Hotel Portfolio Trust, | | | | | | | | | | | | | | | | |
Series 2017-HYT2, Class A, 144A, 1 Month LIBOR + 0.658% | | | 2.730 | (c) | | | 08/09/32 | | | | 20,000 | | | | 19,987,306 | |
JP Morgan Chase Commercial Mortgage Securities Trust, | | | | | | | | | | | | | | | | |
Series 2014-C20, Class A2 | | | 2.872 | | | | 07/15/47 | | | | 8,644 | | | | 8,638,302 | |
Series 2014-C20, Class A3A2, 144A | | | 3.472 | | | | 07/15/47 | | | | 25,000 | | | | 25,066,020 | |
Series 2017-FL11, Class A, 144A, 1 Month LIBOR + 0.850% | | | 2.922 | (c) | | | 10/15/32 | | | | 20,000 | | | | 20,010,336 | |
Series 2018-WPT, Class AFL, 144A, 1 Month LIBOR + 0.950% | | | 3.040 | (c) | | | 07/05/33 | | | | 20,000 | | | | 19,987,856 | |
JPMBB Commercial Mortgage Securities Trust, | | | | | | | | | | | | | | | | |
Series 2013-C12, Class A3 | | | 3.272 | | | | 07/15/45 | | | | 10,000 | | | | 9,988,156 | |
Series 2013-C15, Class A2FL, 144A, 1 Month LIBOR + 0.650% | | | 2.723 | (c) | | | 11/15/45 | | | | 280 | | | | 280,028 | |
Series 2014-C21, Class A2 | | | 2.892 | | | | 08/15/47 | | | | 5,765 | | | | 5,763,405 | |
Series 2014-C22, Class A1 | | | 1.451 | | | | 09/15/47 | | | | 1,240 | | | | 1,236,389 | |
LSTAR Commercial Mortgage Trust, | | | | | | | | | | | | | | | | |
Series 2017-5, Class A1, 144A | | | 2.417 | | | | 03/10/50 | | | | 3,978 | | | | 3,901,633 | |
Morgan Stanley Bank of America Merrill Lynch Trust, | | | | | | | | | | | | | | | | |
Series 2013-C7, Class A3 | | | 2.655 | | | | 02/15/46 | | | | 8,772 | | | | 8,520,399 | |
Series 2014-C14, Class A2 | | | 2.916 | | | | 02/15/47 | | | | 946 | | | | 945,315 | |
Series 2014-C17, Class A2 | | | 3.119 | | | | 08/15/47 | | | | 5,213 | | | | 5,219,797 | |
Series 2014-C19, Class A1 | | | 1.573 | | | | 12/15/47 | | | | 2,915 | | | | 2,897,009 | |
Series 2014-C19, Class A2 | | | 3.101 | | | | 12/15/47 | | | | 5,000 | | | | 5,006,571 | |
Series 2015-C20, Class A1 | | | 1.405 | | | | 02/15/48 | | | | 1,728 | | | | 1,717,596 | |
See Notes to Financial Statements.
| | | | | | | | | | | | | | | | |
| Description | | Interest
Rate | | | Maturity
Date | | | Principal
Amount (000)# | | | Value | |
COMMERCIAL MORTGAGE-BACKED SECURITIES (Continued) | | | | | | | | | | | | | | | | |
Morgan Stanley Bank of America Merrill Lynch Trust, (cont’d.) | | | | | | | | | | | | | | | | |
Series 2015-C24, Class A2 | | | 3.088 | % | | | 05/15/48 | | | | 5,000 | | | $ | 4,984,878 | |
Morgan Stanley Capital I Trust, | | | | | | | | | | | | | | | | |
Series 2012-C4, Class A4 | | | 3.244 | | | | 03/15/45 | | | | 2,150 | | | | 2,139,831 | |
RETL, | | | | | | | | | | | | | | | | |
Series 2018-RVP, Class A, 144A, 1 Month LIBOR + 1.100% | | | 3.172 | (c) | | | 03/15/33 | | | | 22,845 | | | | 22,930,025 | |
Starwood Retail Property Trust, | | | | | | | | | | | | | | | | |
Series 2014-STAR, Class A, 144A, 1 Month LIBOR + 1.220% | | | 3.292 | (c) | | | 11/15/27 | | | | 22,779 | | | | 22,788,506 | |
UBS Commercial Mortgage Trust, | | | | | | | | | | | | | | | | |
Series 2017-C1, Class A1 | | | 1.887 | | | | 06/15/50 | | | | 2,472 | | | | 2,416,457 | |
UBS-Barclays Commercial Mortgage Trust, | | | | | | | | | | | | | | | | |
Series 2012-C2, Class A4 | | | 3.525 | | | | 05/10/63 | | | | 43,642 | | | | 43,765,328 | |
Series 2012-C3, Class A3 | | | 2.728 | | | | 08/10/49 | | | | 2,077 | | | | 2,060,397 | |
Series 2012-C4, Class A3 | | | 2.533 | | | | 12/10/45 | | | | 17,836 | | | | 17,621,263 | |
WFRBS Commercial Mortgage Trust, | | | | | | | | | | | | | | | | |
Series 2014-LC14, Class A3FL, 144A, 1 Month LIBOR + 0.750% | | | 2.823 | (c) | | | 03/15/47 | | | | 3,000 | | | | 3,023,625 | |
| | | | | | | | | | | | | | | | |
TOTAL COMMERCIAL MORTGAGE-BACKED SECURITIES
(cost $435,625,739) | | | | | | | | | | | | | | | 431,107,142 | |
| | | | | | | | | | | | | | | | |
| | | | |
CORPORATE BONDS 37.8% | | | | | | | | | | | | | | | | |
| | | | |
Aerospace & Defense 0.1% | | | | | | | | | | | | | | | | |
General Dynamics Corp., | | | | | | | | | | | | | | | | |
Gtd. Notes, 3 Month LIBOR + 0.290% | | | 2.646 | (c) | | | 05/11/20 | | | | 4,000 | | | | 4,013,120 | |
| | | | |
Auto Manufacturers 4.8% | | | | | | | | | | | | | | | | |
American Honda Finance Corp., | | | | | | | | | | | | | | | | |
Sr. Unsec’d. Notes, MTN, 3 Month LIBOR + 0.150% | | | 2.505 | (c) | | | 11/13/19 | | | | 5,000 | | | | 5,007,147 | |
Sr. Unsec’d. Notes, MTN, 3 Month LIBOR + 0.340% | | | 2.695 | (c) | | | 02/14/20 | | | | 26,000 | | | | 26,060,330 | |
BMW US Capital LLC (Germany), | | | | | | | | | | | | | | | | |
Gtd. Notes, 144A | | | 1.500 | | | | 04/11/19 | | | | 24,000 | | | | 23,778,385 | |
Daimler Finance North America LLC (Germany), | | | | | | | | | | | | | | | | |
Gtd. Notes, 144A, 3 Month LIBOR + 0.250% | | | 2.613 | (c) | | | 11/05/18 | | | | 9,000 | | | | 9,005,096 | |
Gtd. Notes, 144A, 3 Month LIBOR + 0.530% | | | 2.893 | (c) | | | 05/05/20 | | | | 15,000 | | | | 15,050,300 | |
Ford Motor Credit Co. LLC, | | | | | | | | | | | | | | | | |
Sr. Unsec’d. Notes, 3 Month LIBOR + 0.830% | | | 3.156 | (c) | | | 03/12/19 | | | | 4,735 | | | | 4,749,479 | |
Harley-Davidson Financial Services, Inc., | | | | | | | | | | | | | | | | |
Gtd. Notes, 144A, MTN | | | 2.250 | | | | 01/15/19 | | | | 7,000 | | | | 6,986,796 | |
See Notes to Financial Statements.
| | | | |
| Prudential Investment Portfolios 2/PGIM Core Short-Term Bond Fund | | | 21 | |
PGIM Core Short-Term Bond Fund
Schedule of Investments (unaudited) (continued)
as of July 31, 2018
| | | | | | | | | | | | | | | | |
| Description | | Interest
Rate | | | Maturity
Date | | | Principal
Amount (000)# | | | Value | |
CORPORATE BONDS (Continued) | | | | | | | | | | | | | | | | |
| | | | |
Auto Manufacturers (cont’d.) | | | | | | | | | | | | | | | | |
Harley-Davidson Financial Services, Inc., (cont’d.) | | | | | | | | | | | | | | | | |
Sr. Unsec’d. Notes, 144A, 3 Month LIBOR + 0.500% | | | 2.831 | %(c) | | | 05/21/20 | | | | 9,750 | | | $ | 9,770,793 | |
Nissan Motor Acceptance Corp., | | | | | | | | | | | | | | | | |
Sr. Unsec’d. Notes, 144A, MTN, 3 Month LIBOR + 0.390% | | | 2.727 | (c) | | | 07/13/20 | | | | 2,400 | | | | 2,402,250 | |
Toyota Motor Credit Corp., | | | | | | | | | | | | | | | | |
Sr. Unsec’d. Notes, MTN, 3 Month LIBOR + 0.060% (Cap N/A, Floor 0.000%) | | | 2.415 | (c) | | | 05/15/19 | | | | 10,000 | | | | 9,999,199 | |
Sr. Unsec’d. Notes, MTN, 3 Month LIBOR + 0.280% | | | 2.617 | (c) | | | 04/13/21 | | | | 10,000 | | | | 10,017,800 | |
Sr. Unsec’d. Notes, MTN, 3 Month LIBOR + 0.820% | | | 3.151 | (c) | | | 02/19/19 | | | | 20,000 | | | | 20,095,245 | |
| | | | | | | | | | | | | | | | |
| | | | | | | | | | | | | | | 142,922,820 | |
| | | | |
Banks 13.5% | | | | | | | | | | | | | | | | |
ABN AMRO Bank NV (Netherlands), | | | | | | | | | | | | | | | | |
Sr. Unsec’d. Notes, 144A, 3 Month LIBOR + 0.640% | | | 2.973 | (c) | | | 01/18/19 | | | | 25,000 | | | | 25,057,500 | |
Australia & New Zealand Banking Group Ltd. (Australia), | | | | | | | | | | | | | | | | |
Sr. Unsec’d. Notes, 144A, MTN, 3 Month LIBOR + 0.320% | | | 2.656 | (c) | | | 07/02/20 | | | | 25,000 | | | | 25,023,146 | |
Sr. Unsec’d. Notes, 144A, MTN, 3 Month LIBOR + 0.320% | | | 2.689 | (c) | | | 11/09/20 | | | | 600 | | | | 600,730 | |
Bank of Montreal (Canada), | | | | | | | | | | | | | | | | |
Sr. Unsec’d. Notes, MTN, 3 Month LIBOR + 0.250% | | | 2.577 | (c) | | | 09/11/19 | | | | 25,000 | | | | 25,019,953 | |
Sr. Unsec’d. Notes, MTN, 3 Month LIBOR + 0.460% | | | 2.797 | (c) | | | 04/13/21 | | | | 7,500 | | | | 7,530,810 | |
Branch Banking & Trust Co., | | | | | | | | | | | | | | | | |
Sr. Unsec’d. Notes | | | 1.450 | | | | 05/10/19 | | | | 26,000 | | | | 25,757,109 | |
Capital One NA, | | | | | | | | | | | | | | | | |
Sr. Unsec’d. Notes | | | 1.850 | | | | 09/13/19 | | | | 24,500 | | | | 24,189,363 | |
Citibank NA, | | | | | | | | | | | | | | | | |
Sr. Unsec’d. Notes, 3 Month LIBOR + 0.260% | | | 2.595 | (c) | | | 09/18/19 | | | | 699 | | | | 699,213 | |
Sr. Unsec’d. Notes, 3 Month LIBOR + 0.320% | | | 2.678 | (c) | | | 05/01/20 | | | | 20,000 | | | | 20,029,546 | |
Commonwealth Bank of Australia (Australia), | | | | | | | | | | | | | | | | |
Sr. Unsec’d. Notes, 144A, MTN, 3 Month LIBOR + 0.320% | | | 2.655 | (c) | | | 06/25/20 | | | | 16,000 | | | | 15,996,951 | |
Goldman Sachs Group, Inc. (The), | | | | | | | | | | | | | | | | |
Sr. Unsec’d. Notes, 3 Month LIBOR + 1.040% | | | 3.375 | (c) | | | 04/25/19 | | | | 25,000 | | | | 25,160,500 | |
Morgan Stanley, | | | | | | | | | | | | | | | | |
Sr. Unsec’d. Notes, GMTN | | | 2.375 | | | | 07/23/19 | | | | 10,000 | | | | 9,960,648 | |
Sr. Unsec’d. Notes, MTN, 3 Month LIBOR + 0.740% | | | 3.087 | (c) | | | 07/23/19 | | | | 1,900 | | | | 1,909,331 | |
National Australia Bank Ltd. (Australia), | | | | | | | | | | | | | | | | |
Sr. Unsec’d. Notes, 144A, MTN, 3 Month LIBOR + 0.510% | | | 2.839 | (c) | | | 05/22/20 | | | | 40,000 | | | | 40,192,830 | |
Nordea Bank AB (Sweden), | | | | | | | | | | | | | | | | |
Sr. Unsec’d. Notes, 144A, MTN, 3 Month LIBOR + 0.840% | | | 3.175 | (c) | | | 09/17/18 | | | | 16,000 | | | | 16,018,851 | |
PNC Bank NA, | | | | | | | | | | | | | | | | |
Sr. Unsec’d. Notes, 3 Month LIBOR + 0.360% | | | 2.691 | (c) | | | 05/19/20 | | | | 25,000 | | | | 25,090,870 | |
See Notes to Financial Statements.
| | | | | | | | | | | | | | | | |
| Description | | Interest
Rate | | | Maturity
Date | | | Principal
Amount (000)# | | | Value | |
CORPORATE BONDS (Continued) | | | | | | | | | | | | | | | | |
| | | | |
Banks (cont’d.) | | | | | | | | | | | | | | | | |
Royal Bank of Canada (Canada), | | | | | | | | | | | | | | | | |
Sr. Unsec’d. Notes, GMTN, 3 Month LIBOR + 0.380% | | | 2.701 | %(c) | | | 03/02/20 | | | | 30,000 | | | $ | 30,076,345 | |
Sr. Unsec’d. Notes, GMTN, 3 Month LIBOR + 0.390% | | | 2.729 | (c) | | | 04/30/21 | | | | 10,000 | | | | 10,013,371 | |
Santander UK PLC (United Kingdom), | | | | | | | | | | | | | | | | |
Sr. Unsec’d. Notes, 3 Month LIBOR + 1.480% | | | 3.816 | (c) | | | 03/14/19 | | | | 25,000 | | | | 25,209,636 | |
Toronto-Dominion Bank (The) (Canada), | | | | | | | | | | | | | | | | |
Sr. Unsec’d. Notes, MTN, 3 Month LIBOR + 0.280% | | | 2.606 | (c) | | | 06/11/20 | | | | 20,000 | | | | 20,026,560 | |
US Bank NA, | | | | | | | | | | | | | | | | |
Sr. Unsec’d. Notes, 3 Month LIBOR + 0.250% | | | 2.592 | (c) | | | 07/24/20 | | | | 12,000 | | | | 12,011,400 | |
Sr. Unsec’d. Notes, 3 Month LIBOR + 0.320% | | | 2.655 | (c) | | | 04/26/21 | | | | 13,000 | | | | 13,012,813 | |
| | | | | | | | | | | | | | | | |
| | | | | | | | | | | | | | | 398,587,476 | |
| | | | |
Beverages 0.3% | | | | | | | | | | | | | | | | |
PepsiCo, Inc., | | | | | | | | | | | | | | | | |
Sr. Unsec’d. Notes, 3 Month LIBOR + 0.590% | | | 2.919 | (c) | | | 02/22/19 | | | | 10,000 | | | | 10,032,264 | |
| | | | |
Biotechnology 2.1% | | | | | | | | | | | | | | | | |
Amgen, Inc., | | | | | | | | | | | | | | | | |
Sr. Unsec’d. Notes | | | 1.900 | | | | 05/10/19 | | | | 20,000 | | | | 19,875,881 | |
Sr. Unsec’d. Notes, 3 Month LIBOR + 0.320% | | | 2.673 | (c) | | | 05/10/19 | | | | 30,000 | | | | 30,062,286 | |
Gilead Sciences, Inc., | | | | | | | | | | | | | | | | |
Sr. Unsec’d. Notes | | | 1.850 | | | | 09/04/18 | | | | 12,000 | | | | 11,994,120 | |
| | | | | | | | | | | | | | | | |
| | | | | | | | | | | | | | | 61,932,287 | |
| | | | |
Chemicals 0.0% | | | | | | | | | | | | | | | | |
EI du Pont de Nemours & Co., | | | | | | | | | | | | | | | | |
Sr. Unsec’d. Notes, 3 Month LIBOR + 0.530% | | | 2.888 | (c) | | | 05/01/20 | | | | 460 | | | | 462,553 | |
| | | | |
Commercial Services 0.9% | | | | | | | | | | | | | | | | |
Western Union Co. (The), | | | | | | | | | | | | | | | | |
Sr. Unsec’d. Notes, 3 Month LIBOR + 0.800% | | | 3.129 | (c) | | | 05/22/19 | | | | 25,500 | | | | 25,567,134 | |
| | | | |
Computers 2.9% | | | | | | | | | | | | | | | | |
Apple, Inc., | | | | | | | | | | | | | | | | |
Sr. Unsec’d. Notes | | | 1.500 | | | | 09/12/19 | | | | 25,000 | | | | 24,702,821 | |
See Notes to Financial Statements.
| | | | |
| Prudential Investment Portfolios 2/PGIM Core Short-Term Bond Fund | | | 23 | |
PGIM Core Short-Term Bond Fund
Schedule of Investments (unaudited) (continued)
as of July 31, 2018
| | | | | | | | | | | | | | | | |
| Description | | Interest
Rate | | | Maturity
Date | | | Principal
Amount (000)# | | | Value | |
CORPORATE BONDS (Continued) | | | | | | | | | | | | | | | | |
| | | | |
Computers (cont’d.) | | | | | | | | | | | | | | | | |
Apple, Inc., (cont’d.) | | | | | | | | | | | | | | | | |
Sr. Unsec’d. Notes, 3 Month LIBOR + 0.820% | | | 3.150 | %(c) | | | 02/22/19 | | | | 10,000 | | | $ | 10,047,423 | |
Hewlett Packard Enterprise Co., | | | | | | | | | | | | | | | | |
Sr. Unsec’d. Notes, 144A | | | 2.100 | | | | 10/04/19 | | | | 28,000 | | | | 27,665,578 | |
IBM Credit LLC, | | | | | | | | | | | | | | | | |
Sr. Unsec’d. Notes | | | 1.625 | | | | 09/06/19 | | | | 25,000 | | | | 24,712,501 | |
| | | | | | | | | | | | | | | | |
| | | | | | | | | | | | | | | 87,128,323 | |
| | | | |
Cosmetics/Personal Care 0.7% | | | | | | | | | | | | | | | | |
Unilever Capital Corp. (United Kingdom), | | | | | | | | | | | | | | | | |
Gtd. Notes | | | 1.800 | | | | 05/05/20 | | | | 20,000 | | | | 19,613,142 | |
| | | | |
Diversified Financial Services 0.4% | | | | | | | | | | | | | | | | |
American Express Credit Corp., | | | | | | | | | | | | | | | | |
Sr. Unsec’d. Notes, MTN, 3 Month LIBOR + 0.730% | | | 3.049 | (c) | | | 05/26/20 | | | | 1,000 | | | | 1,008,739 | |
Charles Schwab Corp. (The), | | | | | | | | | | | | | | | | |
Sr. Unsec’d. Notes, 3 Month LIBOR + 0.320% | | | 2.649 | (c) | | | 05/21/21 | | | | 10,500 | | | | 10,537,275 | |
Lehman Brothers Holdings, Inc., | | | | | | | | | | | | | | | | |
Sr. Unsec’d. Notes, MTN(d) | | | 3.000 | | | | 05/25/10 | | | | 50,000 | | | | 1,545,000 | |
| | | | | | | | | | | | | | | | |
| | | | | | | | | | | | | | | 13,091,014 | |
| | | | |
Electric 2.7% | | | | | | | | | | | | | | | | |
American Electric Power Co., Inc., | | | | | | | | | | | | | | | | |
Sr. Unsec’d. Notes | | | 2.150 | | | | 11/13/20 | | | | 25,000 | | | | 24,377,490 | |
Black Hills Corp., | | | | | | | | | | | | | | | | |
Sr. Unsec’d. Notes | | | 2.500 | | | | 01/11/19 | | | | 17,572 | | | | 17,535,227 | |
Georgia Power Co., | | | | | | | | | | | | | | | | |
Sr. Unsec’d. Notes | | | 2.000 | | | | 03/30/20 | | | | 20,000 | | | | 19,644,468 | |
Pacific Gas & Electric Co., | | | | | | | | | | | | | | | | |
Sr. Unsec’d. Notes, 3 Month LIBOR + 0.230% | | | 2.549 | (c) | | | 11/28/18 | | | | 17,000 | | | | 16,948,747 | |
| | | | | | | | | | | | | | | | |
| | | | | | | | | | | | | | | 78,505,932 | |
| | | | |
Foods 0.8% | | | | | | | | | | | | | | | | |
Campbell Soup Co., | | | | | | | | | | | | | | | | |
Sr. Unsec’d. Notes, 3 Month LIBOR + 0.500% | | | 2.835 | (c) | | | 03/16/20 | | | | 9,600 | | | | 9,606,223 | |
See Notes to Financial Statements.
| | | | | | | | | | | | | | | | |
| Description | | Interest
Rate | | | Maturity
Date | | | Principal
Amount (000)# | | | Value | |
CORPORATE BONDS (Continued) | | | | | | | | | | | | | | | | |
| | | | |
Foods (cont’d.) | | | | | | | | | | | | | | | | |
General Mills, Inc., | | | | | | | | | | | | | | | | |
Sr. Unsec’d. Notes, 3 Month LIBOR + 0.540% | | | 2.879 | %(c) | | | 04/16/21 | | | | 4,600 | | | $ | 4,617,698 | |
Kellogg Co., | | | | | | | | | | | | | | | | |
Sr. Unsec’d. Notes | | | 3.250 | | | | 05/14/21 | | | | 9,650 | | | | 9,628,856 | |
| | | | | | | | | | | | | | | | |
| | | | | | | | | | | | | | | 23,852,777 | |
| | | | |
Healthcare-Products 0.1% | | | | | | | | | | | | | | | | |
Stryker Corp., | | | | | | | | | | | | | | | | |
Sr. Unsec’d. Notes | | | 2.000 | | | | 03/08/19 | | | | 1,350 | | | | 1,344,795 | |
| | | | |
Healthcare-Services 0.5% | | | | | | | | | | | | | | | | |
Anthem, Inc., | | | | | | | | | | | | | | | | |
Sr. Unsec’d. Notes | | | 2.500 | | | | 11/21/20 | | | | 15,000 | | | | 14,774,281 | |
| | | | |
Insurance 1.7% | | | | | | | | | | | | | | | | |
Ambac Assurance Corp., | | | | | | | | | | | | | | | | |
Sub. Notes, 144A | | | 5.100 | | | | 06/07/20 | | | | 11 | | | | 14,292 | |
Ambac LSNI LLC (Cayman Islands), | | | | | | | | | | | | | | | | |
Sr. Sec’d. Notes, 144A, 3 Month LIBOR + 5.000% (Cap N/A, Floor 6.000%) | | | 7.337 | (c) | | | 02/12/23 | | | | 48 | | | | 48,937 | |
Principal Life Global Funding II, | | | | | | | | | | | | | | | | |
Sec’d. Notes, 144A, 3 Month LIBOR + 0.300% | | | 2.637 | (c) | | | 06/26/20 | | | | 24,600 | | | | 24,575,382 | |
Protective Life Global Funding, | | | | | | | | | | | | | | | | |
Sr. Sec’d. Notes, 144A | | | 1.722 | | | | 04/15/19 | | | | 26,600 | | | | 26,404,681 | |
| | | | | | | | | | | | | | | | |
| | | | | | | | | | | | | | | 51,043,292 | |
| | | | |
Machinery-Construction & Mining 0.5% | | | | | | | | | | | | | | | | |
Caterpillar Financial Services Corp., | | | | | | | | | | | | | | | | |
Sr. Unsec’d. Notes, GMTN, 3 Month LIBOR + 0.290% | | | 2.611 | (c) | | | 09/04/20 | | | | 14,000 | | | | 14,034,354 | |
| | | | |
Media 0.8% | | | | | | | | | | | | | | | | |
Walt Disney Co. (The), | | | | | | | | | | | | | | | | |
Sr. Unsec’d. Notes, MTN, 3 Month LIBOR + 0.130% | | | 2.451 | (c) | | | 03/04/20 | | | | 23,000 | | | | 23,044,350 | |
| | | | |
Mining 0.2% | | | | | | | | | | | | | | | | |
Glencore Funding LLC (Switzerland), | | | | | | | | | | | | | | | | |
Gtd. Notes, 144A | | | 3.125 | | | | 04/29/19 | | | | 5,275 | | | | 5,254,164 | |
See Notes to Financial Statements.
| | | | |
| Prudential Investment Portfolios 2/PGIM Core Short-Term Bond Fund | | | 25 | |
PGIM Core Short-Term Bond Fund
Schedule of Investments (unaudited) (continued)
as of July 31, 2018
| | | | | | | | | | | | | | | | |
| Description | | Interest
Rate | | | Maturity
Date | | | Principal
Amount (000)# | | | Value | |
CORPORATE BONDS (Continued) | | | | | | | | | | | | | | | | |
| | | | |
Miscellaneous Manufacturing 0.9% | | | | | | | | | | | | | | | | |
Siemens Financieringsmaatschappij NV (Germany), | | | | | | | | | | | | | | | | |
Gtd. Notes, 144A, 3 Month LIBOR + 0.340% | | | 2.675 | %(c) | | | 03/16/20 | | | | 25,000 | | | $ | 25,083,253 | |
| | | | |
Oil & Gas 1.9% | | | | | | | | | | | | | | | | |
Chevron Corp., | | | | | | | | | | | | | | | | |
Sr. Unsec’d. Notes, 3 Month LIBOR + 0.210% | | | 2.531 | (c) | | | 03/03/20 | | | | 24,000 | | | | 24,058,393 | |
EOG Resources, Inc., | | | | | | | | | | | | | | | | |
Sr. Unsec’d. Notes | | | 5.625 | | | | 06/01/19 | | | | 8,144 | | | | 8,319,635 | |
Shell International Finance BV (Netherlands), | | | | | | | | | | | | | | | | |
Gtd. Notes | | | 1.375 | | | | 05/10/19 | | | | 25,000 | | | | 24,785,346 | |
| | | | | | | | | | | | | | | | |
| | | | | | | | | | | | | | | 57,163,374 | |
| | | | |
Pharmaceuticals 0.6% | | | | | | | | | | | | | | | | |
Bristol-Myers Squibb Co., | | | | | | | | | | | | | | | | |
Sr. Unsec’d. Notes | | | 1.600 | | | | 02/27/19 | | | | 16,800 | | | | 16,733,161 | |
CVS Health Corp., | | | | | | | | | | | | | | | | |
Sr. Unsec’d. Notes | | | 2.250 | | | | 08/12/19 | | | | 1,650 | | | | 1,640,112 | |
| | | | | | | | | | | | | | | | |
| | | | | | | | | | | | | | | 18,373,273 | |
| | | | |
Pipelines 0.0% | | | | | | | | | | | | | | | | |
Enterprise Products Operating LLC, | | | | | | | | | | | | | | | | |
Gtd. Notes | | | 6.500 | | | | 01/31/19 | | | | 600 | | | | 610,678 | |
| | | | |
Retail 1.4% | | | | | | | | | | | | | | | | |
Lowe’s Cos, Inc., | | | | | | | | | | | | | | | | |
Sr. Unsec’d. Notes, 3 Month LIBOR + 0.600% | | | 2.936 | (c) | | | 09/14/18 | | | | 5,000 | | | | 5,004,800 | |
McDonald’s Corp., | | | | | | | | | | | | | | | | |
Sr. Unsec’d. Notes, MTN | | | 2.100 | | | | 12/07/18 | | | | 26,093 | | | | 26,052,932 | |
Walmart, Inc., | | | | | | | | | | | | | | | | |
Sr. Unsec’d. Notes | | | 3.125 | | | | 06/23/21 | | | | 11,717 | | | | 11,744,211 | |
| | | | | | | | | | | | | | | | |
| | | | | | | | | | | | | | | 42,801,943 | |
See Notes to Financial Statements.
| | | | | | | | | | | | | | | | |
| Description | | Interest
Rate | | | Maturity
Date | | | Principal
Amount (000)# | | | Value | |
CORPORATE BONDS (Continued) | | | | | | | | | | | | | | | | |
| | | | |
Telecommunications 0.0% | | | | | | | | | | | | | | | | |
AT&T, Inc., | | | | | | | | | | | | | | | | |
Sr. Unsec’d. Notes | | | 2.300 | % | | | 03/11/19 | | | | 133 | | | $ | 132,720 | |
Verizon Communications, Inc., | | | | | | | | | | | | | | | | |
Sr. Unsec’d. Notes, 3 Month LIBOR + 0.550% (Cap N/A, Floor 0.000%) | | | 2.879 | (c) | | | 05/22/20 | | | | 800 | | | | 805,418 | |
| | | | | | | | | | | | | | | | |
| | | | | | | | | | | | | | | 938,138 | |
| | | | | | | | | | | | | | | | |
TOTAL CORPORATE BONDS
(cost $1,157,070,200) | | | | | | | | | | | | | | | 1,120,174,737 | |
| | | | | | | | | | | | | | | | |
TOTAL LONG-TERM INVESTMENTS
(cost $2,142,194,145) | | | | | | | | | | | | | | | 2,134,430,536 | |
| | | | | | | | | | | | | | | | |
| | | | |
| | | | | | | | | Shares | | | | |
| | | | |
SHORT-TERM INVESTMENTS 28.3% | | | | | | | | | | | | | | | | |
| | | | |
AFFILIATED MUTUAL FUND 3.6% | | | | | | | | | | | | | | | | |
PGIM Core Ultra Short Bond Fund
(cost $107,997,220)(w) | | | | | | | | | | | 107,997,220 | | | | 107,997,220 | |
| | | | | | | | | | | | | | | | |
| | | | |
| | | | | | | | | Principal
Amount (000)# | | | | |
CERTIFICATES OF DEPOSIT 6.6% | | | | | | | | | | | | | | | | |
Bank of Nova Scotia, 1 Month LIBOR + 0.310% | | | 2.396 | %(c) | | | 06/20/19 | | | | 25,000 | | | | 25,009,925 | |
Canadian Imperial Bank of Commerce, 3 Month LIBOR + 0.320% | | | 2.659 | (c) | | | 07/08/19 | | | | 24,650 | | | | 24,693,288 | |
Mizuho Bank Ltd., 3 Month LIBOR + 0.500% | | | 2.835 | (c) | | | 09/24/18 | | | | 20,000 | | | | 20,004,456 | |
Natixis SA, 1 Month LIBOR + 0.350% | | | 2.436 | (c) | | | 03/05/19 | | | | 25,000 | | | | 25,008,875 | |
Sumitomo Mitsui Banking Corp., 1 Month LIBOR + 0.210% | | | 2.292 | (c) | | | 09/19/18 | | | | 25,000 | | | | 25,003,150 | |
Sumitomo Mitsui Trust Bank Ltd., 1 Month LIBOR + 0.230% | | | 2.309 | (c) | | | 09/18/18 | | | | 25,000 | | | | 25,003,850 | |
Svenska Handelsbanken, 3 Month LIBOR + 0.400% | | | 2.211 | (c) | | | 02/12/19 | | | | 25,000 | | | | 25,039,556 | |
Toronto-Dominion Bank (The), 1 Month LIBOR + 0.190% | | | 2.262 | (c) | | | 08/28/18 | | | | 25,000 | | | | 25,004,800 | |
| | | | | | | | | | | | | | | | |
TOTAL CERTIFICATES OF DEPOSIT
(cost $194,659,535) | | | | | | | | | | | | | | | 194,767,900 | |
| | | | | | | | | | | | | | | | |
See Notes to Financial Statements.
| | | | |
| Prudential Investment Portfolios 2/PGIM Core Short-Term Bond Fund | | | 27 | |
PGIM Core Short-Term Bond Fund
Schedule of Investments (unaudited) (continued)
as of July 31, 2018
| | | | | | | | | | | | | | | | |
| Description | | Interest
Rate | | | Maturity
Date | | | Principal
Amount (000)# | | | Value | |
COMMERCIAL PAPER 18.1% | | | | | | | | | | | | | | | | |
American Water Capital Corp., | | | | | | | | | | | | | | | | |
144A | | | 2.602 | %(n) | | | 09/18/18 | | | | 8,000 | | | $ | 7,974,814 | |
144A | | | 2.602 | (n) | | | 09/19/18 | | | | 7,000 | | | | 6,977,474 | |
Anthem, Inc., 144A | | | 2.180 | (n) | | | 08/01/18 | | | | 10,000 | | | | 9,999,391 | |
AON Corp., | | | | | | | | | | | | | | | | |
144A | | | 2.515 | (n) | | | 08/30/18 | | | | 3,000 | | | | 2,994,350 | |
144A | | | 2.705 | (n) | | | 09/14/18 | | | | 6,000 | | | | 5,982,450 | |
BAT International Finance PLC, 144A | | | 2.756 | (n) | | | 09/10/18 | | | | 18,000 | | | | 17,952,461 | |
Bell Canada, Inc., | | | | | | | | | | | | | | | | |
144A | | | 2.464 | (n) | | | 09/04/18 | | | | 1,000 | | | | 997,796 | |
144A | | | 2.576 | (n) | | | 09/24/18 | | | | 24,000 | | | | 23,914,457 | |
Campbell Soup Co., | | | | | | | | | | | | | | | | |
144A | | | 2.590 | (n) | | | 09/17/18 | | | | 13,000 | | | | 12,959,197 | |
144A | | | 2.602 | (n) | | | 09/24/18 | | | | 2,000 | | | | 1,992,673 | |
Celgene Corp., 144A | | | 2.494 | (n) | | | 08/27/18 | | | | 13,000 | | | | 12,977,975 | |
Dominion Resources, Inc., 144A | | | 2.389 | (n) | | | 09/13/18 | | | | 9,000 | | | | 8,974,315 | |
Electricite de France, 144A | | | 2.336 | (n) | | | 08/16/18 | | | | 9,000 | | | | 8,991,028 | |
ERAC USA Finance LLC, 144A | | | 2.407 | (n) | | | 08/28/18 | | | | 4,000 | | | | 3,992,972 | |
FMC Technologies, Inc., | | | | | | | | | | | | | | | | |
144A | | | 2.651 | (n) | | | 09/06/18 | | | | 4,000 | | | | 3,990,557 | |
144A | | | 2.674 | (n) | | | 09/20/18 | | | | 4,000 | | | | 3,986,627 | |
144A | | | 2.757 | (n) | | | 09/14/18 | | | | 7,000 | | | | 6,979,525 | |
Ford Motor Credit Co. LLC, 144A | | | 2.049 | (n) | | | 10/04/18 | | | | 25,000 | | | | 24,897,670 | |
Harley-Davidson Financial Services, Inc., 144A | | | 2.561 | (n) | | | 09/19/18 | | | | 4,000 | | | | 3,986,906 | |
Harley-Davidson Funding Corp., 144A | | | 2.529 | (n) | | | 09/20/18 | | | | 4,000 | | | | 3,986,627 | |
Hewlett Packard Enterprise Co., 144A | | | 2.563 | (n) | | | 09/24/18 | | | | 41,000 | | | | 40,871,715 | |
Holcim US Finance S.A.R.L. & Cie S.C.S., 144A | | | 2.438 | (n) | | | 08/01/18 | | | | 3,000 | | | | 2,999,818 | |
KCP&L Greater Missouri Operations Co., 144A | | | 2.261 | (n) | | | 08/01/18 | | | | 12,050 | | | | 12,049,268 | |
Marriot International, Inc., | | | | | | | | | | | | | | | | |
144A | | | 2.502 | (n) | | | 08/08/18 | | | | 2,000 | | | | 1,999,016 | |
144A | | | 2.502 | (n) | | | 08/21/18 | | | | 15,780 | | | | 15,759,233 | |
144A | | | 2.523 | (n) | | | 09/21/18 | | | | 5,000 | | | | 4,982,934 | |
NextEra Energy Capital Holdings, Inc., 144A | | | 2.472 | (n) | | | 08/17/18 | | | | 8,000 | | | | 7,991,519 | |
Nutrien Ltd., | | | | | | | | | | | | | | | | |
144A | | | 2.654 | (n) | | | 09/24/18 | | | | 8,000 | | | | 7,968,247 | |
144A | | | 2.674 | (n) | | | 09/17/18 | | | | 13,000 | | | | 12,955,245 | |
144A | | | 2.674 | (n) | | | 09/21/18 | | | | 4,000 | | | | 3,984,123 | |
Sempra Energy Global Enterprises, | | | | | | | | | | | | | | | | |
144A | | | 2.654 | (n) | | | 09/21/18 | | | | 7,000 | | | | 6,976,107 | |
144A | | | 2.705 | (n) | | | 09/13/18 | | | | 9,000 | | | | 8,974,315 | |
144A | | | 2.706 | (n) | | | 09/17/18 | | | | 9,000 | | | | 8,971,800 | |
Societe Generale SA, 144A | | | 2.325 | (n) | | | 08/31/18 | | | | 25,000 | | | | 24,957,504 | |
Southern Co., 144A | | | 2.546 | (n) | | | 08/27/18 | | | | 5,000 | | | | 4,991,529 | |
See Notes to Financial Statements.
| | | | | | | | | | | | | | | | |
| Description | | Interest
Rate | | | Maturity
Date | | | Principal
Amount (000)# | | | Value | |
COMMERCIAL PAPER (Continued) | | | | | | | | | | | | | | | | |
Spectra Energy Partners LP, | | | | | | | | | | | | | | | | |
144A | | | 2.489 | %(n) | | | 08/20/18 | | | | 4,500 | | | $ | 4,494,367 | |
144A | | | 2.628 | (n) | | | 08/30/18 | | | | 10,500 | | | | 10,480,225 | |
144A | | | 2.658 | (n) | | | 08/24/18 | | | | 10,000 | | | | 9,984,953 | |
Suncor Energy, Inc., | | | | | | | | | | | | | | | | |
144A | | | 2.684 | (n) | | | 09/19/18 | | | | 10,000 | | | | 9,967,264 | |
144A | | | 2.684 | (n) | | | 09/20/18 | | | | 2,000 | | | | 1,993,313 | |
144A | | | 2.705 | (n) | | | 09/12/18 | | | | 8,000 | | | | 7,977,745 | |
144A | | | 2.705 | (n) | | | 09/13/18 | | | | 5,000 | | | | 4,985,730 | |
Thomson Reuters Corp., | | | | | | | | | | | | | | | | |
144A | | | 2.566 | (n) | | | 08/27/18 | | | | 12,000 | | | | 11,979,822 | |
144A | | | 2.576 | (n) | | | 08/31/18 | | | | 13,000 | | | | 12,974,779 | |
TransCanada American Investments Ltd., 144A | | | 2.683 | (n) | | | 09/11/18 | | | | 5,000 | | | | 4,987,283 | |
TransCanada Pipelines Ltd., | | | | | | | | | | | | | | | | |
144A | | | 2.684 | (n) | | | 09/17/18 | | | | 4,000 | | | | 3,987,467 | |
144A | | | 2.705 | (n) | | | 09/14/18 | | | | 14,000 | | | | 13,959,050 | |
Tyco International Holding S.A.R.L., 144A | | | 2.601 | (n) | | | 09/26/18 | | | | 5,000 | | | | 4,980,913 | |
UBS AG, | | | | | | | | | | | | | | | | |
144A, 1 Month LIBOR + 0.270% | | | 2.357 | (c) | | | 09/04/18 | | | | 15,000 | | | | 15,004,530 | |
144A, 1 Month LIBOR + 0.420% | | | 2.514 | (c) | | | 05/31/19 | | | | 10,000 | | | | 10,006,210 | |
UDR, Inc., 144A | | | 2.449 | (n) | | | 08/02/18 | | | | 8,000 | | | | 7,999,026 | |
Vodafone Group PLC (United Kingdom), 144A | | | 1.775 | (n) | | | 09/04/18 | | | | 25,000 | | | | 24,944,413 | |
VW Credit, Inc., | | | | | | | | | | | | | | | | |
144A | | | 2.674 | (n) | | | 09/20/18 | | | | 5,000 | | | | 4,983,283 | |
144A | | | 2.684 | (n) | | | 09/13/18 | | | | 15,000 | | | | 14,957,192 | |
144A | | | 2.694 | (n) | | | 09/17/18 | | | | 15,000 | | | | 14,953,000 | |
| | | | | | | | | | | | | | | | |
TOTAL COMMERCIAL PAPER
(cost $536,457,166) | | | | | | | | | | | | | | | 536,542,203 | |
| | | | | | | | | | | | | | | | |
TOTAL SHORT-TERM INVESTMENTS
(cost $839,113,921) | | | | | | | | | | | | | | | 839,307,323 | |
| | | | | | | | | | | | | | | | |
TOTAL INVESTMENTS 100.4%
(cost $2,981,308,066) | | | | | | | | | | | | | | | 2,973,737,859 | |
Liabilities in excess of other assets(z) (0.4)% | | | | | | | | | | | | | | | (10,715,685 | ) |
| | | | | | | | | | | | | | | | |
NET ASSETS 100.0% | | | | | | | | | | | | | | $ | 2,963,022,174 | |
| | | | | | | | | | | | | | | | |
See the Glossary for abbreviations used in the semiannual report.
| # | Principal or notional amount is shown in U.S. dollars unless otherwise stated. |
| ^ | Indicates a Level 3 security. The aggregate value of Level 3 securities is $17,198,004 and 0.6% of net assets. |
| (c) | Variable rate instrument. The interest rate shown reflects the rate in effect at July 31, 2018. |
See Notes to Financial Statements.
| | | | |
| Prudential Investment Portfolios 2/PGIM Core Short-Term Bond Fund | | | 29 | |
PGIM Core Short-Term Bond Fund
Schedule of Investments (unaudited) (continued)
as of July 31, 2018
| (cc) | Variable rate instrument. The rate shown is based on the latest available information as of July 31, 2018. Certain variable rate securities are not based on a published reference rate and spread but are determined by the issuer or agent and are based on current market conditions. These securities do not indicate a reference rate and spread in their description. |
| (d) | Represents issuer in default on interest payments and/or principal repayment. Non-income producing security. Such securities may be post-maturity. |
| (n) | Rate shown reflects yield to maturity at purchase date. |
| (w) | PGIM Investments LLC, the manager of the Fund, also serves as manager of the PGIM Core Ultra Short Bond Fund. |
| (z) | Includes net unrealized appreciation (depreciation) on the following derivative contracts held at reporting period end: |
Interest rate swap agreements outstanding at July 31, 2018:
| | | | | | | | | | | | | | | | | | | | | | | | |
Notional
Amount
(000)# | | | Termination
Date | | | Fixed
Rate | | | Floating Rate | | Value at
Trade
Date | | | Value at
July 31,
2018 | | | Unrealized
Appreciaton
(Depreciation) | |
| | Centrally Cleared Interest Rate Swap Agreements: | | | | | | | | | |
| | 41,500 | | | | 09/07/18 | | | | 1.429%(S) | | | 3 Month LIBOR (1)(Q) | | $ | 44,139 | | | $ | (50,130 | ) | | $ | (94,269 | ) |
| | 35,000 | | | | 01/08/19 | | | | 1.344%(S) | | | 3 Month LIBOR (1)(Q) | | | 164,469 | | | | 193,497 | | | | 29,028 | |
| | 10,000 | | | | 02/24/19 | | | | 1.560%(S) | | | 3 Month LIBOR (1)(Q) | | | 173 | | | | 31,636 | | | | 31,463 | |
| | 59,000 | | | | 04/05/19 | | | | 1.585%(S) | | | 3 Month LIBOR (1)(Q) | | | 273,840 | | | | 190,490 | | | | (83,350 | ) |
| | 81,000 | | | | 05/11/19 | | | | 1.621%(S) | | | 3 Month LIBOR (1)(Q) | | | 231,025 | | | | 758,568 | | | | 527,543 | |
| | 70,000 | | | | 08/21/19 | | | | 1.591%(S) | | | 3 Month LIBOR (1)(Q) | | | 87,829 | | | | 634,994 | | | | 547,165 | |
| | 50,000 | | | | 09/07/19 | | | | 1.514%(S) | | | 3 Month LIBOR (1)(Q) | | | — | | | | 527,776 | | | | 527,776 | |
| | 50,000 | | | | 09/13/19 | | | | 1.546%(S) | | | 3 Month LIBOR (1)(Q) | | | 9,714 | | | | 506,134 | | | | 496,420 | |
| | 22,500 | | | | 12/08/19 | | | | 1.100%(S) | | | 3 Month LIBOR (1)(Q) | | | (3,658 | ) | | | 542,441 | | | | 546,099 | |
| | 20,000 | | | | 03/02/20 | | | | 1.802%(S) | | | 3 Month LIBOR (1)(Q) | | | — | | | | 241,761 | | | | 241,761 | |
| | 27,000 | | | | 05/04/20 | | | | 1.713%(S) | | | 3 Month LIBOR (1)(Q) | | | 142,133 | | | | 574,333 | | | | 432,200 | |
| | 40,200 | | | | 06/15/20 | | | | 1.035%(S) | | | 3 Month LIBOR (1)(Q) | | | 410,740 | | | | 1,412,008 | | | | 1,001,268 | |
| | 83,000 | | | | 11/10/20 | | | | 1.943%(S) | | | 3 Month LIBOR (1)(Q) | | | 911,044 | | | | 1,861,809 | | | | 950,765 | |
| | 70,065 | | | | 05/09/21 | | | | 2.855%(S) | | | 3 Month LIBOR (1)(Q) | | | 88,548 | | | | 92,345 | | | | 3,797 | |
| | 31,000 | | | | 10/02/21 | | | | 1.898%(S) | | | 3 Month LIBOR (1)(Q) | | | 451,083 | | | | 863,253 | | | | 412,170 | |
| | 19,000 | | | | 06/15/22 | | | | 1.873%(S) | | | 3 Month LIBOR (1)(Q) | | | 147,675 | | | | 771,877 | | | | 624,202 | |
| | | | | | | | | | | | | | | | | | | | | | | | |
| | | | | | | | | | | | | | $ | 2,958,754 | | | $ | 9,152,792 | | | $ | 6,194,038 | |
| | | | | | | | | | | | | | | | | | | | | | | | |
Cash of $4,327,000 has been segregated with Citigroup Global Markets to cover requirements for open centrally cleared swap contracts at July 31, 2018.
| (1) | The Fund pays the fixed rate and receives the floating rate. |
| (2) | The Fund pays the floating rate and receives the fixed rate. |
See Notes to Financial Statements.
Fair Value Measurements:
Various inputs are used in determining the value of the Fund’s investments. These inputs are summarized in the three broad levels listed below.
Level 1—unadjusted quoted prices generally in active markets for identical securities.
Level 2—quoted prices for similar securities, interest rates and yield curves, prepayment speeds, foreign currency exchange rates and other observable inputs.
Level 3—unobservable inputs for securities valued in accordance with Board approved fair valuation procedures.
The following is a summary of the inputs used as of July 31, 2018 in valuing such portfolio securities:
| | | | | | | | | | | | |
| | | Level 1 | | | Level 2 | | | Level 3 | |
Investments in Securities | | | | | | | | | | | | |
Asset-Backed Securities | | | | | | | | | | | | |
Automobiles | | $ | — | | | $ | 175,355,102 | | | $ | 17,198,004 | |
Credit Cards | | | — | | | | 123,279,273 | | | | — | |
Home Equity Loans | | | — | | | | 159,317,789 | | | | — | |
Residential Mortgage-Backed Securities | | | — | | | | 59,671,777 | | | | — | |
Student Loans | | | — | | | | 9,004,029 | | | | — | |
Certificates of Deposit | | | — | | | | 234,090,583 | | | | — | |
Commercial Mortgage-Backed Securities | | | — | | | | 431,107,142 | | | | — | |
Corporate Bonds | | | — | | | | 1,120,174,737 | | | | — | |
Affiliated Mutual Fund | | | 107,997,220 | | | | — | | | | — | |
Commercial Paper | | | — | | | | 536,542,203 | | | | — | |
Other Financial Instruments* | | | | | | | | | | | | |
Centrally Cleared Interest Rate Swap Agreements | | | — | | | | 6,194,038 | | | | — | |
| | | | | | | | | | | | |
Total | | $ | 107,997,220 | | | $ | 2,854,736,673 | | | $ | 17,198,004 | |
| | | | | | | | | | | | |
| * | Other financial instruments are derivative instruments not reflected in the Schedule of Investments, such as futures, forwards and centrally cleared swap contracts, which are recorded at the unrealized appreciation (depreciation) on the instrument, and OTC swap contracts which are recorded at fair value. |
During the period, there were no transfers between Level 1, Level 2 and Level 3 to report.
Industry Classification:
The industry classification of investments and liabilities in excess of other assets shown as a percentage of net assets as of July 31, 2018 were as follows:
| | | | |
Commercial Paper | | | 18.1 | % |
Commercial Mortgage-Backed Securities | | | 14.6 | |
Banks | | | 13.5 | |
Certificates of Deposit | | | 7.9 | |
Automobiles | | | 6.5 | |
Home Equity Loans | | | 5.4 | |
Auto Manufacturers | | | 4.8 | % |
Credit Cards | | | 4.2 | |
Affiliated Mutual Fund | | | 3.6 | |
Computers | | | 2.9 | |
Electric | | | 2.7 | |
Biotechnology | | | 2.1 | |
See Notes to Financial Statements.
| | | | |
| Prudential Investment Portfolios 2/PGIM Core Short-Term Bond Fund | | | 31 | |
PGIM Core Short-Term Bond Fund
Schedule of Investments (unaudited) (continued)
as of July 31, 2018
| | | | |
Industry Classification (cont’d.) | | | |
Residential Mortgage-Backed Securities | | | 2.0 | % |
Oil & Gas | | | 1.9 | |
Insurance | | | 1.7 | |
Retail | | | 1.4 | |
Commercial Services | | | 0.9 | |
Miscellaneous Manufacturing | | | 0.9 | |
Foods | | | 0.8 | |
Media | | | 0.8 | |
Cosmetics/Personal Care | | | 0.7 | |
Pharmaceuticals | | | 0.6 | |
Healthcare-Services | | | 0.5 | |
Machinery-Construction & Mining | | | 0.5 | |
Diversified Financial Services | | | 0.4 | |
Beverages | | | 0.3 | |
Student Loans | | | 0.3 | |
Mining | | | 0.2 | % |
Aerospace & Defense | | | 0.1 | |
Healthcare-Products | | | 0.1 | |
Telecommunications | | | 0.0 | * |
Pipelines | | | 0.0 | * |
Chemicals | | | 0.0 | * |
| | | | |
| | | 100.4 | |
Liabilities in excess of other assets | | | (0.4 | ) |
| | | | |
| | | 100.0 | % |
| | | | |
Effects of Derivative Instruments on the Financial Statements and Primary Underlying Risk Exposure:
The Fund invested in derivative instruments during the reporting period. The primary type of risk associated with these derivative instruments is interest rate contracts risk. The effect of such derivative instruments on the Fund’s financial position and financial performance as reflected in the Statement of Assets and Liabilities and Statement of Operations is presented in the summary below.
Fair values of derivative instruments as of July 31, 2018 as presented in the Statement of Assets and Liabilities:
| | | | | | | | | | | | |
Derivatives not accounted for as hedging instruments, carried at fair value | | Asset Derivatives | | | Liability Derivatives | |
| | Balance Sheet
Location | | Fair
Value | | | Balance Sheet
Location | | Fair
Value | |
| Interest rate contracts | | Due from/to broker—variation margin swaps | | $ | 6,371,657 | * | | Due from/to broker—variation margin swaps | | $ | 177,619 | * |
| | | | | | | | | | | | |
| * | Includes cumulative appreciation (depreciation) as reported in the schedule of open futures and centrally cleared swap contracts. Only unsettled variation margin receivable (payable) is reported within the Statement of Assets and Liabilities. |
The effects of derivative instruments on the Statement of Operations for the six months ended July 31, 2018 are as follows:
| | | | |
Amount of Realized Gain (Loss) on Derivatives Recognized in Income | |
Derivatives not accounted for as hedging instruments, carried at fair value | | Swaps | |
| Interest rate contracts | | $ | 1,118,791 | |
| | | | |
See Notes to Financial Statements.
| | | | |
Change in Unrealized Appreciation (Depreciation) on Derivatives Recognized in Income | |
Derivatives not accounted for as hedging instruments, carried at fair value | | Swaps | |
| Interest rate contracts | | $ | 1,775,859 | |
| | | | |
For the six months ended July 31, 2018, the Fund’s average volume of derivative activities is as follows:
| | |
Interest Rate
Swap
Agreements(1) | |
| $ | 647,221,667 | |
| | |
| (1) | Notional Amount in USD. |
See Notes to Financial Statements.
| | | | |
| Prudential Investment Portfolios 2/PGIM Core Short-Term Bond Fund | | | 33 | |
PGIM Core Short-Term Bond Fund
Statement of Assets & Liabilities (unaudited)
as of July 31, 2018
| | | | |
Assets | | | | |
Investments at value: | | | | |
Unaffiliated investments (cost $2,873,310,846) | | $ | 2,865,740,639 | |
Affiliated investments (cost $107,997,220) | | | 107,997,220 | |
Cash | | | 19,481,890 | |
Deposit with broker for centrally cleared swaps | | | 4,327,000 | |
Dividends and interest receivable | | | 6,920,553 | |
Due from broker—variation margin swaps | | | 33,384 | |
Receivable for investments sold | | | 18,079 | |
Prepaid expenses | | | 143 | |
| | | | |
Total Assets | | | 3,004,518,908 | |
| | | | |
| |
Liabilities | | | | |
Payable for investments purchased | | | 37,023,981 | |
Dividends payable | | | 4,343,136 | |
Management fee payable | | | 58,170 | |
Accrued expenses and other liabilities | | | 54,780 | |
Affiliated transfer agent fee payable | | | 16,667 | |
| | | | |
Total Liabilities | | | 41,496,734 | |
| | | | |
| |
Net Assets | | $ | 2,963,022,174 | |
| | | | |
| | | | | |
Net assets were comprised of: | | | | |
Shares of beneficial interest, at par | | $ | 319,720 | |
Paid-in capital in excess of par | | | 2,992,483,857 | |
| | | | |
| | | 2,992,803,577 | |
Undistributed net investment income | | | 6,676,388 | |
Accumulated net realized loss on investment transactions | | | (35,081,622 | ) |
Net unrealized depreciation on investments | | | (1,376,169 | ) |
| | | | |
Net assets, July 31, 2018 | | $ | 2,963,022,174 | |
| | | | |
Net asset value and redemption price per share
($2,963,022,174 ÷ 319,719,848 shares of beneficial interest issued and outstanding) | | $ | 9.27 | |
| | | | |
See Notes to Financial Statements.
PGIM Core Short-Term Bond Fund
Statement of Operations (unaudited)
Six Months Ended July 31, 2018
| | | | |
Net Investment Income (Loss) | | | | |
Income | | | | |
Interest income | | $ | 39,606,317 | |
Affiliated dividend income | | | 648,615 | |
| | | | |
Total income | | | 40,254,932 | |
| | | | |
| |
Expenses | | | | |
Management fee | | | 357,102 | |
Custodian and accounting fees | | | 56,241 | |
Transfer agent’s fees and expenses (including affiliated expense of $49,616) | | | 49,616 | |
Audit fee | | | 19,160 | |
Legal fees and expenses | | | 8,322 | |
Trustees’ fees | | | 6,117 | |
Shareholders’ reports | | | 4,387 | |
Miscellaneous | | | 17,963 | |
| | | | |
Total expenses | | | 518,908 | |
| | | | |
Net investment income (loss) | | | 39,736,024 | |
| | | | |
| |
Realized And Unrealized Gain (Loss) On Investments | | | | |
Net realized gain (loss) on: | | | | |
Investment transactions | | | 214,819 | |
Swap agreement transactions | | | 1,118,791 | |
| | | | |
| | | 1,333,610 | |
| | | | |
Net change in unrealized appreciation (depreciation) on: | | | | |
Investments | | | (6,797,472 | ) |
Swap agreements | | | 1,775,859 | |
| | | | |
| | | (5,021,613 | ) |
| | | | |
Net gain (loss) on investment transactions | | | (3,688,003 | ) |
| | | | |
Net Increase (Decrease) In Net Assets Resulting From Operations | | $ | 36,048,021 | |
| | | | |
See Notes to Financial Statements.
| | | | |
| Prudential Investment Portfolios 2/PGIM Core Short-Term Bond Fund | | | 35 | |
PGIM Core Short-Term Bond Fund
Statements of Changes in Net Assets (unaudited)
| | | | | | | | |
| | | Six Months
Ended
July 31, 2018 | | | Year
Ended
January 31, 2018 | |
Increase (Decrease) in Net Assets | |
Operations | |
Net investment income (loss) | | $ | 39,736,024 | | | $ | 62,942,946 | |
Net realized gain (loss) on investment transactions | | | 1,333,610 | | | | 9,353,011 | |
Net change in unrealized appreciation (depreciation) on investments | | | (5,021,613 | ) | | | (3,533,231 | ) |
| | | | | | | | |
Net increase (decrease) in net assets resulting from operations | | | 36,048,021 | | | | 68,762,726 | |
| | | | | | | | |
Dividends from net investment income | | | (38,572,001 | ) | | | (68,735,210 | ) |
| | | | | | | | |
| | |
Fund share transactions | | | | | | | | |
Net proceeds from shares sold | | | 91,000,000 | | | | 35,707,576 | |
Net asset value of shares issued in reinvestment of dividends and distributions | | | 29,795,973 | | | | 68,732,516 | |
Cost of shares reacquired | | | (274,300,000 | ) | | | (35,707,576 | ) |
| | | | | | | | |
Net increase (decrease) in net assets from Fund share transactions | | | (153,504,027 | ) | | | 68,732,516 | |
| | | | | | | | |
Total increase (decrease) | | | (156,028,007 | ) | | | 68,760,032 | |
| | |
Net Assets: | | | | | | | | |
Beginning of period | | | 3,119,050,181 | | | | 3,050,290,149 | |
| | | | | | | | |
End of period(a) | | $ | 2,963,022,174 | | | $ | 3,119,050,181 | |
| | | | | | | | |
(a) Includes undistributed/(distributions in excess of) net investment income of: | | $ | 6,676,388 | | | $ | 5,512,365 | |
| | | | | | | | |
See Notes to Financial Statements.
PGIM Core Ultra Short Bond Fund
Schedule of Investments (unaudited)
as of July 31, 2018
| | | | | | | | | | | | | | | | |
| Description | | Interest
Rate | | | Maturity
Date | | | Principal
Amount (000)# | | | Value | |
SHORT-TERM INVESTMENTS 102.0% | | | | | | | | | | | | | | | | |
| | | | |
CERTIFICATES OF DEPOSIT 25.3% | | | | | | | | | | | | | | | | |
Bank of America NA, | | | | | | | | | | | | | | | | |
1 Month LIBOR + 0.200% | | | 1.780 | %(c) | | | 10/09/18 | | | | 133,000 | | | $ | 132,999,953 | |
1 Month LIBOR + 0.170% | | | 2.267 | (c) | | | 08/08/18 | | | | 125,000 | | | | 124,999,315 | |
1 Month LIBOR + 0.220% | | | 2.317 | (c) | | | 01/14/19 | | | | 116,000 | | | | 116,004,292 | |
1 Month LIBOR + 0.410% | | | 2.497 | (c) | | | 11/06/18 | | | | 159,000 | | | | 159,082,667 | |
Bank of Montreal, | | | | | | | | | | | | | | | | |
1 Month LIBOR + 0.260% | | | 2.357 | (c) | | | 02/08/19 | | | | 147,000 | | | | 147,048,216 | |
Bank of Nova Scotia, | | | | | | | | | | | | | | | | |
1 Month LIBOR + 0.310% | | | 2.392 | (c) | | | 06/19/19 | | | | 172,000 | | | | 172,060,200 | |
1 Month LIBOR + 0.430% | | | 2.502 | (c) | | | 09/14/18 | | | | 84,000 | | | | 84,047,544 | |
BNP Paribas SA, | | | | | | | | | | | | | | | | |
1 Month LIBOR + 0.240% | | | 2.322 | (c) | | | 02/19/19 | | | | 120,000 | | | | 120,000,840 | |
1 Month LIBOR + 0.270% | | | 2.342 | (c) | | | 11/15/18 | | | | 143,000 | | | | 143,048,906 | |
3 Month LIBOR + 0.140% | | | 2.472 | (c) | | | 06/24/19 | | | | 228,000 | | | | 228,018,881 | |
Canadian Imperial Bank of Commerce, | | | | | | | | | | | | | | | | |
1 Month LIBOR + 0.190% | | | 2.267 | (c) | | | 08/31/18 | | | | 187,000 | | | | 187,038,522 | |
1 Month LIBOR + 0.230% | | | 2.302 | (c) | | | 11/14/18 | | | | 150,000 | | | | 150,042,150 | |
3 Month LIBOR + 0.130% | | | 2.463 | (c) | | | 07/17/19 | | | | 225,000 | | | | 224,977,968 | |
3 Month LIBOR + 0.200% | | | 2.558 | (c) | | | 05/01/19 | | | | 14,000 | | | | 14,008,571 | |
Citibank NA, | | | | | | | | | | | | | | | | |
1 Month LIBOR + 0.190% | | | 2.276 | (c) | | | 09/10/18 | | | | 215,000 | | | | 215,055,470 | |
1 Month LIBOR + 0.180% | | | 2.277 | (c) | | | 08/08/18 | | | | 112,000 | | | | 112,007,728 | |
Citibank NA | | | 2.330 | | | | 10/22/18 | | | | 220,000 | | | | 220,047,549 | |
Cooperatieve Rabobank UA, | | | | | | | | | | | | | | | | |
1 Month LIBOR + 0.160% | | | 2.241 | (c) | | | 08/23/18 | | | | 40,000 | | | | 40,006,120 | |
1 Month LIBOR + 0.210% | | | 2.282 | (c) | | | 11/15/18 | | | | 90,000 | | | | 90,019,350 | |
1 Month LIBOR + 0.400% | | | 2.472 | (c) | | | 04/16/19 | | | | 50,000 | | | | 50,066,500 | |
Credit Agricole Corporate & Investment Bank, | | | | | | | | | | | | | | | | |
1 Month LIBOR + 0.330% | | | 2.427 | (c) | | | 10/09/18 | | | | 150,000 | | | | 150,083,400 | |
DNB Bank ASA, | | | | | | | | | | | | | | | | |
1 Month LIBOR + 0.160% | | | 2.247 | (c) | | | 08/06/18 | | | | 71,000 | | | | 71,003,408 | |
Mizuho Bank Ltd. | | | 1.950 | | | | 08/07/18 | | | | 84,000 | | | | 83,999,688 | |
MUFG Bank Ltd. | | | 2.100 | | | | 09/27/18 | | | | 75,000 | | | | 75,000,302 | |
MUFG Bank Ltd. | | | 2.260 | | | | 10/29/18 | | | | 75,000 | | | | 75,001,760 | |
Natixis SA, | | | | | | | | | | | | | | | | |
1 Month LIBOR + 0.350% | | | 2.436 | (c) | | | 03/05/19 | | | | 176,500 | | | | 176,562,658 | |
Royal Bank of Canada, | | | | | | | | | | | | | | | | |
3 Month LIBOR + 0.130% | | | 2.467 | (c) | | | 07/12/19 | | | | 200,000 | | | | 199,980,728 | |
Sumitomo Mitsui Banking Corp., | | | | | | | | | | | | | | | | |
1 Month LIBOR + 0.210% | | | 2.292 | (c) | | | 09/19/18 | | | | 168,000 | | | | 168,021,168 | |
See Notes to Financial Statements.
| | | | |
| Prudential Investment Portfolios 2/PGIM Core Ultra Short Bond Fund | | | 37 | |
PGIM Core Ultra Short Bond Fund
Schedule of Investments (unaudited) (continued)
as of July 31, 2018
| | | | | | | | | | | | | | | | |
| Description | | Interest
Rate | | | Maturity
Date | | | Principal
Amount (000)# | | | Value | |
CERTIFICATES OF DEPOSIT (Continued) | | | | | | | | | | | | | | | | |
Sumitomo Mitsui Trust Bank Ltd., | | | | | | | | | | | | | | | | |
1 Month LIBOR + 0.230% | | | 2.309 | %(c) | | | 09/18/18 | | | | 131,000 | | | $ | 131,020,174 | |
3 Month LIBOR + 0.200% | | | 2.535 | (c) | | | 09/25/18 | | | | 15,000 | | | | 15,007,365 | |
Svenska Handelsbanken AB, | | | | | | | | | | | | | | | | |
1 Month LIBOR + 0.180% | | | 2.249 | (c) | | | 08/24/18 | | | | 118,000 | | | | 118,019,234 | |
1 Month LIBOR + 0.160% | | | 2.257 | (c) | | | 08/09/18 | | | | 50,000 | | | | 50,003,600 | |
1 Month LIBOR + 0.180% | | | 2.266 | (c) | | | 09/04/18 | | | | 125,000 | | | | 125,027,875 | |
1 Month LIBOR + 0.190% | | | 2.276 | (c) | | | 02/20/19 | | | | 110,000 | | | | 110,003,520 | |
1 Month LIBOR + 0.220% | | | 2.284 | (c) | | | 01/25/19 | | | | 175,000 | | | | 175,042,000 | |
Swedbank AB, | | | | | | | | | | | | | | | | |
1 Month LIBOR + 0.190% | | | 2.259 | (c) | | | 02/25/19 | | | | 200,000 | | | | 199,989,400 | |
1 Month LIBOR + 0.200% | | | 2.287 | (c) | | | 11/06/18 | | | | 223,000 | | | | 223,052,851 | |
Toronto-Dominion Bank (The), | | | | | | | | | | | | | | | | |
1 Month LIBOR + 0.190% | | | 2.262 | (c) | | | 08/28/18 | | | | 148,000 | | | | 148,028,416 | |
Toronto-Dominion Bank (The) | | | 2.280 | | | | 09/19/18 | | | | 83,000 | | | | 83,023,581 | |
US Bank NA, | | | | | | | | | | | | | | | | |
1 Month LIBOR + 0.180% | | | 2.250 | (c) | | | 08/26/18 | | | | 43,000 | | | | 43,007,912 | |
Wells Fargo Bank NA, | | | | | | | | | | | | | | | | |
1 Month LIBOR + 0.220% | | | 2.317 | (c) | | | 10/05/18 | | | | 33,000 | | | | 33,011,583 | |
3 Month LIBOR + 0.160% | | | 2.497 | (c) | | | 08/13/19 | | | | 207,000 | | | | 206,979,221 | |
3 Month LIBOR + 0.230% | | | 2.569 | (c) | | | 04/16/19 | | | | 140,000 | | | | 140,136,745 | |
Westpac Banking Corp., | | | | | | | | | | | | | | | | |
1 Month LIBOR + 0.200% | | | 2.286 | (c) | | | 11/05/18 | | | | 153,000 | | | | 153,040,698 | |
3 Month LIBOR + 0.090% | | | 2.425 | (c) | | | 04/26/19 | | | | 245,000 | | | | 244,981,919 | |
| | | | | | | | | | | | | | | | |
TOTAL CERTIFICATES OF DEPOSIT
(cost $5,928,518,431) | | | | | | | | | | | | | | | 5,929,609,948 | |
| | | | | | | | | | | | | | | | |
| | | | |
COMMERCIAL PAPER 41.3% | | | | | | | | | | | | | | | | |
ABN AMRO Funding USA LLC, | | | | | | | | | | | | | | | | |
144A | | | 2.176 | (n) | | | 08/03/18 | | | | 50,000 | | | | 49,991,771 | |
144A | | | 2.325 | (n) | | | 09/05/18 | | | | 58,000 | | | | 57,879,940 | |
Apple, Inc., | | | | | | | | | | | | | | | | |
144A | | | 2.128 | (n) | | | 09/20/18 | | | | 137,500 | | | | 137,105,936 | |
144A | | | 2.129 | (n) | | | 09/19/18 | | | | 100,000 | | | | 99,719,444 | |
144A | | | 2.130 | (n) | | | 09/18/18 | | | | 65,000 | | | | 64,821,552 | |
144A | | | 2.141 | (n) | | | 09/24/18 | | | | 116,000 | | | | 115,639,353 | |
Bank Nederlandse Gemeenten, | | | | | | | | | | | | | | | | |
144A | | | 1.968 | (n) | | | 08/01/18 | | | | 14,000 | | | | 13,999,248 | |
144A | | | 1.968 | (n) | | | 08/06/18 | | | | 46,000 | | | | 45,984,943 | |
Bank of New York Mellon (The) | | | 2.294 | (n) | | | 09/20/18 | | | | 55,000 | | | | 54,838,712 | |
BASF SE, | | | | | | | | | | | | | | | | |
144A | | | 2.062 | (n) | | | 09/05/18 | | | | 172,000 | | | | 171,652,560 | |
See Notes to Financial Statements.
| | | | | | | | | | | | | | | | |
| Description | | Interest
Rate | | | Maturity
Date | | | Principal
Amount (000)# | | | Value | |
COMMERCIAL PAPER (Continued) | | | | | | | | | | | | | | | | |
BASF SE, (cont’d.) | | | | | | | | | | | | | | | | |
144A | | | 2.072 | %(n) | | | 08/01/18 | | | | 260,000 | | | $ | 259,986,119 | |
144A | | | 2.217 | (n) | | | 09/24/18 | | | | 126,685 | | | | 126,282,811 | |
144A | | | 2.222 | (n) | | | 09/25/18 | | | | 83,000 | | | | 82,731,062 | |
CDP Financial, Inc., | | | | | | | | | | | | | | | | |
144A | | | 2.085 | (n) | | | 09/14/18 | | | | 60,000 | | | | 59,847,750 | |
144A | | | 2.242 | (n) | | | 09/04/18 | | | | 90,500 | | | | 90,324,292 | |
144A | | | 2.253 | (n) | | | 09/13/18 | | | | 61,000 | | | | 60,848,876 | |
144A | | | 2.253 | (n) | | | 09/18/18 | | | | 30,000 | | | | 29,916,578 | |
144A | | | 2.253 | (n) | | | 09/19/18 | | | | 90,000 | | | | 89,744,125 | |
144A | | | 2.264 | (n) | | | 09/06/18 | | | | 20,000 | | | | 19,958,827 | |
Chevron Corp., | | | | | | | | | | | | | | | | |
144A | | | 2.056 | (n) | | | 09/04/18 | | | | 275,000 | | | | 274,477,310 | |
144A | | | 2.085 | (n) | | | 08/14/18 | | | | 68,000 | | | | 67,949,544 | |
Commonwealth Bank of Australia, | | | | | | | | | | | | | | | | |
144A, 1 Month LIBOR + 0.200% | | | 2.282 | (c) | | | 10/19/18 | | | | 3,000 | | | | 3,000,900 | |
144A, 1 Month LIBOR + 0.240% | | | 2.330 | (c) | | | 01/03/19 | | | | 125,000 | | | | 125,029,875 | |
144A, 1 Month LIBOR + 0.330% | | | 2.402 | (c) | | | 02/28/19 | | | | 12,000 | | | | 12,009,744 | |
CPPIB Capital, Inc., | | | | | | | | | | | | | | | | |
144A | | | 2.088 | (n) | | | 09/19/18 | | | | 155,000 | | | | 154,559,326 | |
Federation Des Caisses Desjardins, | | | | | | | | | | | | | | | | |
144A | | | 2.157 | (n) | | | 08/14/18 | | | | 74,000 | | | | 73,943,625 | |
144A | | | 2.162 | (n) | | | 08/20/18 | | | | 203,000 | | | | 202,777,490 | |
144A | | | 2.283 | (n) | | | 09/20/18 | | | | 78,800 | | | | 78,568,919 | |
144A | | | 2.315 | (n) | | | 09/14/18 | | | | 64,000 | | | | 63,836,000 | |
144A, 1 Month LIBOR + 0.300% | | | 2.384 | (c) | | | 06/19/19 | | | | 150,000 | | | | 150,029,400 | |
General Dynamics Corp., | | | | | | | | | | | | | | | | |
144A | | | 2.097 | (n) | | | 09/18/18 | | | | 50,000 | | | | 49,860,282 | |
144A | | | 2.104 | (n) | | | 08/01/18 | | | | 138,000 | | | | 137,992,552 | |
144A | | | 2.127 | (n) | | | 08/14/18 | | | | 40,000 | | | | 39,969,527 | |
General Electric Co. | | | 1.958 | (n) | | | 08/01/18 | | | | 50,000 | | | | 49,997,389 | |
General Electric Co. | | | 1.958 | (n) | | | 08/06/18 | | | | 83,000 | | | | 82,973,647 | |
GlaxoSmithKline LLC, | | | | | | | | | | | | | | | | |
144A | | | 2.122 | (n) | | | 08/06/18 | | | | 92,000 | | | | 91,970,116 | |
144A | | | 2.126 | (n) | | | 08/08/18 | | | | 75,000 | | | | 74,967,483 | |
144A | | | 2.126 | (n) | | | 08/10/18 | | | | 100,000 | | | | 99,945,722 | |
144A | | | 2.147 | (n) | | | 08/20/18 | | | | 55,000 | | | | 54,939,714 | |
144A | | | 2.147 | (n) | | | 08/28/18 | | | | 120,000 | | | | 119,813,800 | |
HSBC Bank PLC, | | | | | | | | | | | | | | | | |
144A, 1 Month LIBOR + 0.160% | | | 2.094 | (c) | | | 08/10/18 | | | | 30,000 | | | | 30,002,190 | |
144A, 1 Month LIBOR + 0.210% | | | 2.307 | (c) | | | 11/08/18 | | | | 114,000 | | | | 114,029,412 | |
ING US Funding LLC, | | | | | | | | | | | | | | | | |
1 Month LIBOR + 0.190% | | | 2.264 | (c) | | | 08/13/18 | | | | 98,000 | | | | 98,009,996 | |
See Notes to Financial Statements.
| | | | |
| Prudential Investment Portfolios 2/PGIM Core Ultra Short Bond Fund | | | 39 | |
PGIM Core Ultra Short Bond Fund
Schedule of Investments (unaudited) (continued)
as of July 31, 2018
| | | | | | | | | | | | | | | | |
| Description | | Interest
Rate | | | Maturity
Date | | | Principal
Amount (000)# | | | Value | |
COMMERCIAL PAPER (Continued) | | | | | | | | | | | | | | | | |
ING US Funding LLC, (cont’d.) | | | | | | | | | | | | | | | | |
1 Month LIBOR + 0.190% | | | 2.282 | %(c) | | | 08/01/18 | | | | 13,000 | | | $ | 13,000,117 | |
International Bank for Reconstruction & Development | | | 2.066 | (n) | | | 08/23/18 | | | | 292,000 | | | | 291,659,236 | |
International Business Machine Corp., | | | | | | | | | | | | | | | | |
144A | | | 2.170 | (n) | | | 09/25/18 | | | | 197,000 | | | | 196,377,612 | |
144A | | | 2.180 | (n) | | | 09/24/18 | | | | 264,500 | | | | 263,680,492 | |
JPMorgan Securities LLC, | | | | | | | | | | | | | | | | |
144A, 1 Month LIBOR + 0.270% | | | 2.339 | (c) | | | 01/24/19 | | | | 132,000 | | | | 132,022,308 | |
1 Month LIBOR + 0.300% | | | 2.367 | (c) | | | 06/12/19 | | | | 43,000 | | | | 43,021,156 | |
144A, 3 Month LIBOR + 0.110% | | | 2.445 | (c) | | | 03/25/19 | | | | 112,000 | | | | 111,992,236 | |
144A, 3 Month LIBOR + 0.180% | | | 2.519 | (c) | | | 10/29/18 | | | | 92,000 | | | | 92,079,028 | |
144A, 3 Month LIBOR + 0.180% | | | 2.522 | (c) | | | 10/19/18 | | | | 61,000 | | | | 61,050,325 | |
144A, 3 Month LIBOR + 0.180% | | | 2.523 | (c) | | | 11/07/18 | | | | 100,000 | | | | 100,089,300 | |
KFW, | | | | | | | | | | | | | | | | |
144A | | | 2.230 | (n) | | | 09/14/18 | | | | 215,000 | | | | 214,446,106 | |
144A | | | 2.233 | (n) | | | 09/12/18 | | | | 84,000 | | | | 83,793,714 | |
National Australia Bank Ltd., | | | | | | | | | | | | | | | | |
144A | | | 2.264 | (n) | | | 09/25/18 | | | | 193,000 | | | | 192,364,129 | |
Nederlandse Waterschapsbank NV, | | | | | | | | | | | | | | | | |
144A | | | 2.062 | (n) | | | 09/04/18 | | | | 5,000 | | | | 4,990,069 | |
Nestle Capital Corp., | | | | | | | | | | | | | | | | |
144A | | | 2.076 | (n) | | | 08/13/18 | | | | 31,000 | | | | 30,978,641 | |
144A | | | 2.091 | (n) | | | 08/14/18 | | | | 100,000 | | | | 99,925,761 | |
144A | | | 2.112 | (n) | | | 09/17/18 | | | | 37,500 | | | | 37,399,900 | |
144A | | | 2.138 | (n) | | | 09/10/18 | | | | 100,000 | | | | 99,773,247 | |
144A | | | 2.138 | (n) | | | 09/12/18 | | | | 50,000 | | | | 49,880,973 | |
144A | | | 2.181 | (n) | | | 09/13/18 | | | | 50,000 | | | | 49,878,144 | |
144A | | | 2.191 | (n) | | | 09/06/18 | | | | 50,000 | | | | 49,897,890 | |
144A | | | 2.264 | (n) | | | 10/10/18 | | | | 90,000 | | | | 89,632,575 | |
144A | | | 2.264 | (n) | | | 10/11/18 | | | | 30,000 | | | | 29,875,560 | |
Nestle Finance International Ltd. | | | 2.126 | (n) | | | 08/14/18 | | | | 50,000 | | | | 49,962,880 | |
Nissan Motor Acceptance Corp., | | | | | | | | | | | | | | | | |
144A | | | 2.243 | (n) | | | 09/10/18 | | | | 40,000 | | | | 39,908,206 | |
144A | | | 2.243 | (n) | | | 09/11/18 | | | | 120,000 | | | | 119,717,760 | |
144A | | | 2.243 | (n) | | | 09/13/18 | | | | 50,000 | | | | 49,876,616 | |
144A | | | 2.243 | (n) | | | 09/17/18 | | | | 210,000 | | | | 209,431,041 | |
Novartis Finance Corp., | | | | | | | | | | | | | | | | |
144A | | | 2.053 | (n) | | | 08/06/18 | | | | 135,000 | | | | 134,957,047 | |
144A | | | 2.063 | (n) | | | 09/12/18 | | | | 45,000 | | | | 44,892,500 | |
Ontario Teachers’ Finance Trust, | | | | | | | | | | | | | | | | |
144A, 1 Month LIBOR + 0.300% | | | 2.018 | (c) | | | 01/11/19 | | | | 50,000 | | | | 50,024,650 | |
144A, 1 Month LIBOR + 0.160% | | | 2.241 | (c) | | | 08/21/18 | | | | 39,000 | | | | 39,005,538 | |
144A, 1 Month LIBOR + 0.150% | | | 2.247 | (c) | | | 08/09/18 | | | | 50,000 | | | | 50,003,450 | |
See Notes to Financial Statements.
| | | | | | | | | | | | | | | | |
| Description | | Interest
Rate | | | Maturity
Date | | | Principal
Amount (000)# | | | Value | |
COMMERCIAL PAPER (Continued) | | | | | | | | | | | | | | | | |
Ontario Teachers’ Finance Trust, (cont’d.) | | | | | | | | | | | | | | | | |
144A, 1 Month LIBOR + 0.190% | | | 2.271 | %(c) | | | 09/21/18 | | | | 94,500 | | | $ | 94,526,649 | |
Pfizer, Inc., | | | | | | | | | | | | | | | | |
144A | | | 2.073 | (n) | | | 08/08/18 | | | | 35,000 | | | | 34,985,137 | |
144A | | | 2.151 | (n) | | | 09/24/18 | | | | 100,000 | | | | 99,690,167 | |
Province of Alberta, | | | | | | | | | | | | | | | | |
144A | | | 2.243 | (n) | | | 09/04/18 | | | | 57,000 | | | | 56,890,164 | |
144A | | | 2.263 | (n) | | | 09/05/18 | | | | 92,000 | | | | 91,817,472 | |
144A | | | 2.263 | (n) | | | 09/10/18 | | | | 55,000 | | | | 54,874,973 | |
144A | | | 2.263 | (n) | | | 09/12/18 | | | | 26,500 | | | | 26,436,694 | |
144A | | | 2.273 | (n) | | | 10/04/18 | | | | 65,000 | | | | 64,759,175 | |
Province of Quebec, | | | | | | | | | | | | | | | | |
144A | | | 2.106 | (n) | | | 08/13/18 | | | | 58,000 | | | | 57,959,619 | |
PSP Capital, Inc., | | | | | | | | | | | | | | | | |
144A | | | 2.075 | (n) | | | 09/11/18 | | | | 74,000 | | | | 73,828,196 | |
144A | | | 2.076 | (n) | | | 09/17/18 | | | | 50,000 | | | | 49,866,000 | |
144A | | | 2.106 | (n) | | | 08/16/18 | | | | 80,000 | | | | 79,930,915 | |
144A | | | 2.126 | (n) | | | 08/07/18 | | | | 50,000 | | | | 49,981,236 | |
Roche Holdings, Inc., | | | | | | | | | | | | | | | | |
144A | | | 2.086 | (n) | | | 09/13/18 | | | | 45,000 | | | | 44,889,835 | |
144A | | | 2.087 | (n) | | | 09/17/18 | | | | 47,500 | | | | 47,372,700 | |
144A | | | 2.097 | (n) | | | 09/12/18 | | | | 40,000 | | | | 39,904,444 | |
Siemens Capital Co. LLC, | | | | | | | | | | | | | | | | |
144A | | | 2.223 | (n) | | | 09/26/18 | | | | 263,000 | | | | 262,153,424 | |
Societe Generale SA, | | | | | | | | | | | | | | | | |
144A | | | 2.325 | (n) | | | 08/31/18 | | | | 50,000 | | | | 49,915,008 | |
Texas Public Finance Auth. | | | 2.100 | | | | 08/09/18 | | | | 27,000 | | | | 27,000,270 | |
Texas Public Finance Auth. | | | 2.110 | | | | 08/08/18 | | | | 50,000 | | | | 50,000,500 | |
Toronto-Dominion Bank (The), | | | | | | | | | | | | | | | | |
144A, 1 Month LIBOR + 0.230% | | | 2.327 | (c) | | | 11/09/18 | | | | 197,000 | | | | 197,061,464 | |
Total Capital Canada Ltd., | | | | | | | | | | | | | | | | |
144A | | | 1.968 | (n) | | | 08/07/18 | | | | 125,000 | | | | 124,952,604 | |
144A | | | 2.222 | (n) | | | 09/20/18 | | | | 268,000 | | | | 267,197,005 | |
Toyota Credit Canada, Inc., | | | | | | | | | | | | | | | | |
1 Month LIBOR + 0.230% | | | 2.327 | (c) | | | 12/03/18 | | | | 22,000 | | | | 22,004,444 | |
1 Month LIBOR + 0.250% | | | 2.347 | (c) | | | 03/01/19 | | | | 50,000 | | | | 50,003,050 | |
Toyota Finance Australia Ltd., | | | | | | | | | | | | | | | | |
1 Month LIBOR + 0.400% | | | 2.222 | (c) | | | 11/13/18 | | | | 78,000 | | | | 78,060,762 | |
1 Month LIBOR + 0.210% | | | 2.274 | (c) | | | 10/22/18 | | | | 60,500 | | | | 60,518,876 | |
Toyota Motor Finance (Netherlands) BV | | | 2.188 | (n) | | | 08/28/18 | | | | 122,000 | | | | 121,816,200 | |
UBS AG, | | | | | | | | | | | | | | | | |
144A, 1 Month LIBOR + 0.270% | | | 2.357 | (c) | | | 09/04/18 | | | | 100,000 | | | | 100,030,200 | |
See Notes to Financial Statements.
| | | | |
| Prudential Investment Portfolios 2/PGIM Core Ultra Short Bond Fund | | | 41 | |
PGIM Core Ultra Short Bond Fund
Schedule of Investments (unaudited) (continued)
as of July 31, 2018
| | | | | | | | | | | | | | | | |
| Description | | Interest
Rate | | | Maturity
Date | | | Principal
Amount (000)# | | | Value | |
COMMERCIAL PAPER (Continued) | | | | | | | | | | | | | | | | |
UBS AG, (cont’d.) | | | | | | | | | | | | | | | | |
144A, 1 Month LIBOR + 0.420% | | | 2.514 | %(c) | | | 05/31/19 | | | | 94,000 | | | $ | 94,058,374 | |
University of Texas System Board of Regents Revenue Financing | | | 2.170 | | | | 09/10/18 | | | | 12,500 | | | | 12,504,375 | |
University of Texas System Board of Regents Revenue Financing | | | 2.170 | | | | 09/13/18 | | | | 21,000 | | | | 21,009,030 | |
University of Texas System Board of Regents Revenue Financing | | | 2.170 | | | | 09/18/18 | | | | 15,000 | | | | 15,004,650 | |
University of Virginia | | | — | (p) | | | 08/07/18 | | | | 25,000 | | | | 24,990,750 | |
University of Virginia | | | — | (p) | | | 08/13/18 | | | | 20,000 | | | | 19,987,000 | |
University of Virginia | | | — | (p) | | | 09/11/18 | | | | 12,000 | | | | 11,971,320 | |
Westpac Banking Corp., | | | | | | | | | | | | | | | | |
144A, 1 Month LIBOR + 0.250% | | | 2.347 | (c) | | | 02/08/19 | | | | 90,000 | | | | 90,039,060 | |
| | | | | | | | | | | | | | | | |
TOTAL COMMERCIAL PAPER
(cost $9,674,318,469) | | | | 9,675,507,811 | |
| | | | | | | | | | | | | | | | |
| | | | |
CORPORATE BONDS 1.7% | | | | | | | | | | | | | | | | |
| | | | |
Auto Manufacturers 0.7% | | | | | | | | | | | | | | | | |
Toyota Motor Credit Corp., | | | | | | | | | | | | | | | | |
Sr. Unsec’d. Notes, MTN, 3 Month LIBOR + 0.060% (Cap N/A, Floor 0.000%), | | | 2.415 | (c) | | | 05/15/19 | | | | 136,000 | | | | 135,989,112 | |
Sr. Unsec’d. Notes, MTN, 3 Month LIBOR + 0.230% (Cap N/A, Floor 0.000%), | | | 2.573 | (c) | | | 08/15/18 | | | | 16,900 | | | | 16,903,137 | |
| | | | | | | | | | | | | | | | |
| | | | | | | | | | | | | | | 152,892,249 | |
| | | | |
Banks 0.3% | | | | | | | | | | | | | | | | |
UBS AG (Switzerland), | | | | | | | | | | | | | | | | |
Sr. Unsec’d. Notes, 144A, 3 Month LIBOR + 0.320% (Cap N/A, Floor 0.000%) | | | 2.639 | (c) | | | 12/07/18 | | | | 26,400 | | | | 26,420,618 | |
Wells Fargo Bank NA, | | | | | | | | | | | | | | | | |
Sr. Unsec’d. Notes, MTN, 3 Month LIBOR + 0.500% | | | 2.819 | (c) | | | 11/28/18 | | | | 41,000 | | | | 41,066,789 | |
| | | | | | | | | | | | | | | | |
| | | | | | | | | | | | | | | 67,487,407 | |
| | | | |
Beverages 0.7% | | | | | | | | | | | | | | | | |
PepsiCo, Inc., | | | | | | | | | | | | | | | | |
Sr. Unsec’d. Notes, 3 Month LIBOR + 0.000% | | | 2.339 | (c) | | | 10/15/18 | | | | 172,000 | | | | 172,042,173 | |
| | | | | | | | | | | | | | | | |
TOTAL CORPORATE BONDS
(cost $392,393,129) | | | | | | | | | | | | | | | 392,421,829 | |
| | | | | | | | | | | | | | | | |
See Notes to Financial Statements.
| | | | | | | | | | | | | | | | |
| Description | | Interest
Rate | | | Maturity
Date | | | Principal
Amount (000)# | | | Value | |
MUNICIPAL BONDS 0.3% | | | | | | | | | | | | | | | | |
| | | | |
New York 0.1% | | | | | | | | | | | | | | | | |
Triborough Bridge & Tunnel Auth. Rev., Subser. 2B, Rfdg., FRDD (Mandatory put date 08/07/18), | | | 1.980 | %(cc) | | | 11/15/32 | | | | 25,000 | | | $ | 25,000,000 | |
| | | | |
Texas 0.2% | | | | | | | | | | | | | | | | |
University of Texas System (The), Rev., Subser. G2, Rfdg., FRDD (Mandatory put date 08/07/18), | | | 1.900 | (cc) | | | 08/01/45 | | | | 29,940 | | | | 29,940,000 | |
| | | | | | | | | | | | | | | | |
TOTAL MUNICIPAL BONDS
(cost $54,940,000) | | | | | | | | | | | | | | | 54,940,000 | |
| | | | | | | | | | | | | | | | |
REPURCHASE AGREEMENTS(m) 11.6% | | | | | | | | | | | | | | | | |
Amherst Pierpont Securities LLC, | | | | | | | | | | | | | | | | |
1.92%, dated 07/25/18, due 08/01/18 in the amount of $140,052,267 | | | | | | | | | | | 140,000 | | | | 140,000,000 | |
1.94%, dated 07/31/18, due 08/01/18 in the amount of $300,016,167 | | | | | | | | | | | 300,000 | | | | 300,000,000 | |
1.94%, dated 07/31/18, due 08/07/18 in the amount of $138,052,057 | | | | | | | | | | | 138,000 | | | | 138,000,000 | |
BNP Paribas SA, | | | | | | | | | | | | | | | | |
1.93%, dated 07/31/18, due 08/01/18 in the amount of $70,003,753 | | | | | | | | | | | 70,000 | | | | 70,000,000 | |
CF Secured LLC, | | | | | | | | | | | | | | | | |
1.93%, dated 07/31/18, due 08/01/18 in the amount of $300,016,083 | | | | | | | | | | | 300,000 | | | | 300,000,000 | |
Credit Agricole Corporate & Investment Bank, | | | | | | | | | | | | | | | | |
1.92%, dated 07/31/18, due 08/01/18 in the amount of $260,013,867 | | | | | | | | | | | 260,000 | | | | 260,000,000 | |
1.93%, dated 07/31/18, due 08/07/18 in the amount of $235,088,190 | | | | | | | | | | | 235,000 | | | | 235,000,000 | |
Merrill Lynch, | | | | | | | | | | | | | | | | |
1.93%, dated 07/31/18, due 08/01/18 in the amount of $257,048,780 | | | | | | | | | | | 257,035 | | | | 257,035,000 | |
MUFG Securities (USA) LLC, | | | | | | | | | | | | | | | | |
1.91%, dated 07/31/18, due 08/01/18 in the amount of $375,019,896 | | | | | | | | | | | 375,000 | | | | 375,000,000 | |
See Notes to Financial Statements.
| | | | |
| Prudential Investment Portfolios 2/PGIM Core Ultra Short Bond Fund | | | 43 | |
PGIM Core Ultra Short Bond Fund
Schedule of Investments (unaudited) (continued)
as of July 31, 2018
| | | | | | | | | | | | | | | | |
| Description | | | | | | | | Principal
Amount (000)# | | | Value | |
REPURCHASE AGREEMENTS (Continued) | | | | | | | | | | | | | | | | |
Nomura Securities International, Inc., | | | | | | | | | | | | | | | | |
1.93%, dated 07/31/18, due 08/01/18 in the amount of $400,021,444 | | | | | | | | | | | 400,000 | | | $ | 400,000,000 | |
TD Securities (USA) LLC, | | | | | | | | | | | | | | | | |
1.93%, dated 07/31/18, due 08/01/18 in the amount of $245,013,135 | | | | | | | | | | | 245,000 | | | | 245,000,000 | |
| | | | | | | | | | | | | | | | |
TOTAL REPURCHASE AGREEMENTS
(cost $2,720,035,000) | | | | | | | | | | | | | | | 2,720,035,000 | |
| | | | | | | | | | | | | | | | |
| | | | |
| | | Interest
Rate | | | Maturity
Date | | | | | | | |
TIME DEPOSITS 0.6% | | | | | | | | | | | | | | | | |
Australia & New Zealand Banking Group | | | 2.350 | % | | | 10/17/18 | | | | 125,000 | | | | 125,000,000 | |
Northern Trust Co. (The) | | | 1.880 | | | | 08/01/18 | | | | 16,874 | | | | 16,874,000 | |
| | | | | | | | | | | | | | | | |
TOTAL TIME DEPOSITS
(cost $141,874,000) | | | | | | | | | | | | | | | 141,874,000 | |
| | | | | | | | | | | | | | | | |
U.S. GOVERNMENT AGENCY OBLIGATIONS 14.6% | | | | | | | | | | | | | | | | |
Federal Home Loan Bank | | | 1.926 | (n) | | | 08/22/18 | | | | 4,950 | | | | 4,944,486 | |
Federal Home Loan Bank | | | 1.927 | (n) | | | 08/24/18 | | | | 220,000 | | | | 219,731,600 | |
Federal Home Loan Bank, 1 Month LIBOR + (0.145)% (Cap N/A, Floor 0.000%) | | | 1.927 | (c) | | | 11/16/18 | | | | 271,000 | | | | 270,976,274 | |
Federal Home Loan Bank | | | 1.930 | (n) | | | 08/15/18 | | | | 208,000 | | | | 207,845,456 | |
Federal Home Loan Bank | | | 1.931 | (n) | | | 09/10/18 | | | | 79,000 | | | | 78,831,493 | |
Federal Home Loan Bank | | | 1.931 | (n) | | | 09/11/18 | | | | 105,000 | | | | 104,770,365 | |
Federal Home Loan Bank | | | 1.932 | (n) | | | 08/20/18 | | | | 415,000 | | | | 414,581,680 | |
Federal Home Loan Bank | | | 1.935 | (n) | | | 08/17/18 | | | | 722,000 | | | | 721,387,022 | |
Federal Home Loan Bank | | | 1.941 | (n) | | | 08/21/18 | | | | 143,000 | | | | 142,848,277 | |
Federal Home Loan Bank | | | 1.951 | (n) | | | 08/29/18 | | | | 425,000 | | | | 424,368,450 | |
Federal Home Loan Bank, 1 Month LIBOR + (0.115)% (Cap N/A, Floor 0.000%) | | | 1.954 | (c) | | | 12/24/18 | | | | 234,000 | | | | 233,995,301 | |
Federal Home Loan Bank, 1 Month LIBOR + (0.115)% (Cap N/A, Floor 0.000%) | | | 1.966 | (c) | | | 11/21/18 | | | | 159,000 | | | | 159,002,163 | |
Federal Home Loan Bank, 1 Month LIBOR + (0.080)% (Cap N/A, Floor 0.000%) | | | 2.020 | (c) | | | 02/04/19 | | | | 205,000 | | | | 205,018,370 | |
Federal Home Loan Bank, 3 Month LIBOR + (0.270)% (Cap N/A, Floor 0.000%) | | | 2.073 | (c) | | | 10/05/18 | | | | 47,000 | | | | 47,003,858 | |
Federal National Mortgage Assoc. | | | 1.914 | (n) | | | 09/12/18 | | | | 70,000 | | | | 69,843,200 | |
See Notes to Financial Statements.
| | | | | | | | | | | | | | | | |
| Description | | Interest
Rate | | | Maturity
Date | | | Principal
Amount (000)# | | | Value | |
U.S. GOVERNMENT AGENCY OBLIGATIONS (Continued) | | | | | | | | | | | | | | | | |
Federal National Mortgage Assoc. | | | 1.914 | %(n) | | | 09/14/18 | | | | 120,000 | | | $ | 119,718,360 | |
| | | | | | | | | | | | | | | | |
TOTAL U.S. GOVERNMENT AGENCY OBLIGATIONS
(cost $3,424,919,719) | | | | | | | | | | | | | | | 3,424,866,355 | |
| | | | | | | | | | | | | | | | |
U.S. TREASURY OBLIGATIONS 6.6% | | | | | | | | | | | | | | | | |
U.S. Treasury Bills | | | 1.914 | (n) | | | 08/16/18 | | | | 57,000 | | | | 56,955,736 | |
U.S. Treasury Bills | | | 1.925 | (n) | | | 09/06/18 | | | | 143,000 | | | | 142,729,730 | |
U.S. Treasury Bills | | | 1.933 | (n) | | | 09/13/18 | | | | 197,000 | | | | 196,557,038 | |
U.S. Treasury Bills | | | 1.936 | (n) | | | 08/30/18 | | | | 170,000 | | | | 169,739,655 | |
U.S. Treasury Bills | | | 1.938 | (n) | | | 09/20/18 | | | | 531,000 | | | | 529,604,282 | |
U.S. Treasury Bills | | | 1.938 | (n) | | | 09/27/18 | | | | 70,000 | | | | 69,789,971 | |
U.S. Treasury Bills | | | 1.977 | (n) | | | 10/04/18 | | | | 119,000 | | | | 118,592,226 | |
U.S. Treasury Bills | | | 1.984 | (n) | | | 10/11/18 | | | | 133,000 | | | | 132,490,799 | |
U.S. Treasury Bills | | | 2.038 | (n) | | | 11/01/18 | | | | 130,000 | | | | 129,335,556 | |
| | | | | | | | | | | | | | | | |
TOTAL U.S. TREASURY OBLIGATIONS
(cost $1,545,787,717) | | | | | | | | | | | | | | | 1,545,794,993 | |
| | | | | | | | | | | | | | | | |
TOTAL INVESTMENTS 102.0%
(cost $23,882,786,465) | | | | | | | | | | | | | | | 23,885,049,936 | |
Liabilities in excess of other assets (2.0)% | | | | | | | | | | | | | | | (470,112,455 | ) |
| | | | | | | | | | | | | | | | |
NET ASSETS 100.0% | | | | | | | | | | | | | | $ | 23,414,937,481 | |
| | | | | | | | | | | | | | | | |
See the Glossary for abbreviations used in the semiannual report:
| # | Principal amount is shown in U.S. dollars unless otherwise stated. |
| (c) | Variable rate instrument. The interest rate shown reflects the rate in effect at July 31, 2018. |
| (cc) | Variable rate instrument. The rate shown is based on the latest available information as of July 31, 2018. Certain variable rate securities are not based on a published reference rate and spread but are determined by the issuer or agent and are based on current market conditions. These securities do not indicate a reference rate and spread in their description. |
| (m) | Repurchase agreements are collateralized by FHLB (coupon rate 1.500%, maturity date 10/21/19), FHLMC (coupon rates 0.000%-7.500%, maturity dates 10/01/18-08/01/48), FNMA (coupon rates 2.000%-7.000%, maturity dates 11/01/18-07/01/48), GNMA (coupon rates 3.000%-5.500%, maturity dates 01/15/34-07/20/67) and U.S. Treasury Securities (coupon rates 0.000%-3.625%%, maturity dates 10/15/18-02/15/48), with the aggregate value, including accrued interest, of $2,774,617,668. |
| (n) | Rate shown reflects yield to maturity at purchase date. |
| (p) | Interest rate not available as of July 31, 2018. |
Fair Value Measurements:
Various inputs are used in determining the value of the Fund’s investments. These inputs are summarized in the three broad levels listed below.
See Notes to Financial Statements.
| | | | |
| Prudential Investment Portfolios 2/PGIM Core Ultra Short Bond Fund | | | 45 | |
PGIM Core Ultra Short Bond Fund
Schedule of Investments (unaudited) (continued)
as of July 31, 2018
Level 1—unadjusted quoted prices generally in active markets for identical securities.
Level 2—quoted prices for similar securities, interest rates and yield curves, prepayment speeds, foreign currency exchange rates and other observable inputs.
Level 3—unobservable inputs for securities valued in accordance with Board approved fair valuation procedures.
The following is a summary of the inputs used as of July 31, 2018 in valuing such portfolio securities:
| | | | | | | | | | | | |
| | | Level 1 | | | Level 2 | | | Level 3 | |
Investments in Securities | | | | | | | | | | | | |
Certificates of Deposit | | $ | — | | | $ | 5,929,609,948 | | | $ | — | |
Commercial Paper | | | — | | | | 9,675,507,811 | | | | — | |
Corporate Bonds | | | — | | | | 392,421,829 | | | | — | |
Municipal Bonds | | | — | | | | 54,940,000 | | | | — | |
Repurchase Agreements | | | — | | | | 2,720,035,000 | | | | — | |
Time Deposits | | | — | | | | 141,874,000 | | | | — | |
U.S. Government Agency Obligations | | | — | | | | 3,424,866,355 | | | | — | |
U.S. Treasury Obligations | | | — | | | | 1,545,794,993 | | | | — | |
| | | | | | | | | | | | |
Total | | $ | — | | | $ | 23,885,049,936 | | | $ | — | |
| | | | | | | | | | | | |
During the period, there were no transfers between Level 1, Level 2 and Level 3 to report.
Industry Classification:
The industry classification of investments and liabilities in excess of other assets shown as a percentage of net assets as of July 31, 2018 were as follows:
| | | | |
Commercial Paper | | | 41.3 | % |
Certificates of Deposit | | | 25.3 | |
U.S. Government Agency Obligations | | | 14.6 | |
Repurchase Agreements | | | 11.6 | |
U.S. Treasury Obligations | | | 6.6 | |
Corporate Bonds | | | 1.7 | |
Time Deposits | | | 0.6 | |
Municipal Bonds | | | 0.3 | % |
| | | | |
| | | 102.0 | |
Liabilities in excess of other assets | | | (2.0 | ) |
| | | | |
| | | 100.0 | % |
| | | | |
Financial Instruments/Transactions—Summary of Offsetting and Netting Arrangements:
The Fund entered into financial instruments/transactions during the reporting period that are either offset in accordance with current requirements or are subject to enforceable master netting arrangements or similar agreements that permit offsetting. The information about offsetting and related netting arrangements for financial instruments/transactions, where the legal right to set-off exists, is presented in the summary below.
See Notes to Financial Statements.
Offsetting of financial instrument/transaction assets and liabilities:
| | | | | | | | | | | | | | | | |
Description | | Counterparty | | | Gross
Market
Value of
Recognized
Assets/
(Liabilities) | | | Collateral
Pledged/(Received)(1) | | | Net Amount | |
Repurchase Agreements | |
| Amherst Pierpont
Securities LLC |
| | $ | 578,000,000 | | | $ | (578,000,000 | ) | | $ | — | |
Repurchase Agreements | | | BNP Paribas SA | | | | 70,000,000 | | | | (70,000,000 | ) | | | — | |
Repurchase Agreements | | | CF Secured LLC | | | | 300,000,000 | | | | (300,000,000 | ) | | | — | |
Repurchase Agreements | |
| Credit Agricole
Corporate &
Investment Bank |
| | | 495,000,000 | | | | (495,000,000 | ) | | | — | |
Repurchase Agreements | | | Merrill Lynch | | | | 257,035,000 | | | | (257,035,000 | ) | | | — | |
Repurchase Agreements | |
| MUFG Securities
(USA) LLC |
| | | 375,000,000 | | | | (375,000,000 | ) | | | — | |
Repurchase Agreements | |
| Nomura Securities
International, Inc. |
| | | 400,000,000 | | | | (400,000,000 | ) | | | — | |
Repurchase Agreements | |
| TD Securities
(USA) LLC |
| | | 245,000,000 | | | | (245,000,000 | ) | | | — | |
| | | | | | | | | | | | | | | | |
| | | | | | $ | 2,720,035,000 | | | | | | | | | |
| | | | | | | | | | | | | | | | |
| (1) | Collateral amount disclosed by the Fund is limited to the market value of financial instruments/transactions. |
See Notes to Financial Statements.
| | | | |
| Prudential Investment Portfolios 2/PGIM Core Ultra Short Bond Fund | | | 47 | |
PGIM Core Ultra Short Bond Fund
Statement of Assets & Liabilities (unaudited)
as of July 31, 2018
| | | | |
Assets | | | | |
Investments at value: | | | | |
Unaffiliated investments (cost $21,162,751,465) | | $ | 21,165,014,936 | |
Repurchase Agreements (cost $2,720,035,000) | | | 2,720,035,000 | |
Interest receivable | | | 13,305,681 | |
Prepaid expenses | | | 323 | |
| | | | |
Total Assets | | | 23,898,355,940 | |
| | | | |
| |
Liabilities | | | | |
Payable for investments purchased | | | 482,833,132 | |
Payable to custodian | | | 380,283 | |
Management fee payable | | | 119,152 | |
Accrued expenses and other liabilities | | | 64,123 | |
Affiliated transfer agent fee payable | | | 16,667 | |
Dividends payable | | | 5,102 | |
| | | | |
Total Liabilities | | | 483,418,459 | |
| | | | |
| |
Net Assets | | $ | 23,414,937,481 | |
| | | | |
| | | | | |
Net assets were comprised of: | | | | |
Shares of beneficial interest, at par | | $ | 23,411,529 | |
Paid-in capital in excess of par | | | 23,389,208,870 | |
| | | | |
| | | 23,412,620,399 | |
Distributions in excess of net investment income | | | (38,683 | ) |
Accumulated net realized gain on investment transactions | | | 92,294 | |
Net unrealized appreciation on investments | | | 2,263,471 | |
| | | | |
Net assets, July 31, 2018 | | $ | 23,414,937,481 | |
| | | | |
Net asset value and redemption price per share
($23,414,937,481 ÷ 23,411,528,658 shares of beneficial interest issued and outstanding) | | $ | 1.00 | |
| | | | |
See Notes to Financial Statements.
PGIM Core Ultra Short Bond Fund
Statement of Operations (unaudited)
Six Months Ended July 31, 2018
| | | | |
Net Investment Income (Loss) | | | | |
Interest income | | $ | 210,870,692 | |
| | | | |
| |
Expenses | | | | |
Management fee | | | 920,685 | |
Custodian and accounting fees | | | 75,019 | |
Transfer agent’s fees and expenses (including affiliated expense of $ 50,000) | | | 50,535 | |
Audit fee | | | 12,316 | |
Legal fees and expenses | | | 8,021 | |
Trustees’ fees | | | 6,111 | |
Shareholders’ reports | | | 4,374 | |
Miscellaneous | | | 30,643 | |
| | | | |
Total expenses | | | 1,107,704 | |
| | | | |
Net investment income (loss) | | | 209,762,988 | |
| | | | |
| |
Realized And Unrealized Gain (Loss) On Investments | | | | |
Net realized gain (loss) on investment transactions | | | 92,294 | |
Net change in unrealized appreciation (depreciation) on investments | | | 1,331,624 | |
| | | | |
Net gain (loss) on investment transactions | | | 1,423,918 | |
| | | | |
Net Increase (Decrease) In Net Assets Resulting From Operations | | $ | 211,186,906 | |
| | | | |
See Notes to Financial Statements.
| | | | |
| Prudential Investment Portfolios 2/PGIM Core Ultra Short Bond Fund | | | 49 | |
PGIM Core Ultra Short Bond Fund
Statements of Changes in Net Assets (unaudited)
| | | | | | | | |
| | | Six Months
Ended
July 31, 2018 | | | Year
Ended
January 31, 2018 | |
Increase (Decrease) in Net Assets | | | | | | | | |
Operations | | | | | | | | |
Net investment income (loss) | | $ | 209,762,988 | | | $ | 273,826,896 | |
Net realized gain (loss) on investment transactions | | | 92,294 | | | | 230,206 | |
Net change in unrealized appreciation (depreciation) on investments | | | 1,331,624 | | | | (3,862,277 | ) |
| | | | | | | | |
Net increase (decrease) in net assets resulting from operations | | | 211,186,906 | | | | 270,194,825 | |
| | | | | | | | |
Dividends from net investment income | | | (209,850,861 | ) | | | (274,051,674 | ) |
| | | | | | | | |
Fund share transactions | | | | | | | | |
Net proceeds from shares sold | | | 78,893,497,746 | | | | 140,971,576,110 | |
Net asset value of shares issued in reinvestment of dividends | | | 209,130,526 | | | | 273,122,231 | |
Cost of shares reacquired | | | (78,199,734,404 | ) | | | (144,286,929,866 | ) |
| | | | | | | | |
Net increase (decrease) in net assets from Fund share transactions | | | 902,893,868 | | | | (3,042,231,525 | ) |
| | | | | | | | |
Total increase (decrease) | | | 904,229,913 | | | | (3,046,088,374 | ) |
| | |
Net Assets: | | | | | | | | |
Beginning of period | | | 22,510,707,568 | | | | 25,556,795,942 | |
| | | | | | | | |
End of period(a) | | $ | 23,414,937,481 | | | $ | 22,510,707,568 | |
| | | | | | | | |
(a) Includes undistributed/(distributions in excess of) net investment income of: | | $ | (38,683 | ) | | $ | 49,190 | |
| | | | | | | | |
See Notes to Financial Statements.
PGIM Institutional Money Market Fund
Schedule of Investments (unaudited)
as of July 31, 2018
| | | | | | | | | | | | | | | | |
| Description | | Interest
Rate | | | Maturity
Date | | | Principal
Amount (000)# | | | Value | |
CERTIFICATES OF DEPOSIT 36.5% | | | | | | | | | | | | | | | | |
Bank of America NA, | | | | | | | | | | | | | | | | |
1 Month LIBOR + 0.170% | | | 2.267 | %(c) | | | 08/08/18 | | | | 70,000 | | | $ | 69,999,616 | |
1 Month LIBOR + 0.200% | | | 1.780 | (c) | | | 10/09/18 | | | | 87,000 | | | | 86,999,970 | |
1 Month LIBOR + 0.410% | | | 2.497 | (c) | | | 11/06/18 | | | | 121,000 | | | | 121,062,910 | |
1 Month LIBOR + 0.220% | | | 2.317 | (c) | | | 01/14/19 | | | | 76,000 | | | | 76,002,812 | |
Bank of Montreal, | | | | | | | | | | | | | | | | |
1 Month LIBOR + 0.260% | | | 2.357 | (c) | | | 02/08/19 | | | | 92,000 | | | | 92,030,176 | |
Bank of Nova Scotia, | | | | | | | | | | | | | | | | |
1 Month LIBOR + 0.430% | | | 2.502 | (c) | | | 09/14/18 | | | | 125,000 | | | | 125,070,750 | |
1 Month LIBOR + 0.310% | | | 2.392 | (c) | | | 06/19/19 | | | | 114,000 | | | | 114,039,900 | |
BNP Paribas SA, | | | | | | | | | | | | | | | | |
3 Month LIBOR + 0.140% | | | 2.472 | (c) | | | 06/24/19 | | | | 5,000 | | | | 5,000,414 | |
1 Month LIBOR + 0.240% | | | 2.322 | (c) | | | 02/19/19 | | | | 152,000 | | | | 152,001,064 | |
1 Month LIBOR + 0.270% | | | 2.342 | (c) | | | 11/15/18 | | | | 100,000 | | | | 100,034,200 | |
BNP Paribas SA | | | 2.270 | | | | 09/21/18 | | | | 122,000 | | | | 122,036,161 | |
Canadian Imperial Bank of Commerce, | | | | | | | | | | | | | | | | |
3 Month LIBOR + 0.250% | | | 2.583 | (c) | | | 09/13/18 | | | | 3,000 | | | | 3,000,703 | |
3 Month LIBOR + 0.200% | | | 2.543 | (c) | | | 05/01/19 | | | | 40,000 | | | | 40,024,488 | |
1 Month LIBOR + 0.210% | | | 2.282 | (c) | | | 11/15/18 | | | | 125,000 | | | | 125,021,625 | |
1 Month LIBOR + 0.190% | | | 2.276 | (c) | | | 08/20/18 | | | | 44,200 | | | | 44,203,271 | |
1 Month LIBOR + 0.190% | | | 2.267 | (c) | | | 08/31/18 | | | | 25,000 | | | | 25,005,150 | |
1 Month LIBOR + 0.230% | | | 2.302 | (c) | | | 11/14/18 | | | | 95,000 | | | | 95,026,695 | |
3 Month LIBOR + 0.130% | | | 2.463 | (c) | | | 07/17/19 | | | | 81,000 | | | | 80,992,068 | |
Citibank NA, | | | | | | | | | | | | | | | | |
1 Month LIBOR + 0.180% | | | 2.277 | (c) | | | 08/08/18 | | | | 70,000 | | | | 70,004,830 | |
1 Month LIBOR + 0.190% | | | 2.276 | (c) | | | 09/10/18 | | | | 117,000 | | | | 117,030,186 | |
Citibank NA | | | 2.330 | | | | 10/22/18 | | | | 150,000 | | | | 150,032,415 | |
Commonwealth Bank of Australia, | | | | | | | | | | | | | | | | |
1 Month LIBOR + 0.330% | | | 2.412 | (c) | | | 03/01/19 | | | | 20,000 | | | | 20,016,480 | |
Cooperatieve Rabobank UA, | | | | | | | | | | | | | | | | |
1 Month LIBOR + 0.160% | | | 2.241 | (c) | | | 08/23/18 | | | | 38,000 | | | | 38,005,814 | |
1 Month LIBOR + 0.210% | | | 2.282 | (c) | | | 11/15/18 | | | | 133,000 | | | | 133,028,595 | |
Credit Agricole Corporate & Investment Bank, | | | | | | | | | | | | | | | | |
1 Month LIBOR + 0.330% | | | 2.427 | (c) | | | 10/09/18 | | | | 90,000 | | | | 90,050,040 | |
Credit Suisse AG | | | 1.850 | | | | 10/29/18 | | | | 70,000 | | | | 69,912,332 | |
Credit Suisse AG, | | | | | | | | | | | | | | | | |
1 Month LIBOR + 0.400% | | | 2.473 | (c) | | | 09/17/18 | | | | 185,000 | | | | 185,101,565 | |
DNB Bank ASA, | | | | | | | | | | | | | | | | |
1 Month LIBOR + 0.160% | | | 2.247 | (c) | | | 08/06/18 | | | | 46,000 | | | | 46,002,208 | |
1 Month LIBOR + 0.300% | | | 2.381 | (c) | | | 10/22/18 | | | | 165,000 | | | | 165,085,635 | |
DNB Bank ASA | | | 2.230 | | | | 08/06/18 | | | | 146,000 | | | | 146,007,577 | |
Mizuho Bank Ltd. | | | 1.950 | | | | 08/07/18 | | | | 200,000 | | | | 199,999,258 | |
MUFG Bank Ltd. | | | 2.100 | | | | 09/27/18 | | | | 154,000 | | | | 154,000,616 | |
MUFG Bank Ltd. | | | 2.260 | | | | 10/29/18 | | | | 154,000 | | | | 154,003,619 | |
See Notes to Financial Statements.
| | | | |
| Prudential Investment Portfolios 2/PGIM Institutional Money Market Fund | | | 51 | |
PGIM Institutional Money Market Fund
Schedule of Investments (unaudited) (continued)
as of July 31, 2018
| | | | | | | | | | | | | | | | |
| Description | | Interest
Rate | | | Maturity
Date | | | Principal
Amount (000)# | | | Value | |
CERTIFICATES OF DEPOSIT (Continued) | | | | | | | | | | | | | | | | |
Natixis SA, | | | | | | | | | | | | | | | | |
3 Month LIBOR + 0.150% | | | 2.492 | %(c) | | | 10/31/18 | | | | 54,600 | | | $ | 54,614,891 | |
1 Month LIBOR + 0.350% | | | 2.436 | (c) | | | 03/05/19 | | | | 143,000 | | | | 143,050,765 | |
Nordea Bank AB, | | | | | | | | | | | | | | | | |
3 Month LIBOR + 0.200% | | | 2.541 | (c) | | | 03/15/19 | | | | 92,000 | | | | 92,101,511 | |
Royal Bank of Canada, | | | | | | | | | | | | | | | | |
3 Month LIBOR + 0.130% | | | 2.467 | (c) | | | 07/12/19 | | | | 145,000 | | | | 144,986,028 | |
Skandinaviska Enskilda Banken AB, | | | | | | | | | | | | | | | | |
1 Month LIBOR + 0.310% | | | 2.392 | (c) | | | 10/19/18 | | | | 165,000 | | | | 165,089,265 | |
Sumitomo Mitsui Banking Corp., | | | | | | | | | | | | | | | | |
1 Month LIBOR + 0.210% | | | 2.292 | (c) | | | 09/19/18 | | | | 114,200 | | | | 114,214,389 | |
Sumitomo Mitsui Banking Corp. | | | 2.350 | | | | 11/01/18 | | | | 108,000 | | | | 108,020,455 | |
Sumitomo Mitsui Trust Bank Ltd., | | | | | | | | | | | | | | | | |
3 Month LIBOR + 0.200% | | | 2.535 | (c) | | | 09/25/18 | | | | 45,000 | | | | 45,022,095 | |
1 Month LIBOR + 0.230% | | | 2.309 | (c) | | | 09/18/18 | | | | 106,000 | | | | 106,016,324 | |
Sumitomo Mitsui Trust Bank Ltd. | | | 1.940 | | | | 08/06/18 | | | | 250,000 | | | | 249,999,500 | |
Svenska Handelsbanken AB, | | | | | | | | | | | | | | | | |
1 Month LIBOR + 0.190% | | | 2.276 | (c) | | | 02/20/19 | | | | 87,000 | | | | 87,002,784 | |
1 Month LIBOR + 0.180% | | | 2.249 | (c) | | | 08/24/18 | | | | 20,000 | | | | 20,003,260 | |
1 Month LIBOR + 0.160% | | | 2.257 | (c) | | | 08/09/18 | | | | 100,000 | | | | 100,007,200 | |
1 Month LIBOR + 0.220% | | | 2.284 | (c) | | | 01/25/19 | | | | 102,000 | | | | 102,024,480 | |
1 Month LIBOR + 0.180% | | | 2.266 | (c) | | | 09/04/18 | | | | 73,000 | | | | 73,016,279 | |
Swedbank AB, | | | | | | | | | | | | | | | | |
1 Month LIBOR + 0.190% | | | 2.259 | (c) | | | 02/25/19 | | | | 170,000 | | | | 169,990,990 | |
Toronto-Dominion Bank (The), | | | | | | | | | | | | | | | | |
3 Month LIBOR + 0.080% | | | 2.410 | (c) | | | 03/21/19 | | | | 117,000 | | | | 116,999,416 | |
1 Month LIBOR + 0.190% | | | 2.262 | (c) | | | 08/28/18 | | | | 113,000 | | | | 113,021,696 | |
Toronto-Dominion Bank (The) | | | 2.280 | | | | 09/19/18 | | | | 40,000 | | | | 40,011,364 | |
Wells Fargo Bank NA, | | | | | | | | | | | | | | | | |
3 Month LIBOR + 0.230% | | | 2.569 | (c) | | | 04/16/19 | | | | 130,000 | | | | 130,126,978 | |
1 Month LIBOR + 0.220% | | | 2.317 | (c) | | | 10/05/18 | | | | 105,000 | | | | 105,036,855 | |
3 Month LIBOR + 0.160% | | | 2.497 | (c) | | | 08/13/19 | | | | 118,000 | | | | 117,988,155 | |
Westpac Banking Corp., | | | | | | | | | | | | | | | | |
1 Month LIBOR + 0.200% | | | 2.286 | (c) | | | 11/05/18 | | | | 90,000 | | | | 90,023,940 | |
1 Month LIBOR + 0.400% | | | 2.472 | (c) | | | 03/14/19 | | | | 130,000 | | | | 130,186,680 | |
| | | | | | | | | | | | | | | | |
TOTAL CERTIFICATES OF DEPOSIT
(cost $5,833,037,619) | | | | | | | | | | | | | | | 5,834,388,443 | |
| | | | | | | | | | | | | | | | |
| | | | |
COMMERCIAL PAPER 36.6% | | | | | | | | | | | | | | | | |
ABN AMRO Funding USA LLC, | | | | | | | | | | | | | | | | |
144A | | | 2.450 | (n) | | | 09/05/18 | | | | 140,000 | | | | 139,710,200 | |
Apple, Inc., | | | | | | | | | | | | | | | | |
144A | | | 2.130 | (n) | | | 09/20/18 | | | | 75,000 | | | | 74,785,057 | |
See Notes to Financial Statements.
| | | | | | | | | | | | | | | | |
| Description | | Interest
Rate | | | Maturity
Date | | | Principal
Amount (000)# | | | Value | |
COMMERCIAL PAPER (Continued) | | | | | | | | | | | | | | | | |
Bank Nederlandse Gemeenten NV, | | | | | | | | | | | | | | | | |
144A | | | 1.940 | %(n) | | | 08/01/18 | | | | 54,000 | | | $ | 53,997,100 | |
144A | | | 1.960 | (n) | | | 08/06/18 | | | | 317,000 | | | | 316,896,246 | |
Bank of New York Mellon (The) | | | 2.280 | (n) | | | 09/20/18 | | | | 38,000 | | | | 37,888,565 | |
BASF SE, | | | | | | | | | | | | | | | | |
144A | | | 2.140 | (n) | | | 09/06/18 | | | | 96,000 | | | | 95,800,493 | |
CDP Financial, Inc., | | | | | | | | | | | | | | | | |
144A | | | 2.250 | (n) | | | 09/04/18 | | | | 50,000 | | | | 49,902,925 | |
144A | | | 2.250 | (n) | | | 09/06/18 | | | | 10,000 | | | | 9,979,414 | |
144A | | | 2.270 | (n) | | | 09/13/18 | | | | 47,500 | | | | 47,382,323 | |
144A | | | 2.270 | (n) | | | 09/14/18 | | | | 90,000 | | | | 89,771,625 | |
144A | | | 2.260 | (n) | | | 09/18/18 | | | | 20,000 | | | | 19,944,386 | |
144A | | | 2.260 | (n) | | | 09/19/18 | | | | 60,000 | | | | 59,829,414 | |
144A | | | 2.080 | (n) | | | 09/21/18 | | | | 25,000 | | | | 24,925,865 | |
Chevron Corp., | | | | | | | | | | | | | | | | |
144A | | | 2.020 | (n) | | | 08/14/18 | | | | 47,000 | | | | 46,965,126 | |
Commonwealth Bank of Australia, | | | | | | | | | | | | | | | | |
144A, 1 Month LIBOR + 0.330% | | | 2.402 | (c) | | | 02/28/19 | | | | 137,000 | | | | 137,111,244 | |
144A, 1 Month LIBOR + 0.200% | | | 2.282 | (c) | | | 10/19/18 | | | | 66,000 | | | | 66,019,800 | |
Federation Des Caisses Desjardins, | | | | | | | | | | | | | | | | |
144A | | | 2.140 | (n) | | | 09/14/18 | | | | 45,000 | | | | 44,873,437 | |
144A | | | 2.030 | (n) | | | 08/14/18 | | | | 175,000 | | | | 174,866,685 | |
144A | | | 2.080 | (n) | | | 09/05/18 | | | | 50,000 | | | | 49,898,700 | |
144A | | | — | (p) | | | 06/20/19 | | | | 90,000 | | | | 89,992,170 | |
General Dynamics Corp., | | | | | | | | | | | | | | | | |
144A | | | 2.120 | (n) | | | 08/01/18 | | | | 92,000 | | | | 91,995,032 | |
144A | | | 2.160 | (n) | | | 08/14/18 | | | | 28,000 | | | | 27,978,670 | |
General Electric Co. | | | 1.910 | (n) | | | 08/01/18 | | | | 26,000 | | | | 25,998,643 | |
General Electric Co. | | | 1.980 | (n) | | | 08/06/18 | | | | 67,000 | | | | 66,978,727 | |
GlaxoSmithKline LLC, | | | | | | | | | | | | | | | | |
144A | | | 2.080 | (n) | | | 08/06/18 | | | | 183,000 | | | | 182,940,562 | |
144A | | | 2.140 | (n) | | | 08/08/18 | | | | 25,000 | | | | 24,989,160 | |
144A | | | 2.150 | (n) | | | 08/20/18 | | | | 38,000 | | | | 37,958,348 | |
HSBC Bank PLC, | | | | | | | | | | | | | | | | |
144A, 1 Month LIBOR + 0.160% | | | 2.094 | (c) | | | 08/10/18 | | | | 45,000 | | | | 45,003,285 | |
144A, 1 Month LIBOR + 0.210% | | | 2.307 | (c) | | | 11/08/18 | | | | 75,000 | | | | 75,019,350 | |
ING US Funding LLC, | | | | | | | | | | | | | | | | |
1 Month LIBOR + 0.190% | | | 2.264 | (c) | | | 08/13/18 | | | | 132,000 | | | | 132,013,464 | |
1 Month LIBOR + 0.210% | | | 2.288 | (c) | | | 09/11/18 | | | | 181,000 | | | | 181,015,747 | |
1 Month LIBOR + 0.190% | | | 2.282 | (c) | | | 08/01/18 | | | | 22,000 | | | | 22,000,198 | |
JPMorgan Securities LLC, | | | | | | | | | | | | | | | | |
144A, 3 Month LIBOR + 0.180% | | | 2.522 | (c) | | | 10/19/18 | | | | 129,000 | | | | 129,106,425 | |
144A | | | — | (p) | | | 11/07/18 | | | | 42,000 | | | | 42,037,506 | |
144A, 1 Month LIBOR + 0.270% | | | 2.339 | (c) | | | 01/24/19 | | | | 42,000 | | | | 42,007,098 | |
See Notes to Financial Statements.
| | | | |
| Prudential Investment Portfolios 2/PGIM Institutional Money Market Fund | | | 53 | |
PGIM Institutional Money Market Fund
Schedule of Investments (unaudited) (continued)
as of July 31, 2018
| | | | | | | | | | | | | | | | |
| Description | | Interest
Rate | | | Maturity
Date | | | Principal
Amount (000)# | | | Value | |
COMMERCIAL PAPER (Continued) | | | | | | | | | | | | | | | | |
JPMorgan Securities LLC, (cont’d.) | | | | | | | | | | | | | | | | |
1 Month LIBOR + 0.300% | | | 2.367 | %(c) | | | 06/12/19 | | | | 95,000 | | | $ | 95,046,740 | |
144A, 3 Month LIBOR + 0.110% | | | 2.445 | (c) | | | 03/25/19 | | | | 68,000 | | | | 67,995,286 | |
KFW, | | | | | | | | | | | | | | | | |
144A | | | 2.040 | (n) | | | 09/12/18 | | | | 58,000 | | | | 57,857,564 | |
144A | | | 2.040 | (n) | | | 09/14/18 | | | | 276,000 | | | | 275,288,969 | |
National Australia Bank Ltd., | | | | | | | | | | | | | | | | |
144A | | | 2.240 | (n) | | | 09/24/18 | | | | 241,000 | | | | 240,221,281 | |
144A | | | 2.240 | (n) | | | 09/25/18 | | | | 90,000 | | | | 89,703,477 | |
Nederlandse Waterschapsbank NV, | | | | | | | | | | | | | | | | |
144A | | | 2.050 | (n) | | | 09/04/18 | | | | 49,000 | | | | 48,902,676 | |
Nestle Capital Corp., | | | | | | | | | | | | | | | | |
144A | | | 1.910 | (n) | | | 08/13/18 | | | | 56,000 | | | | 55,961,416 | |
144A | | | 2.030 | (n) | | | 08/14/18 | | | | 38,000 | | | | 37,971,789 | |
144A | | | 2.070 | (n) | | | 09/11/18 | | | | 40,000 | | | | 39,907,040 | |
144A | | | 2.070 | (n) | | | 09/13/18 | | | | 50,000 | | | | 49,878,145 | |
144A | | | 2.250 | (n) | | | 10/11/18 | | | | 92,000 | | | | 91,618,384 | |
Nissan Motor Acceptance Corp., | | | | | | | | | | | | | | | | |
144A | | | 2.220 | (n) | | | 09/10/18 | | | | 146,100 | | | | 145,764,715 | |
144A | | | 2.260 | (n) | | | 09/12/18 | | | | 50,000 | | | | 49,879,540 | |
144A | | | 2.260 | (n) | | | 09/13/18 | | | | 50,000 | | | | 49,876,615 | |
144A | | | 2.270 | (n) | | | 09/17/18 | | | | 110,000 | | | | 109,701,977 | |
Novartis Finance Corp., | | | | | | | | | | | | | | | | |
144A | | | 2.060 | (n) | | | 08/29/18 | | | | 35,000 | | | | 34,944,543 | |
144A | | | 2.060 | (n) | | | 09/10/18 | | | | 35,200 | | | | 35,119,983 | |
Ontario Teachers’ Finance Trust, | | | | | | | | | | | | | | | | |
144A, 1 Month LIBOR + 0.160% | | | 2.241 | (c) | | | 08/21/18 | | | | 55,000 | | | | 55,007,810 | |
144A, 1 Month LIBOR + 0.150% | | | 2.247 | (c) | | | 08/09/18 | | | | 40,000 | | | | 40,002,760 | |
144A, 1 Month LIBOR + 0.300% | | | 2.018 | (c) | | | 01/11/19 | | | | 30,000 | | | | 30,014,790 | |
Province of Alberta, | | | | | | | | | | | | | | | | |
144A | | | 2.250 | (n) | | | 09/04/18 | | | | 41,000 | | | | 40,920,997 | |
144A | | | 2.250 | (n) | | | 09/05/18 | | | | 64,000 | | | | 63,873,024 | |
144A | | | 2.250 | (n) | | | 09/10/18 | | | | 38,000 | | | | 37,913,618 | |
144A | | | 2.250 | (n) | | | 09/12/18 | | | | 18,500 | | | | 18,455,805 | |
144A | | | 2.260 | (n) | | | 10/04/18 | | | | 45,000 | | | | 44,833,275 | |
PSP Capital, Inc., | | | | | | | | | | | | | | | | |
144A | | | 2.090 | (n) | | | 09/12/18 | | | | 70,000 | | | | 69,833,365 | |
144A | | | 2.090 | (n) | | | 09/17/18 | | | | 50,000 | | | | 49,866,000 | |
Roche Holdings, Inc., | | | | | | | | | | | | | | | | |
144A | | | 2.100 | (n) | | | 09/13/18 | | | | 25,000 | | | | 24,938,798 | |
Societe Generale SA, | | | | | | | | | | | | | | | | |
144A | | | 2.170 | (n) | | | 08/31/18 | | | | 159,000 | | | | 158,729,732 | |
Toronto-Dominion Bank (The), | | | | | | | | | | | | | | | | |
144A,1 Month LIBOR + 0.230% | | | 2.327 | (c) | | | 11/09/18 | | | | 96,000 | | | | 96,029,952 | |
See Notes to Financial Statements.
| | | | | | | | | | | | | | | | |
| Description | | Interest
Rate | | | Maturity
Date | | | Principal
Amount (000)# | | | Value | |
COMMERCIAL PAPER (Continued) | | | | | | | | | | | | | | | | |
Total Capital Canada Ltd., | | | | | | | | | | | | | | | | |
144A | | | 1.970 | %(n) | | | 08/07/18 | | | | 115,000 | | | $ | 114,956,395 | |
144A | | | 2.230 | (n) | | | 09/20/18 | | | | 106,000 | | | | 105,682,403 | |
Toyota Credit Canada, Inc., | | | | | | | | | | | | | | | | |
1 Month LIBOR + 0.250% | | | 2.347 | (c) | | | 03/01/19 | | | | 46,000 | | | | 46,002,806 | |
Toyota Finance Australia Ltd., | | | | | | | | | | | | | | | | |
1 Month LIBOR + 0.400% | | | 2.222 | (c) | | | 11/13/18 | | | | 30,000 | | | | 30,023,370 | |
Toyota Motor Finance (Netherlands) BV, | | | | | | | | | | | | | | | | |
3 Month LIBOR + 0.020% | | | 2.350 | (c) | | | 11/26/18 | | | | 123,000 | | | | 122,998,310 | |
UBS AG, | | | | | | | | | | | | | | | | |
144A, 1 Month LIBOR + 0.270% | | | 2.357 | (c) | | | 09/04/18 | | | | 146,000 | | | | 146,044,092 | |
144A, 3 Month LIBOR + 0.230% | | | 2.593 | (c) | | | 11/08/18 | | | | 12,000 | | | | 12,012,132 | |
144A, 1 Month LIBOR + 0.420% | | | 2.514 | (c) | | | 05/31/19 | | | | 96,000 | | | | 96,059,616 | |
University of Virginia | | | — | (p) | | | 09/11/18 | | | | 9,600 | | | | 9,577,056 | |
Westpac Banking Corp., | | | | | | | | | | | | | | | | |
144A,1 Month LIBOR + 0.250% | | | 2.347 | (c) | | | 02/08/19 | | | | 93,000 | | | | 93,040,362 | |
| | | | | | | | | | | | | | | | |
TOTAL COMMERCIAL PAPER
(cost $5,839,213,098) | | | | | | | | | | | | | | | 5,840,039,598 | |
| | | | | | | | | | | | | | | | |
| | | | |
CORPORATE BONDS 2.0% | | | | | | | | | | | | | | | | |
| | | | |
Auto Manufacturers 0.5% | | | | | | | | | | | | | | | | |
Toyota Motor Credit Corp. (United States), | | | | | | | | | | | | | | | | |
Sr. Unsec’d. Notes, MTN, 3 Month LIBOR + 0.060% | | | 2.415 | (c) | | | 05/15/19 | | | | 70,000 | | | | 69,994,396 | |
Sr. Unsec’d. Notes, MTN, 3 Month LIBOR + 0.230% | | | 2.573 | (c) | | | 08/15/18 | | | | 17,700 | | | | 17,703,286 | |
| | | | | | | | | | | | | | | | |
| | | | | | | | | | | | | | | 87,697,682 | |
| | | | |
Banks 0.8% | | | | | | | | | | | | | | | | |
ABN AMRO Bank NV (Netherlands), | | | | | | | | | | | | | | | | |
Sr. Unsec’d. Notes, 144A, 3 Month LIBOR + 0.640% | | | 2.973 | (c) | | | 01/18/19 | | | | 10,000 | | | | 10,023,000 | |
Bank of Montreal (Canada), | | | | | | | | | | | | | | | | |
Sr. Unsec’d. Notes, MTN | | | 1.350 | | | | 08/28/18 | | | | 6,000 | | | | 5,995,380 | |
Citibank NA, | | | | | | | | | | | | | | | | |
Sr. Unsec’d. Notes, 3 Month LIBOR + 0.340% | | | 2.665 | (c) | | | 03/20/19 | | | | 6,180 | | | | 6,190,577 | |
UBS AG (Switzerland), | | | | | | | | | | | | | | | | |
Sr. Unsec’d. Notes, 144A, 3 Month LIBOR + 0.320% | | | 2.639 | (c) | | | 05/28/19 | | | | 70,000 | | | | 70,071,120 | |
Sr. Unsec’d. Notes, MTN, 144A, 3 Month LIBOR + 0.320% | | | 2.639 | (c) | | | 12/07/18 | | | | 7,000 | | | | 7,005,467 | |
US Bank NA, | | | | | | | | | | | | | | | | |
Sr. Unsec’d. Notes, 3 Month LIBOR + 0.150% | | | 2.480 | (c) | | | 05/24/19 | | | | 21,000 | | | | 21,018,901 | |
Wells Fargo Bank NA, | | | | | | | | | | | | | | | | |
Sr. Unsec’d. Notes, MTN, 3 Month LIBOR + 0.500% | | | 2.819 | (c) | | | 11/28/18 | | | | 8,000 | | | | 8,013,032 | |
| | | | | | | | | | | | | | | | |
See Notes to Financial Statements.
| | | | |
| Prudential Investment Portfolios 2/PGIM Institutional Money Market Fund | | | 55 | |
PGIM Institutional Money Market Fund
Schedule of Investments (unaudited) (continued)
as of July 31, 2018
| | | | | | | | | | | | | | | | |
| Description | | Interest
Rate | | | Maturity
Date | | | Principal
Amount (000)# | | | Value | |
CORPORATE BONDS (Continued) | | | | | | | | | | | | | | | | |
| | | | |
Banks (cont’d.) | | | | | | | | | | | | | | | | |
| | | | | | | | | | | | | | $ | 128,317,477 | |
| | | | |
Beverages 0.7% | | | | | | | | | | | | | | | | |
PepsiCo, Inc., | | | | | | | | | | | | | | | | |
Sr. Unsec’d. Notes, 3 Month LIBOR + 0.000% | | | 2.339 | %(c) | | | 10/15/18 | | | | 108,000 | | | | 108,026,481 | |
| | | | | | | | | | | | | | | | |
TOTAL CORPORATE BONDS
(cost $324,043,083) | | | | | | | | | | | | | | | 324,041,640 | |
| | | | | | | | | | | | | | | | |
| | | | |
MUNICIPAL BONDS 0.8% | | | | | | | | | | | | | | | | |
| | | | |
New York 0.2% | | | | | | | | | | | | | | | | |
Triborough Bridge & Tunnel Auth., Rev., Subser. 2B, Rfdg. | | | 1.980 | (cc) | | | 11/15/32 | | | | 28,035 | | | | 28,035,000 | |
| | | | | | | | | | | | | | | | |
| | | | |
Texas 0.6% | | | | | | | | | | | | | | | | |
University of Texas System (The), Fund Syst., Rev., Subser. G2, Rfdg. | | | 1.900 | (cc) | | | 08/01/45 | | | | 82,375 | | | | 82,375,000 | |
University of Texas System (The), Rev., Subser. G1, Rfdg. | | | 1.900 | (cc) | | | 08/01/45 | | | | 21,000 | | | | 21,000,000 | |
| | | | | | | | | | | | | | | | |
| | | | | | | | | | | | | | | 103,375,000 | |
| | | | | | | | | | | | | | | | |
TOTAL MUNICIPAL BONDS
(cost $131,410,000) | | | | | | | | | | | | | | | 131,410,000 | |
| | | | | | | | | | | | | | | | |
| | | | |
REPURCHASE AGREEMENTS(m) 8.0% | | | | | | | | | | | | | | | | |
Amherst Pierpont Securities LLC, | | | | | | | | | | | | | | | | |
1.92%, dated 07/25/18, due 08/01/18 in the amount of $95,035,467 | | | | | | | | | | | 95,000 | | | | 95,000,000 | |
1.94%, dated 07/31/18, due 08/07/18 in the amount of $96,036,213 | | | | | | | | | | | 96,000 | | | | 96,000,000 | |
1.94%, dated 07/31/18, due 08/01/18 in the amount of $200,010,778 | | | | | | | | | | | 200,000 | | | | 200,000,000 | |
BNP Paribas SA, | | | | | | | | | | | | | | | | |
1.93%, dated 07/31/18, due 08/01/18 in the amount of $22,001,179 | | | | | | | | | | | 22,000 | | | | 22,000,000 | |
CF Secured LLC, | | | | | | | | | | | | | | | | |
1.93%, dated 07/31/18, due 08/01/18 in the amount of $200,010,722 | | | | | | | | | | | 200,000 | | | | 200,000,000 | |
See Notes to Financial Statements.
| | | | | | | | | | | | | | | | |
| Description | | | | | | | | Principal
Amount (000)# | | | Value | |
REPURCHASE AGREEMENTS (Continued) | | | | | | | | | | | | | | | | |
Credit Agricole Corporate & Investment Bank, | | | | | | | | | | | | | | | | |
1.93%, dated 07/31/18, due 08/07/18 in the amount of $163,061,170 | | | | | | | | | | | 163,000 | | | $ | 163,000,000 | |
Merrill Lynch, | | | | | | | | | | | | | | | | |
1.92%, dated 07/31/18, due 08/01/18 in the amount of $150,008,000 | | | | | | | | | | | 150,000 | | | | 150,000,000 | |
Nomura Securities International, Inc., | | | | | | | | | | | | | | | | |
1.93%, dated 07/31/18, due 08/01/18 in the amount of $250,013,403 | | | | | | | | | | | 250,000 | | | | 250,000,000 | |
TD Securities (USA) LLC, | | | | | | | | | | | | | �� | | | |
1.93%, dated 07/31/18, due 08/01/18 in the amount of $100,005,361 | | | | | | | | | | | 100,000 | | | | 100,000,000 | |
| | | | | | | | | | | | | | | | |
TOTAL REPURCHASE AGREEMENTS
(cost $1,276,000,000) | | | | | | | | | | | | | | | 1,276,000,000 | |
| | | | | | | | | | | | | | | | |
| | | | |
| | | Interest
Rate | | | Maturity
Date | | | | | | | |
| | | | |
TIME DEPOSIT 0.4% | | | | | | | | | | | | | | | | |
Northern Trust Co.
(cost $60,265,000) | | | 1.880 | % | | | 08/01/18 | | | | 60,265 | | | | 60,265,000 | |
| | | | | | | | | | | | | | | | |
| | | | |
U.S. GOVERNMENT AGENCY OBLIGATIONS 8.0% | | | | | | | | | | | | | | | | |
Federal Home Loan Bank | | | 1.902 | (n) | | | 08/15/18 | | | | 116,000 | | | | 115,913,812 | |
Federal Home Loan Bank | | | 1.905 | (n) | | | 09/10/18 | | | | 55,000 | | | | 54,882,685 | |
Federal Home Loan Bank | | | 1.905 | (n) | | | 09/11/18 | | | | 73,000 | | | | 72,840,349 | |
Federal Home Loan Bank | | | 1.909 | (n) | | | 08/17/18 | | | | 219,000 | | | | 218,814,069 | |
Federal Home Loan Bank | | | 1.915 | (n) | | | 08/21/18 | | | | 92,000 | | | | 91,902,388 | |
Federal Home Loan Bank | | | 1.925 | (n) | | | 08/29/18 | | | | 550,000 | | | | 549,182,700 | |
Federal Home Loan Bank, 1 Month LIBOR + (0.115)% (Cap N/A, Floor 0.000%) | | | 1.954 | (c) | | | 12/24/18 | | | | 56,000 | | | | 55,998,876 | |
Federal Home Loan Bank, 1 Month LIBOR + (0.115)% (Cap N/A, Floor 0.000%) | | | 1.966 | (c) | | | 11/21/18 | | | | 110,000 | | | | 110,001,496 | |
| | | | | | | | | | | | | | | | |
TOTAL U.S. GOVERNMENT AGENCY OBLIGATIONS
(cost $1,269,543,375) | | | | | | | | | | | | | | | 1,269,536,375 | |
| | | | | | | | | | | | | | | | |
| | | | |
U.S. TREASURY OBLIGATIONS 8.9% | | | | | | | | | | | | | | | | |
U.S. Treasury Bills | | | 1.888 | (s) | | | 08/16/18 | | | | 37,000 | | | | 36,971,267 | |
U.S. Treasury Bills | | | 1.899 | (s) | | | 09/06/18 | | | | 92,000 | | | | 91,826,120 | |
U.S. Treasury Bills | | | 1.905 | (s) | | | 09/27/18 | | | | 450,000 | | | | 448,649,811 | |
U.S. Treasury Bills | | | 1.907 | (s) | | | 09/13/18 | | | | 131,000 | | | | 130,705,441 | |
U.S. Treasury Bills | | | 1.909 | (s) | | | 08/30/18 | | | | 115,000 | | | | 114,823,884 | |
U.S. Treasury Bills | | | 1.912 | (s) | | | 09/20/18 | | | | 350,000 | | | | 349,080,036 | |
See Notes to Financial Statements.
| | | | |
| Prudential Investment Portfolios 2/PGIM Institutional Money Market Fund | | | 57 | |
PGIM Institutional Money Market Fund
Schedule of Investments (unaudited) (continued)
as of July 31, 2018
| | | | | | | | | | | | | | | | |
| Description | | Interest
Rate | | | Maturity
Date | | | Principal
Amount (000)# | | | Value | |
U.S. TREASURY OBLIGATIONS (Continued) | | | | | | | | | | | | | | | | |
U.S. Treasury Bills | | | 1.950 | %(s) | | | 10/04/18 | | �� | | 78,000 | | | $ | 77,732,720 | |
U.S. Treasury Bills | | | 1.957 | (s) | | | 10/11/18 | | | | 88,000 | | | | 87,663,085 | |
U.S. Treasury Bills | | | 2.010 | (s) | | | 11/01/18 | | | | 90,000 | | | | 89,540,000 | |
| | | | | | | | | | | | | | | | |
TOTAL U.S. TREASURY OBLIGATIONS
(cost $1,426,990,457) | | | | | | | | | | | | | | | 1,426,992,364 | |
| | | | | | | | | | | | | | | | |
TOTAL INVESTMENTS 101.2%
(amortized cost $16,160,502,632) | | | | | | | | | | | | | | | 16,162,673,420 | |
Liabilities in excess of other assets (1.2)% | | | | | | | | | | | | | | | (192,515,428 | ) |
| | | | | | | | | | | | | | | | |
NET ASSETS 100.0% | | | | | | | | | | | | | | $ | 15,970,157,992 | |
| | | | | | | | | | | | | | | | |
See the Glossary for abbreviations used in the semiannual report.
| # | Principal amount is shown in U.S. dollars unless otherwise stated. |
| (c) | Variable rate instrument. The interest rate shown reflects the rate in effect at July 31, 2018. |
| (cc) | Variable rate instrument. The rate shown is based on the latest available information as of July 31, 2018. Certain variable rate securities are not based on a published reference rate and spread but are determined by the issuer or agent and are based on current market conditions. These securities do not indicate a reference rate and spread in their description. |
| (m) | Repurchase agreements are collateralized by FCSB (coupon rate 3.440%, maturity date 02/14/28), FHLB (coupon rates 0.000%-4.080%, maturity dates 08/20/18-09/25/37), FMAC (coupon rates 0.000%-8.000%, maturity dates 10/01/18-08/01/48), FNMA (coupon rates 0.000%-7.000%, maturity dates 11/01/18-06/01/51), GNMA (coupon rates 2.000%-7.000%, maturity dates 05/15/28-07/20/67), Tennessee Valley Auth. (coupon rates 5.375%-5.500%, maturity dates 06/15/38-04/01/56), and U.S. Treasury Securities (coupon rate 0.000%-2.875%%, maturity date 09/13/18-11/15/47), with the aggregate value, including accrued interest, of $1,301,634,234. |
| (n) | Rate shown reflects yield to maturity at purchase date. |
| (p) | Interest rate not available as of July 31, 2018. |
| (s) | Represents zero coupon bond or principal only security. Rate represents yield to maturity at purchase date. |
Fair Value Measurements:
Various inputs are used in determining the value of the Fund’s investments. These inputs are summarized in the three broad levels listed below.
Level 1—unadjusted quoted prices generally in active markets for identical securities.
Level 2—quoted prices for similar securities, interest rates and yield curves, prepayment speeds, foreign currency exchange rates and other observable inputs.
Level 3—unobservable inputs for securities valued in accordance with Board approved fair valuation procedures.
See Notes to Financial Statements.
The following is a summary of the inputs used as of July 31, 2018 in valuing such portfolio securities:
| | | | | | | | | | | | |
| | | Level 1 | | | Level 2 | | | Level 3 | |
Investments in Securities | | | | | | | | | | | | |
Certificates of Deposit | | $ | — | | | $ | 5,834,388,443 | | | $ | — | |
Commercial Paper | | | — | | | | 5,840,039,598 | | | | — | |
Corporate Bonds | | | — | | | | 324,041,640 | | | | — | |
Municipal Bonds | | | — | | | | 131,410,000 | | | | — | |
Repurchase Agreements | | | — | | | | 1,276,000,000 | | | | — | |
Time Deposit | | | — | | | | 60,265,000 | | | | — | |
U.S. Government Agency Obligations | | | — | | | | 1,269,536,375 | | | | — | |
U.S. Treasury Obligations | | | — | | | | 1,426,992,364 | | | | — | |
| | | | | | | | | | | | |
Total | | $ | — | | | $ | 16,162,673,420 | | | $ | — | |
| | | | | | | | | | | | |
During the period, there were no transfers between Level 1, Level 2 and Level 3 to report.
Industry Classification:
The industry classification of investments and liabilities in excess of other assets shown as a percentage of net assets as of July 31, 2018 were as follows:
| | | | |
Commercial Paper | | | 36.6 | % |
Certificates of Deposit | | | 36.5 | |
U.S. Treasury Obligations | | | 8.9 | |
U.S. Government Agency Obligations | | | 8.0 | |
Repurchase Agreements | | | 8.0 | |
Corporate Bonds | | | 2.0 | |
Municipal Bonds | | | 0.8 | |
Time Deposit | | | 0.4 | % |
| | | | |
| | | 101.2 | |
Liabilities in excess of other assets | | | (1.2 | ) |
| | | | |
| | | 100.0 | % |
| | | | |
Financial Instruments/Transactions—Summary of Offsetting and Netting Arrangements:
The Fund entered into financial instruments/transactions during the reporting period that are either offset in accordance with current requirements or are subject to enforceable master netting arrangements or similar agreements that permit offsetting. The information about offsetting and related netting arrangements for financial instruments/transactions, where the legal right to set-off exists, is presented in the summary below.
Offsetting of financial instrument/transaction assets and liabilities:
| | | | | | | | | | | | | | |
Description | | Counterparty | | Gross
Market
Value of
Recognized
Assets/
(Liabilities) | | | Collateral
Pledged/(Received) | | | Net Amount | |
Repurchase Agreements | | Amherst Pierpont Securities LLC | | $ | 391,000,000 | | | $ | (391,000,000 | ) | | $ | — | |
Repurchase Agreements | | BNP Paribas SA | | | 22,000,000 | | | | (22,000,000 | ) | | | — | |
Repurchase Agreements | | CF Secured LLC | | | 200,000,000 | | | | (200,000,000 | ) | | | — | |
Repurchase Agreements | | Credit Agricole Corporate & Investment Bank | | | 163,000,000 | | | | (163,000,000 | ) | | | — | |
Repurchase Agreements | | Merrill Lynch | | | 150,000,000 | | | | (150,000,000 | ) | | | — | |
See Notes to Financial Statements.
| | | | |
| Prudential Investment Portfolios 2/PGIM Institutional Money Market Fund | | | 59 | |
PGIM Institutional Money Market Fund
Schedule of Investments (unaudited) (continued)
as of July 31, 2018
| | | | | | | | | | | | | | |
Description | | Counterparty | | Gross
Market
Value of
Recognized
Assets/
(Liabilities) | | | Collateral
Pledged/(Received) | | | Net Amount | |
Repurchase Agreements | | Nomura Securities International, Inc. | | $ | 250,000,000 | | | $ | (250,000,000 | ) | | $ | — | |
Repurchase Agreements | | TD Securities (USA) LLC | | | 100,000,000 | | | | (100,000,000 | ) | | | — | |
| | | | | | | | | | | | | | |
| | | | $ | 1,276,000,000 | | | | | | | | | |
| | | | | | | | | | | | | | |
See Notes to Financial Statements.
PGIM Institutional Money Market Fund
Statement of Assets & Liabilities (unaudited)
as of July 31, 2018
| | | | |
Assets | | | | |
Investments at value: | | | | |
Unaffiliated investments (cost $14,884,502,632) | | $ | 14,886,673,420 | |
Repurchase Agreements (cost $1,276,000,000) | | | 1,276,000,000 | |
Cash | | | 829 | |
Interest receivable | | | 12,907,292 | |
| | | | |
Total Assets | | | 16,175,581,541 | |
| | | | |
| |
Liabilities | | | | |
Payable for investments purchased | | | 204,374,471 | |
Management fee payable | | | 823,498 | |
Custodian & accounting fee payable | | | 161,740 | |
Accrued expenses and other liabilities | | | 47,173 | |
Affiliated transfer agent fee payable | | | 16,667 | |
| | | | |
Total Liabilities | | | 205,423,549 | |
| | | | |
| |
Net Assets | | $ | 15,970,157,992 | |
| | | | |
| | | | | |
Net assets were comprised of: | | | | |
Shares of beneficial interest, at par | | $ | 32,183,863 | |
Paid-in capital in excess of par | | | 15,935,803,340 | |
| | | | |
| | | 15,967,987,203 | |
Distributions in excess of net investment income | | | (143,353 | ) |
Accumulated net realized gain on investment transactions | | | 143,354 | |
Net unrealized appreciation on investments | | | 2,170,788 | |
| | | | |
Net assets, July 31, 2018 | | $ | 15,970,157,992 | |
| | | | |
| |
Class D | | | | |
Net asset value, offering price and redemption price per share,
($15,970,157,992÷15,968,045,593 shares of beneficial interest issued and outstanding) | | $ | 1.0001 | |
| | | | |
See Notes to Financial Statements.
| | | | |
| Prudential Investment Portfolios 2/PGIM Institutional Money Market Fund | | | 61 | |
PGIM Institutional Money Market Fund
Statement of Operations (unaudited)
Six Months Ended July 31, 2018
| | | | |
Net Investment Income (Loss) | | | | |
Interest income | | $ | 144,041,580 | |
| | | | |
| |
Expenses | | | | |
Management fee | | | 10,855,805 | |
Custodian and accounting fees | | | 358,550 | |
Transfer agent’s fees and expenses (including affiliated expense of $ 50,000) | | | 89,549 | |
Audit fee | | | 12,723 | |
Legal fees and expenses | | | 8,780 | |
Trustees’ fees | | | 6,252 | |
Shareholders’ reports | | | 5,493 | |
Miscellaneous | | | 21,663 | |
| | | | |
Total expenses | | | 11,358,815 | |
Less: Fee waiver and/or expense reimbursement | | | (6,292,774 | ) |
| | | | |
Net expenses | | | 5,066,041 | |
| | | | |
Net investment income (loss) | | | 138,975,539 | |
| | | | |
| |
Realized And Unrealized Gain (Loss) On Investments | | | | |
Net realized gain (loss) on investment transactions | | | 155,615 | |
Net change in unrealized appreciation (depreciation) on investments | | | 1,439,437 | |
| | | | |
Net gain (loss) on investment transactions | | | 1,595,052 | |
| | | | |
Net Increase (Decrease) In Net Assets Resulting From Operations | | $ | 140,570,591 | |
| | | | |
See Notes to Financial Statements.
PGIM Institutional Money Market Fund
Statements of Changes in Net Assets (unaudited)
| | | | | | | | |
| | | Six Months
Ended
July 31, 2018 | | | Year
Ended
January 31, 2018 | |
Increase (Decrease) in Net Assets | | | | | | | | |
Operations | | | | | | | | |
Net investment income (loss) | | $ | 138,975,539 | | | $ | 161,405,843 | |
Net realized gain (loss) on investment transactions | | | 155,615 | | | | 120,526 | |
Net change in unrealized appreciation (depreciation) on investments | | | 1,439,437 | | | | (1,664,890 | ) |
| | | | | | | | |
Net increase (decrease) in net assets resulting from operations | | | 140,570,591 | | | | 159,861,479 | |
| | | | | | | | |
Dividends and distributions from net investment income | | | (139,131,249 | ) | | | (161,524,644 | ) |
| | | | | | | | |
| | |
Fund share transactions | | | | | | | | |
Net proceeds from shares sold | | | 36,982,543,163 | | | | 69,720,645,020 | |
Net asset value of shares issued in reinvestment of dividends | | | 139,109,457 | | | | 161,510,624 | |
Cost of shares reacquired | | | (34,368,454,383 | ) | | | (70,103,039,166 | ) |
| | | | | | | | |
Net increase (decrease) in net assets from Fund share transactions | | | 2,753,198,237 | | | | (220,883,522 | ) |
| | | | | | | | |
Total increase (decrease) | | | 2,754,637,579 | | | | (222,546,687 | ) |
| | |
Net Assets: | | | | | | | | |
Beginning of period | | | 13,215,520,413 | | | | 13,438,067,100 | |
| | | | | | | | |
End of period(a) | | $ | 15,970,157,992 | | | $ | 13,215,520,413 | |
| | | | | | | | |
(a) Includes undistributed/(distributions in excess of) net investment income of: | | $ | (143,353 | ) | | $ | 12,357 | |
| | | | | | | | |
See Notes to Financial Statements.
| | | | |
| Prudential Investment Portfolios 2/PGIM Institutional Money Market Fund | | | 63 | |
Glossary:
The following abbreviations are used in the semi-annual report:
Q—Quarterly payment frequency for swaps
S—Semiannual payment frequency for swaps
144A—Security was purchased pursuant to Rule 144A under the Securities Act of 1933 and may not be resold subject to that rule except to qualified institutional buyers. Unless otherwise noted, 144A securities are deemed to be liquid.
ABS—Asset-Backed Securities
FHLB—Federal Home Loan Bank
FHLMC—Federal Home Loan Mortgage Corp.
FNMA—Federal National Mortgage Association
FRDD—Floating Rate Daily Demand Note
GMTN—Global Medium Term Note
GNMA—Government National Mortgage Association
LIBOR—London Interbank Offered Rate
MTN—Medium Term Note
OTC—Over-the-counter
Notes to Financial Statements (unaudited)
Prudential Investment Portfolios 2 (the “PIP 2”) is registered under the Investment Company Act of 1940, as amended (“1940 Act”), as an open-end management investment company. PIP 2 consists of eleven separate series: PGIM Core Conservative Bond Fund, PGIM Core Short-Term Bond Fund, PGIM Core Ultra Short Bond Fund, PGIM Institutional Money Market Fund, PGIM Jennison Small-Cap Core Equity Fund, PGIM QMA Emerging Markets Equity Fund, PGIM QMA International Developed Markets Index Fund, PGIM QMA Mid-Cap Core Equity Fund, PGIM QMA US Broad Market Index Fund and PGIM TIPS Fund, each of which are diversified funds and PGIM QMA Commodity Strategies Fund (formerly known as Prudential Commodity Strategies Fund), which is a non-diversified fund for purposes of the 1940 Act and may invest a greater percentage of its assets in the securities of a single company or other issuer than a diversified portfolio.
These financial statements relate only to the PGIM Core Short-Term Bond Fund (the “Short-Term Bond Fund”), the PGIM Core Ultra Short Bond Fund (the “Ultra Short Bond Fund”) and the PGIM Institutional Money Market Fund (the “Institutional Money Market Fund”) (each, a “Fund” and collectively, the “Funds”). Shares of the Funds are not registered under the Securities Act of 1933, as amended. Effective June 11, 2018, the Funds’ names were changed by replacing “Prudential” with “PGIM” in each Fund’s name.
The investment objective of each of the Ultra Short Bond Fund and Institutional Money Market Fund is current income consistent with the preservation of capital and the maintenance of liquidity.
The investment objective of the Short-Term Bond Fund is income consistent with relative stability of principal.
1. Accounting Policies
The Funds follow investment company accounting and reporting guidance of the Financial Accounting Standards Board (“FASB”) Accounting Standard Codification Topic 946 Financial Services—Investment Companies. The following accounting policies conform to U.S. generally accepted accounting principles. The Funds consistently follow such policies in the preparation of their financial statements.
Securities Valuation: Each Fund holds securities and other assets and liabilities that are fair valued at the close of each day (generally, 4:00 PM Eastern time) the New York Stock Exchange (“NYSE”) is open for trading. Fair value is the price that would be received to sell an asset or paid to transfer a liability in an orderly transaction between market participants on the measurement date. PIP 2’s Board of Trustees (the “Board”) has adopted valuation procedures for security valuation under which fair valuation responsibilities have been delegated to PGIM Investments LLC (“PGIM Investments” or “the Manager”). Pursuant to
Notes to Financial Statements (unaudited) (continued)
the Board’s delegation, a Valuation Committee has been established as two persons, being one or more officers of PIP 2, including: PIP 2’s Treasurer (or the Treasurer’s direct reports); and PIP 2’s Chief or Deputy Chief Compliance Officer (or Vice-President-level direct reports of the Chief or Deputy Chief Compliance Officer). Under the current valuation procedures, the Valuation Committee of the Board is responsible for supervising the valuation of portfolio securities and other assets and liabilities. The valuation procedures permit the Funds to utilize independent pricing vendor services, quotations from market makers, and alternative valuation methods when market quotations are either not readily available or not deemed representative of fair value. A record of the Valuation Committee’s actions is subject to the Board’s review, approval, and ratification at its next regularly scheduled quarterly meeting.
For the fiscal reporting period-end, securities and other assets and liabilities were fair valued at the close of the last U.S. business day. Trading in certain foreign securities may occur when the NYSE is closed (including weekends and holidays). Because such foreign securities trade in markets that are open on weekends and U.S. holidays, the values of some of the Fund’s foreign investments may change on days when investors cannot purchase or redeem Fund shares.
Various inputs determine how each Fund’s investments are valued, all of which are categorized according to the three broad levels (Level 1, 2, or 3) detailed in the Schedule of Investments.
Investments in open-end, non-exchange-traded mutual funds are valued at their net asset values as of the close of the NYSE on the date of valuation. These securities are classified as Level 1 in the fair value hierarchy since they may be purchased or sold at their net asset values on the date of valuation.
Fixed income securities traded in the OTC market are generally classified as Level 2 in the fair value hierarchy. Such fixed income securities are typically valued using the market approach which generally involves obtaining data from an approved independent third-party vendor source. Each Fund utilizes the market approach as the primary method to value securities when market prices of identical or comparable instruments are available. The third-party vendors’ valuation techniques used to derive the evaluated bid price are based on evaluating observable inputs, including but not limited to, yield curves, yield spreads, credit ratings, deal terms, tranche level attributes, default rates, cash flows, prepayment speeds, broker/dealer quotations and reported trades.
Certain Level 3 securities are also valued using the market approach when obtaining a single broker quote or when utilizing transaction prices for identical securities that have been used in excess of five business days. During the reporting period, there were no changes to report with respect to the valuation approach and/or valuation techniques discussed above.
OTC derivative instruments are generally classified as Level 2 in the fair value hierarchy. Such derivative instruments are typically valued using the market approach and/or income approach which generally involves obtaining data from an approved independent third-party vendor source. Each Fund utilizes the market approach when quoted prices in broker-dealer markets are available but also includes consideration of alternative valuation approaches, including the income approach. In the absence of reliable market quotations, the income approach is typically utilized for purposes of valuing OTC derivatives such as interest rate swaps based on a discounted cash flow analysis whereby the value of the instrument is equal to the present value of its future cash inflows or outflows. Such analysis includes projecting future cash flows and determining the discount rate (including the present value factors that affect the discount rate) used to discount the future cash flows. In addition, the third-party vendors’ valuation techniques used to derive the evaluated OTC derivative price is based on evaluating observable inputs, including but not limited to, underlying asset prices, indices, spreads, interest rates and exchange rates. Certain OTC derivatives may be classified as Level 3 when valued using the market approach by obtaining a single broker quote or when utilizing unobservable inputs in the income approach. During the reporting period, there were no changes to report with respect to the valuation approach and/or valuation techniques discussed above.
Centrally cleared swaps listed or traded on a multilateral or trade facility platform, such as a registered exchange, are generally valued at the daily settlement price determined by the respective exchange. These securities are classified as Level 2 in the fair value hierarchy, as the daily settlement price is not public.
Securities and other assets that cannot be priced according to the methods described above are valued based on pricing methodologies approved by the Board. In the event that unobservable inputs are used when determining such valuations, the securities will be classified as Level 3 in the fair value hierarchy.
When determining the fair value of securities, some of the factors influencing the valuation include: the nature of any restrictions on disposition of the securities; assessment of the general liquidity of the securities; the issuer’s financial condition and the markets in which it does business; the cost of the investment; the size of the holding and the capitalization of the issuer; the prices of any recent transactions or bids/offers for such securities or any comparable securities; any available analyst media or other reports or information deemed reliable by the Manager regarding the issuer or the markets or industry in which it operates. Using fair value to price securities may result in a value that is different from a security’s most recent closing price and from the price used by other unaffiliated mutual funds to calculate their net asset values.
Restricted and Illiquid Securities: Subject to guidelines adopted by the Board, the Ultra Short Bond Fund and Institutional Money Market Fund may invest up to 5% and the Short-Term Bond Fund may invest up to 15% of their respective net assets in illiquid securities, including those which are restricted as to disposition under securities law (“restricted securities”). Restricted securities are valued pursuant to the valuation
Notes to Financial Statements (unaudited) (continued)
procedures noted above. Illiquid securities are those that, because of the absence of a readily available market or due to legal or contractual restrictions on resale, cannot be sold within seven days in the ordinary course of business at approximately the amount at which the Fund has valued the investment. Therefore, a Fund may find it difficult to sell illiquid securities at the time considered most advantageous by its Subadviser and may incur expenses that would not be incurred in the sale of securities that were freely marketable. Certain securities that would otherwise be considered illiquid because of legal restrictions on resale to the general public may be traded among qualified institutional buyers under Rule 144A of the Securities Act of 1933. These Rule 144A securities, as well as commercial paper that is sold in private placements under Section 4(2) of the Securities Act, may be deemed liquid by a Fund’s Subadviser under the guidelines adopted by the Trustees of the Fund. However, the liquidity of a Fund’s investments in Rule 144A securities could be impaired if trading does not develop or declines.
Repurchase Agreements: In connection with transactions in repurchase agreements with United States financial institutions, it is each Fund’s policy that its custodian or designated subcustodians under triparty repurchase agreements, as the case may be, take possession of the underlying collateral securities, the value of which exceeds the principal amount of the repurchase transactions, including accrued interest. To the extent that any repurchase transaction exceeds one business day, the value of the collateral is marked-to-market on a daily basis to ensure the adequacy of the collateral. If the seller defaults and the value of the collateral declines or, if bankruptcy proceedings are commenced with respect to the seller of the security, realization of the collateral by the Fund may be delayed or limited.
Swap Agreements: The Short-Term Bond Fund may enter into credit default, interest rate and other types of swap agreements. A swap agreement is an agreement to exchange the return generated by one instrument for the return generated by another instrument. Swap agreements are negotiated in the OTC market and may be executed either directly with counterparty (“OTC-traded”) or through a central clearing facility, such as a registered exchange. Swap agreements are valued daily at current market value and any change in value is included in the net unrealized appreciation (depreciation) on swap agreements. Centrally cleared swaps pay or receive an amount known as “variation margin”, based on daily changes in the valuation of the swap contract. Any upfront premiums paid and received are shown as swap premiums paid and swap premiums received in the Statement of Assets and Liabilities. Risk of loss may exceed amounts recognized on the Statement of Assets and Liabilities. Swap agreements outstanding at period end, if any, are listed in the Schedule of Investments.
Interest Rate Swaps: Interest rate swaps represent an agreement between counterparties to exchange cash flows based on the difference between two interest rates, applied to a notional principal amount for a specified period. The Short-Term Bond Fund is subject to
interest rate risk exposure in the normal course of pursuing its investment objective. The Fund used interest rate swaps to maintain its ability to generate steady cash flow by receiving a stream of fixed-rate payments and to increase exposure to prevailing market rates by receiving floating rate payments. The Fund’s maximum risk of loss from counterparty credit risk is the discounted net present value of the cash flows to be received from the counterparty over the contract’s remaining life.
Master Netting Arrangements: The Funds are subject to various Master Agreements, or netting arrangements, with select counterparties. These are agreements which a subadviser may have negotiated and entered into on behalf of the Funds. A master netting arrangement between the Funds and the counterparty permits the Funds to offset amounts payable by the Funds to the same counterparty against amounts to be received; and by the receipt of collateral from the counterparty by the Funds to cover each Fund’s exposure to the counterparty. However, there is no assurance that such mitigating factors are easily enforceable. In addition to master netting arrangements, the right to set-off exists when all the conditions are met such that each of the parties owes the other determinable amounts, the reporting party has the right to set-off the amount owed with the amount owed by the other party, the reporting party intends to set-off, and the right of set-off is enforceable by law. During the reporting period, there was no intention to settle on a net basis and all amounts are presented on a gross basis on the Statement of Assets and Liabilities.
PIP 2, on behalf of the Short-Term Bond Fund, is a party to ISDA (International Swaps and Derivatives Association, Inc.) Master Agreements (Master Agreements) with certain counterparties that govern OTC derivative and foreign exchange contracts entered into from time to time. The Master Agreements may contain provisions regarding, among other things, the parties’ general obligations, representations, agreements, collateral requirements, events of default and early termination. With respect to certain counterparties, in accordance with the terms of the Master Agreements, collateral posted to the Fund is held in a segregated account by the Fund’s custodian and with respect to amounts which can be sold or re-pledged, is presented in the Schedule of Investments. Collateral pledged by the Fund is segregated by the Fund’s custodian and identified in the Schedule of Investments. Collateral can be in the form of cash or debt securities issued by the U.S. Government or related agencies or other securities as agreed to by the Fund and the applicable counterparty. Collateral requirements are determined based on the Fund’s net position with each counterparty. Termination events applicable to the Fund may occur upon a decline in the Fund’s net assets below a specified threshold over a certain period of time. Termination events applicable to counterparties may occur upon a decline in the counterparty’s long-term and short-term credit ratings below a specified level. In each case, upon occurrence, the other party may elect to terminate early and cause settlement of all derivative and foreign exchange contracts outstanding, including the payment of any losses and costs resulting from such early termination, as reasonably determined by the terminating party. Any decision by one or more of the Fund’s counterparties to elect early termination could impact the Fund’s future derivative activity.
Notes to Financial Statements (unaudited) (continued)
In addition to each instrument’s primary underlying risk exposure (e.g. interest rate, credit, equity or foreign exchange, etc.), swap agreements involve, to varying degrees, elements of credit, market and documentation risk. Such risks involve the possibility that no liquid market for these agreements will exist, the counterparty to the agreement may default on its obligation to perform or disagree on the contractual terms of the agreement, and changes in net interest rates will be unfavorable. In connection with these agreements, securities in the portfolio may be identified or received as collateral from the counterparty in accordance with the terms of the respective swap agreements to provide or receive assets of value and serve as recourse in the event of default or bankruptcy/insolvency of either party. Such OTC derivative agreements include conditions which, when materialized, give the counterparty the right to cause an early termination of the transactions under those agreements. Any election by the counterparty for early termination of the contract(s) may impact the amounts reported on financial statements.
As of July 31, 2018, the Short-Term Bond Fund has not met conditions under such agreements that give the counterparty the right to call for an early termination.
Securities Transactions and Net Investment Income: Securities transactions are recorded on the trade date. Realized gains (losses) from investment and currency transactions are calculated on the specific identification method. Dividend income is recorded on the ex-date. Interest income, including amortization of premium and accretion of discount on debt securities, as required, is recorded on the accrual basis. Expenses are recorded on an accrual basis, which may require the use of certain estimates by management that may differ from actual. Net investment income or loss (other than class specific expenses and waivers, which are allocated as noted below) and unrealized and realized gains (losses) are allocated daily to each class of shares based upon the relative proportion of adjusted net assets of each class at the beginning of the day.
Class specific expenses and waivers, where applicable, are charged to the respective share classes. Class specific expenses include distribution fees and distribution fee waivers, shareholder servicing fee, transfer agent’s fees and expenses, registration fees and fee waivers and/or expense reimbursements, as applicable.
Taxes: It is each Fund’s policy to continue to meet the requirements of the Internal Revenue Code applicable to regulated investment companies and to distribute all of its taxable net investment income and capital gains, if any, to its shareholders. Therefore, no federal income tax provision is required. Withholding taxes on foreign interest are recorded, net of reclaimable amounts, at the time the related income is earned.
Dividends and Distributions: The Institutional Money Market Fund and Ultra Short Bond Fund declare all of their net investment income and net realized short-term capital gains, if
any, as dividends daily to their shareholders of record at the time of such declaration and pay monthly to their shareholders of record at the time of such declaration. The Short-Term Bond Fund declares all of its net investment income as dividends daily and pays monthly to its shareholders of record at the time of such declaration. Distributions of net realized capital gains, if any, are made annually. Dividends and distributions to shareholders, which are determined in accordance with federal income tax regulations and which may differ from generally accepted accounting principles, are recorded on the ex-date. Permanent book/tax differences relating to income and gain (loss) are reclassified amongst undistributed (overdistributed) net investment income, accumulated net realized gain (loss) and paid-in capital in excess of par, as appropriate.
Estimates: The preparation of financial statements requires management to make estimates and assumptions that affect the reported amounts and disclosures in the financial statements. Actual results could differ from those estimates.
2. Agreements
Under a management agreement with the PIP 2, PGIM Investments manages each Fund’s investment operations and administers its business affairs. Pursuant to this agreement, PGIM Investments has responsibility for all investment management services and supervises the subadviser’s performance of such services. PGIM Investments has entered into subadvisory agreements with PGIM, Inc., which provides subadvisory services to the Funds through its PGIM Fixed Income unit. The subadvisory agreements provide that PGIM, Inc. will furnish investment advisory services in connection with the management of the Funds. In connection therewith, PGIM, Inc. is obligated to keep certain books and records of each Fund. For its services on the Ultra Short Bond Fund and Short Term Bond Fund, PGIM, Inc. is reimbursed by PGIM Investments for direct costs, excluding profit and overhead, incurred by PGIM, Inc. in furnishing services to PGIM Investments. PGIM Investments pays for the services of PGIM, Inc. on the Institutional Money Market Fund, the cost of compensation of officers of the Fund, occupancy and certain clerical and bookkeeping costs of the Fund. The Fund bears all other costs and expenses.
The Ultra Short Bond Fund and Short Term Bond Fund reimburse PGIM Investments for their costs and expenses incurred in managing each Fund’s investment operations and administering its business affairs. The costs are accrued daily and payable monthly. For the six months ended July 31, 2018, the costs were at an effective annual rate of .008% for the Ultra Short Bond Fund and 0.024% for the Short-Term Bond Fund. The management fee paid to PGIM Investments by the Institutional Money Market Fund was accrued daily and payable monthly at an annual rate of 0.15% of the average daily net assets.
PGIM Investments has contractually agreed through May 31, 2019 to limit the net annual operating expenses (exclusive of distribution and service (12b-1) fees, taxes (such as income and foreign withholdings taxes, stamp duty and deferred tax expenses), interest, underlying funds, brokerage, extraordinary and certain other expenses, such as dividend, broker charges and interest expense on short sales) of the Institutional Money Market Fund
Notes to Financial Statements (unaudited) (continued)
to 0.07% of the Fund’s average daily net assets. Expenses waived/reimbursed by the Manager in accordance with this agreement may be recouped by the Manager within the same fiscal year during which such waiver/reimbursement is made if such recoupment can be realized without exceeding the expense limit in effect at the time of the recoupment for that fiscal year. For the six months ended July 31, 2018, the effective management fee paid by the Institutional Money Market Fund was 0.06%.
PGIM Investments and PGIM, Inc. are indirect, wholly-owned subsidiaries of Prudential Financial, Inc. (“Prudential”).
3. Other Transactions with Affiliates
Prudential Mutual Fund Services LLC (“PMFS”), an affiliate of PGIM Investments and an indirect, wholly-owned subsidiary of Prudential, serves as the Fund’s transfer agent. Transfer agent’s fees and expenses in the Statement of Operations include certain out-of-pocket expenses paid to non-affiliates, where applicable.
The Funds may enter into certain securities purchase or sale transactions under Board approved Rule 17a-7 procedures. Rule 17a-7 is an exemptive rule under the 1940 Act, that permits purchase and sale transactions among affiliated investment companies, or between an investment company and a person that is affiliated solely by reason of having a common (or affiliated) investment adviser, common directors, and/or common officers. Such transactions are subject to ratification by the Board.
The Short-Term Bond Fund may invest its overnight sweep cash in the Ultra Short Bond Fund. Earnings from the Ultra Short Bond Fund are disclosed on the Statement of Operations as “Affiliated dividend income”.
4. Portfolio Securities
The cost of purchases and proceeds from sales of portfolio securities, other than short-term investments and U.S. Treasury securities for the six months ended July 31, 2018, were as follows:
| | | | | | | | |
| | | Cost of
Purchases | | | Proceeds
from Sales | |
Short-Term Bond Fund | | $ | 627,160,451 | | | $ | 424,232,612 | |
Ultra Short Bond Fund* | | | 1,413,395,000 | | | | 1,179,395,000 | |
| * | Although floating rate daily demand notes are shown as short-term investments in the Schedule of Investments due to frequent reset of coupon rates, they have long-term maturities and are included in these purchase and sale amounts, along with securities which had a maturity beyond one year of acquisition. For the six months ended July 31, 2018, the Fund purchases and sales transactions under Rule 17a-7, were $0 and $2,702,960, respectively. There were no realized gains (losses associated with these 17a-7 transactions during the reporting period |
For the six months ended July 31, 2018, Institutional Money Market Fund purchase and sale transactions under Rule 17a-7, were $0 and $2,002,171, respectively. There were no realized gains (losses) associated with these 17a-7 transactions during the reporting period.
A summary of the cost of purchases and proceeds from sales of shares of affiliated mutual funds for the six months ended July 31, 2018, is presented as follows:
Short-Term Bond Fund
| | | | | | | | | | | | | | | | |
Affiliated
Mutual Funds | | Value,
Beginning of Period | | Cost of
Purchases | | Proceeds
from Sales | | Change in
Unrealized
Gain
(Loss) | | Realized
Gain
(Loss) | | Value, End of
Period | | Shares,
End of Period | | Dividend
Income |
PGIM Core Ultra Short Bond Fund | | $43,031,606 | | $1,080,594,614 | | $1,015,629,000 | | $ — | | $ — | | $107,997,220 | | 107,997,220 | | $648,615 |
| | | | | | | | | | | | | | | | |
5. Tax Information
The United States federal income tax basis of the Funds’ investments and the net unrealized appreciation (depreciation) as of July 31, 2018 were as follows:
| | | | | | | | | | | | | | | | |
| | | Tax Basis | | | Gross
Unrealized
Appreciation | | | Gross
Unrealized
Depreciation | | | Net
Unrealized
Appreciation
(Depreciation) | |
| Short-Term Bond Fund | | | $ 2,981,308,066 | | | | $85,390,265 | | | | $(86,766,434) | | | | $(1,376,169 | ) |
| Ultra Short Bond Fund | | | 23,882,786,465 | | | | 2,551,200 | | | | (287,729) | | | | 2,263,471 | |
| Institutional Money Market Fund | | | 16,160,514,893 | | | | 2,346,587 | | | | (188,060) | | | | 2,158,527 | |
The book basis may differ from tax basis due to certain tax-related adjustments.
Under the Regulated Investment Company Modernization Act of 2010 (the “Act”), the Funds are permitted to carryforward capital losses realized on or after February 1, 2011 (“post-enactment losses”) for an unlimited period. Post-enactment losses are required to be utilized before the utilization of losses incurred prior to the effective date of the Act. As a result of this ordering rule, capital loss carryforwards related to taxable years ending before January 31, 2012 (“pre-enactment losses”) may have an increased likelihood to expire
Notes to Financial Statements (unaudited) (continued)
unused. Additionally, post-enactment capital losses that are carried forward will retain their character as either short-term or long-term capital losses rather than being considered all short-term as under previous law. No capital gains distributions are expected to be paid to shareholders until net gains have been realized in excess of such losses. As of January 31, 2018, the pre and post-enactment losses for Short-Term Bond Fund were approximately:
| | | | |
Post-Enactment Losses: | | $ | 17,664,000 | |
| | | | |
Pre-Enactment Losses: | | | | |
Expiring 2019 | | | 18,751,000 | |
| | | | |
Management has analyzed the Funds’ tax positions taken on federal, state and local income tax returns for all open tax years and has concluded that no provision for income tax is required in the Funds’ financial statements for the current reporting period. The Funds’ federal, state and local income and federal excise tax returns for tax years for which the applicable statutes of limitations have not expired are subject to examination by the Internal Revenue Service and state departments of revenue.
6. Capital and Ownership
Shares of the Ultra Short Bond Fund, the Short-Term Bond Fund and the Institutional Money Market Fund are available only to investment companies managed by PGIM Investments and, as applicable, certain investment advisory clients of PGIM, Inc. As of July 31, 2018, 100% of the shares outstanding were owned by such entities of which six shareholders held 52% of outstanding shares of the Ultra Short Bond Fund, three shareholders held 91% of outstanding shares of the Short-Term Bond Fund and four shareholders held 36% of outstanding shares of the Institutional Money Market Fund.
PIP 2 has authorized an unlimited number of shares of beneficial interest at $0.001 par value per share.
Transactions in shares of beneficial interest were as follows:
| | | | | | | | | | | | | | | | |
| | | Short-Term Bond Fund | | | Ultra Short Bond Fund | |
| | | Shares | | | Amount | | | Shares | | | Amount | |
Six months ended July 31, 2018: | | | | | | | | | | | | | | | | |
Shares sold | | | 9,816,613 | | | $ | 91,000,000 | | | | 78,893,497,746 | | | $ | 78,893,497,746 | |
Shares issued in reinvestment of dividends and distributions | | | 3,214,236 | | | | 29,795,973 | | | | 209,130,526 | | | | 209,130,526 | |
Shares reacquired | | | (29,590,076 | ) | | | (274,300,000 | ) | | | (78,199,734,404 | ) | | | (78,199,734,404 | ) |
| | | | | | | | | | | | | | | | |
Net increase (decrease) in shares outstanding | | | (16,559,227 | ) | | $ | (153,504,027 | ) | | | 902,893,868 | | | $ | 902,893,868 | |
| | | | | | | | | | | | | | | | |
Year ended January 31, 2018: | | | | | | | | | | | | | | | | |
Shares sold | | | 3,837,382 | | | $ | 35,707,576 | | | | 140,971,576,109 | | | $ | 140,971,576,110 | |
Shares issued in reinvestment of dividends and distributions | | | 7,399,751 | | | | 68,732,516 | | | | 273,122,231 | | | | 273,122,231 | |
Shares reacquired | | | (3,837,382 | ) | | | (35,707,576 | ) | | | (144,286,929,866 | ) | | | (144,286,929,866 | ) |
| | | | | | | | | | | | | | | | |
Net increase (decrease) in shares outstanding | | | 7,399,751 | | | $ | 69,732,516 | | | | (3,042,231,526 | ) | | $ | (3,042,231,525 | ) |
| | | | | | | | | | | | | | | | |
| | | |
| | | | | | | | | Institutional Money
Market Fund | |
| | | | | | | | | Shares | | | Amount | |
Six months ended July 31, 2018: | | | | | | | | | | | | | | | | |
Shares sold | | | | | | | | | | | 36,981,287,034 | | | $ | 36,982,543,163 | |
Shares issued in reinvestment of dividends and distributions | | | | | | | | | | | 139,105,600 | | | | 139,109,457 | |
Shares reacquired | | | | | | | | | | | (34,367,201,944 | ) | | | (34,368,454,383 | ) |
| | | | | | | | | | | | | | | | |
Net increase (decrease) in shares outstanding | | | | | | | | | | | 2,753,190,690 | | | $ | 2,753,198,237 | |
| | | | | | | | | | | | | | | | |
Year ended January 31, 2018: | | | | | | | | | | | | | | | | |
Shares sold | | | | | | | | | | | 69,711,122,719 | | | $ | 69,720,645,020 | |
Shares issued in reinvestment of dividends and distributions | | | | | | | | | | | 161,491,067 | | | | 161,510,624 | |
Shares reacquired | | | | | | | | | | | (70,093,366,208 | ) | | | (70,103,039,166 | ) |
| | | | | | | | | | | | | | | | |
Net increase (decrease) in shares outstanding | | | | | | | | | | | (220,752,422 | ) | | $ | (220,883,522 | ) |
| | | | | | | | | | | | | | | | |
7. Borrowings
PIP 2, on behalf of the Short-Term Bond Fund, along with other affiliated registered investment companies (the “Funds”), is a party to a Syndicated Credit Agreement (“SCA”) with a group of banks. The purpose of the SCA is to provide an alternative source of temporary funding for capital share redemptions. The SCA provides for a commitment of $900 million for the period October 5, 2017 through October 4, 2018. The Funds pay an annualized commitment fee of 0.15% of the unused portion of the SCA. The Fund’s portion of the commitment fee for the unused amount, allocated based upon a method approved by the Board, is accrued daily and paid quarterly. The interest on borrowings under the SCA is paid monthly and at a per annum interest rate based upon a contractual spread plus the higher of (1) the effective federal funds rate, (2) the 1-month LIBOR rate or (3) zero percent.
Other affiliated registered investment companies that are parties to the SCA include portfolios that are subject to a predetermined mathematical formula used to manage certain
Notes to Financial Statements (unaudited) (continued)
benefit guarantees offered under variable annuity contracts. The formula may result in large scale asset flows into and out of these portfolios. Consequently, these portfolios may be more likely to utilize the SCA for purposes of funding redemptions. It may be possible for those portfolios to fully exhaust the committed amount of the SCA, thereby requiring the Manager to allocate available funding per a Board-approved methodology designed to treat the Funds in the SCA equitably.
The Short-Term Bond Fund did not utilize the SCA during the period ended July 31, 2018.
8. Other Risks
The Fund’s risks include, but are not limited to, the risks discussed below:
Bond Obligations Risk: The Fund’s holdings, share price, yield and total return may fluctuate in response to bond market movements. The value of bonds may decline for issuer-related reasons, including management performance, financial leverage and reduced demand for the issuer’s goods and services. Certain types of fixed-income obligations also may be subject to “call and redemption risk,” which is the risk that the issuer may call a bond held by the Fund for redemption before it matures and the Fund may not be able to reinvest at the same level and therefore would earn less income.
Derivatives Risk: Derivatives involve special risks and costs and may result in losses to the Fund. The prices of derivatives may move in unexpected ways, especially in abnormal market conditions. Some derivatives are “leveraged” and therefore may magnify or otherwise increase investment losses to the Fund. The Fund’s use of derivatives may also increase the amount of taxes payable by shareholders. Other risks arise from the potential inability to terminate or close out of derivatives positions. A liquid secondary market may not always exist for the Fund’s derivatives positions. Generally, many OTC derivative instruments will not have liquidity beyond the counterparty to the instrument. OTC derivative instruments also involve the risk that the other party will not meet its obligations to the Fund.
Foreign Securities Risk: The Fund’s investments in securities of foreign issuers or issuers with significant exposure to foreign markets involve additional risk. Foreign countries in which the Fund may invest may have markets that are less liquid, less regulated and more volatile than US markets. The value of the Fund’s investments may decline because of factors affecting the particular issuer as well as foreign markets and issuers generally, such as unfavorable government actions, and political or financial instability.
Interest Rate Risk: The market price of the Fund’s investments will change in response to changes in interest rate and other factors. During periods of rising interest rates, the market price of fixed income instruments generally declines. As interest rates increase, slower than
expected principal payments may extend the average life of securities, potentially locking in below-market interest rates and reducing the Fund’s value. In typical market interest rate environments, the prices of long-term debt obligations generally fluctuate more than prices of short-term debt obligations as interest rates change. Fluctuations in the market price of the Fund’s instruments will not affect interest income derived from the instruments already owned by the Fund, but will be reflected in the Fund’s NAV.
Liquidity Risk: The Funds may invest in instruments that trade in lower volumes and are less liquid than other investments. Liquidity risk includes the risk that the Fund may make investments that may become less liquid in response to market developments or adverse investor perceptions. Investments that are illiquid or that trade in lower volumes may be more difficult to value. When there is no willing buyer and investments cannot be readily sold at the desired time or price, the Fund may have to accept a lower price or may not be able to sell the instrument at all. An inability to sell a portfolio position can adversely affect the Fund’s value or prevent the Fund from being able to take advantage of other investment opportunities.
Market and Credit Risk: Securities markets may be volatile and the market prices of the Fund’s securities may decline. Securities fluctuate in price based on changes in an issuer’s financial condition and overall market and economic conditions. If the market prices of the securities owned by the Fund fall, the value of an investment in the Fund will decline. Additionally, the Fund may also be exposed to credit risk in the event that an issuer or guarantor fails to perform or that an institution or entity with which the Fund has unsettled or open transactions defaults.
PGIM Core Short-Term Bond Fund
Financial Highlights (unaudited)
| | | | | | | | | | | | | | | | | | | | | | | | | | | | |
| | | Six Months
Ended
July 31,
2018(a) | | | | | | Year Ended January 31, | |
| | | | | | 2018(a) | | | 2017(a) | | | 2016(a) | | | 2015 | | | 2014 | |
| Per Share Operating Performance: | | | | | | | | | | | | | | | | | | | | | | | | | | | | |
| Net Asset Value, Beginning of Period | | | $9.28 | | | | | | | | $9.27 | | | | $9.28 | | | | $9.33 | | | | $9.33 | | | | $9.30 | |
| Income (loss) from investment operations: | | | | | | | | | | | | | | | | | | | | | | | | | | | | |
| Net investment income (loss) | | | 0.12 | | | | | | | | 0.19 | | | | 0.14 | | | | 0.13 | | | | 0.16 | | | | 0.19 | |
| Net realized and unrealized gain (loss) on investment transactions | | | (0.01 | ) | | | | | | | 0.03 | | | | 0.02 | | | | (0.03 | ) | | | (0.04 | ) | | | (0.03 | ) |
| Total from investment operations | | | 0.11 | | | | | | | | 0.22 | | | | 0.16 | | | | 0.10 | | | | 0.12 | | | | 0.16 | |
| Less Dividends: | | | | | | | | | | | | | | | | | | | | | | | | | | | | |
| Dividends from net investment income | | | (0.12 | ) | | | | | | | (0.21 | ) | | | (0.17 | ) | | | (0.15 | ) | | | (0.12 | ) | | | (0.13 | ) |
| Net Asset Value, end of period | | | $9.27 | | | | | | | | $9.28 | | | | $9.27 | | | | $9.28 | | | | $9.33 | | | | $9.33 | |
| Total Return(b): | | | 1.16% | | | | | | | | 2.36% | | | | 1.78% | | | | 1.04% | | | | 1.28% | | | | 1.72% | |
| |
| Ratios/Supplemental Data: | | | | | | | |
| Net assets, end of period (000) | | | $2,963,022 | | | | | | | | $3,119,050 | | | | $3,050,290 | | | | $2,994,467 | | | | $3,652,005 | | | | $3,687,839 | |
| Average net assets (000) | | | $3,050,490 | | | | | | | | $3,082,883 | | | | $3,021,138 | | | | $3,403,519 | | | | $3,649,937 | | | | $3,680,946 | |
| Ratios to average net assets(c): | | | | | | | | | | | | | | | | | | | | | | | | | | | | |
| Expenses after waivers and/or expense reimbursement | | | 0.03% | (d) | | | | | | | 0.03% | | | | 0.03% | | | | 0.03% | | | | 0.03% | | | | 0.03% | |
| Expenses before waivers and/or expense reimbursement | | | 0.03% | (d) | | | | | | | 0.03% | | | | 0.03% | | | | 0.03% | | | | 0.03% | | | | 0.03% | |
| Net investment income (loss) | | | 2.63% | (d) | | | | | | | 2.04% | | | | 1.50% | | | | 1.34% | | | | 1.71% | | | | 2.00% | |
| Portfolio turnover rate(e) | | | 20% | (f) | | | | | | | 53% | | | | 29% | | | | 25% | | | | 34% | | | | 52% | |
| (a) | Calculated based on average shares outstanding during the period. |
| (b) | Total return is calculated assuming a purchase of a share on the first day and a sale on the last day of each period reported and includes reinvestment of dividends and distributions, if any. Total returns may reflect adjustments to conform to generally accepted accounting principles. Total returns for periods less than one full year are not annualized. |
| (c) | Does not include expenses of the underlying funds in which the Fund invests. |
| (e) | The Fund’s portfolio turnover rate is calculated in accordance with regulatory requirements, without regard to transactions involving short term investments and certain derivatives. If such transactions were included, the Fund’s portfolio turnover rate may be higher. |
See Notes to Financial Statements.
PGIM Core Ultra Short Bond Fund
Financial Highlights (unaudited)
| | | | | | | | | | | | | | | | | | | | | | | | | | | | |
| | | Six Months
Ended
July 31,
2018(a) | | | | | | Year Ended January 31, | |
| | | | | | 2018(a) | | | 2017(a) | | | 2016(a) | | | 2015 | | | 2014 | |
| Per Share Operating Performance: | | | | | | | | | | | | | | | | | | | | | | | | | | | | |
| Net Asset Value, Beginning of Period | | | $1.00 | | | | | | | | $1.00 | | | | $1.00 | | | | $1.00 | | | | $1.00 | | | | $1.00 | |
| Income (loss) from investment operations: | | | | | | | | | | | | | | | | | | | | | | | | | | | | |
| Net investment income (loss) | | | 0.01 | | | | | | | | 0.01 | | | | 0.01 | | | | - | (b) | | | - | (b) | | | - | (b) |
| Net realized and unrealized gain (loss) on investment transactions | | | - | (b) | | | | | | | - | (b) | | | - | (b) | | | - | | | | - | | | | - | |
| Total from investment operations | | | 0.01 | | | | | | | | 0.01 | | | | 0.01 | | | | - | | | | - | | | | - | |
| Dividends and distributions to shareholders | | | (0.01 | ) | | | | | | | (0.01 | ) | | | (0.01 | ) | | | - | (b) | | | - | (b) | | | - | (b) |
| Net Asset Value, end of period | | | $1.00 | | | | | | | | $1.00 | | | | $1.00 | | | | $1.00 | | | | $1.00 | | | | $1.00 | |
| Total Return(c): | | | 0.96% | | | | | | | | 1.18% | | | | 0.63% | | | | 0.21% | | | | 0.15% | | | | 0.15% | |
| |
| Ratios/Supplemental Data: | | | | | | | | | | |
| Net assets, end of period (000) | | | $23,414,937 | | | | | | | | $22,510,708 | | | | $25,556,796 | | | | $41,757,809 | | | | $43,585,206 | | | | $38,389,097 | |
| Average net assets (000) | | | $21,938,021 | | | | | | | | $23,440,098 | | | | $30,480,402 | | | | $41,343,564 | | | | $40,003,023 | | | | $37,135,455 | |
| Ratios to average net assets: | | | | | | | | | | | | | | | | | | | | | | | | | | | | |
| Expenses after waivers and/or expense reimbursement | | | 0.01% | (d) | | | | | | | 0.01% | | | | 0.01% | | | | 0.01% | | | | 0.01% | | | | 0.01% | |
| Expenses before waivers and/or expense reimbursement | | | 0.01% | (d) | | | | | | | 0.01% | | | | 0.01% | | | | 0.01% | | | | 0.01% | | | | 0.01% | |
| Net investment income (loss) | | | 1.93% | (d) | | | | | | | 1.17% | | | | 0.60% | | | | 0.21% | | | | 0.15% | | | | 0.15% | |
| Portfolio turnover rate(e)(f) | | | 84% | (g) | | | | | | | 111% | | | | 46% | | | | - | | | | - | | | | - | |
| (a) | Calculated based on average shares outstanding during the period. |
| (b) | Less than $0.005 per share. |
| (c) | Total return is calculated assuming a purchase of a share on the first day and a sale on the last day of each period reported and includes reinvestment of dividends and distributions, if any. Total returns may reflect adjustments to conform to generally accepted accounting principles. Total returns for periods less than one full year are not annualized. |
| (e) | The Fund’s portfolio turnover rate is calculated in accordance with regulatory requirements, without regard to transactions involving short term investments and certain derivatives. If such transactions were included, the Fund’s portfolio turnover rate may be higher. |
See Notes to Financial Statements.
| | | | |
| Prudential Investment Portfolios 2/PGIM Core Ultra Short Bond Fund | | | 79 | |
PGIM Core Ultra Short Bond Fund
Financial Highlights (unaudited) (continued)
| (f) | The portfolio turnover rate calculation is for the six months ended July 31, 2018, the year ended January 31, 2018 and the period March 30, 2016 through January 31, 2017, respectively, and includes floating rate daily demand notes. Prior to March 30, 2016, the Fund was classified as a money market under Rule 2a-7 of the Investment Company Act of 1940 and disclosure of the Fund’s portfolio turnover was not applicable. |
See Notes to Financial Statements.
PGIM Institutional Money Market Fund
Financial Highlights (unaudited)
| | | | | | | | | | | | | | | | | | | | |
| | | Six Months
Ended July 31, 2018 | | | | | | Year Ended January 31, 2018 | | | | | | July 19, 2016(a)
through January 31,
2017 | |
| Per Share Operating Performance(b): | | | | | | | | | | | | | | | | | | | | |
| Net Asset Value, Beginning of Period | | | $1.0001 | | | | | | | | $1.0002 | | | | | | | | $1.0000 | |
| Income (loss) from investment operations: | | | | | | | | | | | | | | | | | | | | |
| Net investment income (loss) | | | 0.0095 | | | | | | | | 0.0114 | | | | | | | | 0.0031 | |
| Net realized and unrealized gain (loss) on investment and foreign currency transactions | | | - | (c) | | | | | | | (0.0001 | ) | | | | | | | 0.0002 | |
| Total from investment operations | | | 0.0095 | | | | | | | | 0.0113 | | | | | | | | 0.0033 | |
| Less Dividends: | | | | | | | | | | | | | | | | | | | | |
| Dividends from net investment income | | | (0.0095 | ) | | | | | | | (0.0114 | ) | | | | | | | (0.0031 | ) |
| Net Asset Value, end of period | | | $1.0001 | | | | | | | | $1.0001 | | | | | | | | $1.0002 | |
| Total Return(d): | | | 0.95% | | | | | | | | 1.14% | | | | | | | | 0.35% | |
| |
| Ratios/Supplemental Data: | | | | | | | | | | | | | | | |
| Net assets, end of period (000) | | | $15,970,158 | | | | | | | | $13,215,520 | | | | | | | | $13,438,067 | |
| Average net assets (000) | | | $14,594,360 | | | | | | | | $14,177,712 | | | | | | | | $12,592,981 | |
| Ratios to average net assets(e): | | | | | | | | | | | | | | | | | | | | |
| Expenses after waivers and/or expense reimbursement | | | 0.07% | (f) | | | | | | | 0.07% | | | | | | | | 0.07% | (f) |
| Expenses before waivers and/or expense reimbursement | | | 0.16% | (f) | | | | | | | 0.16% | | | | | | | | 0.16% | (f) |
| Net investment income (loss) | | | 1.92% | (f) | | | | | | | 1.14% | | | | | | | | 0.61% | (f) |
| (a) | Commencement of operations. |
| (b) | Calculated based on average shares outstanding during the period. |
| (c) | Less than $0.005 per share. |
| (d) | Total return is calculated assuming a purchase of a share on the first day and a sale on the last day of each period reported and includes reinvestment of dividends and distributions, if any. Total returns may reflect adjustments to conform to generally accepted accounting principles. Total returns for periods less than one full year are not annualized. |
| (e) | Does not include expenses of the underlying funds in which the Fund invests. |
See Notes to Financial Statements.
| | | | |
| Prudential Investment Portfolios 2/PGIM Institutional Money Market Fund | | | 81 | |
Approval of Advisory Agreements (unaudited)
PGIM Core Ultra-Short Bond Fund
(formerly, Prudential Core Ultra-Short Bond Fund)
PGIM Core Short-Term Bond Fund
(formerly, Prudential Core Short-Term Bond Fund)
The Board of Trustees
The Board of Trustees (the “Board”) of PGIM Core Short-Term Bond Fund and PGIM Core Ultra-Short Bond Fund1 (each, a “Fund,” and collectively, the “Funds”) consists of twelve individuals, nine of whom are not “interested persons” of the Funds, as defined in the Investment Company Act of 1940, as amended (the “1940 Act”) (the “Independent Trustees”). The Board is responsible for the oversight of the Funds and their operations, and performs the various duties imposed on the directors of investment companies by the 1940 Act. The Independent Trustees have retained independent legal counsel to assist them in connection with their duties. The Chair of the Board is an Independent Trustee. The Board has established four standing committees: the Audit Committee, the Nominating and Governance Committee, and two Investment Committees. Each committee is chaired by, and composed of, Independent Trustees.
Annual Approval of the Funds’ Advisory Agreements
As required under the 1940 Act, the Board determines annually whether to renew each Fund’s management agreement with PGIM Investments LLC (“PGIM Investments”) and each Fund’s subadvisory agreement with PGIM, Inc. (“PGIM”) on behalf of its PGIM Fixed Income unit. In considering the renewal of the agreements, the Board, including all of the Independent Trustees, met on June 7, 2018 and on June 19-21, 2018 and approved the renewal of the agreements through July 31, 2019, after concluding that the renewal of the agreements was in the best interests of each Fund and its shareholders.
In advance of the meeting, the Board requested and received materials relating to the agreements, and had the opportunity to ask questions and request further information in connection with their consideration. Among other things, the Board considered comparative fee information from PGIM Investments and PGIM. Also, the Board considered comparisons with other mutual funds in relevant Peer Universes and Peer Groups, as is further discussed below.
In approving the agreements, the Board, including the Independent Trustees advised by independent legal counsel, considered the factors it deemed relevant, including the nature, quality and extent of services provided by PGIM Investments and the subadviser, the
| 1 | PGIM Core Short-Term Bond Fund and PGIM Ultra-Short Bond Fund are both series of Prudential Investment Portfolios 2. |
| | |
| Prudential Investment Portfolios 2 |
Approval of Advisory Agreements (continued)
performance of each Fund, the profitability of PGIM Investments and its affiliates, expenses and fees, and the potential for economies of scale that may be shared with each Fund and its shareholders as each Fund’s assets grow. In their deliberations, the Trustees did not identify any single factor which alone was responsible for the Board’s decision to approve the agreements with respect to the Funds. In connection with its deliberations, the Board considered information provided by PGIM Investments throughout the year at regular Board meetings, presentations from portfolio managers and other information, as well as information furnished at or in advance of the meetings on June 7, 2018 and on June 19-21, 2018.
The Trustees determined that the overall arrangements between the Funds and PGIM Investments, which serves as the Funds’ investment manager pursuant to a management agreement, and between PGIM Investments and PGIM, which, through its PGIM Fixed Income unit, serves as each Fund’s subadviser pursuant to the terms of a subadvisory agreement with PGIM Investments, are in the best interests of each Fund and its shareholders in light of the services performed, fees charged and such other matters as the Trustees considered relevant in the exercise of their business judgment.
The material factors and conclusions that formed the basis for the Trustees’ reaching their determinations to approve the continuance of the agreements are separately discussed below.
Nature, Quality and Extent of Services
The Board received and considered information regarding the nature, quality and extent of services provided to each Fund by PGIM Investments and PGIM Fixed Income. The Board considered the services provided by PGIM Investments, including but not limited to the oversight of the subadviser for the Funds, as well as the provision of fund recordkeeping, compliance, and other services to each Fund. With respect to PGIM Investments’ oversight of the subadviser, the Board noted that PGIM Investments’ Strategic Investment Research Group (“SIRG”), which is a business unit of PGIM Investments, is responsible for monitoring and reporting to PGIM Investments’ senior management on the performance and operations of the subadviser. The Board also considered that PGIM Investments pays the salaries of all of the officers and interested Trustees of the Funds who are part of Fund management. The Board also considered the investment subadvisory services provided by PGIM Fixed Income, which it noted had been selected by PGIM Investments, including investment research and security selection, as well as adherence to the Funds’ investment restrictions and compliance with applicable Fund policies and procedures. The Board considered PGIM Investments’ evaluation of the subadviser, as well as PGIM Investments’ recommendation, based on its review of the subadviser, to renew the subadvisory agreements.
The Board considered the qualifications, backgrounds and responsibilities of PGIM Investments’ senior management responsible for the oversight of each Fund and PGIM
| | |
| Visit our website at pgiminvestments.com | | |
Fixed Income, and also considered the qualifications, backgrounds and responsibilities of PGIM Fixed Income’s portfolio managers who are responsible for the day-to-day management of each Fund’s portfolio. The Board was provided with information pertaining to PGIM Investments’ and PGIM Fixed Income’s organizational structure, senior management, investment operations, and other relevant information pertaining to both PGIM Investments and PGIM Fixed Income. The Board also noted that it received favorable compliance reports from the Trust’s Chief Compliance Officer (“CCO”) as to both PGIM Investments and PGIM Fixed Income. The Board noted that PGIM Fixed Income is affiliated with PGIM Investments.
The Board concluded that it was satisfied with the nature, extent and quality of the investment management services provided by PGIM Investments and the subadvisory services provided to the Funds by PGIM Fixed Income, and that there was a reasonable basis on which to conclude that each Fund benefits from the services provided by PGIM Investments and PGIM Fixed Income under the management and subadvisory agreements.
Costs of Services and Profits Realized by PGIM Investments
The Board was provided with information on the profitability of PGIM Investments and its affiliates in serving as the Funds’ investment manager. The Board discussed with PGIM Investments the methodology utilized in assembling the information regarding profitability and considered its reasonableness. The Board recognized that it is difficult to make comparisons of profitability from fund management contracts because comparative information is not generally publicly available and is affected by numerous factors, including the structure of the particular adviser, the types of funds it manages, its business mix, numerous assumptions regarding allocations and the adviser’s capital structure and cost of capital. However, the Board considered that the cost of services provided by PGIM Investments to each Fund during the year ended December 31, 2017 exceeded the benefits gained by PGIM Investments, resulting in an operating loss to PGIM Investments. Taking these factors into account, the Board concluded that the profitability of PGIM Investments and its affiliates in relation to the services rendered was not unreasonable.
Economies of Scale
The Board noted that the Funds do not have a traditional management structure, because they are operated at cost. Accordingly, the Board determined that the Funds, which have low expenses, benefit directly from any cost savings experienced by PGIM Investments.
Other Benefits to PGIM Investments and PGIM Fixed Income
The Board considered potential ancillary benefits that might be received by PGIM Investments, PGIM Fixed Income and their affiliates as a result of their relationship with the
| | |
| Prudential Investment Portfolios 2 |
Approval of Advisory Agreements (continued)
Funds. The Board concluded that potential benefits to be derived by PGIM Investments included transfer agency fees received by the Funds’ transfer agent (which is affiliated with PGIM Investments), and benefits to its reputation as well as other intangible benefits resulting from PGIM Investments’ association with the Funds. The Board concluded that the potential benefits to be derived by PGIM Fixed Income included its ability to use soft dollar credits, as well as the potential benefits consistent with those generally resulting from an increase in assets under management, specifically, potential access to additional research resources and benefits to its reputation. The Board concluded that the benefits derived by PGIM Investments and PGIM Fixed Income were consistent with the types of benefits generally derived by investment managers and subadvisers to mutual funds.
Performance of the Funds / Fees and Expenses
The Board considered certain additional specific factors and made related conclusions relating to the historical performance of the Funds for the one-, three-, five-, and ten-year periods ended December 31, 2017. With respect to the fees and expenses of each Fund, because each Fund is operated at cost, the Board did not consider fees and expenses as a meaningful factor in its deliberations.
The mutual funds included in each Fund’s Peer Universe, which was used to consider performance, and the Peer Group, which was used to consider expenses and fees, were objectively determined by Broadridge, an independent provider of mutual fund data. In certain circumstances, PGIM Investments also may have provided supplemental Peer Universe or Peer Group information, for reasons addressed with the Board. The comparisons placed each Fund in various quartiles, with the first quartile being the best 25% of the mutual funds (for performance, the best performing mutual funds and, for expenses, the lowest cost mutual funds).
The section below summarizes key factors considered by the Board and the Board’s conclusions regarding each Fund’s performance. The table sets forth gross performance comparisons (which do not reflect the impact on performance of fund expenses, or any subsidies, expense caps or waivers that may be applicable) with the Peer Universe, actual management fees with the Peer Group (which reflect the impact of any subsidies or fee waivers), and net total expenses with the Peer Group, each of which were key factors considered by the Board.
| | |
| Visit our website at pgiminvestments.com | | |
| | | | | | | | |
PGIM Core Ultra-
Short Bond Fund | | 1 Year | | 3 Years | | 5 Years | | 10 Years |
| | 4th Quartile | | 3rd Quartile | | 4th Quartile | | 4th Quartile |
| Actual Management Fees: 1st Quartile |
| Net Total Expenses: 1st Quartile |
| | • | | The Board noted that the Fund underperformed its benchmark index over all periods. |
| | • | | The Board also noted, however, that the Fund’s net performance (which reflects the impact of Fund fees and subsidies) in relation to the Peer Universe was in the first quartile over all periods. |
| | • | | The Board further considered PGIM Investments’ assertion that the Fund’s performance relative to its peers was of limited relevance, because the Fund invested more conservatively than peer funds, which was appropriate in light of the fact that the Fund served as a cash sweep vehicle for the other funds in the PGIM fund complex. |
| | • | | The Board concluded that, in light of the above, it would be in the best interests of the Fund and its shareholders to renew the agreements. |
| | • | | The Board concluded that the management fees (including subadvisory fees) and total expenses were reasonable in light of the services provided. |
| | | | | | | | |
PGIM Core Short-
Term Bond Fund | | 1 Year | | 3 Years | | 5 Years | | 10 Years |
| | 1st Quartile | | 2nd Quartile | | 1st Quartile | | 3rd Quartile |
| Actual Management Fees: 1st Quartile |
| Net Total Expenses: 1st Quartile |
| | • | | The Board noted that the Fund outperformed its benchmark index over all periods. |
| | • | | The Board concluded that, in light of the above, it would be in the best interests of the Fund and its shareholders to renew the agreements. |
| | • | | The Board concluded that the management fees (including subadvisory fees) and total expenses were reasonable in light of the services provided. |
* * *
After full consideration of these factors, the Board concluded that the approval of the agreements was in the best interests of each Fund and its shareholders.
| | |
| Prudential Investment Portfolios 2 |
Approval of Advisory Agreements (unaudited)
PGIM Institutional Money Market Fund
(formerly, Prudential Institutional Money Market Fund)
The Fund’s Board of Trustees
The Board of Trustees (the “Board”) of PGIM Institutional Money Market Fund. (the “Fund”)1 consists of twelve individuals, nine of whom are not “interested persons” of the Fund, as defined in the Investment Company Act of 1940, as amended (the “1940 Act”) (the “Independent Trustees”). The Board is responsible for the oversight of the Fund and its operations, and performs the various duties imposed on the directors of investment companies by the 1940 Act. The Independent Trustees have retained independent legal counsel to assist them in connection with their duties. The Chair of the Board is an Independent Trustee. The Board has established four standing committees: the Audit Committee, the Nominating and Governance Committee, and two Investment Committees. Each committee is chaired by, and composed of, Independent Trustees.
Annual Approval of the Fund’s Advisory Agreements
As required under the 1940 Act, the Board determines annually whether to renew the Fund’s management agreement with PGIM Investments LLC (“PGIM Investments”) and the Fund’s subadvisory agreement with PGIM, Inc. (“PGIM”) on behalf of its PGIM Fixed Income unit. In considering the renewal of the agreements, the Board, including all of the Independent Trustees, met on June 7, 2018 and on June 19-21, 2018 and approved the renewal of the agreements through July 31, 2019, after concluding that the renewal of the agreements was in the best interests of the Fund and its shareholders.
In advance of the meetings, the Board requested and received materials relating to the agreements, and had the opportunity to ask questions and request further information in connection with its consideration. Among other things, the Board considered comparative fee information from PGIM Investments and PGIM. Also, the Board considered comparisons with other mutual funds in relevant Peer Universes and Peer Groups, as is further discussed below.
In approving the agreements, the Board, including the Independent Trustees advised by independent legal counsel, considered the factors it deemed relevant, including the nature, quality and extent of services provided by PGIM Investments and the subadviser, the performance of the Fund, the profitability of PGIM Investments and its affiliates, expenses and fees, and the potential for economies of scale that may be shared with the Fund and its shareholders as the Fund’s assets grow. In their deliberations, the Trustees did not identify
| 1 | PGIM Institutional Money Market Fund is a series of Prudential Investment Portfolios 2. |
| | |
| Visit our website at pgiminvestments.com | | |
any single factor which alone was responsible for the Board’s decision to approve the agreements with respect to the Fund. In connection with its deliberations, the Board considered information provided by PGIM Investments throughout the year at regular Board meetings, presentations from portfolio managers and other information, as well as information furnished at or in advance of the meetings on June 7, 2018 and on June 19-21, 2018.
The Trustees determined that the overall arrangements between the Fund and PGIM Investments, which serves as the Fund’s investment manager pursuant to a management agreement, and between PGIM Investments and PGIM, which, through its PGIM Fixed Income unit, serves as the Fund’s subadviser pursuant to the terms of a subadvisory agreement with PGIM Investments, are in the best interests of the Fund and its shareholders in light of the services performed, fees charged and such other matters as the Trustees considered relevant in the exercise of their business judgment.
The material factors and conclusions that formed the basis for the Trustees’ reaching their determinations to approve the continuance of the agreements are separately discussed below.
Nature, Quality and Extent of Services
The Board received and considered information regarding the nature, quality and extent of services provided to the Fund by PGIM Investments and PGIM Fixed Income. The Board considered the services provided by PGIM Investments, including but not limited to the oversight of the subadviser for the Fund, as well as the provision of fund recordkeeping, compliance, and other services to the Fund. With respect to PGIM Investments’ oversight of the subadviser, the Board noted that PGIM Investments’ Strategic Investment Research Group (“SIRG”), which is a business unit of PGIM Investments, is responsible for monitoring and reporting to PGIM Investments’ senior management on the performance and operations of the subadviser. The Board also considered that PGIM Investments pays the salaries of all of the officers and interested Trustees of the Fund who are part of Fund management. The Board also considered the investment subadvisory services provided by PGIM Fixed Income, including investment research and security selection, as well as adherence to the Fund’s investment restrictions and compliance with applicable Fund policies and procedures. The Board considered PGIM Investments’ evaluation of the subadviser,as well as PGIM Investments’ recommendation, based on its review of the subadviser, to renew the subadvisory agreement.
The Board considered the qualifications, backgrounds and responsibilities of PGIM Investments’ senior management responsible for the oversight of the Fund and PGIM Fixed Income, and also considered the qualifications, backgrounds and responsibilities of PGIM Fixed Income’s portfolio managers who are responsible for the day-to-day management of
| | |
| Prudential Investment Portfolios 2 |
Approval of Advisory Agreements (continued)
the Fund’s portfolio. The Board was provided with information pertaining to PGIM Investments’ and PGIM Fixed Income’s organizational structure, senior management, investment operations, and other relevant information pertaining to both PGIM Investments and PGIM Fixed Income. The Board also noted that it received favorable compliance reports from the Fund’s Chief Compliance Officer (“CCO”) as to both PGIM Investments and PGIM Fixed Income. The Board noted that PGIM Fixed Income is affiliated with PGIM Investments.
The Board concluded that it was satisfied with the nature, extent and quality of the investment management services provided by PGIM Investments and the subadvisory services provided to the Fund by PGIM Fixed Income, and that there was a reasonable basis on which to conclude that the Fund benefits from the services provided by PGIM Investments and PGIM Fixed Income under the management and subadvisory agreements.
Costs of Services and Profits Realized by PGIM Investments
The Board was provided with information on the profitability of PGIM Investments and its affiliates in serving as the Fund’s investment manager. The Board discussed with PGIM Investments the methodology utilized in assembling the information regarding profitability and considered its reasonableness. The Board recognized that it is difficult to make comparisons of profitability from fund management contracts because comparative information is not generally publicly available and is affected by numerous factors, including the structure of the particular adviser, the types of funds it manages, its business mix, numerous assumptions regarding allocations and the adviser’s capital structure and cost of capital. Taking these factors into account, the Board concluded that the profitability of PGIM Investments and its affiliates in relation to the services rendered was not unreasonable.
Economies of Scale
The Board received and discussed information concerning economies of scale that PGIM Investments may realize as the Fund’s assets grow beyond current levels. During the course of time, the Board has considered information regarding the launch date of the Fund, the management fees of the Fund compared to those of similarly managed funds and PGIM Investments’ investment in the Fund over time. The Board noted that, while the Fund does not have breakpoints in its management fees, economies of scale can be shared with the Fund in other ways, including low management fees from inception, additional technological and personnel investments to enhance shareholder services, and maintaining existing expense structures in the face of a rising cost environment. The Board also considered PGIM Investments’ assertion that it continually evaluates the management fee schedule of the Fund and the potential to share economies of scale through breakpoints or fee waivers as asset levels increase.
| | |
| Visit our website at pgiminvestments.com | | |
The Board recognized the inherent limitations of any analysis of economies of scale, stemming largely from the Board’s understanding that most of PGIM Investments’ costs are not specific to individual funds, but rather are incurred across a variety of products and services.
Other Benefits to PGIM Investments and PGIM Fixed Income
The Board considered potential ancillary benefits that might be received by PGIM Investments, PGIM Fixed Income and their affiliates as a result of their relationship with the Fund. The Board concluded that potential benefits to be derived by PGIM Investments included transfer agency fees received by the Fund’s transfer agent (which is affiliated with PGIM Investments), as well as benefits to its reputation or other intangible benefits resulting from PGIM Investments’ association with the Fund. The Board concluded that the potential benefits to be derived by PGIM Fixed Income included those generally resulting from an increase in assets under management, specifically, potential access to additional research resources and benefits to its reputation. The Board concluded that the benefits derived by PGIM Investments and PGIM Fixed Income were consistent with the types of benefits generally derived by investment managers and subadvisers to mutual funds.
Performance of the Fund / Fees and Expenses
The Board considered certain additional specific factors and made related conclusions relating to the historical performance of the Fund for the one-year period ended December 31, 2017. The Board considered that the Fund commenced operations on July 19, 2016 and that longer-term performance was not yet available.
The Board also considered the Fund’s actual management fee, as well as the Fund’s net total expense ratio, for the fiscal period ended July 31, 2017. The Board considered the management fee for the Fund as compared to the management fee charged by PGIM Investments to other funds and the fee charged by other advisers to comparable mutual funds in a Peer Group. The actual management fee represents the fee rate actually paid by Fund shareholders and includes any fee waivers or reimbursements. The net total expense ratio for the Fund represents the actual expense ratio incurred by Fund shareholders.
The mutual funds included in the Peer Universe, which was used to consider performance, and the Peer Group, which was used to consider expenses and fees, were objectively determined by Broadridge, an independent provider of mutual fund data. In certain circumstances, PGIM Investments also may have provided supplemental Peer Universe or Peer Group information, for reasons addressed with the Board. The comparisons placed the Fund in various quartiles, with the first quartile being the best 25% of the mutual funds (for performance, the best performing mutual funds and, for expenses, the lowest cost mutual funds).
| | |
| Prudential Investment Portfolios 2 |
Approval of Advisory Agreements (continued)
The section below summarizes key factors considered by the Board and the Board’s conclusions regarding the Fund’s performance, fees and overall expenses. The table sets forth gross performance comparisons (which do not reflect the impact on performance of fund expenses, or any subsidies, expense caps or waivers that may be applicable) with the Peer Universe, actual management fees with the Peer Group (which reflect the impact of any subsidies or fee waivers), and net total expenses with the Peer Group, each of which were key factors considered by the Board.
| | | | | | | | |
Gross
Performance | | 1 Year | | 3 Years | | 5 Years | | 10 Years |
| | | 4th Quartile | | N/A | | N/A | | N/A |
| Actual Management Fees: 1st Quartile |
| Net Total Expenses: 1st Quartile |
| | • | | The Board noted that the Fund underperformed its Peer Universe median over the one-year period. |
| | • | | The Board noted that the Fund does not yet have a three-year performance record and that, therefore, the subadviser should have more time to develop that record. |
| | • | | The Board and PGIM Investments agreed to retain the Fund’s existing contractual expense cap, which (exclusive of certain fees and expenses), caps the Fund’s total annual operating expenses at 0.07% through May 31, 2019. |
| | • | | The Board concluded that in light of the above, it would be in the best interests of the Fund and its shareholders to continue to allow the Fund to create a performance record, and to renew the agreements. |
| | • | | The Board concluded that the management fees (including subadvisory fees) and total expenses were reasonable in light of the services provided. |
* * *
After full consideration of these factors, the Board concluded that approval of the agreements was in the best interests of the Fund and its shareholders.
| | |
| Visit our website at pgiminvestments.com | | |
| | | | |
| ∎ MAIL | | ∎ TELEPHONE | | ∎ WEBSITE |
655 Broad Street Newark, NJ 07102 | | (800) 225-1852 | | www.pgiminvestments.com |
|
| PROXY VOTING |
| The Board of Trustees of the Funds have delegated to the Funds’ investment subadviser the responsibility for voting any proxies and maintaining proxy recordkeeping with respect to the Funds. A description of these proxy voting policies and procedures is available without charge, upon request, by calling (800) 225-1852 or by visiting the Securities and Exchange Commission’s website at www.sec.gov. Information regarding how the Funds voted proxies relating to portfolio securities during the most recent 12-month period ended June 30 are available on the Funds’ website and on the Securities and Exchange Commission’s website at www.sec.gov. |
|
| TRUSTEES |
| Ellen S. Alberding • Kevin J. Bannon • Scott E. Benjamin • Linda W. Bynoe • Barry H. Evans • Keith F. Hartstein • Laurie Simon Hodrick • Michael S. Hyland • Stuart S. Parker • Richard A. Redeker • Brian K. Reid • Grace C. Torres |
|
| OFFICERS |
| Stuart S. Parker, President • Scott E. Benjamin, Vice President • Brian D. Nee, Treasurer and • Raymond A. O’Hara, Chief Legal Officer • Deborah A. Docs, Secretary • Chad A. Earnst, Chief Compliance Officer • Dino Capasso, Vice President and Deputy Chief Compliance Officer • Charles H. Smith, Anti-Money Laundering Compliance Officer • Jonathan D. Shain, Assistant Secretary • Claudia DiGiacomo, Assistant Secretary • Andrew R. French, Assistant Secretary • Peter Parrella, Assistant Treasurer • Lana Lomuti, Assistant Treasurer • Linda McMullin, Assistant Treasurer • Kelly A. Coyne, Assistant Treasurer |
| | | | |
| MANAGER | | PGIM Investments LLC | | 655 Broad Street
Newark, NJ 07102 |
|
| INVESTMENT SUBADVISER | | PGIM Fixed Income | | 655 Broad Street
Newark, NJ 07102 |
|
| DISTRIBUTOR | | Prudential Investment
Management Services LLC | | 655 Broad Street
Newark, NJ 07102 |
|
| CUSTODIAN | | The Bank of New York Mellon | | 225 Liberty Street
New York, NY 10286 |
|
| TRANSFER AGENT | | Prudential Mutual Fund
Services LLC | | PO Box 9658
Providence, RI 02940 |
|
| INDEPENDENT REGISTERED PUBLIC ACCOUNTING FIRM | | KPMG LLP | | 345 Park Avenue New York, NY 10154 |
|
| FUND COUNSEL | | Willkie Farr & Gallagher LLP | | 787 Seventh Avenue
New York, NY 10019 |
|
|
| An investor should consider the investment objectives, risks, charges, and expenses of the Fund carefully before investing. The prospectus contains this and other information about the Funds. An investor may obtain a prospectus by visiting our website at www.pgiminvestments.com or by calling (800) 225-1852. The prospectus should be read carefully before investing. |
|
| SHAREHOLDER COMMUNICATIONS WITH TRUSTEES |
| Shareholders can communicate directly with the Board of Trustees by writing to the Chair of the Board, c/o PGIM Investments, Attn: Board of Trustees, 655 Broad Street, Newark, NJ 07102. Shareholders can communicate directly with an individual Trustee by writing to the same address. Communications are not screened before being delivered to the addressee. |
|
| AVAILABILITY OF PORTFOLIO SCHEDULE |
| The Funds file their complete schedule of portfolio holdings with the Securities and Exchange Commission for the first and third quarters of each fiscal year on Form N-Q. The Funds’ Forms N-Q are available on the Commission’s website at www.sec.gov. The Funds’ Forms N-Q may also be reviewed and copied at the Commission’s Public Reference Room in Washington, D.C. Information on the operation and location of the Public Reference Room may be obtained by calling 1-800-SEC-0330. |
Mutual Funds:
| | | | |
ARE NOT INSURED BY THE FDIC OR ANY
FEDERAL GOVERNMENT AGENCY | | MAY LOSE VALUE | | ARE NOT A DEPOSIT OF OR GUARANTEED
BY ANY BANK OR ANY BANK AFFILIATE |
| | |
| | | CUSIP |
| PGIM CORE SHORT-TERM BOND FUND | | 74440E102 |
| PGIM CORE ULTRA SHORT BOND FUND | | 74440E201 |
| PGIM INSTITUTIONAL MONEY MARKET FUND | | 74440E300 |
| | |
| Item 2 – | | Code of Ethics – Not required, as this is not an annual filing. |
| |
| Item 3 – | | Audit Committee Financial Expert – Not required, as this is not an annual filing. |
| |
| Item 4 – | | Principal Accountant Fees and Services – Not required, as this is not an annual filing. |
| |
| Item 5 – | | Audit Committee of Listed Registrants – Not applicable. |
| |
| Item 6 – | | Schedule of Investments – The schedule is included as part of the report to shareholders filed under Item 1 of this Form. |
| |
| Item 7 – | | Disclosure of Proxy Voting Policies and Procedures for Closed-End Management Investment Companies – Not applicable. |
| |
| Item 8 – | | Portfolio Managers of Closed-End Management Investment Companies – Not applicable. |
| |
| Item 9 – | | Purchases of Equity Securities by Closed-End Management Investment Company and Affiliated Purchasers – Not applicable. |
| |
| Item 10 – | | Submission of Matters to a Vote of Security Holders – Not applicable. |
| |
| Item 11 – | | Controls and Procedures |
| | (a) | It is the conclusion of the registrant’s principal executive officer and principal financial officer that the effectiveness of the registrant’s current disclosure controls and procedures (such disclosure controls and procedures having been evaluated within 90 days of the date of this filing) provide reasonable assurance that the information required to be disclosed by the registrant has been recorded, processed, summarized and reported within the time period specified in the Commission’s rules and forms and that the information required to be disclosed by the registrant has been accumulated and communicated to the registrant’s principal executive officer and principal financial officer in order to allow timely decisions regarding required disclosure. |
| | (b) | There has been no significant change in the registrant’s internal control over financial reporting that occurred during the registrant’s most recent fiscal quarter of the period covered by this report that has materially affected, or is likely to materially affect, the registrant’s internal control over financial reporting. |
Item 12 – Exhibits
| | (a) | (1) Code of Ethics – Not required, as this is not an annual filing. |
| | (2) | Certifications pursuant to Section 302 of the Sarbanes-Oxley Act – Attached hereto as Exhibit EX-99.CERT. |
| | (3) | Any written solicitation to purchase securities under Rule 23c-1. – Not applicable. |
| | (b) | Certifications pursuant to Section 906 of the Sarbanes-Oxley Act – Attached hereto as Exhibit EX-99.906CERT. |
SIGNATURES
Pursuant to the requirements of the Securities Exchange Act of 1934 and the Investment Company Act of 1940, the registrant has duly caused this report to be signed on its behalf by the undersigned, thereunto duly authorized.
| | | | |
Registrant | | | | Prudential Investment Portfolios 2 |
| | |
By: | | | | /s/ Deborah A. Docs |
| | | | Deborah A. Docs |
| | | | Secretary |
| | |
Date: | | | | September 18, 2018 |
Pursuant to the requirements of the Securities Exchange Act of 1934 and the Investment Company Act of 1940, this report has been signed below by the following persons on behalf of the registrant and in the capacities and on the dates indicated.
| | | | |
By: | | | | /s/ Stuart S. Parker |
| | | | Stuart S. Parker |
| | | | President and Principal Executive Officer |
| | |
Date: | | | | September 18, 2018 |
| | |
By: | | | | /s/ Brian D. Nee |
| | | | Brian D. Nee |
| | | | Treasurer and Principal Financial and Accounting Officer |
| | |
Date: | | | | September 18, 2018 |