UNITED STATES
SECURITIES AND EXCHANGE COMMISSION
Washington, D.C. 20549
FORM 10-Q
(Mark One)
| | | | | |
| ☒ | QUARTERLY REPORT PURSUANT TO SECTION 13 OR 15(d) OF THE SECURITIES EXCHANGE ACT OF 1934 |
For the Quarterly Period Ended September 30, 2024
or
| | | | | |
| ☐ | TRANSITION REPORT PURSUANT TO SECTION 13 OR 15(d) OF THE SECURITIES EXCHANGE ACT OF 1934 |
For the transition period from to
Commission file number 1-15525
EDWARDS LIFESCIENCES CORPORATION
(Exact name of registrant as specified in its charter)
| | | | | | | | | | | | | | |
| Delaware | | 36-4316614 | |
| (State or other jurisdiction of incorporation or organization) | | (I.R.S. Employer Identification No.) | |
One Edwards Way
Irvine, California 92614
(Address of principal executive offices and zip code)
(949) 250-2500
(Registrant's telephone number, including area code)
Securities registered pursuant to Section 12(b) of the Act:
| | | | | | | | |
| Title of each class | Trading Symbol(s) | Name of each exchange on which registered |
| Common Stock, par value $1.00 per share | EW | New York Stock Exchange |
Indicate by check mark whether the registrant (1) has filed all reports required to be filed by Section 13 or 15(d) of the Securities Exchange Act of 1934 during the preceding 12 months (or for such shorter period that the registrant was required to file such reports), and (2) has been subject to such filing requirements for the past 90 days. Yes ☒ No ☐
Indicate by check mark whether the registrant has submitted electronically every Interactive Data File required to be submitted pursuant to Rule 405 of Regulation S-T (§232.405 of this chapter) during the preceding 12 months (or for such shorter period that the registrant was required to submit such files). Yes ☒ No ☐
Indicate by check mark whether the registrant is a large accelerated filer, an accelerated filer, a non-accelerated filer, a smaller reporting company, or an emerging growth company. See the definitions of "large accelerated filer," "accelerated filer," "smaller reporting company," and "emerging growth company" in Rule 12b-2 of the Exchange Act.
| | | | | | | | | | | | | | | | | | | | | | | | | | | | | |
| Large accelerated filer | ☒ | Accelerated filer | ☐ | Non-accelerated filer | ☐ | Smaller reporting company | ☐ | Emerging growth company | ☐ |
If an emerging growth company, indicate by check mark if the registrant has elected not to use the extended transition period for complying with any new or revised financial accounting standards provided pursuant to Section 13(a) of the Exchange Act. ☐
Indicate by check mark whether the registrant is a shell company (as defined in Rule 12b-2 of the Exchange Act). Yes ☐ No ☒
The number of shares outstanding of the registrant's common stock, $1.00 par value, as of October 31, 2024 was 589.8 million.
EDWARDS LIFESCIENCES CORPORATION
FORM 10-Q
For the quarterly period ended September 30, 2024
TABLE OF CONTENTS
NOTE REGARDING FORWARD-LOOKING STATEMENTS
This report contains forward-looking statements within the meaning of Section 27A of the Securities Act of 1933 and Section 21E of the Securities Exchange Act of 1934. We intend the forward-looking statements contained in this report to be covered by the safe harbor provisions of such Acts. Statements other than statements of historical or current fact in this report or referred to or incorporated by reference into this report are "forward-looking statements" for purposes of these safe harbor provisions. These statements can sometimes be identified by the use of the forward-looking words such as "may," "believe," "will," "expect," "project," "estimate," "should," "anticipate," "plan," "goal," "continue," "seek," "pro forma," "forecast," "intend," "guidance," "optimistic," "aspire," "confident," other forms of these words or similar words or expressions or the negatives thereof. Statements regarding past performance, efforts, or results about which inferences or assumptions may be made can also be forward-looking statements and are not indicative of future performance or results; these statements can be identified by the use of words such as "preliminary," "initial," "potential," "possible," "diligence," "industry-leading," "compliant," "indications," or "early feedback" or other forms of these words or similar words or expressions or the negatives thereof. These forward-looking statements are subject to substantial risks and uncertainties that could cause our results or future business, financial condition, results of operations or performance to differ materially from our historical results or experiences or those expressed or implied in any forward-looking statements contained in this report. These risks and uncertainties include, but are not limited to: our ability to complete or realize the anticipated benefits of the sale of our critical care product group; our ability to develop new products and avoid manufacturing and quality issues; risks related to our recent pending acquisitions, including our ability to close the transactions in a timely manner or at all; clinical trial or commercial results or new product approvals and therapy adoption; the impact of domestic and global conditions; competition in the markets in which we operate; our reliance on vendors, suppliers, and other third parties; damage, failure or interruption of our information technology systems; the impact of public health crises; consolidation in the healthcare industry; our ability to protect our intellectual property; our compliance with applicable regulations; our exposure to product liability claims; use of our products in unapproved circumstances; changes to reimbursement for our products; the impact of currency exchange rates; unanticipated actions by the United States Food and Drug Administration and other regulatory agencies; changes to tax laws; unexpected impacts or expenses of litigation or internal or government investigations; and other risks detailed under “Risk Factors” in our annual report on Form 10-K for the year ended December 31, 2023, as amended in this report, and as such risks and uncertainties may be further amended, supplemented or superseded from time to time by our subsequent reports on Forms 10-Q and 8-K we file with the United States Securities and Exchange Commission. These forward-looking statements speak only as of the date on which they are made and we do not undertake any obligation to update any forward-looking statement to reflect events or circumstances after the date of the statement. If we do update or correct one or more of these statements, investors and others should not conclude that we will make additional updates or corrections.
Unless otherwise indicated or otherwise required by the context, the terms "we," "our," "it," "its," "Company," "Edwards," and "Edwards Lifesciences" refer to Edwards Lifesciences Corporation and its subsidiaries.
Part I. Financial Information
Item 1. Financial Statements
EDWARDS LIFESCIENCES CORPORATION
CONSOLIDATED CONDENSED BALANCE SHEETS
(in millions, except par value; unaudited) | | | | | | | | | | | |
| | September 30, 2024 | | December 31, 2023 |
| ASSETS | | | |
| Current assets | | | |
| Cash and cash equivalents | $ | 3,676.4 | | | $ | 1,132.3 | |
| Short-term investments (Note 6) | 769.7 | | | 500.5 | |
| Accounts receivable, net of allowances of $12.6 and $8.2, respectively | 716.0 | | | 771.5 | |
| Other receivables | 95.5 | | | 56.6 | |
| Inventories (Note 2) | 1,104.2 | | | 903.5 | |
| | | |
| Prepaid expenses | 114.9 | | | 128.8 | |
| Other current assets | 231.0 | | | 224.9 | |
| Current assets of discontinued operations (Note 5) | 20.0 | | | 317.6 | |
| Total current assets | 6,727.7 | | | 4,035.7 | |
| Long-term investments (Note 6) | 319.6 | | | 583.9 | |
| Property, plant, and equipment, net | 1,675.7 | | | 1,591.0 | |
| Operating lease right-of-use assets | 104.4 | | | 84.4 | |
| Goodwill | 1,605.3 | | | 1,145.1 | |
| Other intangible assets, net | 956.1 | | | 399.4 | |
| Deferred income taxes | 888.4 | | | 749.4 | |
| Other assets (Note 2) | 683.5 | | | 463.2 | |
| Non-current assets of discontinued operations (Note 5) | 10.5 | | | 311.1 | |
| Total assets | $ | 12,971.2 | | | $ | 9,363.2 | |
| LIABILITIES AND STOCKHOLDERS' EQUITY | | | |
| Current liabilities | | | |
| Accounts payable | $ | 172.8 | | | $ | 186.6 | |
| Accrued and other liabilities (Note 2) | 1,745.3 | | | 856.4 | |
| Operating lease liabilities | 24.2 | | | 22.9 | |
| | | |
| | | |
| Current liabilities of discontinued operations (Note 5) | 1.8 | | | 129.5 | |
| Total current liabilities | 1,944.1 | | | 1,195.4 | |
| Long-term debt | 597.5 | | | 597.0 | |
| | | |
| Taxes payable | 1.1 | | | 80.6 | |
| Operating lease liabilities | 85.0 | | | 65.2 | |
| Uncertain tax positions | 345.6 | | | 335.0 | |
| Litigation settlement accrual | 63.9 | | | 94.2 | |
| Other liabilities | 322.6 | | | 251.3 | |
| Non-current liabilities of discontinued operations (Note 5) | — | | | 25.1 | |
| Total liabilities | 3,359.8 | | | 2,643.8 | |
| Commitments and contingencies (Note 13) | | | |
| Stockholders' equity | | | |
| Preferred stock, $0.01 par value, authorized 50.0 shares, no shares outstanding | — | | | — | |
| Common stock, $1.00 par value, 1,050.0 shares authorized, 654.3 and 650.5 shares issued, and 589.8 and 601.1 shares outstanding, respectively | 654.3 | | | 650.5 | |
| Additional paid-in capital | 2,452.1 | | | 2,274.4 | |
| Retained earnings | 12,781.4 | | | 8,992.4 | |
| Accumulated other comprehensive loss (Note 14) | (252.5) | | | (242.8) | |
| Treasury stock, at cost, 64.5 and 49.4 shares, respectively | (6,089.7) | | | (5,024.5) | |
| Total Edwards Lifesciences Corporation stockholders' equity | 9,545.6 | | | 6,650.0 | |
| Noncontrolling interest | 65.8 | | | 69.4 | |
| Total stockholders' equity | 9,611.4 | | | 6,719.4 | |
| Total liabilities and equity | $ | 12,971.2 | | | $ | 9,363.2 | |
The accompanying notes are an integral part of these consolidated condensed financial statements.
EDWARDS LIFESCIENCES CORPORATION
CONSOLIDATED CONDENSED STATEMENTS OF OPERATIONS
(in millions, except per share information; unaudited)
| | | | | | | | | | | | | | | | | | | | | | | |
| | Three Months Ended
September 30, | | Nine Months Ended
September 30, |
| | 2024 | | 2023 | | 2024 | | 2023 |
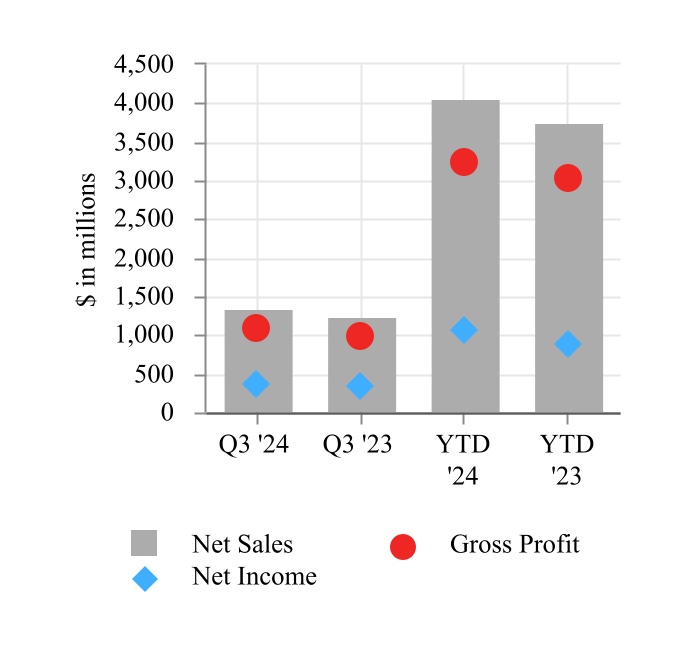
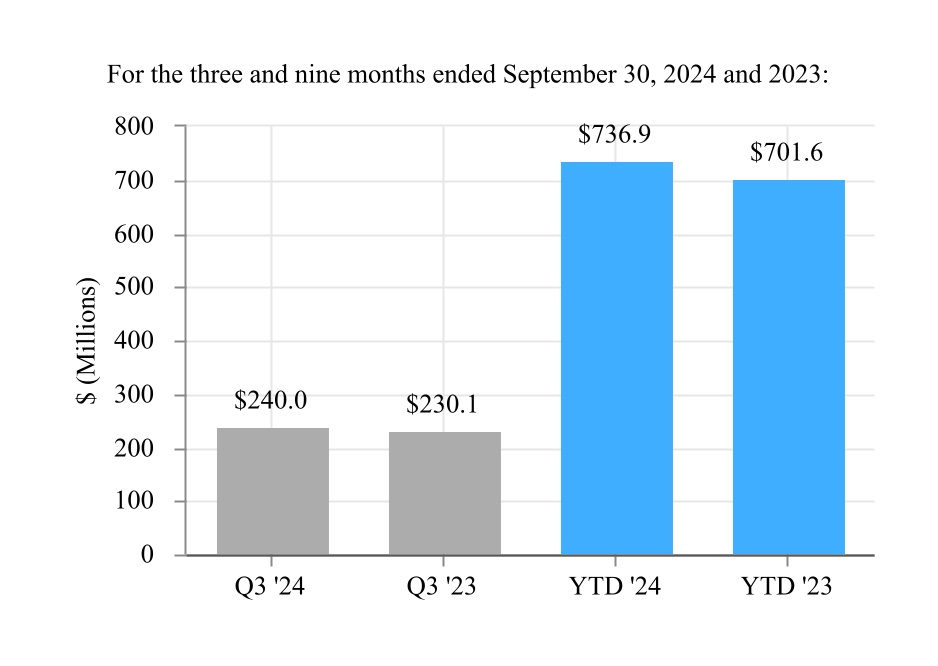
| Net sales | $ | 1,354.4 | | | $ | 1,243.4 | | | $ | 4,053.7 | | | $ | 3,743.6 | |
| Cost of sales | 262.9 | | | 250.6 | | | 825.3 | | | 727.4 | |
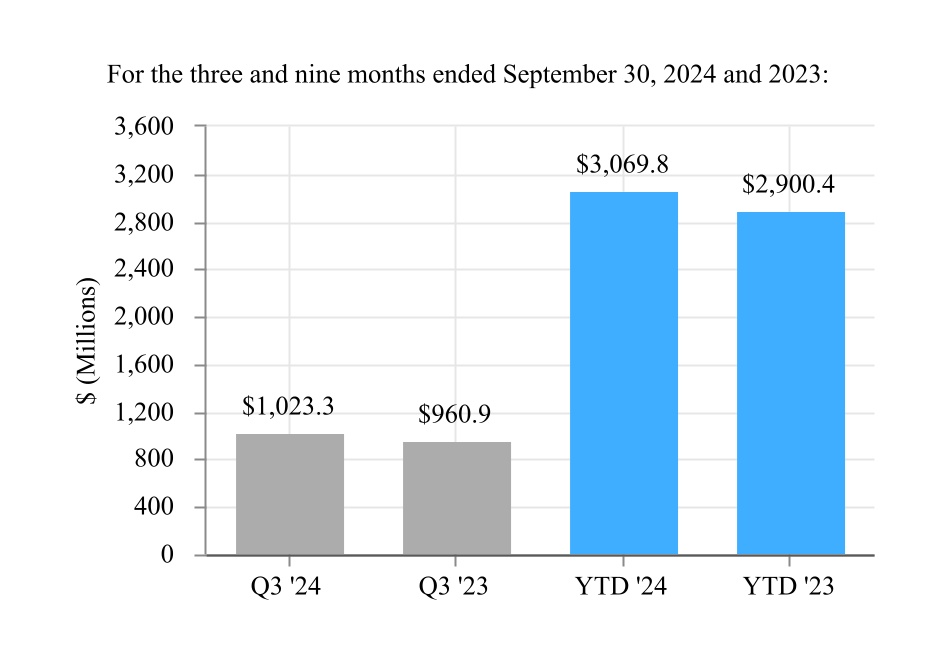
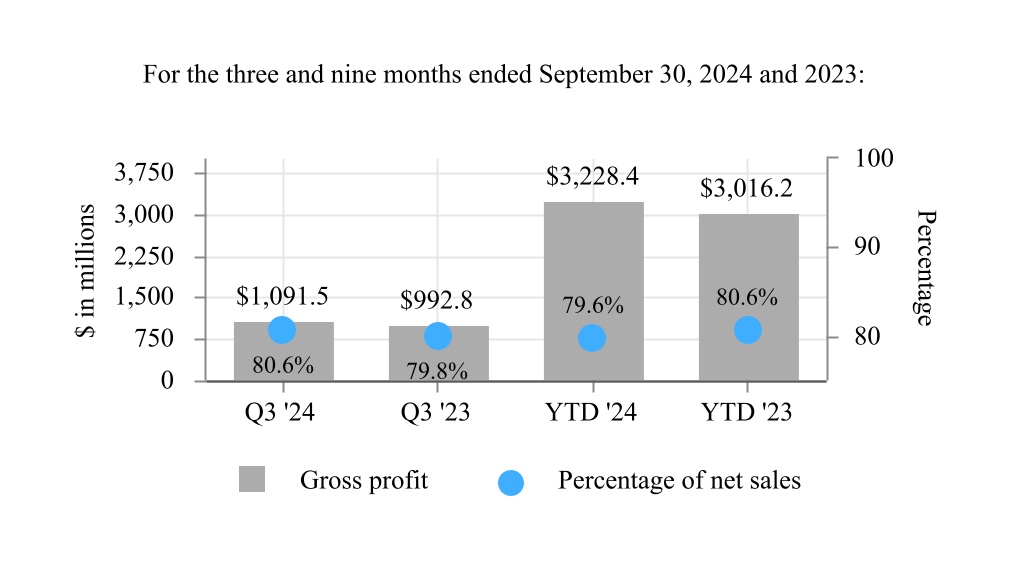
| Gross profit | 1,091.5 | | | 992.8 | | | 3,228.4 | | | 3,016.2 | |
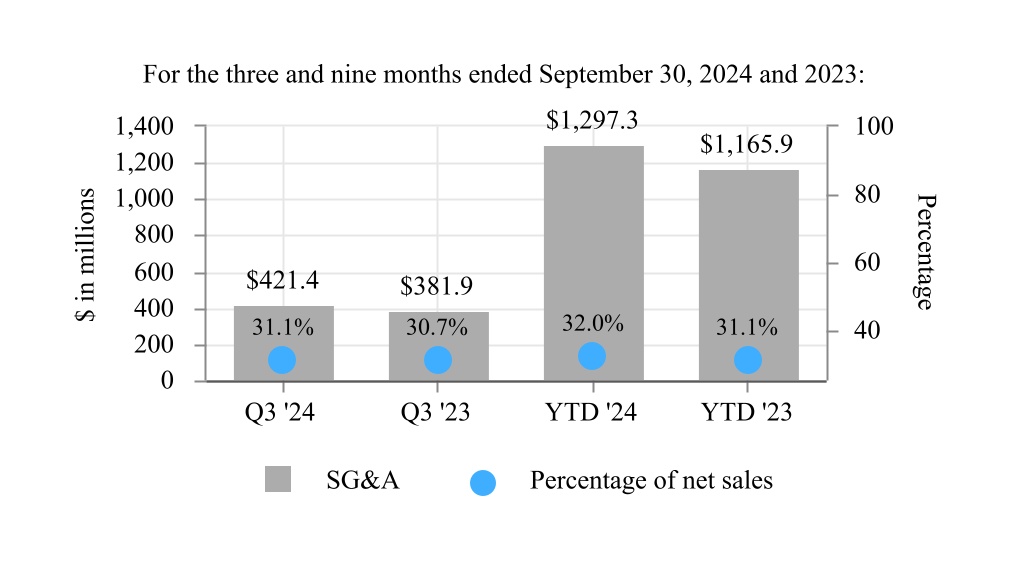
| Selling, general, and administrative expenses | 421.4 | | | 381.9 | | | 1,297.3 | | | 1,165.9 | |
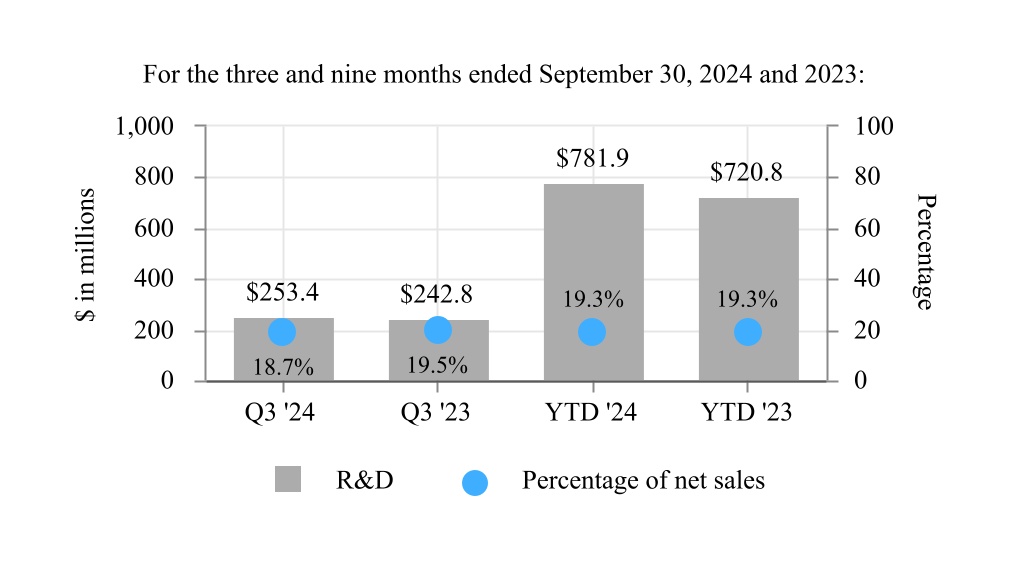
| Research and development expenses | 253.4 | | | 242.8 | | | 781.9 | | | 720.8 | |
| Intellectual property agreement and certain litigation expenses (Note 3) | 10.8 | | | 2.2 | | | 27.8 | | | 193.6 | |
| Change in fair value of contingent consideration liabilities (Note 9) | — | | | — | | | — | | | (26.2) | |
| Restructuring expenses (Note 4) | 32.9 | | | — | | | 32.9 | | | — | |
| Other operating expenses, net | 22.4 | | | — | | | 22.4 | | | — | |
| Operating income, net | 350.6 | | | 365.9 | | | 1,066.1 | | | 962.1 | |
| Interest income, net | (24.3) | | | (15.1) | | | (56.3) | | | (32.8) | |
| | | | | | | |
| Other non-operating income, net | (27.9) | | | (6.6) | | | (35.6) | | | (10.3) | |
| Income from continuing operations before provision for income taxes | 402.8 | | | 387.6 | | | 1,158.0 | | | 1,005.2 | |
| Provision for income taxes | 40.7 | | | 52.7 | | | 107.0 | | | 118.3 | |
| Net income from continuing operations | 362.1 | | | 334.9 | | | 1,051.0 | | | 886.9 | |
| Income from discontinued operations, net of tax | 2,707.3 | | | 48.8 | | | 2,734.4 | | | 142.8 | |
| Net income | 3,069.4 | | | 383.7 | | | 3,785.4 | | | 1,029.7 | |
| Net loss attributable to noncontrolling interest | (1.4) | | | (1.2) | | | (3.6) | | | (2.8) | |
| Net income attributable to Edwards Lifesciences Corporation | $ | 3,070.8 | | | $ | 384.9 | | | $ | 3,789.0 | | | $ | 1,032.5 | |
| | | | | | | |
Share information (Note 15) | | | | | | | |
| Earnings per share: | | | | | | | |
| Basic | | | | | | | |
| Continuing operations | $ | 0.61 | | | $ | 0.55 | | | $ | 1.76 | | | $ | 1.47 | |
| Discontinued operations | $ | 4.53 | | | $ | 0.08 | | | $ | 4.55 | | | $ | 0.23 | |
| Basic earnings per share | $ | 5.14 | | | $ | 0.63 | | | $ | 6.31 | | | $ | 1.70 | |
| Diluted | | | | | | | |
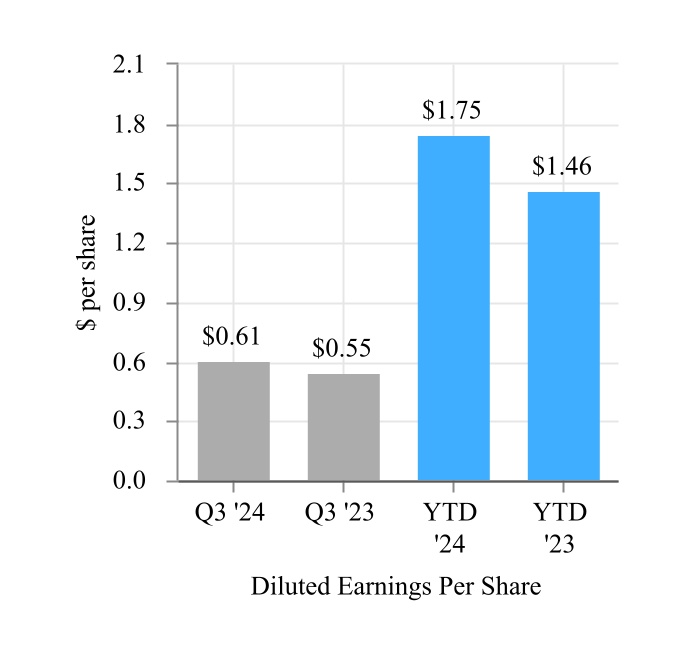
| Continuing operations | $ | 0.61 | | | $ | 0.55 | | | $ | 1.75 | | | $ | 1.46 | |
| Discontinued operations | $ | 4.52 | | | $ | 0.08 | | | $ | 4.54 | | | $ | 0.23 | |
| Diluted earnings per share | $ | 5.13 | | | $ | 0.63 | | | $ | 6.29 | | | $ | 1.69 | |
| Weighted-average number of common shares outstanding: | | | | | | | |
| Basic | 597.2 | | | 607.0 | | | 600.3 | | | 607.2 | |
| Diluted | 598.1 | | | 609.5 | | | 602.2 | | | 610.2 | |
The accompanying notes are an integral part of these consolidated condensed financial statements.
EDWARDS LIFESCIENCES CORPORATION
CONSOLIDATED CONDENSED STATEMENTS OF COMPREHENSIVE INCOME
(in millions; unaudited)
| | | | | | | | | | | | | | | | | | | | | | | |
| | Three Months Ended
September 30, | | Nine Months Ended
September 30, |
| | 2024 | | 2023 | | 2024 | | 2023 |
| Net income | $ | 3,069.4 | | | $ | 383.7 | | | $ | 3,785.4 | | | $ | 1,029.7 | |
| Other comprehensive (loss) income, net of tax (Note 14): | | | | | | | |
| Foreign currency translation adjustments | 4.3 | | | (23.4) | | | (20.8) | | | (31.1) | |
| Unrealized (loss) gain on hedges | (42.7) | | | 18.2 | | | (8.9) | | | 6.3 | |
| Unrealized pension credits | — | | | — | | | 0.2 | | | 0.1 | |
| Unrealized gain on available-for-sale investments | 6.1 | | | 10.6 | | | 19.8 | | | 29.5 | |
| Other comprehensive (loss) income, net of tax | (32.3) | | | 5.4 | | | (9.7) | | | 4.8 | |
| Comprehensive income | 3,037.1 | | | 389.1 | | | 3,775.7 | | | 1,034.5 | |
| Comprehensive loss attributable to noncontrolling interest | (1.4) | | | (1.2) | | | (3.6) | | | (2.8) | |
| Comprehensive income attributable to Edwards Lifesciences Corporation | $ | 3,038.5 | | | $ | 390.3 | | | $ | 3,779.3 | | | $ | 1,037.3 | |
The accompanying notes are an integral part of these consolidated condensed financial statements.
EDWARDS LIFESCIENCES CORPORATION
CONSOLIDATED CONDENSED STATEMENTS OF CASH FLOWS
(in millions; unaudited) | | | | | | | | | | | |
| | Nine Months Ended
September 30, |
| | 2024 | | 2023 |
| Cash flows from operating activities | | | |
| Net income | $ | 3,785.4 | | | $ | 1,029.7 | |
| Adjustments to reconcile net income to net cash provided by operating activities: | | | |
| Depreciation and amortization | 112.6 | | | 108.2 | |
| Non-cash operating lease cost | 21.6 | | | 20.7 | |
| Stock-based compensation (Note 11) | 130.6 | | | 108.9 | |
| Gain on sale of business (Note 5) | (3,337.4) | | | — | |
| | | |
| Change in fair value of contingent consideration liabilities (Note 9) | — | | | (26.2) | |
| | | |
| Deferred income taxes | (224.9) | | | (180.7) | |
| | | |
| Gain on remeasurement of previously held interest upon acquisition (Note 8) | (24.6) | | | — | |
| Other | 2.7 | | | 8.8 | |
| Changes in operating assets and liabilities: | | | |
| Accounts and other receivables, net | 15.3 | | | (123.0) | |
| Inventories | (204.9) | | | (189.7) | |
| Accounts payable and accrued liabilities | 92.6 | | | 112.6 | |
| Income taxes | 301.8 | | | 106.3 | |
| Prepaid expenses and other current assets | 27.4 | | | (63.7) | |
| Intellectual property agreement accrual | (24.3) | | | (26.0) | |
| Long-term prepaid royalties (Note 3) | 6.2 | | | (111.9) | |
| Other | (10.3) | | | (14.8) | |
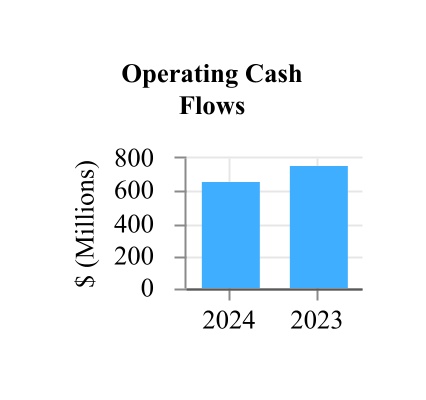
| Net cash provided by operating activities | 669.8 | | | 759.2 | |
| Cash flows from investing activities | | | |
| Capital expenditures | (202.6) | | | (164.7) | |
| Purchases of held-to-maturity investments (Note 6) | (36.3) | | | (23.5) | |
| Proceeds from held-to-maturity investments (Note 6) | 50.4 | | | 91.5 | |
| Purchases of available-for-sale investments (Note 6) | (518.8) | | | (8.4) | |
| Proceeds from available-for-sale investments (Note 6) | 539.1 | | | 486.9 | |
| Investments in intangible assets | (25.4) | | | (13.3) | |
| | | |
| | | |
| | | |
| Proceeds from sale of business | 3,927.4 | | | — | |
| Business combination, net of cash | (763.6) | | | (141.2) | |
| Payment for acquisition options (Note 7) | (16.2) | | | (15.0) | |
| Issuances of notes receivable | (28.0) | | | (47.5) | |
| | | |
| Other | (36.4) | | | (5.1) | |
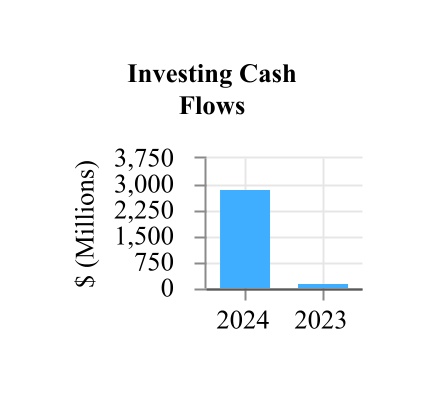
| Net cash provided by investing activities | 2,889.6 | | | 159.7 | |
| Cash flows from financing activities | | | |
| | | |
| | | |
| Purchases of treasury stock | (1,059.3) | | | (431.2) | |
| Equity forward contract related to accelerated share repurchase agreement (Note 12) | (100.0) | | | — | |
| Proceeds from stock plans | 150.9 | | | 136.7 | |
| | | |
| Other | (3.2) | | | (3.3) | |
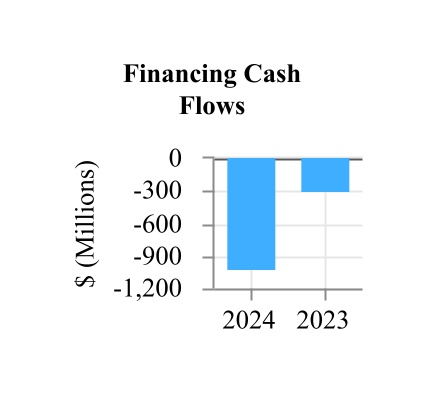
| Net cash used in financing activities | (1,011.6) | | | (297.8) | |
| Effect of currency exchange rate changes on cash, cash equivalents, and restricted cash | (12.4) | | | 20.2 | |
| Net increase in cash, cash equivalents, and restricted cash | 2,535.4 | | | 641.3 | |
| Cash, cash equivalents, and restricted cash at beginning of period | 1,148.0 | | | 772.6 | |
| Cash, cash equivalents, and restricted cash at end of period (Note 2) | $ | 3,683.4 | | | $ | 1,413.9 | |
| | | |
The accompanying notes are an integral part of these consolidated condensed financial statements.
EDWARDS LIFESCIENCES CORPORATION
CONSOLIDATED CONDENSED STATEMENTS OF STOCKHOLDERS' EQUITY
(in millions; unaudited)
| | | | | | | | | | | | | | | | | | | | | | | | | | | | | | | | | | | | | | | | | | | | | | | | | | | | | | | | | | | |
| | Common Stock | | Treasury Stock | | | | | | | | | | | | |
| | Shares | | Par Value | | Shares | | Amount | | Additional Paid-in Capital | | Retained Earnings | | Accumulated Other Comprehensive Loss | | Total Edwards Lifesciences Corporation Stockholders' Equity | | Noncontrolling Interest | | Total Stockholders' Equity |
| Balance at December 31, 2023 | 650.5 | | | $ | 650.5 | | | 49.4 | | | $ | (5,024.5) | | | $ | 2,274.4 | | | $ | 8,992.4 | | | $ | (242.8) | | | $ | 6,650.0 | | | $ | 69.4 | | | $ | 6,719.4 | |
| Net income | | | | | | | | | | | 351.9 | | | | | 351.9 | | | (0.9) | | | 351.0 | |
| Other comprehensive gain, net of tax | | | | | | | | | | | | | 9.5 | | | 9.5 | | | | | 9.5 | |
| Common stock issued under stock plans | 1.3 | | | 1.3 | | | | | | | 60.8 | | | | | | | 62.1 | | | | | 62.1 | |
| Stock-based compensation expense | | | | | | | | | 44.6 | | | | | | | 44.6 | | | | | 44.6 | |
| | | | | | | | | | | | | | | | | | | |
| Purchases of treasury stock | | | | | — | | | (0.2) | | | | | | | | | (0.2) | | | | | (0.2) | |
| | | | | | | | | | | | | | | | | | | |
| | | | | | | | | | | | | | | | | | | |
| Balance at March 31, 2024 | 651.8 | | | $ | 651.8 | | | 49.4 | | | $ | (5,024.7) | | | $ | 2,379.8 | | | $ | 9,344.3 | | | $ | (233.3) | | | $ | 7,117.9 | | | $ | 68.5 | | | $ | 7,186.4 | |
| Net income | | | | | | | | | | | 366.3 | | | | | 366.3 | | | (1.3) | | | 365.0 | |
| Other comprehensive gain, net of tax | | | | | | | | | | | | | 13.1 | | | 13.1 | | | | | 13.1 | |
| Common stock issued under equity plans | 1.7 | | | 1.7 | | | | | | | 52.6 | | | | | | | 54.3 | | | | | 54.3 | |
| Stock-based compensation expense | | | | | | | | | 43.9 | | | | | | | 43.9 | | | | | 43.9 | |
| | | | | | | | | | | | | | | | | | | |
| Purchases of treasury stock | | | | | 1.8 | | | (158.1) | | | | | | | | | (158.1) | | | | | (158.1) | |
| | | | | | | | | | | | | | | | | | | |
| | | | | | | | | | | | | | | | | | | |
| Balance at June 30, 2024 | 653.5 | | | $ | 653.5 | | | 51.2 | | | $ | (5,182.8) | | | $ | 2,476.3 | | | $ | 9,710.6 | | | $ | (220.2) | | | $ | 7,437.4 | | | $ | 67.2 | | | $ | 7,504.6 | |
| Net income | | | | | | | | | | | 3,070.8 | | | | | 3,070.8 | | | (1.4) | | | 3,069.4 | |
| Other comprehensive loss, net of tax | | | | | | | | | | | | | (32.3) | | | (32.3) | | | | | (32.3) | |
| Common stock issued under equity plans | 0.8 | | | 0.8 | | | | | | | 33.7 | | | | | | | 34.5 | | | | | 34.5 | |
| Stock-based compensation expense | | | | | | | | | 42.1 | | | | | | | 42.1 | | | | | 42.1 | |
| | | | | | | | | | | | | | | | | | | |
| Purchases of treasury stock | | | | | 13.3 | | | (906.9) | | | (100.0) | | | | | | | (1,006.9) | | | | | (1,006.9) | |
| | | | | | | | | | | | | | | | | | | |
| | | | | | | | | | | | | | | | | | | |
| Balance at September 30, 2024 | 654.3 | | | $ | 654.3 | | | 64.5 | | | $ | (6,089.7) | | | $ | 2,452.1 | | | $ | 12,781.4 | | | $ | (252.5) | | | $ | 9,545.6 | | | $ | 65.8 | | | $ | 9,611.4 | |
The accompanying notes are an integral part of these consolidated condensed financial statements.
EDWARDS LIFESCIENCES CORPORATION
CONSOLIDATED CONDENSED STATEMENTS OF STOCKHOLDERS' EQUITY
(in millions; unaudited)
| | | | | | | | | | | | | | | | | | | | | | | | | | | | | | | | | | | | | | | | | | | | | | | | | | | | | | | | | | | |
| | Common Stock | | Treasury Stock | | | | | | | | | | | | |
| | Shares | | Par Value | | Shares | | Amount | | Additional Paid-in Capital | | Retained Earnings | | Accumulated Other Comprehensive Loss | | Total Edwards Lifesciences, Inc. Stockholders' Equity | | Noncontrolling Interest | | Total Stockholders' Equity |
| Balance at December 31, 2022 | 646.3 | | | $ | 646.3 | | | 38.0 | | | $ | (4,144.0) | | | $ | 1,969.3 | | | $ | 7,590.0 | | | $ | (254.9) | | | $ | 5,806.7 | | | $ | — | | | $ | 5,806.7 | |
| Net income | | | | | | | | | | | 340.5 | | | | | 340.5 | | | — | | | 340.5 | |
| Other comprehensive loss, net of tax | | | | | | | | | | | | | (0.5) | | | (0.5) | | | | | (0.5) | |
| Common stock issued under stock plans | 0.8 | | | 0.8 | | | | | | | 41.1 | | | | | | | 41.9 | | | | | 41.9 | |
| Stock-based compensation expense | | | | | | | | | 38.9 | | | | | | | 38.9 | | | | | 38.9 | |
| | | | | | | | | | | | | | | | | | | |
| Purchases of treasury stock | | | | | 3.1 | | | (249.5) | | | | | | | | | (249.5) | | | | | (249.5) | |
| | | | | | | | | | | | | | | | | | | |
| Changes to noncontrolling interest | | | | | | | | | | | | | | | | | 84.0 | | | 84.0 | |
| Balance at March 31, 2023 | 647.1 | | | $ | 647.1 | | | 41.1 | | | $ | (4,393.5) | | | $ | 2,049.3 | | | $ | 7,930.5 | | | $ | (255.4) | | | $ | 5,978.0 | | | $ | 84.0 | | | $ | 6,062.0 | |
| Net income | | | | | | | | | | | 307.1 | | | | | 307.1 | | | (1.6) | | | 305.5 | |
| Other comprehensive loss, net of tax | | | | | | | | | | | | | (0.1) | | | (0.1) | | | | | (0.1) | |
| Common stock issued under equity plans | 2.0 | | | 2.0 | | | | | | | 58.8 | | | | | | | 60.8 | | | | | 60.8 | |
| Stock-based compensation expense | | | | | | | | | 37.4 | | | | | | | 37.4 | | | | | 37.4 | |
| | | | | | | | | | | | | | | | | | | |
| Purchases of treasury stock | | | | | 0.1 | | | (7.5) | | | | | | | | | (7.5) | | | | | (7.5) | |
| | | | | | | | | | | | | | | | | | | |
| Changes to noncontrolling interest | | | | | | | | | | | | | | | | | (11.6) | | | (11.6) | |
| Balance at June 30, 2023 | 649.1 | | | $ | 649.1 | | | 41.2 | | | $ | (4,401.0) | | | $ | 2,145.5 | | | $ | 8,237.6 | | | $ | (255.5) | | | $ | 6,375.7 | | | $ | 70.8 | | | $ | 6,446.5 | |
| Net income | | | | | | | | | | | 384.9 | | | | | 384.9 | | | (1.2) | | | 383.7 | |
| Other comprehensive loss, net of tax | | | | | | | | | | | | | 5.4 | | | 5.4 | | | | | 5.4 | |
| Common stock issued under equity plans | 0.8 | | | 0.8 | | | | | | | 33.2 | | | | | | | 34.0 | | | | | 34.0 | |
| Stock-based compensation expense | | | | | | | | | 32.6 | | | | | | | 32.6 | | | | | 32.6 | |
| | | | | | | | | | | | | | | | | | | |
| Purchases of treasury stock | | | | | 2.2 | | | (175.1) | | | | | | | | | (175.1) | | | | | (175.1) | |
| | | | | | | | | | | | | | | | | | | |
| | | | | | | | | | | | | | | | | | | |
| Balance at September 30, 2023 | 649.9 | | | $ | 649.9 | | | 43.4 | | | $ | (4,576.1) | | | $ | 2,211.3 | | | $ | 8,622.5 | | | $ | (250.1) | | | $ | 6,657.5 | | | $ | 69.6 | | | $ | 6,727.1 | |
The accompanying notes are an integral part of these consolidated condensed financial statements.
1. BASIS OF PRESENTATION
The accompanying interim consolidated condensed financial statements and related disclosures have been prepared pursuant to the rules and regulations of the Securities and Exchange Commission ("SEC") and should be read in conjunction with the consolidated financial statements and notes included in Edwards Lifesciences' Annual Report on Form 10-K for the year ended December 31, 2023. Certain information and footnote disclosures normally included in financial statements prepared in accordance with generally accepted accounting principles in the United States of America ("GAAP") have been condensed or omitted.
The consolidated condensed financial statements include the accounts of all wholly-owned subsidiaries and variable interest entities for which the Company is the primary beneficiary. The Company attributes the net income or losses of its consolidated variable interest entities to controlling and noncontrolling interests using the hypothetical liquidation at book value method. All intercompany accounts and transactions have been eliminated in consolidation.
On September 3, 2024, the Company sold its Critical Care product group ("Critical Care"). The historical results of Critical Care are reflected as discontinued operations in the Company's consolidated condensed financial statements for all periods presented. In addition, as a next step in the Company's disposal plan to exit businesses that are not focused on implantable medical innovations for structural heart disease, the historical results of a small non-core product group that the Company plans to sell are also included in discontinued operations. Unless otherwise indicated, the information in the notes to the consolidated condensed financial statements refer only to Edwards Lifesciences' continuing operations. For more information, see Note 5.
The preparation of financial statements in conformity with GAAP requires management to make estimates and assumptions that affect the amounts reported in the financial statements. Actual results could differ from those estimates.
In the opinion of management, the unaudited interim consolidated condensed financial statements reflect all adjustments necessary for a fair statement of the results for the interim periods presented. All such adjustments, unless otherwise noted herein, are of a normal, recurring nature. The results of operations for the interim periods are not necessarily indicative of the results of operations to be expected for the full year.
There have been no material changes to the Company's significant accounting policies from those described in the Company's Annual Report on Form 10-K for the year ended December 31, 2023.
Recently Adopted Accounting Standards
In March 2023, the Financial Accounting Standards Board ("FASB") issued an amendment to the accounting guidance on investments in tax credit structures to allow entities to elect to account for their tax equity investments, regardless of the tax credit program from which the income tax credits are received, using the proportional amortization method if certain conditions are met. The guidance is effective for fiscal years beginning after December 15, 2023, including interim periods within those fiscal years. The Company adopted this guidance on January 1, 2024. The adoption of this guidance did not have a material impact on the Company's consolidated financial statements.
New Accounting Standards Not Yet Adopted
In November 2024, the FASB issued an amendment to the accounting guidance on income statement presentation to require disclosure, in the notes to the financial statements, of disaggregated information about certain costs and expenses, including purchases of inventory, employee compensation, and depreciation and amortization included in each relevant expense caption within continuing operations. The guidance is effective for fiscal years beginning after December 15, 2026, and interim periods beginning after December 15, 2027. The Company is currently evaluating the impact the guidance will have on its consolidated financial statements.
In March 2024, the SEC issued final climate-related disclosure rules that will require disclosure of material climate-related risks and material direct greenhouse gas emissions from operations owned or controlled (Scope 1) and/or material indirect greenhouse gas emissions from purchased energy consumed in owned or controlled operations (Scope 2). Additionally, the rules require disclosure in the notes to the financial statements of the effects of severe weather events and other natural conditions, subject to certain materiality thresholds. The new rules will be effective for annual reporting periods beginning in fiscal year 2025, except for the greenhouse gas emissions disclosures which will be effective for annual reporting periods beginning in fiscal year 2026. Subsequent to issuance, the rules became the subject of litigation, and the SEC has issued a stay
to allow the legal process to proceed. The Company is currently evaluating the disclosure impact the guidance will have on its consolidated financial statements.
In December 2023, the FASB issued an amendment to the accounting guidance on income taxes which requires entities to provide additional information in the rate reconciliation and additional disaggregated disclosures about income taxes paid. This guidance requires public entities to disclose in their rate reconciliation table additional categories of information about federal, state, and foreign income taxes and to provide more details about the reconciling items in some categories if the items meet a quantitative threshold. The guidance is effective for annual periods beginning after December 15, 2024. The Company does not expect the adoption of this guidance to impact its financial statements, but the guidance will impact its income tax disclosures.
In November 2023, the FASB issued an amendment to the accounting guidance on segment reporting. The amendments require disclosure of significant segment expenses and other segment items and requires entities to provide in interim periods all disclosures about a reportable segment's profit or loss and assets that are currently required annually. The amendment also requires disclosure of the title and position of the chief operating decision maker ("CODM") and an explanation of how the CODM uses the reported measure(s) of segment profit or loss in assessing segment performance and deciding how to allocate resources. The guidance is effective for fiscal years beginning after December 15, 2023, and interim periods within fiscal years beginning after December 15, 2024. Retrospective application is required, and early adoption is permitted. The Company is currently evaluating the impact the guidance will have on its consolidated financial statements.
2. OTHER CONSOLIDATED FINANCIAL STATEMENT DETAILS
Composition of Certain Financial Statement Captions
(in millions)
Components of selected captions in the consolidated condensed balance sheets consisted of the following:
| | | | | | | | | | | |
| September 30,
2024 | | December 31, 2023 |
| Inventories | | | |
| Raw materials | $ | 248.8 | | | $ | 196.3 | |
| Work in process | 244.4 | | | 195.8 | |
| Finished products | 611.0 | | | 511.4 | |
| $ | 1,104.2 | | | $ | 903.5 | |
At September 30, 2024 and December 31, 2023, $187.8 million and $164.6 million, respectively, of the Company's finished products inventories were held on consignment.
| | | | | | | | | | | |
| September 30,
2024 | | December 31, 2023 |
| Other assets | | | |
| Tax receivable (Note 16) | $ | 293.7 | | | $ | — | |
| Notes and other receivables | 132.9 | | | 155.1 | |
| Acquisition options | 117.5 | | | 161.3 | |
| Long-term prepaid royalties | 103.7 | | | 109.9 | |
| Fair value of derivatives | 21.8 | | | 23.4 | |
| Other long-term assets | 13.9 | | | 13.5 | |
| $ | 683.5 | | | $ | 463.2 | |
| | | |
| Accrued and other liabilities | | | |
| | | |
| Employee compensation and withholdings | $ | 312.1 | | | $ | 316.4 | |
| Taxes payable (Note 5) | 715.1 | | | 52.7 | |
| Property, payroll, and other taxes | 83.7 | | | 53.8 | |
| Research and development accruals | 79.0 | | | 71.6 | |
| Accrued rebates | 140.0 | | | 123.5 | |
| Fair value of derivatives | 24.3 | | | 15.2 | |
| Accrued marketing expenses | 14.5 | | | 13.7 | |
| Legal and insurance | 29.5 | | | 28.9 | |
| Litigation settlement | 75.1 | | | 69.1 | |
| Accrued relocation costs | 16.2 | | | 16.9 | |
| Accrued professional services | 62.2 | | | 8.5 | |
| Accrued realignment reserves | 39.6 | | | 6.4 | |
| Unfavorable contract liability | 66.0 | | | — | |
| | | |
| | | |
| | | |
| Other accrued liabilities | 88.0 | | | 79.7 | |
| $ | 1,745.3 | | | $ | 856.4 | |
Supplemental Cash Flow Information
(in millions)
| | | | | | | | | | | |
| Nine Months Ended
September 30, |
| 2024 | | 2023 |
| Cash paid during the year for: | | | |
Income taxes (a) (Note 16) | $ | 633.8 | | | $ | 219.1 | |
| Amounts included in the measurement of operating lease liabilities | $ | 21.0 | | | $ | 19.1 | |
| Non-cash investing and financing transactions: | | | |
| | | |
| | | |
| | | |
| Right-of-use assets obtained in exchange for new lease liabilities | $ | 38.9 | | | $ | 19.9 | |
| Capital expenditures accruals | $ | 22.9 | | | $ | 32.5 | |
| | | |
| | | |
______________________________________
(a) Includes cash paid for income taxes from discontinued operations of $29.7 million and $22.7 million for the nine months ended September 30, 2024 and 2023, respectively.
Cash, Cash Equivalents, and Restricted Cash
(in millions)
| | | | | | | | | | | | | | |
| September 30,
2024 | | December 31, 2023 | |
| Continuing operations | | | | |
| Cash and cash equivalents | $ | 3,676.4 | | | $ | 1,132.3 | | |
| Restricted cash included in other current assets | 3.2 | | | 3.3 | | |
| Restricted cash included in other assets | 0.9 | | | 0.7 | | |
| Total | $ | 3,680.5 | | | $ | 1,136.3 | | |
| Discontinued operations | | | | |
| Cash and cash equivalents | $ | 2.9 | | | $ | 11.7 | | |
| Total | $ | 2.9 | | | $ | 11.7 | | |
| Total cash, cash equivalents, and restricted cash | $ | 3,683.4 | | | $ | 1,148.0 | | |
Amounts included in restricted cash primarily represent funds placed in escrow related to litigation.
3. INTELLECTUAL PROPERTY AGREEMENT AND CERTAIN LITIGATION EXPENSES
On April 12, 2023, Edwards entered into an Intellectual Property Agreement (the "Intellectual Property Agreement") with Medtronic, Inc. ("Medtronic") pursuant to which the parties agreed to a 15-year global covenant not to sue ("CNS") for infringement of certain patents in the structural heart space owned or controlled by each other. In consideration for the global CNS and related mutual access to certain intellectual property rights, Edwards paid to Medtronic a one-time, lump sum payment of $300.0 million and is paying annual royalties tied to net sales of certain Edwards products. Based upon the terms of the Intellectual Property Agreement, the Company identified the relevant elements for accounting purposes and allocated the $300.0 million upfront payment based on their respective fair values. The Company recorded a $37.0 million pre-tax charge in Intellectual Property Agreement and Certain Litigation Expenses in March 2023 related primarily to prior commercial sales incurred through March 31, 2023. The Company recorded a prepaid royalty asset of $124.0 million in April 2023 related to future commercial sales, which will be amortized to expense during the term of the Intellectual Property Agreement. Separately, the Company recorded a $139.0 million pre-tax charge in Intellectual Property Agreement and Certain Litigation Expenses in April 2023 related to products currently in development.
4. RESTRUCTURING EXPENSES
In September 2024, the Company recorded an expense of $32.9 million related primarily to severance expenses associated with a global workforce realignment impacting approximately 360 employees. As of September 30, 2024, the Company's remaining severance obligations of $30.6 million are expected to be substantially paid within the next 12 months.
5. DISCONTINUED OPERATIONS
On June 3, 2024, the Company entered into a definitive agreement to sell its Critical Care product group ("Critical Care") to Becton, Dickinson and Company ("BD"). In addition, as a next step in the Company's disposal plan to exit businesses that are not focused on implantable medical innovations for structural heart disease, the Company has committed to a plan to sell a non-core product group, with the sale expected to occur within the next 12 months.
Critical Care and the aforementioned non-core product group (collectively, the "discontinued product groups") were historically reported in each of the Company's segments (United States, Europe, Japan, and Rest of World).
The Company concluded that the Critical Care product group met the criteria to be classified as held-for-sale in June 2024 and that the non-core product group met the criteria to be classified as held-for-sale in September 2024. The Company determined that, when considered together, the conditions for discontinued operations presentation had been met with respect to the discontinued product groups. A component of an entity is reported in discontinued operations after meeting the criteria for held-for-sale classification if the disposition represents a strategic shift that has (or will have) a major effect on the entity's operations and financial results. The Company analyzed the quantitative and qualitative factors relevant to the discontinued product groups, including their significance to the Company’s overall net income and total assets, and determined that those
conditions for discontinued operations presentation had been met. As such, the historical financial condition and results of the discontinued product groups have been reflected as discontinued operations in the Company's consolidated condensed financial statements. The assets and liabilities associated with discontinued product groups are classified as assets and liabilities of discontinued operations in the Company's consolidated condensed balance sheets. Prior period amounts have been adjusted to reflect the discontinued operations presentation.
On September 3, 2024, Critical Care was sold for $4.2 billion, which is subject to a further working capital adjustment, resulting in a gain of $3.3 billion which was included in Income from Discontinued Operations, net of tax.
In connection with the sale of Critical Care, the Company entered into a Transition Services Agreement ("TSA") to provide certain support services for up to 36 months from the closing date of the sale (with certain extension rights as provided therein). These support services may be in the areas of accounting, information technology, human resources, quality assurance, regulatory affairs, customer support, and global supply chain, among others. In connection with the TSA, the Company recognized an unfavorable contract liability of $115.1 million, which will be recognized over the TSA term.
In addition, Edwards and BD entered into other agreements to provide a framework for the ongoing activities between the Company and BD after the sale and until the end of the TSA including, but not limited to, interim operating model agreements to support the commercial operations until full transfer of all regulatory licenses to BD and completion of services under the TSA agreement, a manufacturing and supply agreement, and a quality agreement. Under these agreements, the Company will continue to provide certain services to BD during the term of these agreements including serving as an undisclosed selling and purchasing agent for the Critical Care business on behalf of BD for a period of up to 36 months.
As of September 30, 2024, the Company had a receivable of approximately $24.6 million from BD related to the services under the agreements. The Company recorded income from the TSA of $7.6 million during the three and nine months ended September 30, 2024, which is recorded in Other Operating Expenses, net on the Company's consolidated condensed statements of operations.
Details of Income from Discontinued Operations are as follows (in millions):
| | | | | | | | | | | | | | | | | | | | | | | |
| | Three Months Ended
September 30, | | Nine Months Ended
September 30, |
| | 2024 | | 2023 | | 2024 | | 2023 |
| Net sales | $ | 177.2 | | | $ | 237.5 | | | $ | 708.4 | | | $ | 727.1 | |
| Cost of sales | 65.4 | | | 99.8 | | | 265.1 | | | 295.5 | |
| Gross profit | 111.8 | | | 137.7 | | | 443.3 | | | 431.6 | |
| Selling, general, and administrative expenses | 40.9 | | | 57.7 | | | 163.2 | | | 178.7 | |
| Research and development expenses | 21.4 | | | 27.5 | | | 81.3 | | | 81.0 | |
| | | | | | | |
| | | | | | | |
| Separation costs | 81.5 | | | — | | | 202.5 | | | — | |
| | | | | | | |
| Operating (loss) income, net | (32.0) | | | 52.5 | | | (3.7) | | | 171.9 | |
| | | | | | | |
| | | | | | | |
| Other non-operating (income) expense, net | (3,338.9) | | | 0.8 | | | (3,337.5) | | | 0.7 | |
| Income from discontinued operations before provision for income taxes | 3,306.9 | | | 51.7 | | | 3,333.8 | | | 171.2 | |
| Provision for income taxes from discontinued operations | 599.6 | | | 2.9 | | | 599.4 | | | 28.4 | |
| Net income from discontinued operations | 2,707.3 | | | 48.8 | | | 2,734.4 | | | 142.8 | |
Separation costs related primarily to consulting, legal, tax, and other professional advisory services associated with the sale of Critical Care.
Details of assets and liabilities of discontinued operations are as follows (in millions):
| | | | | | | | | | | |
| | September 30,
2024 | | December 31,
2023 |
| Cash and cash equivalents | $ | 2.9 | | | $ | 11.7 | |
| | | |
| Accounts receivable, net of allowances | — | | | 3.6 | |
| Other receivables | — | | | 5.2 | |
| Inventories | 17.1 | | | 264.7 | |
| Prepaid expenses | — | | | 18.0 | |
| Other current assets | — | | | 14.4 | |
| Total current assets of discontinued operations | $ | 20.0 | | | $ | 317.6 | |
| | | |
| Property, plant, and equipment, net | 3.1 | | | 158.4 | |
| Operating lease right-of-use assets | — | | | 9.6 | |
| Goodwill | 7.4 | | | 108.4 | |
| Other intangible assets, net | — | | | 29.0 | |
| Deferred income taxes | — | | | 5.2 | |
| Other assets | — | | | 0.5 | |
| Total non-current assets of discontinued operations | $ | 10.5 | | | $ | 311.1 | |
| Accounts payable | $ | — | | | $ | 14.8 | |
| Accrued and other liabilities | 1.8 | | | 112.7 | |
| Operating lease liabilities | — | | | 2.0 | |
| Total current liabilities of discontinued operations | $ | 1.8 | | | $ | 129.5 | |
| | | |
| | | |
| | | |
| Operating lease liabilities | — | | | 7.8 | |
| Uncertain tax positions | — | | | 4.3 | |
| | | |
| Other liabilities | — | | | 13.0 | |
| Total non-current liabilities of discontinued operations | $ | — | | | $ | 25.1 | |
Cash flows attributable to the Company's discontinued operations are included in the Company's consolidated condensed statements of cash flows. Significant non-cash operating and investing activities attributable to discontinued operations consisted of the following (in millions):
| | | | | | | | | | | |
| | Nine Months Ended
September 30, |
| | 2024 | | 2023 |
| Depreciation and amortization | 12.1 | | | 16.2 | |
| Stock-based compensation | 16.7 | | | 11.6 | |
| Inventory write off | 17.0 | | | 13.2 | |
| Capital expenditures | 16.4 | | | 21.0 | |
6. INVESTMENTS
Debt Securities
Investments in debt securities at the end of each period were as follows (in millions):
| | | | | | | | | | | | | | | | | | | | | | | | | | | | | | | | | | | | | | | | | | | | | | | |
| | September 30, 2024 | | December 31, 2023 |
| Held-to-maturity | Amortized Cost | | Gross Unrealized Gains | | Gross Unrealized Losses | | Fair Value | | Amortized Cost | | Gross Unrealized Gains | | Gross Unrealized Losses | Fair Value |
| Bank time deposits | $ | 50.5 | | | $ | — | | | $ | — | | | $ | 50.5 | | | $ | 64.5 | | | $ | — | | | $ | — | | | $ | 64.5 | |
| | | | | | | | | | | | | | | |
| | | | | | | | | | | | | | | |
| | | | | | | | | | | | | | | |
| | | | | | | | | | | | | | | |
| | | | | | | | | | | | | | | |
| | | | | | | | | | | | | | | |
| | | | | | | | | | | | | | | |
| | | | | | | | | | | | | | | |
| Available-for-sale | | | | | | | | | | | | | | | |
| Bank time deposits | $ | 17.6 | | | $ | — | | | $ | — | | | $ | 17.6 | | | $ | — | | | $ | — | | | $ | — | | | $ | — | |
| Commercial paper | 112.9 | | | — | | | — | | | 112.9 | | | — | | | — | | | — | | | — | |
| U.S. government and agency securities | 185.2 | | | 0.1 | | | (1.2) | | | 184.1 | | | 72.7 | | | 0.1 | | | (2.8) | | | 70.0 | |
| | | | | | | | | | | | | | | |
| Asset-backed securities | 80.2 | | | — | | | (1.6) | | | 78.6 | | | 192.1 | | | — | | | (7.8) | | | 184.3 | |
| Corporate debt securities | 502.2 | | | 0.1 | | | (4.0) | | | 498.3 | | | 658.5 | | | — | | | (16.7) | | | 641.8 | |
| Municipal securities | 2.8 | | | — | | | (0.1) | | | 2.7 | | | 2.8 | | | — | | | (0.2) | | | 2.6 | |
| Total | $ | 900.9 | | | $ | 0.2 | | | $ | (6.9) | | | $ | 894.2 | | | $ | 926.1 | | | $ | 0.1 | | | $ | (27.5) | | | $ | 898.7 | |
The cost and fair value of investments in debt securities, by contractual maturity, as of September 30, 2024, were as follows:
| | | | | | | | | | | | | | | | | | | | | | | |
| Held-to-Maturity | | Available-for-Sale |
| | Amortized Cost | | Fair Value | | Amortized Cost | | Fair Value |
| | (in millions) |
| Due in 1 year or less | $ | 50.5 | | | $ | 50.5 | | | $ | 721.1 | | | $ | 719.2 | |
| Due after 1 year through 5 years | — | | | — | | | 81.4 | | | 79.2 | |
| | | | | | | |
| | | | | | | |
Instruments not due at a single maturity date (a) | — | | | — | | | 98.4 | | | 95.8 | |
| $ | 50.5 | | | $ | 50.5 | | | $ | 900.9 | | | $ | 894.2 | |
_______________________________________
(a) Consists of mortgage-backed and asset-backed securities.
Actual maturities may differ from the contractual maturities due to call or prepayment rights.
The following tables present gross unrealized losses and fair values for those investments that were in an unrealized loss position as of September 30, 2024 and December 31, 2023, aggregated by investment category and the length of time that individual securities have been in a continuous loss position (in millions):
| | | | | | | | | | | | | | | | | | | | | | | | | | | | | | | | | | | |
| September 30, 2024 |
| Less than 12 Months | | 12 Months or Greater | | Total |
| Fair Value | | Gross Unrealized Losses | | Fair Value | | Gross Unrealized Losses | | Fair Value | | Gross Unrealized Losses |
| | | | | | | | | | | |
| | | | | | | | | | | |
| U.S. government and agency securities | $ | — | | | $ | — | | | $ | 34.0 | | | $ | (1.2) | | | $ | 34.0 | | | $ | (1.2) | |
| | | | | | | | | | | |
| Asset-backed securities | 3.6 | | | (0.1) | | | 65.3 | | | (1.5) | | | 68.9 | | | (1.6) | |
| Corporate debt securities | — | | | — | | | 193.0 | | | (4.0) | | | 193.0 | | | (4.0) | |
| Municipal securities | — | | | — | | | 2.7 | | | (0.1) | | | 2.7 | | | (0.1) | |
| $ | 3.6 | | | $ | (0.1) | | | $ | 295.0 | | | $ | (6.8) | | | $ | 298.6 | | | $ | (6.9) | |
| | | | | | | | | | | | | | | | | | | | | | | | | | | | | | | | | | | |
| | | | | | | | | | | |
| December 31, 2023 |
| Less than 12 Months | | 12 Months or Greater | | Total |
| Fair Value | | Gross Unrealized Losses | | Fair Value | | Gross Unrealized Losses | | Fair Value | | Gross Unrealized Losses |
| | | | | | | | | | | |
| | | | | | | | | | | |
| U.S. government and agency securities | $ | — | | | $ | — | | | $ | 67.1 | | | $ | (2.8) | | | $ | 67.1 | | | $ | (2.8) | |
| | | | | | | | | | | |
| Asset-backed securities | 10.2 | | | (1.8) | | | 172.7 | | | (6.0) | | | 182.9 | | | (7.8) | |
| Corporate debt securities | 25.0 | | | (0.1) | | | 601.3 | | | (16.6) | | | 626.3 | | | (16.7) | |
| Municipal securities | — | | | — | | | 2.6 | | | (0.2) | | | 2.6 | | | (0.2) | |
| $ | 35.2 | | | $ | (1.9) | | | $ | 843.7 | | | $ | (25.6) | | | $ | 878.9 | | | $ | (27.5) | |
The Company reviews its investments in debt securities to determine if there has been an other-than-temporary decline in fair value. Consideration is given to 1) the financial condition and near-term prospects of the issuer, including the credit quality of the security's issuer, 2) the Company's intent to sell the security, and 3) whether it is more likely than not the Company will have to sell the security before recovery of its amortized cost. The unrealized losses on the debt securities were largely due to changes in interest rates, not credit quality, and as of September 30, 2024, the Company did not intend to sell the securities, and it was not more likely than not that it will be required to sell the securities before recovery of the unrealized losses, and, therefore, the unrealized losses are considered temporary.
Investments in Unconsolidated Entities
The Company has a number of equity investments in unconsolidated entities. These investments are recorded in Long-term Investments on the consolidated condensed balance sheets, and are as follows:
| | | | | | | | | | | |
| | September 30,
2024 | | December 31,
2023 |
| | (in millions) |
| Equity method investments | | | |
| Carrying value of equity method investments | $ | 32.3 | | | $ | 33.6 | |
| Equity securities | | | |
| Carrying value of marketable equity securities | 7.4 | | | — | |
| Carrying value of non-marketable equity securities | 104.9 | | | 87.6 | |
| Total investments in unconsolidated entities | $ | 144.6 | | | $ | 121.2 | |
The Company makes equity investments in limited liability companies that invest in qualified community development entities ("CDEs") through the New Markets Tax Credit ("NMTC") program. The NMTC program provides federal tax incentives to investors to make investments in distressed communities and promotes economic improvements through the development of successful businesses in these communities. The NMTC is equal to 39% of the qualified investment and is taken over seven years. These limited liability companies are variable interest entities ("VIEs"). The Company determined that it is not the primary beneficiary of the VIEs because it does not have the power to direct the activities that most significantly impact the economic performance of the VIEs and, therefore, the Company does not consolidate these entities. Instead, the NMTC investments are accounted for as equity method investments.
Marketable equity securities consist of investments with readily determinable fair values over which we do not own a controlling interest or exercise significant influence. Non-marketable equity securities consist of investments in privately held companies without readily determinable fair values, and are reported at cost minus impairment, if any, plus or minus changes resulting from observable price changes in orderly transactions for the identical or similar investment of the same issuer. The Company recorded an upward adjustment of $0.5 million and a downward adjustment of $2.4 million during the nine months ended September 30, 2024 based on observable price changes. As of September 30, 2024, the Company had recorded cumulative upward adjustments of $9.3 million based on observable price changes, and cumulative downward adjustments of $5.5 million due to impairments and observable price changes.
During the three and nine months ended September 30, 2024, the gross realized gains or losses from sales of available-for-sale investments were not material.
7. INVESTMENTS IN VARIABLE INTEREST ENTITIES
The Company reviews its investments in other entities to determine whether the Company is the primary beneficiary of a VIE. The Company would be the primary beneficiary of the VIE, and would be required to consolidate the VIE, if it has the power to direct the significant activities of the entity and the obligation to absorb losses or receive benefits from the entity that may be significant to the VIE. The Company's maximum loss exposure to variable interest entities, prior to the exercise of options to acquire the entities, is limited to its investment in the variable interest entities, which include equity investments, options to acquire, and promissory notes.
Consolidated VIEs
In February 2023, the Company acquired a majority equity interest in a medical technology company pursuant to a preferred stock purchase agreement, and amended and restated a previous option agreement to acquire the remaining equity interest. Edwards concluded that it is the primary beneficiary and consolidated the VIE. The total assets and liabilities of the Company's consolidated VIE was $258.1 million and $26.7 million, respectively, as of September 30, 2024, and were $272.1 million and $31.5 million, respectively, as of December 31, 2023. The assets of the VIE can only be used to settle obligations of the VIE and general creditors have no recourse to the Company.
Unconsolidated VIEs
Edwards has relationships with various VIEs that it does not consolidate as Edwards lacks the power to direct the activities that significantly impact the economic success of these entities.
In June 2022, the Company entered into a convertible promissory note and amended its existing warrant agreement with a medical device company. Under the convertible promissory note agreement, the Company agreed to loan the medical device company up to $47.5 million, of which $42.5 million had been advanced as of September 30, 2024. The remaining $5.0 million was advanced in October 2024. In addition, in 2019, the Company paid $35.0 million for an option to acquire the medical device company. The option and the note receivable are included in Other Assets on the consolidated balance sheets.
In April 2021, the Company entered into a promissory note agreement, a preferred stock purchase agreement, and an option agreement with a privately-held medical device company (the "Investee"). The secured promissory note provides for borrowings up to $45.0 million. At both September 30, 2024 and December 31, 2023, the Company had advanced $30.0 million under the promissory note (included in Other Assets). As of September 30, 2024 and December 31, 2023, the Company had invested $42.8 million and $39.3 million, respectively, in the Investee's preferred equity securities (included in Long-term Investments) and had paid $20.9 million and $13.1 million, respectively, for an option to acquire the Investee (included in Other Assets). Pursuant to the agreements, the Company may be required to invest up to an additional $3.0 million in the Investee's preferred equity securities and up to an additional $6.6 million for the option to acquire the Investee.
In March 2023, the Company agreed to pay a medical device company up to $45.0 million as consideration for an option
to acquire that medical device company, of which $30.0 million had been paid as of September 30, 2024. Also, in March 2023, Edwards advanced $5.0 million to the medical device company under a convertible promissory note. In addition, as of September 30, 2024 and December 31, 2023, the Company had invested $3.5 million and $3.3 million, respectively, in the medical device company's preferred equity securities. The option and the note are included in Other Assets on the consolidated balance sheets, and the equity investment is included in Long-term Investments. In July 2024, the Company exercised its option to acquire the medical device company and the transaction closed in October 2024. For more information, see Note 18.
In addition, Edwards has made equity investments through the NMTC program in limited liability companies that are considered VIEs. For more information, see Note 6.
8. BUSINESS COMBINATIONS
Endotronix, Inc.
On August 19, 2024, the Company acquired all the remaining outstanding shares of Endotronix, Inc. ("Endotronix"). Endotronix is a developer of an implantable sensor for management of heart failure patients. The acquisition was completed primarily to expand the Company's structural heart portfolio into a new therapeutic area to address the large unmet needs of patients suffering from heart failure.
Prior to the acquisition date, the Company had previously paid $60.0 million for an option to acquire Endotronix, which was historically recorded in Other Assets using the measurement alternative for fair value, and had an existing preferred stock investment in Endotronix of $10.0 million, which represented an ownership interest in Endotronix of approximately 7% (collectively, the "previously held equity interest"). In July 2024, the Company exercised its option to acquire the remaining equity interest in Endotronix which was accounted for as a step acquisition in accordance with Accounting Standards Codification Topic 805, "Business Combinations." Accordingly, the Company allocated the purchase price of the acquired company to the net tangible assets and intangible assets acquired based upon their preliminary estimated fair values. The Company remeasured the previously held equity interest to its fair value, as of the date of acquisition. The Company considered multiple factors in determining the fair value of the previously held equity interest, including, (i) the price negotiated with the selling shareholders for the remaining 93% interest in Endotronix and (ii) an income approach valuation model. As a result of the remeasurement of the previously held equity interest, the Company recognized a gain of $24.6 million in Other income, net in the third quarter of 2024.
The purchase consideration for the acquisition of Endotronix was $798.8 million, which consisted of cash consideration of $649.1 million (net of cash acquired of $1.2 million), the fair value of the Company's previously held equity interest of $94.6 million, and the settlement of pre-existing relationships of $53.1 million. In addition, the Company agreed to pay an additional $2.0 million in a pre-specified milestone-driven payment that is dependent on the receipt of CE Mark approval for the CorPASS before June 30, 2025. The Company recognized a $2.0 million contingent consideration liability for the estimated fair value of the contingent milestone payments. The fair value of the contingent milestone payment will be remeasured each quarter, with changes in the fair value recognized within operating expenses on the consolidated statements of operations.
In connection with the acquisition of Endotronix, the Company placed $35.0 million of the cash consideration paid at closing into escrow to satisfy any claims for indemnification made in accordance with the merger agreement and for purchase price adjustments. Acquisition-related costs of $5.6 million were recorded in Selling, General, and Administrative Expenses during the nine months ended September 30, 2024.
The following table summarizes the fair value of consideration transferred and the fair values of the assets acquired and liabilities assumed (in millions):
| | | | | | | | | | | |
| Cash consideration paid at closing | | $ | 650.3 | | |
| Settlement of pre-existing relationships | | 53.1 | | |
| Fair value of previously held equity interest | | 94.6 | | |
| Fair value of contingent consideration | | 2.0 | | |
| Total purchase price | | 800.0 | | |
| Less: cash acquired | | (1.2) | | |
| Total purchase price, net of cash acquired | | $ | 798.8 | | |
| | | |
| Current assets | | $ | 7.7 | | |
| Property and equipment, net | | 12.6 | | |
| Goodwill | | 412.0 | | |
| In-process research and development | | 69.0 | | |
| Developed technology | | 385.0 | | |
| Operating lease right-of-use assets | | 9.9 | | |
| | | |
| Other assets | | 0.7 | | |
| Liabilities assumed | | (26.3) | | |
| Deferred tax liabilities | | (70.6) | | |
| Net assets acquired | | 800.0 | | |
| Less: cash acquired | | (1.2) | | |
| Total purchase price, net of cash acquired | | $ | 798.8 | | |
The above purchase price allocation is preliminary and subject to revision for a one-year measurement period following the date of acquisition as additional information about the fair value of individual assets and liabilities becomes available. The preliminary measurement of intangible assets, goodwill, and deferred income taxes are subject to change. A change in the estimated fair value of the net assets acquired will change the amount of the purchase price allocable to goodwill.
Goodwill includes Endotronix's assembled workforce and expected synergies the Company believes will result from the acquisition. Goodwill was assigned to the Company’s United States segment and is not deductible for tax purposes. The fair value of the developed technology was determined using the income approach. This approach determines fair value based on cash flow projections which are discounted to present value using a risk-adjusted rate of return. The discount rate used to determine the fair value of the developed technology was 15.5%. The fair value of the IPR&D was also determined using the income approach. IPR&D has been capitalized at fair value as an intangible asset with an indefinite life and will be assessed for impairment in subsequent periods. The discount rate used to determine the fair value of the IPR&D was 18.0%. Completion of successful design developments, bench testing, pre-clinical studies and human clinical studies are required prior to selling any product. The risks and uncertainties associated with completing development within a reasonable period of time include those related to the design, development, and manufacturability of the product, the success of pre-clinical and clinical studies, and the timing of regulatory approvals. The valuation assumed $47.1 million of additional research and development expenditures would be incurred prior to the date of product introduction. In the valuation, net cash inflows were modeled to commence in the United States in 2027 and in Japan and Europe in 2028. Upon completion of development, the underlying research and development asset will be amortized over its estimated useful life.
The results of operations for Endotronix have been included in the accompanying consolidated financial statements from the date of acquisition. Pro forma results have not been presented as the results of Endotronix are not material in relation to the consolidated financial statements of Edwards Lifesciences.
JC Medical, Inc.
On July 22, 2024, the Company acquired all the outstanding shares of JC Medical, Inc. ("JC Medical") for purchase consideration of $116.3 million, net of cash acquired. In addition, the Company agreed to pay up to an additional $200.0 million in pre-specified milestone-driven payments over the next 12 years. The Company recognized a $1.8 million contingent consideration liability for the estimated fair value of the contingent milestone payments. The fair value of the contingent milestone payments will be remeasured each quarter, with changes in the fair value recognized within operating expenses on the consolidated statements of operations.
The Company placed $12.0 million of the cash consideration paid at closing into escrow to satisfy any claims for indemnification made in accordance with the merger agreement. Any funds remaining 15 months after the acquisition date will be disbursed to JC Medical's former shareholders. Acquisition-related costs of $1.6 million were recorded in Selling, General, and Administrative Expenses during the nine months ended September 30, 2024.
JC Medical, Inc. is a structural heart company that is primarily engaged in the design and development of transcatheter valve replacement products for the minimally invasive treatment of structural heart disease. The acquisition was completed primarily to expand the Company's TAVR portfolio to enable the treatment of patients with aortic regurgitation. The acquisition was accounted for as a business combination. Tangible and intangible assets acquired were recorded based on their estimated fair values at the acquisition date. The excess of the purchase price over the fair value of net assets acquired was recorded to goodwill.
The following table summarizes the fair value of consideration transferred and the fair values of the assets acquired and liabilities assumed (in millions):
| | | | | | | | | | | |
| Cash consideration paid at closing | | $ | 114.8 | | |
| | | |
| | | |
| Fair value of contingent consideration | | 1.8 | | |
| Total purchase price | | 116.6 | | |
| Less: cash acquired | | (0.3) | | |
| Total purchase price, net of cash acquired | | $ | 116.3 | | |
| | | |
| Current assets | | $ | 0.3 | | |
| Property and equipment, net | | 0.3 | | |
| Goodwill | | 46.9 | | |
| In-process research and development | | 86.6 | | |
| | | |
| | | |
| | | |
| | | |
| Current liabilities assumed | | (1.0) | | |
| Deferred tax liabilities | | (16.5) | | |
| Net assets acquired | | 116.6 | | |
| Less: cash acquired | | (0.3) | | |
| Total purchase price, net of cash acquired | | $ | 116.3 | | |
The above purchase price allocation is preliminary and subject to revision for a one-year measurement period following the date of acquisition as additional information about the fair value of individual assets and liabilities becomes available. The preliminary measurement of intangible assets, goodwill, and deferred income taxes are subject to change. A change in the estimated fair value of the net assets acquired will change the amount of the purchase price allocable to goodwill.
Goodwill includes JC Medical's assembled workforce and expected synergies the Company believes will result from the acquisition. Goodwill was assigned to the Company’s United States segment and is not deductible for tax purposes. IPR&D has been capitalized at fair value as an intangible asset with an indefinite life and will be assessed for impairment in subsequent periods. The fair value of the IPR&D was determined using the income approach. This approach determines fair value based on cash flow projections which are discounted to present value using a risk-adjusted rate of return. The discount rate used to determine the fair value of the IPR&D was 15.0%. Completion of successful design developments, bench testing, pre-clinical studies and human clinical studies are required prior to selling any product. The risks and uncertainties associated with completing development within a reasonable period of time include those related to the design, development, and manufacturability of the product, the success of pre-clinical and clinical studies, and the timing of regulatory approvals. The valuation assumed $55.8 million of additional research and development expenditures would be incurred prior to the date of product introduction. In the valuation, net cash inflows were modeled to commence in the United States in 2028 and Europe in 2029. Upon completion of development, the underlying research and development asset will be amortized over its estimated useful life.
The results of operations for JC Medical have been included in the accompanying consolidated financial statements from the date of acquisition. Pro forma results have not been presented as the results of JC Medical are not material in relation to the consolidated financial statements of Edwards Lifesciences.
9. FAIR VALUE MEASUREMENTS
Fair value is defined as the price that would be received to sell an asset or paid to transfer a liability in an orderly transaction between market participants. The Company prioritizes the inputs used to determine fair values in one of the following three categories:
Level 1—Quoted market prices in active markets for identical assets or liabilities.
Level 2—Inputs, other than quoted prices in active markets, that are observable, either directly or indirectly.
Level 3—Unobservable inputs that are not corroborated by market data.
In certain cases, the inputs used to measure fair value may fall into different levels of the fair value hierarchy. In such cases, the level in the fair value hierarchy within which the fair value measurement in its entirety falls has been determined based on the lowest level input that is significant to the fair value measurement in its entirety.
The consolidated condensed financial statements include financial instruments for which the fair market value of such instruments may differ from amounts reflected on a historical cost basis. Financial instruments of the Company consist of cash deposits, accounts and other receivables, investments, accounts payable, certain accrued liabilities, and borrowings under a revolving credit agreement. The carrying value of these financial instruments generally approximates fair value due to their short-term nature. Financial instruments also include notes payable. As of September 30, 2024, the fair value of the notes payable, based on Level 2 inputs, was $600.0 million.
Assets and Liabilities Measured at Fair Value on a Recurring Basis
The following table summarizes the Company's financial instruments which are measured at fair value on a recurring basis (in millions):
| | | | | | | | | | | | | | | | | | | | | | | |
| September 30, 2024 | Level 1 | | Level 2 | | Level 3 | | Total |
| Assets | | | | | | | |
| Cash equivalents | $ | 2,287.8 | | | $ | 852.3 | | | $ | — | | | $ | 3,140.1 | |
| Available-for-sale investments: | | | | | | | |
| Bank time deposits | — | | | 17.6 | | | — | | | 17.6 | |
| Corporate debt securities | — | | | 498.3 | | | — | | | 498.3 | |
| Asset-backed securities | — | | | 78.6 | | | — | | | 78.6 | |
| United States government and agency securities | 49.3 | | | 134.8 | | | — | | | 184.1 | |
| | | | | | | |
| Commercial paper | — | | | 112.9 | | | — | | | 112.9 | |
| Municipal securities | — | | | 2.7 | | | — | | | 2.7 | |
| Equity investments in unconsolidated entities | 7.5 | | | — | | | — | | | 7.5 | |
| Investments held for deferred compensation plans | 143.9 | | | — | | | — | | | 143.9 | |
| Derivatives | — | | | 27.6 | | | — | | | 27.6 | |
| $ | 2,488.5 | | | $ | 1,724.8 | | | $ | — | | | $ | 4,213.3 | |
| Liabilities | | | | | | | |
| Derivatives | $ | — | | | $ | 24.3 | | | $ | — | | | $ | 24.3 | |
| | | | | | | |
| Contingent consideration liabilities | — | | | — | | | 3.8 | | | 3.8 | |
| Other | — | | | — | | | 5.0 | | | 5.0 | |
| $ | — | | | $ | 24.3 | | | $ | 8.8 | | | $ | 33.1 | |
| December 31, 2023 | | | | | | | |
| Assets | | | | | | | |
| Cash equivalents | $ | 579.2 | | | $ | — | | | $ | — | | | $ | 579.2 | |
| Available-for-sale investments: | | | | | | | |
| | | | | | | |
| Corporate debt securities | — | | | 641.8 | | | — | | | 641.8 | |
| Asset-backed securities | — | | | 184.3 | | | — | | | 184.3 | |
| United States government and agency securities | — | | | 70.0 | | | — | | | 70.0 | |
| | | | | | | |
| | | | | | | |
| Municipal securities | — | | | 2.6 | | | — | | | 2.6 | |
| | | | | | | |
| Investments held for deferred compensation plans | 125.8 | | | — | | | — | | | 125.8 | |
| Derivatives | — | | | 39.5 | | | — | | | 39.5 | |
| $ | 705.0 | | | $ | 938.2 | | | $ | — | | | $ | 1,643.2 | |
| Liabilities | | | | | | | |
| Derivatives | $ | — | | | $ | 15.2 | | | $ | — | | | $ | 15.2 | |
| | | | | | | |
| | | | | | | |
| Other | — | | | — | | | 10.3 | | | 10.3 | |
| $ | — | | | $ | 15.2 | | | $ | 10.3 | | | $ | 25.5 | |
Cash Equivalents and Available-for-sale Investments
Cash equivalents included money market funds for the periods presented above. The Company estimates the fair values of its money market funds based on quoted prices in active markets for identical assets. The Company estimates the fair values of its corporate debt securities, asset-backed securities, commercial paper, United States and foreign government and agency securities, and municipal securities by taking into consideration valuations obtained from third-party pricing services. The pricing services use industry standard valuation models, including both income and market-based approaches, for which all significant inputs are observable, either directly or indirectly, to estimate fair value. These inputs include reported trades and broker-dealer quotes on the same or similar securities, benchmark yields, credit spreads, prepayment and default projections based on historical data, and other observable inputs. The Company independently reviews and validates the pricing received from the third-party pricing service by comparing the prices to prices reported by a secondary pricing source. The Company’s validation procedures have not resulted in an adjustment to the pricing received from the pricing service.
Deferred Compensation Plans
The Company holds investments related to its deferred compensation plans. The investments are in a variety of stock, bond and money market mutual funds. The fair values of these investments are based on quoted market prices.
Derivative Instruments
The Company uses derivative financial instruments in the form of foreign currency forward exchange contracts and cross-currency swap contracts to manage foreign currency exposures. All derivative instruments are recognized on the balance sheet at their fair value, which was measured using quoted foreign exchange rates, interest rates, yield curves, and cross-currency swap basis rates. The estimates presented herein are not necessarily indicative of the amounts that the Company could realize in a current market exchange.
Contingent Consideration Liabilities
Certain of the Company's acquisitions involve contingent consideration arrangements. Payment of additional consideration is contingent upon the acquired company reaching certain performance milestones, such as attaining specified sales levels or obtaining regulatory approvals. These contingent consideration liabilities are measured at estimated fair value using either a probability weighted discounted cash flow analysis or a Monte Carlo simulation model, both of which consider significant unobservable inputs. These inputs include (1) the discount rate used to present value the projected cash flows
(ranging from 0.0% to 11.7%; with a weighted average of 5.6%), (2) the probability of milestone achievement (ranging from 60% to 100%; with a weighted average of 80.9%), (3) the projected payment dates (ranging from 2025 to 2032; with a weighted average of 2029), and (4) the volatility of future revenue (27%). The weighted average of each of the above inputs was determined based on the relative fair value of each obligation. The use of different assumptions could have a material effect on the estimated fair value amounts.
The following tables summarize the changes in fair value of Level 3 financial instruments measured at fair value on a recurring basis (in millions): | | | | | | | | | | | | | | | | | |
| | Contingent Consideration | | Other | | Total |
| Balance at December 31, 2023 | $ | — | | | $ | 10.3 | | | $ | 10.3 | |
| Additions | 3.8 | | | — | | | 3.8 | |
| Payments | — | | | — | | | — | |
| Changes in fair value | — | | | (5.3) | | | (5.3) | |
| | | | | |
| Balance at September 30, 2024 | $ | 3.8 | | | $ | 5.0 | | | $ | 8.8 | |
| | | | | |
| Contingent Consideration | | Other | | Total |
| Balance at December 31, 2022 | $ | 26.2 | | | $ | 14.0 | | | $ | 40.2 | |
| | | | | |
| | | | | |
| Changes in fair value | (26.2) | | | (3.7) | | | (29.9) | |
| | | | | |
| Balance at September 30, 2023 | $ | — | | | $ | 10.3 | | | $ | 10.3 | |
10. DERIVATIVE INSTRUMENTS AND HEDGING ACTIVITIES
The Company uses derivative financial instruments to manage its currency exchange rate risk and its interest rate risk as summarized below. Notional amounts are stated in United States dollar equivalents at spot exchange rates at the respective dates. The Company does not enter into these arrangements for trading or speculation purposes.
| | | | | | | | | | | |
| | Notional Amount |
| | September 30,
2024 | | December 31, 2023 |
| | (in millions) |
| Foreign currency forward exchange contracts | $ | 2,219.8 | | | $ | 1,460.3 | |
| Cross-currency swap contracts | 300.0 | | | 300.0 | |
| | | |
Derivative financial instruments involve credit risk in the event the counterparty should default. It is the Company's policy to execute such instruments with global financial institutions that the Company believes to be creditworthy. The Company diversifies its derivative financial instruments among counterparties to minimize exposure to any one of these entities. The Company also uses International Swap Dealers Association master-netting agreements. The master-netting agreements provide for the net settlement of all contracts through a single payment in a single currency in the event of default, as defined by the agreements.
The Company uses foreign currency forward exchange contracts and cross-currency swap contracts to manage its exposure to changes in currency exchange rates from (a) future cash flows associated with intercompany transactions and certain local currency expenses expected to occur within approximately one year (designated as cash flow hedges), (b) its net investment in certain foreign subsidiaries (designated as net investment hedges) and (c) foreign currency denominated assets or liabilities (designated as fair value hedges). The Company also uses foreign currency forward exchange contracts that are not designated as hedging instruments to offset the transaction gains and losses associated with revaluation of certain assets and liabilities denominated in currencies other than their functional currencies (resulting principally from intercompany and local currency transactions).
All derivative financial instruments are recognized at fair value in the consolidated condensed balance sheets. For each derivative instrument that is designated as a fair value hedge, the gain or loss on the derivative included in the assessment of hedge effectiveness is recognized immediately to earnings and offsets the loss or gain on the underlying hedged item. The Company reports in Accumulated Other Comprehensive Loss the gain or loss on derivative financial instruments that are designated, and that qualify, as cash flow hedges. The Company reclassifies these gains and losses into earnings in the same line item and in the same period in which the underlying hedged transactions affect earnings. Changes in the fair value of net investment hedges are reported in Accumulated Other Comprehensive Loss as a part of the cumulative translation adjustment and would be reclassified into earnings if the underlying net investment is sold or substantially liquidated. The portion of the change in fair value related to components excluded from the hedge effectiveness assessment are amortized into earnings over the life of the derivative. The gains and losses on derivative financial instruments for which the Company does not elect hedge accounting treatment are recognized in the consolidated statements of operations in each period based upon the change in the fair value of the derivative financial instrument. Cash flows from net investment hedges are reported as investing activities in the consolidated statements of cash flows, and cash flows from all other derivative financial instruments are reported as operating activities.
The following table presents the location and fair value amounts of derivative instruments reported in the consolidated condensed balance sheets (in millions):
| | | | | | | | | | | | | | | | | | | | |
| | | | | Fair Value |
| Derivatives designated as hedging instruments | | Balance Sheet
Location | | September 30,
2024 | | December 31, 2023 |
| Assets | | | | | | |
| Foreign currency contracts | | Other current assets | | $ | 5.8 | | | $ | 16.1 | |
| | | | | | |
| Cross-currency swap contracts | | Other assets | | $ | 21.8 | | | $ | 23.4 | |
| | | | | | |
| Liabilities | | | | | | |
| | | | | | |
| Foreign currency contracts | | Accrued and other liabilities | | $ | 21.2 | | | $ | 15.2 | |
| | | | | | |
| | | | | | |
| Derivatives not designated as hedging instruments | | | | | | |
| | | | | | |
| | | | | | |
| | | | | | |
| Liabilities | | | | | | |
| Foreign currency contracts | | Accrued and other liabilities | | $ | 3.1 | | | $ | — | |
The following table presents the effect of master-netting agreements and rights of offset on the consolidated condensed balance sheets (in millions):
| | | | | | | | | | | | | | | | | | | | | | | | | | | | | | | | | | | |
| | | | | | | | Gross Amounts
Not Offset in
the Consolidated
Balance Sheet | | |
| | | | Gross Amounts
Offset in the
Consolidated
Balance Sheet | | | | |
| | | | Net Amounts
Presented in the
Consolidated
Balance Sheet | | |
| September 30, 2024 | Gross
Amounts | | Financial
Instruments | | Cash
Collateral
Received | | Net
Amount |
| Derivative assets | | | | | | | | | | | |
| Foreign currency contracts | $ | 5.8 | | | $ | — | | | $ | 5.8 | | | $ | (3.8) | | | $ | — | | | $ | 2.0 | |
| Cross-currency swap contracts | $ | 21.8 | | | $ | — | | | $ | 21.8 | | | $ | — | | | $ | — | | | $ | 21.8 | |
| Derivative liabilities | | | | | | | | | | | |
| Foreign currency contracts | $ | 24.3 | | | $ | — | | | $ | 24.3 | | | $ | (3.8) | | | $ | — | | | $ | 20.5 | |
| | | | | | | | | | | |
| December 31, 2023 | | | | | | | | | | | |
| Derivative assets | | | | | | | | | | | |
| Foreign currency contracts | $ | 16.1 | | | $ | — | | | $ | 16.1 | | | $ | (9.4) | | | $ | — | | | $ | 6.7 | |
| Cross-currency swap contracts | $ | 23.4 | | | $ | — | | | $ | 23.4 | | | $ | — | | | $ | — | | | $ | 23.4 | |
| Derivative liabilities | | | | | | | | | | | |
| Foreign currency contracts | $ | 15.2 | | | $ | — | | | $ | 15.2 | | | $ | (9.4) | | | $ | — | | | $ | 5.8 | |
The following tables present the effect of derivative and non-derivative hedging instruments on the consolidated condensed statements of operations and consolidated condensed statements of comprehensive income (in millions):
| | | | | | | | | | | | | | | | | | | | | | | | | | |
| | | Amount of Gain or (Loss) Recognized in Other Comprehensive Income on Derivative
(Effective Portion) |
| | | Three Months Ended
September 30, | | Nine Months Ended
September 30, |
| | |
| | 2024 | | 2023 | | 2024 | | 2023 |
| Cash flow hedges | | | | | | | | |
| Foreign currency contracts | | $ | (40.9) | | | $ | 33.5 | | | $ | 17.0 | | | $ | 60.4 | |
| Net investment hedges | | | | | | | | |
| Cross-currency swap contracts | | $ | (8.7) | | | $ | 3.8 | | | $ | (1.6) | | | $ | (5.2) | |
The cross-currency swap contracts have an expiration date of June 15, 2028. At the maturity of the cross-currency swap contracts, the Company will deliver the notional amount of €257.2 million and will receive $300.0 million from the counterparties. The Company receives semi-annual interest payments from the counterparties based on a fixed interest rate until maturity of the agreements.
The following tables present the effect of derivative instruments on the consolidated condensed statements of operations (in millions):
| | | | | | | | | | | | | | | | | | | | | | | | | | | | | | | | | | | | | | | |
| | Location and Amount of Gain or (Loss) Recognized in Income |
| | Three Months Ended
September 30, 2024 | | Nine Months Ended
September 30, 2024 |
| | Cost of sales | | | | Interest income, net | | Other non-operating income, net | | Cost of sales | | | | Interest income, net | | Other non-operating income, net |
| | | | | |
| Total amounts presented in the consolidated condensed statements of operations | $ | (262.9) | | | | | $ | 24.3 | | | $ | 27.9 | | | $ | (825.3) | | | | | $ | 56.3 | | | $ | 35.6 | |
| The effects of fair value hedges: | | | | | | | | | | | | | | | |
| Foreign currency contracts: | | | | | | | | | | | | | | | |
| Hedged items | $ | — | | | | | $ | — | | | $ | — | | | $ | — | | | | | $ | — | | | $ | (4.0) | |
| Derivatives designated as hedging instruments | $ | — | | | | | $ | — | | | $ | — | | | $ | — | | | | | $ | — | | | $ | 4.0 | |
| Amount excluded from effectiveness testing (amortized) | $ | — | | | | | $ | — | | | $ | — | | | $ | — | | | | | $ | — | | | $ | 0.8 | |
| The effects of cash flow hedges: | | | | | | | | | | | | | | | |
| Foreign currency contracts: | | | | | | | | | | | | | | | |
| Amount of gain (loss) reclassified from accumulated other comprehensive loss into income | $ | 17.0 | | | | | $ | — | | | $ | — | | | $ | 31.9 | | | | | $ | — | | | $ | — | |
| The effects of net investment hedges: | | | | | | | | | | | | | | | |
| Cross currency swap contracts: | | | | | | | | | | | | | | | |
| Amount excluded from effectiveness testing | $ | — | | | | | $ | 1.6 | | | $ | — | | | $ | — | | | | | $ | 5.1 | | | $ | — | |
| The effects of non-designated hedges: | | | | | | | | | | | | | | | |
| Foreign currency contracts | $ | — | | | | | $ | — | | | $ | (29.6) | | | $ | — | | | | | $ | — | | | $ | 3.7 | |
| | | | | | | | | | | | | | | | | | | | | | | | | | | | | | | | | | | | | | | |
| | Location and Amount of Gain or (Loss) Recognized in Income |
| | Three Months Ended
September 30, 2023 | | Nine Months Ended
September 30, 2023 |
| | Cost of sales | | | | Interest income, net | | Other non-operating income, net | | Cost of sales | | | | Interest income, net | | Other non-operating income, net |
| | | | | |
| Total amounts presented in the consolidated condensed statements of operations | $ | (250.6) | | | | | $ | 15.1 | | | $ | 6.6 | | | $ | (727.4) | | | | | $ | 32.8 | | | $ | 10.3 | |
| The effects of fair value hedges: | | | | | | | | | | | | | | | |
| Foreign currency contracts: | | | | | | | | | | | | | | | |
| Hedged items | $ | — | | | | | $ | — | | | $ | (3.6) | | | $ | — | | | | | $ | — | | | $ | (12.5) | |
| Derivatives designated as hedging instruments | $ | — | | | | | $ | — | | | $ | 3.6 | | | $ | — | | | | | $ | — | | | $ | 12.5 | |
| Amount excluded from effectiveness testing (amortized) | $ | — | | | | | $ | — | | | $ | 1.2 | | | $ | — | | | | | $ | — | | | $ | 3.6 | |
| The effects of cash flow hedges: | | | | | | | | | | | | | | | |
| Foreign currency contracts: | | | | | | | | | | | | | | | |
| Amount of gain (loss) reclassified from accumulated other comprehensive loss into income | $ | 9.3 | | | | | $ | — | | | $ | — | | | $ | 53.0 | | | | | $ | — | | | $ | — | |
| The effects of net investment hedges: | | | | | | | | | | | | | | | |
| Cross currency swap contracts: | | | | | | | | | | | | | | | |
| Amount excluded from effectiveness testing | $ | — | | | | | $ | 1.7 | | | $ | — | | | $ | — | | | | | $ | 5.2 | | | $ | — | |
| The effects of non-designated hedges: | | | | | | | | | | | | | | | |
| Foreign currency contracts | $ | — | | | | | $ | — | | | $ | 14.6 | | | $ | — | | | | | $ | — | | | $ | 19.1 | |
The Company expects that during the next twelve months it will reclassify to earnings a $4.1 million gain currently recorded in Accumulated Other Comprehensive Loss.
11. STOCK-BASED COMPENSATION
Stock-based compensation expense related to awards issued under the Company's incentive compensation plans for the three and nine months ended September 30, 2024 and 2023 was as follows (in millions):
| | | | | | | | | | | | | | | | | | | | | | | |
| | Three Months Ended
September 30, | | Nine Months Ended
September 30, |
| | 2024 | | 2023 | | 2024 | | 2023 |
| Cost of sales | $ | 6.1 | | | $ | 4.7 | | | $ | 20.8 | | | $ | 16.3 | |
| Selling, general, and administrative expenses | 20.4 | | | 17.2 | | | 62.4 | | | 57.3 | |
| Research and development expenses | 8.7 | | | 7.2 | | | 28.3 | | | 23.7 | |
| | | | | | | |
| Total stock-based compensation expense | 35.2 | | | 29.1 | | | 111.5 | | | 97.3 | |
| Income tax benefit | (6.0) | | | (4.7) | | | (17.5) | | | (14.5) | |
| Total stock-based compensation expense, net of tax | $ | 29.2 | | | $ | 24.4 | | | $ | 94.0 | | | $ | 82.8 | |
At September 30, 2024, the total remaining compensation cost related to nonvested stock options, restricted stock units, market-based restricted stock units, and employee stock purchase plan ("ESPP") subscription awards amounted to $289.7 million, which will be amortized on a straight-line basis over each award's requisite service period. The weighted-average remaining requisite service period is 33 months.
On May 7, 2024, the Company’s stockholders approved the amendment and restatement of the Company’s Long-term Stock Incentive Compensation Program (the “Long-term Stock Program”) to (1) increase the total number of shares of the Company’s common stock available for issuance under the Long-term Stock Program by 6.9 million shares to a new total share limit of 334.5 million shares, (2) increase the total number of shares of the Company’s common stock available for issuance as restricted stock and restricted stock unit awards under the Long-term Stock Program by 2.0 million shares to a new limit on the total number of shares available for these types of awards of 35.6 million shares, and (3) extend the term within which new awards may be granted under the Long-term Stock Program through February 21, 2034.
During the nine months ended September 30, 2024, the Company granted 1.5 million stock options at a weighted-average
exercise price per share of $85.94, and 1.9 million restricted stock units at a weighted-average grant-date fair value per share of $85.09. During the nine months ended September 30, 2024, the Company also granted 0.1 million market-based restricted stock units at a weighted-average grant-date fair value per share of $97.66. The market-based restricted stock units granted during the nine months ended September 30, 2024 vest based on a combination of certain service and market conditions. The actual number of shares issued will be determined based on the Company's total shareholder return relative to a selected industry peer group over a three-year performance period and may range from 0% to 175% of the target number of shares granted.
Fair Value Disclosures
The fair value of market-based restricted stock units was determined using a Monte Carlo simulation model, which uses multiple input variables to determine the probability of satisfying the market condition requirements. The weighted-average assumptions used to determine the fair value of the market-based restricted stock units granted during the nine months ended September 30, 2024 and 2023 included a risk-free interest rate of 4.5% and 3.6%, respectively, and an expected volatility rate of 32.4% and 32.6%, respectively.
The following table includes the weighted-average grant-date fair values of stock options granted during the periods indicated and the related weighted-average assumptions used in the Black-Scholes option pricing model:
| | | | | | | | | | | | | | | | | | | | | | | |
Option Awards | Three Months Ended
September 30, | | Nine Months Ended
September 30, |
| | 2024 | | 2023 | | 2024 | | 2023 |
| Risk-free interest rate | 4.2 | % | | 4.3 | % | | 4.5% | | 3.4% |
| Expected dividend yield | None | | None | | None | | None |
| Expected volatility | 31.0 | % | | 32.7 | % | | 30.9% | | 32.8% |
| Expected term (years) | 5.5 | | 5.2 | | 5.3 | | 5.1 |
| Fair value, per option | $ | 32.15 | | | $ | 31.16 | | | $ | 31.30 | | | $ | 31.02 | |
The following table includes the weighted-average grant-date fair values for ESPP subscriptions granted during the periods indicated and the related weighted-average assumptions used in the Black-Scholes option pricing model:
| | | | | | | | | | | | | | | | | | | | | | | |
ESPP | Three Months Ended
September 30, | | Nine Months Ended
September 30, |
| | 2024 | | 2023 | | 2024 | | 2023 |
| Risk-free interest rate | 5.3 | % | | 5.3 | % | | 5.2% | | 4.6% |
| Expected dividend yield | None | | None | | None | | None |
| Expected volatility | 29.5 | % | | 34.8 | % | | 33.5% | | 31.5% |
| Expected term (years) | 0.6 | | 0.6 | | 0.6 | | 0.6 |
| Fair value, per share | $ | 16.51 | | | $ | 18.53 | | | $ | 25.01 | | $ | 19.03 | |
12. ACCELERATED SHARE REPURCHASE
During 2024 and 2023, the Company entered into accelerated share repurchase ("ASR") agreements providing for the repurchase of the Company's common stock based on the volume-weighted average price ("VWAP") of the Company's common stock during the term of the applicable agreements, less a discount. The following table summarizes the terms of the ASR agreements (dollars and shares in millions, except per share data):
| | | | | | | | | | | | | | | | | | | | | | | | | | | | | | | | | | | | | | | | | | | | |
| | | | | Initial Delivery | | Final Settlement |
| Agreement Date | | Amount
Paid | | Shares
Received | | Price per
Share | | Value of
Shares as %
of Contract
Value | | Settlement
Date | | Total Shares
Received | | Average Price
per Share |
| February 2023 | | $ | 200.0 | | | 2.0 | | | $ | 80.44 | | | 80 | % | | March 2023 | | 2.5 | | | $ | 79.28 | |
| April 2024 | | $ | 150.0 | | | 1.4 | | | $ | 85.95 | | | 80 | % | | May 2024 | | 1.7 | | | $ | 86.72 | |
| August 2024 | | $ | 500.0 | | | 5.8 | | | $ | 68.93 | | | 80 | % | | (a) | | | | |
______________________________________
(a) The ASR agreement has a scheduled settlement date of December 27, 2024. At the conclusion of the ASR agreement, the Company may receive additional shares or may be required to pay additional cash or shares (at our election).
The ASR agreements were accounted for as two separate transactions: (1) the value of the initial delivery of shares was recorded as shares of common stock acquired in a treasury stock transaction on the acquisition date, and (2) the remaining amount of the purchase price paid was recorded as a forward contract indexed to the Company's own common stock and was initially recorded in Additional Paid-in Capital and subsequently, upon settlement, will be transferred to Treasury Stock on the consolidated condensed balance sheets. The initial delivery of shares resulted in an immediate reduction of the outstanding shares used to calculate the weighted-average common shares outstanding for basic and diluted earnings per share. The Company determined that the forward contracts indexed to the Company's common stock met all the applicable criteria for equity classification and, therefore, were not accounted for as a derivative instrument.
13. COMMITMENTS AND CONTINGENCIES
In 2021, the Company initiated an internal review and investigation into whether certain business activities in Japan and other markets violated provisions of the Foreign Corrupt Practices Act (“FCPA”). The Company voluntarily notified the SEC and the United States Department of Justice (“DOJ”) about the matter and thereafter provided status updates. In September 2024, the Company received a letter from the SEC Staff stating that the SEC is not recommending an enforcement action.
On September 28, 2021, Aortic Innovations LLC, a non-practicing entity, filed a lawsuit against Edwards Lifesciences Corporation and certain of its subsidiaries (“Edwards”) in the United States District Court for the District of Delaware alleging that Edwards’ SAPIEN 3 Ultra product infringes certain of its patents. The Company is unable to predict the ultimate outcome of this matter or estimate a range of possible exposure; therefore, no amounts have been accrued. The Company is vigorously defending itself in this litigation.
The European Commission (the “Commission”) is investigating certain business practices of Edwards including its unilateral pro-innovation (anti-copycat) policy and patent practices. The Company is cooperating with the Commission and believes its business practices support healthy competition. The Company cannot predict the outcome of the investigation or the potential impact on our financial statements.
On October 14, 2024, a purported stockholder of the Company filed a putative securities class action complaint against the Company and certain of the Company’s executive officers in the United States District Court for the Central District of California, captioned Patel v. Edwards Lifesciences Corporation, et al., No. 24-cv-02221. The complaint alleges violations of various securities laws based on alleged false or misleading statements regarding the Company’s business prospects. The complaint seeks damages, interest, costs and other fees. The Company is unable to predict the ultimate outcome of this matter or estimate a range of possible exposure; therefore, no amounts have been accrued. The Company intends to defend against the lawsuit vigorously.
The Company is or may be a party to, or may otherwise be responsible for, pending or threatened lawsuits including those related to products and services currently or formerly manufactured or performed, as applicable, by the Company, workplace and employment matters, matters involving real estate, Company operations or health care regulations, contingent considerations, or governmental investigations (the “Lawsuits”). The Lawsuits raise difficult and complex factual and legal issues and are subject to many uncertainties, including, but not limited to, the facts and circumstances of each particular case or claim, the jurisdiction in which each suit is brought, and differences in applicable law. Management does not believe that any loss relating to the Lawsuits would have a material adverse effect on the Company's overall financial condition, results of operations or cash flows. However, the resolution of one or more of the Lawsuits in any reporting period, could have a material adverse impact on the Company's financial results for that period. The Company is not able to estimate the amount or range of any loss for legal contingencies related to the Lawsuits for which there is no reserve or additional loss for matters already reserved.
The Company is subject to various environmental laws and regulations both within and outside of the United States. The Company's operations, like those of other medical device companies, involve the use of substances regulated under environmental laws, primarily in manufacturing and sterilization processes. While it is difficult to quantify the potential impact of continuing compliance with environmental protection laws, management believes that such compliance will not have a material impact on the Company's financial results. The Company's threshold for disclosing material environmental legal proceedings involving a governmental authority where potential monetary sanctions are involved is $1 million.
14. ACCUMULATED OTHER COMPREHENSIVE LOSS
The following tables summarize the activity for each component of Accumulated Other Comprehensive Loss (in millions):
| | | | | | | | | | | | | | | | | | | | | | | | | | | | | |
| | Foreign
Currency
Translation
Adjustments | | Unrealized Gain (Loss) on Hedges | |
Unrealized Loss on Available-for-sale Investments | | Unrealized Pension Costs | | Total
Accumulated
Other
Comprehensive
Loss |
| December 31, 2023 | $ | (214.5) | | | $ | 0.7 | | | $ | (24.8) | | | $ | (4.2) | | | $ | (242.8) | |
| Other comprehensive (loss) income before reclassifications | (23.3) | | | 43.4 | | | 7.0 | | | 0.4 | | | 27.5 | |
| Amounts reclassified from accumulated other comprehensive loss | (1.7) | | | (7.2) | | | 2.5 | | | — | | | (6.4) | |
| Deferred income tax expense | (1.1) | | | (9.3) | | | (1.1) | | | (0.1) | | | (11.6) | |
| March 31, 2024 | $ | (240.6) | | | $ | 27.6 | | | $ | (16.4) | | | $ | (3.9) | | | $ | (233.3) | |
| Other comprehensive income (loss) before reclassifications | 3.4 | | | 21.8 | | | 4.2 | | | (0.1) | | | 29.3 | |
| Amounts reclassified from accumulated other comprehensive loss | (1.8) | | | (12.5) | | | 1.0 | | | — | | | (13.3) | |
| Deferred income tax (expense) benefit | (0.6) | | | (2.4) | | | 0.1 | | | — | | | (2.9) | |
| June 30, 2024 | $ | (239.6) | | | $ | 34.5 | | | $ | (11.1) | | | $ | (4.0) | | | $ | (220.2) | |
| Other comprehensive income (loss) before reclassifications | 3.8 | | | (41.0) | | | 6.8 | | | — | | | (30.4) | |
| Amounts reclassified from accumulated other comprehensive loss | (1.6) | | | (17.0) | | | (0.8) | | | | | (19.4) | |
| Deferred income tax benefit | 2.1 | | | 15.3 | | | 0.1 | | | — | | | 17.5 | |
| September 30, 2024 | $ | (235.3) | | | $ | (8.2) | | | $ | (5.0) | | | $ | (4.0) | | | $ | (252.5) | |
| | | | | | | | | |
| | | | | | | | | | | | | | | | | | | | | | | | | | | | | |
| | Foreign
Currency
Translation
Adjustments | | Unrealized Gain on Hedges | |
Unrealized Loss on Available-for-sale Investments | | Unrealized
Pension
Credits | | Total
Accumulated
Other
Comprehensive
Loss |
| December 31, 2022 | $ | (218.8) | | | $ | 23.8 | | | $ | (65.6) | | | $ | 5.7 | | | $ | (254.9) | |
| Other comprehensive income (loss) before reclassifications | 4.9 | | | 6.7 | | | 9.0 | | | (0.1) | | | 20.5 | |
| Amounts reclassified from accumulated other comprehensive loss | (1.7) | | | (29.8) | | | 4.0 | | | — | | | (27.5) | |
| Deferred income tax benefit | 0.6 | | | 5.9 | | | — | | | — | | | 6.5 | |
| March 31, 2023 | $ | (215.0) | | | $ | 6.6 | | | $ | (52.6) | | | $ | 5.6 | | | $ | (255.4) | |
| Other comprehensive (loss) income before reclassifications | (11.3) | | | 33.5 | | | 2.1 | | | 0.2 | | | 24.5 | |
| Amounts reclassified from accumulated other comprehensive loss | (1.8) | | | (25.2) | | | 3.8 | | | — | | | (23.2) | |
| Deferred income tax benefit (expense) | 1.6 | | | (3.0) | | | — | | | — | | | (1.4) | |
| June 30, 2023 | $ | (226.5) | | | $ | 11.9 | | | $ | (46.7) | | | $ | 5.8 | | | $ | (255.5) | |
| Other comprehensive (loss) income before reclassifications | (20.7) | | | 38.6 | | | 9.4 | | | — | | | 27.3 | |
| Amounts reclassified from accumulated other comprehensive loss | (1.7) | | | (14.1) | | | 1.2 | | | — | | | (14.6) | |
| Deferred income tax (expense) benefit | (1.0) | | | (6.3) | | | — | | | — | | | (7.3) | |
| September 30, 2023 | $ | (249.9) | | | $ | 30.1 | | | $ | (36.1) | | | $ | 5.8 | | | $ | (250.1) | |
| | | | | | | | | |
The following table provides information about amounts reclassified from Accumulated Other Comprehensive Loss (in millions):
| | | | | | | | | | | | | | | | | | | | | | | | | | | | | |
| | Three Months Ended
September 30, | | Nine Months Ended
September 30, | | |
| | Affected Line on Consolidated Condensed
Statements of Operations |
Details about Accumulated Other Comprehensive Loss Components | 2024 | | 2023 | | 2024 | | 2023 | |
| Foreign currency translation adjustments | $ | 1.6 | | | $ | 1.7 | | | $ | 5.1 | | | $ | 5.2 | | | Other non-operating income, net |
| (0.5) | | | (0.5) | | | (1.3) | | | (1.3) | | | Provision for income taxes |
| $ | 1.1 | | | $ | 1.2 | | | $ | 3.8 | | | $ | 3.9 | | | Net of tax |
| Gain (Loss) on hedges | $ | 17.0 | | | $ | 9.3 | | | $ | 31.9 | | | $ | 53.0 | | | Cost of sales |
| | | | | | | | | |
| — | | | 4.8 | | | 4.8 | | | 16.1 | | | Other non-operating income, net |
| 17.0 | | | 14.1 | | | 36.7 | | | 69.1 | | | Total before tax |
| (4.2) | | | (2.9) | | | (8.9) | | | (14.8) | | | Provision for income taxes |
| $ | 12.8 | | | $ | 11.2 | | | $ | 27.8 | | | $ | 54.3 | | | Net of tax |
| Loss on available-for-sale investments | $ | 0.8 | | | $ | (1.2) | | | $ | (2.7) | | | $ | (9.0) | | | Interest income, net |
| (0.2) | | | 0.4 | | | 0.7 | | | 2.3 | | | Provision for income taxes |
| $ | 0.6 | | | $ | (0.8) | | | $ | (2.0) | | | $ | (6.7) | | | Net of tax |
| | | | | | | | | |
| | | | | | | | | |
| | | | | | | | | |
15. EARNINGS PER SHARE
Basic earnings per share is computed by dividing net income by the weighted-average common shares outstanding during the period. Diluted earnings per share is computed based on the weighted-average common shares outstanding plus the effect of dilutive potential common shares outstanding during the period calculated using the treasury stock method. Dilutive potential common shares include employee equity share options, nonvested shares, and similar equity instruments granted by the Company. Potential common share equivalents have been excluded where their inclusion would be anti-dilutive.
The table below presents the computation of basic and diluted earnings per share (in millions, except for per share information):
| | | | | | | | | | | | | | | | | | | | | | | |
| | Three Months Ended
September 30, | | Nine Months Ended
September 30, |
| | 2024 | | 2023 | | 2024 | | 2023 |
| Net Income for Earnings Per Share Calculations: | | | | | | | |
| Income from continuing operations, net of tax | $ | 362.1 | | | $ | 334.9 | | | $ | 1,051.0 | | | $ | 886.9 | |
| Net loss attributable to noncontrolling interests | (1.4) | | | (1.2) | | | (3.6) | | | (2.8) | |
| Income from continuing operations attributable to Edwards Lifesciences Corporation | 363.5 | | | 336.1 | | | 1,054.6 | | | 889.7 | |
| Income from discontinued operations | 2,707.3 | | | 48.8 | | | 2,734.4 | | | 142.8 | |
| Net income attributable to Edwards Lifesciences Corporation | $ | 3,070.8 | | | $ | 384.9 | | | $ | 3,789.0 | | | $ | 1,032.5 | |
| Weighted Average Shares: | | | | | | | |
| Basic weighted-average shares outstanding | 597.2 | | | 607.0 | | | 600.3 | | | 607.2 | |
| Dilutive effect of stock plans | 0.9 | | | 2.5 | | | 1.9 | | | 3.0 | |
| Dilutive weighted-average shares outstanding | 598.1 | | | 609.5 | | | 602.2 | | | 610.2 | |
| Earnings per Share: | | | | | | | |
| Basic: | | | | | | | |
| Continuing operations | $ | 0.61 | | | $ | 0.55 | | | $ | 1.76 | | | $ | 1.47 | |
| Discontinued operations | 4.53 | | | 0.08 | | | 4.55 | | | 0.23 | |
| Basic earnings per share | $ | 5.14 | | | $ | 0.63 | | | $ | 6.31 | | | $ | 1.70 | |
| Diluted: | | | | | | | |
| Continuing operations | $ | 0.61 | | | $ | 0.55 | | | $ | 1.75 | | | $ | 1.46 | |
| Discontinued operations | 4.52 | | | 0.08 | | | 4.54 | | | 0.23 | |
| Diluted earnings per share | $ | 5.13 | | | $ | 0.63 | | | $ | 6.29 | | | $ | 1.69 | |
Stock options, restricted stock units, and market-based restricted stock units to purchase an aggregate of 10.4 million and 6.5 million common shares for the three months ended September 30, 2024 and 2023, respectively, and 7.8 million and 6.1 million shares for the nine months ended September 30, 2024 and 2023, respectively, were outstanding, but were not included in the computation of diluted earnings per share for such periods because the effect would have been anti-dilutive. Additionally, 1.9 million shares that would have been received if the ASR agreement discussed in Note 12 was settled as of September 30, 2024 were not included in the computation of diluted earnings per share because the effect would have been anti-dilutive.
16. INCOME TAXES
The Company's effective income tax rates attributable to continuing operations were 10.1% and 13.6% for the three months ended September 30, 2024 and 2023, respectively and 9.2% and 11.8% for the nine months ended September 30, 2024 and 2023, respectively. The decrease in the effective rate between the nine months ended September 30, 2024 and 2023 is primarily due to an increase in tax benefits from foreign earnings taxed at lower rates and favorable global income tax audit settlements. In addition, the effective rates for the nine months ended September 30, 2024 and 2023 were lower than the federal statutory rate of 21% primarily due to (1) foreign earnings taxed at lower rates, (2) Federal and California research and development credits, and (3) the tax benefit from employee share-based compensation. The effective rates include a tax benefit from employee share-based compensation attributable to continuing operations of $0.6 million and $1.8 million for the three months ended September 30, 2024 and 2023, respectively, and $10.1 million and $12.8 million for the nine months ended September 30, 2024 and 2023, respectively.
The Internal Revenue Service ("IRS") and other taxing authorities are in different stages of examining various years of the Company's tax filings. During these audits, the Company may receive proposed audit adjustments that could be material. An adverse outcome in these audits could have a material effect on the Company's results of operations and financial condition. The Company strives to resolve open matters with each taxing authority at the examination level and could reach agreement with a tax authority at any time. While the Company has accrued for matters it believes are more likely than not to require settlement, the final outcome with a tax authority may result in a tax liability that is materially different from that reflected in the consolidated financial statements. Furthermore, the Company may later decide to challenge any assessments, if made, and may exercise its right to appeal. The uncertain tax positions are reviewed quarterly and adjusted as events occur that affect
potential liabilities for additional taxes, such as lapsing of applicable statutes of limitations, proposed assessments by tax authorities, negotiations between tax authorities, identification of new issues, and issuance of new legislation, regulations, or case law.
As of September 30, 2024 and December 31, 2023, the gross liability recorded for income taxes associated with uncertain tax positions was $656.5 million and $583.9 million, respectively. The Company estimates that these liabilities would be reduced by $326.1 million and $250.7 million, respectively, from offsetting tax benefits associated with the correlative effects of potential transfer pricing adjustments, state income taxes, and timing adjustments. The net amounts of $330.4 million and $333.2 million, respectively, if not required, would favorably affect the Company's effective tax rate. Management believes that adequate amounts of tax and related penalty and interest have been provided for any adjustments that may result from these uncertain tax positions.
The Company executed an Advance Pricing Agreement (“APA”) in 2018 between the United States and Switzerland governments for tax years 2009 through 2020 covering various, but not all, transfer pricing matters. The unagreed transfer pricing matters, namely Surgical Structural Heart and Transcatheter Aortic Valve Replacement (collectively "Surgical/TAVR") intercompany royalty transactions, then reverted to IRS examination for further consideration as part of the respective years' regular tax audits. In addition, the Company executed other bilateral APAs as follows: during 2017, an APA between the United States and Japan covering tax years 2015 through 2019; and during 2018, APAs between Singapore and Japan and between Switzerland and Japan covering tax years 2015 through 2019. The Company has filed to renew all three of the APAs with Japan for the years 2020 and forward. An APA between Switzerland and Japan covering tax years 2020 through 2024 was executed in 2021. An APA between the United States and Japan covering tax years 2020 through 2024 was executed in 2023. The APA renewal between Singapore and Japan covering tax years 2020 through 2026 is pending.
The audits of the Company’s United States federal income tax returns through 2014 have been closed. The IRS audit field work for the 2015 through 2017 tax years was completed during the second quarter of 2021, except for transfer pricing and related matters. The IRS is currently examining the 2018 through 2020 tax years. The audits of the Company's material state, local, and foreign income tax matters have been concluded for years through 2015.
During 2021, the Company received a Notice of Proposed Adjustment (“NOPA”) from the IRS for the 2015 through 2017 tax years relating to transfer pricing involving Surgical/TAVR intercompany royalty transactions between the Company's United States and Switzerland subsidiaries. The NOPA proposed a substantial increase to the Company's United States taxable income, which could result in additional tax expense for the 2015 through 2017 period of approximately $250 million and reflects a departure from a transfer pricing method the Company had previously agreed upon with the IRS. The Company disagreed with the NOPA and pursued an administrative appeal with the IRS Independent Office of Appeals ("Appeals"). The Appeals process culminated in the third quarter of 2023 when the Company and Appeals concluded that a satisfactory resolution of the matter at the administrative level was not possible.
During the fourth quarter of 2023, Appeals issued a notice of deficiency ("NOD") increasing the Company's 2015 through 2017 United States federal income tax in amounts resulting from the income adjustments previously reflected in the NOPA. The additional tax sought in excess of the Company's filing position is $269.3 million before consideration of interest and a repatriation tax offset.
The Company plans to vigorously contest the additional tax claimed by the IRS through the judicial process. Final resolution of this matter is not likely within the next 12 months. The Company believes the amounts previously accrued related to this uncertain tax position are appropriate for a number of reasons, including the interpretation and application of relevant tax law and accounting standards to the Company's facts and, accordingly, has not accrued any additional amount based on the NOD and other proceedings to date. Nonetheless, the outcome of the judicial process cannot be predicted with certainty, and it is possible that the outcome of that process could have a material impact on the Company's consolidated financial statements. As noted below, similar material tax disputes may arise for the 2018 through 2024 tax years. While no payment of any amount related to the NOPA or NOD has yet been required, the Company made a partial deposit with the IRS of $75 million in November 2022 to prevent the further accrual of interest on that portion of any additional tax the Company may ultimately be found to owe. In March 2024, the Company made an additional deposit with the IRS of $305 million to further mitigate interest on potential tax liabilities and interest thereon while the Company prepares to contest through the judicial process the IRS's entitlement to any of the additional tax claimed by the IRS.
Surgical/TAVR intercompany royalty transactions covering tax years 2018 through 2024 remain subject to IRS examination, and those transactions and related tax positions remain uncertain as of September 30, 2024. The Company has considered this information, as well as information regarding the NOD and other proceedings described above in its evaluation
of its uncertain tax positions. The impact of these unresolved transfer pricing matters, net of any correlative tax adjustments, may be significant to the Company’s consolidated financial statements. Based on the information currently available and numerous possible outcomes, the Company cannot reasonably estimate what, if any, changes in its existing uncertain tax positions may occur in the next 12 months and, therefore, has continued to record the uncertain tax positions as a long-term liability.
During the first quarter of 2024, the Company received a notice of assessment from the Israel Tax Authority (“ITA”) wherein the ITA claimed that the Company owes approximately $110 million of tax excluding interest and penalties in connection with a claimed 2017 transfer of intellectual property. The Company maintains that it did not transfer intellectual property outside of Israel and intends to vigorously defend that position through administrative proceedings including a formal appeal of the assessment that was filed during the third quarter of 2024. If necessary, the Company will defend that position through judicial proceedings. There can be no assurance that this matter will be resolved in the Company's favor and an adverse outcome could have a material effect on the Company's consolidated financial statements.
17. SEGMENT INFORMATION
Edwards Lifesciences conducts operations worldwide and is managed in the following geographical regions: United States, Europe, Japan, and Rest of World. All regions sell products that are used to treat advanced cardiovascular disease.
The Company's geographic segments are reported based on the financial information provided to the Chief Operating Decision Maker (the Chief Executive Officer). The Company evaluates the performance of its geographic segments based on net sales and operating income. Segment net sales and segment operating income are based on internally derived foreign exchange rates and do not include inter-segment profits. Because of the interdependence of the reportable segments, the operating profit as presented may not be representative of the geographical distribution that would occur if the segments were not interdependent. Net sales by geographic area are based on the location of the customer. There were no customers that represented 10% or more of the Company's total net sales.
Certain items are maintained at the corporate level and are not allocated to the segments. The non-allocated items include corporate research and development expenses, manufacturing variances, corporate headquarters costs, net interest income, global marketing expenses, special gains and charges, stock-based compensation, foreign currency hedging activities, certain litigation costs, changes in the fair value of contingent consideration liabilities, and most of the Company's amortization expense. Although most of the Company's depreciation expense is included in segment operating income, due to the Company's methodology for cost build-up, it is impractical to determine the amount of depreciation expense included in each segment and, therefore, a portion is maintained at the corporate level. The Company neither discretely allocates assets to its operating segments, nor evaluates the operating segments using discrete asset information.
The table below presents information about Edwards Lifesciences' reportable segments (in millions):
| | | | | | | | | | | | | | | | | | | | | | | |
| | Three Months Ended
September 30, | | Nine Months Ended
September 30, |
| | 2024 | | 2023 | | 2024 | | 2023 |
| Segment Net Sales | | | | | | | |
| United States | $ | 804.6 | | | $ | 735.9 | | | $ | 2,393.1 | | | $ | 2,203.6 | |
| Europe | 315.1 | | | 282.7 | | | 968.4 | | | 878.0 | |
| Japan | 85.8 | | | 84.9 | | | 265.6 | | | 251.5 | |
| Rest of World | 153.2 | | | 136.1 | | | 440.9 | | | 399.0 | |
| Total segment net sales | $ | 1,358.7 | | | $ | 1,239.6 | | | $ | 4,068.0 | | | $ | 3,732.1 | |
| Segment Operating Income | | | | | | | |
| United States | $ | 551.2 | | | $ | 498.4 | | | $ | 1,619.2 | | | $ | 1,510.2 | |
| Europe | 177.3 | | | 156.1 | | | 540.3 | | | 489.2 | |
| Japan | 54.4 | | | 53.7 | | | 159.8 | | | 158.5 | |
| Rest of World | 67.2 | | | 59.5 | | | 184.7 | | | 170.6 | |
| Total segment operating income | $ | 850.1 | | | $ | 767.7 | | | $ | 2,504.0 | | | $ | 2,328.5 | |
The table below presents reconciliations of segment net sales to consolidated net sales and segment operating income to consolidated pre-tax income (in millions):
| | | | | | | | | | | | | | | | | | | | | | | |
| | Three Months Ended
September 30, | | Nine Months Ended
September 30, |
| | 2024 | | 2023 | | 2024 | | 2023 |
| Net Sales Reconciliation | | | | | | | |
| Segment net sales | $ | 1,358.7 | | | $ | 1,239.6 | | | $ | 4,068.0 | | | $ | 3,732.1 | |
| Foreign currency | (4.3) | | | 3.8 | | | (14.3) | | | 11.5 | |
| Consolidated net sales | $ | 1,354.4 | | | $ | 1,243.4 | | | $ | 4,053.7 | | | $ | 3,743.6 | |
| Pre-tax Income Reconciliation | | | | | | | |
| Segment operating income | $ | 850.1 | | | $ | 767.7 | | | $ | 2,504.0 | | | $ | 2,328.5 | |
| Unallocated amounts: | | | | | | | |
| Corporate items | (468.7) | | | (410.1) | | | (1,396.5) | | | (1,259.4) | |
| Restructuring expenses (Note 4) | (32.9) | | | — | | | (32.9) | | | — | |
| Intellectual property agreement and certain litigation expenses | (10.8) | | | (2.2) | | | (27.8) | | | (193.6) | |
| Change in fair value of contingent consideration liabilities | — | | | — | | | — | | | 26.2 | |
| Foreign currency | 12.9 | | | 10.5 | | | 19.3 | | | 60.4 | |
| Consolidated operating income | 350.6 | | | 365.9 | | | 1,066.1 | | | 962.1 | |
| Non-operating income | 52.2 | | | 21.7 | | | 91.9 | | | 43.1 | |
| Consolidated pre-tax income | $ | 402.8 | | | $ | 387.6 | | | $ | 1,158.0 | | | $ | 1,005.2 | |
Enterprise-wide Information
(in millions)
The following enterprise-wide information is based on actual foreign exchange rates used in the Company's consolidated condensed financial statements.
| | | | | | | | | | | | | | | | | | | | | | | |
| | Three Months Ended
September 30, | | Nine Months Ended
September 30, |
| | 2024 | | 2023 | | 2024 | | 2023 |
| Net Sales by Geographic Region | | | | | | | |
| United States | $ | 804.6 | | | $ | 735.9 | | | $ | 2,393.1 | | | $ | 2,203.6 | |
| Europe | 319.8 | | | 286.5 | | | 978.0 | | | 877.7 | |
| Japan | 81.4 | | | 85.8 | | | 253.9 | | | 266.4 | |
| Rest of World | 148.6 | | | 135.2 | | | 428.7 | | | 395.9 | |
| $ | 1,354.4 | | | $ | 1,243.4 | | | $ | 4,053.7 | | | $ | 3,743.6 | |
| Net Sales by Major Product Group | | | | | | | |
| Transcatheter Aortic Valve Replacement | $ | 1,023.3 | | | $ | 960.9 | | | $ | 3,069.8 | | | $ | 2,900.4 | |
| Transcatheter Mitral and Tricuspid Therapies | 91.1 | | | 52.4 | | | 247.0 | | | 141.6 | |
| Surgical Structural Heart | 240.0 | | | 230.1 | | | 736.9 | | | 701.6 | |
| | | | | | | |
| $ | 1,354.4 | | | $ | 1,243.4 | | | $ | 4,053.7 | | | $ | 3,743.6 | |
18. SUBSEQUENT EVENTS
In October 2024, the Company acquired all the remaining outstanding shares of Innovalve Bio Medical Limited ("Innovalve") for an aggregate cash purchase price of $300.0 million, subject to certain adjustments, plus an additional $25.0 million upon achievement of a certain regulatory milestone. Innovalve is a developer of a transcatheter mitral valve replacement system.
Prior to the acquisition date, the Company had previously paid $30.0 million for an option to acquire Innovalve, which the Company exercised in July 2024, and had an existing preferred stock investment in Innovalve of $3.5 million, which represented approximately a 4% interest in Innovalve (collectively, the "previously held interest"). The acquisition of the remaining equity interest in Innovalve is expected to be accounted for as a step acquisition in accordance with Accounting Standards Codification Topic 805, "Business Combinations."
Item 2. Management's Discussion and Analysis of Financial Condition and Results of Operations
Overview
The following discussion and analysis contains forward-looking statements within the meaning of the federal securities laws, and should be read in conjunction with the disclosures we make concerning risks and other factors that may affect our business and operating results. See “Note Regarding Forward-Looking Statements” preceding Part I, Item 1 in this Quarterly Report on Form 10-Q.
We are the global leader in patient-focused medical innovations for structural heart disease. Driven by a passion to help patients, we partner with the world's leading clinicians and researchers and invest in research and development to transform care for those impacted by structural heart disease. We conduct operations worldwide and are managed in the following geographical regions: United States, Europe, Japan, and Rest of World. Our products are categorized into the following groups: Transcatheter Aortic Valve Replacement ("TAVR"), Transcatheter Mitral and Tricuspid Therapies ("TMTT"), and Surgical Structural Heart ("Surgical").
On June 3, 2024, we entered into a definitive agreement to sell our Critical Care product group ("Critical Care") to Becton, Dickinson and Company in an all cash-transaction for $4.2 billion, subject to certain customary adjustments as set forth in the agreement. We completed the sale of Critical Care on September 3, 2024. We believe that the sale will enable us to pursue expanded opportunities for TAVR, TMTT, and Surgical patients, as well as new investments in interventional heart failure technologies. In addition, as a next step in our disposal plan to exit businesses that are not focused on implantable medical innovations for structural heart disease, we have committed to a plan to sell a non-core product group, with the sale expected to occur within the next 12 months. We analyzed the quantitative and qualitative factors relevant to the divestiture of Critical Care and the aforementioned non-core product group (collectively, the "discontinued product groups"), including its significance to our overall net income and total assets, and determined that, when considered together, the conditions for discontinued operations presentation with respect to the discontinued product groups had been met. As such, the historical financial condition and results of the discontinued product groups have been reflected as discontinued operations in our consolidated condensed financial statements, including a $3.3 billion pre-tax gain on the sale of Critical Care. Prior period amounts have been adjusted to reflect the discontinued operations presentation. Our discussion and analysis of our results of operations is reflective of our continuing operations. See Note 5 to the Consolidated Condensed Financial Statements for further information.
Financial Highlights
Our net sales for the first nine months of 2024 were $4.1 billion, representing an increase of $310.1 million compared to the first nine months of 2023, driven primarily by sales of our TAVR and TMTT products.
Our gross profit increased in the nine months ended September 30, 2024, driven by our sales growth. Gross profit as a percentage of sales decreased primarily due to foreign currency rate fluctuations. The increase in our diluted earnings per share
in the nine months ended September 30, 2024 was driven by a one-time after-tax charge of $138.7 million in the nine months ended September 30, 2023 related to an intellectual property agreement.
Healthcare Environment, Opportunities, and Challenges
The medical technology industry is highly competitive and continues to evolve. Our success is measured both by the development of innovative products and the value we bring to our stakeholders. We are committed to developing new technologies and innovations, and we are committed to defending our intellectual property in support of those developments. Our vision for growth is to treat patients with both valvular and non-valvular structural heart disease, such as heart failure, which is a natural progression of the disease for many patients suffering from aortic stenosis and mitral and tricuspid regurgitation.
We are dedicated to generating robust clinical, economic, and quality-of-life evidence increasingly expected by patients, clinicians, and payors in the current healthcare environment, with the goal of encouraging the adoption of innovative new medical therapies that demonstrate superior outcomes.
New Accounting Standards
Information on new accounting standards is included in Note 1 to the Consolidated Condensed Financial Statements.
Results of Operations
Net Sales by Region
(dollars in millions) | | | | | | | | | | | | | | | | | | | | | | | | | | | | | | | | | | | | | | | | | | | | | | | |
| | Three Months Ended
September 30, | | | | | | Nine Months Ended
September 30, | | | | |
| | | | Percent Change | | | | Percent Change |
| | 2024 | | 2023 | | Change | | 2024 | | 2023 | | Change | |
| United States | $ | 804.6 | | | $ | 735.9 | | | $ | 68.7 | | | 9.3 | % | | $ | 2,393.1 | | | $ | 2,203.6 | | | $ | 189.5 | | | 8.6 | % |
| Europe | 319.8 | | | 286.5 | | | 33.3 | | | 11.6 | % | | 978.0 | | | 877.7 | | | 100.3 | | | 11.4 | % |
| Japan | 81.4 | | | 85.8 | | | (4.4) | | | (5.1) | % | | 253.9 | | | 266.4 | | | (12.5) | | | (4.7) | % |
| Rest of World | 148.6 | | | 135.2 | | | 13.4 | | | 10.1 | % | | 428.7 | | | 395.9 | | | 32.8 | | | 8.3 | % |
| Outside of the United States | 549.8 | | | 507.5 | | | 42.3 | | | 8.4 | % | | 1,660.6 | | | 1,540.0 | | | 120.6 | | | 7.8 | % |
| Total net sales | $ | 1,354.4 | | | $ | 1,243.4 | | | $ | 111.0 | | | 8.9 | % | | $ | 4,053.7 | | | $ | 3,743.6 | | | $ | 310.1 | | | 8.3 | % |
Net sales outside of the United States include the impact of foreign currency exchange rate fluctuations. The impact of foreign currency exchange rate fluctuations on net sales is not necessarily indicative of the impact on net income due to the corresponding effect of foreign currency exchange rate fluctuations on international manufacturing and operating costs, and our hedging activities.
Net Sales by Product Group
(dollars in millions)
| | | | | | | | | | | | | | | | | | | | | | | | | | | | | | | | | | | | | | | | | | | | | | | |
| | Three Months Ended
September 30, | | | | | | Nine Months Ended
September 30, | | | | |
| | | | Percent Change | | | | Percent Change |
| | 2024 | | 2023 | | Change | | 2024 | | 2023 | | Change | |
| Transcatheter Aortic Valve Replacement | $ | 1,023.3 | | | $ | 960.9 | | | $ | 62.4 | | | 6.5 | % | | $ | 3,069.8 | | | $ | 2,900.4 | | | $ | 169.4 | | | 5.8 | % |
| Transcatheter Mitral and Tricuspid Therapies | 91.1 | | | 52.4 | | | 38.7 | | | 73.4 | % | | 247.0 | | | 141.6 | | | 105.4 | | | 74.4 | % |
| Surgical Structural Heart | 240.0 | | | 230.1 | | | 9.9 | | | 4.3 | % | | 736.9 | | | 701.6 | | | 35.3 | | | 5.0 | % |
| Total net sales | $ | 1,354.4 | | | $ | 1,243.4 | | | $ | 111.0 | | | 8.9 | % | | $ | 4,053.7 | | | $ | 3,743.6 | | | $ | 310.1 | | | 8.3 | % |
Transcatheter Aortic Valve Replacement Sales
Net sales of TAVR products increased for the three and nine months ended September 30, 2024 driven by:
•higher sales of the Edwards SAPIEN platform in 2024, primarily the Edwards SAPIEN 3 Ultra RESILIA valve in the United States and Japan, and the Edwards SAPIEN 3 Ultra valve in Europe;
partially offset by:
•foreign currency exchange rate fluctuations, which decreased net sales outside of the United States by $5.9 million and $18.4 million for the three and nine months ended September 30, 2024, respectively, primarily due to the weakening of the Japanese yen against the United States dollar.
While our global competitive position and pricing remained stable during the first nine months of 2024, we experienced some regional sales pressure and a reduction in procedures with certain hospital centers in the United States related to a variety of factors including, but not limited to, resources and priorities.
In January 2024, we completed patient treatment in our PROGRESS pivotal trial, studying the treatment of moderate aortic stenosis patients, and we received CE Mark approval for the Edwards SAPIEN 3 Ultra RESILIA valve in Europe. In September 2024, we received CE mark for the Edwards SAPIEN 3 transcatheter pulmonary valve system with Alterra adaptive prestent for use in the management of patients with severe pulmonary regurgitation.
Transcatheter Mitral and Tricuspid Therapies Sales
Net sales of TMTT products increased for the three and nine months ended September 30, 2024 primarily due to higher sales of our PASCAL transcatheter edge-to-edge repair ("TEER") system and our continued launch of the EVOQUE tricuspid valve replacement system in the United States and Europe.
Surgical Structural Heart Sales
Net sales of Surgical products increased for the three and nine months ended September 30, 2024 primarily due to higher sales of the INSPIRIS RESILIA aortic valve in the United States and Europe, the KONECT RESILIA tissue valved conduit in the United States, and the MITRIS RESILIA valve in the United States and Europe.
We have completed enrollment in the United States and Canada of patients in our MOMENTIS clinical study to demonstrate the durability of RESILIA tissue in the mitral position.
Gross Profit
Gross profit as a percentage of net sales increased for the three months ended September 30, 2024 driven by a 0.3 percentage point impact from foreign currency rate fluctuations, including the settlement of foreign currency hedging contracts, and timing of variable expenses. Gross profit as a percentage of net sales decreased for the nine months ended September 30, 2024 driven by a 0.8 percentage point impact from foreign currency rate fluctuations, including the settlement of foreign currency hedging contracts.
Selling, General, and Administrative ("SG&A") Expenses
SG&A expenses increased for the three and nine months ended September 30, 2024 primarily due to higher field-based personnel-related costs in support of our growth strategy initiatives, primarily in the United States and Europe, and costs associated with our recent business combinations. Foreign currency exchange rate fluctuations decreased expenses by $2.9 million and $8.6 million for the three and nine months ended September 30, 2024, respectively, primarily due to the strengthening of United States dollar against the Japanese yen.
Research and Development ("R&D") Expenses
R&D expenses increased for the three and nine months ended September 30, 2024 primarily due to continued investments in our aortic transcatheter valve innovations, including increased clinical trial activity.
Intellectual Property Agreement and Certain Litigation Expenses
We incurred certain litigation expenses related to intellectual property litigation and tax litigation of $10.8 million and $2.2 million during the three months ended September 30, 2024 and 2023, respectively, and $27.8 million and $17.6 million during the nine months ended September 30, 2024 and 2023, respectively. Also, on April 12, 2023, we entered into an Intellectual Property Agreement (the "Intellectual Property Agreement") with Medtronic, Inc. ("Medtronic") and recorded a $37.0 million charge in March 2023 and a $139.0 million charge in April 2023. For more information, see Note 3 to the Consolidated Condensed Financial Statements.
Change in Fair Value of Contingent Consideration Liabilities
The change in fair value of contingent consideration liabilities resulted in a gain of $26.2 million during the nine months ended September 30, 2023. The gain in 2023 was primarily due to changes in projected probabilities of milestone achievement. For further information, see Note 9 to the Consolidated Condensed Financial Statements.
Provision for Income Taxes
The provision for income taxes consists of provisions for federal, state, and foreign income taxes. We operate in an international environment with significant operations in various locations outside the United States which have statutory tax rates typically lower than the United States tax rate. Accordingly, the consolidated income tax rate is a composite rate reflecting the earnings in the various locations and the applicable rates.
Our effective income tax rate attributable to continuing operations was 10.1% and 13.6% for the three months ended September 30, 2024 and 2023, respectively, and 9.2% and 11.8% for the nine months ended September 30, 2024 and 2023, respectively. The decrease in the effective rate between the nine months ended September 30, 2024 and 2023 was primarily due to an increase in tax benefits from foreign earnings taxed at lower rates and favorable global income tax audit settlements. In addition, the effective rates for the nine months ended September 30, 2024 and 2023 were lower than the federal statutory rate of 21% primarily due to (1) foreign earnings taxed at lower rates, (2) Federal and California research and development credits, and (3) the tax benefit from employee share-based compensation.
The Internal Revenue Service ("IRS") and other taxing authorities are in different stages of examining various years of our tax filings. During these audits, we may receive proposed audit adjustments that could be material. An adverse outcome in these audits could have a material effect on our results of operations and financial condition. We strive to resolve open matters with each tax authority at the examination level and could reach agreement with a taxing authority at any time. While we have accrued for matters we believe are more likely than not to require settlement, the eventual outcome with a tax authority may
result in a tax liability that is materially different from that reflected in the consolidated financial statements. Furthermore, we may later decide to challenge any assessments, if made, and may exercise our right to appeal. The uncertain tax positions are reviewed quarterly and adjusted as events occur that affect potential liabilities for additional taxes, such as lapsing of applicable statutes of limitations, proposed assessments by tax authorities, negotiations between tax authorities, identification of new issues, and issuance of new legislation, regulations, or case law. We believe that adequate amounts of tax and related penalty and interest have been provided for any adjustments that may result from these uncertain tax positions.
We executed an Advance Pricing Agreement ("APA") in 2018 between the United States and Switzerland governments for tax years 2009 through 2020 covering various, but not all, transfer pricing matters. The unagreed transfer pricing matters, namely Surgical Structural Heart and Transcatheter Aortic Valve Replacement (collectively "Surgical/TAVR") intercompany royalty transactions, then reverted to IRS Examination for further consideration as part of the respective years' regular tax audits. In addition, we executed other bilateral APAs as follows: during 2017, an APA between the United States and Japan covering tax years 2015 through 2019; and during 2018, APAs between Singapore and Japan and between Switzerland and Japan covering tax years 2015 through 2019. We have filed to renew all three of the APAs with Japan for the years 2020 and forward. An APA between Switzerland and Japan covering tax years 2020 through 2024 was executed in 2021. An APA between the United States and Japan covering tax years 2020 through 2024 was executed in 2023. The APA renewal between Singapore and Japan covering tax years 2020 through 2026 is pending.
The audits of our United States federal income tax returns through 2014 have been closed. The IRS audit field work for the 2015 through 2017 tax years was completed during the second quarter of 2021, except for certain transfer pricing and related matters. The IRS is currently examining the 2018 through 2020 tax years. The audits of our material state, local, and foreign income tax matters have been concluded for years through 2015.
During 2021, we received a Notice of Proposed Adjustment (“NOPA”) from the IRS for the 2015 through 2017 tax years relating to transfer pricing involving Surgical/TAVR intercompany royalty transactions between our United States and Switzerland subsidiaries. The NOPA proposed a substantial increase to our United States taxable income, which could result in additional tax expense for the 2015 through 2017 period of approximately $250 million and represented a departure from a transfer pricing method we had previously agreed upon with the IRS. We have disagreed with the NOPA and pursued an administrative appeal with the IRS Independent Office of Appeals ("Appeals"). The Appeals process culminated in the third quarter of 2023 when we and Appeals concluded that a satisfactory resolution of the matter at the administrative level was not possible.
During the fourth quarter of 2023, Appeals issued a notice of deficiency ("NOD") increasing our 2015 through 2017 United States federal income tax in amounts resulting from the income adjustments previously reflected in the NOPA. The additional tax sought in excess of our filing position is $269.3 million before consideration of interest and a repatriation tax
offset.
We plan to vigorously contest the additional tax claimed by the IRS through the judicial process. Final resolution of this matter is not likely within the next 12 months. We believe the amounts previously accrued related to this uncertain tax position are appropriate for a number of reasons, including the interpretation and application of relevant tax law and accounting standards to our facts and, accordingly, have not accrued any additional amount based on the NOD and other proceedings to date. Nonetheless, the outcome of the judicial process cannot be predicted with certainty, and it is possible that the outcome of that process could have a material impact on our consolidated financial statements. As noted below, similar material tax disputes may arise for the 2018 through 2024 tax years. While no payment of any amount related to the NOPA or NOD has yet been required, we made a partial deposit with the IRS of $75 million in November 2022 to prevent the further accrual of interest on that portion of any additional tax we may ultimately be found to owe. In March 2024, we made an additional deposit with the IRS of $305 million to further mitigate interest on potential tax liabilities and interest thereon while we prepare to contest through the judicial process the IRS's entitlement to any of the additional tax claimed by the IRS.
Surgical/TAVR intercompany royalty transactions covering tax years 2018 through 2024 remain subject to IRS examination, and those transactions and related tax positions remain uncertain as of September 30, 2024. We have considered this information, as well as information regarding the NOD and other proceedings described above, in our evaluation of our uncertain tax positions. The impact of these unresolved transfer pricing matters, net of any correlative tax adjustments, may be significant to our consolidated financial statements. Based on the information currently available and numerous possible outcomes, we cannot reasonably estimate what, if any, changes in our existing uncertain tax positions may occur in the next 12 months and, therefore, have continued to record the uncertain tax positions as a long-term liability.
During the first quarter of 2024, we received a notice of assessment from the Israel Tax Authority (“ITA”) wherein the ITA claimed that we owe approximately $110 million of tax excluding interest and penalties in connection with a claimed 2017 transfer of intellectual property. We maintain that we did not transfer intellectual property outside of Israel and intend to vigorously defend that position through administrative proceedings including a formal appeal of the assessment that was filed during the third quarter of 2024. If necessary, we will defend that position through judicial proceedings. There can be no assurance that this matter will be resolved in our favor and an adverse outcome could have a material effect on our consolidated financial statements.
Additionally, many countries are implementing some or all the Organization for Economic Co-operation and Development's Base Erosion and Profit Shifting Pillar Two rules ("Pillar Two") that impose a global minimum tax of 15%. Under Pillar Two, a company is required to determine a combined effective tax rate for all entities located in a jurisdiction. If the jurisdictional effective tax rate is less than 15%, a top-up tax will be due to bring the jurisdictional effective tax rate up to 15%. We are continuing to monitor the implementation of Pillar Two by individual countries and the potential effects of Pillar Two on our effective tax rate. We do not expect Pillar Two to have a material impact on our consolidated financial statements in 2024. The provisions effective in 2025 may have a material impact on our consolidated financial statements in 2025 and future years, depending on future legislation, regulatory guidance, and business events.
Liquidity and Capital Resources
Our sources of cash liquidity include cash and cash equivalents, short-term investments, cash from operations, and amounts available under credit facilities. We believe that these sources are sufficient to fund the current and long-term requirements of working capital, capital expenditures, and other financial commitments. However, we periodically consider various financing alternatives and may, from time to time, seek to take advantage of favorable interest rate environments or other market conditions.
As of September 30, 2024, cash and cash equivalents and short-term investments held in the United States and outside of the United States were $4.1 billion and $333.9 million, respectively.
We have a Five-year Credit Agreement (the "Credit Agreement") which provides for a $750.0 million multi-currency unsecured revolving credit facility and matures on July 15, 2027. We may increase the amount available under the Credit Agreement by up to an additional $250.0 million in the aggregate and extend the maturity date for an additional year, subject to agreement of the lenders. As of September 30, 2024, no amounts were outstanding under the Credit Agreement.
In June 2018, we issued $600.0 million of 4.3% fixed-rate unsecured senior notes (the "2018 Notes") due June 15, 2028. We may redeem the 2018 Notes, in whole or in part, at any time and from time to time at specified redemption prices. As of September 30, 2024, we have not elected to redeem any of the 2018 Notes. As of September 30, 2024, the carrying value of the 2018 Notes was $597.5 million.
From time to time, we repurchase shares of our common stock under share repurchase programs authorized by the Board of Directors. We consider several factors in determining when to execute share repurchases, including, among other things, expected dilution from stock plans, cash capacity, and the market price of our common stock. During the nine months ended September 30, 2024, under the Board authorized repurchase program, we repurchased a total of 15.0 million shares at an aggregate cost of $1.2 billion, including pursuant to a $500 million accelerated share repurchase agreement (see Note 12 to the Consolidated Condensed Financial Statements). As of September 30, 2024, we had remaining authority to purchase $1.4 billion of our common stock under the share repurchase program.
In July 2024, we entered into agreements and plans of mergers to acquire multiple medical device companies for a total aggregate cash purchase price of $1.5 billion, subject to certain adjustments. Two of these transactions closed in the third quarter of 2024, and upon closing we paid $763.6 million, and a third closed in October 2024. These agreements include up to an additional $670.0 million of potential payments upon achievement of certain regulatory, performance, and sales milestones. For more information, see Notes 8 and 18 to the Consolidated Condensed Financial Statements.
In June 2024, we entered into a definitive agreement to sell our Critical Care product group ("Critical Care") to Becton, Dickinson and Company in an all cash-transaction for $4.2 billion, subject to certain customary adjustments as set forth in the agreement. We completed the sale of Critical Care in early September 2024.
On April 12, 2023, we entered into the Intellectual Property Agreement with Medtronic pursuant to which the parties agreed to a 15-year global covenant not to sue ("CNS") for infringement of certain patents in the structural heart space owned or controlled by each other. In consideration for the global CNS, we paid Medtronic a one-time, lump sum payment of
$300.0 million and are paying annual royalties that are tied to net sales of certain Edwards products. For more information, see Note 3 to the Consolidated Condensed Financial Statements.
We have purchased options to acquire and have agreed to provide promissory notes to various entities. These arrangements could result in additional cash outlays in the future should we decide to exercise the options or should the entities
draw on the promissory notes.
At September 30, 2024, there had been no material changes in our cash requirements from known contractual and other obligations, including commitments for capital expenditures, as disclosed in Item 7, Management's Discussion and Analysis of Financial Condition and Results of Operations, of our Annual Report on Form 10-K for the year ended December 31, 2023.
Consolidated Cash Flows - For the nine months ended September 30, 2024 and 2023:
Net cash flows provided by operating activities of $669.8 million for the nine months ended September 30, 2024 decreased $89.4 million over the same period last year primarily due to tax payments of $633.8 million for the nine months ended September 30, 2024, which included a $305.1 million tax deposit we made to mitigate interest on potential tax liabilities we are contesting through the judicial process (see Note 16 to the Consolidated Condensed Financial Statements). The nine months ended September 30, 2023 included $219.1 million of tax payments and a $300.0 million payment under an intellectual property agreement.
Net cash provided by investing activities of $2.9 billion for the nine months ended September 30, 2024 consisted primarily of the sale of our Critical Care product group for proceeds of 3.9 billion, partially offset by capital expenditures of $202.6 million and net purchases of investments of $2.3 million
Net cash provided by investing activities of $159.7 million for the nine months ended September 30, 2023 consisted primarily of net proceeds from investments of $541.1 million, partially offset by a payment of $141.2 million to acquire a majority interest in another company and capital expenditures of $164.7 million.
Net cash used in financing activities of $1.0 billion for the nine months ended September 30, 2024 consisted primarily of purchases of treasury stock of 1.2 billion, partially offset by proceeds from stock plans of $150.9 million.
Net cash used in financing activities of $297.8 million for the nine months ended September 30, 2023 consisted primarily of purchases of treasury stock of $431.2 million, partially offset by proceeds from stock plans of $136.7 million.
Critical Accounting Policies and Estimates
The consolidated condensed financial statements have been prepared in accordance with accounting principles generally accepted in the United States which require us to make estimates and assumptions that affect the reported amounts of assets and liabilities at the date of the consolidated condensed financial statements and sales and expenses during the periods reported. Actual results could differ from those estimates. Information with respect to our critical accounting policies and estimates which we believe could have the most significant effect on our reported results and require subjective or complex judgments by management is contained on pages 38-40 in Item 7, Management's Discussion and Analysis of Financial Condition and Results of Operations, of our Annual Report on Form 10-K for the year ended December 31, 2023. There have been no significant changes from the information discussed therein.
Item 3. Quantitative and Qualitative Disclosures About Market Risk
Interest Rate Risk, Foreign Currency Risk, Credit Risk, and Concentrations of Risk
For a complete discussion of our exposure to interest rate risk, foreign currency risk, credit risk, and concentrations of risk, refer to Item 7A Quantitative and Qualitative Disclosures About Market Risk in our Annual Report on Form 10-K for the year ended December 31, 2023. There have been no material changes from the information discussed therein.
Investment Risk
We are exposed to investment risks related to changes in the underlying financial condition and credit capacity of certain of our investments. As of September 30, 2024, we had $944.7 million of investments in debt securities, of which $175.0 million were long-term. In addition, we had $144.6 million of investments in equity instruments of public and private companies. Should these companies experience a decline in financial performance, financial condition or credit capacity, or fail to meet certain development milestones, a decline in the investments' value may occur, resulting in unrealized or realized losses. See Note 6 to the Consolidated Condensed Financial Statements for additional information.
Item 4. Controls and Procedures
Evaluation of Disclosure Controls and Procedures. Our management, including the Chief Executive Officer and the Chief Financial Officer, performed an evaluation of the effectiveness of the design and operation of our disclosure controls and procedures (as defined in Rules 13a-15(e) and 15d-15(e) under the Securities Exchange Act of 1934, as amended) as of September 30, 2024. Based on their evaluation, the Chief Executive Officer and Chief Financial Officer have concluded as of September 30, 2024 that our disclosure controls and procedures are designed at a reasonable assurance level and effective in providing reasonable assurance that the information we are required to disclose in the reports we file or submit under the Securities Exchange Act of 1934, as amended, is recorded, processed, summarized, and reported within the time periods specified in the Securities and Exchange Commission's rules and forms, and that such information is accumulated and communicated to our management, including the Chief Executive Officer and Chief Financial Officer, as appropriate, to allow timely decisions regarding required disclosure.
Changes in Internal Control Over Financial Reporting. There have been no changes in our internal control over financial reporting during the quarter ended September 30, 2024 that have materially affected, or are reasonably likely to materially affect, our internal control over financial reporting.
Part II. Other Information
Item 1. Legal Proceedings
Please see Part I, Item 1, Note 11 of the “Consolidated Condensed Financial Statements” of this Quarterly Report on Form 10-Q for a description of our legal proceedings, which is incorporated by reference herein.
Item 1A. Risk Factors
A description of the risk factors associated with our business is contained in the “Risk Factors” section of our Annual Report on Form 10-K for our fiscal year ended December 31, 2023 and of our Quarterly Report on Form 10-Q for our quarter ended June 30, 2024. There have been no material changes to our Risk Factors as previously reported.
Item 2. Unregistered Sales of Equity Securities and Use of Proceeds
Issuer Purchases of Equity Securities | | | | | | | | | | | | | | | | | | | | | | | | | | | | | | | | | | | |
| Period | | | | Total Number
of Shares
Purchased | | Average
Price Paid
per Share | | Total Number of
Shares
Purchased as Part of Publicly Announced Plans or Programs | | Approximate
Dollar Value of
Shares that
May Yet Be
Purchased
Under the Plans
or Programs
(in millions) (a) (b) | |
| July 1, 2024 through July 31, 2024 | | 444,999 | | | $ | 62.91 | | | 444,999 | | | $ | 870.5 | | |
| August 1, 2024 through August 31, 2024 | | 6,741,892 | | | 66.81 | | | 6,741,892 | | | 1,919.9 | | |
| September 1, 2024 through September 30, 2024 | | 6,108,421 | | | 68.99 | | | 6,108,421 | | | 1,398.5 | | |
| Total | | 13,295,312 | | | 67.68 | | | 13,295,312 | | | | |
| | | | | | | | | | | |
(a) In December 2023, the Board of Directors approved a stock repurchase program providing for up to $1.0 billion of repurchases of our common stock. In August 2024, the Board of Directors approved an additional $1.5 billion of repurchases under this program. Repurchases under the program may be made on the open market, including pursuant to a Rule 10b5-1 plan, and in privately negotiated transactions. The repurchase program does not have an expiration date.
(b) In August 2024, we entered into a $500.0 million accelerated share repurchase ("ASR") agreement and received, on September 5, 2024, an initial delivery of 5.8 million shares of our common stock, representing approximately 80 percent of the total contract value. At the conclusion of the ASR agreement, we may receive additional shares or may be required to pay additional cash or shares (at our election). The final settlement is based on the volume-weighted average price over the term of the agreement, less a discount. The ASR has a scheduled termination date of December 27, 2024. Shares purchased pursuant to the ASR agreement are presented in the table above in the periods in which they were received.
Item 5. Other Information
Rule 10b5-1 Trading Plans
During the third quarter of 2024, following is a list of activity by any executive officer or director with respect to a 10b5-1 trading plan intended to satisfy the affirmative defense of Rule 10b5-1(c) under the Exchange Act (each, a "Plan"):
On August 19, 2024, Scott B. Ullem, Corporate Vice President, Chief Financial Officer, entered into a Plan providing for the potential sale of 56,250 shares of the Company’s stock commencing December 9, 2024. Mr. Ullem's Plan terminates on the earlier of May 9, 2025 or the date all shares are sold.
In addition, on September 23, 2024, Bernard J. Zovighian, Chief Executive Officer and Director, terminated a Plan that had provided for the potential sale of 25,147 shares of the Company’s stock commencing May 20, 2024. Following the termination date, no remaining shares can be sold pursuant to the Plan.
Item 6. Exhibits
The exhibits listed in the Exhibit Index below are filed, furnished, or incorporated by reference as part of this report on Form 10-Q.
| | | | | | | | | | | |
| Exhibit No. | | Description | |
| 3.1 | | | |
| 3.2 | | | |
| 3.3 | | | |
| 3.4 | | | |
| 31.1 | | | |
| 31.2 | | | |
| 32 | | | |
| 101.INS | | XBRL Inline Instance Document - the instance document does not appear in the Interactive Data File because its XBRL tags are embedded within the Inline XBRL document |
| 101.SCH | | XBRL Taxonomy Extension Schema Document |
| 101.CAL | | XBRL Taxonomy Extension Calculation Linkbase Document |
| 101.DEF | | XBRL Taxonomy Extension Definition Linkbase Document |
| 101.LAB | | XBRL Taxonomy Extension Label Linkbase Document |
| 101.PRE | | XBRL Taxonomy Extension Presentation Linkbase Document |
| 104 | | | Cover Page Interactive Data File (formatted as Inline XBRL and contained in Exhibit 101) |
| | | |
|
______________________________________________________________________________
* Represents management contract or compensatory plan
SIGNATURES
Pursuant to the requirements of the Securities Exchange Act of 1934, the registrant has duly caused this report to be signed on its behalf by the undersigned thereunto duly authorized.
| | | | | | | | | | | |
| | EDWARDS LIFESCIENCES CORPORATION |
| | (Registrant) |
| Date: | November 6, 2024 | By: | /s/ SCOTT B. ULLEM |
| | | Scott B. Ullem Corporate Vice President, Chief Financial Officer (Principal Financial Officer; Duly Authorized Officer) |
| Date: | November 6, 2024 | By: | /s/ ANDREW M. DAHL |
| | | Andrew M. Dahl Senior Vice President, Corporate Controller (Principal Accounting Officer) |