U.S. SECURITIES AND EXCHANGE COMMISSION
WASHINGTON, D.C. 20549
FORM 10-K
ANNUAL REPORT PURSUANT TO SECTION 13 OR 15(d) OF
THE SECURITIES EXCHANGE ACT OF 1934
For the fiscal year ended June 30, 2005
Commission File Number: 000-31979
Array BioPharma Inc.
(Exact Name of Registrant as Specified in Its Charter)
Delaware | | 84-1460811 |
(State of Incorporation) | | (I.R.S. Employer Identification No.) |
3200 Walnut Street, Boulder, Colorado 80301
(Address of principal executive offices)
(303) 381-6600
(Registrant’s telephone number, including area code)
Securities registered pursuant to Section 12(b) of the Act: None
Securities registered pursuant to Section 12(g) of the Act:
Common Stock, Par Value $.001 Per Share
Indicate by check mark whether the registrant (1) has filed all reports required to be filed by Section 13 or 15(d) of the Securities Exchange Act of 1934 during the preceding 12 months (or for such shorter period that the registrant was required to file such reports), and (2) has been subject to such filing requirements for the past 90 days.
Yes ý No o
Indicate by check mark if disclosure of delinquent filers pursuant to Item 405 of Regulation S-K is not contained herein, and will not be contained, to the best of registrant’s knowledge, in definitive proxy or information statements incorporated by reference in Part III of this Form 10-K or any amendment to this Form 10-K. ý
Indicate by check mark whether the registrant is an accelerated filer (as defined in Rule 12b-2 of the Exchange Act).
Yes ý No o
Indicate by check mark whether the registrant is a shell company (as defined in Rule 12b-2 of the Exchange Act).
Yes o No ý
The aggregate market value of voting stock held by non-affiliates of the registrant as of December 31, 2004 was $320,073,862 (For this computation, the registrant has excluded the market value of all shares of its common stock reported as beneficially owned by executive officers and directors of the registrant; such exclusion shall not be deemed to constitute an admission that any such person is an “affiliate” of the registrant.)
Number of shares outstanding of the registrant’s class of common stock as of August 31, 2005: 38,493,721.
Documents incorporated by reference:
Portions of the registrant’s definitive Proxy Statement to be filed with the Securities and Exchange Commission on Form 14A for the 2005 Annual Meeting of Stockholders – Part III
FORWARD-LOOKING STATEMENTS
This annual report filed on Form 10-K and other documents we file with the Securities and Exchange Commission contain forward-looking statements within the meaning of the Private Securities Litigation Reform Act of 1995 that involve significant risks and uncertainties. In addition, we may make forward-looking statements in our press releases or in other oral or written communications with the public. These statements do not relate to historical matters and reflect our current expectations concerning future events. Therefore our actual results could differ materially from those anticipated in these forward-looking statements as a result of many factors. These factors include, but are not limited to, our ability to achieve and maintain profitability, the extent to which the pharmaceutical and biotechnology industries are willing to in-license drug candidates for their product pipelines and to collaborate with and fund third parties on their drug discovery activities, our ability to out-license our proprietary candidates on favorable terms, our ability to continue to fund and successfully progress internal research efforts and to create effective, commercially viable drugs, risks associated with our dependence on our collaborators for the clinical development and commercialization of our out-licensed drug candidates, the ability of our collaborators and of Array to meet objectives, including clinical trials, tied to milestones and royalties, our ability to attract and retain experienced scientists and management, and the risk factors set forth below under the caption “Risk Factors.” We are providing this information as of the date of this report. We undertake no duty to update any forward-looking statements to reflect the occurrence of events or circumstances after the date of such statements or of anticipated or unanticipated events that alter any assumptions underlying such statements.
PART I
Item 1. Business
OUR BUSINESS
Array BioPharma Inc. is a biopharmaceutical company focused on the discovery, development and commercialization of targeted small molecule drugs to treat debilitating and life-threatening diseases. Our proprietary drug development pipeline is primarily focused on the treatment of cancer and inflammatory disease and includes clinical candidates that are designed to regulate therapeutically important targets. In addition, leading pharmaceutical and biotechnology companies collaborate with Array to discover and develop drug candidates across a broad range of therapeutic areas.
There is tremendous opportunity in creating drugs for debilitating and life-threatening diseases, especially in cancer and inflammation. The medical community is seeking targeted therapies that more effectively treat disease with improved safety profiles. We believe the future of medicine will be to genetically characterize patients and treat them with these targeted therapies. This approach may result in a greater number of marketed drugs aimed at a smaller subset of patients. The resulting market for personalized medicine is potentially subscale for a major pharmaceutical company, but highly valuable to Array.
The worldwide market for targeted cancer drugs is expected to grow from $7 billion in 2004 to $30 billion in 2009, reaching over 50% of total cancer drug sales. The market for inflammatory disease is even larger and could account for a quarter of all drug sales in the future. Inflammation is an extremely broad area and covers a number of diseases, including rheumatoid arthritis (RA), asthma, congestive heart failure (CHF), COPD, atopic dermatitis and liver fibrosis. Our research benefits from the evolving scientific understanding of how modulating specific targets can potentially treat both cancer and inflammatory disease. As a result, a drug designed to treat one disease may also be useful in treating the other.
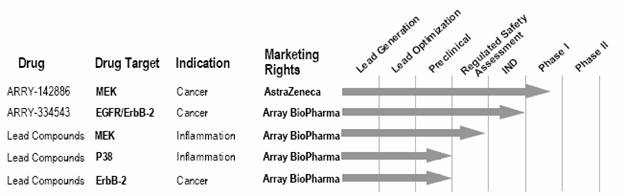
We have identified multiple drug candidates for these diseases in our own proprietary programs and in collaborations with other drug companies. To date, we have advanced four programs that are wholly owned by Array including: ErbB-2/EGFR (cancer), in which the lead compound, ARRY-334543, is expected to begin a Phase I clinical trial in the fall of 2005; MEK (inflammation), in which the lead compound is in regulated safety assessment testing; and p38 (inflammation) and ErbB-2 (cancer), each of which is in preclinical development. In addition, we have out-licensed proprietary cancer programs to AstraZeneca PLC (ARRY-142886: AZD6244), which is currently in Phase Ib clinical trials, and to Genentech, Inc., which involves two early stage programs.
3
We have built our drug development pipeline, and our discovery and development capabilities, primarily through cash flow from collaborations and through sales of our equity securities. Through June 30, 2005, we have recognized $156 million in research funding, and we have generated $18 million in up-front payments and $6 million in milestone payments from our collaborators and out-licensing partners. Under our existing collaboration agreements, we have the potential to earn over $190 million in additional milestone payments if we achieve all of the drug discovery objectives under these agreements, as well as royalties on any resulting product sales from 14 different programs. In December 2004, we raised approximately $67 million in a follow-on public offering of our common stock.
Over the past year, we executed our strategy through the following accomplishments.
Advancing Research Programs
• Advanced ARRY-142886 (AZD6244), a novel MEK inhibitor for cancer, into a Phase Ib clinical trial, entitling Array to a second milestone payment from AstraZeneca PLC.
• Filed an IND application, now in effect, with the FDA for ARRY-334543, a potent, orally active, dual inhibitor of ErbB-2 and EGFR, and continued evaluation of selective ErbB-2 inhibitors in preclinical models of human cancer.
• Initiated regulated safety assessment of our lead MEK inhibitor for inflammatory disease.
• Continued testing our lead p38 inhibitor for inflammatory disease in advanced efficacy and tolerability models.
• Created promising lead compounds in several early discovery programs aimed at therapeutically important targets and anticipate advancing select programs into lead optimization in fiscal 2006.
Growing Collaborative Research
• Commenced or expanded drug discovery collaborations with Genentech, InterMune and QLT that include research funding and potential milestones and royalties.
• Received a $1 million research milestone payment under our collaboration with Amgen.
Strengthening Financial Position
• Completed an offering of 9.2 million shares of common stock, including the over-allotment option, at $7.75 per share, resulting in net proceeds of approximately $67 million.
• Achieved record revenue of over $45 million for the year, increasing more than 30% over the prior year, as a result of new and expanding collaborations and recognizing up-front and milestone payments.
• Ended fiscal 2005 with $93 million in cash and marketable securities.
These achievements continue to drive Array toward our goal of building the industry’s premier biopharmaceutical company.
Proprietary Research and Development
Our proprietary research focuses on biologic regulatory pathways that have been identified as important for the treatment of human disease based on human clinical, preclinical or genetic data. We seek to create first-in-class drugs against important therapeutic targets within these pathways to treat patients with debilitating or life-threatening conditions, primarily for the treatment of cancer and inflammatory disease. In addition, we identify opportunities to improve upon existing therapies or drugs in clinical development by creating drug candidates with superior, or best-in-class, drug characteristics (including efficacy, tolerability or dosing) to provide safer, more effective drugs.
We have advanced four programs that are wholly owned by Array, which include:
• ErbB-2/EGFR (cancer): an IND application was filed for the lead compound, ARRY-334543, with the FDA and became effective in July 2005;
• MEK (inflammation): the lead compound is in regulated safety assessment testing;
• p38 (inflammation): synthesis of the lead compound is being scaled up for regulated safety assessment testing; and
• ErbB-2 (cancer): the lead compound is in advanced preclinical development.
4
In addition, we have out-licensed our MEK for cancer program, including our compound ARRY-142886 (AZD6244), to AstraZeneca and two cancer programs to Genentech. Our agreements with AstraZeneca and Genentech each provide for up-front payments, research funding, success-based milestone payments and royalties on product sales. We have invested approximately $58 million in our proprietary research from our inception through June 30, 2005, and we have received $24 million in up-front payments and milestones resulting from this proprietary research for a net investment of $34 million.
We plan to initiate a Phase I clinical trial on our ErbB-2/EGFR dual inhibitor, ARRY-334543, a drug that we believe holds promise for treating breast, lung and other types of cancer. We plan to advance our MEK inhibitor, ARRY-142886, through a Phase Ib clinical trial and, given positive results, our partner, AstraZeneca, is expected to begin a Phase II clinical trial. In 2006, we anticipate filing two additional IND applications and initiating clinical trials under them. And, we will enhance our clinical and regulatory capabilities to provide further support for our proprietary programs. We are also evaluating or developing compounds against over a dozen targets for new drug research and development in cancer and inflammatory disease as well as other therapeutic areas.
Our Drug Development Pipeline
The following pipeline chart shows our five most advanced programs in the areas of cancer and inflammatory disease and their stage in the drug discovery process.
Our Drug Discovery Efforts
Cancer Programs
Despite a wide range of available cancer therapies, patient responses remain limited and variable. As a result, oncologists experiment with combination therapies and drug dosing regimens tailored for individual tumor types and specific patients. Targeted therapies offer a more specific approach than first generation, cytotoxic chemotherapy drugs by regulating discrete aspects of cellular function affecting cancer cells to a greater extent than normal cells, providing an improved side effect profile and potentially increased efficacy. We believe certain cancers will eventually become a chronic disease, treated with a combination of targeted therapies. Array is building a pipeline of products to meet these new regimens.
According to the American Cancer Society, 3.2 million people in the U.S. are afflicted with cancer. Each year, 1.4 million new patients are diagnosed, including prostate, 230,000; breast, 225,000; lung, 190,000; colon, 150,000; melanoma, 66,000; pancreas, 32,000; and multiple myeloma, 16,000. Worldwide, the cancer drug market is expected to grow from $22 billion in 2004 to $56 billion in 2009. Array’s cancer programs focus on molecular targeted therapies, which represented 30% of the cancer drug market in 2004 and is expected to increase to more than 50% of the market by 2009.
ARRY-142886 (AZD6244)/MEK for Oncology
ARRY-142886 is a novel, selective, non-ATP-competitive inhibitor of MEK (MAP-erk kinase) 1 / 2 that has demonstrated nanomolar activity against isolated MEK enzyme and in numerous cancer cell lines. MEK, as part
5
of the ras/raf/MEK/erk pathway, regulates cell proliferation, survival, migration and differentiation and is a critical enzyme in this biologic pathway. Oral administration of ARRY-142886 has demonstrated tumor suppressive or regressive activity in multiple preclinical models of human cancer, including melanoma, pancreatic, colon, lung and breast cancer models. We believe our MEK inhibitor’s advantages over current therapies may include the ability to target certain cancers with over-activation of MEK or activating pathway mutations, improved efficacy linked to novel mechanism and, because it is an oral agent, ease of use.
In December 2003, we entered into an out-licensing and collaboration agreement with AstraZeneca to develop our MEK program solely in the field of oncology. Under the agreement, AstraZeneca acquired exclusive worldwide rights to our clinical development candidate, ARRY-142886, and certain second-generation compounds we develop during the collaboration for oncology indications. We retain the rights to all non-oncology therapeutic indications for MEK compounds not selected by AstraZeneca for development. Under the agreement, we received an up-front payment of $10 million and a payment of $4 million upon initiation of Phase I clinical testing for ARRY-142886. The agreement also provides for research funding, potential additional development milestone payments of over $81 million and royalties on product sales.
We are collaborating with AstraZeneca on process research for this compound and are manufacturing clinical dosage forms for the Phase I clinical trial. In addition, we are responsible for creating a select number of second-generation MEK compounds, from which AstraZeneca will have the option to select a certain number of compounds for inclusion under the license. Research funding for this second-generation program will end in October 2005. We will perform process research and cGMP manufacturing of Phase I clinical materials for the additional compounds AstraZeneca selects, and we are funding and managing the current Phase I clinical trial. AstraZeneca is responsible for all other aspects of clinical development and commercialization for ARRY-142886 and other compounds it licenses. AstraZeneca is providing funding to us for all activities that we perform under the agreement other than the Phase I clinical trial.
We initiated Phase I clinical testing of ARRY-142886 in June 2004. The trial was designed to evaluate tolerability and pharmacokinetics of ARRY-142886 following oral administration to patients with advanced cancer. In addition, the trial examined patients for indications of therapeutic activity as well as pharmacodynamic and tumor biomarkers. At the 2005 American Society of Clinical Oncology (ASCO) annual meeting, we presented clinical data demonstrating a direct correlation between blood levels of ARRY-142886 and the inhibition of pERK, a downstream biomarker that indicates the ability of our drug to inhibit its target in patients. We initiated a Phase Ib clinical trial in August 2005 with an expanded number of patients at the maximal doses found to be tolerated in the Phase Ia trial to evaluate specific genetic markers and biomarkers, as well as the drug’s tolerability and efficacy.
ErbB-2 / EGFR Inhibitors.
Receptor kinase targets are proteins that interact with certain growth factors found to stimulate aberrant growth, prolong survival and promote differentiation of many tumors. ErbB-2 is a receptor kinase target that has been found to be over-expressed in human breast and other cancers. HerceptinÒ is an IV-dosed protein therapeutic currently on the market that modulates ErbB-2. Recently, Herceptin has shown promising therapeutic benefits in an expanded patient population, including post-surgery breast cancer patients being treated chronically or patients with chemotherapy-induced ErbB-2 over-expression. We believe these results suggest a high potential value in an orally active drug that can be conveniently dosed for extended periods of time. EGFR is also a receptor kinase target that has been found to be over-expressed in numerous human cancers, including breast, lung, pancreatic, head and neck cancers. ErbituxÔ, an IV-dosed protein therapeutic, and TarcevaÒ, a small molecule inhibitor, are drugs currently on the market that modulate EGFR. According to scientific literature, the concurrent inhibition of both ErbB-2 and EGFR may provide enhanced efficacy in cancer treatment. Currently, there is no single drug on the market that inhibits both ErbB-2 and EGFR.
We have identified ARRY-334543, a novel, orally active dual inhibitor of ErbB-2 and EGFR. The compound behaves as a reversible ATP-competitive inhibitor with nanomolar potency both in vitro and in cell-based proliferation assays. Selectivity against a panel of kinases has been demonstrated in vitro. In preclinical models, ARRY-334543 demonstrated significant dose related tumor growth inhibition when administered orally. ARRY-334543 has demonstrated enhanced efficacy in certain preclinical models when compared to Herceptin, Tarceva or IressaÒ and, based on our knowledge, has shown equivalent or improved efficacy relative to the most clinically advanced competitor compound.
6
Based on potency, selectivity and efficacy data, we nominated ARRY-334543 as a clinical candidate. During fiscal 2005, we completed the regulated safety assessment testing and filed an IND application with the FDA in June 2005, which became effective in July 2005. We anticipate initiating a Phase I clinical trial in both the United States and Canada in the fall of 2005.
ErbB-2 Inhibitors.
We have invented orally active, small molecule, selective ErbB-2 inhibitors which have shown potency and efficacy in preclinical models of human cancer. We continue to create and evaluate select compounds to identify the most promising clinical candidate to move into regulated safety assessment testing. Our ErbB-2 inhibitors’ are designed to improve efficacy linked to tissue penetration, ease of use and cost effectiveness.
Inflammation Programs
Inflammation is a natural biologic response to injury or infectious attack to the human body. Unregulated inflammation results in a broad range of conditions, most of which are classified by the tissue or organ where the inflammation occurs. These conditions include rheumatoid arthritis (RA) in the joint, psoriasis in the skin, COPD in the lung, fibrotic disease in the liver and kidney, Crohn’s disease in the intestine, CHF in the heart and arteriosclerosis in the arteries, among others. Currently, some of the most effective treatments for these diseases are injectable protein therapeutics, which have significant cost and patient compliance issues. IV-dosed protein therapeutics currently on the market — EnbrelÒ, RemicadeÒ, HumiraÒ and Kineret Ò — bind to and/or modulate the activity of the inflammatory cytokines TNF-a or IL-1 and are utilized for the treatment of RA, psoriasis and Crohn’s disease. We believe there is a great opportunity to create orally active drugs to treat many of these often-chronic diseases. Array is developing drugs that modulate important biological targets in key intracellular pathways that control inflammation, potentially providing the ability to treat multiple diseases with a single oral agent.
In the future, the market for inflammatory disease could account for a quarter of all drug sales. The worldwide RA therapy market alone is expected to more than double in size, from $7 billion in 2004 to more than $17 billion in 2009. Additionally, COPD, the fourth largest killer worldwide, provides an enormous opportunity due to the current lack of effective treatments.
MEK for Inflammation Inhibitors.
MEK is a kinase target that has been demonstrated to have a role in the biosynthesis and function of TNF-a and IL-1. Our scientists have discovered MEK inhibitors that selectively interfere with these processes. We have also advanced one MEK inhibitor, ARRY-142886, into clinical development for the treatment of cancer. Based on our experience with the safety profile of MEK inhibitors, we believe inhibition of MEK will have utility in chronic diseases driven by IL-1 and TNF-a. Our lead MEK for inflammation inhibitor has been shown to be efficacious, potent, selective and well-tolerated in preclinical models of human arthritis and COPD. We believe this compound may provide broad therapeutic benefits in the treatment of inflammatory and chronic degenerative diseases. We initiated regulated safety assessment on this compound in June 2005.
p38a Inhibitors.
p38a is a MAP kinase target that has been found to regulate the production and function of numerous pro-inflammatory cytokines, in particular, TNF-a, IL-6 and IL-1. IV-dosed protein therapeutics currently on the market — Enbrel, Remicade, Humira and Kineret — bind to and/or modulate the activity of TNF-a or IL-1. Our lead orally active, small molecule p38 inhibitor is efficacious and well tolerated in preclinical models of human arthritis. We are currently scaling up the synthesis of this molecule, and plan to initiate regulated safety assessment testing in the fall of 2005.
Collaborative Research and Development
We have research collaborations with leading pharmaceutical and biotechnology companies that include design, creation and optimization of drug candidates, preclinical testing and process research and development, across a broad range of therapeutic areas and focus on targets outside of our proprietary research programs. These collaborations provide research funding and, in a number of our current agreements, up-front fees, milestone
7
payments upon achievement of certain drug discovery objectives and/or royalties based upon sales of products commercialized by our collaborators as a result of these agreements. Our collaborators, where we are receiving research funding or have the potential for future milestones or royalties, include Amgen, AstraZeneca, Elan, Eli Lilly and Company, Genentech, Hoffman-La Roche Inc., ICOS Corporation, InterMune, Inc., Japan Tobacco Inc., Procter & Gamble Pharmaceuticals, QLT Inc. and Takeda Pharmaceutical Company, Ltd. Today, these collaborations include 14 programs ongoing in our laboratories for screening, lead generation, lead optimization or preclinical research. In addition, we have delivered lead compounds on 13 programs to our collaborators for further lead optimization, clinical candidates on 12 programs for preclinical development.
Below are summaries of two of our most significant collaboration programs.
Genentech—Oncology Collaboration Programs
We entered into a licensing and collaboration agreement with Genentech in December 2003 to develop small molecule drugs against multiple therapeutic targets in the field of oncology. We initiated this collaboration with Genentech to advance two of our proprietary oncology programs into clinical development. These programs include small molecule leads we developed along with additional, related intellectual property. Under the agreement, Genentech has made an up-front payment to us, is providing research funding and has agreed to pay us potential development milestone payments and royalties on any resulting product sales. Genentech is responsible for clinical development and commercialization of the resulting products.
In April 2005, we announced an expansion of the collaboration agreement with Genentech to develop clinical candidates directed against a cancer target, generated by Genentech. Under the expanded agreement, Array is receiving additional research funding, as well as potential research and development milestone payments and product royalties based on the success of the new program. Genentech will have the sole responsibility for clinical development and commercialization of the resulting products. Research funding under these agreements with Genentech ends January 31, 2006, but may be extended at Genentech’s option.
InterMune – Hepatitis C Virus Collaboration Programs
Array and InterMune scientists have collaborated since 2002 to discover novel small molecule inhibitors of the Hepatitis C Virus (HCV) NS3/4 protease. During fiscal 2005, this collaboration was extended and expanded. Under the terms of the agreement, InterMune will fund drug discovery, preclinical testing, process development and cGMP manufacturing conducted by Array and will provide milestone payments to Array based on the selection and progress of clinical drug candidates, as well as royalties on net sales of products derived from the collaboration. As a result of Array’s research progress, we received our first milestone payment from InterMune in June 2004.
Compounds from the program were designed using computational modeling techniques and optimized to achieve superior efficacy and targeted tissue penetration. Preclinical plasma pharmacokinetic analysis following intravenous and oral administration was then used in conjunction with other in vitro assays and stability studies to choose optimal development candidates. Preclinical data was presented in November 2004 at the 55th Annual Meeting of the American Association for the Study of Liver Diseases (AASLD).
We also commenced a second drug discovery collaboration with InterMune in April 2005 to create small molecule drugs focused on hepatitis. InterMune will fund drug discovery research conducted by Array based on the number of Array scientists working on the research phase of the agreement and will be responsible for all further development and commercialization. Array will be entitled to receive milestone payments based on the selection and progress of clinical drug candidates, as well as royalties on net sales of products derived from the collaborative efforts. Research funding under these agreements with InterMune ends June 30, 2006, but may be extended at InterMune’s option.
Array’s Research and Development Technologies and Expertise
Our scientists use the Array Discovery Platform, an integrated suite of drug discovery technologies, to create drug candidates and conduct preclinical and clinical development. A critical capability within the Array Discovery Platform is our proprietary computational software, which enables our scientists to share information across the Company, analyze databases of existing drugs, generate novel predictive databases and design novel drugs with
8
potential competitive advantages over current therapies. We use in vitro and in vivo predictive pharmacodynamic and pharmacokinetic models to select compounds for potential development. Early in the drug discovery process, our scientists engineer into a drug candidate desirable drug characteristics, such as improved potency, specificity and dosing regimen and reduced side effect profile. The resulting compounds are tested for safety, efficacy and metabolism to select the most promising clinical candidates. We believe our drug discovery approach can significantly improve on the industry’s existing clinical attrition rates through our use of:
• Proprietary chemoinformatic databases that relate chemical structure to compound development potential;
• Multiple lead generation strategies including high throughput screening of our lead generation library of up to 400,000 compounds, virtual screening and proprietary de novo design software;
• State-of-the-art protein x-ray crystallography, structural databases and computational modeling;
• An extensive battery of in vivo and in vitro metabolic and safety drug profiling assays; and
• A company-wide electronic laboratory notebook that enables our scientists to collect, analyze and share information across the organization.
Our Strategy
We are building a fully integrated, commercial-stage biopharmaceutical company inventing, developing and marketing safe and effective drugs to treat patients with debilitating and life-threatening diseases. We intend to accomplish this through the following strategies:
• Filling our clinical pipeline with targeted small molecule drugs — primarily for the treatment of cancer and inflammatory disease — which demonstrate a competitive advantage over existing therapies.
• Commercializing drugs for debilitating and life-threatening diseases requiring a small, therapeutically directed sales force.
• Partnering select drug candidates requiring broad distribution for late-stage codevelopment and commercialization and pursuing additional partnering opportunities based on geography, therapeutic indication or route of administration.
• Evaluating opportunities to advance our pipeline by in-licensing later-stage clinical programs.
• Inventing drug candidates in collaboration with leading pharmaceutical and biotechnology companies, where we receive research funding and potential milestones and royalties.
Competitors
The pharmaceutical and biotechnology industries are characterized by rapid and continuous technological innovation. We compete with companies worldwide that are engaged in the research and discovery, licensing, development and commercialization of drug candidates, including Arqule Inc.; Cytokinetics Inc; deCODE genetics Inc; Exelixis Inc; Incyte Corporation; Theravance, Inc.; and Vertex Pharmaceuticals Incorporated. Some of our competitors have a broader range of capabilities and have greater access to financial, technical, scientific, regulatory, business development, recruiting and other resources than we do. Their access to greater resources may allow them to develop processes or products that are more effective, safer or less costly, or gain greater market acceptance, than products we develop or for which they obtain FDA approval more rapidly than we do. We anticipate that we will face increased competition in the future as new companies enter the market and advanced technologies become available.
Research and Development Expenses
Research and development expenses consist of costs associated with our proprietary drug programs for salaries and benefits of scientific personnel, consulting and outsourced services, laboratory supplies, allocated facilities costs and depreciation. Research and development expenses were $22.9 million for the year ended June 30, 2005, compared to $15.9 million for fiscal 2004 and $11.4 million for fiscal 2003.
9
Government regulation
Biopharmaceutical companies are subject to substantial regulation by governmental agencies in the United States and other countries. Virtually all pharmaceutical products are subject to rigorous preclinical and clinical testing and other approval procedures by the FDA and by foreign regulatory agencies. Before a drug product is approved by the FDA for commercial marketing, three phases of human clinical trials are usually conducted to test the safety and effectiveness of the product. Phase I clinical trials most typically involve testing the drug on a small number of healthy volunteers to assess the safety profile of the drug at different dosage levels. Phase II clinical trials, which also enroll a relatively small number of volunteers, are designed to further evaluate the drug’s safety profile and to provide preliminary data as to the drug’s effectiveness in humans. Phase III clinical trials consist of larger, well-controlled studies that may involve several hundred volunteers representing the drug’s targeted population. During any of these phases, the clinical trial can be placed on “clinical hold,” or temporarily or permanently stopped for a variety of reasons, principally for safety concerns.
The approval process is time-consuming and expensive, and there are no assurances that approval will be granted on a timely basis, or at all. Even if regulatory approvals are granted, a marketed product is subject to continual review under federal and state laws and regulations. Post-marketing requirements include reporting adverse events, recordkeeping, compliance with current good manufacturing practices (cGMP), and marketing requirements.
If drug candidates we develop, including ARRY-142886, are approved for commercial marketing by the FDA, they would be subject to the provisions of the Drug Price Competition and Patent Term Restoration Act of 1984 known as the “Hatch-Waxman Act.” The Hatch-Waxman Act provides companies with marketing exclusivity for new chemical entities and allows companies to apply to extend patent protection for up to five additional years. It also provides a means for approving generic versions of a drug product once the marketing exclusivity period has ended and all relevant patents have expired (or have been successfully challenged and defeated). The period of exclusive marketing may be shortened, however, by a successful patent challenge.
All facilities and manufacturing processes used in the production of Active Pharmaceutical Ingredients for clinical use in the United States must be operated in conformity with cGMP as established by the FDA. We have a cGMP manufacturing facility, which allows us to produce cGMP compliant compounds. In our facility, we have the capacity to produce Active Pharmaceutical Ingredients for Phase I clinical testing. We have validated this capability for compliance with FDA regulations and began our first cGMP manufacturing campaign in the second half of calendar 2002. Our cGMP facility is subject to periodic regulatory inspections to ensure compliance with cGMP requirements. We could also be required to comply with specific requirements or specifications of our collaborators, which may be more stringent than regulatory requirements. If we fail to comply with applicable regulations, the FDA could require us to cease ongoing research or disqualify the data submitted to regulatory authorities. A finding that we had materially violated cGMP requirements could result in additional regulatory sanctions and, in severe cases, could result in a mandated closing of our cGMP facility, which would materially and adversely affect our business, financial condition and results of operations.
In the course of our business, we handle, store and dispose of chemicals and biological samples. We are subject to various federal, state and local laws and regulations relating to the use, manufacture, storage, handling and disposal of hazardous materials and waste products. These environmental laws generally impose liability regardless of the negligence or fault of a party and may expose us to liability for the conduct of, or conditions caused by, others. We have not incurred, and do not expect to incur, material costs to comply with these laws and regulations.
Most health care providers, including research institutions from whom we or our collaborators obtain patient information, are subject to privacy rules under the Health Insurance Portability and Accountability Act of 1996 (HIPAA). Although we are not directly regulated by these privacy regulations, we could face substantial criminal penalties if we knowingly receive individually identifiable health information from a health care provider that has not satisfied HIPPA’s disclosure standards. In addition, certain state privacy laws and genetic testing laws may apply directly to our operations and/or those of our collaborators and may impose restrictions on the use and dissemination of individuals’ health information.
10
We are subject to other regulations, including regulations under the Occupational Safety and Health Act, regulations promulgated by the United States Department of Agriculture, and regulations under other federal, state and local laws.
Intellectual property
Our success will depend in part on our ability to protect our proprietary software, potential drug candidates and other intellectual property rights. To establish and protect our proprietary technologies and products, we rely on a combination of patent, copyright, trademark and trade secret laws, as well as confidentiality provisions in our contracts with collaborators.
We attempt to protect our trade secrets by entering into confidentiality agreements with third parties, employees and consultants. Our employees also sign agreements requiring that they assign to us their interests in inventions, original expressions and any corresponding patents and copyrights arising from their work for us. However, it is possible that these agreements may be breached, invalidated or rendered unenforceable, and if so, we may not have an adequate remedy available. Despite the measures we have taken to protect our intellectual property, parties to our agreements may breach the confidentiality provisions or infringe or misappropriate our patents, copyrights, trademarks, trade secrets and other proprietary rights. In addition, third parties may independently discover or invent competing technologies or reverse-engineer our trade secrets or other technology.
We have also implemented a patent strategy designed to protect technology, inventions and improvements to inventions that are commercially important to our business. We currently have seven issued United States patents and numerous patent applications on file with the United States Patent and Trademark Office and around the world. The source code for our proprietary software programs is protected both as a trade secret and as a copyrighted work.
United States patents issued from applications filed on or after June 8, 1995, have a term of 20 years from the application filing date or earlier claimed priority. All of our patent applications were filed after June 8, 1995. Patents in most other countries have a term of 20 years from the date of filing of the patent application. Because the time from filing patent applications to issuance of patents is often several years, this process may result in a period of patent protection significantly shorter than 20 years, which may adversely affect our ability to exclude competitors from our markets. Our success will depend in part upon our ability to develop proprietary products and technologies and to obtain patent coverage for these products and technologies. We intend to continue to file patent applications covering newly developed products and technologies. We may not, however, commercialize the technology underlying any or all of our existing or future patent applications.
Patents provide some degree of protection for our proprietary technology. However, the pursuit and assertion of patent rights, particularly in areas like pharmaceuticals and biotechnology, involve complex legal and factual determinations and, therefore, are characterized by some uncertainty. In addition, the laws governing patentability and the scope of patent coverage continue to evolve, particularly in biotechnology. As a result, patents may not be issued from any of our patent applications or from applications licensed to us. The scope of any of our patents, if issued, may not be sufficiently broad to offer meaningful protection. In addition, our patents or patents licensed to us, if they are issued, may be successfully challenged, invalidated, circumvented or rendered unenforceable so that our patent rights might not create an effective competitive barrier. Moreover, the laws of some foreign countries may not protect our proprietary rights to the same extent as do the laws of the United States. Any patents issued to us or our strategic partners may not provide a legal basis for establishing an exclusive market for our products or provide us with any competitive advantages. Moreover, the patents held by others may adversely affect our ability to do business or to continue to use our technologies freely. In view of these factors, our intellectual property positions bear some degree of uncertainty.
Employees
As of June 30, 2005, we had 269 full-time employees, including 204 scientists, of whom 109 have Ph.D.’s and 86 have experience at large pharmaceutical or biotechnology companies. None of our employees are covered by collective bargaining agreements, and we consider our employee relations to be good.
11
Our corporate information
Founded in 1998, we are headquartered in Boulder, Colorado with 269 employees, including 204 scientists housed in 160,000 square feet of state-of-the-art laboratory facilities. We became a public company in November 2000, and our stock is listed on the Nasdaq National Market under the symbol “ARRY.” The mailing address and telephone number of our principal executive offices are 3200 Walnut Street, Boulder, Colorado 80301, (303) 381-6600.
Available information
The annual reports on Form 10-K, quarterly reports on Form 10-Q, current reports on Form 8-K, and amendments to those reports, that we file with or furnish to the SEC are available on our web site free of charge as soon as reasonably practicable following the filing or furnishing of these reports with the SEC. Our web site can be found at www.arraybiopharma.com. Information on our web site does not constitute any part of this Annual Report on Form 10-K.
12
RISK FACTORS
In addition to the other factors discussed elsewhere in this report and in other reports we file with the SEC, the following factors could cause actual results or events to differ materially from those contained in any forward-looking statements made by us or on our behalf. In addition, other risks and uncertainties not presently known to us or that we currently deem immaterial may impair our business operations. If any of the following risks or such other risks occur, it could adversely affect our business, operating results and financial condition, as well as cause the value of our common stock to decline.
RISKS RELATED TO OUR BUSINESS
We have a history of losses and may not achieve or sustain profitability.
We are at an early stage of executing our business plan, and we have a limited history of developing and out-licensing our proprietary drug candidates and offering our drug discovery capabilities. We have incurred significant operating and net losses and negative cash flows from operations since our inception. As of June 30, 2005, we had an accumulated deficit of $94.0 million. We had net losses of $23.2 million, $26.0 million and $20.0 million for the fiscal years ended June 30, 2005, 2004 and 2003, respectively. We expect to incur additional losses and negative cash flows in the future, and these losses may continue or increase due in part to anticipated increases in expenses for research and development, expansion of our scientific capabilities, acquisitions of complementary technologies or in-licensed drug candidates and possible reductions in revenue from drug discovery collaborations. We may not be able to achieve or maintain profitability. Moreover, if we do achieve profitability, the level of any profitability cannot be predicted and may vary significantly.
Much of our current revenue is non-recurring in nature and unpredictable as to timing and amount. While several of our out-license and collaboration agreements provide for royalties on product sales, given that none of our drug candidates have been approved for commercial sale, that our drug candidates are at early stages of development and that drug development entails a high risk of failure, we do not expect to receive any royalty revenue for several years, if at all. For the same reasons, we may never realize much of the milestone revenue provided for in our out-license and collaboration agreements. In addition, we have been devoting more resources to drug discovery and our proprietary drug programs. As a result, we expect that revenue from the sale of our research tools and services will continue to decline as a percentage of total revenue and that our research and development and other expenses will continue to increase.
Our drug candidates are at early stages of development, and we may not successfully develop a drug candidate that becomes a commercially viable drug.
The drug discovery and development process is highly uncertain, and we have not developed, and may never develop, a drug candidate that ultimately leads to a commercially viable drug. All of our drug candidates are in the early stages of development, and we do not have any drugs approved for commercial sale. Before a drug product is approved by the FDA for commercial marketing, it is tested for safety and effectiveness in clinical trials that can take up to six years or longer. At any time, a clinical trial can be placed on “clinical hold”, or temporarily or permanently stopped for a variety of reasons, principally for safety concerns. Only one of our candidates, ARRY-142886, is in a clinical trial, a Phase I that began in June 2004, and a second candidate, ARRY-334543, is expected to enter a Phase I trial in the fall of 2005. Candidates that appear promising in pre-clinical or clinical trials may fail to become marketed drugs for a number of reasons, including:
• the failure to achieve clinical trial results that indicate a candidate is effective in treating a specified condition or illness in humans;
• the presence of harmful side effects;
• the failure to obtain FDA or other regulatory approval;
• the lack of commercial viability of the drug;
13
• the failure to acquire, on reasonable terms, intellectual property rights necessary for commercialization; and
• the existence of therapeutics that are more effective or economical to produce.
At any time, we or our collaborators may decide to discontinue the development of a drug candidate or not to commercialize a candidate. Even if one of our drug candidates receives regulatory approval for marketing, physicians or consumers may not find that its effectiveness, ease of use, side effect profile, cost or other factors make it effective in treating disease or more beneficial than or preferable to other drugs on the market. Additionally, health insurance plans or maintenance organizations may choose not to include the drug on their formulary list for reimbursement. As a result, the drug may not be used or may be used only for restricted applications.
Our business depends on the extent to which the pharmaceutical and biotechnology industries in-license drug candidates to fill their product pipelines and collaborate with other companies for one or more aspects of their drug discovery process.
We are highly dependent on pharmaceutical and biotechnology companies continuing to in-license drug candidates to fill their clinical development pipelines and to collaborate with outside companies to obtain drug discovery expertise, and on their willingness to spend significant funds on research and development. Our capabilities include aspects of the drug discovery process that pharmaceutical and biotechnology companies have traditionally performed internally. The willingness of these companies to in-license drug candidates and to expand or continue drug discovery collaborations to enhance their research and development process is based on several factors that are beyond our control. These include their ability to hire and retain qualified scientists, the resources available for entering into drug discovery collaborations and the spending priorities among various types of research activities. Any of these factors could cause our revenue to decline. In addition, our ability to convince these companies to in-license our drug candidates or programs or to use our drug discovery capabilities, rather than develop them internally, will depend on many factors, including our ability to:
• discover competitive drug candidates targeting large market opportunities;
• develop and implement drug discovery technologies that will result in the identification of higher-quality drug candidates;
• attract and retain experienced, high caliber scientists;
• achieve timely, high quality results at an acceptable cost; and
• design, create and manufacture our chemical compounds in quantities, at purity levels and at costs that are acceptable to our collaborators.
The importance of these factors varies depending on the company and type of discovery program, and although we believe we currently address many of these factors, we may be unable to meet any or all of them in the future. Even if we are able to address these factors, these companies may still decide to perform these activities internally, acquire companies to fill their product pipelines or retain other companies that provide drug research and development expertise similar to ours.
We may not be successful in entering into additional out-license agreements on favorable terms.
We are committing significant resources to create our own proprietary drug candidates. In fiscal 2005, we increased our investment in proprietary research to $22.9 million, compared to $15.9 million and $11.4 million for fiscal years 2004 and 2003, respectively. Our proprietary drug discovery programs are in their early stage of development and are unproven. To date, we have entered into three out-licensing agreements for the co-development and commercialization of our drug candidates. Although we have expended, and continue to expend, resources on internal research and development for our proprietary programs and for our collaborators, we may not be successful in creating valuable proprietary drug candidates that would enable us to form additional collaborations with favorable terms that include up-front, milestone, royalty and/or license payments. If we are unsuccessful in establishing favorable out-licensing collaborations in the future, we may undertake and fund further development,
14
clinical trials, manufacturing and marketing activities solely at our expense. As a result, our requirements for capital, which may not be available on favorable terms, could increase significantly, or we may be required to substantially reduce our development efforts, which would delay the commercialization of our drug candidates.
We may not out-license our proprietary programs at the most appropriate time to maximize the total value or return of these programs to us.
A critical aspect of our business strategy is to out-license drug candidates for late-stage co-development and commercialization to obtain the highest possible value while also evaluating earlier out-licensing opportunities to maximize our risk-adjusted return on our investment in proprietary research. Because the costs and risk of failure of bringing a drug to market are high, the value of out-licensing a drug candidate generally increases as it successfully progresses through clinical trials. Array may choose or be forced to out-license a drug candidate or program at a point in the research and development process that does not provide as great a value or return than what might have been obtained if we had further developed the candidate or program internally. Likewise, we may decline, or be unable to obtain favorable, early out-licensing opportunities in programs that do not result in a commercially viable drug, which could leave the resulting program with little or no value even though significant resources were invested in its development.
Our collaborators have substantial control and discretion over the timing and the continued development and marketing of drug candidates we create.
Our collaborators have significant discretion in determining the efforts and amount of resources that they dedicate to our collaborations. Our collaborators may determine not to proceed with clinical development or commercialization of a particular drug candidate for a number of reasons that are beyond our control, even under circumstances where we might have continued such a program. In addition, our ability to generate milestone payments and royalties from our collaborators depends on our collaborators’ abilities to establish the safety and efficacy of our drug candidates, obtain regulatory approvals and achieve market acceptance of products developed from our drug candidates. We also depend on our collaborators to manufacture clinical scale quantities of some of our drug candidates and would depend on them in the future for commercial scale manufacture, distribution and direct sales. Our collaborators may not be successful in manufacturing our drug candidates on a commercial scale or in successfully commercializing them.
We face additional risks in connection with our collaborations, including the following:
• our collaborators may develop and commercialize, either alone or with others, products and services that are similar to or competitive with the products that are the subject of the collaboration with us;
• our collaborators may underfund or not commit sufficient resources to the testing, marketing, distribution or other development of our drug candidates;
• our collaborators may not properly maintain or defend our intellectual property rights or they may utilize our proprietary information in such a way as to invite litigation that could jeopardize or potentially invalidate our proprietary information or expose us to potential liability;
• our collaborators may encounter conflicts of interest, changes in business strategy or other business issues which could adversely affect their willingness or ability to fulfill their obligations to us (for example, pharmaceutical and biotechnology companies historically have re-evaluated their priorities following mergers and consolidations, which have been common in recent years in these industries); and
• disputes may arise between us and our collaborators delaying or terminating the research, development or commercialization of our drug candidates, resulting in significant litigation or arbitration that could be time-consuming and expensive, or causing collaborators to act in their own self-interest and not in the interest of our stockholders.
15
The sale and manufacture of drug candidates that we develop with our collaborators or on our own may not receive regulatory approval.
The development and commercialization of drug candidates for our collaborators and our own internal drug discovery efforts are subject to regulation. Pharmaceutical products require lengthy and costly testing in animals and humans and regulatory approval by governmental agencies prior to commercialization. It takes several years to complete testing, and failure can occur at any stage of testing. Results attained in preclinical testing and early clinical trials for any of our drug candidates may not be indicative of results that are obtained in later studies, and significant setbacks in advanced clinical trials may arise, even after promising results in earlier studies. Clinical trials may not demonstrate sufficient safety and efficacy to obtain the requisite regulatory approvals or result in marketable products. Based on results at any stage of testing, we or our collaborators may decide to repeat or redesign a trial or discontinue development of a drug candidate.
Approval of a drug candidate as safe and effective for use in humans is never certain, and regulatory agencies may delay or deny approval of drug candidates for commercialization. These agencies may also delay or deny approval based on additional government regulation or administrative action or on changes in regulatory policy during the period of clinical trials in humans and regulatory review. Similar delays and denials may be encountered in foreign countries. None of our collaborators have obtained regulatory approval to manufacture and sell drug candidates owned by us or identified or developed under an agreement with us. If we or our collaborators cannot obtain this approval, we will not realize milestone or royalty payments based on commercialization goals for these drug candidates.
Even if our drug candidates obtain regulatory approval, we and our collaborators will be subject to ongoing government regulation.
Even if regulatory authorities approve any of our drug candidates, the manufacture, marketing and sale of these drugs will be subject to strict and ongoing regulation. Compliance with this regulation consumes substantial financial and management resources and may expose us and our collaborators to the potential for other adverse circumstances. For example, approval for a drug may be conditioned on costly post-marketing follow-up studies. Based on these studies, if a regulatory authority does not believe that the drug demonstrates a clinical benefit to patients, it could limit the indications for which a drug may be sold or revoke the drug’s marketing approval. In addition, identification of certain side effects after a drug is on the market may result in the subsequent withdrawal of approval, reformulation of a drug, additional preclinical and clinical trials and changes in labeling. Any of these events could delay or prevent us from generating revenue from the commercialization of these drugs and cause us to incur significant additional costs.
In addition, the marketing of these drugs by us or our collaborators will be regulated by federal and state laws pertaining to health care “fraud and abuse,” such as the federal anti-kickback law prohibiting bribes, kickbacks or other remuneration for the order or recommendation of items or services reimbursed by federal health care programs. Many states have similar laws applicable to items or services reimbursed by commercial insurers. Violations of fraud and abuse laws can result in fines and/or imprisonment.
If our drug candidates do not gain market acceptance, we may be unable to generate significant revenue.
Even if our drug candidates are approved for sale, they may not be successful in the marketplace. Market acceptance of any of our drug candidates will depend on a number of factors including:
• demonstration of clinical effectiveness and safety;
• the potential advantages of our drug candidates over alternative treatments;
• the availability of adequate third-party reimbursement; and
• the effectiveness of marketing and distribution methods for the products.
16
If our drug candidates do not gain market acceptance among physicians, patients and others in the medical community, our ability to generate meaningful revenues from our drug candidates would be limited.
If we need but are unable to obtain additional funding to support our operations, we could experience a reduction in our ability to expand or be forced to reduce our operations.
We have historically financed our operations in substantial part through the sale of our securities and revenue from our collaborators. We used $17.2 million in our operating activities in fiscal 2005 while we generated $5.5 million from our operating activities for the fiscal 2004 and used $17.6 million for fiscal 2003. Although we anticipate that we will use more cash in our operating activities in future periods, we believe that our existing cash, cash equivalents and marketable securities and anticipated cash flow from existing out-license and collaboration agreements will be sufficient to support our current operating plan for at least the next 12 months. However, our current operating plan could change as a result of many factors, and we could require additional funding sooner than anticipated.
To the extent that the cash from our future operating activities is insufficient to meet our future capital requirements, we will have to raise additional funds to continue our proprietary research and development. We may not be able to raise funds on favorable terms, if at all. To the extent that we raise additional capital through the sale of equity or convertible debt securities, the issuance of those securities would result in dilution to our stockholders. In June 2005, we obtained a credit facility providing for a $10 million term loan, which we were advanced in June 2005, and a $5 million equipment line and $2 million revolving line of credit to support standby letters of credit. A portion of our cash flow will be dedicated to the payment of principal and interest on such indebtedness, which could render us more vulnerable to competitive pressures and economic downturns and imposes some restrictions on our operations. If we are unable to obtain additional funds if and when needed, we may be required to curtail operations significantly or to obtain funds through other arrangements on unattractive terms.
We have limited clinical development and commercialization experience.
One of our business strategies is to develop select drug candidates through later stage clinical trials before out-licensing them to a pharmaceutical or biotechnology partner for further clinical development and commercialization. To date, we have filed two IND and initiated one Phase I clinical trial, and we have not yet conducted a Phase II or later stage clinical trial, nor commercialized a drug. We have limited experience conducting clinical trials and obtaining regulatory approvals, and we may not be successful in some or all of these activities. We may be required to expend significant amounts to recruit and retain high quality personnel with clinical development or commercialization experience or be forced to rely on third-party clinical investigators, clinical research or marketing organizations, which could subject us to costs and delays that are outside our control.
Our research and development capabilities may not produce viable drug candidates.
We have entered into several research and development collaborations under which we provide drug discovery services to identify drug candidates for our collaborators using the Array Discovery Platform. We also seek to identify and develop drug candidates for our proprietary programs. It is uncertain whether we will be able to provide drug discovery more efficiently or create high quality drug candidates that are suitable for our or our collaborators’ purposes. Our ability to create viable drug candidates depends on many factors, including the implementation of appropriate technologies, the development of effective new research tools and the performance and decision-making capabilities of our scientists. Our information-driven technology platform, which we believe allows our scientists to make better decisions, may not enable our scientists to make correct decisions or develop viable drug candidates.
If our drug discovery and development programs do not progress as anticipated, our revenue and stock price could be negatively impacted.
We estimate the timing of a variety of preclinical, clinical, regulatory and other milestones for planning purposes, including when a drug candidate is expected to enter clinical trials, when a clinical trial will be completed or when an application for regulatory approval will be filed. Some of our estimates are included in this report. We base our estimates on facts that are currently known to us and on a variety of assumptions, many of which are beyond our control. Delays may be caused by regulatory or patent issues, interim or final results of on-going clinical trials, scheduling conflicts with participating clinics and the rate of patient enrollment in clinical trials. If we or our
17
collaborators do not achieve milestones when anticipated, we may not achieve our planned revenue, and our stock price could decline.
We may not realize anticipated benefits from future acquisitions.
As part of our business strategy, we may in the future make acquisitions of, or significant investments in, businesses with complementary products, services and/or technologies. Acquisitions involve numerous risks, including, but not limited to:
• difficulties and increased costs in connection with integration of the personnel, operations, technologies and products of acquired companies;
• diversion of management’s attention from other operational matters;
• the potential loss of key employees;
• the potential loss of key collaborators;
• lack of synergy, or the inability to realize expected synergies, resulting from the acquisition; and
• acquired intangible assets becoming impaired as a result of technological advancements or worse-than-expected performance of the acquired company.
Mergers and acquisitions are inherently risky and involve significant investments in time and resources to effectively manage these risks and integrate an acquired business. Even with these investments in time and resources, an acquisition may not produce the revenues, earnings or business synergies we anticipate. An acquisition that fails to meet our expectations could materially and adversely affect our business, financial condition and results of operations.
Because we rely on a small number of collaborators for a significant portion of our revenue, if one or more of our major collaborators terminates or reduces the scope of their agreement with us, our revenue may significantly decrease.
A relatively small number of collaborators account for a significant portion of our revenue. Genentech, AstraZeneca and InterMune accounted for 28%, 27% and 10%, respectively, or our total revenue in fiscal 2005, and AstraZeneca, Genentech and Eli Lilly accounted for 18%, 13% and 12%, respectively, of our total revenue for the fiscal 2004. The majority of our research funding from Eli Lilly ended in March 2005 and the research funding from AstraZeneca ends between October and December 2005. We expect that revenue from a limited number of collaborators, including Genentech, AstraZeneca and InterMune, will account for a large portion of our revenue in future quarters. In general, our collaborators may terminate their contracts with us upon 30 to 90 days’ notice for a number of reasons or, in some cases, for no reason. In addition, some of our major collaborators can determine the amount of products delivered and research or development performed under these agreements. As a result, if any one of our major collaborators cancels, declines to renew or reduces the scope of its contract with us, our revenue may decrease.
We may not be able to recruit and retain the experienced scientists and management we need to compete in the drug research and development industry.
We have 269 employees as of June 30, 2005, and our future success depends upon our ability to attract, retain and motivate highly skilled scientists and management. Our ability to achieve our business strategies, including progressing drug candidates through later stage development or commercialization, attracting new collaborators and retaining, renewing and expanding existing collaborations, depends on our ability to hire and retain high caliber scientists and other qualified experts. We compete with pharmaceutical and biotechnology companies, contract research companies and academic and research institutions to recruit personnel. We may not be successful in attracting new scientists or management or in retaining or motivating our existing personnel.
Our future success also depends on the personal efforts and abilities of the principal members of our senior management and scientific staff to provide strategic direction, manage our operations and maintain a cohesive and stable environment. In particular, we rely on the services of Robert E. Conway, our Chief Executive Officer; Dr. Kevin Koch, our President and Chief Scientific Officer; Dr. David L. Snitman, our Chief Operating Officer and Vice President, Business Development; Dr. Anthony D. Piscopio, our Vice President, Chemistry and Director of
18
Process Chemistry; R. Michael Carruthers, our Chief Financial Officer; and John R. Moore, our Vice President and General Counsel. We have employment agreements with all of the above personnel that are terminable upon 30 days’ prior notice. If we cannot attract and retain qualified scientists and management, we will not be able to continue to provide or expand our drug discovery offerings.
We may not be able to meet the delivery and performance requirements set forth in our collaboration agreements.
In order to maintain our current collaborative relationships and to meet the performance and delivery requirements in our agreements, we must be able to provide drug discovery capabilities at appropriate levels, with acceptable quality and at an acceptable cost. Our ability to deliver the drug discovery capabilities we offer to our collaborators is limited by many factors, including the difficulty of the chemistry and biology, the lack of predictability in the scientific process and having adequate scientific expertise. The inability to meet our existing or future contractual commitments may result in delayed or lost revenue, loss of collaborators or failure to expand our existing relationships.
Our quarterly operating results could fluctuate significantly.
Entering into out-licensing or drug discovery collaborations typically involves significant technical evaluation and/or commitment of capital by our collaborators. Accordingly, negotiation can be lengthy and is subject to a number of significant risks, including collaborators’ budgetary constraints and internal acceptance reviews. In addition, a significant portion of our revenue is attributable to up-front payments and milestones that are non-recurring. Further, some of our collaborators can influence when we deliver products and perform services under their contracts with us. Due to these factors, our operating results could fluctuate significantly from quarter to quarter. In addition, we may experience significant fluctuations in quarterly operating results due to factors such as general and industry-specific economic conditions that may affect the research and development expenditures of pharmaceutical and biotechnology companies.
Due to the possibility of fluctuations in our revenue and expenses, we believe that quarter-to-quarter comparisons of our operating results are not a good indication of our future performance. Our operating results in some quarters may not meet the expectations of stock market analysts and investors. If we do not meet analysts’ and/or investors’ expectations, our stock price could decline.
We expect that revenue from our research tools will decline as a percentage of our total revenue in the future as we focus more resources on our proprietary research programs.
We expect that revenue from our research tools, such as Optimerâ building blocks, Lead Generation Libraries and custom synthesis, will decline as a percentage of our total revenue in the future as we focus greater resources on drug discovery programs. We also face greater competition for these tools and services, particularly from foreign chemistry service providers that have made progress in recent years in obtaining significant contracts to provide customer designed custom screening library compounds to major pharmaceutical companies due to significantly lower cost structures. As a result of this competition, our collaborators may decide to fulfill some or all of their needs through other providers or internally. In light of these changes in market conditions and our expectation that future revenue for our Lead Generation Libraries and Optimer building blocks will decline, we reduced the carrying values for our inventories. We increased the inventory reserves during fiscal 2004 and fiscal 2003, resulting in non-cash charges of $5.6 million and $4.1 million, respectively. We perform periodic reviews and, when required, write down our inventories for non-marketability when the cost of inventory exceeds the estimated market value based upon assumptions about future demand and market conditions. If future market conditions are less favorable than projected, we may determine that further increases in our inventory reserves are necessary. As of June 30, 2005 we had $533,000 and $1.6 million in inventory, net of reserves, related to our Optimer building blocks and fine chemical or reagent supplies, respectively.
Our cGMP and pharmacology facilities and practices may fail to comply with government regulations.
All facilities and manufacturing processes used in the production of Active Pharmaceutical Ingredients for clinical use in the United States must be operated in conformity with current Good Manufacturing Practices (cGMP), as established by the FDA. We operate a clinical-scale manufacturing facility that we believe conforms
19
with cGMP requirements. This facility and our cGMP practices are subject to periodic regulatory inspections to ensure compliance with cGMP requirements. In addition, we could be required to comply with specific requirements of our collaborators, which may exceed FDA requirements. Failure on our part to comply with applicable regulations and specific requirements of our collaborators could result in the termination of ongoing research or the disqualification of data for submission to regulatory authorities. Material violations of cGMP requirements could result in regulatory sanctions and, in severe cases, could result in a mandated closing of our cGMP facility.
In addition, our pharmacology facility may be subject to the United States Department of Agriculture (USDA) regulations for certain animal species. Failure on our part to comply with applicable regulations and specific requirements of our collaborators could result in the termination of ongoing pharmacology research. Material violations of USDA requirements could result in additional regulatory sanctions and, in severe cases, could result in a mandated closing of our pharmacology facility for certain species.
Our development, testing and manufacture of drug candidates may expose us to product liability lawsuits.
We develop, test and manufacture drug candidates that are generally intended for use in humans. Our drug discovery activities that result in the future manufacture and sale of drugs by our collaborators expose us to the risk of liability for personal injury or death to persons using these drugs. We may be required to pay substantial damages or incur legal costs in connection with defending any of these product liability claims, or we may not receive revenue from expected royalty or milestone payments if the commercialization of a drug is limited or ceases as a result of such claims. We have product liability insurance that contains customary exclusions and provides coverage up to $3.0 million per occurrence and in the aggregate, which we believe is customary in our industry. However, our product liability insurance does not cover every type of product liability claim that we may face or loss we may incur, and may not adequately compensate us for the entire amount of covered claims or losses or for the harm to our business reputation. We may be unable to acquire or maintain additional or maintain our current insurance policies at acceptable costs or at all.
If our use of chemical and hazardous materials violates applicable laws or regulations or causes personal injury we may be liable for damages.
Our drug discovery activities, including the analysis and synthesis of chemical compounds, involve the controlled use of chemicals, including flammable, combustible, toxic and radioactive materials that are potentially hazardous. Our use, storage, handling and disposal of these materials is subject to federal, state and local laws and regulations, including the Resource Conservation and Recovery Act, the Occupational Safety and Health Act and local fire codes, and regulations promulgated by the Department of Transportation, the Drug Enforcement Agency, the Department of Energy, the Colorado Department of Public Health and Environment, and the Colorado Department of Human Services, Alcohol and Drug Abuse Division. We may incur significant costs to comply with these laws and regulations in the future. In addition, we cannot completely eliminate the risk of accidental contamination or injury from these materials, which could result in material unanticipated expenses, such as substantial fines or penalties, remediation costs or damages, or the loss of a permit or other authorization to operate or engage in our business. Those expenses could exceed our net worth and limit our ability to raise additional capital.
Our operations could be interrupted by damage to our specialized laboratory facilities.
Our operations are dependent upon the continued use of our highly specialized laboratories and equipment in Boulder and Longmont, Colorado. Catastrophic events, including fires or explosions, could damage our laboratories, equipment, scientific data, work in progress or inventories of chemical compounds and may materially interrupt our business. We employ safety precautions in our laboratory activities in order to reduce the likelihood of the occurrence of these catastrophic events; however, we cannot eliminate the chance that such an event will occur. The availability of laboratory space in these locations is limited, and rebuilding our facilities could be time consuming and result in substantial delays in fulfilling our agreements with our collaborators. We maintain business interruption insurance in the amount of $18.0 million to cover continuing expenses and lost revenue caused by such occurrences. However, this insurance does not compensate us for the loss of opportunity and potential harm to customer relations that our inability to meet our collaborators’ needs in a timely manner could create.
20
RISKS RELATED TO OUR INDUSTRY
The concentration of the pharmaceutical and biotechnology industry and any further consolidation could reduce the number of our potential collaborators.
There are a limited number of pharmaceutical and biotechnology companies, and these companies represent a significant portion of the market for our capabilities. The number of our potential collaborators could decline even further through consolidation among these companies. If the number of our potential collaborators declines even further, they may be able to negotiate greater rights to the intellectual property they license from us, price discounts or other terms that are unfavorable to us.
Capital market conditions may reduce our biotechnology collaborators’ ability to fund research.
Traditionally, many unprofitable biotechnology companies have funded their research and development expenditures through raising capital in the equity markets. Declines and uncertainties in these markets have severely restricted raising new capital at times in the past and have affected these companies’ ability to continue to expand or fund existing research and development efforts. If our current or future biotechnology collaborators are unable to raise sufficient capital to fund research and development expenditures, we may not be able to expand or maintain current revenue.
Health care reform and cost control initiatives by third-party payors could reduce the prices that can be charged for drugs, which could limit the commercial success of our drug candidates.
The commercial success of our drug candidates will depend significantly on the availability of reimbursement to the patient from third party payors, such as the government and private insurance plans. In the United States, the Medicare Prescription Drug, Improvement and Modernization Act of 2003 adds prescription drug benefit to Medicare beginning in 2006 and added a voluntary drug discount card program for Medicare beneficiaries otherwise without prescription drug coverage. However, future legislation may limit the prices that can be charged for drugs we develop and may limit our commercial opportunity and reduce any associated revenue and profits. For example, federal laws require drug manufacturers to pay specified rebates for medicines reimbursed by Medicaid and to provide discounts for out-patient medicines purchased by certain public health service entities and “disproportionate share” hospitals and for purchases by some federal governmental departments such as the Department of Veterans Affairs and the Department of Defense. In some countries other than the United States, pricing and profitability of prescription pharmaceuticals and biopharmaceuticals are subject to government control. Also, we expect managed care will continue to put pressure on the pricing of pharmaceutical and biopharmaceutical products. Cost control initiatives could decrease the price that we, or any potential collaborators receive for any of our future products, which could adversely affect our profitability. These initiatives may also have the effect of reducing the resources that pharmaceutical and biotechnology companies can devote to in-licensing drug candidates and the research and development of new drugs, which could reduce our resulting revenue.
We or our collaborators may not obtain favorable reimbursement rates for our drug candidates.
Third party payors, such as government and private insurance plans, frequently require companies to provide rebates and predetermined discounts from list prices and are increasingly challenging the prices charged for pharmaceuticals and other medical products. Our products may not be considered cost-effective, and reimbursement to the patient may not be available or be sufficient to allow the sale of our products on a competitive basis. We, or our collaborators may not be able to negotiate favorable reimbursement rates for our products. If we, or our collaborators fail to obtain an adequate level of reimbursement for our products by third-party payors, sales of the drugs would be adversely affected or there may be no commercially viable market for the products.
The drug research and development industry has a history of patent and other intellectual property litigation, and we may be involved in costly intellectual property lawsuits.
The drug research and development industry has a history of patent and other intellectual property litigation, and we believe these lawsuits are likely to continue. Legal proceedings relating to intellectual property would be expensive, take significant time and divert management’s attention from other business concerns. Because we produce drug candidates for a broad range of therapeutic areas and provide many different capabilities in this
21
industry, we face potential patent infringement suits by companies that control patents for similar drug candidates or capabilities or other suits alleging infringement of their intellectual property rights. There could be issued patents of which we are not aware that our products infringe or patents that we believe we do not infringe that we are ultimately found to infringe. Moreover, patent applications are in many cases maintained in secrecy until patents are issued. The publication of discoveries in the scientific or patent literature frequently occurs substantially later than the date on which the underlying discoveries were made and patent applications were filed. Because patent applications can take many years to issue, there may be currently pending applications of which we are unaware that may later result in issued patents that we infringe with our products. In addition, technology created under our research and development collaborations may infringe the intellectual property rights of third parties, in which case we may not receive milestone or royalty revenue from those collaborations.
If we do not prevail in an infringement lawsuit brought against us, we might have to pay substantial damages, including triple damages, and we could be required to stop the infringing activity or obtain a license to use the patented technology or redesign our products so as not to infringe the patent. We may not be able to enter into licensing arrangements at a reasonable cost or effectively redesign our products. Any inability to secure licenses or alternative technology could delay the introduction of our products or prevent us from manufacturing or selling products.
The intellectual property rights we rely on to protect our proprietary drug candidates and the technology underlying our tools and techniques may be inadequate to prevent third parties from using our technology or developing competing capabilities or to protect our interests in our proprietary drug candidates.
Our success will depend in part on our ability to protect patents and maintain the secrecy of proprietary processes and other technologies we develop for the testing and synthesis of chemical compounds in the drug discovery process. In addition, one of our business strategies is to develop our own proprietary drug candidates and enter into collaborations with pharmaceutical and biotechnology companies for the development of these drug candidates. In order to protect our rights to our proprietary drug candidates, we must obtain and maintain the intellectual property rights to such drug candidates. We currently have seven issued United States patents and numerous patent applications on file with the United States Patent and Trademark Office and around the world.
Any patents that we may own or license now or in the future may not afford meaningful protection for our drug candidates or our technology and tools. In order to protect or enforce our intellectual property rights, we may have to initiate legal proceedings against third parties. Our efforts to enforce and maintain our intellectual property rights may not be successful and may result in substantial costs and diversion of management time. In addition, other companies may challenge our patents and, as a result, these patents could be narrowed, invalidated or rendered unenforceable, or we may be forced to stop using the technology covered by these patents or to license the technology from third parties. In addition, current and future patent applications on which we depend may not result in the issuance of patents in the United States or foreign countries. Even if our rights are valid, enforceable and broad in scope, competitors may develop drug candidates or other products based on similar research or technology that is not covered by our patents.
Patent applications relating to or affecting our business may have been filed by a number of pharmaceutical and biopharmaceutical companies and academic institutions. A number of the technologies in these applications or patents may conflict with our technologies, patents or patent applications, which could reduce the scope of patent protection we could otherwise obtain. We could also become involved in interference proceedings in connection with one or more of our patents or patent applications to determine priority of inventions. We cannot be certain that we are the first creator of inventions covered by pending patent applications, or that we were the first to file patent applications for any such inventions.
Drug candidates we develop that are approved for commercial marketing by the FDA would be subject to the provisions of the Drug Price Competition and Patent Term Restoration Act of 1984, known as the “Hatch-Waxman Act.” The Hatch-Waxman Act provides companies with marketing exclusivity for varying time periods during which generic versions of a drug may not be marketed and allows companies to apply to extend patent protection for up to five additional years. It also provides a means for approving generic versions of a drug once the marketing exclusivity period has ended and all relevant patents have expired. The period of exclusive marketing, however, may be shortened if a patent is successfully challenged and defeated, which could reduce the amount of royalties we receive on the product.
22
Agreements we have with our employees, consultants and collaborators may not afford adequate protection for our trade secrets, confidential information and other proprietary information.
In addition to patent protection, we also rely on copyright and trademark protection, trade secrets, know-how, continuing technological innovation and licensing opportunities. In an effort to maintain the confidentiality and ownership of our trade secrets and proprietary information, we require our employees, consultants and advisors to execute confidentiality and proprietary information agreements. However, these agreements may not provide us with adequate protection against improper use or disclosure of confidential information and there may not be adequate remedies in the event of unauthorized use or disclosure. Furthermore, we may from time to time hire scientific personnel formerly employed by other companies involved in one or more areas similar to the activities we conduct. In some situations, our confidentiality and proprietary information agreements may conflict with, or be subject to, the rights of third parties with whom our employees, consultants or advisors have prior employment or consulting relationships. Although we require our employees and consultants to maintain the confidentiality of all proprietary information of their previous employers, these individuals, or we, may be subject to allegations of trade secret misappropriation or other similar claims as a result of their prior affiliations. Finally, others may independently develop substantially equivalent proprietary information and techniques or otherwise gain access to our trade secrets. Our failure or inability to protect our proprietary information and techniques may inhibit or limit our ability to compete effectively, or exclude certain competitors from the market.
The drug research and development industry is highly competitive, and we compete with some companies that offer a broader range of capabilities and have better access to resources than we do.
The pharmaceutical and biotechnology industries are characterized by rapid and continuous technological innovation. We compete with companies worldwide that are engaged in the research and discovery, licensing, development and commercialization of drug candidates, including Arena Pharmaceuticals Inc; Arqule; Cytokinetics Inc; deCODE genetics Inc; Exelixis Inc; Incyte Corporation; Theravance, Inc.; and Vertex Pharmaceuticals Incorporated. Some of our competitors have a broader range of capabilities and have greater access to financial, technical, scientific, regulatory, business development, recruiting and other resources than we do. Their access to greater resources may allow them to develop processes or products that are more effective, safer or less costly, or gain greater market acceptance, than products we develop or for which they obtain FDA approval more rapidly than we do. We anticipate that we will face increased competition in the future as new companies enter the market and advanced technologies become available.
We face potential liability related to the privacy of health information we obtain from research institutions.
Most health care providers, including research institutions from whom we or our collaborators obtain patient information, are subject to privacy regulations promulgated under the Health Insurance Portability and Accountability Act of 1996, or HIPAA. Although we are not directly regulated by HIPAA, we could face substantial criminal penalties if we knowingly receive individually identifiable health information from a health care provider or research institution that has not satisfied HIPPA’s disclosure standards. In addition, certain state privacy laws and genetic testing laws may apply directly to our operations and/or those of our collaborators and may impose restrictions on our use and dissemination of individuals’ health information. Moreover, patients about whom we or our collaborators obtain information, as well as the providers who share this information with us, may have contractual rights that limit our ability to use and disclose the information. Claims that we have violated individuals’ privacy rights or breached our contractual obligations, even if we are not found liable, could be expensive and time-consuming to defend and could result in adverse publicity that could harm our business.
23
RISKS RELATED TO OUR STOCK
Our officers and directors have significant control over us and their interests may differ from those of our stockholders.
At June 30, 2005, our directors and officers beneficially owned or controlled approximately 14% of our common stock. Individually and in the aggregate, these stockholders significantly influence our management, affairs and all matters requiring stockholder approval. These stockholders may vote their shares in a way with which other stockholders do not agree. In particular, this concentration of ownership may have the effect of delaying, deferring or preventing an acquisition of us or entrenching management and may adversely affect the market price of our common stock.
Because our stock price may be volatile, our stock price could experience substantial declines.
The market price of our common stock has historically experienced and may continue to experience volatility. The high and low closing bids for our common stock were $9.73 and $5.66 respectively in fiscal 2005 and $11.61 and $3.10 respectively in fiscal 2004. Our quarterly operating results, the success or failure of our internal drug discovery efforts, changes in general conditions in the economy or the financial markets and other developments affecting our collaborators, our competitors or us could cause the market price of our common stock to fluctuate substantially. This volatility and market declines over the past several years have affected the market prices of securities issued by many companies, often for reasons unrelated to their operating performance, and may adversely affect the price of our common stock. In the past, securities class action litigation has often been instituted following periods of volatility in the market price of a company’s securities. A securities class action suit against us could result in potential liabilities, substantial costs and the diversion of management’s attention and resources, regardless of whether we win or lose.
Because we do not intend to pay dividends, stockholders will benefit from an investment in our common stock only if it appreciates in value.
We have never declared or paid any cash dividends on our common stock and are restricted in our ability to do so under our current credit agreement. We currently intend to retain our future earnings, if any, to finance the expansion of our business and do not expect to pay any cash dividends in the foreseeable future. As a result, the success of an investment in our common stock will depend entirely upon any future appreciation. There is no guarantee that our common stock will appreciate in value or even maintain the price at which stockholders have purchased their shares.
The ability of our stockholders to control our policies and effect a change of control of our company is limited, which may not be in the best interests of our stockholders.
There are provisions in our certificate of incorporation and bylaws that may discourage a third party from making a proposal to acquire us, even if some of our stockholders might consider the proposal to be in their best interests. These include the following provisions in our certificate of incorporation:
• Our certificate of incorporation provides for three classes of directors with the term of office of one class expiring each year, commonly referred to as a “staggered board.” By preventing stockholders from voting on the election of more than one class of directors at any annual meeting of stockholders, this provision may have the effect of keeping the current members of our board of directors in control for a longer period of time than stockholders may desire.
• Our certificate of incorporation authorizes our board of directors to issue shares of preferred stock without stockholder approval and to establish the preferences and rights of any preferred stock issued, which would allow the board to issue one or more classes or series of preferred stock that could discourage or delay a tender offer or change in control.
24
In addition, our board of directors approved a Rights Agreement on August 2, 2001, which could prevent or deter a potential unsolicited takeover of us by causing substantial dilution of an acquirer of 15% or more of our outstanding common stock. We are also subject to the business combination provisions of Section 203 of the Delaware General Corporation Law, which, in general, imposes restrictions upon acquirers of 15% or more of our stock. As a result, it is difficult for a third party to acquire control of us without the approval of the board of directors and, therefore, mergers and acquisitions of us that our stockholders may consider in their best interests may not occur.
Item 2. Properties
We are headquartered in Boulder, Colorado, where we lease approximately 144,000 square feet of office and laboratory space under a lease that expires April 1, 2008. We have options to extend the entire Boulder lease for three additional terms for up to 18 years. We also lease two connected buildings of approximately 75,000 total square feet of laboratory space in Longmont, Colorado under two leases that expire on March 31, 2008. The March 31, 2008 terms will automatically extend to May 31, 2013, unless the landlord is unable to provide certain expansion space to us and we choose to maintain the March 31, 2008 expiration date. We have options to extend the leases for three additional consecutive terms of five years each. We also have the option to expand the Longmont leased space by up to an additional 80,000 square feet in adjacent buildings. In addition, we have the right to purchase each of the leased buildings in Longmont, including the expansion space.
Item 3. Legal Proceedings
We may be involved, from time to time, in various claims and legal proceedings arising in the ordinary course of our business. We are not currently a party to any such claims or proceedings that, if decided adversely to us, would either individually or in the aggregate have a material adverse effect on our business, financial condition or results of operations.
Item 4. Submission of Matters to a Vote of Security Holders
No matters were submitted to a vote of our security holders, through solicitation of proxies or otherwise, during the fourth quarter of the year ended June 30, 2005.
25
PART II
Item 5. Market for the Registrant’s Common Equity, Related Stockholder Matters and Issuer Purchases of Equity Securities
The following table sets forth, for the periods indicated, the range of the high and low closing bid for Array’s common stock.
| | High | | Low | |
Fiscal Year Ended June 30, 2005 | | | | | |
First Quarter | | $ | 8.29 | | $ | 5.66 | |
Second Quarter | | 9.73 | | 6.66 | |
Third Quarter | | 9.50 | | 6.80 | |
Fourth Quarter | | 7.06 | | 5.67 | |
| | | | | |
Fiscal Year Ended June 30, 2004 | | | | | |
First Quarter | | $ | 6.36 | | $ | 3.10 | |
Second Quarter | | 6.07 | | 4.60 | |
Third Quarter | | 9.34 | | 5.95 | |
Fourth Quarter | | 11.61 | | 7.95 | |
As of August 31, 2005, there were approximately 100 holders of record of our common stock. This does not include the number of persons whose stock is in nominee or “street name” accounts through brokers.
Dividend Policy
We have never declared or paid any cash dividends on our common stock and we do not intend to pay any cash dividends in the foreseeable future. In addition, the terms of our loan agreement restrict our ability to pay cash dividends to our stockholders. We currently intend to retain all available funds and any future earnings for use in the operations of our business and to fund future growth.
26
Item 6. Selected Financial Data
The following selected financial data is derived from our audited financial statements. These historical results do not necessarily indicate future results. When you read this data, it is important that you also read our financial statements and related notes, as well as the section “Management’s Discussion and Analysis of Financial Condition and Results of Operations” appearing elsewhere in this Annual Report on Form 10-K.
| | Fiscal Years Ended June 30, | |
| | 2005 | | 2004 | | 2003 | | 2002 | | 2001 | |
| | (in thousands, except per share data) | |
Statements of Operations Data | | | | | | | | | | | |
Revenue | | | | | | | | | | | |
Collaboration revenue | | $ | 34,343 | | $ | 28,186 | | $ | 33,633 | | $ | 33,854 | | $ | 16,364 | |
License and milestone revenue | | 11,162 | | 6,645 | | 1,492 | | 1,235 | | 642 | |
Total revenue | | 45,505 | | 34,831 | | 35,125 | | 35,089 | | 17,006 | |
| | | | | | | | | | | |
Costs and expenses | | | | | | | | | | | |
Cost of revenue (1) | | 38,048 | | 37,257 | | 35,136 | | 28,759 | | 19,694 | |
Research and development for proprietary drug discovery | | 22,871 | | 15,905 | | 11,395 | | 5,542 | | 1,587 | |
Selling, general and administrative expenses | | 9,372 | | 8,016 | | 8,901 | | 6,918 | | 7,671 | |
Total operating expenses | | 70,291 | | 61,178 | | 55,432 | | 41,219 | | 28,952 | |
| | | | | | | | | | | |
Loss from operations | | (24,786 | ) | (26,347 | ) | (20,307 | ) | (6,130 | ) | (11,946 | ) |
Interest expense including loss from early extinguishment of debt | | — | | — | | — | | — | | (812 | ) |
Interest income | | 1,542 | | 381 | | 787 | | 1,483 | | 2,092 | |
Other expense - loss on investment | | — | | — | | (500 | ) | — | | — | |
Net loss | | (23,244 | ) | (25,966 | ) | (20,020 | ) | (4,647 | ) | (10,666 | ) |
Deemed dividend related to beneficial conversion feature of preferred stock | | — | | — | | — | | — | | (5,000 | ) |
Net loss applicable to common stockholders | | $ | (23,244 | ) | $ | (25,966 | ) | $ | (20,020 | ) | $ | (4,647 | ) | $ | (15,666 | ) |
| | | | | | | | | | | |
Basic and diluted net loss per share applicable to common stockholders | | $ | (0.68 | ) | $ | (0.91 | ) | $ | (0.72 | ) | $ | (0.19 | ) | $ | (1.00 | ) |
| | | | | | | | | | | |
Number of shares used to compute per share data | | 34,043 | | 28,511 | | 27,830 | | 24,920 | | 15,693 | |
| | | | | | | | | | | |
Balance Sheet Data | | | | | | | | | | | |
Cash, cash equivalents, restricted cash and marketable securities | | $ | 92,706 | | $ | 37,446 | | $ | 34,130 | | $ | 59,598 | | $ | 47,712 | |
Property, plant and equipment, gross | | 61,517 | | 57,557 | | 53,939 | | 44,365 | | 21,458 | |
Working capital | | 80,435 | | 24,652 | | 38,321 | | 57,350 | | 44,917 | |
Total assets | | 127,952 | | 77,764 | | 83,830 | | 107,915 | | 70,950 | |
Long term debt | | 10,000 | | — | | — | | — | | — | |
Total stockholders’ equity | | 99,415 | | 54,493 | | 77,039 | | 93,673 | | 62,406 | |
(1) Cost of revenue includes a provision for excess inventory of $5.6 million and $4.1 million in fiscal year 2004 and 2003, respectively.
27
Item 7. Management’s Discussion and Analysis of Financial Condition and Results of Operations
The Management’s Discussion and Analysis of Financial Condition and Results of Operations contains forward-looking statements within the meaning of the Private Securities Litigation Reform Act of 1995, including statements about our expectations related to realizing new revenue streams and obtaining future collaboration agreements that include milestone and/or royalty payments, our ability to realize such milestone and royalty payments under our existing or any future agreements, the success of our internal proprietary drug discovery activities, future research and development spending, our working capital requirements and our future headcount requirements. These statements involve significant risks and uncertainties, including those discussed below and those described more fully under the caption “Risk Factors” above and in other reports filed by Array BioPharma with the Securities and Exchange Commission.
The following discussion of our financial condition and results of operations should be read in conjunction with the financial statements and notes to those statements included elsewhere in this report.
Overview
Array BioPharma is a biopharmaceutical company focused on the discovery, development and commercialization of targeted small molecule drugs to treat life threatening and debilitating diseases. Our proprietary drug development pipeline is primarily focused on the treatment of cancer and inflammatory disease and includes clinical candidates that are designed to regulate therapeutically important targets. In addition, leading pharmaceutical and biotechnology companies collaborate with Array to discover and develop drug candidates across a broad range of therapeutic areas.
We have identified multiple drug candidates in our own proprietary programs and in collaborations with other drug companies. We intend to progress our proprietary drug programs internally through clinical testing and continue to evaluate select programs for out-licensing opportunities with pharmaceutical and biotechnology partners.
To date, we have advanced four programs we wholly own:
• ErbB-2/EGFR (cancer), in which the lead compound, ARRY-334543, is expected to begin a Phase I clinical trial in the fall of 2005;
• MEK (inflammation), in which the lead compound is in regulated safety assessment testing; and
• p38 (inflammation) and ErbB-2 (cancer), which have compounds in preclinical development.
In addition, we have out-licensed proprietary cancer programs to AstraZeneca PLC (ARRY-142886), which is currently in Phase Ib clinical trials, and Genentech, Inc., which involves two early stage programs.
We have built our drug development pipeline, and our discovery and development capabilities, primarily through cash flow from collaborations and through sales of our equity securities. Through June 30, 2005, we have recognized $156 million in research funding, and we have generated $18 million in up-front payments and $6 million in milestone payments from our collaborators and out-licensing partners. Under our existing collaboration agreements, we have the potential to earn over $190 million in additional milestone payments if we achieve all of the drug discovery objectives under these agreements, as well as royalties on any resulting product sales from 14 different programs. In December 2004, we raised approximately $67 million in a follow-on public offering of our common stock.
We have incurred net losses since inception and expect to incur losses in the near future as we continue to invest in our proprietary drug discovery programs. As of June 30, 2005, we had an accumulated deficit of $94.0 million.
Revenue. We generate revenue through the out-licensing of select proprietary drug discovery programs for license and up-front fees, research funding, based on the number of full-time equivalents contractually assigned to the program, and research and development milestone payments. We also have the potential to generate revenue from royalties on future product sales. Four programs have been out-licensed to date, and we have received up-front license fees of $18 million in total from AstraZeneca, Genentech and Amgen Inc.
We also generate revenue through collaborations aimed at inventing drug candidates for our collaborators. We receive research funding or collaboration revenue based on the number of full-time equivalent employees
28
contractually assigned to a program, plus related research expenses. Under certain of these agreements, we are entitled to receive additional payments based on the achievement of research milestones, drug development milestones and/or royalties based on sales of products created as a result of these collaborations.
We sell our Optimer building blocks, which are the starting materials used to create more complex chemical compounds in the drug discovery process, on a per-compound basis without any restrictions on use. In addition, we have licensed our Lead Generation Libraries, which are a collection of structurally related chemical compounds that may have the potential of becoming drug candidates, on a non-exclusive basis to our collaborators for their internal research purposes. We are no longer developing new Lead Generation Libraries other than for our proprietary research. Under our existing agreements, we retain all other rights to the compounds, which permits us to license the same compounds to other collaborators. Some of our existing Lead Generation Library agreements allow our collaborators to obtain exclusive rights to commercialize particular compounds upon the payment of additional fees. For the fiscal years 2005, 2004, and 2003, Lead Generation Library revenue represented 4%, 10% and 12%, respectively, of total revenue. During the second quarter of fiscal 2005, we sold compounds representing the remaining net book value of Lead Generation Library inventory to a single major biotechnology company. Future revenue from any sales of compounds in our Lead Generation Library is not expected to be significant.
We report revenue for lead generation and lead optimization research, custom synthesis and process research, the development and sale of chemical compounds and the co-development of proprietary drug candidates we out-license, as collaboration revenue. License and milestone revenue is combined and reported separately from collaboration revenue.
Revenue recognition. We recognize revenue from fees under our collaboration agreements on a monthly basis as work is performed. Per-compound revenue is recognized as compounds are shipped. Revenue from license fees and up-front fees are non refundable and are recognized on a straight-line basis over the expected period of the related research program. Payments received in advance of performance are recorded as advance payments from collaborators until the revenue is earned. Milestone payments are non refundable and are recognized as revenue over the expected period of the related research program. A portion of any milestone payment is recognized at the date the milestone is achieved which is determined using the applicable percentage of the research term that has elapsed at the date the milestone is achieved. Any balance is recognized ratably over the remaining research term. Revenue recognition related to license fees, up-front payments and milestone payments could be accelerated in the event of early termination of programs.
Customer concentration. Our top 20 collaborators contributed over 98% of our total revenue for fiscal 2005 and our top three collaborators, Genentech, AstraZeneca and InterMune, Inc., accounted for 28%, 27% and 10%, respectively, of our total revenue. During fiscal 2004, AstraZeneca, Genentech and Eli Lilly and Company accounted for 18%, 13% and 12%, respectively, of our total revenue. In general, our collaborators may terminate their collaboration agreements with us on 30 to 90 days’ prior notice.
Cost of revenue. Cost of revenue consists mainly of compensation, associated fringe benefits and other collaboration-related costs, including research and development conducted for our collaborators, supplies, small tools, facilities, depreciation, recruiting and relocation and other direct and indirect chemical handling and laboratory support costs. Fine chemicals consumed as well as any required inventory reserve adjustments are also recorded as cost of revenue. We review the level and value of our chemical inventories periodically and, when required, write down the carrying cost of our inventories for non-marketability to estimated net realizable value through an appropriate reserve.
Research and development expenses for proprietary drug discovery. Research and development expenses for proprietary drug discovery consists of all costs associated with our proprietary drug development pipeline, including salaries and benefits, consulting and outsourced services, laboratory supplies, and allocated facility costs and depreciation. When an internal proprietary program is out-licensed, all subsequent costs of the out-licensed program are reported as cost of revenue.
Selling, general and administrative expenses. Selling, general and administrative expenses consist mainly of compensation and associated fringe benefits not included in cost of revenue or research and development expenses and include other management, business development, accounting, information technology and administration costs, including patent prosecution, recruiting and relocation, consulting and professional services, travel and meals,
29
advertising, sales commissions, facilities, depreciation and other office expenses. In addition, termination related costs of approximately $541,000 associated with a reduction in workforce completed in March 2003 were recorded as selling, general and administrative expenses during fiscal year 2003.
Business development. We currently license or sell our compounds and enter into collaborations directly with pharmaceutical and biotechnology companies through opportunities identified by our business development group, senior management, scientists and customer referrals. In addition, we license or sell our compounds and collaborations in Japan through an agent. International revenue represented 40% of our total revenue during fiscal year 2005, up from 33% for fiscal year 2004. Our international revenue is primarily attributable to both European and Japanese collaborations and increased in fiscal 2005 over the prior year due to the collaboration and out-licensing agreement with AstraZeneca that we initiated in December 2003. All of our collaboration agreements and purchase orders are denominated in United States dollars.
Future outlook. We plan to increase our investment in proprietary research to broaden our product pipeline and advance drugs further in clinical development. Array will consider commercializing select programs with appropriate market characteristics while continuing to evaluate out-licensing opportunities to maximize their risk-adjusted return. As part of these efforts, we expect near term selling, general and administrative costs to rise in connection with increased patent and other intellectual property related costs incurred to protect and enforce our intellectual property rights in our proprietary programs. As we devote more scientists to our proprietary research, we expect fewer scientists will be assigned to revenue generating collaborations. In addition, we will recognize approximately $833,000 each month in revenue through November 2005 from previously received up-front and milestone payments from out-licensed proprietary programs. Because of our strategy to retain other proprietary programs later in clinical development before out-licensing them or commercializing them ourselves, it is unlikely that this revenue will be replaced in 2006. Our statements about future events in this paragraph are subject to many risks and uncertainties, including many that are beyond our control. These risks are described more fully under the caption “Risk Factors” included herein and in other reports filed by Array BioPharma with the Securities and Exchange Commission.
Deferred Stock Compensation
We recorded compensation expense related to stock option grants of approximately $154,000, $2.0 million and $1.9 million in fiscal years 2005, 2004 and 2003, respectively. The compensation expense related to stock option grants is charged to cost of revenue, research and development expenses, and selling, general and administrative expenses, based on the functional responsibility of the associated employee. As of June 30, 2005, we had no remaining deferred stock compensation.
Results of Operations
Fiscal Years Ended June 30, 2005, 2004 and 2003:
Revenue
| | Years Ended June 30, | | % increase (decrease) | |
| | 2005 | | 2004 | | 2003 | | 2004 to 2005 | | 2003 to 2004 | |
| | (in thousands) | | | | | |
Collaboration revenue | | $ | 34,343 | | $ | 28,186 | | $ | 33,633 | | 22 | % | (16 | )% |
License and milestone revenue | | 11,162 | | 6,645 | | 1,492 | | 68 | % | 345 | % |
Total revenue | | $ | 45,505 | | $ | 34,831 | | $ | 35,125 | | 31 | % | (1 | )% |
Fiscal 2005 as compared to fiscal 2004: Total revenue for fiscal 2005 grew 31% from 2004 with improvements in both collaboration revenue, which increased $6.2 million, and license and milestone revenue, which increased $4.5 million. The improvement in collaboration revenue was the result of increased revenue, totaling $14.6 million, from new or expanded collaborations with Genentech, AstraZeneca, InterMune, Takeda Pharmaceutical Company, Elan Pharmaceuticals, Inc., and Roche Palo Alto LLC. This increase was partially offset by expired research programs with ICOS Corporation, Japan Tobacco Inc., and GenPath Pharmaceuticals, which had resulted in a total
30
of $4.4 million in revenue during fiscal 2004. Further offsetting the increase in collaboration revenue were the declines in revenue from custom libraries of $3.1 million and Lead Generation Libraries of $1.4 million, each declining primarily due to continued increasing competition from foreign chemistry service providers.
The up-front license fee and Phase I milestone payment for ARRY-142886 that we received from AstraZeneca in the latter half of fiscal 2004, together with the up-front license fee that we received from Genentech in the same half of the fiscal 2004, aggregating $20 million, caused the majority of the increase to license and milestone revenue. Revenues associated with these arrangements were recognized over the full year of fiscal 2005, compared to recognition during only part of the year in fiscal 2004. A $1 million milestone payment received from Amgen in fiscal 2005 also contributed to the increased license and milestone revenue.
Fiscal 2004 as compared to fiscal 2003: Total revenue for fiscal 2004 and 2003 remained relatively flat. Increased revenue from up-front license fees and milestone payments largely offset the decline in collaboration revenue. Partial recognition of up-front license fees from AstraZeneca and Genentech and a Phase I milestone payment for ARRY-142886 from AstraZeneca, totaling $20 million in the aggregate, represented the majority of the increase to license and milestone revenue. Decreased collaboration revenue from expired programs with ICOS, Amgen, Merck and Co., Inc., and Vertex Pharmaceuticals Incorporated of $11.5 million in total was partially offset by revenue from new collaborations with Genentech, AstraZeneca and GenPath of $6.8 million in total. In addition, collaboration revenue from our Lead Generation Libraries and Optimer building blocks declined $1.4 million in fiscal 2004 compared to 2003, primarily due to increased competition from foreign chemistry service providers.
Cost of Revenue
| | Years Ended June 30, | | % increase (decrease) | |
| | 2005 | | 2004 | | 2003 | | 2004 to 2005 | | 2003 to 2004 | |
| | (in thousands) | | | | | |
Cost of revenue | | $ | 38,048 | | $ | 31,641 | | $ | 31,036 | | 20 | % | 2 | % |
Provision for excess inventory | | — | | 5,616 | | 4,100 | | (100 | )% | 37 | % |
Total cost of revenue | | $ | 38,048 | | $ | 37,257 | | $ | 35,136 | | 2 | % | 6 | % |
Fiscal 2005 as compared to fiscal 2004: The increased cost of revenue for fiscal 2005 of 20% over 2004 is largely the result of supporting the 22% increase in collaboration revenue. Improvements in cost of revenue as a percentage of collaboration revenue of 111% in fiscal 2005 compared to 112% in fiscal 2004 is the result of slightly improved average pricing from collaborations and the reduction in the custom library business. Cost of revenue includes $1.2 million for accrued bonuses, which was offset by a decrease in stock compensation expense of $1.4 million.
Fiscal 2004 as compared to fiscal 2003: The increased cost of revenue for fiscal 2004 was primarily related to increased costs associated with staffing various collaborations, including increased scientific salaries and benefits and to a lesser extent, increased utility charges. We also experienced slightly lower average pricing received from collaborations than in the prior year. Also during 2004, we had a lower percentage of our total revenue generated from licensing of chemical compounds from Lead Generation Libraries and sales of Optimer building blocks.
Due to the evolution of our business model to focus primarily on our proprietary drug discovery efforts, we do not expect that Lead Generation Libraries will be a significant source of revenues in future periods, and no new Lead Generation Libraries will be produced other than for our own proprietary research. Consequently, we reviewed the inventory levels and carrying values for Lead Generation Libraries, Optimer building blocks and fine chemicals during the third quarter of fiscal 2004. Based on this review and on an analysis of expected future sales and industry standards relating to net carrying values, we determined that there was an excess level of Lead Generation Library and Optimer building block inventory. We also determined that our inventory of fine chemicals used as the starting materials for Lead Generation Libraries exceeded anticipated usage. Accordingly, we increased the reserves for these inventories, which resulted in a non-cash charge for excess inventory of $5.6 million in the third quarter of fiscal 2004.
31
During the fourth quarter of fiscal year 2003, we increased our inventory reserves for Lead Generation Libraries by $4.1 million. The reserves were increased in light of difficult market conditions and resulting declines in Lead Generation Library revenue experienced during the second half of fiscal 2003.
Research and Development Expenses for Proprietary Drug Discovery
Our research and development expenses for proprietary drug discovery include costs associated with our proprietary drug programs for scientific personnel, supplies, equipment, consultants, sponsored research, allocated facility costs, costs related to preclinical and clinical trials, and stock-based compensation. We manage our proprietary programs based on scientific data and achievement of research plan goals. Our scientists record their time to specific projects when possible. However, many activities simultaneously benefit multiple projects and cannot be readily attributed to a specific project. Accordingly, the accurate assignment of time and costs to a specific project is difficult and may not give a true indication of the actual costs of a particular project. As a result, we do not report costs on a program basis. The following table shows our research and development expenses by categories of costs for the periods presented:
| | Years Ended June 30, | | % increase | |
| | 2005 | | 2004 | | 2003 | | 2004 to 2005 | | 2003 to 2004 | |
| | (in thousands) | | | | | |
Salaries and benefits | | $ | 8,035 | | $ | 7,523 | | $ | 5,552 | | 7 | % | 36 | % |
Consulting and outsourced services | | 4,998 | | 1,584 | | 592 | | 216 | % | 168 | % |
Laboratory supplies | | 3,739 | | 2,601 | | 1,976 | | 44 | % | 32 | % |
Facilities and depreciation | | 5,795 | | 3,974 | | 3,122 | | 46 | % | 27 | % |
Other | | 303 | | 223 | | 153 | | 36 | % | 46 | % |
| | | | | | | | | | | |
Research and development expenses for proprietary drug discovery | | $ | 22,871 | | $ | 15,905 | | $ | 11,395 | | 44 | % | 40 | % |
Fiscal 2005 as compared to fiscal 2004: Research and development expenses for proprietary drug discovery increased 44% over the prior fiscal year relating to accrued bonuses, increased laboratory supplies, facilities’ costs and depreciation related to our expanded facilities, and increased pharmacology studies supporting our expanded efforts to advance proprietary compounds into regulated safety testing. The most significant increase in costs came from outsourced pharmacology studies to support the advancement of our ErB2/EGFR, P38, Mek for inflammation, and other programs. As a result, total consulting and outsourced services costs, including pharmacology studies, increased to $5.0 million in 2005, from $1.6 million in 2004. We expect that proprietary research and development spending will continue to increase as we focus more resources on our proprietary drug discovery programs and advance our programs potentially through clinical development. For fiscal year 2005, we expensed approximately $820,000 related to accrued cash bonuses that were paid subsequent to June 2005.
Fiscal 2004 as compared to fiscal 2003: Research and development expenses for proprietary drug discovery increased 40% related to our expanded efforts to advance compounds into regulated safety testing. In addition, a number of new programs were initiated during the year, and the lead compound in our MEK for cancer program advanced through regulated safety assessment. Supporting these efforts were additional scientists and increased outsourced and internally generated pharmacology studies.
The scope and magnitude of future research and development expenses are difficult to predict given the number of studies that will need to be conducted for any of our potential products, as well as our limited capital resources. In general, biopharmaceutical development involves a series of steps – beginning with identification of a potential target and including, among others, proof of concept in animals and Phase I, II and III clinical studies in humans – each of which is typically more expensive than the previous step. Therefore, we expect our research and development costs to increase as we progress our programs through development.
The successful development and commercialization of drugs resulting from our proprietary programs is highly uncertain and subject to a number of risks that are beyond our control. The duration and cost of discovery, preclinical, nonclinical and clinical trials may vary significantly based on the type, complexity and novelty of a product and are difficult to predict. The FDA and comparable agencies in foreign countries impose substantial
32
requirements on the introduction of therapeutic pharmaceutical products, typically requiring lengthy and detailed laboratory and clinical testing procedures, sampling activities and other costly and time-consuming procedures. Data obtained from preclinical, nonclinical and clinical activities at any step in the testing process may be adverse and lead to discontinuation or redirection of development activity or be susceptible to varying interpretations, which could delay, limit or prevent regulatory approval. Accurate and meaningful estimates of the ultimate costs to bring our drug candidates to market are not available. Given the uncertainties related to development, we are currently unable to reliably estimate when, if ever, our drug candidates will generate revenue and net cash inflows.
Status of Significant Proprietary Programs
The following table summarizes the status of our most advanced drug candidates.
Drug Target | | Indication | | Development Status |
MEK | | Cancer | | ARRY-142886 (AZD6244) Beginning Phase Ib clinical trials |
| | | | |
ErbB-2/EGFR | | Cancer | | Beginning Phase I clinical trials in the fall of 2005 |
| | | | |
MEK | | Inflammation | | Regulated safety assessment |
| | | | |
P38 | | Inflammation | | Pre-clinical development |
| | | | |
ErbB-2 | | Cancer | | Pre-clinical development |
Clinical timelines, likelihood of success and total completion costs vary significantly for each drug candidate and are difficult to estimate. We estimate that it takes 10 to 15 years or possibly longer, to discover, develop and bring to market a new pharmaceutical product in the United States as outlined in the following table:
Phase: | | Objective: | | Estimated
Duration: |
Discovery | | Lead identification and target validation | | 2 to 4 years |
Preclinical | | Initial toxicology for preliminary identification of risks for humans; gather early pharmacokinetic data | | 1 to 2 years |
Phase I | | Evaluate safety in humans; study how the drug works, metabolizes and interacts with other drugs | | 1 to 2 years |
Phase II | | Establish effectiveness of the drug and its optimal dosage; continue safety evaluation | | 2 to 4 years |
Phase III | | Confirm efficacy, dosage regime and safety profile of the drug; submit New Drug Application | | 2 to 4 years |
FDA approval | | Approval by the FDA to sell and market the drug under approved labeling | | 6 months to 2 years |
Animal and other nonclinical studies typically are conducted during each phase of human clinical studies.
We anticipate that we will make determinations as to which research programs to pursue and how much funding to direct to each program on an ongoing basis in response to the scientific and clinical success of each drug candidate. The lengthy process of seeking regulatory approvals, and subsequent compliance with applicable regulations, require the expenditure of substantial resources. Any failure by us to obtain, or any delay in obtaining, regulatory approvals could cause our research and development expenditures to increase and, in turn, have a material adverse effect on our results of operations.
33
Selling, General and Administrative Expenses
| | Years Ended June 30, | | % increase (decrease) | |
| | 2005 | | 2004 | | 2003 | | 2004 to 2005 | | 2003 to 2004 | |
| | (in thousands) | | | | | |
Selling, general and administrative expenses | | $ | 9,372 | | $ | 8,016 | | $ | 8,902 | | 17 | % | (10 | )% |
| | | | | | | | | | | | | | |
Fiscal 2005 as compared to fiscal 2004: The increase in selling, general and administrative expenses was primarily related to increased patents and patent application costs related to our expanding proprietary drug development programs of approximately $420,000 and, to a lesser degree, increased compliance costs of approximately $303,000 related to Section 404 of the Sarbanes-Oxley Act. The remaining increase was attributable to increases in compensation and benefit related expenses. Selling, general and administrative expenses include approximately $680,000 for accrued bonuses, which was partially offset by a decrease in stock compensation expense of approximately $447,000. We expect patent related costs to continue to increase in the near term and the Sarbanes-Oxley Act compliance costs to decrease due to first year implementation expenses that are not expected to recur.
Fiscal 2004 as compared to fiscal 2003: The decrease in selling, general and administrative expenses was attributable to a March 2003 workforce reduction whereby we reduced our workforce by 31 employees in order to reduce costs and match our headcount resources with the near-term demand for our collaboration programs. This reduction resulted in a fiscal 2003 charge to selling, general and administrative expenses of approximately $541,000 for termination-related costs consisting primarily of severance payments and out-placement services for affected employees. The remaining year over year decrease was attributable to cost savings associated with the elimination of certain administrative positions that were affected by this reduction in workforce.
Compensation Related to Option Grants
| | Years Ended June 30, | | % increase (decrease) | |
| | 2005 | | 2004 | | 2003 | | 2004 to 2005 | | 2003 to 2004 | |
| | (in thousands) | | | | | |
Compensation related to option grants | | $ | 151 | | $ | 1,977 | | $ | 1,883 | | (92 | )% | 5 | % |
| | | | | | | | | | | | | | |
Fiscal 2005 as compared to fiscal 2004: During the first quarter of fiscal 2005, we recorded approximately $151,000 of stock compensation expense, representing the final amortization of deferred stock compensation related to the vesting of stock options that were granted prior to our initial public offering of common stock in November 2000.
Fiscal 2004 as compared to fiscal 2003: Compensation expense relates to certain stock options that were granted prior to the November 2000 initial public offering. This non-cash charge was recognized on a straight-line basis over the vesting periods of the related options, which was generally four years.
Net Interest Income
| | Years Ended June 30, | | % increase (decrease) | |
| | 2005 | | 2004 | | 2003 | | 2004 to 2005 | | 2003 to 2004 | |
| | (in thousands) | | | | | |
Net interest income | | $ | 1,542 | | $ | 381 | | $ | 787 | | 305 | % | (52 | )% |
| | | | | | | | | | | | | | |
Fiscal 2005 as compared to fiscal 2004: The increase in interest income in fiscal 2005 compared to fiscal 2004 is due to higher investment interest rates earned on a higher average marketable securities balance. Our marketable securities balance increased significantly during the year due to the follow-on public offering completed in December 2004.
Fiscal 2004 as compared to fiscal 2003: The decrease in interest income in fiscal 2004 compared to fiscal 2003 was due to lower investment interest rates earned on a lower average marketable securities balance.
34
Other
Other Expense – Loss on investment. In March 2002, we entered into a drug discovery collaboration agreement with Aptus Genomics, Inc. to create small molecule therapeutics against select G-Protein Coupled Receptor (GPCR) targets. Array worked exclusively with Aptus on a select number of GPCR targets and provided Aptus access to its Lead Generation Libraries in exchange for $500,000 of common stock in Aptus. During fiscal 2003, the value of Aptus common stock decreased significantly. We determined this reduction in value to be other-than-temporary and as a result, wrote off our investment.
Income taxes. There was no income tax expense for the fiscal years ended June 30, 2005, 2004 or 2003. At June 30, 2005, we had federal and Colorado income tax net operating loss carryforwards for income tax purposes of $79.0 million, which will expire beginning in 2018 and continuing through 2025. We have provided a 100% valuation allowance against the related deferred tax assets, as based on available evidence, it is more likely than not that the deferred tax asset will not be realized.
Liquidity and Capital Resources
| | As of June 30, | |
| | 2005 | | 2004 | | 2003 | |
| | (in thousands) | |
Cash, cash equivalents, restricted cash and marketable securities | | $ | 92,706 | | $ | 37,446 | | $ | 34,130 | |
Increase (decrease) in net operating assets and liabilities, excluding cash, cash equivalents and marketable securities | | 2,726 | | (21,029 | ) | 7,569 | |
Purchases of property, plant and equipment | | 5,682 | | 3,627 | | 9,570 | |
| | | | | | | |
Cash flow provided by (used in): | | | | | | | |
Operating activities | | (17,178 | ) | 5,499 | | (17,585 | ) |
Investing activities | | (55,043 | ) | (4,190 | ) | 4,090 | |
Financing activities | | 78,151 | | 1,609 | | 1,517 | |
| | | | | | | | | | |
Fiscal 2005 as compared to fiscal 2004: We have historically funded our operations through cash received from our collaborations and the issuance of equity securities. As of June 30, 2005, cash, cash equivalents, restricted cash and marketable securities totaled $92.7 million compared with $37.4 million at June 30, 2004. This increase was primarily attributable to the net proceeds received from our common stock offering in December 2004, resulting in net proceeds of $66.6 million.
Net cash used in operating activities for fiscal year 2005 was $17.2 million, compared to net cash provided by operating activities of $5.5 million for fiscal 2004. During fiscal year 2005, our net loss of $23.2 million was reduced by noncash charges of $8.8 million, primarily associated with depreciation and deferred rent expense. For the fiscal year 2005, our net operating assets and liabilities, excluding cash and marketable securities, increased by $2.7 million. This was due to decreases in advance payment balances of $10.6 million from collaborators, which was partially offset by decreased inventory balances of $1.9 million and increased accrued compensation, accounts payable and other liabilities totaling $5.3 million. The combined balance of advance payments from collaborators decreased by $10.6 million during fiscal year 2005 due to the recognition of revenue from previously received up-front license and milestone payments. The decrease in inventory balances resulted from a significant sale of Lead Generation Library chemical compounds that occurred in the second quarter of fiscal 2005. Accrued compensation and benefits increased primarily from reserving for a planned cash employee bonus program for the year.
During fiscal year 2005, we invested $5.7 million in laboratory equipment, primarily for our process research, biology and cGMP manufacturing operations, as well as in various computer hardware and software. Purchases of marketable securities used $121.7 million of cash while proceeds from the sale and maturity of marketable securities provided $73.0 million of cash. Approximately $726,000 of cash became restricted during the year in support of outstanding standby letters of credit related to our facilities leases that increased in a like amount. Financing
35
activities provided $78.2 million of cash consisting of $66.6 million in net proceeds from our public common stock offering, $10.0 million for proceeds received from the issuance of long term debt and $1.6 million of cash resulting from the exercise of stock options under our stock option plan and purchases of stock under our employee stock purchase plan.
Fiscal 2004 as compared to fiscal 2003: As of June 30, 2004, cash, cash equivalents, restricted cash and marketable securities totaled $37.4 million compared to $34.1 million at June 30, 2003. Net cash provided by operating activities was $5.5 million for fiscal year 2004, compared to net cash used in operating activities of $17.6 million for fiscal 2003. During fiscal year 2004, our net loss of $26.0 million was reduced by noncash charges of $16.1 million associated with depreciation, compensation related to stock option grants, deferred rent and a provision for excess inventory. For the fiscal year 2004, our net operating assets and liabilities, excluding cash and marketable securities, decreased by $21.0 million primarily due to a $16.2 million increase in advance payments from collaborators and a $5.0 million decrease in inventories. Advance payments from collaborators primarily increased due to the receipt of up-front license and milestone payments totaling $20.8 million for fiscal 2004. We recognized $6.6 million of these up-front license and milestone payments as revenue during 2004, and recorded the remaining amounts as advance payments from collaborators. Inventories decreased by $5.0 million due to the increased inventory reserves for Lead Generation Libraries, Optimer building blocks and certain fine chemicals used as the starting materials for Lead Generation Libraries.
During fiscal year 2004, we invested $3.6 million in capital equipment and leasehold improvements primarily associated with equipping and commencing operations in our new pharmacology and drug metabolism facilities. Financing activities provided $1.6 million of cash resulting from the exercise of stock options under our stock option plan and purchases of stock under our employee stock purchase plan.
Our future capital requirements will depend on a number of factors, including the rate at which we invest in proprietary research, the growth of our collaboration business and the amount of collaboration research funding we receive, the timing of milestone and royalty payments, if any, from our collaboration and out-licensed programs, our capital spending on new facilities and equipment, expenses associated with unforeseen litigation, regulatory changes, competition, technological developments, general economic conditions and the extent to which we acquire or invest in other businesses, products and technologies.
In addition, our future capital requirements may be impacted if we do not receive potential milestone or royalty payments under our existing or future collaboration agreements. Our ability to realize these payments is subject to a number of risks, many of which are beyond our control and include the following: the drug development process is risky and highly uncertain, and we or our collaborators may not be successful in commercializing drug candidates we create; our collaborators have substantial control and discretion over the timing and continued development and marketing of drug candidates we create; the sale and manufacture of drug candidates we develop may not obtain regulatory approval; and, if regulatory approval is received, drugs we develop will remain subject to regulation or may not gain market acceptance, which could delay or prevent us from generating milestone or royalty revenue from the commercialization of these drugs.
We believe that our existing cash, cash equivalents and marketable securities and anticipated cash flow from existing collaboration agreements will be sufficient to support our current operating plan for at least the next 12 months. This estimate of our future capital requirements is a forward-looking statement that is based on assumptions that may prove to be wrong and that involve substantial risks and uncertainties. Our actual future capital requirements could vary as a result of a number of factors, including:
• the progress of our research activities;
• the availability of resources for revenue generating collaborations as we devote more resources to our proprietary programs;
• our ability to enter into agreements to out-license and co-develop our proprietary drug candidates, and the timing of those agreements in each candidate’s development stage;
• the number and scope of our research programs;
• the progress of our preclinical and clinical development activities;
• the progress of the development efforts of our collaborators;
• our ability to establish and maintain current and new collaboration agreements;
• the ability of our collaborators to fund research and development programs;
36
• the costs involved in enforcing patent claims and other intellectual property rights;
• the decision to stay in our current facilities, or to consolidate operations in an existing or new location;
• the costs and timing of regulatory approvals; and
• the costs of establishing clinical development, business development and distribution or commercialization capabilities.
Until we can generate sufficient levels of cash from our operations, which we do not expect to achieve in the foreseeable future, we expect to continue to utilize our existing cash and marketable securities resources that were primarily generated from the proceeds of our equity offerings. In addition, we may finance future cash needs through the sale of equity securities, strategic collaboration agreements and debt financing. We cannot assure that we will be successful in obtaining new or in retaining existing out-license or collaboration agreements, in securing agreements for the co-development of our proprietary drug candidates, or in receiving milestone and/or royalty payments under those agreements, that our existing cash and marketable securities resources will be adequate or that additional financing will be available when needed or that, if available, this financing will be obtained on terms favorable to us or our stockholders. Insufficient funds may require us to delay, scale back or eliminate some or all of our research or development programs or to relinquish greater or all rights to product candidates at an earlier stage of development or on less favorable terms than we would otherwise choose, or may adversely affect our ability to operate as a going concern. If we raise additional funds by issuing equity securities, substantial dilution to existing stockholders may result.
Obligations and Commitments
The following table shows our contractual obligations and commitments as of June 30, 2005.
| | Payments due by period | |
| | (in thousands) | |
| | Less than
1 year | | 1-3 years | | 4-5 years | | After 5
years | | Total | |
Operating lease obligations | | $ | 4,920 | | $ | 9,090 | | $ | 1,603 | | $ | 7,353 | | $ | 22,966 | |
Purchase obligations | | 4,738 | | 238 | | — | | — | | 4,976 | |
Debt obligations | | 450 | | 900 | | 10,900 | | — | | 12,250 | |
Total obligations | | $ | 10,108 | | $ | 10,228 | | $ | 12,503 | | $ | 7,353 | | $ | 40,192 | |
We are obligated under noncancelable operating leases for our facilities and certain equipment. Original lease terms for our facilities range from five to eight years with renewal options and generally require us to pay a proportionate share of real estate taxes, insurance, common area and other operating costs. Equipment leases generally range from three to five years.
Due to the high cost to replace and the limited availability of laboratory facilities, we concluded that the exercise of a portion of our lease term options for at least 15 years was reasonably assured. During the last quarter of fiscal 2005, we reassessed our facility requirements, and began to consider the possibility of consolidating operations in one of our existing locations, or a new location. While we have not yet made a final determination whether to consolidate operations at one location, it is no longer reasonably assured that we will remain in our Boulder, Colorado location beyond the initial lease term, which ends in March 2008. We have not changed our determination that it is reasonably assured that we will exercise certain of our lease extensions and lease our other facility, located in Longmont, Colorado, for at least another 13 years. Therefore, we have included in our operating lease obligations reflected in the table above the cash to be paid for our facility leases for the remaining reasonably assured lease terms of three years for our Boulder facility and 13 years for our Longmont facility. The portion of operating lease obligations that is related to optional extension periods for our Longmont facility is $4.8 million and is included within the “after 5 years” column above.
At June 30, 2005, we had restricted cash of $2.0 million as a compensating balance to support outstanding standby letters of credit that were issued during the prior fiscal years in relation to our facilities leases.
37
Critical Accounting Policies
We believe critical accounting policies are essential to the understanding of our results of operations and require our management to make significant judgments in preparing the financial statements included in this report. Management has made estimates and assumptions based on these policies. We do not believe that materially different amounts would be reported if different assumptions were used. However, the application of these policies involves judgments and assumptions as to future events and, as a result, actual results could differ. The impact and any associated risks related to these policies on our business operations is discussed throughout Management’s Discussion and Analysis of Financial Condition and Results of Operations where such policies affect our reported and expected financial results.
Revenue Recognition
We believe our revenue recognition policy is significant because the amount and timing of revenue is a key component of our results of operations. We follow the guidance of Staff Accounting Bulletin No. 104, which requires that a series of criteria be met in order to recognize revenue related to the performance of services or the shipment of products. If these criteria are not met, the associated revenue is deferred until the criteria are met. We recognize revenue when (a) persuasive evidence of an arrangement exists, (b) products are delivered or services are rendered, (c) the sales price is fixed or determinable and (d) collectibility is assured.
Most of our revenue is derived from designing, creating, optimizing and evaluating drug candidates for our collaborators. The majority of our collaboration revenue consists of fees received based on contracted annual rates for full time equivalent employees working on a project. Our collaboration agreements also include license and up-front fees, milestone payments upon achievement of specified research or development goals and royalties on sales of resulting products. A small portion of our revenue comes from development and fixed fee revenue and from sales of compounds on a per-compound basis.
Our collaboration agreements typically call for a specific level of resources as measured by the number of full time equivalent employees working a defined number of hours per year at a stated price under the agreement. We recognize revenue under our collaboration agreements on a monthly basis for fees paid to us based on hours worked. We recognize revenue from sales of Lead Generation Library and Optimer building block compounds as the compounds are shipped, as these agreements are priced on a per-compound basis and title and risk of loss passes upon shipment to our customers.
Revenue from license fees and up-front fees is non refundable and is recognized on a straight-line basis over the expected period of the related research program. Milestone payments are non refundable and are recognized as revenue over the expected period of the related research program. A portion of any milestone payment is recognized at the date the milestone is achieved which is determined using the applicable percentage of the research term that has elapsed at the date the milestone is achieved. Any balance is recognized ratably over the remaining research term. Revenue recognition related to license fees, up-front payments and milestone payments could be accelerated in the event of early termination of programs.
In general, contract provisions include predetermined payment schedules or the submission of appropriate billing detail. Payments received in advance of performance are recorded as advance payments from collaborators until the revenue is earned.
We report revenue for lead generation and lead optimization research, custom synthesis and process research, the development and sale of chemical compounds and the co-development of proprietary drug candidates we out-license, as collaboration revenue. License and milestone revenue is combined and reported separately from collaboration revenue.
Recent Accounting Pronouncements
For a summary of recent accounting pronouncements, see Note 2: “Summary of Significant Accounting Policies – Recent Accounting Pronouncements” under Notes to Financial Statements included in Item 8 “Financial Statements and Supplementary Data” of this Form 10-K.
38
Item 7A. Quantitative and Qualitative Disclosures about Market Risk
Interest rate risk. Our interest income is sensitive to changes in the general level of United States interest rates, particularly since a significant portion of our investments are and will be in short-term marketable securities. Due to the nature and short-term maturities of our short-term investments, we have concluded that there is no material market risk exposure. Based on outstanding investment balances at June 30, 2005, a change of 100 basis points in interest rates would result in a $924,000 change in our annual interest income.
We are also impacted by adverse changes in interest rates relating to variable-rate borrowings under our credit facility used for working capital purposes. We pay interest on advances under our loan agreement at one of three variable rates, which are adjusted periodically for changes in the underlying prevailing rate. Changes in prevailing interest rates will not affect the fair market value of our debt, but would impact future results of operations and cash flows. At June 30, 2005, we had $10 million of long-term debt outstanding and the interest rate on our term loan was 4.5%. This rate is adjusted based on changes in the bank’s prime lending rate. Assuming constant debt levels, a change of 100 basis points in our interest rate would result in a $100,000 change in our annual interest expense.
Foreign currency rate fluctuations. All of our collaboration agreements and purchase orders are denominated in United States dollars. Therefore, we are not exposed to changes in foreign currency exchange rates.
Inflation. We do not believe that inflation has had a material impact on our business or operating results during the periods presented.
39
Item 8. Financial Statements and Supplementary Data
INDEX TO FINANCIAL STATEMENTS
40
REPORT OF INDEPENDENT REGISTERED PUBLIC ACCOUNTING FIRM
To the Board of Directors and Stockholders of
Array BioPharma Inc.:
We have audited the accompanying balance sheet of Array BioPharma Inc. as of June 30, 2005, and the related statements of operations, stockholders’ equity and comprehensive loss, and cash flows for the year then ended. In connection with our audit of the financial statements, we also have audited financial statement schedule II for the year ended June 30, 2005. These financial statements and financial statement schedule are the responsibility of the Company’s management. Our responsibility is to express an opinion on these financial statements and financial statement schedule based on our audit.
We conducted our audit in accordance with the standards of the Public Company Accounting Oversight Board (United States). Those standards require that we plan and perform the audit to obtain reasonable assurance about whether the financial statements are free of material misstatement. An audit includes examining, on a test basis, evidence supporting the amounts and disclosures in the financial statements. An audit also includes assessing the accounting principles used and significant estimates made by management, as well as evaluating the overall financial statement presentation. We believe that our audit provides a reasonable basis for our opinion.
In our opinion, the financial statements referred to above present fairly, in all material respects, the financial position of the Company as of June 30, 2005, and the results of its operations and its cash flows for the year then ended, in conformity with U.S. generally accepted accounting principles. Also in our opinion, the related financial statement schedule for the year ended June 30, 2005, when considered in relation to the basic financial statements taken as a whole, presents fairly, in all material respects, the information set forth therein.
We also have audited, in accordance with the standards of the Public Company Accounting Oversight Board (United States), the effectiveness of Array BioPharma Inc.’s internal control over financial reporting as of June 30, 2005, based on criteria established in Internal Control—Integrated Framework issued by the Committee of Sponsoring Organizations of the Treadway Commission (COSO), and our report dated September 12, 2005 expressed an unqualified opinion on management’s assessment of, and the effective operation of, internal control over financial reporting.
Boulder, Colorado
September 12, 2005
41
REPORT OF INDEPENDENT REGISTERED PUBLIC ACCOUNTING FIRM
To the Board of Directors and Stockholders of
Array BioPharma Inc.
We have audited the accompanying balance sheets of Array BioPharma, Inc. as of June 30, 2004 and 2003, and the related statements of operations, shareholders’ equity, and cash flows for each of the three years in the period ended June 30, 2004. Our audits also included financial statement schedule II. These financial statements and schedule are the responsibility of the Company’s management. Our responsibility is to express an opinion on these financial statements and schedules based on our audits.
We conducted our audits in accordance with the standards of the Public Company Accounting Oversight Board (United States). Those standards require that we plan and perform the audit to obtain reasonable assurance about whether the financial statements are free of material misstatement. We were not engaged to perform an audit of the Company’s internal control over financial reporting. Our audit included consideration of internal control over financial reporting as a basis for designing audit procedures that are appropriate in the circumstances, but not for the purpose of expressing an opinion on the effectiveness of the Company’s internal control over financial reporting. Accordingly, we express no such opinion. An audit also includes examining, on a test basis, evidence supporting the amounts and disclosures in the financial statements, assessing the accounting principles used and significant estimates made by management, and evaluating the overall financial statement presentation. We believe that our audits provide a reasonable basis for our opinion.
In our opinion, the financial statements referred to above present fairly, in all material respects, the financial position of Array BioPharma, Inc. at June 30, 2004 and 2003, and the consolidated results of its operations and its cash flows for each of the three years in the period ended June 30, 2004, in conformity with U.S. generally accepted accounting principles. Also, in our opinion, the related financial statement schedule, when considered in relation to the basic financial statements taken as a whole, presents fairly in all material respects the information set forth therein.
Denver, Colorado
July 29, 2004
42
ARRAY BIOPHARMA INC.
BALANCE SHEETS
| | As of June 30, | |
| | 2005 | | 2004 | |
ASSETS | | | | | |
Current assets | | | | | |
Cash and cash equivalents | | $ | 12,429,526 | | $ | 6,499,589 | |
Marketable securities | | 78,296,782 | | 29,693,301 | |
Restricted cash - current | | 1,979,678 | | — | |
Accounts receivable, net | | 679,609 | | 1,080,330 | |
Inventories, net | | 2,153,486 | | 4,030,681 | |
Prepaid expenses and other | | 1,025,871 | | 1,315,786 | |
Total current assets | | 96,564,952 | | 42,619,687 | |
| | | | | |
Property, plant and equipment, net | | 31,306,452 | | 33,810,952 | |
| | | | | |
Restricted cash - long term | | — | | 1,253,223 | |
Other assets | | 80,246 | | 80,246 | |
Total assets | | $ | 127,951,650 | | $ | 77,764,108 | |
| | | | | |
LIABILITIES AND STOCKHOLDERS’ EQUITY | | | | | |
Current liabilities | | | | | |
Accounts payable | | $ | 3,708,656 | | $ | 2,408,718 | |
Advance payments from collaborators - current | | 6,698,292 | | 14,108,118 | |
Accrued compensation and benefits | | 4,320,755 | | 1,048,909 | |
Deferred rent - current | | 341,555 | | — | |
Other current liabilities | | 1,061,080 | | 402,090 | |
Total current liabilities | | 16,130,338 | | 17,967,835 | |
| | | | | |
Long term liabilities | | | | | |
Advance payments from collaborators - long term | | 937,500 | | 4,166,665 | |
Deferred rent and other liabilities | | 1,354,533 | | 1,136,188 | |
Long term debt | | 10,000,000 | | — | |
Other long term liabilities | | 113,933 | | — | |
Total long term liabilities | | 12,405,966 | | 5,302,853 | |
Total liabilities | | 28,536,304 | | 23,270,688 | |
| | | | | |
Stockholders’ equity | | | | | |
Preferred stock, $0.001 par value; 10,000,000 shares authorized, no shares issued or outstanding | | — | | — | |
Common stock, $0.001 par value; 60,000,000 shares authorized; 38,466,804 and 28,871,979 shares issued and outstanding at June 30, 2005 and 2004, respectively | | 38,467 | | 28,872 | |
Additional paid-in capital | | 193,696,156 | | 125,555,122 | |
Accumulated deficit | | (94,040,179 | ) | (70,796,155 | ) |
Accumulated other comprehensive loss | | (279,098 | ) | (143,415 | ) |
Deferred stock-based compensation | | — | | (151,004 | ) |
Total stockholders’ equity | | 99,415,346 | | 54,493,420 | |
Total liabilities and stockholders’ equity | | $ | 127,951,650 | | $ | 77,764,108 | |
See accompanying notes.
43
ARRAY BIOPHARMA INC.
STATEMENTS OF OPERATIONS
| | Years Ended June 30, | |
| | 2005 | | 2004 | | 2003 | |
Revenue | | | | | | | |
Collaboration revenue | | $ | 34,343,022 | | $ | 28,185,609 | | $ | 33,633,601 | |
License and milestone revenue | | 11,162,494 | | 6,645,381 | | 1,491,812 | |
Total revenue | | 45,505,516 | | 34,830,990 | | 35,125,413 | |
| | | | | | | |
Costs and expenses | | | | | | | |
Cost of revenue (1) | | 38,048,077 | | 37,256,852 | | 35,136,097 | |
Research and development for proprietary drug discovery | | 22,870,777 | | 15,905,107 | | 11,394,941 | |
Selling, general and administrative expenses | | 9,372,457 | | 8,015,746 | | 8,901,853 | |
Total operating expenses | | 70,291,311 | | 61,177,705 | | 55,432,891 | |
| | | | | | | |
Loss from operations | | (24,785,795 | ) | (26,346,715 | ) | (20,307,478 | ) |
| | | | | | | |
Interest income | | 1,541,771 | | 380,855 | | 787,087 | |
Other expense -loss on investment | | — | | — | | (500,000 | ) |
Net loss | | $ | (23,244,024 | ) | $ | (25,965,860 | ) | $ | (20,020,391 | ) |
| | | | | | | |
Basic and diluted net loss per share | | $ | (0.68 | ) | $ | (0.91 | ) | $ | (0.72 | ) |
| | | | | | | |
Number of shares used to compute per share data | | 34,042,826 | | 28,511,457 | | 27,829,527 | |
(1) Cost of revenue includes a provision for excess inventory of $5.6 million and $4.1 million in fiscal 2004 and 2003, respectively.
See accompanying notes.
44
ARRAY BIOPHARMA INC.
STATEMENTS OF STOCKHOLDERS’ EQUITY
AND COMPREHENSIVE INCOME (LOSS)
| | | | | | | | | | Notes | | Accumulated | | | | | |
| | | | | | Additional | | | | Receivable for | | Other | | | | | |
| | Common Stock | | Paid-In | | Accumulated | | Common Stock - | | Comprehensive | | Deferred | | | |
| | Shares | | Amount | | Capital | | Deficit | | Related Party | | Income (Loss) | | Compensation | | Total | |
Balance at June 30, 2002 | | 27,520,780 | | $ | 27,520 | | $ | 123,274,749 | | $ | (24,809,904 | ) | $ | (155,625 | ) | $ | 33,300 | | $ | (4,697,015 | ) | $ | 93,673,025 | |
Issuance of common stock under stock option and employee stock purchase plans | | 700,300 | | 701 | | 1,358,880 | | — | | — | | — | | — | | 1,359,581 | |
Interest accrued on notes receivable | | — | | — | | — | | — | | (1,558 | ) | — | | — | | (1,558 | ) |
Repayment of notes receivable | | — | | — | | — | | — | | 157,183 | | — | | — | | 157,183 | |
Compensation related to stock option grants | | — | | — | | — | | — | | — | | — | | 1,882,771 | | 1,882,771 | |
Reversal of prior year deferred stock compensation for terminated employees | | — | | — | | (582,970 | ) | — | | — | | — | | 582,970 | | — | |
Net loss | | — | | — | | — | | (20,020,391 | ) | — | | — | | — | | (20,020,391 | ) |
Change in unrealized loss on marketable securities | | — | | — | | — | | — | | — | | (11,444 | ) | — | | (11,444 | ) |
Comprehensive loss | | | | | | | | | | | | | | | | (20,031,835 | ) |
Balance at June 30, 2003 | | 28,221,080 | | 28,221 | | 124,050,659 | | (44,830,295 | ) | — | | 21,856 | | (2,231,274 | ) | 77,039,167 | |
Issuance of common stock under stock option and employee stock purchase plans | | 650,899 | | 651 | | 1,608,075 | | — | | — | | — | | — | | 1,608,726 | |
Compensation related to stock option grants | | — | | — | | — | | — | | — | | — | | 1,976,658 | | 1,976,658 | |
Reversal of prior year deferred stock compensation for terminated employees | | — | | — | | (103,612 | ) | — | | — | | — | | 103,612 | | — | |
Net loss | | — | | — | | — | | (25,965,860 | ) | — | | — | | — | | (25,965,860 | ) |
Change in unrealized loss on marketable securities | | — | | — | | — | | — | | — | | (165,271 | ) | — | | (165,271 | ) |
Comprehensive loss | | | | | | | | | | | | | | | | (26,131,131 | ) |
Balance at June 30, 2004 | | 28,871,979 | | 28,872 | | 125,555,122 | | (70,796,155 | ) | — | | (143,415 | ) | (151,004 | ) | 54,493,420 | |
Issuance of common stock for cash-public offering, net of offering costs of $4,724,853 | | 9,200,000 | | 9,200 | | 66,565,947 | | — | | — | | — | | — | | 66,575,147 | |
Issuance of common stock under stock option and employee stock purchase plans | | 394,825 | | 395 | | 1,575,087 | | — | | — | | — | | — | | 1,575,482 | |
Compensation related to stock option grants | | — | | — | | — | | — | | — | | — | | 151,004 | | 151,004 | |
Net loss | | — | | — | | — | | (23,244,024 | ) | — | | — | | — | | (23,244,024 | ) |
Change in unrealized loss on marketable securities | | — | | — | | — | | — | | — | | (135,683 | ) | — | | (135,683 | ) |
Comprehensive loss | | | | | | | | | | | | | | | | (23,379,707 | ) |
Balance at June 30, 2005 | | 38,466,804 | | $ | 38,467 | | $ | 193,696,156 | | $ | (94,040,179 | ) | $ | — | | $ | (279,098 | ) | $ | — | | $ | 99,415,346 | |
See accompanying notes.
45
ARRAY BIOPHARMA INC.
STATEMENTS OF CASH FLOWS
| | Years Ended June 30, | |
| | 2005 | | 2004 | | 2003 | |
Operating activities | | | | | | | |
Net loss | | $ | (23,244,024 | ) | $ | (25,965,860 | ) | $ | (20,020,391 | ) |
Adjustments to reconcile net loss to net cash provided by (used in) operating activities: | | | | | | | |
Depreciation and amortization | | 8,028,447 | | 7,996,750 | | 7,177,177 | |
Deferred rent | | 559,900 | | 461,838 | | 446,339 | |
Compensation related to stock option grants | | 151,004 | | 1,976,658 | | 1,882,771 | |
Provision for excess inventory | | — | | 5,616,424 | | 4,100,000 | |
Loss on investment | | — | | — | | 500,000 | |
Loss on equipment and software disposals | | 53,144 | | — | | — | |
Accrued interest on notes receivable for common stock | | — | | — | | (1,558 | ) |
Changes in operating assets and liabilities: | | | | | | | |
Accounts receivable | | 400,721 | | 563,416 | | 848,003 | |
Inventories | | 1,877,195 | | (582,557 | ) | (4,694,885 | ) |
Prepaid expenses and other | | 289,915 | | (585,107 | ) | 74,565 | |
Accounts payable | | 1,299,938 | | (114,153 | ) | (3,846,670 | ) |
Advance payments from collaborators | | (10,638,991 | ) | 16,172,437 | | (3,795,121 | ) |
Accrued compensation and benefits | | 3,271,846 | | (5,870 | ) | (47,623 | ) |
Other current liabilities | | 658,990 | | (34,750 | ) | (207,699 | ) |
Other long term liabilities | | 113,933 | | — | | — | |
Net cash provided by (used in) operating activities | | (17,177,982 | ) | 5,499,226 | | (17,585,092 | ) |
| | | | | | | |
Investing activities | | | | | | | |
Purchases of property, plant and equipment | | (5,681,941 | ) | (3,627,018 | ) | (9,569,799 | ) |
Sales of property, plant and equipment | | 104,850 | | — | | — | |
Purchases of marketable securities | | (121,689,164 | ) | (250,192,325 | ) | (234,788,434 | ) |
Proceeds from sale and maturity of marketable securities | | 72,950,000 | | 249,750,000 | | 248,441,280 | |
Increase in restricted cash | | (726,455 | ) | (120,911 | ) | (175,193 | ) |
Reduction in other long-term assets | | — | | — | | 182,270 | |
Net cash provided by (used in) investing activities | | (55,042,710 | ) | (4,190,254 | ) | 4,090,124 | |
| | | | | | | |
Financing activities | | | | | | | |
Proceeds from sale of common stock, net of issuance costs | | 66,575,147 | | — | | — | |
Proceeds from exercise of stock options and shares issued under the employee stock purchase plan | | 1,575,482 | | 1,608,726 | | 1,359,581 | |
Proceeds from the issuance of long term debt | | 10,000,000 | | — | | — | |
Proceeds from repayment of notes receivable | | — | | — | | 157,183 | |
Net cash provided by financing activities | | 78,150,629 | | 1,608,726 | | 1,516,764 | |
| | | | | | | |
Net increase (decrease) in cash and cash equivalents | | 5,929,937 | | 2,917,698 | | (11,978,204 | ) |
Cash and cash equivalents, beginning of year | | 6,499,589 | | 3,581,891 | | 15,560,095 | |
Cash and cash equivalents, end of year | | $ | 12,429,526 | | $ | 6,499,589 | | $ | 3,581,891 | |
See accompanying notes.
46
ARRAY BIOPHARMA INC.
NOTES TO FINANCIAL STATEMENTS
1. Business Operations
Array BioPharma Inc. (the “Company”) is a biopharmaceutical company focused on the discovery, development and commercialization of targeted small molecule drugs to treat life threatening and debilitating diseases. The Company’s proprietary drug development pipeline is primarily focused on the treatment of cancer and inflammatory disease and includes clinical candidates that are designed to regulate therapeutically important targets. In addition, leading pharmaceutical and biotechnology companies collaborate with the Company to discover and develop drug candidates across a broad range of therapeutic areas.
2. Summary of Significant Accounting Policies
Cash Equivalents and Marketable Securities
Cash equivalents consist of short-term, highly liquid financial instruments that are readily convertible to cash and have maturities of three months or less from the date of purchase and may consist of money market funds, taxable commercial paper, U.S. government agency obligations and corporate notes and bonds with high credit quality. Marketable securities consist of similar financial instruments with maturities of greater than three months.
At June 30, 2005 and 2004, management designated marketable securities held by the Company as available-for-sale securities for purposes of Statement of Financial Accounting Standards No. 115, Accounting for Certain Investments in Debt and Equity Securities. Securities available-for-sale are carried at fair value, with unrealized gains and losses reported as a component of stockholders’ equity until their disposition. The amortized cost of debt securities in this category is adjusted for amortization of premiums and accretion of discounts to maturity. Such amortization is included in investment income. Realized gains and losses and declines in value judged to be other-than-temporary on securities available-for-sale are included in investment income. Interest on securities available-for-sale are included in investment income. The cost of securities sold is based on the specific identification method.
Fair Value of Financial Instruments
At June 30, 2005 and 2004, the Company’s financial instruments consisted of cash, cash equivalents, marketable securities, accounts receivable, accounts payable and debt. Marketable securities recorded as available-for-sale are recorded at their estimated fair value. The carrying amounts of all other instruments approximate fair value. See Note 3 for a discussion of the fair value of the Company’s marketable securities. See Note 5 for a discussion of long-term debt.
Accounts Receivable and Allowance for Doubtful Accounts
The Company evaluates the collectibility of its accounts receivable based on a combination of factors. In circumstances when the Company is aware of a specific customer’s potential inability to meet its financial obligation, the Company records a specific reserve for bad debt against amounts due. For all other instances, the Company reviews the historical collections experience for its customers in determining if an allowance for doubtful accounts is deemed necessary. As of June 30, 2005 and 2004, the allowance for doubtful accounts was $57,000 and $54,550, respectively.
Concentration of Credit Risk
Financial instruments that potentially subject the Company to concentrations of credit risk are primarily cash and cash equivalents, accounts receivable and investments in marketable securities. The Company maintains its cash balances in the form of bank demand deposits. Cash equivalents and restricted cash consist of money market funds. Marketable securities consist of auction rate securities and federal agency mortgage-backed securities. All cash, cash equivalents, restricted cash and marketable securities are maintained with financial institutions that management believes are creditworthy. Accounts receivable are typically unsecured and are concentrated in the pharmaceutical
47
and biotechnology industries. Accordingly, the Company may be exposed to credit risk generally associated with pharmaceutical and biotechnology companies.
Inventories
Inventories consist of individual chemical compounds in the form of Optimer building blocks available-for-sale and commercially available fine chemicals used in the Company’s proprietary drug discovery programs and research collaborations. Inventories are stated at the lower of cost or market, cost being determined under the first-in, first-out method. The Company designs and produces the chemical compounds comprising its Optimer building blocks and capitalizes costs into inventory only after technological feasibility has been established. The Company reviews the level and value of its chemical inventories periodically and, when required, writes down the carrying cost for non-marketability to estimated net realizable value through an appropriate reserve.
Property, Plant and Equipment
Property, plant and equipment are stated at cost. Repairs and maintenance are charged to operations as incurred, and significant expenditures for additions and improvements are capitalized. Depreciation and amortization of equipment is computed using the straight-line method based on the following estimated useful lives:
Type of Property and Equipment | | Estimated
Useful Life |
Computer hardware and software | | 3 years |
Laboratory and analytical equipment | | 5 years |
Furniture and fixtures | | 7 years |
Leasehold improvements | | See below |
Leasehold improvements were amortized over seven years prior to fiscal year 2002. During 2002, the Company entered into a new building lease and modified an existing one, and in this process obtained options for extending all significant building leases up to, and beyond, 15 years. Due to the high cost to replace and the limited availability of laboratory facilities, the Company concluded that the exercise of a portion of its option to extend its lease terms to at least 15 years was reasonably assured. During the last quarter of fiscal 2005, the Company reassessed its facility requirements, and began to consider the possibility of consolidating operations in one of its existing locations, or a new location. While the Company has not yet made a final determination whether to consolidate operations at one location, it is no longer reasonably assured that it will remain in the Boulder, Colorado location beyond the initial lease term, which ends in March 2008. Therefore, as of June 2005, the Company began amortizing its Boulder leasehold improvements over the remaining 34 months of the initial lease term resulting in an additional expense of approximately $141,000 for fiscal year 2005. The Company has not changed its determination that it is reasonably assured that it will exercise its lease extensions and lease its other facility, located in Longmont, Colorado for at least 13 more years. Therefore, the Company will continue to amortize its Longmont leasehold improvements through May 2018.
Software Development Costs
The Company uses software it develops for capturing, searching and presenting data. The Company capitalizes direct, payroll-related software development costs for time incurred during the software development stage where the computer software project is intended to create a new system or add identifiable functionality to an existing system. All other costs, including time incurred for preliminary project planning, training, implementation or ongoing maintenance, are expensed in the period incurred. Total capitalized costs were approximately $506,000, $351,000 and $430,000 for fiscal years 2005, 2004 and 2003, respectively, and are being amortized on a straight-line basis over a period of three years.
Impairment of Long-Lived Assets
Long-lived assets are reviewed for impairment when events or changes in circumstances indicate the book value of the assets may not be recoverable. Recoverability is measured by comparison of the assets’ book value to future
48
net undiscounted cash flows the assets are expected to generate. If such assets are considered to be impaired, the impairment to be recognized is measured by the amount by which the book value of the assets exceed the projected discounted future net cash flows arising from the assets.
Deferred Rent
The Company’s facilities leases provide for annual rent increases over the term of the leases. The Company recognizes the average annual rent expense over the lease term. As a result, the amount of rent expense will exceed the Company’s actual cash rent payments during the early part of the lease term. The Company records deferred rent equal to the difference between the actual cash payments and the amount recognized as rent expense on a straight-line basis for the Company’s facilities leases. Rent expense is recognized ratably over the life of the lease for the Company’s Boulder facility, which expires in March 2008, and over the life of the lease and one of the optional extension periods, which expires in May 2018, for its Longmont facility. See “Property, Plant and Equipment” description above.
Bonus Program
The Company’s bonus program covers substantially all employees. Bonuses are determined based on the achievement of Company-wide goals and other performance measures approved by the Board of Directors. Bonus accruals are estimated based on various factors, including target bonus percentages per level of employee and probability of achieving goals upon which bonuses are based. The Company periodically reviews the progress made towards the goals under the bonus programs and adjusts the accrual accordingly. As of June 30, 2005, accrued compensation and benefits included $2.7 million for accrued bonus payments that were paid subsequent to June 2005. For the years ended June 30, 2004 and 2003, the Company did not pay cash bonuses but instead granted its employees incentive stock options for 472,000 and 814,000 shares of common stock, respectively, that did not result in any corresponding compensation expense.
Revenue Recognition
Most of the Company’s revenue is derived from designing, creating, optimizing and evaluating drug candidates for its collaborators. The majority of collaboration revenue consists of fees received based on contracted annual rates for full time equivalent employees working on a project. The Company’s collaboration agreements also include license and up-front fees, milestone payments upon achievement of specified research or development goals and royalties on sales of resulting products. A small portion of the Company’s revenue comes from development and fixed fee revenue and from sales of compounds on a per-compound basis.
Collaboration agreements typically call for a specific level of resources as measured by the number of full time equivalent employees working a defined number of hours per year at a stated price under the agreement. The Company recognizes revenue under its collaboration agreements on a monthly basis for fees paid to the Company based on hours worked. The Company recognizes revenue from sales of Lead Generation Library and Optimer building block compounds as the compounds are shipped, as these agreements are priced on a per-compound basis and title and risk of loss passes upon shipment to the Company’s customers.
Revenue from license fees and up-front fees is non refundable and is recognized on a straight-line basis over the expected period of the related research program. Milestone payments are non refundable and are recognized as revenue over the expected period of the related research program. A portion of any milestone payment is recognized at the date the milestone is achieved which is determined using the applicable percentage of the research term that has elapsed at the date the milestone is achieved. Any balance is recognized ratably over the remaining research term. Revenue recognition related to license fees, up-front payments and milestone payments could be accelerated in the event of early termination of programs.
In general, contract provisions include predetermined payment schedules or the submission of appropriate billing detail. Payments received in advance of performance are recorded as advance payments from collaborators until the revenue is earned.
The Company reports revenue for lead generation and lead optimization research, custom synthesis and process research, the development and sale of chemical compounds and the co-development of proprietary drug candidates it
49
out-licenses, as collaboration revenue. License and milestone revenue is combined and reported separately from collaboration revenue.
Segment and Geographic Information
All operations of the Company are considered to be in one operating segment and, accordingly, no segment disclosures have been presented. The physical location of the Company’s property, plant and equipment is within the United States. The following table details revenue from customers by geographic area based on the country in which collaborators are located or the destination of where compounds from the Company’s inventories are shipped.
| | Years Ended June 30, | |
| | 2005 | | 2004 | | 2003 | |
| | | | | | | |
North America | | $ | 29,162,359 | | $ | 23,799,660 | | $ | 30,339,113 | |
Europe | | 12,680,730 | | 6,483,833 | | 946,494 | |
Japan and Asia-Pacific | | 3,662,427 | | 4,547,497 | | 3,839,806 | |
Total revenue | | $ | 45,505,516 | | $ | 34,830,990 | | $ | 35,125,413 | |
Approximately 97% and 94% of the revenue generated from sales to Europe during the years ended June 30, 2005 and June 30, 2004, respectively, related to the Company’s collaboration and licensing agreement with AstraZeneca AB, located in Sweden. For the years ended June 30, 2004 and June 30, 2003, sales to Japan exceeded 10% of the Company’s revenue. No other individual international country exceeded 10% of the Company’s revenue for the periods presented.
During fiscal year 2005, revenue from three of the Company’s customers represented approximately 28%, 27% and 10% of total revenue. During fiscal year 2004, revenue from three of the Company’s customers represented approximately 18%, 13% and 12% of total revenue. During fiscal year 2003, revenue from three of the Company’s customers represented approximately 21%, 15% and 12% of total revenue.
Shipping and Handling Costs
Costs incurred for shipping and handling of products are included in cost of revenue. Amounts billed to customers for shipping and handling are reported within collaboration revenue.
Cost of Revenue
The Company’s out-licensing and collaboration agreements provide for research funding based on the number of full time equivalent employees contractually assigned to a program. The Company does not bear any risk of the failure of the contracted research and development activities and the payments are not contingent based on the success or failure of these activities. Accordingly, the Company expenses these costs when incurred.
Research and Development Costs
Research and development costs are expensed as incurred.
Advertising and Promotion Expenses
Advertising and promotion costs are expensed as incurred. The amount charged against operations for the years ended June 30, 2005, 2004 and 2003 was approximately $71,000, $47,000 and $149,000, respectively.
Patents and Patent Application Costs
Patents and patent application costs are expensed as incurred as selling, general and administrative expenses.
50
Accounting for Stock-Based Compensation
The Company currently accounts for its stock-based compensation arrangements under the provisions of Accounting Principles Board Opinion No. 25, Accounting for Stock Issued to Employees (“APB 25”), and its related interpretations. Under the provisions of APB 25, no compensation expense is recognized when stock options are granted with exercise prices equal to or greater than market value on the date of grant.
The Company follows the disclosure requirements of the Financial Accounting Standards Board (“FASB”) Statement No. 148, Accounting for Stock-Based Compensation — Transition and Disclosure (“SFAS 148”), which amends the disclosure provisions of FASB Statement No. 123, Accounting for Stock-Based Compensation (“SFAS 123”), and Accounting Principles Board Opinion No. 28, Interim Financial Reporting. SFAS 148 requires disclosure of the method of accounting used for stock-based compensation and the effects of this method on reported net income (loss) and earnings (loss) per share for annual and interim financial statements. The following table illustrates the effect on net loss and net loss per share assuming the estimated fair value of the options granted is amortized to expense over the option-vesting period as required by SFAS 123.
| | Years Ended June 30, | |
| | 2005 | | 2004 | | 2003 | |
| | | | | | | |
Net loss, as reported | | $ | (23,244,024 | ) | $ | (25,965,860 | ) | $ | (20,020,391 | ) |
Add: Stock-based employee compensation expense included in reported net loss | | 151,004 | | 1,976,658 | | 1,882,771 | |
| | | | | | | |
Less: Total stock-based employee compensation expense determined under fair value based methods for all options granted | | (7,222,225 | ) | (7,723,166 | ) | (8,487,330 | ) |
Pro forma net loss | | $ | (30,315,245 | ) | $ | (31,712,368 | ) | $ | (26,624,950 | ) |
| | | | | | | |
Net loss per share: | | | | | | | |
Basic and diluted - as reported | | $ | (0.68 | ) | $ | (0.91 | ) | $ | (0.72 | ) |
Basic and diluted - pro forma | | $ | (0.89 | ) | $ | (1.11 | ) | $ | (0.96 | ) |
| | | | | | | |
Number of shares used to compute per share data | | 34,042,826 | | 28,511,457 | | 27,829,527 | |
The Company uses the Black-Scholes option pricing model under SFAS 123 and used the following assumptions for its Stock Option and Incentive Plan and Employee Stock Purchase Plan. The Black-Scholes option-pricing model requires the input of highly subjective assumptions. Because the Company’s employee stock options have characteristics significantly different from those of traded options, and because changes in the subjective input assumptions can materially affect the fair value estimate, in management’s opinion, the existing models do not necessarily provide a reliable single measure of the fair value of its employee stock options.
| | Risk-Free
Interest Rate | | Dividend
Yield | | Volatility
Factor | | Option
Life in
Years | | Calculated
Fair Value of
Options Granted | |
Fiscal Year 2005 | | 3.70 | % | 0 | % | 75.5 | % | 5 | | $ | 4.92 | |
Fiscal Year 2004 | | 3.77 | % | 0 | % | 81.6 | % | 5 | | $ | 5.07 | |
Fiscal Year 2003 | | 2.41 | % | 0 | % | 90.0 | % | 5 | | $ | 5.08 | |
51
Comprehensive Loss
The Company discloses, in addition to net loss, comprehensive income (loss) and its components including unrealized gains and losses on investments in debt and equity securities. The Company has disclosed comprehensive loss in its statements of stockholders’ equity and comprehensive loss.
Net Loss Per Share
Basic and diluted net loss per share has been computed by dividing net loss for the period by the weighted average number of common shares outstanding during the period. The Company has excluded the effects of outstanding stock options from the calculation of diluted net loss per share because all such securities are anti-dilutive for all periods presented. The number of common share equivalents relating to these stock options excluded from the diluted loss per share calculations for the years ended June 30, 2005, 2004 and 2003 were 465,792 shares, 623,365 shares and 576,687 shares, respectively.
Use of Management’s Estimates
The preparation of financial statements in conformity with U.S. generally accepted accounting principles requires management to make certain estimates and assumptions that affect the amounts reported in the financial statements and accompanying notes. Actual results could differ from those estimates.
Reclassifications
Certain reclassifications have been made to the prior year’s amounts to conform to the current year’s presentation. These reclassifications had no impact on the reported results of operations.
Recent Accounting Pronouncements
In December 2004, the FASB issued Statement No. 123R, Share-Based Payment – an amendment of FASB Statement No. 123 and 95 (“SFAS 123R”). SFAS 123R addresses the accounting for transactions in which a company receives employee services in exchange for (a) equity instruments of the company or (b) liabilities that are based on the fair value of the company’s equity instruments or that may be settled by the issuance of such equity instruments. SFAS 123R eliminates accounting for share-based compensation transactions using APB 25 and requires instead that such transactions be accounted for using a fair-value based method, thereby requiring companies to recognize an expense for compensation cost related to share-based payment arrangements, including stock options and employee stock purchase plans. This statement is required to be adopted by the Company on July 1, 2005, which is the beginning of its fiscal year 2006. The cumulative effect of adoption applied on a modified prospective basis would be measured and recognized on July 1, 2005. In March 2005, Staff Accounting Bulletin No. 107 (“SAB 107”) was issued permitting registrants to choose from different valuation models to estimate the fair value of share options, and also providing guidance on developing assumptions used in implementing SFAS 123R. The Company is currently evaluating these option valuation methodologies and assumptions in light of SFAS 123R and SAB 107 related to its employee stock option and employee stock purchase plans and expects that the adoption of SFAS 123R will have a material impact on the Company’s future results of operations and earnings per share. Current estimates of option values using the Black-Scholes method reflected in Note 2 above may not be indicative of results from valuation methodologies ultimately adopted by the Company in compliance with SFAS 123R.
In November 2004, the FASB issued Statement No. 151, Inventory Costs – an amendment of ARB No. 43, Chapter 4 (“SFAS 151”). SFAS 151 amends the guidance of ARB No. 43, Chapter 4, “Inventory Pricing”, to clarify the accounting for abnormal amounts of idle facility expense, freight, handling costs, and wasted material (spoilage). Paragraph 5 of ARB No. 43, Chapter 4, previously stated, “…under some circumstances, items such as idle facility expense, excessive spoilage, double freight, and handling costs may be so abnormal to require treatment as a current period charge…” SFAS 151 requires that those items be recognized as current-period charges regardless of whether they meet the criterion of “so abnormal”. In addition, this statement requires that allocation of fixed production overheads to the costs of conversion be based on the normal capacity of the production facilities. The provisions of SFAS 151 will be effective for inventory costs during the fiscal years beginning after June 15, 2005. The Company does not believe that the adoption of this statement will have a material impact on its financial condition or results of operations.
52
In December 2004, the FASB issued Statement No. 153, Exchanges of Nonmonetary assets – an amendment of APB Opinion No. 29, Accounting for Nonmonetary Transactions (“SFAS 153”). SFAS 153 eliminates the exception from fair value measurement for nonmonetary exchanges of similar productive assets in paragraph 21(b) of APB Opinion No. 29, and replaces it with an exception for exchanges that do not have commercial substance. SFAS 153 specifies that a nonmonetary exchange has commercial substance if the future cash flows of the entity are expected to change significantly as a result of the exchange. SFAS 153 is effective for the fiscal periods beginning after June 15, 2005. The Company does not believe that the adoption of this statement will have a material impact on its financial condition or results of operations.
In May 2005, the FASB issued Statement No. 154, Accounting Changes and Error Corrections (“SFAS 154”), which replaces APB Opinion No. 20, Accounting Changes, and SFAS No. 3, Reporting Accounting Changes in Interim Financial Statements, and changes the requirements for the accounting for and reporting of a change in accounting principle. SFAS 154 applies to all voluntary changes in accounting principle and to changes required by an accounting pronouncement when the pronouncement does not include specific transition provisions. SFAS 154 requires retrospective application of changes in accounting principle to prior periods’ financial statements unless it is impracticable to determine either the period-specific effects or the cumulative effect of the change. APB Opinion No. 20 previously required that most voluntary changes in accounting principle be recognized by including the cumulative effect of the change in net income for the period of the change in accounting principle. SFAS 154 carries forward without change the guidance contained in APB Opinion No. 20 for reporting the correction of an error in previously issued financial statements and a change in accounting estimate. SFAS 154 also carries forward the guidance in APB Opinion No. 20 requiring justification of a change in accounting principle on the basis of preferability. SFAS 154 is effective for accounting changes and correction of errors made in fiscal periods beginning after December 15, 2005 with early adoption permitted. The Company does not believe that the adoption of this statement will have a material impact on its financial condition or results of operations.
3. Cash, Cash Equivalents and Marketable Securities
All cash, cash equivalents and marketable securities classified as available-for-sale as of June 30, 2005 and 2004 consist of the following:
| | As of June 30, | |
| | 2005 | | 2004 | |
Cash and cash equivalents: | | | | | |
Cash | | $ | 440,958 | | $ | 5,451,105 | |
Money market fund | | 11,988,568 | | 1,048,484 | |
Total | | $ | 12,429,526 | | $ | 6,499,589 | |
| | | | | |
Marketable securities: | | | | | |
Auction rate securities | | $ | 28,553,313 | | $ | 10,257,750 | |
Federal agency mortgage-backed securities | | 49,743,469 | | 19,435,551 | |
Total | | $ | 78,296,782 | | $ | 29,693,301 | |
| | | | | |
Restricted cash (current and long term): | | | | | |
Money market fund | | $ | 1,979,678 | | $ | 1,253,223 | |
Unrealized losses on available-for-sale securities at June 30, 2005 and June 30, 2004 were approximately $279,000 and $143,000, respectively. The unrealized losses at both dates were related to the Company’s investment in federal agency mortgage-backed securities. The fair values of these investments at June 30, 2005 and June 30, 2004 were $49.2 million (excluding approximately $523,000 of accrued interest) and $19.4 million, respectively, compared to the Company’s original cost of $49.5 million and $19.5 million, respectively. Because the decline in market value is attributable to changes in interest rates and not credit quality, the Company does not consider these investments to be other-than-temporarily impaired at June 30, 2005 and June 30, 2004.
53
At June 30, 2005 and June 30, 2004, the Company had restricted cash of $2.0 million and $1.3 million, respectively, as a compensating balance to support outstanding standby letters of credit. The standby letters of credit were issued during the fiscal years of 2003 and 2002 and increased during fiscal years 2005 and 2004 in relation to the Company’s facilities leases.
Debt securities at June 30, 2005 and 2004, by contractual maturity, are shown below. Actual maturities may differ from contractual maturities because issuers of the securities may have the right to prepay obligations.
| | As of June 30, | |
| | 2005 | | 2004 | |
Marketable securities: | | | | | |
Due in one year or less | | $ | 56,147,883 | | $ | 10,257,750 | |
Due after one year through two years | | 22,148,899 | | 19,435,551 | |
Total | | $ | 78,296,782 | | $ | 29,693,301 | |
The Company has included marketable securities due after one year within current assets, as these investments are available for use in current operating activities.
4. Balance Sheet Components
| | As of June 30, | |
| | 2005 | | 2004 | |
Inventories: | | | | | |
Fine chemicals | | $ | 2,884,541 | | $ | 2,909,619 | |
Optimer building blocks | | 2,186,260 | | 2,363,133 | |
Lead Generation Libraries | | — | | 5,386,313 | |
Total inventories at cost | | 5,070,801 | | 10,659,065 | |
Less reserves | | (2,917,315 | ) | (6,628,384 | ) |
Total inventories, net | | $ | 2,153,486 | | $ | 4,030,681 | |
During fiscal years 2004 and 2003, the Company recorded $5.6 million and $4.1 million, respectively, of charges to cost of revenue associated with increases in its inventory reserves for excess Lead Generation Library and Optimer building block inventory. During the second quarter of fiscal year 2005, the Company received $1.4 million for the sale of compounds with a carrying value of approximately $700,000 that represented the remaining net book value of the Lead Generation Library inventory. Lead Generation Library inventory with a cost of $4.4 million was applied against the previously established reserves of the same amount during the second quarter of fiscal year 2005, which had no impact on the reported results of operations. The Company has not and does not anticipate recognizing any revenue from sales or licensing of inventory that has been written off.
| | As of June 30, | |
| | 2005 | | 2004 | |
Property, plant and equipment: | | | | | |
Laboratory and analytical equipment | | $ | 28,483,646 | | $ | 24,786,661 | |
Computer hardware and software | | 7,491,534 | | 7,803,505 | |
Furniture and fixtures | | 1,527,281 | | 1,369,555 | |
Leasehold improvements | | 23,826,346 | | 23,018,334 | |
Equipment and computer software in progress | | 188,168 | | 578,460 | |
Total property, plant and equipment, gross | | 61,516,975 | | 57,556,515 | |
Less accumulated depreciation and amortization | | (30,210,523 | ) | (23,745,563 | ) |
Total property, plant and equipment, net | | $ | 31,306,452 | | $ | 33,810,952 | |
54
Depreciation and amortization expense was $8.0 million, $8.0 million and $7.2 million for the years ended June 30, 2005, 2004 and 2003, respectively.
During fiscal year 2005, the Company disposed of software with a net book value of approximately $30,000 that was no longer being utilized. Additionally, laboratory and analytical equipment with a net book value of approximately $128,000 was sold, resulting in a loss of approximately $23,000.
5. Debt
On June 28, 2005, the Company entered into a Loan and Security Agreement (“Loan and Security Agreement”) with Comerica Bank (“Comerica” or “Bank”). The terms of the Loan and Security Agreement provide for an interest only term loan, interest only equipment advances and a revolving line of credit secured by a security interest in the Company’s assets, other than intellectual property. The full $10,000,000 term loan was advanced to the Company on June 30, 2005, and currently has an interest rate of 4.5% per annum and a maturity date of June 28, 2010. The equipment advances in the amount of up to $5,000,000 are available to the Company from time to time through December 28, 2006 to finance the purchase of equipment, capitalized software and tenant improvements, with a maturity date of June 28, 2010. The revolving line of credit in the amount of up to $2,000,000 is available to support the future issuance of standby letters of credit until June 28, 2008. The outstanding balances under the term loan, the equipment advances and the revolving line of credit bear interest on a monthly basis at one of the following interest rates elected by the Company from time to time:
• A rate equal to one and three-quarters percent (1.75%) below the Prime “Base Rate” as quoted by Bank from time to time; or
• A rate equal to one percent (1.00%) above the Bank’s LIBOR rate, which rate shall remain in effect during the relevant LIBOR period; or
• A rate equal to one and one quarter percent (1.25%) above the Bank’s Cost of Funds rate, which rate shall remain in effect during the relevant Cost of Funds period.
Should the Company maintain less than $8,000,000 at the Bank at any time during any interest rate period, the interest rate the Company pays will be 0.50% higher than shown above.
After July 30, 2005 the Company is required to maintain a minimum balance of $2,000,000 in an interest earning Comerica money market account. If the Company’s total cash, equivalents and marketable securities, including those invested at the Bank, falls between $30,000,000 and $25,000,000, or below $25,000,000, the minimum required balance maintained at the Bank increases to $8,500,000 and $17,000,000, respectively. If the Company’s total cash, equivalents and marketable securities, including those invested at the Bank, falls below $20,000,000, the loans become due.
The Loan and Security Agreement contains representations and warranties and affirmative and negative covenants that are customary for credit facilities of this type. The Loan and Security Agreement could restrict the Company’s ability to, among other things, sell certain assets, engage in a merger or change in control transaction, incur debt, pay cash dividends and make investments. The Loan and Security Agreement also contains events of default that are customary for credit facilities of this type, including payment defaults, covenant defaults, insolvency type defaults and events of default relating to liens, judgments, material misrepresentations and the occurrence of certain material adverse events.
The Company’s future minimum commitments by fiscal year using the interest rate in effect as of June 30, 2005 are as follows:
| | Amount | |
2006 - includes interest only | | $ | 450,000 | |
2007 - includes interest only | | 450,000 | |
2008 - includes interest only | | 450,000 | |
2009 - includes interest only | | 450,000 | |
2010 - includes both principal and interest | | 10,450,000 | |
Total minimum debt commitments | | $ | 12,250,000 | |
55
6. Commitments - Operating Leases and Purchase Obligations
The Company leases facilities and equipment under various noncancelable operating lease agreements. Rent expense under these agreements was $5.6 million, $4.3 million and $3.6 million for the years ended June 30, 2005, 2004 and 2003, respectively, including deferred rent expense of approximately $515,000, $462,000, and $446,000, respectively. As of June 30, 2005, future minimum rental commitments, by fiscal year and in the aggregate, for the Company’s operating leases are as follows:
| | Amount | |
2006 | | $ | 4,920,055 | |
2007 | | 5,047,576 | |
2008 | | 4,042,331 | |
2009 | | 791,371 | |
2010 | | 812,487 | |
Thereafter | | 7,352,675 | |
Total minimum lease payments | | $ | 22,966,495 | |
The Company has options to extend the lease terms on all of its existing facilities leases in Boulder and Longmont, Colorado. The Boulder lease, expiring on March 31, 2008, offers options to renew the lease for three additional terms for up to 18 years. On August 5, 2005, the Company amended its two prior lease agreements for the Longmont facility, which extended the lease terms under the prior leases to March 31, 2008. On August 5, 2006, the March 31, 2008 terms will automatically extend to May 31, 2013, unless the landlord is unable to provide certain expansion space to the Company and the Company chooses to maintain the March 31, 2008 expiration date. The Company also has options to extend these leases for three additional consecutive terms of five years each.
During the last quarter of fiscal 2005, the Company reassessed its facility requirements, and began to consider the possibility of consolidating operations in one of their existing locations, or a new location. While the Company has not yet made a final determination whether to consolidate operations at one location, it is no longer reasonably assured that it will remain in its Boulder location beyond the initial lease term, which ends in March 2008. The Company has not changed its determination that it is reasonably assured that it will exercise a portion of its lease extensions and lease its Longmont facility for at least another 13 years. Therefore, the minimum lease payments above only include the cost of the Boulder facility leases through their original term of March 2008. Minimum lease payments for the Longmont leases are calculated through May 2018. The portion of minimum lease payments related to optional extension periods for the Longmont facility is $4.8 million beginning June 2013.
At June 30, 2005, the Company had outstanding purchase obligations totaling $5.0 million, primarily for outsourced pharmacology services and laboratory equipment and supplies.
7. Employee Savings Plan
The Company has a 401(k) plan that allows participants to contribute 1% to 60% of their salary; subject to eligibility requirements and annual IRS limits. The Company matches employee contributions on a discretionary basis as determined by the Company’s Board of Directors. During fiscal year 2005, 2004 and 2003, the Company paid matching contributions of approximately $780,000, $326,000 and $351,000, respectively. Company contributions are fully vested after four years of employment.
56
8. Stock Compensation Plans, Stock Warrants and Stockholder Rights Plan
Stock Options
In September 2000, the Company’s Board of Directors approved the Amended and Restated Stock Option and Incentive Plan (the “Plan”), which is the successor equity incentive plan to the Company’s 1998 Stock Option Plan (the “1998 Plan”), initially adopted by the Board of Directors in July 1998. Upon the closing of the Company’s initial public offering, the Plan became effective and no additional grants were made under the 1998 Plan. A total of 10,728,370 shares of common stock have been reserved for issuance under the Plan to eligible employees, consultants and directors of the Company. Additional authorized shares may be reserved on any given day in an amount equal to the difference between: (i) 25% of the Company’s issued and outstanding shares of common stock, on a fully diluted and as-converted basis and (ii) the number of outstanding shares relating to awards under the Plan plus the number of shares available for future grants of awards under the Plan on that date. The Plan provides that this number will increase on January 1 of each year from 2003 through 2006 by 250,000 shares, provided that this number may not exceed the total number of shares reserved under the Plan. As of June 30, 2005, there were 3,399,173 shares available for future issuance under the Plan.
The Plan provides for awards of both nonstatutory stock options and incentive stock options within the meaning of Section 422 of the Internal Revenue Code of 1986, as amended, and other incentive awards and rights to purchase shares of the Company’s common stock.
The Plan is administered by the Compensation Committee of the Board of Directors, which has the authority to select the individuals to whom awards will be granted and to determine whether and to what extent stock options and other stock incentive awards are to be granted, the number of shares of common stock to be covered by each award, the vesting schedule of stock options, generally straight-line over a period of four years, and all other terms and conditions of each award.
A summary of activity in the Plan is as follows:
| | Number of
Options | | Weighted-
Average
Exercise
Price | |
Balance, June 30, 2002 | | 5,475,449 | | $ | 5.57 | |
Granted | | 1,021,458 | | 7.21 | |
Exercised | | 428,159 | | 0.51 | |
Terminated or expired | | 353,171 | | 6.99 | |
Balance, June 30, 2003 | | 5,715,577 | | 6.16 | |
Granted | | 1,281,749 | | 5.13 | |
Exercised | | 410,034 | | 1.75 | |
Terminated or expired | | 308,455 | | 7.04 | |
Balance, June 30, 2004 | | 6,278,837 | | 6.19 | |
Granted | | 773,884 | | 7.72 | |
Exercised | | 214,920 | | 2.49 | |
Terminated or expired | | 203,260 | | 7.20 | |
Balance, June 30, 2005 | | 6,634,541 | | $ | 6.46 | |
57
A summary of options outstanding as of June 30, 2005, is as follows:
| | Outstanding Options | | Exercisable Options | |
Exercise
Price | | Shares Under
Option | | Weighted-
Average
Remaining
Contractual Life | | Weighted-
Average
Exercise
Price | | Shares
Currently
Exercisable | | Weighted-
Average
Exercise
Price | |
$ 0.24 | | 336,035 | | 3.8 | | $ | 0.24 | | 336,035 | | $ | 0.24 | |
$0.25-$0.60 | | 922,580 | | 4.6 | | 0.60 | | 922,580 | | 0.60 | |
$0.61-$3.00 | | 182,931 | | 6.0 | | 2.85 | | 151,431 | | 2.93 | |
$3.01-$6.00 | | 942,460 | | 7.8 | | 3.67 | | 281,332 | | 4.11 | |
$6.01-$8.50 | | 1,608,394 | | 7.8 | | 7.94 | | 583,878 | | 8.05 | |
$8.51-$9.00 | | 858,791 | | 7.3 | | 8.66 | | 419,121 | | 8.67 | |
$9.01-$10.50 | | 1,199,700 | | 6.8 | | 9.31 | | 836,425 | | 9.31 | |
$10.51-$14.28 | | 583,650 | | 6.6 | | 11.73 | | 454,000 | | 11.88 | |
| | 6,634,541 | | 6.7 | | 6.46 | | 3,984,802 | | 5.96 | |
| | | | | | | | | | | | | |
Deferred Stock-Based Compensation
The Company had deferred stock-based compensation balances related to certain stock options granted to employees prior to the Company’s November 2000 initial public offering. Stock compensation expense was recognized on a straight-line basis over the vesting periods of the related options, which was generally four years, except for options with performance-based vesting provisions. The Company recognized stock compensation expense of approximately $151,000, $2.0 million and $1.9 million for fiscal years 2005, 2004 and 2003, respectively. As of June 30, 2005, the Company had no remaining deferred stock-based compensation to be amortized in future periods.
Employee Stock Purchase Plan
During fiscal year 2001, the Company adopted an Employee Stock Purchase Plan (the “Purchase Plan”), authorizing the issuance of 800,000 shares of its common stock pursuant to purchase rights granted to eligible employees of the Company. During fiscal 2003, stockholders approved an increase of 400,000 shares for a total of 1.2 million authorized shares for issuance under the Plan. The Purchase Plan provides a means by which employees purchase common stock of the Company through payroll deductions of up to 15% of their base compensation. The Compensation Committee determines the length and duration of the periods during which payroll deductions will be accumulated to purchase shares of common stock. This period is known as the offering period. Within a single offering period, the Company permits periodic purchases of stock, known as purchase periods. Currently, offering periods are six-month periods. The purchase periods are currently three-month periods. The Compensation Committee may modify the duration of the offering periods and the purchase periods in the future. At the end of each of four purchase periods during a calendar year, the Company uses accumulated payroll deductions to purchase, on behalf of participating employees, shares of common stock at a price equal to the lower of 85% of the fair value of a share of common stock (i) at the beginning of the offering period or (ii) at the end of the purchase period. The purchase periods under the Purchase Plan end on March 31, June 30, September 30 and December 31 of each year. Generally, all employees, including executive officers, who work at least 20 hours per week and five months per year, may participate in the Purchase Plan. Employees who are deemed to own greater than 5% of the combined voting power of all classes of stock of the Company are not eligible for participation in the Purchase Plan. For the fiscal years 2005, 2004 and 2003, total shares issued under the Purchase Plan were 179,905, 240,865, and 272,141, respectively. As of June 30, 2005, there were 158,563 shares available for future issuance under the Purchase Plan.
Stockholder Rights Plan
In August 2001, the Company adopted a Stockholder Rights Plan designed to ensure that the Company’s stockholders receive fair and equal treatment in the event of an unsolicited attempt to take control of the Company and to deter coercive or unfair tactics by potential acquirers. The Stockholder Rights Plan imposes a significant
58
penalty upon any person or group that acquires 15% or more of the Company’s outstanding common stock without the approval of the Company’s Board of Directors. Under the Stockholder Rights Plan, a dividend of one Preferred Stock Purchase Right was declared for each common share held of record as of the close of business on August 27, 2001. Each right entitles the holder to purchase 1/100th of a share of Series A Junior Participating Preferred Stock for an exercise price of $70.00 per share. The rights generally will not become exercisable unless an acquiring entity accumulates or initiates a tender offer to purchase 15% or more of the Company’s common stock. In that event, each right will entitle the holder, other than the unapproved acquirer and its affiliates, to purchase upon the payment of the exercise price a number of shares of the Company’s common stock having a value of two times the exercise price. If the Company is not the surviving entity in a merger or stock exchange, or 50% or more of the Company’s assets or earning power are sold in one or more related transactions, each right would entitle the holder thereof to purchase for the exercise price a number of shares of common stock of the acquiring company having a value of two times the exercise price. The rights expire on August 2, 2011.
9. Common Stock
On December 14, 2004, the Company completed a follow-on public offering of 9,200,000 shares of its common stock, including 1,200,000 shares for the exercise of the underwriters’ over-allotment option. The Company received net proceeds of $66.6 million from this public offering, net of $4.7 million in expenses and underwriters’ discount relating to the issuance and distribution of the securities. The Company intends to use the net proceeds from the sale of securities to fund its research and development efforts and for general corporate purposes, including working capital. The Company may also use a portion of the net proceeds to acquire or invest in complementary businesses, technologies, drugs, drug candidates or other intellectual property, although the Company has no present commitments or agreements to do so.
During fiscal year 2003, the Company received approximately $157,000 from a Company founder as full repayment of an outstanding note receivable balance, including accrued interest. This payment was in connection with the purchase by the founder of shares of the Company’s common stock in May 1998. All previously issued notes receivable for common stock have been fully repaid by the Company founders.
10. Income Taxes
Income taxes are accounted for under the asset and liability method. Deferred tax assets and liabilities are recognized for the future tax consequences attributable to differences between the financial statement carrying amounts of existing assets and liabilities and their respective tax bases and operating loss and tax credit carryforwards. Deferred tax assets and liabilities are measured using enacted tax rates expected to apply to taxable income in the years in which those temporary differences are expected to be recovered or settled. The effect on deferred tax assets and liabilities of a change in tax rates is recognized in income in the period that includes the enactment date.
A reconciliation of the Company’s effective tax rate from the federal statutory income tax rate is as follows:
| | Years Ended June 30, | |
| | 2005 | | 2004 | | 2003 | |
Expected federal income tax expense at statutory rate of 34% | | 34.0 | % | 34.0 | % | 34.0 | % |
Generation of research and development tax credit | | 5.1 | % | 3.7 | % | 3.6 | % |
Non-deductible expenses | | 0.1 | % | (1.4 | )% | (1.7 | )% |
State income tax expense, net of federal benefit | | 3.1 | % | 2.9 | % | 2.9 | % |
Change in valuation allowance | | (42.3 | )% | (39.2 | )% | (38.8 | )% |
| | — | % | — | % | — | % |
59
The components of the Company’s deferred tax assets and liabilities are as follows:
| | | As of June 30, | |
| | | 2005 | | 2004 | |
| Deferred tax assets: | | | | | |
| Net operating loss carryforwards | | $ | 29,248,422 | | $ | 17,385,247 | |
| Research and development credit carryforwards | | 3,921,333 | | 2,728,800 | |
| Deferred revenue | | 2,354,584 | | 5,249,571 | |
| Deferred rent | | 628,499 | | 421,024 | |
| Inventory reserve | | 1,081,034 | | 2,456,201 | |
| Other | | 346,063 | | 293,109 | |
| | | 37,579,935 | | 28,533,952 | |
| Valuation allowance | | (37,132,765 | ) | (27,002,434 | ) |
| | | 447,170 | | 1,531,518 | |
| Deferred tax liabilities: | | | | | |
| Depreciation of property, plant and equipment | | (447,170 | ) | (1,531,518 | ) |
| Net deferred tax assets and liabilities | | $ | — | | $ | — | |
In assessing the realizability of deferred tax assets, management considers whether it is more likely than not that some portion or all of the deferred tax assets will not be realized. The ultimate realization of deferred tax assets is dependent upon the generation of future taxable income during the periods in which those temporary differences become deductible. Management considers the scheduled reversal of deferred tax liabilities, projected future taxable income, and tax planning strategies in making this assessment. Based upon the level of historical taxable income and projections for future taxable income over the periods in which the deferred tax assets are deductible, management believes it is more likely than not that the Company will realize the benefits of these deductible differences, net of the existing valuation allowances at June 30, 2005. The amount of the deferred tax asset considered realizable, however, could be reduced in the near term if estimates of future taxable income during the carryforward period are reduced.
As of June 30, 2005 and 2004, approximately $1.8 million and $1.6 million, respectively, of net operating loss deferred tax assets relates to disqualifying dispositions of employee stock options. In future periods, if the Company determines that a valuation allowance is no longer necessary, the portion related to disqualifying dispositions of employee stock options will reverse against additional paid-in capital rather than be recognized as an income tax benefit on the statement of operations.
At June 30, 2005, the Company has the following net operating loss and tax credit carryforwards for income tax purposes:
Expiration date: | | Net Operating
Losses | | Research and
Development
Credits | |
2018 | | $ | 49,000 | | $ | — | |
2019 | | 4,468,000 | | 135,000 | |
2020 | | 4,494,000 | | 147,000 | |
2021 | | 5,560,000 | | 287,000 | |
2022 | | 6,180,000 | | 485,000 | |
2023 | | 17,328,000 | | 715,000 | |
2024 | | 8,973,000 | | 960,000 | |
2025 | | 31,879,000 | | 1,192,000 | |
| | $ | 78,931,000 | | $ | 3,921,000 | |
The Tax Reform Act of 1986 contains provisions that limit the utilization of net operating loss and tax credit carryforwards if there has been a “change of ownership” as described in Section 382 of the Internal Revenue Code. Such a change of ownership may limit the Company’s utilization of its net operating loss and tax credit carryforwards, and could be triggered by subsequent sales of securities by the Company or its stockholders.
60
11. Other Expense – Loss on investment
In March 2002, the Company entered into a drug discovery collaboration agreement with Aptus Genomics, Inc. to create small molecule therapeutics against select G-Protein Coupled Receptor (GPCR) targets. The Company worked exclusively with Aptus on a select number of GPCR targets and provided Aptus access to its Lead Generation Libraries in exchange for $500,000 of common stock in Aptus. During fiscal 2003, the value of Aptus common stock decreased significantly. The Company determined this reduced value to be other-than-temporary and as a result, wrote off its investment in the company.
12. Restructuring – Fiscal year 2003
In March 2003, the Company reduced its workforce in order to reduce costs and match its headcount resources with the near-term demand for its collaboration programs, which resulted in the termination of 31 employees across all employee levels and business functions. This reduction resulted in a charge to operations in fiscal 2003 for termination-related costs of approximately $541,000. Such costs included severance packages and out-placement services for affected employees and were included in selling, general and administrative expenses in the statement of operations.
13. Subsequent Events
Amendment to Lease Agreements. On August 5, 2005, the Company entered into an Addendum #4 to it Longmont lease agreements. The Amendment amends two existing Lease Agreements between the Company and its Lessor, dated February 28, 2000 and February 11, 2002 (the “Prior Lease Agreements”), for two buildings the Company occupies in Longmont, Colorado. The Company currently leases approximately 75,000 square feet under the Prior Leases. The Amendment provides for monthly lease payments along with 3% annual increases.
The Prior Lease Agreements previously expired on May 31, 2005 and March 31, 2008, respectively. The Amendment extends the lease terms under the Prior Lease Agreements for both buildings to March 31, 2008. On August 5, 2006, the March 31, 2008 terms will automatically extend to May 31, 2013, unless the landlord is unable to provide certain expansion space to the Company and the Company chooses to maintain the March 31, 2008 expiration date. The Company also has options to extend the Prior Leases for three additional consecutive terms of five years each.
Under the Amendment, the Company has the option to expand its leased space by up to an additional 80,000 square feet of space in adjacent buildings. In addition, the Company has the right to purchase each of the leased buildings, including the expansion space.
61
14. Selected Quarterly Financial Data (Unaudited)
The tables below summarize the Company’s unaudited quarterly operating results for fiscal years 2005 and 2004.
| | 1st Quarter | | 2nd Quarter | | 3rd Quarter | | 4th Quarter | |
FISCAL YEAR 2005 | | | | | | | | | |
Total revenue | | $ | 9,857,007 | | $ | 12,048,445 | | $ | 11,555,739 | | $ | 12,044,325 | |
Cost of revenue | | 8,793,127 | | 9,464,030 | | 9,572,711 | | 10,218,209 | |
Net loss | | (5,615,328 | ) | (4,877,017 | ) | (6,234,606 | ) | (6,517,073 | ) |
| | | | | | | | | |
Basic and diluted net loss per share | | (0.19 | ) | (0.16 | ) | (0.16 | ) | (0.17 | ) |
| | | | | | | | | |
FISCAL YEAR 2004 | | | | | | | | | |
Total revenue | | $ | 7,195,472 | | $ | 7,594,913 | | $ | 9,687,916 | | $ | 10,352,689 | |
Cost of revenue (1) | | 7,311,838 | | 7,288,872 | | 14,156,480 | | 8,499,662 | |
Net loss | | (6,052,199 | ) | (6,376,670 | ) | (9,848,208 | ) | (3,688,783 | ) |
| | | | | | | | | |
Basic and diluted net loss per share (2) | | (0.21 | ) | (0.22 | ) | (0.34 | ) | (0.13 | ) |
(1) Cost of revenue includes a provision for excess inventory of $5.6 million for the third quarter of fiscal year 2004.
(2) Net loss per share is calculated independently for each of the quarters presented. Therefore, the sum of the quarterly net loss per share will not necessarily equal the total for the full fiscal year.
62
ARRAY BIOPHARMA INC.
SCHEDULE II – VALUATION AND QUALIFYING ACCOUNTS
FISCAL YEARS ENDED JUNE 30, 2005, 2004 AND 2003
| | Balance at
Beginning
of Period | | Charged to
Cost and
Expenses | | Deductions
Charged to
Reserves | | Balance at
End of Period | |
| | | | | | | | | |
Allowance for doubtful accounts: | | | | | | | | | |
Fiscal year ended June 30, 2005 | | $ | 54,550 | | $ | 2,450 | | $ | — | | $ | 57,000 | |
Fiscal year ended June 30, 2004 | | 26,500 | | 28,050 | | — | | 54,550 | |
Fiscal year ended June 30, 2003 | | 25,000 | | 1,500 | | — | | 26,500 | |
| | | | | | | | | |
Inventory reserve: | | | | | | | | | |
Fiscal year ended June 30, 2005 | | $ | 6,628,384 | | $ | 717,208 | | $ | 4,428,277 | (3) | $ | 2,917,315 | |
Fiscal year ended June 30, 2004 | | 5,651,644 | | 6,539,093 | (1) | 5,562,353 | (2) | 6,628,384 | |
Fiscal year ended June 30, 2003 | | 618,925 | | 5,032,719 | (1) | — | | 5,651,644 | |
(1) During fiscal years 2004 and 2003, the Company recorded $5.6 million and $4.1 million, respectively, of charges to cost of revenue associated with increases in its inventory reserves for excess Lead Generation Library and Optimer building block inventory.
(2) At June 30, 2004, fully reserved inventory of $5.6 million was written off and applied to these established reserves.
(3) During the second quarter of fiscal year 2005, the Company received $1.4 million for the sale of compounds with a carrying value of approximately $700,000 that represented the remaining net book value of the Lead Generation Library inventory. During this same period, Lead Generation Library inventory with a cost of $4.4 million was applied against previously established reserves of the same amount, which had no impact on the reported results of operations. The Company has not and does not anticipate recognizing any revenue from sales or licensing of inventory that has been written off.
63
REPORT OF KPMG LLP, INDEPENDENT REGISTERED PUBLIC ACCOUNTING FIRM
To the Board of Directors and Stockholders of
Array BioPharma Inc.:
We have audited management’s assessment, included in the accompanying Management’s Report on Internal Control over Financial Reporting that Array BioPharma Inc. maintained effective internal control over financial reporting as of June 30, 2005, based on criteria established in Internal Control—Integrated Framework issued by the Committee of Sponsoring Organizations of the Treadway Commission (COSO). Array BioPharma Inc.’s management is responsible for maintaining effective internal control over financial reporting and for its assessment of the effectiveness of internal control over financial reporting. Our responsibility is to express an opinion on management’s assessment and an opinion on the effectiveness of the Company’s internal control over financial reporting based on our audit.
We conducted our audit in accordance with the standards of the Public Company Accounting Oversight Board (United States). Those standards require that we plan and perform the audit to obtain reasonable assurance about whether effective internal control over financial reporting was maintained in all material respects. Our audit included obtaining an understanding of internal control over financial reporting, evaluating management’s assessment, testing and evaluating the design and operating effectiveness of internal control, and performing such other procedures as we considered necessary in the circumstances. We believe that our audit provides a reasonable basis for our opinion.
A company’s internal control over financial reporting is a process designed to provide reasonable assurance regarding the reliability of financial reporting and the preparation of financial statements for external purposes in accordance with generally accepted accounting principles. A company’s internal control over financial reporting includes those policies and procedures that (1) pertain to the maintenance of records that, in reasonable detail, accurately and fairly reflect the transactions and dispositions of the assets of the company; (2) provide reasonable assurance that transactions are recorded as necessary to permit preparation of financial statements in accordance with generally accepted accounting principles, and that receipts and expenditures of the company are being made only in accordance with authorizations of management and directors of the company; and (3) provide reasonable assurance regarding prevention or timely detection of unauthorized acquisition, use, or disposition of the company’s assets that could have a material effect on the financial statements.
Because of its inherent limitations, internal control over financial reporting may not prevent or detect misstatements. Also, projections of any evaluation of effectiveness to future periods are subject to the risk that controls may become inadequate because of changes in conditions, or that the degree of compliance with the policies or procedures may deteriorate.
In our opinion, management’s assessment that Array BioPharma Inc. maintained effective internal control over financial reporting as June 30, 2005, is fairly stated, in all material respects, based on criteria established in Internal Control—Integrated Framework issued by the Committee of Sponsoring Organizations of the Treadway Commission (COSO). Also, in our opinion, Array BioPharma Inc. maintained, in all material respects, effective internal control over financial reporting as of June 30, 2005, based on criteria established in Internal Control—Integrated Framework issued by the Committee of Sponsoring Organizations of the Treadway Commission (COSO).
We also have audited, in accordance with the standards of the Public Company Accounting Oversight Board (United States), the balance sheet of Array BioPharma Inc. as of June 30, 2005, and the related statements of operations, stockholders’ equity and comprehensive loss, and cash flows for the year then ended, and our report dated September 12, 2005 expressed an unqualified opinion on those financial statements.
Boulder, Colorado
September 12, 2005
64
Item 9. Changes in and Disagreements with Accountants on Accounting and Financial Disclosures
None - Not Applicable
Item 9A. Controls and Procedures
Effectiveness of Disclosure Controls and Procedures
We carried out an evaluation required by the Exchange Act, under the supervision and with the participation of our senior management, including our principal executive officer and principal financial officer, of the effectiveness of the design and operation of our disclosure controls and procedures as of the end of the period covered by this report. Based on this evaluation, our principal executive officer and principal financial officer concluded that our disclosure controls and procedures, as defined in Rules 13a-15(e) and 15d-15(e) under the Exchange Act, are effective in timely alerting them to material information required to be included in our periodic SEC reports.
Management’s Annual Report on Internal Control over Financial Reporting
Our management is responsible for establishing and maintaining adequate internal control over financial reporting, as such term is defined in Exchange Act Rules 13a-15(f) and 15d-15(f). Under the supervision and with the participation of our management, including our principal executive officer and principal financial officer, we conducted an evaluation of the effectiveness of our internal control over financial reporting based on the framework in Internal Control— Integrated Framework issued by the Committee of Sponsoring Organizations of the Treadway Commission (COSO).
Based on management’s evaluation under the COSO framework of our internal control over financial reporting, management concluded that our internal control over financial reporting was effective as of June 30, 2005.
All internal control systems, no matter how well designed, have inherent limitations. Therefore, even those systems determined to be effective can provide only reasonable assurance regarding the reliability of financial reporting and the preparation of financial statements for external purposes in accordance with GAAP.
KPMG LLP, our independent registered public accounting firm, has issued an attestation report on our management’s assessment of the effectiveness of our internal control over financial reporting as of June 30, 2005, as stated in their report, which appears at the end of Item 8 of this Annual Report on Form 10-K.
Changes in Internal Control Over Financial Reporting
During the fourth quarter of fiscal year 2005, management implemented certain controls including implementing a compliance checklist and providing for a secondary review of new leases to ensure that our leases are accounted for in accordance with Statement of Financial Accounting Standards No. 13, Accounting for Leases, and Financial Accounting Standards Board Technical Bulletin No. 85-3, Accounting for Operating Leases with Scheduled Rent Increases. The implementation of these controls followed a change in our accounting of rent expense under our facilities leases, which had previously not been in compliance with the Technical Bulletin. Although we do not believe that the impact of this change was material to any prior periods, we restated our prior financial statements because correcting this error in a single quarter could have a material effect on our results of operations for the fourth quarter of fiscal 2005.
Other than the change in controls described above, there have been no changes in the Company’s internal control over financial reporting identified in connection with the evaluation required by Rule 13a-15(d) of the Securities Exchange Act of 1934, as amended that occurred during the Company’s last fiscal quarter that have materially affected, or are reasonably likely to material affect, the Company’s internal control over financial reporting.
Item 9B. Other Information
Not applicable
65
PART III
Item 10. Directors and Executive Officers of the Registrant
The information required by this item is incorporated by reference from the information under the captions “Proposal 1-Election of Directors,” “Executive Officers” “Section 16(a) Beneficial Ownership Reporting Compliance” contained in the Proxy Statement of Array BioPharma Inc. relating to the annual meeting of stockholders to be held on October 26, 2005.
Code of Ethics
We have adopted a Code of Business Conduct that applies to all of our directors, officers and employees, including our principal executive officer, principal financial officer and principal accounting officer. The Code of Business Conduct is posted under the Investor Relations portion of our website at www.arraybiopharma.com.
We intend to satisfy the disclosure requirement of Form 8-K regarding amendments to or waivers from a provision of our Code of Business Conduct by posting such information on our website at www.arraybiopharma.com and, to the extent required by the Nasdaq Stock Market, by filing a current report on Form 8-K with the SEC, disclosing such information.
Item 11. Executive Compensation
The information required by this item is incorporated by reference from the information under the caption “Executive Compensation” contained in the Proxy Statement of Array BioPharma Inc. relating to the annual meeting of stockholders to be held on October 26, 2005.
Item 12. Security Ownership of Certain Beneficial Owners and Management and Related Stockholder Matters
The information required by this item is incorporated by reference from the information under the caption “Principal Stockholders” contained in the Proxy Statement of Array BioPharma Inc. relating to the annual meeting of stockholders to be held on October 26, 2005.
66
Securities Authorized for Issuance Under Equity Compensation Plans
The following table provides information as of June 30, 2005 about the shares of common stock that may be issued upon the exercise of options, warrants and rights under our existing equity compensation plans, which include the Amended and Restated Array BioPharma Inc. Stock Option and Incentive Plan and the Array BioPharma Inc. Employee Stock Purchase Plan.
Plan Category | | (a)
Number of
securities to be
issued upon
exercise of
outstanding
options, warrants
and rights | | (b)
Weighted-
Average
exercise price
of outstanding
options,
warrants and
rights | | (c)
Number of securities
remaining available
for future issuance
under equity
compensation plans
excluding securities
reflected in
column (a) | |
| | | | | | | |
Equity compensation plans approved by stockholders: | | | | | | | |
Amended and Restated Array BioPharma Inc. Stock Option and Incentive Plan (1) | | 6,634,541 | | $ | 6.46 | | 3,399,173 | |
Array BioPharma Inc. Employee Stock Purchase Plan (2) | | 51,398 | | 5.36 | | 158,563 | |
Equity compensation plans not approved by stockholders | | — | | — | | — | |
Total | | 6,685,939 | | $ | 6.45 | | 3,557,736 | |
(1) The shares available for issuance under the Amended and Restated Array BioPharma Inc. Stock Option and Incentive Plan (the “Plan”) is increased automatically by an amount equal to the difference between (a) 25% of our issued and outstanding shares of capital stock (on a fully diluted, as converted basis), and (b) the sum of the shares relating to outstanding option grants plus the shares available for future grants under the Plan.
(2) The number of securities to be issued under the Company’s Employee Stock Purchase Plan relates to shares of common stock accrued during the three-month purchase period ended June 30, 2005, but not issued to employees until July 2005.
Item 13. Certain Relationships and Related Transactions
The information required by this item is incorporated by reference from the information under the caption “Certain Relationships and Transactions” contained in the Proxy Statement of Array BioPharma Inc. relating to the annual meeting of stockholders to be held on October 26, 2005.
Item 14. Principal Accountant Fees and Services
The information required by this item is incorporated by reference from the information under the caption “Fees Paid to Auditors” contained in the Proxy Statement of Array BioPharma Inc. relating to the annual meeting of stockholders to be held on October 26, 2005.
67
PART IV
Item 15. Exhibits and Financial Statement Schedules
(a) 1. FINANCIAL STATEMENTS
The financial statements are listed under Part II, Item 8 of this report.
Index to Financial Statements
a) Balance Sheets at June 30, 2005 and 2004
b) Statements of Operations for each of the years in the three-year period ended June 30, 2005
c) Statements of Stockholders’ Equity and Comprehensive Income (Loss) for each of the years in the three year period ended June 30, 2005
d) Statements of Cash Flows for each of the years in the three-year period ended June 30, 2005
e) Notes to Financial Statements
2. FINANCIAL STATEMENT SCHEDULES
The following financial schedule of Array BioPharma Inc. is included under Part II, Item 8 of this report:
Schedule II – Valuation and Qualifying Accounts
Schedules other than those listed above have been omitted because they are not required, are not applicable or the information is included in the financial statements or notes thereto.
3. EXHIBITS
Exhibits are set forth in the “Exhibit Index” below.
(b) EXHIBITS — Registrant hereby files as part of this Annual Report Form 10-K the exhibits listed on the “Exhibit Index” below.
68
SIGNATURES
Pursuant to the requirements of Section 13 or 15(d) of the Securities Exchange Act of 1934, the Registrant has duly caused this report to be signed on its behalf by the undersigned, thereunto duly authorized, in the City of Boulder, State of Colorado.
| | ARRAY BIOPHARMA INC. |
Dated: September 13, 2005 | | |
| | |
| | By: /s/ Robert E. Conway | |
| | Robert E. Conway |
| | Chief Executive Officer |
SIGNATURE | | TITLE | | |
| | | | |
/s/ ROBERT E. CONWAY | | Chief Executive Officer and | | September 13, 2005 |
Robert E. Conway | | Director (Principal Executive | | |
| | Officer) | | |
| | | | |
/s/ KYLE A. LEFKOFF | | Chairman of the Board of | | September 13, 2005 |
Kyle A. Lefkoff | | Directors | | |
| | | | |
/s/ R. MICHAEL CARRUTHERS | | Chief Financial Officer | | September 13, 2005 |
R. Michael Carruthers | | (Principal Financial and | | |
| | Accounting Officer) | | |
| | | | |
/s/ FRANCIS J. BULLOCK | | Director | | September 13, 2005 |
Francis J. Bullock, Ph.D. | | | | |
| | | | |
/s/ MARVIN H. CARUTHERS | | Director | | September 13, 2005 |
Marvin H. Caruthers, Ph.D. | | | | |
| | | | |
/s/ KEVIN KOCH | | Director | | September 13, 2005 |
Kevin Koch, Ph.D. | | | | |
| | | | |
/s/ DAVID L. SNITMAN | | Director | | September 13, 2005 |
David L. Snitman, Ph.D. | | | | |
| | | | |
/s/ GIL J. VAN LUNSEN | | Director | | September 13, 2005 |
Gil J. Van Lunsen | | | | |
| | | | |
/s/ DOUGLAS E. WILLIAMS | | Director | | September 13, 2005 |
Douglas E. Williams, Ph.D. | | | | |
| | | | |
/s/ JOHN L. ZABRISKIE | | Director | | September 13, 2005 |
John L. Zabriskie, Ph.D. | | | | |
69
EXHIBIT INDEX
Exhibit
No. | | | Description |
3.1 | (1) | | Amended and Restated Certificate of Incorporation of Array BioPharma Inc. |
3.2 | (1) | | Amended and Restated Bylaws of Array BioPharma Inc. |
3.3 | (5) | | Certificate of Designation of the Series A Junior Participating Preferred Stock |
4.1 | (1) | | Specimen certificate representing the common stock |
10.1 | (1) | | 1998 Stock Option Plan effective July 1, 1998, as amended* |
10.2 | (10) | | Amended and Restated Array BioPharma Inc. Stock Option and Incentive Plan, as amended* |
10.3 | (10) | | Array BioPharma Inc. Employee Stock Purchase Plan, as amended* |
10.4 | (12) | | Amendment to Array BioPharma Inc. Employee Stock Purchase Plan* |
10.5 | (1) | | Preferred and Common Stock Purchase Agreement between Registrant and the parties whose signatures appear on the signature pages thereto dated May 18, 1998 |
10.6 | (1) | | Amendment to Preferred and Common Stock Purchase Agreement dated August 7, 1998 |
10.7 | (1) | | Series B Preferred Stock Purchase Agreement between Registrant and the parties whose signatures appear on the signature pages thereto dated November 16, 1999 |
10.8 | (1) | | Series C Preferred Stock Purchase Agreement between Registrant and the parties whose signatures appear on the signature pages thereto dated August 31, 2000 |
10.9 | (1) | | Lease Agreement by and between Registrant, as Tenant, and Amgen Inc., as Landlord, dated July 1998 |
10.10 | (1) | | First Amendment to Lease Agreement by and between Registrant, as Tenant, and Amgen Inc., as Landlord, dated April 1, 1999 |
10.11 | (3) | | Second Amendment to Lease Agreement by and between Registrant, as Tenant, and Amgen Inc., as Landlord, dated April 1, 2001 |
10.12 | (3) | | Option Agreement by and between Registrant, as Subtenant, and Boulder Headquarters LLC, as Landlord, dated April 1, 2001 |
10.13 | (1) | | Lease Agreement by and between Registrant, as Tenant, and Pratt Land Limited Liability Company, as Landlord, dated February 28, 2000 |
10.14 | (7) | | Lease Agreement by and between Registrant, as Tenant, and Pratt Land Limited Liability Company, as Landlord, dated February 11, 2002 |
10.15 | (2) | | Revised Employment Agreement by and between Registrant and Robert E. Conway dated November 15, 2001* |
10.16 | (9) | | Form of Employment Agreement dated September 1, 2002 by and between Registrant and each of Laurence E. Burgess, Jonathan A. Josey, Anthony D. Piscopio, David L. Snitman, Kevin Koch and R. Michael Carruthers. * |
10.17 | (8) | | Employment Agreement effective as of March 2002 between Registrant and John Moore* |
10.18 | (1) | | Amended and Restated Investor Rights Agreement between Registrant and the parties whose signatures appear on the signature pages thereto dated November 16, 1999 |
10.19 | (1) | | Amendment No. 1 to Amended and Restated Investor Rights Agreement between Registrant and the parties whose signatures appear on the signature pages thereto dated August 31, 2000 |
10.20 | (4) | | Rights Agreement, dated August 2, 2001, between the Registrant and Computershare Trust Company, Inc., as Rights Agent |
10.21 | (1) | | Research Services Agreement between Registrant and Eli Lilly and Company dated March 22, 2000, as amended |
10.22 | (1) | | Array Library Screening Agreement between Registrant and E.I. du Pont de Nemours and Company dated August 1, 2000 |
10.23 | (1) | | Diversity Library Screening Agreement between Registrant and Tularik Inc. dated June 10, 1999, as amended |
10.24 | (6) | | Research Agreement between Registrant and Amgen Inc. dated as of November 1, 2001 |
10.25 | (5) | | Lead Generation Collaboration Agreement by and between Registrant and Takeda Chemical Industries, Ltd., dated July 18, 2001 |
10.26 | (11) | | Collaboration and License Agreement by and between Registrant and AstraZeneca AB, dated December 18, 2003 |
10.27 | (11) | | Collaboration and License Agreement by and between Registrant and Genentech, Inc., dated December 22, 2003 |
70
10.28 | (13) | | Amended and Restated Deferred Compensation Plan of Array BioPharma Inc. dated December 20, 2004* |
10.29 | | | Drug Discovery Collaboration Agreement by and between Registrant and InterMune, Inc., dated September 10, 2002 along with Amendment No. 1 dated May 8, 2003, Amendment No. 2 dated January 7, 2004, Amendment No. 3 dated September 13, 2004, Amendment No. 4 dated December 7, 2004, Amendment No. 4A dated March 10, 2005 and Amendment No. 5 dated June 30, 2005** |
10.30 | | | Loan and Security agreement by and between Registrant and Comerica Bank dated June 28, 2005 |
10.31 | | | Addendum No. 4 to Lease Agreement by and between Registrant, as Tenant, and Circle Capital Longmont LLC, as Landlord, dated August 5, 2005** |
23.1 | | | Consent of KPMG LLP, Independent Registered Public Accounting Firm |
23.2 | | | Consent of Ernst & Young LLP, Independent Registered Public Accounting Firm |
31.1 | | | Certification of Robert E. Conway pursuant to Section 302 of the Sarbanes-Oxley Act of 2002 |
31.2 | | | Certification of R. Michael Carruthers pursuant to Section 302 of the Sarbanes-Oxley Act of 2002 |
32.0 | | | Certifications of Robert E. Conway and R. Michael Carruthers pursuant to Section 906 of the Sarbanes-Oxley Act of 2002 |
(1) | Incorporated herein by reference to the Registrant’s registration statement on Form S-1 (File No. 333-45922) |
(2) | Incorporated herein by reference to the Registrant’s registration statement on Form S-3 (File No. 333-76828) |
(3) | Incorporated herein by reference to the Quarterly Report on Form 10-Q for the fiscal quarter ended March 31, 2001 (File No. 000-31979) |
(4) | Incorporated herein by reference to the Current Report on Form 8-K as of August 3, 2001(File No. 000-31979) |
(5) | Incorporated herein by reference to the Quarterly Report on Form 10-Q for the fiscal quarter ended September 30, 2001 (File No. 000-31979) |
(6) | Incorporated herein by reference to the Current Report on Form 8-K/A as of February 6, 2002 (File No. 000-31979) |
(7) | Incorporated herein by reference to the Quarterly Report on Form 10-Q for the fiscal quarter ended March 31, 2002 (File No. 000-31979) |
(8) | Incorporated herein by reference to the Annual Report on Form 10-K for the fiscal year ended June 30, 2002 (File No. 000-31979) |
(9) | Incorporated herein by reference to the Quarterly Report on Form 10-Q for the fiscal quarter ended September 30, 2002 (File No. 000-31979) |
(10) | Incorporated herein by reference to the Registrant’s definitive proxy statement on Schedule 14A dated October 1, 2002, with respect to the annual meeting of stockholders held on October 31, 2002 |
(11) | Incorporated herein by reference to the Quarterly Report on Form 10-Q for the fiscal quarter ended December 31, 2003 (File No. 000-31979) |
(12) | Incorporated herein by reference to the Quarterly Report on Form 10-Q for the fiscal quarter ended March 31, 2004 (File No. 000-31979) |
(13) | Incorporated herein by reference to the Current Report on Form 8-K as of December 20, 2004 (File No. 000-31979) |
* Management contract or compensatory plan.
**Confidential treatment of redacted portions has been applied for.
71