
Link to searchable text of slide shown above

Link to searchable text of slide shown above
Link to searchable text of slide shown above
Link to searchable text of slide shown above

Link to searchable text of slide shown above
Link to searchable text of slide shown above
Link to searchable text of slide shown above

Link to searchable text of slide shown above

Link to searchable text of slide shown above
Link to searchable text of slide shown above

Link to searchable text of slide shown above

Link to searchable text of slide shown above

Link to searchable text of slide shown above

Link to searchable text of slide shown above
Link to searchable text of slide shown above

Link to searchable text of slide shown above

Link to searchable text of slide shown above

Link to searchable text of slide shown above

Link to searchable text of slide shown above

Link to searchable text of slide shown above

Link to searchable text of slide shown above

Link to searchable text of slide shown above

Link to searchable text of slide shown above
Link to searchable text of slide shown above

Link to searchable text of slide shown above

Link to searchable text of slide shown above

Link to searchable text of slide shown above

Link to searchable text of slide shown above

Link to searchable text of slide shown above
Link to searchable text of slide shown above
Link to searchable text of slide shown above

Link to searchable text of slide shown above
Link to searchable text of slide shown above

Link to searchable text of slide shown above

Link to searchable text of slide shown above
Link to searchable text of slide shown above

Link to searchable text of slide shown above
Link to searchable text of slide shown above
Link to searchable text of slide shown above
Link to searchable text of slide shown above
Link to searchable text of slide shown above
Link to searchable text of slide shown above
Link to searchable text of slide shown above

Link to searchable text of slide shown above
Link to searchable text of slide shown above

Link to searchable text of slide shown above
Link to searchable text of slide shown above
Link to searchable text of slide shown above
Link to searchable text of slide shown above

Link to searchable text of slide shown above
Link to searchable text of slide shown above
Link to searchable text of slide shown above
Link to searchable text of slide shown above
Link to searchable text of slide shown above

Link to searchable text of slide shown above
Link to searchable text of slide shown above
Link to searchable text of slide shown above
Link to searchable text of slide shown above

Link to searchable text of slide shown above

Link to searchable text of slide shown above
Link to searchable text of slide shown above
Link to searchable text of slide shown above
Link to searchable text of slide shown above
Link to searchable text of slide shown above
Link to searchable text of slide shown above

Link to searchable text of slide shown above

Link to searchable text of slide shown above

Link to searchable text of slide shown above
Link to searchable text of slide shown above
Link to searchable text of slide shown above

Link to searchable text of slide shown above
Link to searchable text of slide shown above
Link to searchable text of slide shown above

Link to searchable text of slide shown above
Link to searchable text of slide shown above

Link to searchable text of slide shown above

Link to searchable text of slide shown above
Link to searchable text of slide shown above

Link to searchable text of slide shown above
Link to searchable text of slide shown above

Link to searchable text of slide shown above

Link to searchable text of slide shown above
Link to searchable text of slide shown above
Link to searchable text of slide shown above
Link to searchable text of slide shown above
Link to searchable text of slide shown above
Link to searchable text of slide shown above
Link to searchable text of slide shown above
Link to searchable text of slide shown above

Link to searchable text of slide shown above

Link to searchable text of slide shown above

Link to searchable text of slide shown above
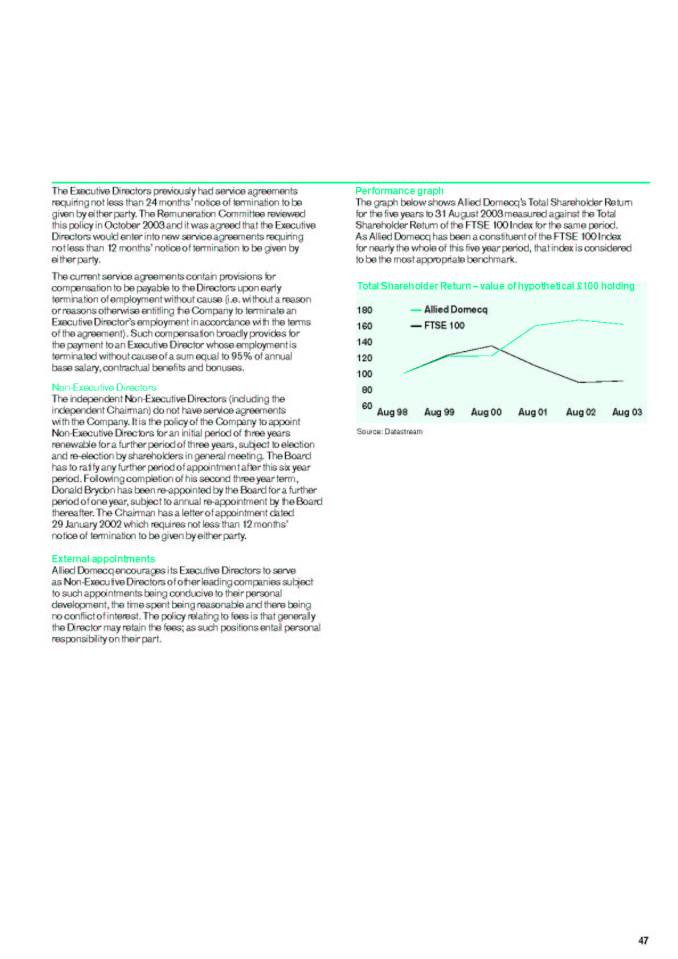
Searchable text section of graphics shown above
[GRAPHIC]
[LOGO]
invigorated
Annual Report and Accounts 2003
We will deliver growth through a relentless focus on maximising our portfolio, our presence and the talents of our people. There's a lot happening at Allied Domecq...Why not take a fresh look.
Cautionary statement regarding forward-looking information: Some statements in this Annual Report contain ‘forward-looking’ statements as defined in Section 21E of the United States Securities Exchange Act of 1934. They represent our expectations for our business, and involve risks and uncertainties. You can identify these statements by the use of words such as ‘believes’, ‘expects’, ‘may’, ‘will’, ‘should’, ‘intends’, ‘plans’, ‘anticipates’, ‘estimates’ or other similar words. We have based these forward-looking statements on our current expectations and projections about future events. We believe that our expectations and assumptions with respect to these forward-looking statements are reasonable. However, because these forward-looking statements involve known and unknown risks, uncertainties and other factors which are in some cases beyond our control, our actual results or performance may differ materially from those expressed or implied by such forward-looking statements.
Explanatory notes
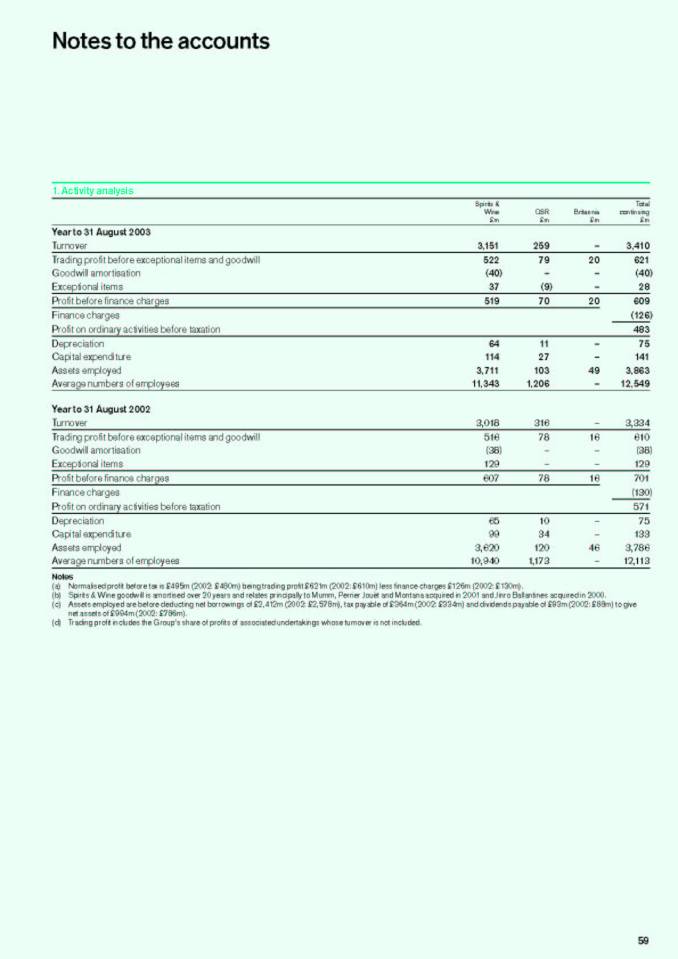
Net turnover is turnover excluding excise duty. Profit and normalised earnings are stated before goodwill and exceptional items, which include the benefit of the Mexican excise rebate. Organic growth comparisons exclude the contribution of acquisitions until they have been incorporated in the business for a full 12 months from the date of acquisition. Volumes are quoted in nine litre cases unless otherwise specified.
Brands
All brands mentioned in this Annual Report are trademarks and are registered and/or otherwise protected in accordance with applicable law.
Statement of Directors’ responsibilities and Board committees |
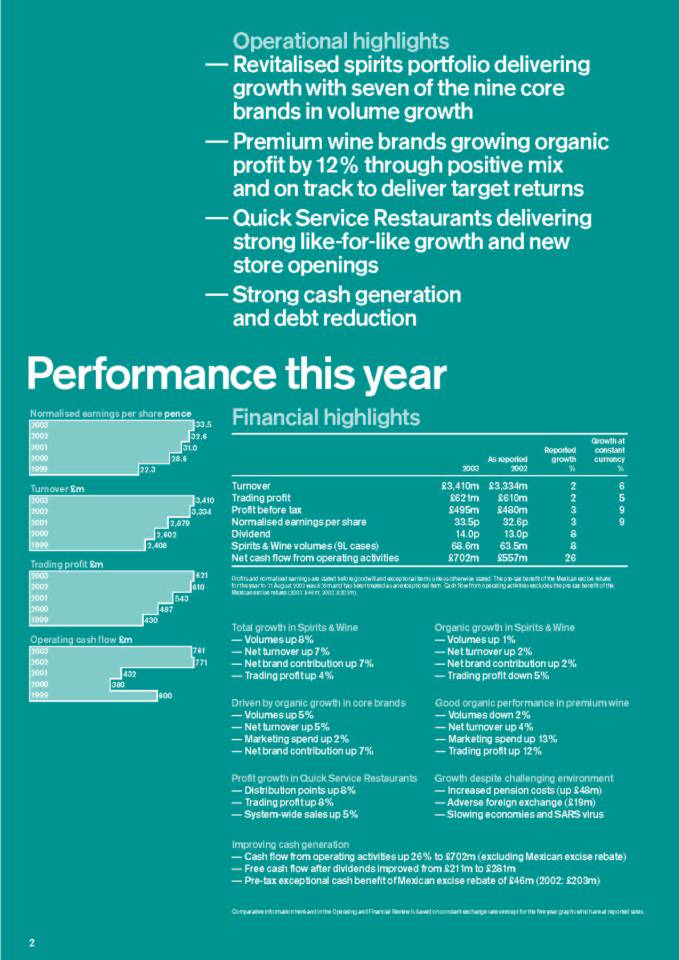
• Revitalised spirits portfolio delivering growth with seven of the nine core brands in volume growth
• Premium wine brands growing organic profit by 12% through positive mix and on track to deliver target returns
• Quick Service Restaurants delivering strong like-for-like growth and new store openings
• Strong cash generation and debt reduction
Performance this year
Normalised earnings per share pence
2003 | - | 33.5 |
|
2002 | - | 32.6 |
|
2001 | - | 31.0 |
|
2000 | - | 28.6 |
|
1999 | - | 22.3 |
|
|
|
|
|
Turnover £m |
| ||
|
|
|
|
2003 | - | 3,410 |
|
2002 | - | 3,334 |
|
2001 | - | 2,879 |
|
2000 | - | 2,602 |
|
1999 | - | 2,408 |
|
|
|
|
|
Trading profit £m |
| ||
|
|
|
|
2003 | - | 621 |
|
2002 | - | 610 |
|
2001 | - | 543 |
|
2000 | - | 487 |
|
1999 | - | 430 |
|
|
|
|
|
Operating cash flow £m |
| ||
|
|
|
|
2003 | - | 761 |
|
2002 | - | 771 |
|
2001 | - | 432 |
|
2000 | - | 380 |
|
1999 | - | 600 |
|
Financial highlights
|
|
|
| As reported |
| Reported |
| Growth at |
|
|
| 2003 |
| 2002 |
| % |
| % |
|
|
|
|
|
|
|
|
|
|
|
Turnover |
| £3,410 | m | £3,334 | m | 2 |
| 6 |
|
Trading profit |
| £621 | m | £610 | m | 2 |
| 5 |
|
Profit before tax |
| £495 | m | £480 | m | 3 |
| 9 |
|
Normalised earnings per share |
| 33.5 | p | 32.6 | p | 3 |
| 9 |
|
Dividend |
| 14.0 | p | 13.0 | p | 8 |
|
|
|
Spirits & Wine volumes (9L cases) |
| 68.6 | m | 63.5 | m | 8 |
|
|
|
Net cash flow from operating activities |
| £702 | m | £557 | m | 26 |
|
|
|
Profits and normalised earnings are stated before goodwill and exceptional items unless otherwise stated. The pre-tax benefit of the Mexican excise rebate for the year to 31 August 2003 was £38m and has been treated as an exceptional item. Cash flow from operating activities excludes the pre-tax benefit of the Mexican excise rebate (2003: £46m; 2002: £203m).
Total growth in Spirits & Wine
• Volumes up 8%
• Net turnover up 7%
• Net brand contribution up 7%
• Trading profit up 4%
Driven by organic growth in core brands
• Volumes up 5%
• Net turnover up 5%
• Marketing spend up 2%
• Net brand contribution up 7%
Profit growth in Quick Service Restaurants
• Distribution points up 8%
• Trading profit up 8%
• System-wide sales up 5%
Organic growth in Spirits & Wine
• Volumes up 1%
• Net turnover up 2%
• Net brand contribution up 2%
• Trading profit down 5%
Good organic performance in premium wine
• Volumes down 2%
• Net turnover up 4%
• Marketing spend up 13%
• Trading profit up 12%
Growth despite challenging environment
• Increased pension costs (up £48m)
• Adverse foreign exchange (£19m)
• Slowing economies and SARS virus
Improving cash generation
• Cash flow from operating activities up 26% to £702m (excluding Mexican excise rebate)
• Free cash flow after dividends improved from £211m to £281m
• Pre-tax exceptional cash benefit of Mexican excise rebate of £46m (2002: £203m)
Comparative information here and in the Operating and Financial Review is based on constant exchange rates except for the five year graphs which are at reported rates.
2
We have produced strong results again this year. Continued earnings growth, accelerated core brand performance and increasingly strong cash generation have been achieved despite difficult trading conditions and slowing economies. We have had to absorb two non-trading impacts: increased pension and foreign exchange costs. Reported earnings per share are up 3%, but excluding these two non-trading items, shows growth of 20%.
Over the past four years, our brands have been revitalised through increased marketing investment, targeted acquisitions in growing categories and innovation. This investment is now delivering with eight of our nine core brands recording net turnover growth. New products are strengthening the portfolio with encouraging results. Tia Lusso was launched last year and has already established itself as the number two cream liqueur in the UK. This year has seen new brand extensions for both Kahlúa and Beefeater.
Our acquisitions of Malibu and the distribution rights for Stolichnaya have given us access to the fast-growing categories of rum and vodka. This year both Malibu and Stolichnaya have grown share in their key markets. We are also benefiting from an increased exposure to premium wine which is growing far faster than spirits and beer in many mature markets. Our expansion into wine over the past three years is enhancing the growth profile of the business.
At Allied Domecq we are proud of our brands and encourage people to enjoy them responsibly. The consumption of alcohol has a long history and its association with relaxation, enjoyment and sociability is at the heart of our business.
As such, we are the first company to include responsible drinking messages in all of our new brand advertising. Most recently, we established an independent third party panel to review our marketing material and advise on compliance against our marketing code.
Our Quick Service Restaurants business has again delivered good profit growth with Dunkin’ Donuts outpacing the industry. Encouragingly this has come from both new store openings and growth in like-for-like sales. This business shows good growth prospects for the future.
I would like to acknowledge the contributions made by our Non-Executive Directors. In particular, David Malpas who retired from the Board in October and Peter Jacobs and Sir Ross Buckland who will retire at the conclusion of the AGM in January. I want to thank them for their role in the success of Allied Domecq over recent years. The Board has benefited from their wisdom, guidance and perspective. I am delighted to welcome three new Non-Executive Directors: Bruno Angelici of AstraZeneca, Paul Adams of British American Tobacco and John Rishton of British Airways. I look forward to working with them in the coming years.
These strong results are a testament to the leadership of Philip Bowman and the hard work and dedication of his management team and staff, and I thank them for their contribution over the past year.
/s/ Gerry Robinson |
|
| |
Gerry Robinson | |
Chairman | |
3
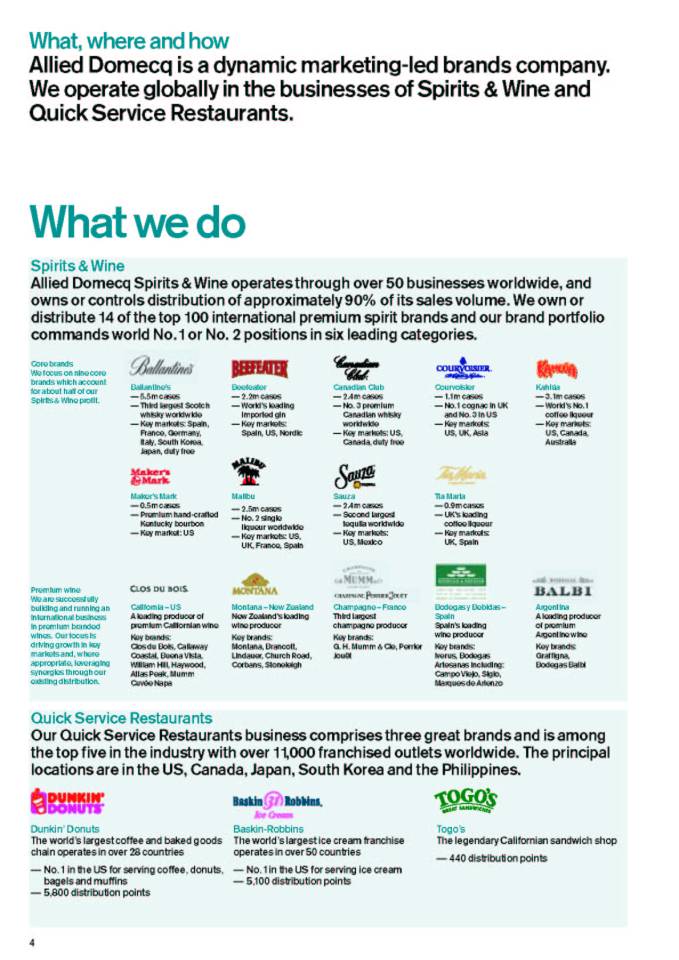
Allied Domecq is a dynamic marketing-led brands company.
We operate globally in the businesses of Spirits & Wine and Quick Service Restaurants.
What we do
Spirits & Wine
Allied Domecq Spirits & Wine operates through over 50 businesses worldwide, and owns or controls distribution of approximately 90% of its sales volume. We own or distribute 14 of the top 100 international premium spirit brands and our brand portfolio commands world No. 1 or No. 2 positions in six leading categories.
Core brands
We focus on nine core brands which account for about half of our Spirits & Wine profit.
[GRAPHIC]
Ballantine’s
• 5.5m cases
• Third largest Scotch whisky worldwide
• Key markets: Spain, France, Germany, Italy, South Korea, Japan, duty free
[GRAPHIC]
Beefeater
• 2.2m cases
• World’s leading imported gin
• Key markets: Spain, US, Nordic
[GRAPHIC]
Canadian Club
• 2.4m cases
• No. 3 premium Canadian whisky worldwide
• Key markets: US, Canada, duty free
[GRAPHIC]
Courvoisler
• 1.1m cases
• No. 1 cognac in UK and No. 3 in US
• Key markets: US, UK, Asia
[GRAPHIC]
Kahlúa
• 3.1m cases
• World’s No. 1 coffee liqueur
• Key markets: US, Canada, Australia
[GRAPHIC]
Maker's Mark
• 0.5m cases
• Premium hand-crafted Kentucky bourbon
• Key market: US
[GRAPHIC]
Malibu
• 2.5m cases
• No. 2 single liqueur worldwide
• Key markets: US, UK, France, Spain
[GRAPHIC]
Sauza
• 2.4m cases
• Second largest tequila worldwide
• Key markets: US, Mexico
[GRAPHIC]
Tia Maria
• 0.9m cases
• UK’s leading coffee liqueur
• Key markets: UK, Spain
Premium wine We are successfully building and running an international business in premium branded wines. Our focus is driving growth in key markets and, where appropriate, leveraging synergies through our existing distribution.
[GRAPHIC]
California – US
A leading producer of premium Californian wine
Key brands: Clos du Bois, Callaway Coastal, Buena Vista, William Hill, Haywood, Atlas Peak, Mumm Cuvée Napa
[GRAPHIC]
Montana – New Zealand
New Zealand’s leading wine producer
Key brands: Montana, Brancott, Lindauer, Church Road, Corbans, Stoneleigh
[GRAPHIC]
Champagne – France
Third largest champagne producer
Key brands: G. H. Mumm & Cie, Perrier Jouët
[GRAPHIC]
Bodegas y Bebidas – Spain
Spain’s leading wine producer
Key brands: Iverus, Bodegas Artesanas including: Campo Viejo, Siglo, Marques de Arienzo
[GRAPHIC]
Argentina
A leading producer of premium Argentine wine
Key brands: Graffigna, Bodegas Balbi
Quick Service Restaurants
Our Quick Service Restaurants business comprises three great brands and is among the top five in the industry with over 11,000 franchised outlets worldwide. The principal locations are in the US, Canada, Japan, South Korea and the Philippines.
[GRAPHIC]
Dunkin’ Donuts
The world’s largest coffee and baked goods chain operates in over 28 countries
• No. 1 in the US for serving coffee, donuts, bagels and muffins
• 5,800 distribution points
[GRAPHIC]
Baskin-Robbins
The world’s largest ice cream franchise operates in over 50 countries
• No. 1 in the US for serving ice cream
• 5,100 distribution points
[GRAPHIC]
Togo’s
The legendary Californian sandwich shop
• 440 distribution points
4
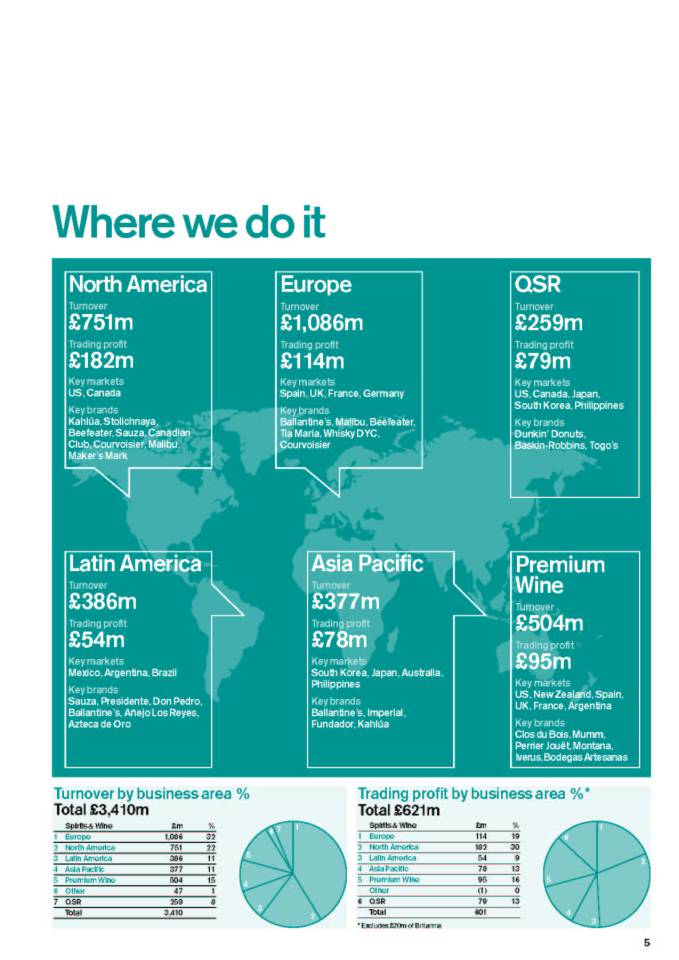
Where we do it
|
| Turnover |
| Trading profit |
| Key markets |
| Key brands |
|
North America |
| £751m |
| £182m |
| US, Canada |
| Kahlúa, Stolichnaya, Beefeater, Sauza, Canadian Club, Courvoisier, Malibu, Maker’s Mark |
|
Europe |
| £1,086m |
| £114m |
| Spain, UK, France Germany |
| Ballantine’s, Malibu, Beefeater, Tia Maria, Whisky DYC, Courvoisier |
|
QSR |
| £259m |
| £79m |
| US, Canada, Japan, South Korea, Philippines |
| Dunkin’ Donuts, Baskin-Robbins, Togo’s |
|
Latin America |
| £386m |
| £54m |
| Mexico, Argentina, Brazil |
| Sauza, Presidente, Don Pedro, Ballantine’s, Añejo Los Reyes, Azteca de Oro |
|
Asia Pacific |
| £377m |
| £78m |
| South Korea, Japan, Australia, Philippines |
| Ballantine’s, Imperial, Fundador, Kahlúa |
|
Premium Wine |
| £504m |
| £95m |
| US, New Zealand, Spain, UK, France, Argentina |
| Closdu Bois, Mumm, Perrier Jouët, Montana, Iverus, Bodegas Artesanas |
|
Turnover by business area %
Total £3,410m
[CHART]
Spirits & Wine |
| £m |
| % |
| |
1 | Europe |
| 1,086 |
| 32 |
|
2 | North America |
| 751 |
| 22 |
|
3 | Latin America |
| 386 |
| 11 |
|
4 | Asia Pacific |
| 377 |
| 11 |
|
5 | Premium Wine |
| 504 |
| 15 |
|
6 | Other |
| 47 |
| 1 |
|
7 | QSR |
| 259 |
| 8 |
|
| Total |
| 3,410 |
|
|
|
Trading profit by business area %*
Total £621m
[CHART]
Spirits & Wine |
| £m |
| % |
| |
1 | Europe |
| 114 |
| 19 |
|
2 | North America |
| 182 |
| 30 |
|
3 | Latin America |
| 54 |
| 9 |
|
4 | Asia Pacific |
| 78 |
| 13 |
|
5 | Premium Wine |
| 95 |
| 16 |
|
| Other |
| (1 | ) | 0 |
|
6 | QSR |
| 79 |
| 13 |
|
| Total |
| 601 |
|
|
|
* Excludes £20m of Britannia
5
[GRAPHIC]
Size matters? Perhaps. But biggest is rarely best. We prefer being smart. Clever in the face of change – change in the world we serve and change in the ways we work. We’re happy to be different. Look. See what we can achieve when we take some of the world’s most famous brands. Add know-how, substance and scale. Apply insight. Then finish with a dash of bravado.
positively different
[GRAPHIC]
If you build a wall without proper foundations, it will tumble down. Our business is about brands, and what we do with them. Investing in them provides the structure we need to drive our sales and grow the value of the business. We’re becoming a marketing-led company, investing more money and dedicating an ever greater share of that spending to our core brands. And we’re spending better too – with precision and to measured effect.
building brands
[GRAPHIC]
If you want to know how people enjoy our products, just ask. We can tell you. The who, the what, the why, where and who with. We’re spending more on research to understand our consumers better. Understanding means we can invest in the right way behind the right brands in the right markets. And by keeping an ear to the ground, we can predict what they will want in the future.
ear to the ground
[GRAPHIC]
One. Explore what consumers want. Two. Look at your portfolio. Three. Meet the need from existing brands. Or buy one. Or launch one. Our capacity to develop and deliver fresh ideas gives us that option. Take Tia Lusso, now well established in the UK in little over a year. In the US, current growth is in white spirits and rum. So enter WET by Beefeater and Kuya spiced fusion rum from Kahlúa – extending the portfolio, responding to trends.
exploratory thinking
[GRAPHIC]
Even a job well done can always be done better. Faster. Smarter. At lower cost. And we’re always looking to improve the ways we work. But chasing best practice isn’t enough. We’re looking for emerging practice – the brave new ideas that challenge accepted wisdom and outdated processes. The joined up thinking that gets us there first. Because when we get there, we know how to make money out of it.
creative solutions
[GRAPHIC]
We’re lucky. We can operate globally, building powerful and exciting brands. But with this opportunity comes responsibility. Alcohol isn’t just another consumer product, and we’re not just another employer. We actively promote responsible drinking. And wherever we operate we apply the same high standards to protecting our workforce, respecting the environment and caring for local communities. And we ask: judge us by what we do, not by what we say.
responsible thinking
[GRAPHIC]
You need the brands of course, but you need distribution strength to sell them. You need presence. In mature markets – North America, Western Europe – we’re consolidating relationships, improving partnerships with our distributors. And we’re building from strength in the growth markets of today and of tomorrow – South Korea, Eastern Europe, the EU accession countries, Latin America. It’s a cliché – but no less true: We really are well positioned for growth.
more coverage
[GRAPHIC]
It’s not just what we do, but how we do it that brings our brands to life. By developing people and harnessing talents, we attract and retain the best to deliver our business goals. People are the key to unlocking the value in the brands, and we reward good performance. We asked our employees: What kind of company would you like to work for? They said: One that makes time to celebrate success together.
celebrating success
[GRAPHIC]
Operating and financial review
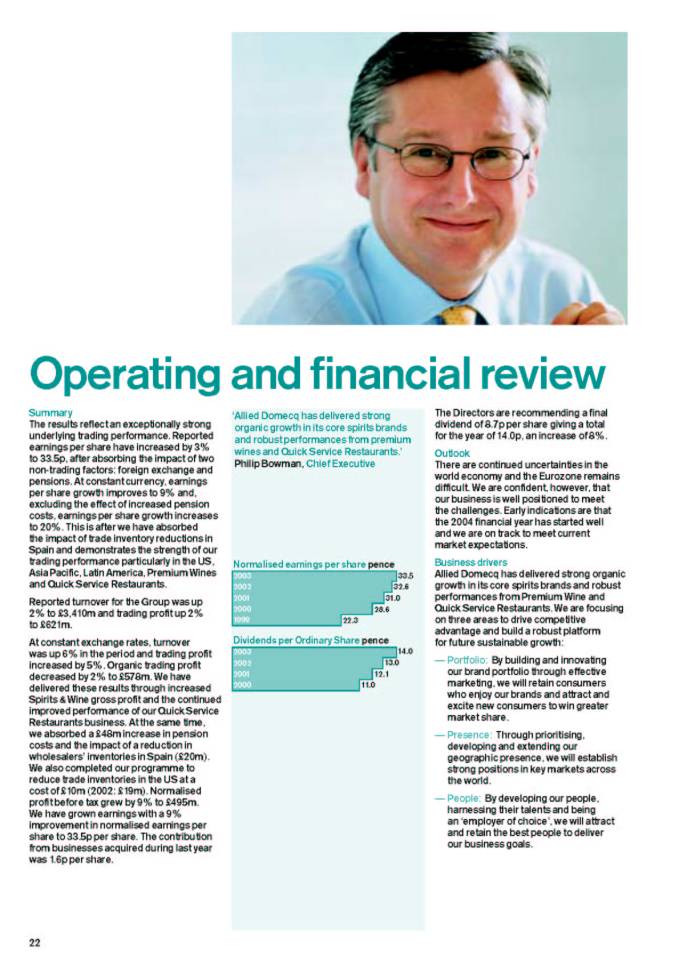
‘Allied Domecq has delivered strong organic growth in its core spirits brands and robust performances from premium wines and Quick Service Restaurants.’ Philip Bowman, Chief Executive
Normalised earnings per share pence
2003 | — | 33.5 |
|
2002 | — | 32.6 |
|
2001 | — | 31.0 |
|
2000 | — | 28.6 |
|
1999 | — | 22.3 |
|
|
|
|
|
Dividends per Ordinary Share pence | |||
|
|
|
|
2003 | — | 14.0 |
|
2002 | — | 13.0 |
|
2001 | — | 12.1 |
|
2000 | — | 11.0 |
|
Summary
The results reflect an exceptionally strong underlying trading performance. Reported earnings per share have increased by 3% to 33.5p, after absorbing the impact of two non-trading factors: foreign exchange and pensions. At constant currency, earnings per share growth improves to 9% and, excluding the effect of increased pension costs, earnings per share growth increases to 20%. This is after we have absorbed the impact of trade inventory reductions in Spain and demonstrates the strength of our trading performance particularly in the US, Asia Pacific, Latin America, Premium Wines and Quick Service Restaurants.
Reported turnover for the Group was up 2% to £3,410m and trading profit up 2% to £621m.
At constant exchange rates, turnover was up 6% in the period and trading profit increased by 5%. Organic trading profit decreased by 2% to £578m. We have delivered these results through increased Spirits & Wine gross profit and the continued improved performance of our Quick Service Restaurants business. At the same time, we absorbed a £48m increase in pension costs and the impact of a reduction in wholesalers’ inventories in Spain (£20m). We also completed our programme to reduce trade inventories in the US at a cost of £10m (2002: £19m). Normalised profit before tax grew by 9% to £495m. We have grown earnings with a 9% improvement in normalised earnings per share to 33.5p per share. The contribution from businesses acquired during last year was 1.6p per share.
The Directors are recommending a final dividend of 8.7p per share giving a total for the year of 14.0p, an increase of 8%.
Outlook
There are continued uncertainties in the world economy and the Eurozone remains difficult. We are confident, however, that our business is well positioned to meet the challenges. Early indications are that the 2004 financial year has started well and we are on track to meet current market expectations.
Business drivers
Allied Domecq has delivered strong organic growth in its core spirits brands and robust performances from Premium Wine and Quick Service Restaurants. We are focusing on three areas to drive competitive advantage and build a robust platform for future sustainable growth:
• Portfolio: By building and innovating our brand portfolio through effective marketing, we will retain consumers who enjoy our brands and attract and excite new consumers to win greater market share.
• Presence: Through prioritising, developing and extending our geographic presence, we will establish strong positions in key markets across the world.
• People: By developing our people, harnessing their talents and being an ‘employer of choice’, we will attract and retain the best people to deliver our business goals.
22
[GRAPHIC]
We are reinvigorating our No. 1 US brand, Kahlúa, with an exciting new marketing campaign called ‘Unleash it’. Launched in October 2002, the campaign is already helping to deliver improved consumption trends.
[GRAPHIC]
Stolichnaya is the world’s top selling vodka and we refreshed our marketing for the brand in the US with a new campaign called ‘Little truths’.
Portfolio: Through a focused programme of effective marketing and innovation over recent years, we have revitalised the growth of our portfolio – particularly our core brands. Our ‘Go play’ programme of marketing activity has stimulated continued market share growth for Ballantine’s across Europe. New marketing programmes and executions were launched during the year for Kahlúa, Sauza, Malibu and Stolichnaya to build brand equity and drive future growth. We have also continued our focus on the effectiveness of our marketing spend.
Innovation is also fuelling growth in our core brands. The successful launch of Tia Lusso, a cream liqueur extension of Tia Maria, has helped to grow the Tia Maria brand by 14%. During the year, we continued our innovation programme with the launch of WET by Beefeater – a premium extension of Beefeater, and Kuya – a spiced fusion rum extension of Kahlúa. In addition, we have developed a range of ready-to-drinks in markets such as Mexico and Australia which are growing strongly.
The portfolio continues to benefit from the targeted acquisitions made over the past three years in growing categories such as rum, vodka and premium wine. Malibu has exceeded our expectations with good share growth in its key markets. Stolichnaya has continued to grow volume and share in the competitive US vodka market. Our premium wine brands have delivered strong growth demonstrating the resilience of our wine operations – remaining firmly on track to meet their targeted returns.
Presence: We have increased our exposure to key markets through focused investment in distribution and sales capabilities. We will capitalise upon existing market strengths and establish new positions in markets with the capacity for growth. For example, we have further strengthened our partnership with US distributors with the continued implementation of our ‘first choice supplier’ approach, with new contracts established in Illinois and California. Our strong portfolio and distributor relationships have helped us to grow market share in the US. We have significantly increased our sales force capabilities, particularly in the on-trade in the UK and US. The profits from our Asia Pacific business have increased fourfold since we invested in Jinro Ballantines in South Korea in 2000. We have established market-leading positions in a number of key countries in Central & Eastern Europe which will continue to drive future growth in Europe.
We have also doubled the pace at which we are opening new distribution points in our Quick Service Restaurants business such that distribution points increased by 8% in the year. There remain considerable opportunities to increase our brand presence within the US and internationally and we have a programme to open over 1,000 new distribution points in 2004.
23
Operating and financial review
[GRAPHIC]
Our people are at the heart of what we do at Allied Domecq. By continuing to attract the right people, harnessing their talents and creating incentives to reward success we will continue to build a culture based on quality and competence.
Spirits & Wine revenue £m
2003 | — | 3,151 |
|
2002 | — | 3,018 |
|
2001 | — | 2,571 |
|
2000 | — | 2,297 |
|
1999 | — | 2,110 |
|
|
|
|
|
Spirits & Wine advertising and promotion £m | |||
|
|
|
|
2003 | — | 437 |
|
2002 | — | 443 |
|
2001 | — | 330 |
|
2000 | — | 301 |
|
1999 | — | 272 |
|
|
|
|
|
Spirits & Wine trading profit £m | |||
|
|
|
|
2003 | — | 522 |
|
2002 | — | 516 |
|
2001 | — | 458 |
|
2000 | — | 414 |
|
1999 | — | 369 |
|
People: Our people are key to unlocking the value of our brands. We encourage our people to be passionate about our brands by providing opportunities for development, rewarding good performance and recognising achievement. Through rigorous evaluation and effective recruitment, we have progressively increased the quality of our people. There is also now a clearer link between performance and reward to create the right environment to drive the success of our people and our brands.
Measured by turnover, our Spirits & Wine business is 49% larger than it was in 1999 as a result of targeted acquisitions and organic growth. We are leveraging this increased scale by introducing new ways of working. This will reduce overlap between central, regional and market-focused functions and will allow us to be leaner and more responsive – to speed up decision making and to push accountability out into the business. This is enabling us to be more competitive and to respond more quickly to customers and changing market conditions. Our objective is to grow the profitable volume of our brands while optimising the efficiency of our operations.
Spirits & Wine
|
| Total |
| Organic |
| ||||||
|
| 2003 |
| Growth |
| 2003 |
| Growth |
| ||
Volume |
|
|
|
|
|
|
|
|
| ||
(9L cases) |
| 68.6 | m | 8 |
| 64.2 | m | 1 |
| ||
Net turnover |
| £ | 2,480 | m | 7 |
| £ | 2,352 | m | 2 |
|
Advertising and promotion |
| £ | 437 | m | 1 |
| £ | 414 | m | (5 | ) |
Trading profit |
| £ | 522 | m | 4 |
| £ | 479 | m | (5 | ) |
We have grown our Spirits & Wine net turnover through organic growth and acquisition. Total Spirits & Wine volumes and net turnover increased by 8% and 7% respectively. Trading profit grew 4%.
Before acquisitions, volumes and net turnover grew 1% and 2% respectively. On an organic basis, trading profit declined by 5% primarily as a result of the increased pension costs (£48m). We have also absorbed the impact of the trade inventory reductions in Spain (£20m) and US (£10m). These results reflect a performance against a prior year that was particularly strong in the second half.
Marketing excellence: During the year we increased advertising and promotion spend by 1%. Before acquisitions, advertising and promotion declined by 5%, following a 21% increase last year. This decline is driven partly by a 32% reduction in Asia Pacific following a 57% increase last year driven by new campaigns for Imperial and Ballantine’s Masters. Spend in the region was reduced during the second half because of the short-term impact of SARS. We have also reduced spend behind the Mexican brandies and our other Spirits & Wine brands. There has also been some reduction as a result of the transitioning of marketing assignments between advertising agencies.
Over the past four years we have progressively increased our investment in marketing our spirits portfolio particularly our core brands. Advertising and promotion has increased by 59% since 1999 while turnover has increased by 49% over the same period. Advertising and promotion for spirits brands, measured as a percentage of net turnover, has increased by two percentage points since 1999 to 20%. Our wine brands, including premium wine brands, typically require lower levels of spend at around 11% of net turnover.
24
[GRAPHIC]
‘Go play’ is the first fully integrated through-the-line campaign for Ballantine’s – our largest brand. Launched in 2002, it has helped to drive Ballantine’s market share to new heights in Europe.
[GRAPHIC]
Canadian Club has been revitalised with market share growth in its key market – the US. We have also launched a successful range of ready-to-drinks in Australia.
[GRAPHIC]
Courvoisier has delivered strong growth and has retained its position as the No. 1 cognac in the UK.
In addition, we are increasingly rigorous in the way we allocate spend between brands and markets: directing more spend behind new marketing campaigns and product launches particularly for the core brands and withdrawing spend from less effective areas. The investment is increasingly focused behind the core brands which now receive 57% of the advertising and promotion spend. Our organic spend behind the core brands increased by 2% in the year, particularly behind Kahlúa and Tia Maria. We have also increased organic spend behind the premium wine brands by 13%, particularly the champagnes which have performed well.
Over the past four years, we have sought to improve the effectiveness of our marketing spend through improved consumer research techniques, media and brand tracking studies and through the way we work with our agencies. During the year, we completed the agency realignment programme that we started in 2001, rationalising from over 150 marketing agencies to one global agency. This programme has already generated annual savings of around £20m since 2001 and will ensure that we continue to leverage improved efficiencies for future marketing activities. As a result, we are achieving a greater impact from our increased spend such that we anticipate that our ongoing investment is likely to track broadly in line with sales growth with some variation as specific brand campaign and innovation opportunities arise.
Brand review
We manage our Spirits & Wine portfolio as four groups: core brands, local market leaders, premium wine and other Spirits & Wine brands. Brand performance is reviewed below under these groups.
Core brands: The volumes and net turnover of our core brands, on a like-for-like basis, both grew by 5% driven by strong growth across nearly all the brands. Organic advertising and promotion behind the core brands was up 2% resulting in net brand contribution up 7%.
Ballantine’s has benefited from the ‘Go play’ campaign launched in 2002 and has grown share strongly across its key markets in Europe and Asia Pacific. Both Ballantine’s and Beefeater have continued to grow market share in Spain. However, despite these gains, both brands have recorded declines in overall shipment volumes as a result of the change in buying patterns by wholesalers in Spain. Outside Spain, Ballantine’s volumes grew 3% and Beefeater volumes were flat.
Canadian Club has grown share in the US and performed well with ready-to-drink extensions in Australia driving total volumes up 9% and net turnover up 7%. Excluding the ready-to-drink extensions, the Canadian Club mother brand grew volumes by 5% and net turnover by 6%. Courvoisier has performed well in the US and UK with overall volumes up by 5% and net turnover up by 4% although it has slowed in the second half against a very strong performance last year.
25
Operating and financial review
Spirits & Wine volumes
68.6m nine litre cases
[CHART]
1 Core brands |
| 30 | % |
2 Local market leaders |
| 17 | % |
3 Premium wine |
| 23 | % |
4 Other Spirits & Wine |
| 30 | % |
Spirits & Wine net turnover
£2,480m
[CHART]
1 Core brands |
| 44 | % |
2 Local market leaders |
| 19 | % |
3 Premium wine |
| 19 | % |
4 Other Spirits & Wine |
| 18 | % |
Spirits & Wine advertising and promotion
£437m
[CHART]
1 Core brands |
| 57 | % |
2 Local market leaders |
| 18 | % |
3 Premium wine |
| 11 | % |
4 Other Spirits & Wine |
| 14 | % |
Spirits & Wine net brand contribution
£1,023m
[CHART]
1 Core brands |
| 48 | % |
2 Local market leaders |
| 20 | % |
3 Premium wine |
| 15 | % |
4 Other Spirits & Wine |
| 17 | % |
[GRAPHIC]
The launch of Tia Lusso last year helped to grow Tia Maria volumes by 14% this year.
[GRAPHIC]
Our acquisition of Malibu in May 2002 has exceeded our expectations delivering market share growth in the US, the UK and Spain.
Spirits & Wine volume and net turnover growth
|
| Volume |
| Volume |
| Net |
|
Core brands |
|
|
|
|
|
|
|
Ballantine’s |
| 5.5 |
| (4 | ) | (3 | ) |
Beefeater |
| 2.2 |
| (2 | ) | 2 |
|
Canadian Club |
| 2.4 |
| 9 |
| 7 |
|
Courvoisier |
| 1.1 |
| 5 |
| 4 |
|
Kahlúa |
| 3.1 |
| 1 |
| 1 |
|
Maker’s Mark |
| 0.5 |
| 14 |
| 16 |
|
Malibu (organic) |
| 0.8 |
| 50 |
| 47 |
|
Sauza |
| 2.4 |
| 28 |
| 20 |
|
Tia Maria |
| 0.9 |
| 14 |
| 15 |
|
Organic core brands |
| 18.9 |
| 5 |
| 5 |
|
Malibu (acquired) |
| 1.7 |
| — |
| — |
|
|
|
|
|
|
|
|
|
Local market leaders |
| 11.9 |
| (4 | ) | (6 | ) |
|
|
|
|
|
|
|
|
Organic premium wine |
| 13.1 |
| (2 | ) | 4 |
|
Premium wine acquisitions |
| 2.7 |
| — |
| — |
|
|
|
|
|
|
|
|
|
Other Spirits & Wine brands |
|
|
|
|
|
|
|
Other spirits |
| 12.7 |
| 2 |
| 5 |
|
Other wine |
| 7.6 |
| 4 |
| (1 | ) |
Other Spirits & Wine Total |
| 20.3 |
| 3 |
| 4 |
|
Total |
| 68.6 |
| 8 |
| 7 |
|
Organic |
| 64.2 |
| 1 |
| 2 |
|
The performance of Kahlúa has improved this year with volumes and net turnover both up 1%. This has been driven by good performances in Latin America and duty free and the launch of a new advertising campaign, ‘Unleash it’, in the US. Kahlúa has also benefited from the launch in the US of Kuya, a spiced fusion rum. This is the world’s first fusion rum which is aimed at 21-29 year olds and is being promoted through the ‘Do Ya Kuya?’ campaign. Maker’s Mark had another good year with volumes up 14% and net turnover up 16%. Malibu is now fully integrated as one of our core brands and has begun contributing to the organic portfolio growth with three months of like-for-like sales. The brand has performed well in its core markets with market share growth in the UK, US, France and Spain.
Sauza became the world’s fastest growing international distilled spirit brand with significant market share growth in both US and Mexico. Sauza volumes grew 28% and net turnover grew 20% with pricing down, driven by the reduced cost of the raw material, agave. A new fully integrated marketing campaign, ‘Get lost’ has helped to drive brand awareness. The Tia Maria brand has continued to benefit from the successful launch of Tia Lusso, a new light cream liqueur. Overall Tia Maria volumes grew by 14% and net turnover by 15%.
Local market leaders: Stolichnaya has continued to perform strongly in the US with good market share gains in volume and value. A new marketing campaign, ‘Little truths’, was launched this summer to fuel future brand growth. The range of Stolichnaya flavours was also expanded with Stolichnaya Cranberi and Stolichnaya Citros. Hiram Walker Liqueurs benefited from the successful launch of a new range of fruit liqueurs in North America called Fruja which helped to grow its volumes and net turnover up by 12%. Fundador continued to build on its position as the largest international spirit brand in the Philippines with 6% growth in volumes and 11% improvement in net turnover. The combined impact of a decline in the shipment volumes of Whisky DYC and Centenario, because of the change in buying patterns by wholesalers in Spain, and declines in Mexican brandies caused overall local market leader brand volumes to fall by 4% and net turnover to decline by 6%. Outside Spain, the local market leader volumes grew 1%.
26
[GRAPHIC]
We own two premium champagne brands, G.H. Mumm & Cie and Perrier Jouët, which have grown volumes 16% and net turnover 17%.
[GRAPHIC]
We are now capitalising on the fast-growing premium wine category. We have established a strong presence with a good mix of brands from key wine markets around the world. Our premium wine brands grew organic profits 12% and we are firmly on track to meet our targeted returns.
Premium wine: The premium wine business grew volumes by 18% primarily as a result of the acquisition of Bodegas y Bebidas in December 2001 and Mumm Cuvée Napa in May 2002. Before the benefit of acquisitions, premium wine volumes fell 2% while net turnover grew 4% primarily as a result of the improving mix. A full review of the premium wine brands is provided in the regional review on page 30.
Other Spirits & Wine brands: The volumes of other Spirits & Wine brands were up 3% with net turnover up 4%, while net brand contribution grew by 6%. This has been driven by strong performances by the ready-to-drink brands, Caribe Cooler and Spirit by Terry, in Mexico and by good growth in various North American brands such as Wiser’s whisky and Polar Ice.
Market review
The regional performance of our business is reviewed below.
Europe
|
| Organic |
| Total |
|
Volumes (9L cases) |
| (6 | ) | (2 | ) |
Net turnover |
| (3 | ) | 2 |
|
Advertising and promotion |
| 8 |
| 16 |
|
Trading profit |
| (33 | ) | (21 | ) |
Reported net turnover grew 2% to £762m while trading profit declined 21% to £114m. Before acquisitions, trading profit was down 33% reflecting net turnover down 3% and advertising and promotion up 8%. Europe’s profit decline reflects increased marketing investment behind the launch of Tia Lusso. It was also affected by a change in the buying patterns by Spanish wholesalers as they reduced inventories. Outside Spain, our organic European volumes were flat and net turnover grew 2% reflecting the sluggish economies in the region, particularly Germany and France. Organic net brand contribution outside Spain declined 5% reflecting the increased marketing spend for the launch of Tia Lusso.
Our business in Spain grew its volume and value share of the total spirits market, which continued to grow at around 2% in the year to July 2003. However, a change in buying patterns by Spanish wholesalers caused shipment volumes to fall by 17% on an organic basis for the year. The whisky category has continued to grow, although at a slower rate than last year, but Ballantine’s has gained share by growing twice as fast as the category. We have continued to invest behind Ballantine’s ‘Go play’ in Spain with an 18% increase in advertising and promotion to drive awareness in this important market. Beefeater has continued to make progress with strong market share gains in the gin category. Centenario has increased its share of the brandy category by two percentage points making it the clear category leader. Malibu has performed very well under our ownership with good growth in the on-trade helping to grow its market share.
The UK business had a good year with market share gains in the off-trade driven by strong performances by Teacher’s, Courvoisier, Tia Maria and Malibu. Courvoisier grew volumes 6% and has retained its position as the number one selling cognac in the UK. Tia Maria grew volumes 33% as a result of the launch of Tia Lusso, which has become the number two selling cream liqueur in the UK. Malibu has performed particularly strongly as the fastest growing speciality liqueur brand in the on-trade.
27
Operating and financial review
[GRAPHIC]
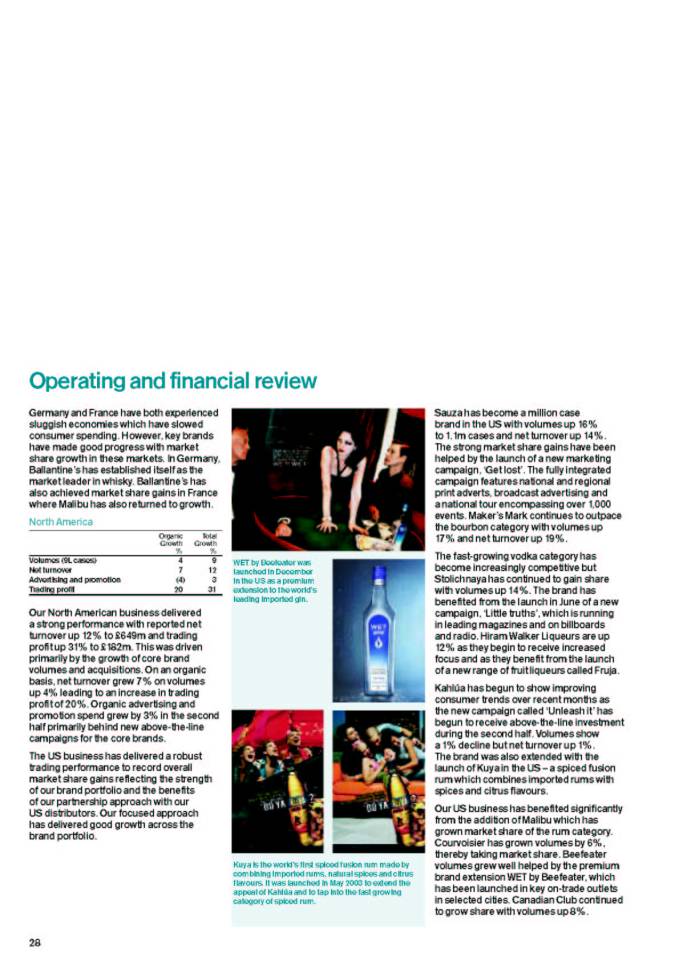
WET by Beefeater was launched in December in the US as a premium extension to the world’s leading imported gin.
[GRAPHIC]
Kuya is the world’s first spiced fusion rum made by combining imported rums, natural spices and citrus flavours. It was launched in May 2003 to extend the appeal of Kahlúa and to tap into the fast growing category of spiced rum.
Germany and France have both experienced sluggish economies which have slowed consumer spending. However, key brands have made good progress with market share growth in these markets. In Germany, Ballantine’s has established itself as the market leader in whisky. Ballantine’s has also achieved market share gains in France where Malibu has also returned to growth.
North America
|
| Organic |
| Total |
|
Volumes (9L cases) |
| 4 |
| 9 |
|
Net turnover |
| 7 |
| 12 |
|
Advertising and promotion |
| (4 | ) | 3 |
|
Trading profit |
| 20 |
| 31 |
|
Our North American business delivered a strong performance with reported net turnover up 12% to £649m and trading profit up 31% to £182m. This was driven primarily by the growth of core brand volumes and acquisitions. On an organic basis, net turnover grew 7% on volumes up 4% leading to an increase in trading profit of 20%. Organic advertising and promotion spend grew by 3% in the second half primarily behind new above-the-line campaigns for the core brands.
The US business has delivered a robust trading performance to record overall market share gains reflecting the strength of our brand portfolio and the benefits of our partnership approach with our US distributors. Our focused approach has delivered good growth across the brand portfolio.
Sauza has become a million case brand in the US with volumes up 16% to 1.1m cases and net turnover up 14%. The strong market share gains have been helped by the launch of a new marketing campaign, ‘Get lost’. The fully integrated campaign features national and regional print adverts, broadcast advertising and a national tour encompassing over 1,000 events. Maker’s Mark continues to outpace the bourbon category with volumes up 17% and net turnover up 19%.
The fast-growing vodka category has become increasingly competitive but Stolichnaya has continued to gain share with volumes up 14%. The brand has benefited from the launch in June of a new campaign, ‘Little truths’, which is running in leading magazines and on billboards and radio. Hiram Walker Liqueurs are up 12% as they begin to receive increased focus and as they benefit from the launch of a new range of fruit liqueurs called Fruja.
Kahlúa has begun to show improving consumer trends over recent months as the new campaign called ‘Unleash it’ has begun to receive above-the-line investment during the second half. Volumes show a 1% decline but net turnover up 1%. The brand was also extended with the launch of Kuya in the US – a spiced fusion rum which combines imported rums with spices and citrus flavours.
Our US business has benefited significantly from the addition of Malibu which has grown market share of the rum category. Courvoisier has grown volumes by 6%, thereby taking market share. Beefeater volumes grew well helped by the premium brand extension WET by Beefeater, which has been launched in key on-trade outlets in selected cities. Canadian Club continued to grow share with volumes up 8%.
28
[GRAPHIC]
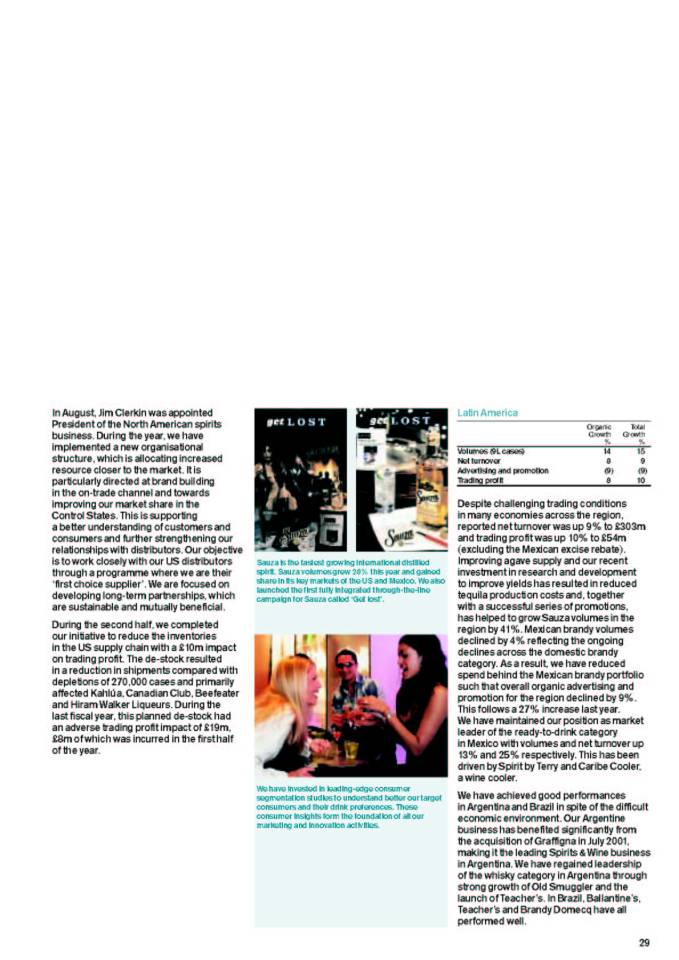
Sauza is the fastest growing international distilled spirit. Sauza volumes grew 28% this year and gained share in its key markets of the US and Mexico. We also launched the first fully integrated through-the-line campaign for Sauza called ‘Get lost’.
[GRAPHIC]
We have invested in leading-edge consumer segmentation studies to understand better our target consumers and their drink preferences. These consumer insights form the foundation of all our marketing and innovation activities.
In August, Jim Clerkin was appointed President of the North American spirits business. During the year, we have implemented a new organisational structure, which is allocating increased resource closer to the market. It is particularly directed at brand building in the on-trade channel and towards improving our market share in the Control States. This is supporting a better understanding of customers and consumers and further strengthening our relationships with distributors. Our objective is to work closely with our US distributors through a programme where we are their ‘first choice supplier’. We are focused on developing long-term partnerships, which are sustainable and mutually beneficial.
During the second half, we completed our initiative to reduce the inventories in the US supply chain with a £10m impact on trading profit. The de-stock resulted in a reduction in shipments compared with depletions of 270,000 cases and primarily affected Kahlúa, Canadian Club, Beefeater and Hiram Walker Liqueurs. During the last fiscal year, this planned de-stock had an adverse trading profit impact of £19m, £8m of which was incurred in the first half of the year.
Latin America
|
| Organic |
| Total |
|
Volumes (9L cases) |
| 14 |
| 15 |
|
Net turnover |
| 8 |
| 9 |
|
Advertising and promotion |
| (9 | ) | (9 | ) |
Trading profit |
| 8 |
| 10 |
|
Despite challenging trading conditions in many economies across the region, reported net turnover was up 9% to £303m and trading profit was up 10% to £54m (excluding the Mexican excise rebate). Improving agave supply and our recent investment in research and development to improve yields has resulted in reduced tequila production costs and, together with a successful series of promotions, has helped to grow Sauza volumes in the region by 41%. Mexican brandy volumes declined by 4% reflecting the ongoing declines across the domestic brandy category. As a result, we have reduced spend behind the Mexican brandy portfolio such that overall organic advertising and promotion for the region declined by 9%. This follows a 27% increase last year. We have maintained our position as market leader of the ready-to-drink category in Mexico with volumes and net turnover up 13% and 25% respectively. This has been driven by Spirit by Terry and Caribe Cooler, a wine cooler.
We have achieved good performances in Argentina and Brazil in spite of the difficult economic environment. Our Argentine business has benefited significantly from the acquisition of Graffigna in July 2001, making it the leading Spirits & Wine business in Argentina. We have regained leadership of the whisky category in Argentina through strong growth of Old Smuggler and the launch of Teacher’s. In Brazil, Ballantine’s, Teacher’s and Brandy Domecq have all performed well.
29
Operating and financial review
[GRAPHIC]
Ballantine’s is our largest brand and is the No. 2 Scotch in Europe.
[GRAPHIC]
Fundador is the largest international spirits brand in the Philippines.
[GRAPHIC]
Maker’s Mark is a hand crafted premium batch bourbon with cult status among bourbon drinkers. The brand has continued to grow strongly with volumes up 14% driven by its unique marketing support.
During the period, the pre-tax profit of the Mexican excise rebate following the Mexican Supreme Court ruling was £38m. This has been treated as an exceptional item. This is the final payment giving a pre-tax total of £298m received over the last three years.
Asia Pacific
|
| Organic |
| Total |
|
Volumes (9L cases) |
| 5 |
| 7 |
|
Net turnover |
| 0 |
| 1 |
|
Advertising and promotion |
| (32 | ) | (32 | ) |
Trading profit |
| 27 |
| 30 |
|
Asia Pacific has delivered strong trading profit growth in spite of a slowdown in the region in the second half caused by weaker economies and the impact of SARS on the duty free channel in a number of markets. Trading profit was up 30% to £78m while net turnover grew 1% to £258m. On an organic basis, trading profit grew 27%. The profit growth has been driven principally by South Korea and good performances in the Philippines, Australia, the Middle East and Thailand duty free. Organic advertising and promotion declined, following a 57% increase in marketing investment last year. This decline is principally behind Ballantine’s, following the launch costs for Ballantine’s Masters last year, and Imperial, after a large increase last year for the ‘Imperial Keeper’ campaign. We also reviewed our spend in the second half as a result of the SARS impact in the region.
Our South Korean business, Jinro Ballantines, grew strongly in the year with market share growth over the last year. Ballantine’s volumes grew 8% driven particularly by growth in the super-premium aged Ballantine’s range. Imperial remains the clear leader in premium whisky and the largest volume whisky brand in Korea although its volumes declined by 1% reflecting slowdown in the overall Scotch category during the second half. This category slowdown was driven by a weaker Korean economy and by pressures on consumer credit.
Fundador continues to perform well in the Philippines with volumes up 6% and net turnover growth of 11% driven by market share growth. Fundador is the largest international spirits brand in the Philippines. Our business in Australia has benefited from growth in the Canadian Club mother brand and CC Club and CC Cola ready-to-drinks supported by the successful ‘similar yet different’ message.
Premium Wine
|
| Organic |
| Total |
|
Volumes (9L cases) |
| (2 | ) | 18 |
|
Net turnover |
| 4 |
| 18 |
|
Advertising and promotion |
| 13 |
| 23 |
|
Trading profit |
| 12 |
| 23 |
|
Our premium wine brands have performed well against tough trading conditions in many wine markets around the world. Reported net turnover grew 18% to £463m and trading profit up 23% to £95m. We remain firmly on track to meet our stated targets to grow the returns from our premium wines. This demonstrates the resilience of our wine brands and the benefits of their broad geography which provides a natural hedge against variations in recent wine cycles.
30
[GRAPHIC]
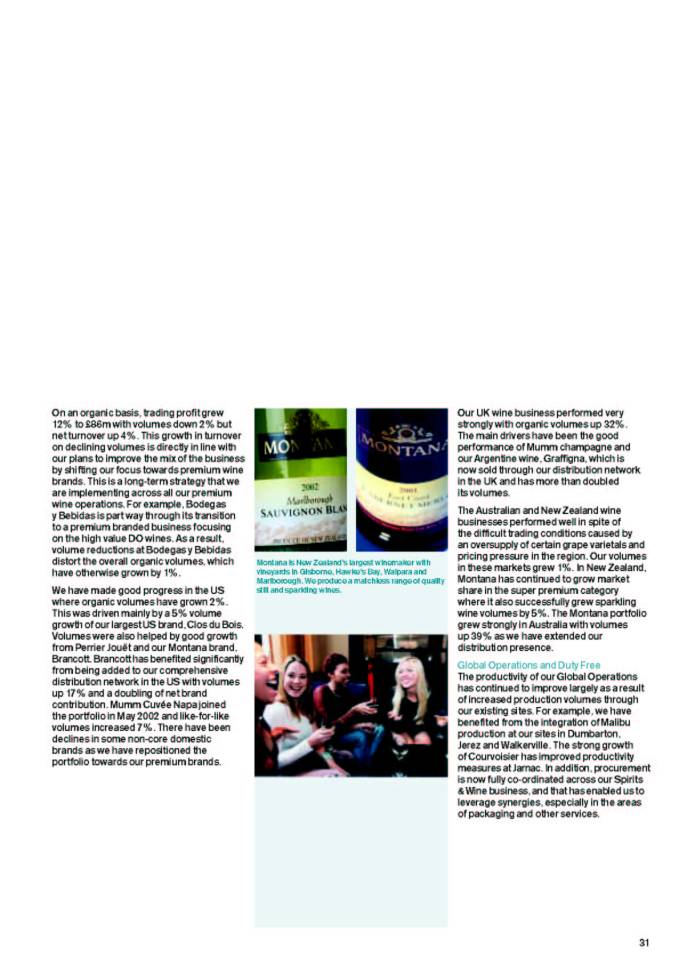
Montana is New Zealand’s largest winemaker with vineyards in Gisborne, Hawke’s Bay, Waipara and Marlborough. We produce a matchless range of quality still and sparkling wines.
[GRAPHIC]
On an organic basis, trading profit grew 12% to £86m with volumes down 2% but net turnover up 4%. This growth in turnover on declining volumes is directly in line with our plans to improve the mix of the business by shifting our focus towards premium wine brands. This is a long-term strategy that we are implementing across all our premium wine operations. For example, Bodegas y Bebidas is part way through its transition to a premium branded business focusing on the high value DO wines. As a result, volume reductions at Bodegas y Bebidas distort the overall organic volumes, which have otherwise grown by 1%.
We have made good progress in the US where organic volumes have grown 2%. This was driven mainly by a 5% volume growth of our largest US brand, Clos du Bois. Volumes were also helped by good growth from Perrier Jouët and our Montana brand, Brancott. Brancott has benefited significantly from being added to our comprehensive distribution network in the US with volumes up 17% and a doubling of net brand contribution. Mumm Cuvée Napa joined the portfolio in May 2002 and like-for-like volumes increased 7%. There have been declines in some non-core domestic brands as we have repositioned the portfolio towards our premium brands.
Our UK wine business performed very strongly with organic volumes up 32%. The main drivers have been the good performance of Mumm champagne and our Argentine wine, Graffigna, which is now sold through our distribution network in the UK and has more than doubled its volumes.
The Australian and New Zealand wine businesses performed well in spite of the difficult trading conditions caused by an oversupply of certain grape varietals and pricing pressure in the region. Our volumes in these markets grew 1%. In New Zealand, Montana has continued to grow market share in the super premium category where it also successfully grew sparkling wine volumes by 5%. The Montana portfolio grew strongly in Australia with volumes up 39% as we have extended our distribution presence.
Global Operations and Duty Free
The productivity of our Global Operations has continued to improve largely as a result of increased production volumes through our existing sites. For example, we have benefited from the integration of Malibu production at our sites in Dumbarton, Jerez and Walkerville. The strong growth of Courvoisier has improved productivity measures at Jarnac. In addition, procurement is now fully co-ordinated across our Spirits & Wine business, and that has enabled us to leverage synergies, especially in the areas of packaging and other services.
31
Operating and financial review
‘We have continued to deliver earnings growth and improved cash generation. Free cash flow has increased in each of the last three years driven by our focus on working capital management.’
Graham Hetherington,
Chief Financial Officer
Quick Service Restaurants distribution points
11,383 points
[CHART]
1 Dunkin’ Donuts |
| 51 | % |
2 Baskin-Robbins |
| 45 | % |
3 Togo’s |
| 4 | % |
Quick Service Restaurants system-wide sales
£2,742m
[CHART]
1 North America |
| 85 | % |
2 International |
| 15 | % |
Quick Service Restaurants trading profit £m
2003 | — | 79 |
|
2002 | — | 78 |
|
2001 | — | 72 |
|
2000 | — | 64 |
|
1999 | — | 53 |
|
Our Duty Free operations have performed well within a difficult environment. The first half saw strong organic growth and showed a recovery against the previous year which was affected by the events of 11 September 2001. However, the impact of the SARS virus, the Iraq war and slowing economies in many markets caused the recovery to falter in the second half reflecting a decline in passenger traffic. Our actions to mitigate these effects was successful with Ballantine’s Aged performing particularly well, retaining its market leadership position in super premium scotch in duty free. The addition of Malibu and our premium wine brands has made a very positive contribution to our Duty Free business. In particular, our premium wines have benefited from the access to this channel provided by our global distribution network.
Quick Service Restaurants
• Distribution points up 8%
• Number of combination stores up 37%
• System-wide sales growth of 5%
• Trading profit up 8% to £79m
The strong profit growth in our Quick Service Restaurants business has been driven by continued growth in same store sales and the contribution from new stores. Distribution points increased by 8% as we significantly increased the pace of store openings in both the US and internationally during the year. We have plans to rapidly expand the number of distribution points over the coming year. Overall turnover has fallen by 11% to £259m reflecting the final stage in the process to full outsourcing of ice cream manufacture for Baskin-Robbins to Dean Foods in the US.
Dunkin’ Donuts delivered a 7% growth in system-wide sales driven by a 4.4% increase in US same store sales and a 7% increase in global distribution points. Its same store sales growth has continued to outpace the overall QSR industry driven by effective marketing work and innovation. Dunkin’ Donuts has promoted the sale of boxed donuts through a programme called ‘express donuts’ which are 12 packs containing the top six flavours. This programme has also been supported by a new campaign, ‘Who brought the donuts?’, which encourages the purchase of boxed donuts, thereby increasing the value of each customer transaction. In addition, Dunkin’ Donuts has driven its successful innovation programme with new beverage offerings such as caramel iced coffee and lemonade coolatta which benefited from a promotional competition with MTV called ‘Route to Cool’. We have also continued our focus on coffee with sales of ‘coffee by the pound’ growing well and a successful trial of a broader range of coffee offerings such as cappuccino, latte and espresso.
Baskin-Robbins same store sales in the US declined by 4.5% and global system-wide sales were up 1% for the year reflecting the poor weather in key US markets and the sluggish US economy – particularly in its core market of California. Global distribution points increased by 9%. Baskin-Robbins ran movie tie-ins with ‘X2: X-Men United’ and ‘Sinbad’ with new flavours such as Oreo X-Mint, X-Treme Berry Sherbet and Sinbad’s Triple Punch Sherbet. Free-Scoop Nights continue to attract significant publicity to drive brand awareness.
32
[GRAPHIC]
Dunkin’ Donuts sales growth has continued to outpace the QSR industry driven by its cutting edge marketing and new product development. We’re No. 1 in the US for serving coffee, donuts, bagels and muffins.
[GRAPHIC]
Baskin-Robbins is the world’s largest ice cream franchise. It’s famous for its innovative flavours with a flavour library approaching 1,000 different offerings. We sell the full range of frozen ice cream treats such as cones, cakes, sundaes, shakes and ‘Blasts’.
[GRAPHIC]
Togo’s is a popular sandwich brand on the West Coast of the US, selling great sandwiches with generous portions of high-quality, fresh ingredients. We also offer a selection of soups, salads and vegetarian selections.
Togo’s has also been affected by the poor economic situation in California resulting in a 5% decline in system-wide sales. Togo’s has been refreshing its product offering with the introduction of toasted sandwiches, a new line of breads, meat and cheese and has expanded into a new range of salads and lighter meals as well as kids’ meals.
Our strategy of multi-branded combination stores continues to be a driver of growth in new store openings, with a 37% increase in the number of combination stores to over 1,100 stores. This strategy is supported by our brands’ complementary day-part offering and brings significant benefits to our franchisees through improved scale and operating efficiencies, along with increased choices for consumers.
In January 2003, Jon Luther was appointed as Chief Executive Officer of the Quick Service Restaurants business. During 2003, we restructured the business to concentrate around the three brands and to provide improved focus on operational systems and standards, menu and product development and the expansion of the international business. The reorganisation has resulted in a leaner and more focused organisation providing operational synergies. This resulted in an exceptional charge of £9m which will generate annual cost savings of £7m.
Britannia soft drinks
The Group’s share of Britannia’s profits for the period was £20m (2002: £16m).
Taxation
The normalised tax rate for the year has decreased from 25% to 24%, as we continue to manage our tax liabilities. We anticipate that the normalised rate for the year ending 31 August 2004 will remain at this level.
Goodwill and exceptional items
Goodwill amortisation totalled £40m (2002: £38m), the increase reflecting a full year of amortisation relating to the acquisition of Bodegas y Bebidas.
The exceptional items of £28m reflect the benefit of the Mexican excise rebate: pre-tax £38m (2002: £213m); post-tax £25m (2002: £138m). It also includes a charge for the restructuring of Quick Service Restaurants (£9m) and the completion of the acquisition integration programme announced in 2002 (£3m).
Cash flow
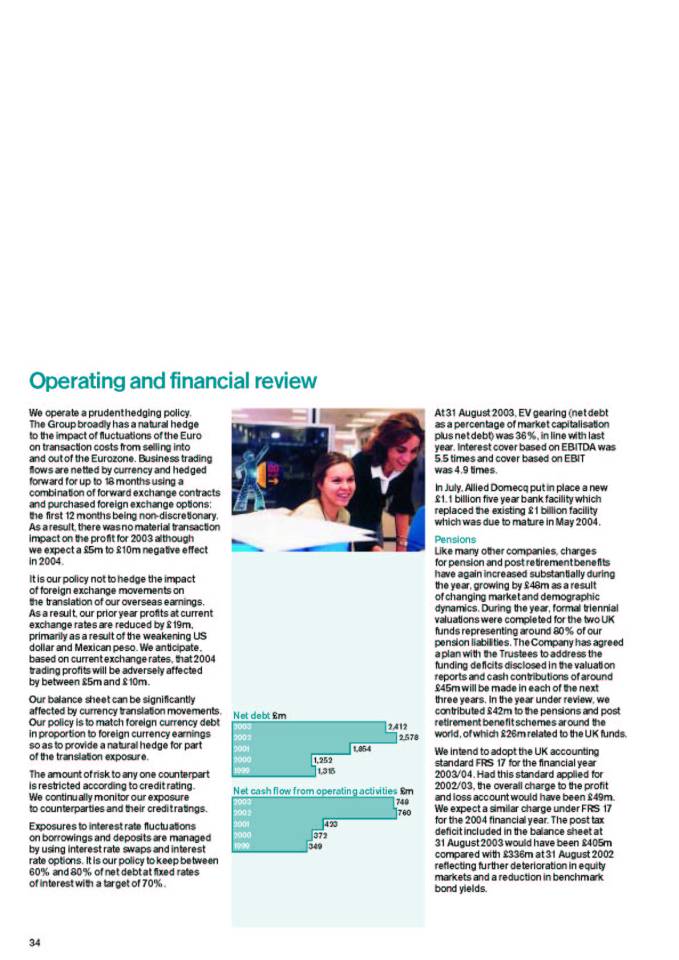
Net cash flow from operating activities was £748m (2002: £760m) and free cash flow was £281m (2002: £211m). Cash flow benefited from a rebate of excise duty (net of tax) in Mexico of £38m this year (2002: £128m). If this non-repeatable item is excluded, free cash flow improved by £160m to £243m. This improvement is a result of improved working capital management, particularly debtor and creditor management, and lower tax payments.
Net debt decreased by £166m during the period from £2,578m to £2,412m which includes an adverse currency translation impact on our borrowings of £82m largely as a result of the strengthening Euro partially offset by a weakening US dollar.
Treasury operations
The Group treasury operates as a centralised service managing interest rate and foreign exchange risk and financing. The Board agrees and reviews policies and financial instruments for risk management.
33
Operating and financial review
[GRAPHIC]
Net debt £m
2003 | - | 2,412 |
|
2002 | - | 2,578 |
|
2001 | - | 1,854 |
|
2000 | - | 1,252 |
|
1999 | - | 1,315 |
|
|
|
|
|
Net cash flow from operating activities £m | |||
|
|
|
|
2003 | - | 748 |
|
2002 | - | 760 |
|
2001 | - | 423 |
|
2000 | - | 372 |
|
1999 | - | 349 |
|
We operate a prudent hedging policy. The Group broadly has a natural hedge to the impact of fluctuations of the Euro on transaction costs from selling into and out of the Eurozone. Business trading flows are netted by currency and hedged forward for up to 18 months using a combination of forward exchange contracts and purchased foreign exchange options: the first 12 months being non-discretionary. As a result, there was no material transaction impact on the profit for 2003 although we expect a £5m to £10m negative effect in 2004.
It is our policy not to hedge the impact of foreign exchange movements on the translation of our overseas earnings. As a result, our prior year profits at current exchange rates are reduced by £19m, primarily as a result of the weakening US dollar and Mexican peso. We anticipate, based on current exchange rates, that 2004 trading profits will be adversely affected by between £5m and £10m.
Our balance sheet can be significantly affected by currency translation movements. Our policy is to match foreign currency debt in proportion to foreign currency earnings so as to provide a natural hedge for part of the translation exposure.
The amount of risk to any one counterpart is restricted according to credit rating. We continually monitor our exposure to counterparties and their credit ratings.
Exposures to interest rate fluctuations on borrowings and deposits are managed by using interest rate swaps and interest rate options. It is our policy to keep between 60% and 80% of net debt at fixed rates of interest with a target of 70%.
At 31 August 2003, EV gearing (net debt as a percentage of market capitalisation plus net debt) was 36%, in line with last year. Interest cover based on EBITDA was 5.5 times and cover based on EBIT was 4.9 times.
In July, Allied Domecq put in place a new £1.1 billion five year bank facility which replaced the existing £1 billion facility which was due to mature in May 2004.
Pensions
Like many other companies, charges for pension and post retirement benefits have again increased substantially during the year, growing by £48m as a result of changing market and demographic dynamics. During the year, formal triennial valuations were completed for the two UK funds representing around 80% of our pension liabilities. The Company has agreed a plan with the Trustees to address the funding deficits disclosed in the valuation reports and cash contributions of around £45m will be made in each of the next three years. In the year under review, we contributed £42m to the pensions and post retirement benefit schemes around the world, of which £26m related to the UK funds.
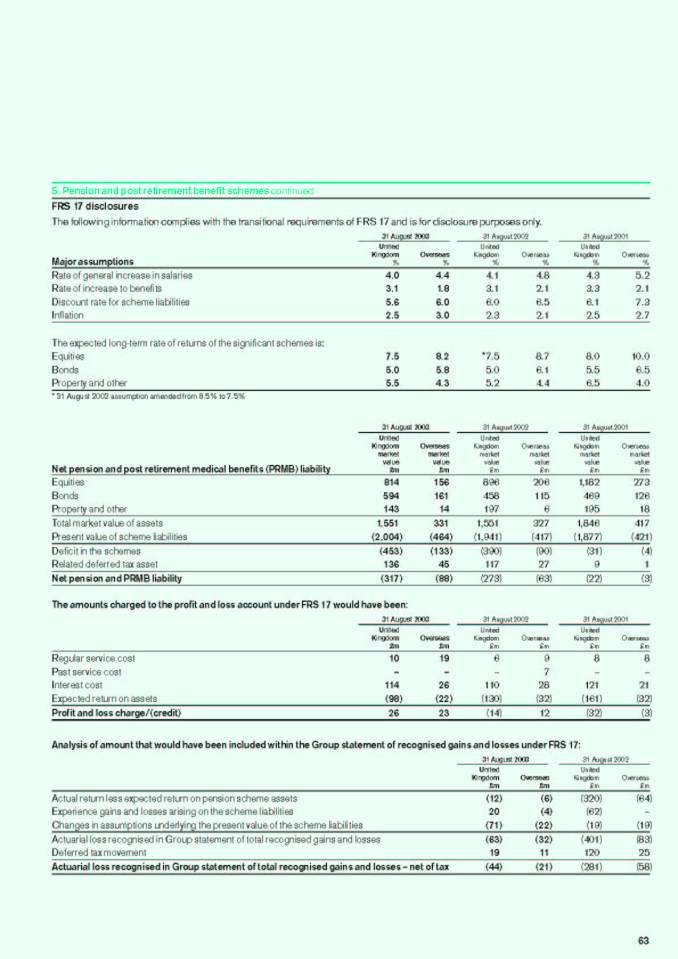
We intend to adopt the UK accounting standard FRS 17 for the financial year 2003/04. Had this standard applied for 2002/03, the overall charge to the profit and loss account would have been £49m. We expect a similar charge under FRS 17 for the 2004 financial year. The post tax deficit included in the balance sheet at 31 August 2003 would have been £405m compared with £336m at 31 August 2002 reflecting further deterioration in equity markets and a reduction in benchmark bond yields.
34
Constant exchange rate reporting
The following tables provide a reconciliation between the 2002 reported results and those shown at constant exchange rates in the Operating and Financial Review.
Geographical analysis – Group trading profit
In line with previous statements, the trading profits of the regions shown in this review are on a management reporting basis at constant exchange rates, rather than on a statutory basis at each year’s actual exchange rates, as shown in note 2 to the accounts. The table bottom right shows the foreign exchange effect of restating last year’s reported trading profit for each region at this year’s actual exchange rates. ‘Others’ in the table includes Global Operations (including profit from the sale of bulk whisky), stand-alone Duty Free operations and central costs not allocated to marketing regions. In addition, the table sets out the impact of market transfers on last year’s regional Spirits & Wine trading profits. The market transfers column includes the movement of European Duty Free from Europe to our stand-alone Duty Free operations reported in ‘Others’. The column also includes the movement of some existing Spanish wine operations from Europe to Premium Wine and the reallocation of central costs, primarily central marketing costs such as consumer research activities, to the regions. The profit decline in ‘Others’ principally reflects increased pension costs (£48m) partly offset by the year-on-year benefit of some one-off costs which were not repeated in the current year.
|
| 2002 |
| 2003 |
| ||||||
Group |
| Reported |
| Foreign |
| At 2003 |
| Reported |
| Growth |
|
|
| £m |
| £m |
| £m |
| £m |
| % |
|
Turnover |
| 3,334 |
| (114 | ) | 3,220 |
| 3,410 |
| 6 |
|
Trading profit |
| 610 |
| (19 | ) | 591 |
| 621 |
| 5 |
|
Finance charges |
| (130 | ) | (6 | ) | (136 | ) | (126 | ) | (7 | ) |
Profit before tax |
| 480 |
| (25 | ) | 455 |
| 495 |
| 9 |
|
Taxation |
| (120 | ) | 6 |
| (114 | ) | (119 | ) | 4 |
|
Minority interests |
| (13 | ) | — |
| (13 | ) | (16 | ) | 23 |
|
Earnings |
| 347 |
| (19 | ) | 328 |
| 360 |
| 10 |
|
Weighted average number of Ordinary Shares (millions) |
| 1,066 |
|
|
| 1,066 |
| 1,075 |
|
|
|
Earnings per share (pence) |
| 32.6 |
|
|
| 30.8 |
| 33.5 |
| 9 |
|
|
| 2002 |
| 2003 |
| ||||||
Spirits & Wine |
| Reported |
| Foreign |
| At 2003 |
| Reported |
| Growth |
|
|
| £m |
| £m |
| £m |
| £m |
| % |
|
Turnover |
| 3,018 |
| (88 | ) | 2,930 |
| 3,151 |
| 8 |
|
Duty |
| (638 | ) | 20 |
| (618 | ) | (671 | ) | 9 |
|
Net turnover |
| 2,380 |
| (68 | ) | 2,312 |
| 2,480 |
| 7 |
|
Advertising and promotion |
| 443 |
| (9 | ) | 434 |
| 437 |
| 1 |
|
The foreign exchange adjustment restates prior year profits and sales at current year average exchange rates. Where this would distort the reporting of underlying performance following a material devaluation or under conditions of hyperinflation, profits and sales are not restated and retain their original value as reported in pounds sterling.
Geographical analysis – Group trading profit
|
| 2002 |
| 2003 |
| 2003 |
| ||||||||||
|
| Reported |
| Market |
| Foreign |
| At 2003 |
| 2003 |
| Growth |
| 2003 |
| Growth |
|
|
| £m |
| £m |
| £m |
| £m |
| £m |
| % |
| £m |
| % |
|
Europe |
| 160 |
| (27 | ) | 12 |
| 145 |
| 114 |
| (21 | ) | 97 |
| (33 | ) |
North America |
| 169 |
| (11 | ) | (19 | ) | 139 |
| 182 |
| 31 |
| 167 |
| 20 |
|
Latin America |
| 61 |
| (3 | ) | (9 | ) | 49 |
| 54 |
| 10 |
| 53 |
| 8 |
|
Asia Pacific |
| 66 |
| (4 | ) | (2 | ) | 60 |
| 78 |
| 30 |
| 76 |
| 27 |
|
Premium Wine |
| 68 |
| 8 |
| 1 |
| 77 |
| 95 |
| 23 |
| 86 |
| 12 |
|
Others |
| (8 | ) | 37 |
| 3 |
| 32 |
| (1 | ) | (103 | ) | — |
| (100 | ) |
Spirits & Wine |
| 516 |
| — |
| (14 | ) | 502 |
| 522 |
| 4 |
| 479 |
| (5 | ) |
QSR |
| 78 |
| — |
| (5 | ) | 73 |
| 79 |
| 8 |
| 79 |
| 8 |
|
Britannia |
| 16 |
| — |
| — |
| 16 |
| 20 |
| 25 |
| 20 |
| 25 |
|
Total |
| 610 |
| — |
| (19 | ) | 591 |
| 621 |
| 5 |
| 578 |
| (2 | ) |
35
Corporate social responsibility
Building a sustainable business
‘There is no doubt that our continued drinks sector leadership position in the BiE index reflects the consistent hard work of all the Global Operations team to ensure that our policy objective of ‘beyond compliance’ is implemented. There is no room for complacency and every operating unit has its plan to deliver continual improvements in environmental and health and safety performance.’ Richard Turner, President, Global Operations
[GRAPHIC]
Allied Domecq and the Texas Package Store Association (TPSA) partnering together to combat underage access to beverage alcohol by using point of sale material.
‘Corporate Social Responsibility is not a response to a changing environment. It is a belief that either exists in the management of a corporation or doesn’t. The management of Allied Domecq has such a belief and has undertaken some significant initiatives during 2003 to make the belief a tangible reality.’ Kim Manley, Chief Marketing Officer
Allied Domecq builds brands people want in order to deliver maximum return to its shareholders. But we can only maintain and optimise this return if we recognise the impact that our products and our actions have on society, on the environment, our consumers and our employees.
We need to plan to build a long-term, sustainable business. And we do – committing ourselves to delivering sustainability in three critical areas: economic, environmental and social. Within Allied Domecq we call this our triple bottom line.
Economic – While we clearly exist to make a profitable return on the money invested in our business, our performance measurements take as much account of the way in which we achieve results as the results themselves.
Sustainability criteria run right through our business planning processes, and employees are expected to carry out their every day activities to maximise the positive impact on the triple bottom line.
Environmental – We are an acknowledged sector leader in environmental policy. This was again recognised in two important benchmarking surveys: the Business in the Environment index where we lead the drinks sector as we have in each of the seven years that the BiE index has been established; and in our continued inclusion in the Dow Jones sustainability index.
The adoption of ISO 14001 as the global production standard has committed the business to making continual improvements in our production processes to minimise their environmental impact. Over 80% of the Group has plans and targets for water use improvements, waste reduction and energy efficiency. Some examples of the practical effect of our environmental policy can be found in the environment section of our website (www.allieddomecq.com), and our full Environmental, Health and Safety Report will be updated in early 2004.
Social – As one of the world’s largest producers of beverage alcohol we recognise our social responsibilities. Alcohol can be a source of pleasure, positive social interaction and can be life enhancing. However, if abused it can cause considerable damage to the individual and to society.
We take enormous care when marketing our products to ensure that we do not encourage excessive consumption or inadvertently target those under the legal drinking age. By being proactive in developing a Global Marketing Code we have helped to raise industry standards.
Last year we announced that we were leading the industry by including responsible drinking messages in all of our new brand communications, thereby helping to promote beneficial patterns of consumption.
This year we have another industry first with the creation of a third party review board which advises the Company on compliance with our own standards for marketing, and identifies any external risks that we need to take into account when executing new campaigns. The review board will operate transparently with regular meeting reports on our corporate website.
Allied Domecq is a member of a number of national bodies established with our industry partners to develop programmes to reduce the abuse of alcohol by young people, encourage sensible alcohol consumption and discourage drinking and driving. We will also work with any organisation that seeks to reduce the harm that can result from inappropriate consumption of our products by targeting potentially risky occasions.
36
Allied Domecq Spirits North America has formed a partnership with the Texas Package Store Association (TPSA) in a joint social responsibility initiative to combat underage drinking. TPSA represents retailers in Texas, and Allied Domecq will be working with retailers to launch a Point of Sale programme to educate parents on the risks of illegal under age access to beverage alcohol.
UK
As part of the Bristol mosaic we have funded a new interactive exhibit in the award winning science and discovery centre @Bristol. Mainly targeted at teenagers, the exhibit allows visitors to explore how alcohol affects our health and behaviour.
Scotland
We support a local theatre company that is conveying the message of the dangers of drug and alcohol abuse. Senior managers of Allied Distillers are involved in mentoring projects for the unemployed and by offering business expertise to small local businesses. Allied Distillers has its own recycling compound on site, which processes 3,000 tonnes of waste of which 2,750 tonnes are recycled.
Mexico
Effluent from the spent wash at our tequila plant in Mexico equalled the waste from a town of 180,000 inhabitants. Legal alternatives, such as using the wash to irrigate crops, were not considered to be a sustainable solution, so we chose to install the only wastewater treatment plant in the whole of the tequila industry.
Spain
Each year employees choose three projects to support based on what they perceive as the real needs of local people – needs such as disability or homelessness. The Solidarity Dominican Republic project is setting up a library in an impoverished area of Punta Cana, with employees donating the books and Allied Domecq providing furniture and other equipment.
New Zealand
Montana has used cause-related marketing to support projects researching threats to dolphins and the marine environment, and won the Australian Financial Review’s Commercial Bravery Award for its involvement with the Aids Trust of Australia.
‘The ideas behind the building of a sustainable business are now becoming real for people in Allied Domecq. Teams throughout the business are increasingly more aware of the importance of our relationships with all our stakeholders. We are now making significant progress towards the cultivation of a socially responsible way of working rather than just responding to the governance needs for ticks in certain boxes. We will be known by our actions not words.’ David Scotland, President, Wines
[GRAPHIC]
Corporate Responsibility Index 2002
Business in the Community – Beverages
Company |
| Rating |
| Ranking |
|
1 Allied Domecq |
| ABAAA |
| 2nd Quintile (71.8% – 82%) |
|
2 Diageo |
| AAABB |
| 3rd Quintile (65.8% – 71.8%) |
|
3 Scottish & Newcastle |
| BBABB |
| 4th Quintile (52% – 65.8%) |
|
[GRAPHIC]
Included in the Dow Jones Sustainability Indexes, the World Index and STOXX
[GRAPHIC]
Included in the FTSE4 Good Benchmarking survey
We seek to play a positive and involving role in the communities in which we work. We do not believe in ‘top down’ corporate donations but rather encourage our operating companies and sites to donate, contribute and play active roles in their local communities based on the real needs of local people. We call this the ‘Allied Domecq Mosaic Approach’ and our various activities include involvement in homelessness projects, literacy programmes and employee volunteering.
Social report – It is possible to assess an organisation’s social performance by analysing its effect on stakeholders at the local, national and global levels. In order to obtain the information needed to make this assessment, we have conducted – this year – an internal audit of our social impact at the local level, covering every business unit within the Group worldwide. We have identified key performance indicators such as labour practices and human rights, and broader issues affecting consumers, communities and other stakeholders in society. The findings will be published in early 2004 as our first Social Report, and in addition to community and marketplace issues will also elaborate on the workplace policies and practices that are in place.
Workplace – In the same way that we have promoted global environmental standards, the externally certified occupational health and safety management system OHSAS18001 is being implemented as the common health and safety standard across the Group.
We have endorsed the United Nations Declaration on Human Rights and our policy on non-discrimination, respect for diversity and equal opportunities is given full in the Corporate Social Report on our website.
Our employees are at the heart of Allied Domecq and we have made great strides during this year in the overall management of our talent.
In 2002 we introduced our 6 core values: Performance with Passion, Diversity, Celebration, Learning, Unity and Integrity. These values have now been built into our talent management. We have significantly developed our talent base both from the marketplace and by improving our identification of internal talent. We have introduced a global leadership programme, ATLAS, which is improving the quality of our workforce and will guarantee our leadership capability for the future. Within our reward programmes, employees are assessed on both what they have achieved and how it has been achieved, with equal weighting given to both. This is a clear indication that our performance-led culture is growing even stronger.
We continue to listen to our employees through employee opinion global surveys. This year, we have achieved even higher levels of participation in the survey, which is further evidence of our employee’s commitment to the success of AlliedDomecq.
All businesses within Allied Domecq have an alcohol policy. This ensures that employees are given balanced information about the impact of misusing alcohol on their own health and the potential consequences for them and their families. They also have confidential access to treatment if they have difficulty controlling their own drinking. Providing information on sensible, enjoyable drinking is part of the complete range of employment policies that have been developed by Allied Domecq to equip us for business in the 21st century.
37
Gerry Robinson Non-Executive Chairman
Appointed a Director in February 2002 and Non-Executive Chairman in April 2002. He is also Chairman of Arts Council England. He was formerly Chairman of Granada, British Sky Broadcasting Group and ITN. Aged 54.
Paul Adams (from 5 December 2003)
Appointed a Non-Executive Director with effect from December 2003. He is the Managing Director of British American Tobacco. Aged 50.
Bruno Angelici
Joined the Group as a Non-Executive Director in August 2003. He is the Executive Vice-President, Europe, Japan, Asia Pacific and Latin America at AstraZeneca. Aged 56.
Philip Bowman Chief Executive
Joined as Group Finance Director in 1998 and was appointed Chief Executive in August 1999. He was formerly a Director of Bass following an extensive career in accountancy and venture development in Iran, Australia and the US and was Chairman of Liberty. He is also a Non-Executive Director of British Sky Broadcasting Group and Burberry Group and is a member of the UK Industrial Advisory Board of Alchemy Partners. Aged 50.
Donald Brydon Senior Independent Director
Joined the Group as a Non-Executive Director in 1997 and is Chairman of the Allied Domecq pension trusts. He is the senior independent Non-Executive Director of Allied Domecq. He is Chairman of Amersham, AXA Investment Managers and the London Metal Exchange and a Non-Executive Director of Scottish Power. Aged 58.
Sir Ross Buckland (until 30 January 2004)
Joined the Group as a Non-Executive Director in 1998. He retired as Chief Executive of Uniq (formerly Unigate) in March 2001. He is also a Director of Mayne Group and Clayton Utz. Aged 60.
Graham Hetherington Chief Financial Officer
Joined the Group in 1991 and Allied Domecq Spirits & Wine in 1995. He was appointed Finance Director of Allied Domecq Spirits & Wine in 1998. He became a Director of Allied Domecq in June 1999 and was appointed Chief Financial Officer in August 1999. Aged 44.
Peter Jacobs (until 30 January 2004)
Joined the Group as a Non-Executive Director in 1998. He retired as Chief Executive of BUPA in 1998 and as Chairman of Hillsdown Holdings in July 1999. He is also Chairman of LA Fitness and WT (Holdings) and a Non-Executive Director of Health Quality Services. Aged 60.
David Malpas (retired 20 October 2003)
Joined the Group as a Non-Executive Director in 1997. He retired as Managing Director of Tesco in 1997. He is Chairman of Dresdner Income Growth Investor Trust and a Non-Executive Director of Wincanton. Aged 63.
John Rishton (from 5 December 2003)
Appointed a Non-Executive Director with effect from December 2003. He is the Chief Financial Officer of British Airways. Aged 45.
David Scotland President, Wines
Has been a Director of Allied Domecq Spirits & Wine since 1992 and a Director of Allied Domecq since 1995. He is also a Non-Executive Director of Photo-Me International and Brixton. Aged 55.
Richard Turner President, Global Operations
Joined the Group in 1982. Appointed President, Global Operations of Allied Domecq Spirits & Wine in 1995. He was appointed a Director of Allied Domecq in June 1999. Aged 54.
Leonard Quaranto
General Counsel & Company Secretary
38
Statement of directors’ responsibilities
Company law requires the Directors to prepare financial statements for each financial year which give a true and fair view of the state of affairs of the Company and the Group and of the profit or loss for that year. In preparing those financial statements the Directors are required to:
• Select suitable accounting policies and then apply them consistently;
• Make judgements and estimates that are reasonable and prudent;
• State whether applicable accounting standards have been followed, subject to any material departures disclosed and explained in the financial statements; and
• Prepare the financial statements on a going concern basis unless it is inappropriate to presume that the Group will continue in business.
The Directors are responsible for keeping proper accounting records which disclose with reasonable accuracy at any time the financial position of the Company and the Group and to enable them to ensure that the financial statements comply with the Companies Act 1985. They have general responsibilities for taking such steps as are reasonably open to them to safeguard the assets of the Group and to prevent and detect fraud and other irregularities.
Board committees
Audit Committee
Peter Jacobs (1) (Chairman)
John Rishton (2) (3)
Paul Adams (2)
Bruno Angelici
Donald Brydon
Sir Ross Buckland (1)
Gerry Robinson
Summary terms of reference: to assist the Board in exercising its responsibilities for accounting, financial reporting and internal control and risk assessment, to keep the work of internal and external audit under review and to oversee the independence of the external auditor.
Remuneration Committee
Donald Brydon (Chairman)
Paul Adams (2)
Bruno Angelici
Sir Ross Buckland (1)
Peter Jacobs (1)
John Rishton (2)
Gerry Robinson
Summary terms of reference: to set terms of employment, including remuneration, for Executive Directors.
Nomination Committee
Gerry Robinson (Chairman)
Philip Bowman
Donald Brydon
John Rishton (2)
Summary terms of reference: to consider and recommend candidates for appointment to the Board.
Executive Committee
This Committee comprises mainly the Executive Directors.
Summary terms of reference: to formalise Group strategy, run the day-to-day operations of the Group, approve projects within capital expenditure limits delegated by the Board and lead the management development process.
Financing Committee
This Committee comprises mainly the Executive Directors.
Summary terms of reference: to exercise the powers of the Company concerning the financing of approved acquisitions and the refinancing of debt.
Key:
(1) Until 30 January 2004
(2) From 5 December 2003
(3) Chairman from 30 January 2004
39
Directors’ Report
The Directors are pleased to present their Annual Report and Accounts for the year ended 31 August 2003.
Business review and future developments
The Chairman’s Statement and the Operating and Financial Review on page 3 and pages 22 to 35 provide a review of the business and likely future developments.
Main trading activities
The Group’s main trading activities are the production, marketing and sale of Spirits & Wine and the franchising of Quick Service Restaurants.
Dividends
An interim dividend of 5.3p per share was paid on 25 July 2003 and the Directors are pleased to recommend a final ordinary dividend of 8.7p per share, making a total for the year of 14.0p. The final dividend will be paid on 4 February 2004 to shareholders on the register on 9 January 2004.
Annual General Meeting
The AGM will be held on 30 January 2004 at the Hotel Inter-Continental London, One Hamilton Place, Hyde Park Corner, London W1J 7QY. Details of the business to be considered at the AGM and the Notice of Meeting are included in the accompanying Chairman’s Letter.
Share capital
Details of the Company’s share capital and options over the Company’s shares under the Group’s employee share plans are given in note 22 of the accounts on page 75. As at 31 August 2003 the company had authority to purchase up to 10% of its Ordinary Shares. Shareholders’ approval is being sought for the renewal of this authority.
Substantial interests
The Company has been notified of the following disclosable interests in Allied Domecq Ordinary Shares:
Suntory Limited |
| 37,834,591 shares |
| (3.42 | )% |
Barclays plc |
| 33,513,581 shares |
| (3.03 | )% |
Aviva plc |
| 33,451,589 shares |
| (3.02 | )% |
(of which 33,382,252 shares are held by Morley Fund Management Limited, a subsidiary of Aviva plc)
Employees
Allied Domecq operates a policy of equal opportunity and continues to give full and fair consideration to applications for employment made by disabled persons. Employees who become disabled will, wherever possible and practicable, be retained in employment and, where necessary, appropriate training will be provided.
Employees are encouraged to become shareholders in the Company. Grants of options over a total of 11,754,945 Ordinary Shares (including options over American Depositary Shares, representing underlying Ordinary Shares) were made to eligible employees under the Company’s employee share option plans during the year.
Communications and involvement
Considerable emphasis is placed by the Group on communications with its employees. In addition to obtaining a comprehensive range of attitudes and views from employees through employee opinion surveys, Group companies involve and consult them with regard to the activities and performance of their businesses and any matters of concern to them. It is normal practice to use formal joint consultative bodies locally for one-to-one and Group meetings. Allied Domecq has a European Council which acts as a forum for Pan-European consultation and discussion.
Health, safety and welfare
The Group recognises that occupational health and safety management is among one of its highest corporate responsibilities. A significant number of Group companies have now established health and safety management systems based on OHSAS 18001 (Occupational Health and Safety Assessment Series) and have achieved, or are working towards, external certification. Further development of the Group’s audit processes has taken place over the past year and during the year we again globally benchmarked our health and safety performance and practice in order to measure our impacts and further progress our targets and key performance indicators, towards our goal of continual improvement. The Group’s full health and safety report is posted on the Company’s website at www.allieddomecq.com
Research and development
The amount spent by the Group on research and development during the period was £1m but this does not include the full cost of new product development.
Creditor payment policy
The Company’s policy, in relation to all of its suppliers, is to settle the terms of payment when agreeing the terms of the transaction, to ensure that suppliers are aware of the terms of payment and to abide by those terms provided it is satisfied that the goods or services were supplied in accordance with the agreed terms and conditions. The Company does not follow any particular code or standard on payment practice. Creditor days have not been calculated as the Company had no trade creditors at 31 August 2003. The Company’s invoices for goods and services are settled by subsidiaries acting as agents for the Company.
40
Directors
The names and brief biographical details of the Directors as at 20 October 2003 and those appointed with effect from 5 December 2003 are given on page 38. During the year Bruno Angelici was appointed as a Non-Executive Director. David Malpas retired as a Director on 20 October 2003. In accordance with the Articles of Association, Bruno Angelici, Philip Bowman, Sir Ross Buckland and Peter Jacobs retire at the forthcoming AGM. Philip Bowman offers himself for re-election and Bruno Angelici, Paul Adams and John Rishton offer themselves for election.
Political and charitable contributions
No political donations were made to EU political parties or organisations during the year. Charitable contributions in the UK totalled £126,000. In addition, the Allied Domecq Trust gave £10,000 to charitable causes and charitable contributions of over £500,000 were made outside the UK.
Auditor
KPMG Audit Plc has expressed its willingness to continue in office as Auditor of the Company and the Audit Committee has approved its re-appointment. A resolution for the re-appointment of the Auditor, at a rate of remuneration to be determined by the Directors, acting through the Audit Committee, will be proposed at the AGM.
By Order of the Board
Leonard Quaranto
General Counsel & Company Secretary
20 October 2003
41
Directors’ Reports
Introduction
The Directors of Allied Domecq PLC are committed to the high standards of corporate governance set out in the Principles of Good Governance and Code of Best Practice, which together comprise the Combined Code appended to the Listing Rules of the Financial Services Authority. The Directors are accountable to the shareholders for ensuring that these principles are understood and implemented throughout the Company’s operations and this statement describes the manner in which Allied Domecq PLC has applied the Principles and Provisions of the Code during the financial year. In July 2003, a New Combined Code was issued by the Financial Reporting Council in response to the Higgs Review on Non-Executive Directors and the Smith Review on Audit Committees. The Directors support the spirit of the New Combined Code and comply with the majority of its provisions. They are not required to report on their compliance with the New Combined Code until they report to shareholders in respect of the financial year ending 31 August 2005, however the Directors do make the following initial observations:
1. The Directors consider Gerry Robinson to be independent of management in his capacity as Non-Executive Chairman
2. The Board had already appointed Donald Brydon as its Senior Independent Director but it is not currently intended that he will accompany management at meetings with institutional shareholders unless requested by shareholders
3. In view of the relatively small size of the Board, it is currently intended to continue the practice of all Non-Executive Directors, including the Non-Executive Chairman, being members of both the Remuneration and Audit Committees with such Committees continuing to benefit from the diversity and experience the various Non-Executive Directors bring to the proceedings.
As a Company listed on the New York Stock Exchange, as well as being subject to UK legislation and practice, Allied Domecq is subject to the rules of the US Securities and Exchange Commission (SEC). We continually monitor our compliance with such rules as applicable to foreign registrants and are in compliance with the rules that are currently in force. The Company follows UK corporate governance practice which does not differ significantly from the corporate governance standards set out in section 303A of the New York Stock Exchange Listed Company Manual, except that the Nomination Committee is required to be comprised of a majority, rather than entirely, of independent Directors.
Executive and Non-Executive Directors
During the year under review, the Executive Directors were engaged on employment contracts subject to 24 months’ written notice given by either party. However, as stated in the Directors’ Remuneration Report on pages 46 and 47, the Executive Directors have subsequently entered into new employment contracts subject to 12 months’ written notice given by either party. Non-Executive Directors are appointed for three-year terms and are generally limited to six years of service. In accordance with the Company’s Articles of Association, all Directors are subject to election by shareholders at the first opportunity after their appointment, and to re-election thereafter at intervals of no more than three years. The Non-Executive Directors’ fee levels are determined by the Board of Directors, whilst the Executive Directors’ salary levels are determined by the Remuneration Committee. Directors do not participate in decisions regarding their own remuneration.
The remuneration policy and the terms and conditions of service of the Executive and Non-Executive Directors appear in the Directors’ Remuneration Report on pages 44 to 51. Allied Domecq PLC is in compliance with Schedules A and B of the Combined Code relating to remuneration.
Organisation and functions of the Board and key Board Committees
The Board is responsible for the overall direction, strategy, performance and management of Allied Domecq PLC. It is currently comprised of four Executive Directors and five independent Non-Executive Directors (including the independent Chairman). Throughout the financial year, the roles of Chairman and Chief Executive Officer have been held separately.
The Board and its Committees have formal terms of reference setting out their authorities and duties.
All Board members have access to the advice and services of the General Counsel & Company Secretary and, in accordance with agreed procedures, are also able to obtain independent professional advice as required at the Company’s expense.
On appointment, new Directors are given the opportunity to participate in an external professional programme for Directors and are offered other appropriate induction and training.
All of the Non-Executive Directors bring a wide range of experience to the Board and participate fully in decisions on key issues facing the Group. All Non-Executive Directors (including the Chairman) are considered by the Board to be independent of management and free from any business or other relationship which could materially interfere with the exercise of independent judgement.
The Board generally meets at least six times a year focusing on strategic issues and financial performance. The Board has a formal schedule of matters reserved to it for decision and decisions are communicated widely throughout the Allied Domecq Group of companies. Included within this formal schedule of matters is responsibility for the Group’s risk management strategy. All Board members are provided with sufficient information on a timely basis in order to ensure their ability to discharge their duties.
The Board of Allied Domecq Spirits & Wine Limited and the Quick Service Restaurants’ Executive generally meet monthly. These groups, together with the Executive Committee of the Board, formulate strategy and oversee day-to-day operations of the Group, approve projects within capital expenditure limits delegated by the main Board, and lead the management development process.
The Board has established a number of Board Committees, each of which has formal terms of reference. Membership of Board Committees is shown on page 39.
The Remuneration Committee is comprised of the five independent Non-Executive Directors responsible for determining the remuneration policy and the terms and conditions of service of the Executive Directors. It also reviews external appointments offered to Executive Directors. The Committee generally meets at least twice per year. Committee members are not eligible for any share options, bonuses or pension entitlements. The Committee has access to the services of independent advisers as required.
42
The Audit Committee monitors and reviews the system of financial and operational controls of the Group. It also considers the Group’s compliance with the Combined Code and oversees the objectivity, effectiveness and independence of the auditors. The Committee is comprised of the five independent Non-Executive Directors. The Committee can request the external auditors, Executive Directors and any other officers of the Group to attend its meetings. Additionally, the Group’s internal and external auditors have direct access to the Committee to raise any matters of concern. The Committee is required to meet at least twice each year and met twice during the financial year ended 31 August 2003. The Committee receives periodic reports from the internal audit function, the external auditors and management summarising audit issues noted and corrective actions planned. It also approves the provision of audit, audit-related and non-audit services to the Group by the external auditors. During the year, the Board approved new terms of reference for the Audit Committee to ensure its responsibilities were broadly consistent with current corporate governance guidance and included the responsibilities required by the Sarbanes-Oxley Act of 2002. In addition, the Committee itself approved detailed procedures to ensure compliance with the auditor independence provisions of that Act.
The Nomination Committee has responsibility for leading the process for Board appointments and making recommendations to the Board. It is comprised of a majority of independent Non-Executive Directors and meets from time to time as required.
The Turnbull guidance for directors on internal control was issued in September 1999.
The Board confirms that it has established a process that meets the Turnbull guidance. The process has been in place for the whole of the year to 31 August 2003 and, as part of this process, the Board has received and reviewed regular reports during the year on internal control and risk and has reviewed the effectiveness of the Group’s system of internal control.
Internal control
The Board of Directors has final responsibility for the system of internal control maintained by the Group. The responsibility for establishing and operating detailed control procedures within each operating business lies with the operating Board and local management. The approach to internal control is risk based, with risk management processes including an evaluation of the likelihood and impact of risks. This system provides reasonable, but not absolute, assurance against material loss and includes the safeguarding of assets, the maintenance of proper accounting records, the reliability of financial information, compliance with appropriate legislation, regulation and best practice, and the identification and mitigation of business risks. Group and local management are responsible for the identification and evaluation of key applicable business, operational, compliance and financial risks. These risks are assessed on a continual basis, taking into account the overall risk environment, and may be associated with a variety of internal or external sources including control breakdowns, disruption in information systems, competition, natural catastrophe and regulatory requirements.
Group businesses participate in periodic strategic reviews which include consideration of long-term financial projections and the evaluation of business alternatives. Operating units prepare annual budgets; performance against budget is actively monitored both at the level of the Board of Allied Domecq Spirits & Wine Limited and the Quick Service Restaurants’ Executive and the Board, supported by regular forecasts.
A process of annual control self-assessment and hierarchical reporting provides for a documented and auditable trail of accountability from the local business unit to regional management to executive management. This process includes an internal control questionnaire which is completed for all business units and reviewed by regional management. The questionnaire is tailored by region to reflect the potential risks and the control environment of the region and each region has appointed a business risk champion to challenge, validate and collate the responses into regionally owned reports. These self-assessment tools provide for successive assurances at increasingly higher levels of management and, finally, to the Board.
The process and the supporting documentation are reviewed by the internal auditors for completeness, accuracy and compliance with Combined Code requirements. Planned corrective actions, where applicable, are independently monitored for timely completion.
Through these mechanisms, risk assessment and internal control have been embedded in ongoing operations. Business performance is continually monitored, risks identified in a timely manner, their financial implications assessed, control procedures re-evaluated and corrective actions agreed and implemented.
In addition, throughout the year, the Company has operated a Disclosure Committee, as recommended by the SEC, which is responsible for considering the materiality of information to be included in its financial reports as well as determining the Group’s disclosure obligations on a timely basis. The Disclosure Committee reports to the Chief Executive and Chief Financial Officer.
Relations with shareholders
The Board believes it is important to respond adequately to all the queries of both institutional and private shareholders. At the AGM shareholders are offered an opportunity to raise with the Board and the respective Board Committee Chairmen any specific questions they have concerning the Group. In addition, meetings are also held between individual Directors and institutional shareholders at various times during the year. At the AGM the Company indicates, following a vote on each resolution, the number of proxy votes lodged and the notices covering each AGM are sent to the shareholders at least 20 working days before the meeting.
Going concern
After making enquiries, the Directors, at the time of approving the financial statements, have determined that there is reasonable expectation that the Company and the Group have adequate resources to continue operating for the foreseeable future. For this reason, the Directors have adopted the going concern basis in preparing the financial statements.
43
Compliance with Combined Code
The Company was in compliance throughout the financial year with the Code provisions set out in Section 1 of the Combined Code except that Executive Directors were engaged on employment contracts subject to 24 months’ written notice given by either party during the year. However, as stated in the Directors’ Remuneration Report on pages 46 and 47, the Executive Directors have subsequently entered into new employment contracts subject to 12 months’ written notice given by either party and the Company would be in compliance on this basis.
Our auditor, KPMG Audit Plc, has reviewed the Directors’ statement on the Company’s compliance to the extent required by the Listing Rules and its report appears on page 52.
Directors’ remuneration report
The information contained in this report has been audited by KPMG Audit Plc to the extent required by the Companies Act 1985.
The Remuneration Committee
The Remuneration Committee is a committee of independent Non-Executive Directors, the members of which are: Donald Brydon (Chairman), Bruno Angelici, Sir Ross Buckland, Peter Jacobs and Gerry Robinson. David Malpas was Chairman of the Remuneration Committee until his retirement from the Board on 20 October 2003. The Committee establishes the terms of employment and remuneration for the Executive Directors.
The Remuneration Committee has appointed Deloitte & Touche LLP as its executive remuneration advisers and Linklaters as its legal advisers. Deloitte & Touche has also provided financial and IT consulting services to the Group during the year ended 31 August 2003 and Linklaters act as one of the Group’s corporate legal advisers. The Chief Executive normally attends meetings of the Remuneration Committee and assists the Committee on matters relating to the other Executive Directors’ performance and remuneration; he does not participate in decisions regarding his own remuneration. Additionally, the Remuneration Committee is materially assisted by the Group’s Secretariat and Human Resources functions.
Remuneration policy
This report sets out the Company’s policy on Directors’ remuneration. It is currently intended that this policy will continue to apply to each Executive Director for the year ending 31 August 2004 and, subject to review, for subsequent years.
Allied Domecq operates in global and highly competitive markets. With over 90% of trading profit generated outside the UK and over half of trading profit derived in the Americas it is vital that the Company operates a remuneration policy appropriate to its global executive talent pool.
Accordingly, the Remuneration Policy is designed to provide remuneration which:
• Takes account of practice in the relevant markets
• Aligns the interests of executives with those of shareholders by placing heavy emphasis on the linkage between pay and sustained business performance
• Provides a high proportion of total reward in Allied Domecq shares delivered over a number of years.
The Group’s reward strategy is for base salaries and benefits including pensions (or cash allowances paid in lieu of benefits) to reflect the relevant market median position and for total compensation to be performance-driven to higher than market median levels as appropriate. This strategy is consistent with the Group’s belief that performance should determine a significant proportion of the total remuneration package for all employees (including Executive Directors).
The fees of the independent Non-Executive Directors (including the independent Chairman) are determined by the Board as a whole within the overall amount authorised by shareholders. Directors do not participate in decisions regarding their own remuneration. The fees paid to independent Non-Executive Directors are designed to recognise the significant responsibilities of Directors and to attract individuals with the necessary experience and ability to make an important contribution to the Group’s affairs. The fees, which are neither performance-related nor pensionable, are comparable with those paid by other FTSE 100 companies. Non-Executive Directors do not receive any share options or long term incentive awards.
Remuneration
Proportion of total remuneration
The relative importance of fixed and performance-related remuneration for the Executive Directors based on the remuneration policy set out in this report is broadly as follows:
Remuneration mix
[CHART]
1 Base salary/benefits
2 Performance-related bonus
3 Long Term Incentives
|
| Base |
| Performance- |
| Long Term |
| Total |
|
All Executive Directors |
| 25-30 | % | 35-40 | % | 30-45 | % | 100 | % |
Note:
(1) The above information is based on current base salaries and other benefits, maximum potential bonus payments and associated maximum deferral/matching of bonuses and expected value for long term incentives. It excludes pension benefits or pension allowances paid in lieu thereof and participation in all-employee share plans.
Base salary
Salaries of the Executive Directors are reviewed annually on 1 January of each year, taking into consideration the pay levels in a comparator group of approximately 20 other international FMCG companies of a size and complexity relevant to that of Allied Domecq.
44
The Company recognises that pension provision is an important component of total remuneration. David Scotland and Graham Hetherington are eligible for a pension from the Allied Domecq Pension Fund, subject to the UK Inland Revenue Earnings Cap. Executive Directors who have joined the Group since 1998 have not been invited to join the Fund. As a result of this policy, Philip Bowman is not a member of the Fund and hence accrues no pension benefits. To the extent that Executive Directors receive salary that is not pensionable, they are paid an allowance in lieu of pension benefits.
Details of the accrued pension benefits of those Executive Directors who participate in the Company’s non-contributory pension scheme are shown on page 49. Details of allowances paid in lieu of pensions are reported in the Directors’ Remuneration table shown on page 48.
Benefits
Benefits include the provision of private health, life and other insurances, car allowances, pension allowances for those Directors who do not participate in the Company sponsored pension plans or whose benefits under the Company plans are limited by the UK Inland Revenue Earnings Cap, business-related partner travel costs and certain other minor benefits. These benefits do not form part of pensionable earnings.
Performance-related bonuses
The Company operates a Deferred Bonus Plan for the Executive Directors and certain other senior executives. The Remuneration Committee sets performance targets annually based on relevant market measures and, for the year ended 31 August 2003, the bonuses were based on earnings per share growth and completion of key management and business objectives.
The bonus payable to participants in respect of the year was the equivalent of 14% of their annual base salary for every 1% of real growth in the Company’s normalised earnings per share (adjusted by the Remuneration Committee to measure underlying business performance). The maximum bonus receivable based on earnings per share growth was 80% of base salary.
An additional bonus of up to 20% of salary was available under the plan on the achievement of certain key management and business objectives.
The level of bonus achievable under the plan is commensurate with the much more demanding economic conditions in many of the relevant markets.
In order to promote share ownership and to aid retention, 25% of the bonus awarded is automatically, and up to a further 25% of the bonus awarded may be voluntarily, deferred and invested in Allied Domecq shares, which are forfeitable under certain circumstances. A matching award of an equal number of shares is awarded subject to the executive remaining in employment. For the year ended 31 August 2003, 50% of the shares are released to the executive after two years and the remaining 50% of the shares are released to the executive after three years. The matching award is not subject to the achievement of any further performance conditions because it relates to the deferred element of a bonus which has already been earned.
Long Term Incentives
The Executive Directors participate in the Group’s Executive Share Option Schemes and Long Term Incentive Scheme. When determining awards under the Schemes, the Remuneration Committee takes account of the role and responsibility of the individual and relevant market practice. In accordance with market practice, awards are currently made annually.
At the time of grant the combined awards have an expected value of up to 2 x base salary for the Chief Executive and up to 1 x base salary for all other Executive Directors. Expected value is currently calculated at 22.5% of face value for options granted under the executive share option schemes and 40% of face value for awards under the Long Term Incentive Scheme.
The performance conditions selected by the Remuneration Committee for the Executive Share Option Schemes and the Long Term Incentive Scheme are designed to be challenging, to align the interests of management with those of the shareholders and were agreed following extensive consultation with shareholder representative bodies.
Executive Share Option Schemes
The Group operates Executive Share Option Schemes for Executive Directors, other senior executives and other employees for exceptional performance. The schemes are the Inland Revenue Approved Executive Share Option Scheme 1999, the Executive Share Option Scheme 1999 (incorporating US Schedule) and the Share Appreciation Rights Plan 1999. The Executive Share Option Schemes provide for the grant of options or share appreciation rights at an exercise price of not less than market value which under normal circumstances remain exercisable between the third and tenth anniversaries of the date of grant (though shorter life options or share appreciation rights may be granted under certain of the Schemes). The Remuneration Committee sets performance conditions that must be met before the options or share appreciation rights become exercisable.
During the year ended 31 August 2003, options were granted with a face value of 275% of base salary to the Chief Executive and 175% of base salary at the date of grant to all other Executive Directors. Options granted during the year ended 31 August 2000 are exercisable if the Total Shareholder Return (share price growth plus gross dividends re-invested) performance of Allied Domecq equals or exceeds the median Total Shareholder Return achieved by the constituents of the FTSE 100 Index over any consecutive three year period between the dates of grant and exercise. This performance condition has been achieved and the options are therefore exercisable.
45
All options granted since 1 September 2000 become exercisable if Allied Domecq’s growth in normalised earnings per share exceeds the growth in the UK retail prices index (excluding mortgage interest) by 9% over three years. If the performance condition is not met over the three years following the grant of options, the condition is re-tested after four years and, if necessary, again after five years, with a consequent increase in earnings per share growth to 12% over four years or 15% over five years. If the performance condition is not met after five years, the options will lapse. When considering the achievement of the performance conditions, the Remuneration Committee has the discretion to adjust normalised earnings per share to measure the underlying business performance of the Group.
Long Term Incentive Scheme
Under the Long Term Incentive Scheme 1999 awards are made to the Executive Directors and certain other senior executives, subject to the achievement of performance conditions set by the Remuneration Committee at award.
During the year ended 31 August 2003, awards were made under the Long Term Incentive Scheme with a face value of 200% of base salary for the Chief Executive and 100% of base salary to all other Executive Directors.
These awards are subject to Allied Domecq’s Total Shareholder Return performance over a three year period relative to a comparator group of companies. No shares will be delivered unless Total Shareholder Return is at or above median of the comparator group and for performance at the median of the comparator group 40% of the shares can be earned. The full number of shares can only be earned if the Total Shareholder Return is at or above upper quartile. For performance that is between median and upper quartile the number of shares that vest is determined on a straight line basis. In addition, awards will only vest if the Remuneration Committee is satisfied that underlying financial performance is satisfactory.
The comparator groups for the various awards under the Long Term Incentive Scheme comprise the following companies from the food, drink and tobacco industries:
Years ended 31 August 2001 and 2002
Associated British Foods |
| SAB Miller |
Six Continents (1) |
| Scottish & Newcastle |
British American Tobacco |
| Tate & Lyle |
Cadbury Schweppes |
| Uniq (2) |
Diageo |
| Unilever |
Gallaher Group |
| Whitbread |
Imperial Tobacco |
|
|
Year ended 31 August 2003
In order to reflect more appropriately the competitive set of global companies with which Allied Domecq competes for business and its executive talent, the Remuneration Committee decided to expand the above comparator group to include the following additional international FMCG companies for the awards made under the Long Term Incentive Scheme in the year ended 31 August 2003:
Anheuser-Busch |
| Kellogg |
Brown-Forman |
| Pernod Ricard |
Carlsberg |
| Philip Morris |
Heineken |
| Procter and Gamble |
Nestlé |
|
|
Notes:
(1) Following the demerger of Six Continents, the methodology followed to track TSR performance has been to synthesise the effect of the transaction. On demerger, Six Continents’ shareholders received 50 Mitchells and Butlers (MAB) shares, 50 Intercontinental Hotels Group (IHG) shares and 81p in cash for every 59 Six Continents shares held. The cash payment has been applied as a special dividend reinvested equally in shares of MAB and IHG. For future awards, Six Continents is to replaced in the comparator group by Mitchells and Butlers.
(2) Uniq is only included in the comparator group for the awards made during the year ended 31 August 2001.
Based on the current performance conditions, it looks unlikely that the options awarded under the Long Term Incentive Scheme will vest and deliver the expected 40% of face value despite the very favourable total shareholder return performance of the Company relative to the FTSE 100 Index illustrated in the graph on page 47.
All-employee share plans
The Executive Directors are also eligible to participate in the other share plans that are open to all employees in certain jurisdictions. These plans are the SAYE plans, namely the SAYE Scheme 1999, the International SAYE Scheme 1999 and the United States Share Purchase Plan, and the Share Partnership Plan. The SAYE plans offer savings contracts and the right to buy shares with the projected savings proceeds at an exercise price of not less than 80% of the market value of the shares at grant. The Share Partnership Plan is an Inland Revenue approved share incentive plan; eligible employees may purchase shares on a monthly basis from gross pay and the Company matches their investment on a one for four basis. As is normal practice for share plans that are open to all employees, performance conditions do not apply to the all-employee share plans.
46
Service agreements
Executive Directors
Details of the Executive Directors’ service agreements are as follows:
|
| Agreement |
| Unexpired |
| Notice |
|
P Bowman |
| 20 October 2003 |
| Rolling 12 months |
| 12 months |
|
G Hetherington |
| 20 October 2003 |
| Rolling 12 months |
| 12 months |
|
D Scotland |
| 20 October 2003 |
| Rolling 12 months |
| 12 months |
|
R Turner |
| 20 October 2003 |
| Rolling 12 months |
| 12 months |
|
The Executive Directors previously had service agreements requiring not less than 24 months’ notice of termination to be given by either party. The Remuneration Committee reviewed this policy in October 2003 and it was agreed that the Executive Directors would enter into new service agreements requiring not less than 12 months’ notice of termination to be given by either party.
The current service agreements contain provisions for compensation to be payable to the Directors upon early termination of employment without cause (i.e. without a reason or reasons otherwise entitling the Company to terminate an Executive Director’s employment in accordance with the terms of the agreement). Such compensation broadly provides for the payment to an Executive Director whose employment is terminated without cause of a sum equal to 95% of annual base salary, contractual benefits and bonuses.
Non-Executive Directors
The independent Non-Executive Directors (including the independent Chairman) do not have service agreements with the Company. It is the policy of the Company to appoint Non-Executive Directors for an initial period of three years renewable for a further period of three years, subject to election and re-election by shareholders in general meeting. The Board has to ratify any further period of appointment after this six year period. Following completion of his second three year term, Donald Brydon has been re-appointed by the Board for a further period of one year, subject to annual re-appointment by the Board thereafter. The Chairman has a letter of appointment dated 29 January 2002 which requires not less than 12 months’ notice of termination to be given by either party.
External appointments
Allied Domecq encourages its Executive Directors to serve as Non-Executive Directors of other leading companies subject to such appointments being conducive to their personal development, the time spent being reasonable and there being no conflict of interest. The policy relating to fees is that generally the Director may retain the fees; as such positions entail personal responsibility on their part.
Performance graph
The graph below shows Allied Domecq’s Total Shareholder Return for the five years to 31 August 2003 measured against the Total Shareholder Return of the FTSE 100 Index for the same period. As Allied Domecq has been a constituent of the FTSE 100 Index for nearly the whole of this five year period, that index is considered to be the most appropriate benchmark.
Total Shareholder Return – value of hypothetical £100 holding
[CHART]
Source: Datastream
47
Directors’ remuneration report
Directors’ Remuneration and Interests
Remuneration (Audited)
|
| Salary/fees |
| Pension allowance (3) |
| Other benefits |
| Performance-related |
| Total |
| ||||||||||
|
| Year to |
| Year to |
| Year to |
| Year to |
| Year to |
| Year to |
| Year to |
| Year to |
| Year to |
| Year to |
|
|
| £’000 |
| £’000 |
| £’000 |
| £’000 |
| £’000 |
| £’000 |
| £’000 |
| £’000 |
| £’000 |
| £’000 |
|
Executive Directors: |
|
|
|
|
|
|
|
|
|
|
|
|
|
|
|
|
|
|
|
|
|
P Bowman |
| 665 |
| 610 |
| 279 |
| 256 |
| 24 |
| 23 |
| 1,035 |
| 738 |
| 2,003 |
| 1,627 |
|
G Hetherington |
| 335 |
| 298 |
| 71 |
| 61 |
| 15 |
| 22 |
| 507 |
| 366 |
| 928 |
| 747 |
|
D Scotland |
| 353 |
| 330 |
| 77 |
| 70 |
| 28 |
| 26 |
| 542 |
| 333 |
| 1,000 |
| 759 |
|
R Turner |
| 324 |
| 288 |
| — |
| — |
| 13 |
| 21 |
| 415 |
| 357 |
| 752 |
| 666 |
|
|
|
|
|
|
|
|
|
|
|
|
|
|
|
|
|
|
|
|
|
|
|
Non-Executive Directors: |
|
|
|
|
|
|
|
|
|
|
|
|
|
|
|
|
|
|
|
|
|
G Robinson |
| 200 |
| 88 |
| — |
| — |
| 11 |
| — |
| — |
| — |
| 211 |
| 88 |
|
B Angelici |
| — |
| — |
| — |
| — |
| — |
| — |
| — |
| — |
| — |
| — |
|
D Brydon (1) |
| 66 |
| 43 |
| — |
| — |
| — |
| — |
| — |
| — |
| 66 |
| 43 |
|
Sir Ross Buckland |
| 34 |
| 28 |
| — |
| — |
| — |
| — |
| — |
| — |
| 34 |
| 28 |
|
P Jacobs |
| 39 |
| 33 |
| — |
| — |
| — |
| — |
| — |
| — |
| 39 |
| 33 |
|
D Malpas |
| 39 |
| 33 |
| — |
| — |
| — |
| — |
| — |
| — |
| 39 |
| 33 |
|
|
|
|
|
|
|
|
|
|
|
|
|
|
|
|
|
|
|
|
|
|
|
Payments to former directors (2) |
|
|
|
|
|
|
|
|
|
|
|
|
|
|
|
|
| — |
| 2,326 |
|
Total |
| 2,055 |
| 1,751 |
| 427 |
| 387 |
| 91 |
| 92 |
| 2,499 |
| 1,794 |
| 5,072 |
| 6,350 |
|
Notes:
(1) Donald Brydon’s fee as Senior Independent Non-Executive Director includes his roles as Chairman of the Remuneration Committee and Chairman of the Allied Domecq pensions trusts.
(2) Payments to former Directors in 2002 include £1,991,000 in respect of compensation for loss of office reported in 2002.
(3) Philip Bowman is not a member of any Allied Domecq pension scheme. Both Graham Hetherington and David Scotland are members of the Allied Domecq Executives Pension Fund but their pension benefits only relate to that part of their salary up to the Inland Revenue Earnings Cap (currently £99,000 per annum).
(4) The performance-related bonus figures shown above include the deferred and matching elements of the bonus that are received in shares. The deferred bonus shares are forfeitable in certain circumstances and 50% of the deferred bonus shares are released to the executive after two years and the remaining 50% of the deferred bonus shares are released to the executive after three years. It should be noted that the matching shares are conditional, except under exceptional circumstances, on continued employment with the Group and therefore a significant amount of the performance-related bonus reported in the table above is not received by the Director until the end of the deferral period that operates under the Deferred Bonus Plan. A breakdown of the total bonuses reported is as follows:
|
| Cash bonus |
| Amount of deferred |
| Current value of |
| Total |
|
|
| £’000 |
| £’000 |
| £’000 |
| £’000 |
|
P Bowman |
| 345 |
| 345 |
| 345 |
| 1,035 |
|
G Hetherington |
| 169 |
| 169 |
| 169 |
| 507 |
|
D Scotland |
| 180.5 |
| 180.5 |
| 180.5 |
| 542 |
|
R Turner |
| 249 |
| 83 |
| 83 |
| 415 |
|
48
Pension entitlements (Audited)
|
| Accrued |
| Accrued |
| Additional |
| Transfer |
| Transfer |
| Change in |
| Additional |
| Transfer |
|
|
| £’000 pa |
| £’000 pa |
| £’000 pa |
| £’000 |
| £’000 |
| £’000 |
| £’000 pa |
| £’000 |
|
G Hetherington |
| 37 |
| 33 |
| 4 |
| 380 |
| 325 |
| 55 |
| 3 |
| 35 |
|
D Scotland |
| 36 |
| 32 |
| 4 |
| 600 |
| 507 |
| 93 |
| 3 |
| 56 |
|
R Turner |
| 217 |
| 196 |
| 22 |
| 3,419 |
| 2,923 |
| 496 |
| 18 |
| 287 |
|
Notes:
(1) The pension entitlement shown above is that which would be paid annually on retirement based on service to the end of the year.
(2) The transfer value has been calculated on the basis of actuarial advice in accordance with Actuarial Guidance Note GN11. No contractual contributions were due to have been paid by Directors during the period.
(3) Members of the Allied Domecq Executives Pension Fund have the option to pay additional voluntary contributions to secure additional pension benefits. Neither the contributions nor the resulting benefits are included in the above table.
(4) Details of the Company’s policy on Directors’ pensions are included on page 45 of this report.
Directors’ interests
The Company’s Register of Directors’ Interests contains full details of the Directors’ shareholdings and options to acquire shares in the Company.
Shareholdings
The beneficial interests of Directors in the Ordinary Share capital of the Company at 31 August 2003 were as follows:
|
| At 31 August 2003 |
| At 1 September 2002 |
|
B Angelici |
| — |
| — |
|
P Bowman |
| 308,833 |
| 217,735 |
|
D Brydon |
| 11,500 |
| 11,500 |
|
Sir Ross Buckland |
| 1,000 |
| 1,000 |
|
G Hetherington |
| 107,253 |
| 72,068 |
|
P Jacobs |
| 6,300 |
| 6,300 |
|
D Malpas |
| 9,921 |
| 9,921 |
|
G Robinson |
| — |
| — |
|
D Scotland |
| 77,766 |
| 46,352 |
|
R Turner |
| 106,875 |
| 75,567 |
|
Total |
| 629,448 |
| 440,443 |
|
Notes:
(1) At 31 August 2003 the Allied Domecq employee trusts held 32,549,067 (2002: 24,514,993) unallocated Ordinary Shares* in the Company on discretionary terms for the benefit of certain Group employees. The Executive Directors were treated as interested in these shares in their capacity as potential beneficiaries. As at 20 October 2003 these holdings had reduced to 32,317,937 Ordinary Shares*.
(2) The above table includes interests in deferred bonus shares awarded under the Company’s Deferred Bonus Plan and partnership shares purchased pursuant to the Company’s Share Partnership Plan and associated matching shares. The Directors beneficially own such shares, however certain of these shares are forfeitable in specific circumstances. The table excludes interests in matching shares under the Company’s Deferred Bonus Plan and interests in the Company’s Share Option and Long Term Incentive Schemes disclosed on pages 50 and 51.
(3) Philip Bowman purchased a further 82 shares and Richard Turner purchased a further 259 shares between 1 September 2003 and 20 October 2003. No Director had a non-beneficial interest in shares or stocks of the Company at any time either during the year ended 31 August 2003 or between 1 September 2003 and 20 October 2003.
(* includes American Depositary Shares representing underlying Ordinary Shares)
49
Deferred Bonus Plan awards (Audited)
As at 31 August 2003 the Executive Directors were interested in the following shares pursuant to matching share awards made under the Company’s Deferred Bonus Plan:
|
| At 1 September 2002 |
| Awarded during Year |
| Released during year |
| Lapsed during year |
| At 31 August 2003 |
| Release Date |
|
P Bowman |
| 24,276 |
| — |
| 24,276 |
| — |
| — |
| 29.08.03 |
|
|
| 67,873 |
| — |
| — |
| — |
| 67,873 |
| 31.08.04 |
|
|
| — |
| 62,579 |
| — |
| — |
| 62,579 |
| 31.08.05 |
|
Total |
| 92,149 |
| 62,579 |
| 24,276 |
| — |
| 130,452 |
|
|
|
G Hetherington |
| 23,343 |
| — |
| 23,343 |
| — |
| — |
| 29.08.03 |
|
|
| 32,239 |
| — |
| — |
| — |
| 32,239 |
| 31.08.04 |
|
|
| — |
| 31,035 |
| — |
| — |
| 31,035 |
| 31.08.05 |
|
Total |
| 55,582 |
| 31,035 |
| 23,343 |
| — |
| 63,274 |
|
|
|
D Scotland |
| 14,472 |
| — |
| 14,472 |
| — |
| — |
| 29.08.03 |
|
|
| 18,267 |
| — |
| — |
| — |
| 18,267 |
| 31.08.04 |
|
|
| — |
| 16,942 |
| — |
| — |
| 16,942 |
| 31.08.05 |
|
Total |
| 32,739 |
| 16,942 |
| 14,472 |
| — |
| 35,209 |
|
|
|
R Turner |
| 24,276 |
| — |
| 24,276 |
| — |
| — |
| 29.08.03 |
|
|
| 15,837 |
| — |
| — |
| — |
| 15,837 |
| 31.08.04 |
|
|
| — |
| 15,619 |
| — |
| — |
| 15,619 |
| 31.08.05 |
|
Total |
| 40,113 |
| 15,619 |
| 24,276 |
| — |
| 31,456 |
|
|
|
Note:
(1) Full details covering the operation of the Company’s Deferred Bonus Plan are included on page 45 of this report.
Cash award (Audited)
In November 2002, the Remuneration Committee made awards of deferred cash bonuses to certain senior executives including the four Executive Directors. These awards were made to take the place of grants of options under the Long Term Incentive Scheme which would have been made but in the event could not properly be made because of consolidation activity in the industry. In making these awards the Remuneration Committee took account of the value created for shareholders. The structure of the award has been designed to retain those executives who are eligible to receive the awards. The award was equal to 100% of base salary as at 1 January 2003. The payment of the award is subject to the executive remaining in employment on the payment dates. Half of the award was paid on 1 September 2003 and the other half will be paid on 1 September 2004.
|
| Awarded during year & held at 31 August 2003 |
| Expiry date |
|
P Bowman |
| Cash award equal to 100% of 1 January 2003 salary |
| 01.09.04 |
|
G Hetherington |
| Cash award equal to 100% of 1 January 2003 salary |
| 01.09.04 |
|
D Scotland |
| Cash award equal to 100% of 1 January 2003 salary |
| 01.09.04 |
|
R Turner |
| Cash award equal to 100% of 1 January 2003 salary |
| 01.09.04 |
|
50
Share Options and Long Term Incentive awards (Audited)
The following movements in Share Option and Long Term Incentive Scheme awards occurred during the year:
|
|
| Number of |
| Options |
| Options |
| Options |
| Number of |
| Exercise |
| Market price |
| Gain |
| Date of |
| Date |
| Expiry |
| Exercisable/ |
|
P Bowman | (a) |
| 3,697 |
| — |
| 3,697 |
| — |
| — |
| 262 | p | 414 | p | 5,619 |
| 03.12.99 |
| — |
| — |
| n/a |
|
| (b) |
| 608,187 |
| — |
| — |
| — |
| 608,187 |
| 342 | p | — |
| — |
| 01.11.99 |
| 01.11.02 |
| 31.10.09 |
| * |
|
| (c) |
| 441,176 |
| — |
| — |
| — |
| 441,176 |
| 0.1 | p | — |
| — |
| 08.05.01 |
| 08.05.04 |
| 07.05.11 |
| ** |
|
| (c) |
| 512,091 |
| — |
| — |
| — |
| 512,091 |
| 0.1 | p | — |
| — |
| 02.11.01 |
| 02.11.04 |
| 01.11.11 |
| ** |
|
| (d) |
| — |
| 7,853 |
| — |
| — |
| 7,853 |
| 382 | p | — |
| — |
| 01.11.02 |
| 01.11.05 |
| 31.10.12 |
| ** |
|
| (b) |
| — |
| 434,882 |
| — |
| — |
| 434,882 |
| 382 | p | — |
| — |
| 01.11.02 |
| 01.11.05 |
| 31.10.12 |
| ** |
|
| (c) |
| — |
| 321,989 |
| — |
| — |
| 321,989 |
| 0.1 | p | — |
| — |
| 01.11.02 |
| 01.11.05 |
| 31.10.12 |
| ** |
|
Total |
|
| 1,565,151 |
| 764,724 |
| 3,697 |
| — |
| 2,326,178 |
|
|
|
|
| 5,619 |
|
|
|
|
|
|
|
|
|
G Hetherington | (a) |
| 6,440 |
| — |
| — |
| — |
| 6,440 |
| 262 | p | — |
| — |
| 03.12.99 |
| 01.01.05 |
| 30.06.05 |
| ** |
|
| (b) |
| 263,157 |
| — |
| — |
| — |
| 263,157 |
| 342 | p | — |
| — |
| 01.11.99 |
| 01.11.02 |
| 31.10.09 |
| * |
|
| (c) |
| 104,779 |
| — |
| — |
| — |
| 104,779 |
| 0.1 | p | — |
| — |
| 08.05.01 |
| 08.05.04 |
| 07.05.11 |
| ** |
|
| (c) |
| 121,621 |
| — |
| — |
| — |
| 121,621 |
| 0.1 | p | — |
| — |
| 02.11.01 |
| 02.11.04 |
| 01.11.11 |
| ** |
|
| (d) |
| — |
| 7,853 |
| — |
| — |
| 7,853 |
| 382 | p | — |
| — |
| 01.11.02 |
| 01.11.05 |
| 31.10.12 |
| ** |
|
| (b) |
| — |
| 131,872 |
| — |
| — |
| 131,872 |
| 382 | p | — |
| — |
| 01.11.02 |
| 01.11.05 |
| 31.10.12 |
| ** |
|
| (c) |
| — |
| 79,842 |
| — |
| — |
| 79,842 |
| 0.1 | p | — |
| — |
| 01.11.02 |
| 01.11.05 |
| 31.10.12 |
| ** |
|
Total |
|
| 495,997 |
| 219,567 |
| — |
| — |
| 715,564 |
|
|
| — |
|
|
|
|
|
|
|
|
|
|
|
D Scotland | (b) |
| 350,877 |
| — |
| — |
| — |
| 350,877 |
| 342 | p | — |
| — |
| 01.11.99 |
| 01.11.02 |
| 31.10.09 |
| * |
|
| (c) |
| 119,485 |
| — |
| — |
| — |
| 119,485 |
| 0.1 | p | — |
| — |
| 08.05.01 |
| 08.05.04 |
| 07.05.11 |
| ** |
|
| (c) |
| 138,691 |
| — |
| — |
| — |
| 138,691 |
| 0.1 | p | — |
| — |
| 02.11.01 |
| 02.11.04 |
| 01.11.11 |
| ** |
|
| (d) |
| — |
| 7,853 |
| — |
| — |
| 7,853 |
| 382 | p | — |
| — |
| 01.11.02 |
| 01.11.05 |
| 31.10.12 |
| ** |
|
| (b) |
| — |
| 144,699 |
| — |
| — |
| 144,699 |
| 382 | p | — |
| — |
| 01.11.02 |
| 01.11.05 |
| 31.10.12 |
| ** |
|
| (c) |
| — |
| 87,172 |
| — |
| — |
| 87,172 |
| 0.1 | p | — |
| — |
| 01.11.02 |
| 01.11.05 |
| 31.10.12 |
| ** |
|
Total |
|
| 609,053 |
| 239,724 |
| — |
| — |
| 848,777 |
|
|
| — |
|
|
|
|
|
|
|
|
|
|
|
R Turner | (a) |
| 3,697 |
| — |
| 3,697 |
| — |
| — |
| 262 | p | 388p |
| 4,658 |
| 03.12.99 |
| — |
| — |
| n/a |
|
| (b) |
| 304,093 |
| — |
| — |
| — |
| 304,093 |
| 342 | p | — |
| — |
| 01.11.99 |
| 01.11.02 |
| 31.10.09 |
| * |
|
| (c) |
| 102,941 |
| — |
| — |
| — |
| 102,941 |
| 0.1 | p | — |
| — |
| 08.05.01 |
| 08.05.04 |
| 07.05.11 |
| ** |
|
| (c) |
| 119,487 |
| — |
| — |
| — |
| 119,487 |
| 0.1 | p | — |
| — |
| 02.11.01 |
| 02.11.04 |
| 01.11.11 |
| ** |
|
| (d) |
| — |
| 7,853 |
| — |
| — |
| 7,853 |
| 382 | p | — |
| — |
| 01.11.02 |
| 01.11.05 |
| 31.10.12 |
| ** |
|
| (b) |
| — |
| 132,788 |
| — |
| — |
| 132,788 |
| 382 | p | — |
| — |
| 01.11.02 |
| 01.11.05 |
| 31.10.12 |
| ** |
|
| (c) |
| — |
| 80,366 |
| — |
| — |
| 80,366 |
| 0.1 | p | — |
| — |
| 01.11.02 |
| 01.11.05 |
| 31.10.12 |
| ** |
|
Total |
|
| 530,218 |
| 221,007 |
| 3,697 |
| — |
| 747,528 |
|
|
|
|
| 4,658 |
|
|
|
|
|
|
|
|
|
(a) SAYE Scheme 1999 (b) Executive Share Option Scheme 1999 (c) Long Term Incentive Scheme 1999 (d) Inland Revenue Approved Executive Share Option Scheme 1999.
Notes:
* Exercisable
** Not exercisable
(1) The aggregate value of gain made on the exercise of share options by all Directors during the year was £10,277.
(2) The middle market price of the Ordinary Shares at 31 August 2003 was 380.25p and the range during the year to 31 August 2003 was 261.25p to 418.75p.
(3) Details of the performance conditions related to the Executive Share Option Schemes and the Long Term Incentive Scheme are included on pages 45 and 46 of this report.
By Order of the Board
Leonard Quaranto
General Counsel & Company Secretary
20 October 2003
51
Independent auditor’s report to the members of Allied Domecq PLC
We have audited the accounts on pages 53 to 79. We have also audited the information in the Directors’ Remuneration Report that is described as having been audited.
This report is made solely to the Company’s members, as a body, in accordance with section 234 of the Companies Act 1985. Our audit work has been undertaken so that we might state to the Company’s members those matters we are required to state to them in an auditor’s report and for no other purpose. To the fullest extent permitted by law, we do not accept or assume responsibility to anyone other than the Company and the Company’s members as a body, for our audit work, or for the opinions we have formed.
Respective responsibilities of directors and auditors
The Directors are responsible for preparing the Annual Report and the Directors’ Remuneration Report. As described on page 39 this includes responsibility for preparing the accounts in accordance with applicable United Kingdom law and accounting standards. Our responsibilities, as independent auditors, are established in the United Kingdom by statute, the Auditing Practices Board, the Listing Rules of the Financial Services Authority, and by our profession’s ethical guidance.
We report to you our opinion as to whether the accounts give a true and fair view and whether the accounts and the part of the Directors’ Remuneration Report to be audited have been properly prepared in accordance with the Companies Act 1985. We also report to you if, in our opinion, the Directors’ Remuneration Report is not consistent with the accounts, if the Company has not kept proper accounting records, if we have not received all the information and explanations we require for our audit, or if information specified by law regarding directors’ remuneration and transactions with the Group is not disclosed.
We review whether the statement on pages 42 and 43 reflects the Company’s compliance with the seven provisions of the Combined Code specified for our review by the Listing Rules, and we report if it does not. We are not required to consider whether the Board’s statements on internal control cover all risks and controls, or form an opinion on the effectiveness of the Group’s corporate governance procedures or its risk and control procedures.
We read the other information contained in the Annual Report, including the corporate governance statement and the unaudited part of the Directors’ Remuneration Report, and consider whether it is consistent with the audited accounts. We consider the implications for our report if we become aware of any apparent misstatements or material inconsistencies with the financial statements.
Basis of audit opinion
We conducted our audit in accordance with Auditing Standards issued by the Auditing Practices Board. An audit includes examination, on a test basis, of evidence relevant to the amounts and disclosures in the accounts and the part of the Directors’ Remuneration Report to be audited. It also includes an assessment of the significant estimates and judgements made by the Directors in the preparation of the accounts, and of whether the accounting policies are appropriate to the Group’s circumstances, consistently applied and adequately disclosed.
We planned and performed our audit so as to obtain all the information and explanations which we considered necessary in order to provide us with sufficient evidence to give reasonable assurance that the accounts and the part of the Directors’ Remuneration Report to be audited are free from material misstatement, whether caused by fraud or other irregularity or error. In forming our opinion we also evaluated the overall adequacy of the presentation of information in the accounts and the part of the Directors’ Remuneration Report to be audited.
Opinion
In our opinion the accounts give a true and fair view of the state of affairs of the Company and the Group as at 31 August 2003 and of the profit of the Group for the year then ended and the accounts and the part of the Directors’ Remuneration Report to be audited have been properly prepared in accordance with the Companies Act 1985.
KPMG Audit Plc
Chartered Accountants
Registered Auditor
London
20 October 2003
52
Accounting policies
Year to 31 August 2003
Basis of accounting
The accounts are prepared under the historical cost convention and comply with accounting policies generally accepted in the United Kingdom (‘UK GAAP’). The accounts have complied with the disclosure requirements of Financial Reporting Standard (FRS) 17 Retirement Benefits in line with the transitional timetable laid down by the standard. The Group intends to adopt FRS 17 in full from 1 September 2003.
Pages 82 to 84 describes the significant differences between UK GAAP and US generally accepted accounting principles (‘US GAAP’) and presents a reconciliation of net income and shareholders’ equity from UK GAAP to US GAAP as a result of such differences.
Basis of consolidation
Allied Domecq PLC (the ‘Group’ or ‘Company’) accounts consolidate the accounts of the Company and its interests in subsidiary undertakings. Interests in associated undertakings are included using the equity method of accounting. The results of businesses acquired or disposed of during the year are consolidated for the period from, or up to, the date control passes.
Acquisitions
On the acquisition of a business, or an interest in an associate, fair values, reflecting conditions at the date of the acquisition, are attributed to the net assets acquired. Adjustments are also made to bring accounting policies in line with those of the Group.
Intangible fixed assets
Goodwill arising on acquisitions of a business since 1 September 1998 is capitalised and amortised by equal instalments over its anticipated useful life, but not exceeding 20 years. Goodwill arising on acquisitions prior to 1 September 1998 was charged directly to reserves. On disposal of a business, any attributable goodwill previously eliminated against reserves is included in the calculation of any gain or loss. Other purchased intangible assets are capitalised and amortised over their useful economic lives on a straight line basis. Where intangible assets, such as brands, are regarded as having indefinite useful economic lives, they are not amortised but are subject to annual impairment reviews.
Tangible fixed assets
Tangible fixed assets are capitalised at cost. Depreciation is provided to write off the cost less the estimated residual value of assets by equal instalments over their estimated useful economic lives as follows: Land and buildings – the shorter of 50 years or the length of the lease; distilling and maturing equipment – 20 years; storage tanks – 20 to 50 years; other plant and equipment and fixtures and fittings – 5 to 12 years; and computer software – 4 years. Vineyard developments are not depreciated in the first 3 years unless they become productive within that time. No depreciation is provided on freehold land.
Fixed asset investments
Fixed asset investments are stated at cost, less provision for any permanent diminution in value.
Turnover
Turnover represents sales to external customers (including excise duties but excluding sales taxes) and franchise income.
Stocks
Stocks are valued at the lower of cost and net realisable value. Cost comprises purchase price or direct production cost, together with duties and manufacturing overheads. The cost of spirits and wine stocks is determined by the weighted average cost method. Stocks are included in current assets, although a portion of such stocks may be held for periods longer than one year.
Deferred tax
Full provision is made for deferred tax assets and liabilities arising from timing differences. Deferred tax assets are recognised to the extent that they are regarded as recoverable.
Financial instruments
The Group uses financial derivative instruments to manage exposures to movements in interest and exchange rates. Transactions involving financial instruments are accounted for as follows:
(i) Gains or losses arising on forward exchange contracts are taken to the profit and loss account in the same period as the underlying transaction. Premiums paid or received on foreign currency options are taken to the profit and loss account when the option expires or matures.
(ii) Net interest arising on interest rate agreements is taken to the profit and loss account over the life of the agreement.
(iii) Gains and losses on foreign currency debt and foreign exchange contracts held for the purposes of hedging balance sheet translation exposures are taken to reserves.
Foreign currencies
Monetary assets and liabilities arising from transactions in foreign currencies are translated at the rate of exchange prevailing at the date of transaction. Subsequent movements in exchange rates are included in the Group profit and loss account. The results of undertakings outside the UK are translated at weighted average exchange rates each month. The closing balance sheets of undertakings outside the UK are translated at year end rates. Exchange rate differences arising from the translation of foreign currency denominated balance sheets to closing rates are dealt with through reserves.
Pension and post employment benefits
Pension and post retirement medical benefit costs are charged to the profit and loss account on a systematic basis over the service life of employees, with the advice of actuaries, using the projected unit credit method.
53
Year to 31 August 2003
|
|
|
| Year to 31 August 2003 |
| Year to 31 August 2002 |
| |||||||||
|
|
|
| Before |
| Goodwill |
| Total |
| Before |
| Goodwill |
| Total |
| |
|
| Note |
| £m |
| £m |
| £m |
| £m |
| £m |
| £m |
| |
Turnover |
| 1 |
| 3,410 |
| — |
| 3,410 |
| 3,334 |
| — |
| 3,334 |
| |
Operating costs | – goodwill amortisation |
| 6 |
| — |
| (40 | ) | (40 | ) | — |
| (38 | ) | (38 | ) |
| – Mexican excise rebate |
| 6 |
| — |
| 38 |
| 38 |
| — |
| 213 |
| 213 |
|
| – other |
| 6 |
| (2,813 | ) | (10 | ) | (2,823 | ) | (2,739 | ) | (84 | ) | (2,823 | ) |
Operating profit from continuing operations |
|
|
| 597 |
| (12 | ) | 585 |
| 595 |
| 91 |
| 686 |
| |
Share of profits of associated undertakings |
| 15 |
| 24 |
| — |
| 24 |
| 15 |
| — |
| 15 |
| |
Trading profit on ordinary activities before finance charges |
| 1 |
| 621 |
| (12 | ) | 609 |
| 610 |
| 91 |
| 701 |
| |
Finance charges |
| 8 |
| (126 | ) | — |
| (126 | ) | (130 | ) | — |
| (130 | ) | |
Profit on ordinary activities before taxation |
|
|
| 495 |
| (12 | ) | 483 |
| 480 |
| 91 |
| 571 |
| |
Taxation |
| 9 |
| (119 | ) | (8 | ) | (127 | ) | (120 | ) | (46 | ) | (166 | ) | |
Profit on ordinary activities after taxation |
|
|
| 376 |
| (20 | ) | 356 |
| 360 |
| 45 |
| 405 |
| |
Minority interests – equity and non-equity |
| 24 |
| (16 | ) | — |
| (16 | ) | (13 | ) | — |
| (13 | ) | |
Profit earned for Ordinary Shareholders for the year |
| 23 |
| 360 |
| (20 | ) | 340 |
| 347 |
| 45 |
| 392 |
| |
Ordinary dividends |
| 11 |
|
|
|
|
| (150 | ) |
|
|
|
| (141 | ) | |
Retained profit |
|
|
|
|
|
|
| 190 |
|
|
|
|
| 251 |
| |
Earnings per Ordinary Share: |
|
|
|
|
|
|
|
|
|
|
|
|
|
|
| |
– basic |
| 10 |
|
|
|
|
| 31.6 | p |
|
|
|
| 36.8 | p | |
– diluted |
| 10 |
|
|
|
|
| 31.6 | p |
|
|
|
| 36.7 | p | |
– normalised |
| 10 |
| 33.5 | p |
|
|
|
| 32.6 | p |
|
|
|
| |
54
Group balance sheet
At 31 August 2003
|
|
|
| 31 August |
| 31 August |
| |
|
| Note |
| £m |
| £m |
| |
Fixed assets |
|
|
|
|
|
|
| |
Intangible assets |
| 12 |
| 1,273 |
| 1,316 |
| |
Tangible assets |
| 13 |
| 966 |
| 877 |
| |
Investments and loans |
| 14 |
| 160 |
| 126 |
| |
Investments in associates |
| 15 |
| 85 |
| 71 |
| |
Total fixed assets |
|
|
| 2,484 |
| 2,390 |
| |
Current assets |
|
|
|
|
|
|
| |
Stocks |
| 16 |
| 1,407 |
| 1,302 |
| |
Debtors due within one year |
| 17 |
| 679 |
| 736 |
| |
Debtors due after more than one year |
| 17 |
| 326 |
| 332 |
| |
Cash at bank and in hand |
|
|
| 175 |
| 169 |
| |
Total current assets |
|
|
| 2,587 |
| 2,539 |
| |
Creditors (due within one year) |
|
|
|
|
|
|
| |
Short-term borrowings |
| 20 |
| (772 | ) | (971 | ) | |
Other creditors |
| 18 |
| (1,161 | ) | (1,022 | ) | |
Total current liabilities |
|
|
| (1,933 | ) | (1,993 | ) | |
Net current assets |
|
|
| 654 |
| 546 |
| |
Total assets less current liabilities |
|
|
| 3,138 |
| 2,936 |
| |
Creditors (due after more than one year) |
|
|
|
|
|
|
| |
Loan capital |
| 20 |
| (1,815 | ) | (1,776 | ) | |
Other creditors |
| 18 |
| (46 | ) | (90 | ) | |
Total creditors due after more than one year |
|
|
| (1,861 | ) | (1,866 | ) | |
Provisions for liabilities and charges |
| 19 |
| (283 | ) | (284 | ) | |
Net assets |
|
|
| 994 |
| 786 |
| |
Capital and reserves |
|
|
|
|
|
|
| |
Called up share capital |
| 22 |
| 277 |
| 277 |
| |
Share premium account |
| 23 |
| 165 |
| 165 |
| |
Merger reserve |
| 23 |
| (823 | ) | (823 | ) | |
Profit and loss account |
| 23 |
| 1,299 |
| 1,087 |
| |
Shareholders’ funds | – equity |
|
|
| 918 |
| 706 |
|
Minority interests | – equity and non-equity |
| 24 |
| 76 |
| 80 |
|
|
|
|
| 994 |
| 786 |
| |
Approved by the Board on 20 October 2003 and signed on its behalf by:
/s/ Gerry Robinson |
| /s/ Graham Hetherington |
|
Gerry Robinson, | Graham Hetherington, | ||
Chairman | Director | ||
55
Year to 31 August 2003
|
|
|
| Year to |
| Year to |
|
|
| Note |
| £m |
| £m |
|
Reconciliation of operating profit to net cash inflow from operating activities |
|
|
|
|
|
|
|
Operating profit |
|
|
| 585 |
| 686 |
|
Goodwill amortisation |
|
|
| 40 |
| 38 |
|
Exceptional operating costs |
|
|
| 4 |
| 64 |
|
Depreciation |
|
|
| 75 |
| 75 |
|
Increase in stocks |
|
|
| (72 | ) | (94 | ) |
Decrease/(increase) in debtors |
|
|
| 58 |
| (22 | ) |
Increase in creditors |
|
|
| 65 |
| 71 |
|
Expenditure against provisions for reorganisation and restructuring costs |
|
|
| (29 | ) | (36 | ) |
Other items |
|
|
| 22 |
| (22 | ) |
Net cash inflow from operating activities |
|
|
| 748 |
| 760 |
|
|
|
|
|
|
|
|
|
Group cash flow statement |
|
|
|
|
|
|
|
Net cash inflow from operating activities |
|
|
| 748 |
| 760 |
|
Dividends received from associated undertakings |
|
|
| 13 |
| 11 |
|
Returns on investments and servicing of finance |
| 25 |
| (148 | ) | (133 | ) |
Taxation paid |
| 25 |
| (65 | ) | (178 | ) |
Capital expenditure and financial investment |
| 25 |
| (156 | ) | (712 | ) |
Acquisitions and disposals |
| 25 |
| — |
| (586 | ) |
Equity dividends paid |
|
|
| (144 | ) | (133 | ) |
Cash inflow/(outflow) before use of liquid resources and financing |
|
|
| 248 |
| (971 | ) |
Management of liquid resources |
|
|
| 50 |
| (21 | ) |
Financing |
| 25 |
| (164 | ) | 798 |
|
Increase/(decrease) in cash in the year |
|
|
| 134 |
| (194 | ) |
|
|
|
|
|
|
|
|
Reconciliation of net cash flow to movement in net debt |
|
|
|
|
|
|
|
Increase/(decrease) in cash in the year |
|
|
| 134 |
| (194 | ) |
(Decrease)/increase in liquid resources |
|
|
| (50 | ) | 21 |
|
Decrease/(increase) in loan capital |
|
|
| 164 |
| (649 | ) |
Movement in net debt resulting from cash flows |
|
|
| 248 |
| (822 | ) |
Exchange adjustments |
|
|
| (82 | ) | 98 |
|
Movement in net debt during the year |
|
|
| 166 |
| (724 | ) |
Opening net debt |
|
|
| (2,578 | ) | (1,854 | ) |
Closing net debt |
| 27 |
| (2,412 | ) | (2,578 | ) |
56
Group statement of total recognised gains and losses
Year to 31 August 2003
|
| Year to |
| Year to |
|
|
| £m |
| £m |
|
Profit earned for Ordinary Shareholders for the year |
| 340 |
| 392 |
|
Currency translation differences on foreign currency net investments |
| 3 |
| (23 | ) |
Taxation on translation differences |
| 19 |
| (12 | ) |
Total recognised gains and losses for the year |
| 362 |
| 357 |
|
Group note of historical cost profits and losses
Year to 31 August 2003
There is no difference between the profit earned for ordinary shareholders as disclosed in the profit and loss account and the profit stated on an historical cost basis.
Group reconciliation of movements in Shareholders’ funds
Year to 31 August 2003
|
| Year to |
| Year to |
|
|
| £m |
| £m |
|
Shareholders’ funds at the beginning of the year |
| 706 |
| 341 |
|
Total recognised gains and losses for the year |
| 362 |
| 357 |
|
Ordinary dividends |
| (150 | ) | (141 | ) |
Ordinary Share capital issued (net of costs) |
| — |
| 149 |
|
Net movement in Shareholders’ funds |
| 212 |
| 365 |
|
Shareholders’ funds at the end of the year |
| 918 |
| 706 |
|
57
At 31 August 2003
|
|
|
| 31 August |
| 31 August |
|
|
| Note |
| £m |
| £m |
|
Fixed asset investments |
| 14 |
| 4,215 |
| 4,179 |
|
|
|
|
|
|
|
|
|
Current assets |
|
|
|
|
|
|
|
Debtors |
| 17 |
| 12 |
| 14 |
|
Creditors (due within one year) |
|
|
|
|
|
|
|
Other creditors |
| 18 |
| (180 | ) | 88 |
|
Net current liabilities |
|
|
| (168 | ) | (74 | ) |
Net assets |
|
|
| 4,047 |
| 4,105 |
|
Capital and reserves |
|
|
|
|
|
|
|
Called up share capital |
| 22 |
| 277 |
| 277 |
|
Share premium account |
| 23 |
| 165 |
| 165 |
|
Merger reserve |
| 23 |
| 2,420 |
| 2,420 |
|
Capital reserve |
| 23 |
| 651 |
| 651 |
|
Profit and loss account |
| 23 |
| 534 |
| 592 |
|
Shareholders’ funds – equity |
|
|
| 4,047 |
| 4,105 |
|
Approved by the Board on 20 October 2003 and signed on its behalf by:
/s/ Gerry Robinson |
| /s/ Graham Hetherington |
|
Gerry Robinson, | Graham Hetherington, | ||
Chairman | Director | ||
Profits of the Parent Company
Under s230 (4) of the Companies Act 1985, a separate profit and loss account for the Parent Company is not presented.
Profits for the year arising in the Parent Company are disclosed in note 23.
58
Notes to the accounts
1. Activity analysis
|
| Spirits & |
| QSR |
| Britannia |
| Total |
|
|
| £m |
| £m |
| £m |
| £m |
|
Year to 31 August 2003 |
|
|
|
|
|
|
|
|
|
Turnover |
| 3,151 |
| 259 |
| — |
| 3,410 |
|
Trading profit before exceptional items and goodwill |
| 522 |
| 79 |
| 20 |
| 621 |
|
Goodwill amortisation |
| (40 | ) | — |
| — |
| (40 | ) |
Exceptional items |
| 37 |
| (9 | ) | — |
| 28 |
|
Profit before finance charges |
| 519 |
| 70 |
| 20 |
| 609 |
|
Finance charges |
|
|
|
|
|
|
| (126 | ) |
Profit on ordinary activities before taxation |
|
|
|
|
|
|
| 483 |
|
Depreciation |
| 64 |
| 11 |
| — |
| 75 |
|
Capital expenditure |
| 114 |
| 27 |
| — |
| 141 |
|
Assets employed |
| 3,711 |
| 103 |
| 49 |
| 3,863 |
|
Average numbers of employees |
| 11,343 |
| 1,206 |
| — |
| 12,549 |
|
|
|
|
|
|
|
|
|
|
|
Year to 31 August 2002 |
|
|
|
|
|
|
|
|
|
Turnover |
| 3,018 |
| 316 |
| — |
| 3,334 |
|
Trading profit before exceptional items and goodwill |
| 516 |
| 78 |
| 16 |
| 610 |
|
Goodwill amortisation |
| (38 | ) | — |
| — |
| (38 | ) |
Exceptional items |
| 129 |
| — |
| — |
| 129 |
|
Profit before finance charges |
| 607 |
| 78 |
| 16 |
| 701 |
|
Finance charges |
|
|
|
|
|
|
| (130 | ) |
Profit on ordinary activities before taxation |
|
|
|
|
|
|
| 571 |
|
Depreciation |
| 65 |
| 10 |
| — |
| 75 |
|
Capital expenditure |
| 99 |
| 34 |
| — |
| 133 |
|
Assets employed |
| 3,620 |
| 120 |
| 46 |
| 3,786 |
|
Average numbers of employees |
| 10,940 |
| 1,173 |
| — |
| 12,113 |
|
Notes
(a) Normalised profit before tax is £495m (2002: £480m) being trading profit £621m (2002: £610m) less finance charges £126m (2002:£130m).
(b) Spirits & Wine goodwill is amortised over 20 years and relates principally to Mumm, Perrier Jouët and Montana acquired in 2001 and Jinro Ballantines acquired in 2000.
(c) Assets employed are before deducting net borrowings of £2,412m (2002: £2,578m), tax payable of £364m (2002: £334m) and dividends payable of £93m (2002: £88m) to give net assets of £994m (2002: £786m).
(d) Trading profit includes the Group’s share of profits of associated undertakings whose turnover is not included.
59
|
| Europe |
| Americas |
| Rest of |
| Total |
| |
|
| £m |
| £m |
| £m |
| £m |
| |
By country of operation |
|
|
|
|
|
|
|
|
| |
Year to 31 August 2003 |
|
|
|
|
|
|
|
|
| |
Turnover | – continuing activities |
| 2,097 |
| 1,821 |
| 419 |
| 4,337 |
|
| – to Group companies |
|
|
|
|
|
|
| (927 | ) |
| – external |
|
|
|
|
|
|
| 3,410 |
|
Trading profit | – continuing activities |
| 229 |
| 327 |
| 65 |
| 621 |
|
| – goodwill amortisation in continuing activities |
| (20 | ) | (2 | ) | (18 | ) | (40 | ) |
| – exceptional items in continuing activities |
| 4 |
| 24 |
| — |
| 28 |
|
Profit before finance charges |
| 213 |
| 349 |
| 47 |
| 609 |
| |
Assets employed |
| 1,896 |
| 1,347 |
| 620 |
| 3,863 |
| |
|
|
|
|
|
|
|
|
|
| |
Year to 31 August 2002 |
|
|
|
|
|
|
|
|
| |
Turnover | – continuing activities |
| 1,892 |
| 1,836 |
| 419 |
| 4,147 |
|
| – to Group companies |
|
|
|
|
|
|
| (813 | ) |
| – external |
|
|
|
|
|
|
| 3,334 |
|
Trading profit | – continuing activities |
| 252 |
| 312 |
| 46 |
| 610 |
|
| – goodwill amortisation in continuing activities |
| (19 | ) | (1 | ) | (18 | ) | (38 | ) |
| – exceptional items in continuing activities |
| (32 | ) | 161 |
| — |
| 129 |
|
Profit before finance charges |
| 201 |
| 472 |
| 28 |
| 701 |
| |
Assets employed |
| 1,650 |
| 1,376 |
| 760 |
| 3,786 |
| |
Notes
(a) Export sales from the United Kingdom were £419m (2002: £448m) including £300m (2002: £336m) sales to Group companies.
(b) Trading profit includes the Group’s share of profits of associated undertakings whose turnover is not included.
60
|
|
| Americas |
| Rest of |
| Total |
| ||
|
| £m |
| £m |
| £m |
| £m |
| |
By country of destination |
|
|
|
|
|
|
|
|
| |
Year to 31 August 2003 |
|
|
|
|
|
|
|
|
| |
Turnover | – continuing activities |
| 1,387 |
| 1,495 |
| 528 |
| 3,410 |
|
Trading profit | – continuing activities |
| 188 |
| 330 |
| 103 |
| 621 |
|
| – goodwill amortisation in continuing activities |
| (20 | ) | (2 | ) | (18 | ) | (40 | ) |
| – exceptional items in continuing activities |
| 4 |
| 24 |
| — |
| 28 |
|
|
| 172 |
| 352 |
| 85 |
| 609 |
| |
|
|
|
|
|
|
|
|
|
| |
Year to 31 August 2002 |
|
|
|
|
|
|
|
|
| |
Turnover | – continuing activities |
| 1,213 |
| 1,599 |
| 522 |
| 3,334 |
|
Trading profit | – continuing activities |
| 209 |
| 311 |
| 90 |
| 610 |
|
| – goodwill amortisation in continuing activities |
| (19 | ) | (1 | ) | (18 | ) | (38 | ) |
| – exceptional items in continuing activities |
| (32 | ) | 161 |
| — |
| 129 |
|
|
| 158 |
| 471 |
| 72 |
| 701 |
| |
Notes
(a) Turnover excludes sales to Group companies.
(b) Trading profit includes the Group’s share of profits of associated undertakings whose turnover is not included.
3. Exchange rates
The significant translation rates to £1:
|
| Average rate |
| Closing rate |
| ||||
|
| 2003 |
| 2002 |
| 31 August |
| 31 August |
|
United States dollar |
| 1.60 |
| 1.46 |
| 1.58 |
| 1.55 |
|
Mexican peso |
| 16.72 |
| 13.70 |
| 17.48 |
| 15.33 |
|
Euro |
| 1.49 |
| 1.60 |
| 1.45 |
| 1.58 |
|
61
4. Staff costs
|
|
|
|
|
|
|
|
|
| Year to |
| Year to |
| |
|
| Full-time |
| Part-time |
| 31 August |
| 31 August |
| |||||
|
| United |
| Overseas |
| United |
| Overseas |
| 2003 |
| 2002 |
| |
|
| £m |
| £m |
| £m |
| £m |
| £m |
| £m |
| |
Remuneration |
| 80 |
| 282 |
| 4 |
| 11 |
| 377 |
| 357 |
| |
Social security |
| 9 |
| 34 |
| — |
| 1 |
| 44 |
| 42 |
| |
Pension schemes | – United Kingdom |
| 26 |
| — |
| — |
| — |
| 26 |
| (9 | ) |
| – Overseas |
| — |
| 7 |
| — |
| — |
| 7 |
| (1 | ) |
Post retirement medical benefits (PRMB) |
| 1 |
| 11 |
| — |
| — |
| 12 |
| 7 |
| |
|
| 116 |
| 334 |
| 4 |
| 12 |
| 466 |
| 396 |
| |
Average numbers employed |
|
|
|
|
|
|
|
|
|
|
|
|
| |
2003 – continuing operations |
| 1,804 |
| 9,319 |
| 187 |
| 1,239 |
| 12,549 |
|
|
| |
2002 – continuing operations |
| 1,563 |
| 9,034 |
| 146 |
| 1,370 |
|
|
| 12,113 |
| |
Directors’ remuneration
The amounts relating to emoluments, share options, Long Term Incentive Scheme interests and Directors’ pension entitlements are disclosed within the Directors’ Remuneration Report on pages 44 to 51.
5. Pension and post retirement benefit schemes
The Group operates a number of pension and post retirement healthcare schemes throughout the world. The major schemes are of the defined benefit type and the assets of the schemes are largely held in separate trustee administered funds. The UK funds represent approximately 80% of the overall pension liabilities of the Group and are closed to new members. Full actuarial reviews of the UK funds were carried out during the year and agreement has been reached with the scheme trustees on funding for the next three years.
The Group has continued to account for pensions in accordance with SSAP 24 for the year ended 31 August 2003. Additional information required under the transitional arrangements for the introduction of FRS 17 is set out below. The Group intends to fully adopt the FRS 17 accounting standard for the year ending 31 August 2004.
SSAP 24 disclosures
United Kingdom
The assets and liabilities of the defined benefit UK schemes are reviewed regularly by an actuary. A full assessment is undertaken every three years for funding purposes and the latest full actuarial valuation of the UK schemes was carried out as at 6 April 2003 by an independent actuary. The valuation is based on a market value approach using the projected unit credit method. The most important assumptions are the discount rate, the rate of increase in remuneration and the pension increase rate.
The funding position as at 6 April 2003 is used as the basis for SSAP 24 accounting purposes. The main assumptions were a discount rate of 7.5% (2002: 7.5%) per annum, remuneration increases of 4% (2002: 4.5%) per annum for the Main Fund and 5.5% (2002: 4.5%) per annum for the Executive Fund and pension increases of 3.2% (2002: 3.5%) per annum. The market value of the Main Fund was £1,129m (2002: £1,397m) and the funding level was 107% (2002: 106%). The market value of the Executive Fund was £325m (2002: £379m) and the funding level was 81% (2002: 83%).
Overseas
The Group operates defined benefit pension and post retirement medical benefit plans in several countries overseas, with the most significant being in the US and Canada. The latest actuarial reviews of these plans were carried out as at 31 August 2002 by independent actuaries for the purpose of calculating pension costs for the year ended 31 August 2003.
The actuarial reviews of the US plans showed that the combined market value of pension plan assets was £151m at 31 August 2002 (2001: £186m). This represents approximately 105% (2001: 144%) of the value of benefits that had accrued to pensioners, deferred pensioners and members as at that date. The principal assumptions used to calculate the liabilities at 31 August 2002 were an assumed discount rate of 6.25% (2001: 7.25%) per annum and earnings increases of 5% (2001: 5%) per annum.
The actuarial reviews of the Canadian plans showed that the combined market value of pension plan assets was £113m at 31 August 2002 (2001: £132m). This represents approximately 95% (2001: 108%) of the value of benefits that had accrued to pensioners, deferred pensioners and members as at that date. The principal assumptions used to calculate the liabilities at 31 August 2002 were an assumed discount rate of 6.74% (2001: 6.94%) per annum and earnings increases of 4.38% (2001: 4.98%) per annum.
62
FRS 17 disclosures
The following information complies with the transitional requirements of FRS 17 and is for disclosure purposes only.
|
| 31 August 2003 |
| 31 August 2002 |
| 31 August 2001 |
| ||||||
|
| United |
| Overseas |
| United |
| Overseas |
| United |
| Overseas |
|
|
| % |
| % |
| % |
| % |
| % |
| % |
|
Major assumptions |
|
|
|
|
|
|
|
|
|
|
|
|
|
Rate of general increase in salaries |
| 4.0 |
| 4.4 |
| 4.1 |
| 4.8 |
| 4.3 |
| 5.2 |
|
Rate of increase to benefits |
| 3.1 |
| 1.8 |
| 3.1 |
| 2.1 |
| 3.3 |
| 2.1 |
|
Discount rate for scheme liabilities |
| 5.6 |
| 6.0 |
| 6.0 |
| 6.5 |
| 6.1 |
| 7.3 |
|
Inflation |
| 2.5 |
| 3.0 |
| 2.3 |
| 2.1 |
| 2.5 |
| 2.7 |
|
|
|
|
|
|
|
|
|
|
|
|
|
|
|
The expected long-term rate of returns of the significant schemes is: |
|
|
|
|
|
|
|
|
|
|
|
|
|
Equities |
| 7.5 |
| 8.2 |
| *7.5 |
| 8.7 |
| 8.0 |
| 10.0 |
|
Bonds |
| 5.0 |
| 5.8 |
| 5.0 |
| 6.1 |
| 5.5 |
| 6.5 |
|
Property and other |
| 5.5 |
| 4.3 |
| 5.2 |
| 4.4 |
| 6.5 |
| 4.0 |
|
* 31 August 2002 assumption amended from 8.5% to 7.5%
|
| 31 August 2003 |
| 31 August 2002 |
| 31 August 2001 |
| ||||||
|
| United |
| Overseas |
| United |
| Overseas |
| United |
| Overseas |
|
|
| £m |
| £m |
| £m |
| £m |
| £m |
| £m |
|
Net pension and post retirement medical benefits (PRMB) liability |
|
|
|
|
|
|
|
|
|
|
|
|
|
Equities |
| 814 |
| 156 |
| 896 |
| 206 |
| 1,182 |
| 273 |
|
Bonds |
| 594 |
| 161 |
| 458 |
| 115 |
| 469 |
| 126 |
|
Property and other |
| 143 |
| 14 |
| 197 |
| 6 |
| 195 |
| 18 |
|
Total market value of assets |
| 1,551 |
| 331 |
| 1,551 |
| 327 |
| 1,846 |
| 417 |
|
Present value of scheme liabilities |
| (2,004 | ) | (464 | ) | (1,941 | ) | (417 | ) | (1,877 | ) | (421 | ) |
Deficit in the schemes |
| (453 | ) | (133 | ) | (390 | ) | (90 | ) | (31 | ) | (4 | ) |
Related deferred tax asset |
| 136 |
| 45 |
| 117 |
| 27 |
| 9 |
| 1 |
|
Net pension and PRMB liability |
| (317 | ) | (88 | ) | (273 | ) | (63 | ) | (22 | ) | (3 | ) |
The amounts charged to the profit and loss account under FRS 17 would have been:
|
| 31 August 2003 |
| 31 August 2002 |
| 31 August 2001 |
| ||||||
|
| United |
| Overseas |
| United |
| Overseas |
| United |
| Overseas |
|
|
| £m |
| £m |
| £m |
| £m |
| £m |
| £m |
|
Regular service cost |
| 10 |
| 19 |
| 6 |
| 9 |
| 8 |
| 8 |
|
Past service cost |
| — |
| — |
| — |
| 7 |
| — |
| — |
|
Interest cost |
| 114 |
| 26 |
| 110 |
| 28 |
| 121 |
| 21 |
|
Expected return on assets |
| (98 | ) | (22 | ) | (130 | ) | (32 | ) | (161 | ) | (32 | ) |
Profit and loss charge/(credit) |
| 26 |
| 23 |
| (14 | ) | 12 |
| (32 | ) | (3 | ) |
Analysis of amount that would have been included within the Group statement of recognised gains and losses under FRS 17:
|
| 31 August 2003 |
| 31 August 2002 |
| ||||
|
| United |
| United |
| Kingdom |
| Overseas |
|
|
| £m |
| £m |
| £m |
| £m |
|
Actual return less expected return on pension scheme assets |
| (12 | ) | (6 | ) | (320 | ) | (64 | ) |
Experience gains and losses arising on the scheme liabilities |
| 20 |
| (4 | ) | (62 | ) | — |
|
Changes in assumptions underlying the present value of the scheme liabilities |
| (71 | ) | (22 | ) | (19 | ) | (19 | ) |
Actuarial loss recognised in Group statement of total recognised gains and losses |
| (63 | ) | (32 | ) | (401 | ) | (83 | ) |
Deferred tax movement |
| 19 |
| 11 |
| 120 |
| 25 |
|
Actuarial loss recognised in Group statement of total recognised gains and losses – net of tax |
| (44 | ) | (21 | ) | (281 | ) | (58 | ) |
63
The history of experience gains and losses under FRS 17 would have been:
|
| 31 August 2003 |
| 31 August 2002 |
| ||||
|
| United |
| Overseas |
| United |
| Overseas |
|
Actual return less expected return on pension scheme assets |
|
|
|
|
|
|
|
|
|
Amount (£m) |
| (12 | ) | (6 | ) | (320 | ) | (64 | ) |
Percentage of the scheme assets (%) |
| (1 | )% | (2 | )% | (21 | )% | (20 | )% |
Experience gains and losses arising on the scheme liabilities |
|
|
|
|
|
|
|
|
|
Amount (£m) |
| 20 |
| (4 | ) | (62 | ) | — |
|
Percentage of the present value of the scheme liabilities (%) |
| (1 | )% | 1 | % | 3 | % | — |
|
Actuarial loss recognised in Group statement of total recognised gains and losses |
|
|
|
|
|
|
|
|
|
Amount (£m) |
| (63 | ) | (32 | ) | (401 | ) | (83 | ) |
Percentage of the present value of the scheme liabilities (%) |
| 3 | % | 7 | % | 21 | % | 20 | % |
The movement in deficit during the year under FRS 17 would have been:
|
| 31 August 2003 |
| 31 August 2002 |
| ||||
|
| United |
| Overseas |
| United |
| Overseas |
|
|
| £m |
| £m |
| £m |
| £m |
|
Deficit in scheme at the beginning of the year net of deferred tax |
| (273 | ) | (63 | ) | (22 | ) | (3 | ) |
Movement in year: |
|
|
|
|
|
|
|
|
|
Current service cost |
| (10 | ) | (19 | ) | (6 | ) | (9 | ) |
Past service cost |
| — |
| — |
| — |
| (7 | ) |
Contributions |
| 26 |
| 16 |
| 16 |
| 4 |
|
Other finance income |
| (16 | ) | (4 | ) | 20 |
| 4 |
|
Currency translation adjustment |
| — |
| 3 |
| — |
| 6 |
|
Deferred tax movement on actuarial loss |
| 19 |
| 11 |
| 120 |
| 25 |
|
Actuarial loss |
| (63 | ) | (32 | ) | (401 | ) | (83 | ) |
Deficit in scheme at the end of the year net of deferred tax |
| (317 | ) | (88 | ) | (273 | ) | (63 | ) |
Group net assets and profit and loss account reserves under FRS 17 would have been:
|
| 31 August |
| 31 August |
|
|
| £m |
| £m |
|
Group net assets |
|
|
|
|
|
Net assets per Group balance sheet |
| 994 |
| 786 |
|
Less: pension and post retirement benefits reported under SSAP 24 (net of deferred tax) |
| (147 | ) | (149 | ) |
Add: pension and post retirement benefits reported under FRS 17 (net of deferred tax) |
| (405 | ) | (336 | ) |
Net assets under FRS 17 |
| 442 |
| 301 |
|
Group profit and loss account |
|
|
|
|
|
Profit and loss account per Group balance sheet |
| 1,299 |
| 1,087 |
|
Less: pension and post retirement benefits reported under SSAP 24 (net of deferred tax) |
| (147 | ) | (149 | ) |
Add: pension and post retirement benefits reported under FRS 17 (net of deferred tax) |
| (405 | ) | (336 | ) |
Profit and loss account under FRS 17 |
| 747 |
| 602 |
|
64
|
|
|
| Year to |
| Year to |
| |
|
| Note |
| £m |
| £m |
| |
Change in stocks of finished goods and work in progress |
|
|
| (72 | ) | (94 | ) | |
Raw materials and consumables |
|
|
| 838 |
| 840 |
| |
Customs and excise duties paid | – ongoing |
|
|
| 671 |
| 638 |
|
| – Mexican excise rebate |
|
|
| (38 | ) | (213 | ) |
Staff costs |
| 4 |
| 466 |
| 396 |
| |
Depreciation |
| 13 |
| 75 |
| 75 |
| |
Goodwill amortisation |
|
|
| 40 |
| 38 |
| |
Other operating charges including exceptional items |
|
|
| 783 |
| 903 |
| |
Operating leases | – hire of equipment |
|
|
| 11 |
| 11 |
|
| – property rents |
|
|
| 48 |
| 48 |
|
Payments to auditor | – fees for audit |
|
|
| 3 |
| 6 |
|
|
|
|
| 2,825 |
| 2,648 |
| |
The Parent Company audit fee was nil (2002: nil). Other payments to the auditor were £1m (2002: £4m) which primarily relate to taxation services.
Mexican excise rebate
The Mexican Supreme Court ruled in 2000 in favour of an action, brought by a number of spirits companies challenging the excise duty regime applicable to their Mexican operations during 1998 and 1999. Its ruling determined that the tax was inequitable because it was applied only to large companies.
The Mexican Supreme Court awarded compensation which, by agreement with the Mexican tax authorities, was principally recovered by offset against current and future duties and taxes. At 31 August 2003 the recovery was complete and £298m has been received over the past three financial years subject to applicable corporation tax at 35%.
7. Goodwill amortisation and exceptional items
|
| Year to |
| Year to |
|
|
| £m |
| £m |
|
Goodwill amortisation |
| (40 | ) | (38 | ) |
Exceptional items |
|
|
|
|
|
Mexican excise rebate |
| 38 |
| 213 |
|
Mexican social projects |
| — |
| (11 | ) |
Acquisition integration costs |
| (3 | ) | (36 | ) |
Termination of land lease |
| — |
| (23 | ) |
Asset write-downs |
| 2 |
| (14 | ) |
Restructuring – QSR |
| (9 | ) | — |
|
Total exceptional items within operating costs |
| 28 |
| 129 |
|
Goodwill amortisation and exceptional items before taxation |
| (12 | ) | 91 |
|
Taxation |
| (8 | ) | (46 | ) |
Goodwill amortisation and exceptional items after taxation |
| (20 | ) | 45 |
|
8. Finance charges
|
| Year to |
| Year to |
|
|
| £m |
| £m |
|
Interest on bank loans and overdrafts |
| 31 |
| 63 |
|
Interest on other loans |
| 107 |
| 75 |
|
Less: deposit and other interest receivable |
| (12 | ) | (8 | ) |
|
| 126 |
| 130 |
|
65
9. Taxation
|
| Year to |
| Year to |
|
|
| £m |
| £m |
|
The charge for taxation on the profit for the period comprises: |
|
|
|
|
|
Current tax |
|
|
|
|
|
United Kingdom taxation |
|
|
|
|
|
Corporation tax at 30% (2002: 30%) |
| 25 |
| 18 |
|
Adjustment in respect of prior periods |
| (1 | ) | (3 | ) |
Double taxation relief |
| (1 | ) | (3 | ) |
|
| 23 |
| 12 |
|
Overseas taxation |
|
|
|
|
|
Corporation tax |
| 60 |
| 188 |
|
Adjustment in respect of prior periods |
| 9 |
| (26 | ) |
|
| 69 |
| 162 |
|
Taxation on attributable profit of associated undertakings |
| 10 |
| 7 |
|
Total current tax |
| 102 |
| 181 |
|
|
|
|
|
|
|
Deferred tax |
|
|
|
|
|
Origination and reversal of timing differences |
| 65 |
| (10 | ) |
Adjustment in respect of prior periods |
| (32 | ) | 5 |
|
Recognition of deferred tax assets arising in prior periods |
| (8 | ) | (10 | ) |
Total tax charge |
| 127 |
| 166 |
|
A reconciliation of the current tax charge at the UK corporation tax rate of 30% (2002: 30%) to the Group’s current tax on profit on ordinary activities is shown below :
|
| Year to |
| Year to |
|
|
| £m |
| £m |
|
Profit on ordinary activities before taxation |
| 483 |
| 571 |
|
Notional charge at UK corporation tax rate of 30% |
| 145 |
| 171 |
|
Differences in effective overseas tax rates |
| 16 |
| 18 |
|
Adjustments to prior period tax charges |
| 8 |
| (29 | ) |
Taxable intra-group dividend income |
| 5 |
| 14 |
|
Utilisation of tax losses not recognised |
| — |
| (14 | ) |
Non deductible expenditure |
| 13 |
| 22 |
|
Non taxable income and gains |
| (12 | ) | (10 | ) |
Losses and other timing differences |
| (65 | ) | 10 |
|
Other current year items |
| (8 | ) | (1 | ) |
Current tax charge |
| 102 |
| 181 |
|
66
Basic earnings per share of 31.6p (2002: 36.8p) has been calculated on earnings of £340m (2002: £392m) divided by the average number of shares of 1,075m (2002: 1,066m).
Diluted earnings per share of 31.6p (2002: 36.7p) has been calculated on earnings of £340m (2002: £392m) and after including the effect of all dilutive potential Ordinary Shares, the average number of shares is 1,076m (2002: 1,069m).
To show earnings per share on a consistent basis, normalised earnings per share of 33.5p (2002: 32.6p) has been calculated on normalised earnings of £360m (2002: £347m) divided by the average number of shares of 1,075m (2002: 1,066m). Normalised earnings has been calculated as follows:
|
| Year to |
| Year to |
|
|
| £m |
| £m |
|
Earnings as reported |
| 340 |
| 392 |
|
Adjustment for exceptional items net of tax |
| (18 | ) | (81 | ) |
Adjustment for goodwill amortisation net of tax |
| 38 |
| 36 |
|
Normalised earnings |
| 360 |
| 347 |
|
Average number of shares |
| Millions |
| Millions |
|
Weighted average Ordinary Shares in issue during the year |
| 1,107 |
| 1,087 |
|
Weighted average Ordinary Shares owned by the Allied Domecq employee trusts* |
| (32 | ) | (21 | ) |
Weighted average Ordinary Shares used in earnings per share calculation |
| 1,075 |
| 1,066 |
|
* Includes American Depositary Shares representing underlying Ordinary Shares
11. Ordinary dividends
|
| Year to |
| Year to |
| Year to |
| Year to |
|
|
| £m |
| £m |
| p |
| p |
|
Interim |
| 57 |
| 53 |
| 5.3 |
| 4.9 |
|
Final |
| 93 |
| 88 |
| 8.7 |
| 8.1 |
|
|
| 150 |
| 141 |
| 14.0 |
| 13.0 |
|
The 2003 interim dividend was paid on 25 July 2003 and the final dividend will be paid on 4 February 2004.
12. Intangible assets
|
| Goodwill |
| Brands |
| Other |
| 31 August |
| 31 August |
|
|
| £m |
| £m |
| £m |
| £m |
| £m |
|
Cost |
|
|
|
|
|
|
|
|
|
|
|
At the beginning of the year |
| 785 |
| 555 |
| 35 |
| 1,375 |
| 635 |
|
Currency translation adjustment |
| — |
| — |
| — |
| — |
| — |
|
Additions |
| — |
| — |
| — |
| — |
| 740 |
|
At the end of the year |
| 785 |
| 555 |
| 35 |
| 1,375 |
| 1,375 |
|
Amortisation |
|
|
|
|
|
|
|
|
|
|
|
At the beginning of the year |
| (53 | ) | — |
| (6 | ) | (59 | ) | (17 | ) |
Currency translation adjustment |
| — |
| — |
| — |
| — |
| — |
|
Charge for the year |
| (40 | ) | — |
| (3 | ) | (43 | ) | (42 | ) |
At the end of the year |
| (93 | ) | — |
| (9 | ) | (102 | ) | (59 | ) |
Net balance at the end of the year |
| 692 |
| 555 |
| 26 |
| 1,273 |
| 1,316 |
|
Goodwill is being amortised over 20 years. Brands relates to the acquisition of Malibu in 2002; an impairment review was carried out at the balance sheet date and the Directors are satisfied that the brand has not suffered any loss in value. Other intangibles are being amortised over ten years.
67
13. Tangible assets
|
| Land and |
| Plant and |
| Total |
|
|
| £m |
| £m |
| £m |
|
Cost |
|
|
|
|
|
|
|
At the beginning of the year |
| 698 |
| 677 |
| 1,375 |
|
Currency translation adjustment |
| 42 |
| 24 |
| 66 |
|
|
| 740 |
| 701 |
| 1,441 |
|
Capital expenditure |
| 49 |
| 92 |
| 141 |
|
Disposals and transfers |
| (16 | ) | (72 | ) | (88 | ) |
At the end of the year |
| 773 |
| 721 |
| 1,494 |
|
Depreciation |
|
|
|
|
|
|
|
At the beginning of the year |
| (145 | ) | (353 | ) | (498 | ) |
Currency translation adjustment |
| (10 | ) | (16 | ) | (26 | ) |
|
| (155 | ) | (369 | ) | (524 | ) |
Disposals and transfers |
| 4 |
| 67 |
| 71 |
|
Charge for the year |
| (18 | ) | (57 | ) | (75 | ) |
At the end of the year |
| (169 | ) | (359 | ) | (528 | ) |
|
|
|
|
|
|
|
|
Net book value at 31 August 2003 |
| 604 |
| 362 |
| 966 |
|
Net book value at 31 August 2002 |
| 553 |
| 324 |
| 877 |
|
|
| 31 August 2003 |
| 31 August 2002 |
| ||||
|
| At |
| Net book |
| At |
| Net book |
|
|
| £m |
| £m |
| £m |
| £m |
|
Freehold land and buildings |
| 689 |
| 548 |
| 630 |
| 511 |
|
Long lease land and buildings |
| 17 |
| 15 |
| 14 |
| 13 |
|
Short lease land and buildings |
| 67 |
| 41 |
| 54 |
| 29 |
|
Total land and buildings |
| 773 |
| 604 |
| 698 |
| 553 |
|
14. Investments and loans
|
| Investments |
| Franchise |
|
|
| ||
|
| Listed |
| Unlisted |
| loans |
| Total |
|
|
| £m |
| £m |
| £m |
| £m |
|
Group |
|
|
|
|
|
|
|
|
|
At the beginning of the year |
| 102 |
| 16 |
| 8 |
| 126 |
|
Currency translation adjustment |
| — |
| — |
| — |
| — |
|
Additions |
| 43 |
| — |
| 1 |
| 44 |
|
Disposals and transfers |
| (6 | ) | (3 | ) | (1 | ) | (10 | ) |
At the end of the year |
| 139 |
| 13 |
| 8 |
| 160 |
|
Included within listed investments is £129m (2002: £93m) in respect of a holding of 32,549,067 (2002: 24,514,993) Ordinary Shares (includes American Depositary Shares representing underlying Ordinary Shares) of 25p each of the Company, purchased by the Parent Company (see below) and held by the trustees of the Group’s employee trusts. The market value of these shares was £124m (2002: £100m) at 31 August 2003.
The listed investments also include £8m (2002: £6m) in respect of a holding of 14.5% (2002: 11.2%) in Peter Lehmann Wines Limited, incorporated in Australia. The market value of these shares was £8m (2002: £6m) at 31 August 2003.
The unlisted investments include a holding of 1% in Suntory Limited, incorporated in Japan.
|
| Investment |
| Listed |
| Total |
|
|
| £m |
| £m |
| £m |
|
Parent Company |
|
|
|
|
|
|
|
At the beginning of the year |
| 4,086 |
| 93 |
| 4,179 |
|
Additions |
| — |
| 41 |
| 41 |
|
Disposals |
| — |
| (5 | ) | (5 | ) |
At the end of the year |
| 4,086 |
| 129 |
| 4,215 |
|
68
|
| Cost |
| Unlisted |
| Listed |
| Loans |
| Total |
|
|
| £m |
| £m |
| £m |
| £m |
| £m |
|
At the beginning of the year |
| 43 |
| 12 |
| 14 |
| 2 |
| 71 |
|
Currency translation adjustment |
| — |
| — |
| — |
| — |
| — |
|
Share of retained profit for the year |
| — |
| 14 |
| — |
| — |
| 14 |
|
At the end of the year |
| 43 |
| 26 |
| 14 |
| 2 |
| 85 |
|
The share of profits before taxation was £24m (2002: £15m) and dividends received were £13m (2002: £11m).
The principal associate is a 25% equity interest in Britannia Soft Drinks Limited, a company engaged in the manufacture and sale of soft drinks.
Other associates include Baskin-Robbins Japan (44% equity interest), Baskin-Robbins Korea (33% equity interest) and the Group’s interest in the Miller RTD commercial partnership.
The above figures comprise the amounts attributable to the Group based on the latest accounts it has been practicable to obtain, some of which are unaudited management accounts.
16. Stocks
|
| 31 August |
| 31 August |
|
|
| £m |
| £m |
|
Raw materials and consumables |
| 45 |
| 52 |
|
Maturing inventory |
| 1,047 |
| 953 |
|
Finished products |
| 293 |
| 281 |
|
Bottles, cases and pallets |
| 22 |
| 16 |
|
|
| 1,407 |
| 1,302 |
|
17. Debtors
|
| Group |
| Parent Company |
| ||||
|
| 31 August |
| 31 August |
| 31 August |
| 31 August |
|
|
| £m |
| £m |
| £m |
| £m |
|
Amounts falling due within one year |
|
|
|
|
|
|
|
|
|
Trade debtors |
| 501 |
| 537 |
| — |
| — |
|
Deferred tax assets (note 19) |
| 17 |
| 36 |
| — |
| — |
|
Amounts due from subsidiary undertakings |
| — |
| — |
| — |
| 4 |
|
Other debtors |
| 108 |
| 111 |
| 12 |
| 10 |
|
Prepayments and accrued income |
| 53 |
| 52 |
| — |
| — |
|
|
| 679 |
| 736 |
| 12 |
| 14 |
|
Amounts due after more than one year |
|
|
|
|
|
|
|
|
|
Pension prepayments |
| 309 |
| 302 |
| — |
| — |
|
Other debtors |
| 2 |
| 15 |
| — |
| — |
|
Prepayments and accrued income |
| 15 |
| 15 |
| — |
| — |
|
|
| 326 |
| 332 |
| — |
| — |
|
69
18. Creditors
|
| Group |
| Parent Company |
| ||||
|
| 31 August |
| 31 August |
| 31 August |
| 31 August |
|
|
| £m |
| £m |
| £m |
| £m |
|
Amounts due within one year |
|
|
|
|
|
|
|
|
|
Trade creditors |
| 216 |
| 175 |
| — |
| — |
|
Bills payable |
| 17 |
| 15 |
| — |
| — |
|
Amounts owed to subsidiary undertakings |
| — |
| — |
| 81 |
| — |
|
Other creditors |
| 312 |
| 286 |
| 6 |
| — |
|
Social security |
| 10 |
| 9 |
| — |
| — |
|
Taxation |
| 228 |
| 226 |
| — |
| — |
|
Accruals and deferred income |
| 285 |
| 223 |
| — |
| — |
|
Proposed dividend (note 11) |
| 93 |
| 88 |
| 93 |
| 88 |
|
|
| 1,161 |
| 1,022 |
| 180 |
| 88 |
|
Amounts due after more than one year |
|
|
|
|
|
|
|
|
|
Other creditors |
| 34 |
| 45 |
| — |
| — |
|
Accruals and deferred income |
| 12 |
| 45 |
| — |
| — |
|
|
| 46 |
| 90 |
| — |
| — |
|
19. Provisions for liabilities and charges
|
| Post |
| Reorganisation |
| Surplus |
| Deferred |
| Total |
|
|
| £m |
| £m |
| £m |
| £m |
| £m |
|
At the beginning of the year |
| 81 |
| 49 |
| 10 |
| 144 |
| 284 |
|
Currency translation adjustment |
| 2 |
| (1 | ) | — |
| 2 |
| 3 |
|
Timing differences within statement of recognised gains and losses |
| — |
| — |
| — |
| 2 |
| 2 |
|
Utilised during the year |
| (5 | ) | (29 | ) | (1 | ) | — |
| (35 | ) |
Charged during the year |
| 12 |
| 12 |
| — |
| 5 |
| 29 |
|
At the end of the year |
| 90 |
| 31 |
| 9 |
| 153 |
| 283 |
|
The future cost of the post retirement medical benefits is assessed in accordance with independent actuarial advice.
£29m of reorganisation and restructuring provisions brought forward from previous years were utilised during the year. New provisions totalling £9m were created during the year. Of the provisions outstanding at the year end, £3m relate to the final stages of the acquisition integration programme, £16m for the termination of a land lease in California and £4m for the trust fund established for social and community projects in Mexico. The remainder relates to the QSR restructuring programme.
It is expected that the majority of reorganisation and restructuring costs will be incurred in the financial year ending 31 August 2004, whilst the trust funds will be disbursed as the projects develop.
The provision for surplus properties will be utilised over the terms of the leases to which the provisions relate.
70
|
| 31 August |
| 31 August |
|
|
| £m |
| £m |
|
Accelerated capital allowances |
| 16 |
| 28 |
|
Goodwill and other intangible assets |
| 82 |
| 70 |
|
Pensions and other post retirement benefits |
| 72 |
| 72 |
|
Tax losses and credits |
| (37 | ) | (47 | ) |
Other timing differences |
| 3 |
| (15 | ) |
Net deferred taxation liability |
| 136 |
| 108 |
|
Comprising: |
|
|
|
|
|
Deferred tax asset (note 17) |
| (17 | ) | (36 | ) |
Deferred tax liability |
| 153 |
| 144 |
|
|
| 136 |
| 108 |
|
At the beginning of the year |
| 108 |
| 111 |
|
Currency translation adjustment |
| 1 |
| (3 | ) |
Timing differences within statement of recognised gains and losses |
| 2 |
| 12 |
|
Acquisition of businesses |
| — |
| 3 |
|
Charged during the year |
| 25 |
| (15 | ) |
At the end of the year |
| 136 |
| 108 |
|
Deferred tax assets of £42m at 31 August 2003 (2002: £49m) have not been recognised due to the degree of uncertainty over the utilisation of the underlying tax losses and deductions in certain tax jurisdictions.
Deferred tax has not been provided for liabilities which might arise on unremitted earnings of overseas subsidiaries and associates, as such earnings are reinvested by the Group and no tax is expected to be payable on them in the foreseeable future.
71
20. Net debt
|
| Redemption |
| 31 August |
| 31 August |
|
Unsecured loans |
|
|
|
|
|
|
|
GBP250m Bond (6.625%)* |
| 2014 |
| 247 |
| 246 |
|
EUR600m Bond (5.875%)* |
| 2009 |
| 410 |
| 376 |
|
GBP450m Bond (6.625%)* |
| 2011 |
| 447 |
| 447 |
|
EUR800m Bond (5.5%)* |
| 2006 |
| 550 |
| 504 |
|
NZD125m Capital Notes (9.3%) |
| 2006 |
| 45 |
| 38 |
|
DEM500m Notes (4.75%)* |
| 2005 |
| 176 |
| 161 |
|
NZD400m Revolving Credit Facility |
| Expired |
| — |
| 115 |
|
NZD100m Revolving Credit Facility* |
| 2006 |
| 23 |
| — |
|
MXN600m Revolving Credit Facility |
| 2008 |
| 34 |
| — |
|
Other loans |
| Various |
| — |
| 16 |
|
Foreign currency swaps |
| Various |
| (115 | ) | (59 | ) |
Secured loans |
|
|
|
|
|
|
|
NZD225m Revolving Credit Facility** |
| Expired |
| — |
| 60 |
|
|
|
|
| 1,817 |
| 1,904 |
|
Less amounts repayable within one year |
|
|
| (2 | ) | (128 | ) |
Loan capital |
|
|
| 1,815 |
| 1,776 |
|
Short-term borrowings |
|
|
| 772 |
| 971 |
|
Cash at bank and in hand |
|
|
| (175 | ) | (169 | ) |
Net debt |
|
|
| 2,412 |
| 2,578 |
|
* Borrowings and interest guaranteed by Allied Domecq PLC or Allied Domecq (Holdings) PLC.
** Borrowings subject to a charge over Montana assets.
The Euro and GBP Bonds have been partially swapped into floating rate US dollars.
The Parent Company has short-term borrowings of nil (2002: nil).
|
| 31 August |
| 31 August |
|
|
| £m |
| £m |
|
Repayment schedule |
|
|
|
|
|
More than five years |
| 1,104 |
| 1,069 |
|
Between two and five years |
| 711 |
| 647 |
|
Between one and two years |
| — |
| 60 |
|
Loan capital |
| 1,815 |
| 1,776 |
|
Short-term borrowings |
| 772 |
| 971 |
|
Total borrowings |
| 2,587 |
| 2,747 |
|
The funding policy of the Group is to maintain a broad portfolio of debt, diversified by source and maturity and to maintain committed facilities sufficient to cover with a minimum of £300m above peak borrowing requirements. At 31 August 2003 the Group had available undrawn committed bank facilities of £1,346m (2002: £1,606m) of which £167m (2002: £580m) mature in less than one year and £1,179m (2002: £1,026m) between two and five years.
72
The Group’s treasury policies are set out in the Operating and Financial Review. Set out below is a year end comparison of the current and book values of the Group’s financial instruments by category, excluding short-term debtors and creditors. Where available, market rates have been used to determine current values. Where market rates are not available, current values have been calculated by discounting cash flows at prevailing interest and exchange rates.
|
| 31 August 2003 |
| 31 August 2002 |
| ||||
|
| Book |
| Current |
| Book |
| Current |
|
|
| £m |
| £m |
| £m |
| £m |
|
Cash at bank and in hand |
| 175 |
| 175 |
| 169 |
| 169 |
|
Short-term borrowings |
| (772 | ) | (772 | ) | (971 | ) | (971 | ) |
Loan capital |
| (1,815 | ) | (1,932 | ) | (1,776 | ) | (1,829 | ) |
Net debt |
| (2,412 | ) | (2,529 | ) | (2,578 | ) | (2,631 | ) |
Interest rate risk management
Exposure to interest rate fluctuations on borrowings and deposits is managed by using cross currency swaps, interest rate swaps and purchased interest rate options. The Group has a fixed/floating debt target of 70% +/- 10%. At the year end, taking account of swaps, 70% (2002: 61%) of net debt was at fixed rates of interest. At the year end, the weighted average maturity of net debt was approximately 4 years (2002: 4.9 years).
|
| 31 August 2003 |
| 31 August 2002 |
| ||||
|
| Book |
| Current |
| Book |
| Current |
|
|
| £m |
| £m |
| £m |
| £m |
|
Interest rate swaps |
| 1 |
| (34 | ) | — |
| (43 | ) |
Cross currency swaps |
| 7 |
| 44 |
| 8 |
| 16 |
|
|
| 8 |
| 10 |
| 8 |
| (27 | ) |
There is a deferred loss in respect of interest rate swaps, being the net of the current value less book value, of which £9m (2002: £11m) relates to the financial year ending 31 August 2004 and £26m (2002: £32m) thereafter.
There is a deferred gain in respect of cross currency swaps, being the net of the current value less book value, of which £6m (2002: £1m) relates to the financial year ending 31 August 2004 and £31m (2002: £7m) thereafter.
After taking account of cross currency and interest rate swaps, the currency and interest rate exposure of net debt as at 31 August 2003 was:
|
| 31 August 2003 |
| 31 August 2002 |
| ||||||||||||||||
|
|
|
|
|
| Fixed rate debt |
|
|
|
|
| Fixed rate debt |
| ||||||||
|
| Net |
| Floating |
| Fixed rate |
| Weighted |
| Weighted |
| Net |
| Floating |
| Fixed rate |
| Weighted |
| Weighted |
|
Sterling |
| 65 |
| 5 |
| 60 |
| 11.2 |
| 8 |
| 350 |
| 166 |
| 184 |
| 6.6 |
| 11 |
|
US dollar* |
| 1,471 |
| 523 |
| 948 |
| 5.7 |
| 5 |
| 1,262 |
| 303 |
| 959 |
| 5.7 |
| 6 |
|
Euro |
| 701 |
| 166 |
| 535 |
| 5.1 |
| 4 |
| 719 |
| 332 |
| 387 |
| 5.1 |
| 4 |
|
NZ dollar |
| 108 |
| 35 |
| 73 |
| 8.1 |
| 3 |
| 252 |
| 214 |
| 38 |
| 9.1 |
| 3 |
|
Japanese Yen |
| 110 |
| 36 |
| 74 |
| 0.7 |
| 6 |
| 68 |
| 32 |
| 36 |
| 0.9 |
| 3 |
|
Other |
| (43 | ) | (43 | ) | — |
| — |
| — |
| (73 | ) | (73 | ) | — |
| — |
| — |
|
Net debt |
| 2,412 |
| 722 |
| 1,690 |
| 5.6 |
| 6 |
| 2,578 |
| 974 |
| 1,604 |
| 5.6 |
| 6 |
|
* US dollar debt includes a non-material amount of Canadian dollar debt.
Some of the interest rate swaps included in the above table are cancellable at the option of the banks at various dates between 2004 and 2006.
The floating rate debt includes bank debt bearing interest at rates based on the relevant inter bank rate and on commercial paper rates in the UK, US, Canada and France. These rates are fixed in advance for periods up to six months. The weighted average interest rate on floating net debt as at 31 August 2003 was approximately 2.8% (2002: 3.6%).
73
The Group estimates its net transaction cash flows in its main currencies of business which are then hedged forward for up to 18 months using a combination of forward exchange contracts and purchased foreign exchange options. At the year end 84% (2002: 86%) of such currency exposures had been hedged for the following 12 months.
The estimated current value of the foreign exchange cover forward contracts and options entered into to hedge future transaction flows is set out below based on quoted market prices where available and option pricing models.
|
| 31 August 2003 |
| 31 August 2002 |
| |||||||||||
|
| Nominal |
| Book |
| Current |
| Nominal |
| Book |
| Current |
| |||
|
| £m |
| £m |
| £m |
| £m |
| £m |
| £m |
| |||
Foreign exchange forward rate contracts | – assets |
| 155 |
| — |
| 4 |
| 128 |
| — |
| 12 |
| ||
| – liabilities |
| 72 |
| — |
| (4 | ) | 97 |
| — |
| (3 | ) | ||
Options | – assets |
| 19 |
| — |
| — |
| — |
| — |
| — |
| ||
| – liabilities |
| 19 |
| — |
| — |
| 6 |
| — |
| — |
| ||
|
| 265 |
| — |
| — |
| 231 |
| — |
| 9 |
| |||
A net gain of £13m was recognised on all foreign exchange forward contracts and options maturing in the year to 31 August 2003 (2002: £9m).
At 31 August 2003 and 31 August 2002, there were no material monetary assets or liabilities in currencies other than the functional currencies of Group companies, having taken into account the effect of derivative financial instruments that have been used to hedge foreign currency exposure.
22. Share capital
|
| Authorised |
| Allotted, called |
| ||||
|
| 31 August |
| 31 August |
| 31 August |
| 31 August |
|
|
| £m |
| £m |
| £m |
| £m |
|
Equity |
|
|
|
|
|
|
|
|
|
Ordinary Shares of 25p |
| 400 |
| 400 |
| 277 |
| 277 |
|
|
| Authorised |
| Issued |
| ||||
|
| Million |
| Million |
| Million |
| Million |
|
Number of shares |
| 1,600 |
| 1,600 |
| 1,107 |
| 1,107 |
|
74
During the year options have been granted under the existing employee share option schemes over both Ordinary Shares and American Depositary Shares (ADSs) totalling 11,754,945* shares. Options were exercised over 1,598,429 shares and options over 1,738,186* shares lapsed during the year.
* These totals include options over ADSs each of which represents four underlying Ordinary Shares.
Details of the unexercised options granted under the Company’s employee share option schemes as at 31 August 2003 were as follows:
|
| Date of grant |
| Option |
| Ordinary |
|
Options over Ordinary Shares |
|
|
|
|
|
|
|
SAYE Scheme 1999 |
| 3 December 1999 |
| 262.0 |
| 655,020 |
|
International SAYE Scheme 1999 |
| 2 June 2000 |
| 265.0 |
| 385,716 |
|
|
| 30 November 2001 |
| 282.0 |
| 570,132 |
|
Approved Executive Share Option Scheme 1999 |
| 5 May 2000 |
| 331.0 |
| 36,252 |
|
|
| 8 May 2001 |
| 408.0 |
| 1,124,856 |
|
|
| 2 November 2001 |
| 351.5 |
| 320,942 |
|
|
| 3 May 2002 |
| 438.0 |
| 34,245 |
|
|
| 1 November 2002 |
| 382.0 |
| 470,956 |
|
|
| 1 May 2003 |
| 351.0 |
| 25,641 |
|
Executive Share Option Scheme 1999 |
| 1 November 1999 |
| 342.0 |
| 4,617,281 |
|
|
| 16 November 1999 |
| 331.5 |
| 947,017 |
|
|
| 5 May 2000 |
| 331.0 |
| 46,248 |
|
|
| 8 May 2001 |
| 408.0 |
| 3,519,398 |
|
|
| 2 November 2001 |
| 351.5 |
| 5,085,762 |
|
|
| 1 November 2002 |
| 382.0 |
| 7,676,505 |
|
|
| 3 May 2002 |
| 438.0 |
| 221,853 |
|
|
| 1 May 2003 |
| 351.0 |
| 64,359 |
|
Long Term Incentive Scheme 1999 |
| 8 May 2001 |
| 0.1 |
| 1,263,666 |
|
|
| 2 November 2001 |
| 0.1 |
| 1,563,889 |
|
|
| 3 May 2002 |
| 0.1 |
| 77,054 |
|
|
| 1 November 2002 |
| 0.1 |
| 1,015,906 |
|
|
|
|
|
|
| 29,722,698 |
|
|
| Date of grant |
| Option |
| ADSs |
|
Options over ADSs |
|
|
|
|
|
|
|
US Schedule to the Executive Share Option Scheme 1999 |
| 1 November 2002 |
| 24.45 |
| 469,470 |
|
|
| 8 January 2003 |
| 25.85 |
| 3,868 |
|
|
| 1 May 2003 |
| 22.93 |
| 3,750 |
|
Executive Share Option Scheme 1999 |
| 1 November 2002 |
| 24.45 |
| 38,011 |
|
|
| 8 January 2003 |
| 25.85 |
| 33,366 |
|
|
| 1 May 2003 |
| 22.93 |
| 1,750 |
|
Long Term Incentive Scheme 1999 |
| 8 January 2003 |
| 0.006 |
| 21,276 |
|
|
|
|
|
|
| 571,491 |
|
The Company currently satisfies the exercise of options using existing shares that are purchased in the market by the Company’s employee trusts. The profit and loss expense under the option plans is determined based upon the excess of the shares purchased by the trust over the exercise price of the underlying options and is amortised over the vesting period of the underlying options. As at 31 August 2003 the Company’s employee trusts held 32,549,067 shares (including ADSs) in the Company all of which were the subject of awards made under the Company’s employee share schemes. The trustees are obliged to waive the dividends on these shares. The options exercised during the year were all satisfied by the transfer of shares to participants by the employee trusts.
75
|
| Share |
| Share |
| Merger |
| Profit |
| Total |
|
|
| £m |
| £m |
| £m |
| £m |
| £m |
|
Group |
|
|
|
|
|
|
|
|
|
|
|
At the beginning of the year |
| 277 |
| 165 |
| (823 | ) | 1,087 |
| 706 |
|
Profit earned for Shareholders for the year |
| — |
| — |
| — |
| 340 |
| 340 |
|
Currency translation differences on foreign currency net investments |
| — |
| — |
| — |
| 3 |
| 3 |
|
Taxation on translation differences |
| — |
| — |
| — |
| 19 |
| 19 |
|
Ordinary dividends |
| — |
| — |
| — |
| (150 | ) | (150 | ) |
At the end of the year |
| 277 |
| 165 |
| (823 | ) | 1,299 |
| 918 |
|
Goodwill (at historic exchange rates) of £2,284m has been written off to reserves.
|
| Share |
| Share |
| Merger |
| Capital |
| Profit |
| Total |
|
|
| £m |
| £m |
| £m |
| £m |
| £m |
| £m |
|
Parent Company |
|
|
|
|
|
|
|
|
|
|
|
|
|
At the beginning of the year |
| 277 |
| 165 |
| 2,420 |
| 651 |
| 592 |
| 4,105 |
|
Profit earned for Shareholders for the year |
| — |
| — |
| — |
| — |
| 92 |
| 92 |
|
Ordinary dividends |
| — |
| — |
| — |
| — |
| (150 | ) | (150 | ) |
At the end of the year |
| 277 |
| 165 |
| 2,420 |
| 651 |
| 534 |
| 4,047 |
|
24. Minority interests
|
| Equity |
| Non-equity |
| Total |
|
|
| £m |
| £m |
| £m |
|
At the beginning of the year |
| 76 |
| 4 |
| 80 |
|
Currency translation adjustment |
| 2 |
| — |
| 2 |
|
Share of profits of subsidiary undertakings |
| 15 |
| 1 |
| 16 |
|
Dividends declared |
| (21 | ) | (1 | ) | (22 | ) |
At the end of the year |
| 72 |
| 4 |
| 76 |
|
The principal minority shareholdings relate to Jinro Ballantines Company Limited and Corby Distilleries Limited.
76
25. Detailed analysis of gross cash flows
|
| Year to |
| Year to |
|
|
| £m |
| £m |
|
Returns on investments and servicing of finance |
|
|
|
|
|
Interest received |
| 22 |
| 8 |
|
Interest paid |
| (149 | ) | (137 | ) |
Dividends paid to minority shareholders |
| (21 | ) | (4 | ) |
|
| (148 | ) | (133 | ) |
Taxation paid |
|
|
|
|
|
UK taxation |
| — |
| (1 | ) |
Overseas taxation |
| (65 | ) | (177 | ) |
|
| (65 | ) | (178 | ) |
Capital expenditure and financial investment |
|
|
|
|
|
Purchase of tangible fixed assets |
| (144 | ) | (133 | ) |
Sale of tangible fixed assets |
| 21 |
| 17 |
|
Purchase of intangible fixed assets |
| — |
| (556 | ) |
Purchase of trade investments |
| (3 | ) | (13 | ) |
Disposal of trade investments |
| 11 |
| 7 |
|
Purchase of Ordinary Share capital for employee trusts* |
| (41 | ) | (34 | ) |
|
| (156 | ) | (712 | ) |
Acquisitions and disposals |
|
|
|
|
|
Purchase of subsidiary undertakings |
| — |
| (550 | ) |
Borrowings acquired with subsidiary undertakings |
| — |
| (36 | ) |
|
| — |
| (586 | ) |
Financing |
|
|
|
|
|
Issue of Ordinary Share capital |
| — |
| 149 |
|
Redemption of debt |
| (175 | ) | — |
|
Bonds issued during the year |
| — |
| 622 |
|
Increase in other borrowings |
| 11 |
| 27 |
|
|
| (164 | ) | 798 |
|
* Includes American Depositary Shares representing underlying Ordinary Shares.
26. Reconciliation of net cash inflow from operating activities to free cash flow
|
| Year to |
| Year to |
| |
|
| £m |
| £m |
| |
Net cash inflow from operating activities |
| 748 |
| 760 |
| |
Capital expenditure net of sale of tangible assets |
| (123 | ) | (116 | ) | |
Dividends received from associated undertakings |
| 13 |
| 11 |
| |
Operating cash net of fixed assets |
| 638 |
| 655 |
| |
Taxation paid |
| (65 | ) | (178 | ) | |
Net interest paid |
| (127 | ) | (129 | ) | |
Dividends paid | – Ordinary Shareholders |
| (144 | ) | (133 | ) |
| – minorities |
| (21 | ) | (4 | ) |
Free cash flow |
| 281 |
| 211 |
| |
77
27. Net debt
|
|
|
|
|
|
|
|
|
| Year to 31 August |
| ||
|
| Cash at |
| Overdrafts |
| Other loans |
| Loan capital |
| 2003 |
| 2002 |
|
|
| £m |
| £m |
| £m |
| £m |
| £m |
| £m |
|
At the beginning of the year |
| 169 |
| (843 | ) | (128 | ) | (1,776 | ) | (2,578 | ) | (1,854 | ) |
Increase/(decrease) in cash |
| 57 |
| 77 |
| — |
| — |
| 134 |
| (194 | ) |
(Decrease)/increase in liquid resources |
| (50 | ) | — |
| — |
| — |
| (50 | ) | 21 |
|
Decrease/(increase) in loan capital and other loans |
| — |
| — |
| 147 |
| 17 |
| 164 |
| (649 | ) |
Exchange adjustments |
| (1 | ) | (4 | ) | (21 | ) | (56 | ) | (82 | ) | 98 |
|
At the end of the year |
| 175 |
| (770 | ) | (2 | ) | (1,815 | ) | (2,412 | ) | (2,578 | ) |
Liquid resources comprise short-term deposits which have maturity dates of less than three months.
28. Capital commitments
|
| 31 August |
| 31 August |
|
|
| £m |
| £m |
|
Contracted for but not provided in the accounts |
| 1 |
| 1 |
|
29. Operating lease commitments
|
| Land and |
| Other |
| Land and |
| Other |
|
|
| £m |
| £m |
| £m |
| £m |
|
The minimum operating lease payments to be made in the year ending 31 August 2004 for leases expiring: |
|
|
|
|
|
|
|
|
|
Within one year |
| 4 |
| 1 |
| 3 |
| 1 |
|
Within two to five years |
| 14 |
| 8 |
| 15 |
| 7 |
|
After five years |
| 26 |
| — |
| 26 |
| 1 |
|
|
| 44 |
| 9 |
| 44 |
| 9 |
|
30. Contingent liabilities
|
| Parent Company |
| ||
|
| 31 August |
| 31 August |
|
|
| £m |
| £m |
|
Guarantees in respect of liabilities of subsidiary undertakings |
| 2,555 |
| 2,654 |
|
In the normal course of business, the Group has a number of legal claims or potential claims against it, none of which are expected to give rise to significant loss. We are not currently involved in any legal or arbitration proceedings, including any proceedings which are threatened or pending of which we are aware, which may have a material effect on our financial position, results of operations or liquidity.
78
31. Related party transactions
Transactions with associated undertakings
All transactions with these undertakings arise in the normal course of the business.
|
| Year to |
| Year to |
|
|
| £m |
| £m |
|
Sales to associated undertakings |
| 43 |
| 50 |
|
Purchases of goods and other services |
| (11 | ) | (13 | ) |
Marketing expenditure charged |
| (14 | ) | (8 | ) |
Dividends received |
| 13 |
| 11 |
|
|
| As at |
| As at |
|
|
| £m |
| £m |
|
Loans to associated undertakings |
| 2 |
| 2 |
|
Net amounts due from associated undertakings |
| 6 |
| 11 |
|
Transactions with Directors
Remuneration and shareholdings of Directors are disclosed in the Directors’ Remuneration Report on pages 44 to 51.
79
|
| 1999 |
| 2000 |
| 2001 |
| 2002 |
| 2003 |
| |
Profit and loss account for the year |
| £m |
| £m |
| £m |
| £m |
| £m |
| |
Continuing operations |
| 2,408 |
| 2,602 |
| 2,879 |
| 3,334 |
| 3,410 |
| |
Discontinued operations |
| 1,695 |
| 18 |
| — |
| — |
| — |
| |
Turnover |
| 4,103 |
| 2,620 |
| 2,879 |
| 3,334 |
| 3,410 |
| |
Continuing operations |
| 430 |
| 487 |
| 543 |
| 610 |
| 621 |
| |
Discontinued operations |
| 241 |
| 13 |
| — |
| — |
| — |
| |
Trading profit |
| 671 |
| 500 |
| 543 |
| 610 |
| 621 |
| |
Finance charges |
| (92 | ) | (83 | ) | (90 | ) | (130 | ) | (126 | ) | |
Normalised profit before the following items: |
| 579 |
| 417 |
| 453 |
| 480 |
| 495 |
| |
Goodwill amortisation |
| — |
| (3 | ) | (12 | ) | (38 | ) | (40 | ) | |
Exceptional operating costs |
| (253 | ) | (54 | ) | 38 |
| 129 |
| 28 |
| |
Profits on sales of businesses and fixed assets |
| 167 |
| 59 |
| 6 |
| — |
| — |
| |
Debenture/loan stock repayment premia |
| (272 | ) | — |
| — |
| — |
| — |
| |
Profit on ordinary operations before taxation |
| 221 |
| 419 |
| 485 |
| 571 |
| 483 |
| |
Taxation* |
| (140 | ) | (80 | ) | (128 | ) | (166 | ) | (127 | ) | |
Minority interests and preference dividends |
| (6 | ) | (9 | ) | (13 | ) | (13 | ) | (16 | ) | |
Earned for Ordinary Shareholders* |
| 75 |
| 330 |
| 344 |
| 392 |
| 340 |
| |
Earnings and dividends |
|
|
|
|
|
|
|
|
|
|
| |
Earnings per Ordinary Share | – basic* |
| 7.2 | p | 31.2 | p | 32.6 | p | 36.8 | p | 31.6 | p |
| – normalised* |
| 22.3 | p | 28.6 | p | 31.0 | p | 32.6 | p | 33.5 | p |
Dividends per Ordinary Share |
| 15.0 | p | 11.0 | p | 12.1 | p | 13.0 | p | 14.0 | p | |
Normalised cover for ordinary dividends |
| 2.7 | x | 2.5 | x | 2.6 | x | 2.5 | x | 2.4 | x | |
Normalised earnings per Ordinary Share exclude discontinued operations and the taxation thereon.
|
| 1999 |
| 2000 |
| 2001 |
| 2002 |
| 2003 |
|
Balance sheet at year end |
| £m |
| £m |
| £m |
| £m |
| £m |
|
Assets employed |
|
|
|
|
|
|
|
|
|
|
|
Fixed assets* |
| 2,908 |
| 762 |
| 1,547 |
| 2,390 |
| 2,484 |
|
Net current assets excluding net borrowings |
| 932 |
| 1,009 |
| 1,019 |
| 1,348 |
| 1,251 |
|
Creditors over one year and provisions* |
| (306 | ) | (316 | ) | (303 | ) | (374 | ) | (329 | ) |
Total assets |
| 3,534 |
| 1,455 |
| 2,263 |
| 3,364 |
| 3,406 |
|
Short-term borrowings less cash |
| (535 | ) | (446 | ) | (659 | ) | (802 | ) | (597 | ) |
Loan capital |
| (780 | ) | (806 | ) | (1,195 | ) | (1,776 | ) | (1,815 | ) |
Net assets |
| 2,219 |
| 203 |
| 409 |
| 786 |
| 994 |
|
Financed by |
|
|
|
|
|
|
|
|
|
|
|
Share capital and share premium |
| 3,496 |
| 293 |
| 293 |
| 442 |
| 442 |
|
Merger reserve |
| (2,586 | ) | (823 | ) | (823 | ) | (823 | ) | (823 | ) |
Revaluation reserve |
| 960 |
| — |
| — |
| — |
| — |
|
Profit and loss account* |
| 323 |
| 667 |
| 871 |
| 1,087 |
| 1,299 |
|
Minority interests |
| 26 |
| 66 |
| 68 |
| 80 |
| 76 |
|
Shareholders’ funds and minorities* |
| 2,219 |
| 203 |
| 409 |
| 786 |
| 994 |
|
* The profit and loss account and balance sheets for 1999 to 2001 have been restated for the impact of the adoption of FRS 19.
80
|
| 1999 |
| 2000 |
| 2001 |
| 2002 |
| 2003 |
| |
Cash flow statement for the year |
| £m |
| £m |
| £m |
| £m |
| £m |
| |
Operating cash flow |
| 600 |
| 380 |
| 432 |
| 771 |
| 761 |
| |
Capital expenditure |
| (211 | ) | (87 | ) | (97 | ) | (133 | ) | (144 | ) | |
Proceeds from sale of fixed assets |
| 60 |
| 115 |
| 24 |
| 17 |
| 21 |
| |
Operating cash net of fixed assets |
| 449 |
| 408 |
| 359 |
| 655 |
| 638 |
| |
Tax (paid)/repaid |
| (161 | ) | 21 |
| (34 | ) | (178 | ) | (65 | ) | |
Interest paid |
| (115 | ) | (77 | ) | (72 | ) | (129 | ) | (127 | ) | |
Dividends paid | – to shareholders |
| (320 | ) | — |
| (163 | ) | (133 | ) | (144 | ) |
| – to minorities |
| (4 | ) | (4 | ) | (4 | ) | (4 | ) | (21 | ) |
Free cash flow after dividends paid |
| (151 | ) | 348 |
| 86 |
| 211 |
| 281 |
| |
Acquisitions |
| (51 | ) | (103 | ) | (658 | ) | (1,155 | ) | (3 | ) | |
Disposals |
| 490 |
| (114 | ) | 4 |
| 7 |
| 11 |
| |
Financing |
| (289 | ) | — |
| — |
| — |
| — |
| |
Share capital issued/(acquired) |
| 112 |
| (39 | ) | (26 | ) | 115 |
| (41 | ) | |
Foreign currency translation of net debt |
| (25 | ) | (29 | ) | (8 | ) | 98 |
| (82 | ) | |
Movement in net debt |
| 86 |
| 63 |
| (602 | ) | (724 | ) | 166 |
| |
Opening net debt |
| (1,401 | ) | (1,315 | ) | (1,252 | ) | (1,854 | ) | (2,578 | ) | |
Closing net debt |
| (1,315 | ) | (1,252 | ) | (1,854 | ) | (2,578 | ) | (2,412 | ) | |
Group highlights in the Euro and US dollars
|
| Sterling |
| Euro |
| US dollar |
| ||||||
|
| 2003 |
| 2002 |
| 2003 |
| 2002 |
| 2003 |
| 2002 |
|
|
| £ |
| £ |
| € |
| € |
| $ |
| $ |
|
EBITA |
| 621 | m | 610 | m | 900 | m | 964 | m | 981 | m | 945 | m |
EBITDA |
| 696 | m | 685 | m | 1,009 | m | 1,082 | m | 1,100 | m | 1,062 | m |
Earnings per share |
| 0.335 |
| 0.326 |
| 0.486 |
| 0.515 |
| 0.529 |
| 0.505 |
|
Dividends per share |
| 0.140 |
| 0.130 |
| 0.203 |
| 0.205 |
| 0.221 |
| 0.201 |
|
Net assets |
| 994 | m | 786 | m | 1,441 | m | 1,242 | m | 1,571 | m | 1,218 | m |
Free cash flow after dividends paid |
| 281 | m | 211 | m | 407 | m | 333 | m | 444 | m | 327 | m |
Figures stated in the Euro and US dollars have been translated at the 31 August closing rates of exchange for each year.
81
US GAAP reconciliation
Allied Domecq PLC listed on the New York Stock Exchange on 31 July 2002. Pages 82 to 84 provide an explanation and reconciliation from UK to US GAAP.
Differences between UK and US Generally Accepted Accounting Principles
The Group’s consolidated financial statements are prepared in accordance with UK GAAP, which differ from those generally accepted in the United States (‘US GAAP’). The significant differences between UK GAAP and US GAAP which affect the Group’s net income and shareholders’ equity are summarised below.
(a) Brands, goodwill and other intangible assets
Under UK GAAP, goodwill arising on acquisitions of a business since 1 September 1998 is capitalised and amortised by equal instalments over its anticipated useful life, but not exceeding 20 years. Goodwill arising on acquisitions prior to 1 September 1998 was charged directly to reserves. On disposal of a business, any attributable goodwill previously eliminated against reserves is included in the calculation of any gain or loss. Other purchased intangible assets are capitalised and amortised over their useful economic lives on a straight line basis. Where intangible assets, such as brands, are regarded as having indefinite useful economic lives, they are not amortised but are subject to annual impairment reviews.
Under US GAAP, prior to the adoption of Statement of Financial Accounting Standards (SFAS) No. 141 – Business Combinations and SFAS No. 142 – Goodwill and Other Intangible Assets, goodwill and other intangible assets arising on acquisition were capitalised and amortised over their useful economic lives, but not exceeding 40 years. The Group adopted the provisions of SFAS No. 141 as at 1 July 2001, and SFAS No. 142 as at 1 September 2001. Goodwill and intangible assets determined to have an indefinite useful life acquired in a purchase business combination are no longer amortised and are subjected to annual impairment testing. Accordingly, net income no longer includes amortisation of brands, and goodwill amortisation recognised under UK GAAP is reversed.
The amount of goodwill under UK GAAP differs to that under US GAAP due to the fair values allocated to intangible assets, significantly brands, stock, and the exclusion from the purchase price consideration of certain costs.
(b) Associated undertakings
The principal difference between UK GAAP and US GAAP relates to the accounting treatment of goodwill which is discussed in note (a).
(c) Stocks
Under UK GAAP, stock acquired through a business combination is valued at the lower of replacement cost and net realisable value. Under US GAAP, stock acquired through a business combination reflects the selling price less costs to complete, costs of disposal and a reasonable element of profit for the selling effort by the acquiring company.
(d) Investments
Under UK GAAP, other investments include amounts in respect of Ordinary Shares (including ADSs) held by the employee trusts. Under US GAAP, these amounts would be treated as Treasury Stock and deducted from Shareholders’ funds.
(e) Restructuring costs
Under UK GAAP, provisions are made for restructuring costs once a detailed formal plan is in place and valid expectations have been raised in those affected that the restructuring will be carried out. Provision is made for voluntary redundancy payments to the extent that it is expected that volunteers will come forward. US GAAP requires a number of specific criteria to be met before restructuring costs can be recognised as an expense. Also, to the extent restructuring costs are related to the activities of an acquired company, US GAAP allows them to be recognised as a liability upon acquisition provided certain specific criteria are met whereas UK GAAP does not. Accordingly, timing differences arise between UK GAAP and US GAAP recognition of restructuring costs.
(f) Pension and other post retirement benefits
Under the Group’s accounting policy for post employment benefits, in accordance with SSAP 24, pension costs are charged to the profit and loss account on a systematic basis over the service life of employees based on consultation with actuaries and using the projected unit credit method and a set of long-term actuarial assumptions.
Under US GAAP, pension costs and liabilities are calculated in accordance with SFAS No. 87 Employers’ Accounting for Pensions. This standard requires the use of the projected unit credit method and prescribes, in particular, the use of a market-related discount rate. This is not the same as the long-term approach used under SSAP 24.
(g) Share compensation
Under UK GAAP, the cost of share option plans are amortised based on the cost of the shares (including ADSs) acquired by the employee trusts to fulfil the plan, less the amount contributed by the employee. Under US GAAP, compensation for fixed plan awards is determined at the date of grant, based on the cost of the fair value of the shares subject to the award, less the option exercise or purchase price, if any, except for allowable discounts with respect to certain qualified plans where the discount is no greater than 15% of the fair value of the shares. Compensation costs for variable plan awards is estimated at the end of each period from the date of grant to the date final compensation costs are determinable based on the difference between the fair value of the shares subject to the award and the option exercise or purchase price. Such cost is allocated to compensation expense over the vesting period and, if performance criteria are applicable to the award, based on actual performance attained.
82
Under UK GAAP, the proposed dividends on Ordinary Shares, as recommended by the Directors, are deducted from Shareholders’ equity and shown as a liability in the balance sheet at the end of the period to which they relate, including proposed dividends which have been recommended but not yet approved by shareholders. Under US GAAP, such dividends are only deducted from Shareholders’ equity at the date of declaration of the dividend.
(i) Derivative instruments
The Group’s foreign currency, interest rate and commodity contracts hedge forecast exposures that do not meet the US GAAP hedge accounting criteria. Under US GAAP, these contracts are marked to market at the balance sheet date and gains and losses arising are included in net income. Under UK GAAP, these gains and losses can be deferred until the hedged transactions actually occur.
The Group may enter into foreign currency contracts to hedge the purchase price consideration on certain acquisitions. Under UK GAAP, the gains and losses arising on these foreign currency contracts are recognised in the purchase price consideration. Under US GAAP, the gains and losses arising on these foreign currency contracts are recognised within net income.
(j) Deferred taxation
The Group adopted FRS 19 – Deferred Tax in the year ended 31 August 2002. FRS 19 brings accounting for deferred tax under UK GAAP conceptually closer to US GAAP, although some differences remain. Following the Group’s restatement under FRS 19, and other than the tax effect of other UK to US GAAP differences, there is only one material difference between UK GAAP and US GAAP. This difference relates to the recognition criteria for recording deferred tax assets under US GAAP and UK GAAP. Under US GAAP, the calculation of current and deferred tax assets is based on the probable tax treatment of the tax position taken. Once it is determined that there is a probable deferred tax asset, it is then reduced by a valuation allowance to the extent it is deemed more likely than not (a likelihood of more than 50%) that some portion or all of the deferred tax asset will not be realised.
Under UK GAAP, both the existence of the asset and the probability of its recoverability are considered in combination, and a deferred tax asset is recognised only to the extent that its existence and recoverability are probable (a threshold which is higher than ‘more likely than not’).
(k) Exceptional items
Under UK GAAP, exceptional items are those that, by virtue of their size or nature, the Board of Directors believes should be separately disclosed. Such items are included within the profit and loss account heading and disclosed in the notes to the consolidated financial statements. Under US GAAP, there is no such concept as exceptional items. Exceptional items would not be considered extraordinary or non-operating items under US GAAP.
(l) Mexican excise rebate
Under UK GAAP, we are recognising the amount due when offset against future excise duty and other taxes payable. Under US GAAP, the Mexican excise rebate was recognised upon the issuance of a favourable court judgment and additional interest and inflation adjustments are recognised as they accrue.
(m) Liabilities
The Group is contractually obligated to make a payment to a business venture partner upon termination of the venture which, unless renewed, is scheduled to terminate in 2029. Under UK GAAP, the Group records the obligation at the present value of the payment obligation, discounted at a risk-adjusted rate to reflect the time value of money, and recognises interest expense each period such that the recorded obligation will equal the payment obligation at the currently best estimated scheduled maturity. Under US GAAP, the obligation is recorded at the amount payable at maturity (i.e. undiscounted).
(n) Franchise income
The Group has entered into agreements to sell the right to develop multiple stores within a specified territory, which entitles the Group to non-refundable franchise fees. Under UK GAAP, these franchise fees are recognised upon signing of the agreement. Under US GAAP, the revenue recognition is based on store openings or until the rights to develop the territory have been forfeited.
83
US GAAP reconciliation
|
|
|
| Year to |
| Year to |
|
|
| Note |
| £m |
| £m |
|
Profit earned for Ordinary Shareholders in accordance with UK GAAP |
|
|
| 340 |
| 392 |
|
Adjustments to conform with US GAAP: |
|
|
|
|
|
|
|
Brands |
| (a | ) | — |
| — |
|
Goodwill |
| (a | ) | 42 |
| 38 |
|
Other intangible assets |
| (a | ) | (3 | ) | (4 | ) |
Stocks |
| (c | ) | (22 | ) | (66 | ) |
Restructuring costs |
| (e | ) | (7 | ) | 4 |
|
Pension costs and other post retirement benefits |
| (f | ) | 20 |
| 28 |
|
Share compensation |
| (g | ) | 5 |
| — |
|
Derivative instruments |
| (i | ) | (61 | ) | 90 |
|
Mexican excise rebate |
| (l | ) | (40 | ) | (54 | ) |
Franchise income |
| (n | ) | (10 | ) | (9 | ) |
Other |
|
|
| (3 | ) | (1 | ) |
Deferred taxation – other |
| (j | ) | (11 | ) | (40 | ) |
Deferred taxation – on above US GAAP adjustments |
| (j | ) | 30 |
| 28 |
|
Minority share of above adjustments |
|
|
| — |
| — |
|
Net income in accordance with US GAAP |
|
|
| 280 |
| 406 |
|
Other comprehensive income: |
|
|
|
|
|
|
|
Minimum pension liability |
|
|
| (61 | ) | (203 | ) |
Currency translation differences |
|
|
| 78 |
| (130 | ) |
Comprehensive income in accordance with US GAAP |
|
|
| 297 |
| 73 |
|
Net earnings per Ordinary Share |
|
|
|
|
|
|
|
Basic |
|
|
| 26.0 | p | 38.1 | p |
Diluted |
|
|
| 26.0 | p | 38.0 | p |
Shareholders’ equity
|
|
|
| Year to |
| Year to |
|
|
| Note |
| £m |
| £m |
|
Shareholders’ funds as reported in the Group balance sheet |
|
|
| 918 |
| 706 |
|
Adjustments to conform with US GAAP: |
|
|
|
|
|
|
|
Brands |
| (a | ) | 1,408 |
| 1,410 |
|
Goodwill |
| (a | ) | 227 |
| 185 |
|
Other intangible assets – costs |
| (a | ) | 166 |
| 168 |
|
Other intangible assets – accumulated amortisation |
| (a | ) | (145 | ) | (144 | ) |
Associated undertakings |
| (b | ) | 57 |
| 57 |
|
Stock |
| (c | ) | 23 |
| 45 |
|
Investments |
| (d | ) | (129 | ) | (93 | ) |
Restructuring costs |
| (e | ) | 1 |
| 8 |
|
Pension and other post retirement benefits |
| (f | ) | (620 | ) | (555 | ) |
Share compensation |
| (g | ) | 6 |
| 1 |
|
Proposed dividends |
| (h | ) | 93 |
| 88 |
|
Derivative instruments |
| (i | ) | (18 | ) | (26 | ) |
Mexican excise rebate |
| (l | ) | — |
| 40 |
|
Liabilities |
| (m | ) | (42 | ) | (38 | ) |
Franchise income |
| (n | ) | (19 | ) | (9 | ) |
Other |
|
|
| 8 |
| 6 |
|
Deferred taxation – other |
| (j | ) | — |
| 11 |
|
Deferred taxation – on above US GAAP adjustments |
| (j | ) | (277 | ) | (319 | ) |
Minority share of above adjustments |
|
|
| — |
| — |
|
Shareholders’ equity in accordance with US GAAP |
|
|
| 1,657 |
| 1,541 |
|
84
Principal subsidiaries and associates
Allied Domecq PLC is the holding company of the Group. We have over 500 subsidiaries incorporated in over 50 countries. We have a 100% equity interest in all of our principal subsidiaries. We list those subsidiaries as at 31 August 2003 below together with their country of incorporation and operation.
Name |
| Country of incorporation and operation |
Allied Domecq (Holdings) PLC |
| England & Wales |
Allied Domecq Spirits & Wine Holdings PLC |
| England & Wales |
Allied Domecq Spirits & Wine Limited |
| England & Wales |
Allied Domecq Financial Services PLC |
| England & Wales |
Allied Domecq Overseas Limited |
| England & Wales |
Allied Domecq Overseas (Canada) Limited |
| England & Wales |
Allied Domecq Overseas Holdings Limited |
| Cayman Islands |
Allied Domecq Overseas (Europe) Limited |
| England & Wales |
Allied Domecq International Holdings B.V. |
| Netherlands |
Allied Domecq Netherlands B.V. |
| Netherlands |
Allied Domecq Luxembourg Holdings S.a.r.l. |
| Luxembourg |
Allied Domecq Luxembourg S.a.r.l. |
| Luxembourg |
Allied Domecq Canada Limited |
| Canada |
Hiram Walker-Gooderham & Worts Limited |
| Canada |
Allied Domecq North America Corp. |
| USA |
Allied Domecq Spirits & Wine Americas, Inc. |
| USA |
Allied Domecq Spirits & Wine USA, Inc. |
| USA |
The Group also has companies/investments in a number of other countries including Argentina, Australia, Austria, Barbados, Bolivia, Bosnia, Brazil, Bulgaria, Chile, China, Colombia, Croatia, Czech Republic, Denmark, Estonia, Finland, France, Germany, Greece, Hong Kong, Hungary, Iceland, India, Italy, Jamaica, Japan, Malaysia, Madeira, Mexico, New Zealand, Norway, Philippines, Poland, Portugal, Romania, Scotland, Singapore, Slovak Republic, Slovenia, South Korea, Spain, Sweden, Switzerland, Taiwan, Thailand, Uruguay, Venezuela, Vietnam and Yugoslavia.
Other than Allied Domecq (Holdings) PLC, none of the principal subsidiaries and associates listed are directly owned by Allied Domecq PLC. A complete list of subsidiaries will be included in the Company’s next annual return.
Other interest
The Group has an investment in Britannia Soft Drinks Limited (25% equity interest).
85
Analysis of shareholdings
The tables below show an analysis of Ordinary Shareholdings as at 31 August 2003:
|
| Holders |
| % |
| Shares held |
| % |
|
Private holders |
| 37,214 |
| 86.02 |
| 51,954,580 |
| 4.70 |
|
Corporate holders |
| 6,048 |
| 13.98 |
| 1,054,615,734 |
| 95.30 |
|
|
| 43,262 |
| 100.00 |
| 1,106,570,314 |
| 100.00 |
|
Number of shares held: |
|
|
|
|
|
|
|
|
|
1–10,000 |
| 41,561 |
| 96.07 |
| 49,218,240 |
| 4.45 |
|
10,001–50,000 |
| 863 |
| 1.99 |
| 18,542,175 |
| 1.68 |
|
50,001–250,000 |
| 412 |
| 0.95 |
| 49,677,503 |
| 4.49 |
|
250,001–1,000,000 |
| 257 |
| 0.60 |
| 130,374,261 |
| 11.78 |
|
Over 1,000,000 |
| 169 |
| 0.39 |
| 858,758,135 |
| 77.60 |
|
|
| 43,262 |
| 100.00 |
| 1,106,570,314 |
| 100.00 |
|
Financial calendar
Ex dividend date for final dividend |
| 7 January 2004 |
Record date for final dividend |
| 9 January 2004 |
Annual General Meeting |
| 30 January 2004 |
Final dividend payable (Ordinary Shares) |
| 4 February 2004 |
Final dividend payable (ADRs) |
| 11 February 2004 |
Interim results announced (provisional) |
| 22 April 2004 |
Ex dividend date for interim dividend (provisional) |
| 30 June 2004 |
Record date for interim dividend (provisional) |
| 2 July 2004 |
Interim dividend payable (Ordinary Shares) (provisional) |
| 30 July 2004 |
Interim dividend payable (ADRs) (provisional) |
| 6 August 2004 |
Annual General Meeting
The AGM of the company will be held at 2.00pm on 30 January 2004 at the Hotel Inter-Continental London, One Hamilton Place, Hyde Park Corner, London W1J 7QY. The Notice of Meeting is set out in the Chairman’s Letter to shareholders.
86
Shareholder enquiries
UK – Registrars
Enquiries relating to administrative matters should be addressed to the Company’s Registrar at:
Computershare Investor Services PLC,
PO Box 82, The Pavilions,
Bridgwater Road,
Bristol BS99 7NH, UK
Tel: +44 (0)870 702 0000
Electronic communication
Allied Domecq offers shareholders the opportunity to receive corporate documents such as the Report and Accounts and Notices of Meetings in electronic form. If you choose to take advantage of this you will receive an e-mail notification each time a publication is made on the corporate website.
To register to receive shareholder communications in this way and not receive printed copies by post please follow the instructions below to record your e-mail address:
1. Log on to www.allieddomecq.com
2. Click on Investor Relations
3. Click on Shareholder Services
4. Click on Registrar Services
5. Click on Online Shareholder Services
6. Enter your personal details – Shareholder Reference Number (this is the 11 – digit number printed on your form of proxy), surname, country or postcode, and click on the arrow
7. Select Shareholder Communications
8. Read the Terms and Conditions and, if you agree to them, press ‘enter’
9. Register your e-mail address and click ‘go’
If you do not register an e-mail address you will continue to receive all future shareholder communications in paper form through the post as before. If you decide to register you will be able to change your instruction or request paper copies of shareholder information at any time. It is your responsibility to notify Computershare Investor Services PLC of any change in your contact details. Your e-mail address can be changed on-line, but any change to your name or postal address must be notified in writing to Computershare Investor Services PLC.
[LOGO]
USA – ADR administration
The Depositary Bank is the JPMorgan Chase Bank and enquiries on ADR holdings should be made to:
JPMorgan Chase Bank,
P O Box 43013, Boston,
MA 02940-3013, USA.
Tel: +1 781 575 4328
e-mail: adr@jpmorgan.com
Website: www.adr.com/shareholder
Company Secretary and Registered Office
Other enquiries should be addressed to:
The Secretariat,
Allied Domecq PLC,
The Pavilions, Bridgwater Road,
Bedminster Down, Bristol BS13 8AR, UK.
Tel: +44 (0)117 978 5000
Institutional shareholder enquiries
Institutional shareholder enquiries should be addressed to:
Peter Durman, Director of Investor Relations, at the Registered office.
Tel: +44 (0)117 978 5753
e-mail: investor.relations@adsweu.com
Environment and alcohol issues
For further details about our environmental and alcohol policies and related literature, please write to:
Jan Buckingham,
Director of Alcohol and Social Policy,
at the Registered Office.
Internet
Corporate information, including press releases, Annual Reports and presentations, can be downloaded from the Group’s website at www.allieddomecq.com
Share price quotation
For information on the market prices of the Company’s Ordinary Shares and ADRs, please refer to the investor relations section of the Group’s website.
Low cost dealing service
For information on a low cost dealing service for shareholders, please refer to the Group’s website at www.allieddomecq.com or contact the Secretariat at the Registered Office (details above).
87
Advertising and promotion (A&P)
Expenditure on advertising and promotion of brands.
Associated undertaking
An entity in which the Group is able to exercise significant influence, normally by controlling more than 20% of the voting rights.
BMC
Brand Market Combination. For example, Ballantine’s in Spain is a BMC.
Bulk sales
Sales of unbottled/unbranded spirit sold in bulk to other spirits and wine producers.
Constant actual exchange
Profits or earnings where the prior year results of operations outside the UK are stated in sterling at the current year weighted average exchange rate to give a constant measure of growth year on year.
Core brands
The global priority brands are Ballantine’s, Beefeater, Canadian Club, Courvoisier, Kahlúa, Maker’s Mark, Malibu, Sauza and Tia Maria.
Dividend cover
Earnings per share divided by dividends per share, to assess the Group’s ability to pay dividends.
Earnings per share (EPS)
Profit for the year after tax and minority interests (Earnings) divided by the average number of shares.
EBITA
Earnings Before Interest and Tax and Amortisation of intangible fixed assets.
EBITDA
Earnings Before Interest, Tax, Depreciation of tangible fixed assets and Amortisation of intangible fixed assets.
Exceptional items
Gains or costs that are disclosed separately because they arise outside the normal business activity.
Franchising
Business where individuals and/or corporations are provided with the rights to market a specific company’s goods and/or services in a designated area for adesignated fee.
Free cash flow
Operating cash less taxation, interest and dividends paid to shareholders and minority interest.
Gearing – enterprise value (EV)
Net debt expressed as a percentage of the total of the Group’s market capitalisation plus net debt.
Goodwill
The difference between the price paid for an acquisition and the fair value of the assets and liabilities acquired.
Liquid resources
Liquid resources comprise short-term deposits which have maturity dates of less than three months.
Local market leaders
These are brands that have a strong position in a particular market. These will include such brands as Stolichnaya and Hiram Walker Liqueurs in the US; Mexican brandies; Whisky DYC and Centenario in Spain; Imperial in Korea; Fundador in the Philippines; Teacher’s in the UK and Kuemmerling in Germany. These brands fall into two categories: those that deliver critical mass in key markets and those that provide an opportunity for strong value growth.
Market capitalisation
The price of one of the Company’s Ordinary Shares multiplied by the number of shares in issue.
Net brand contribution (NBC)
A measure of brand profitability before overhead costs but after A&P has been allocated.
Net turnover
Gross turnover excluding excise duty.
Normalised
Profits or earnings before exceptional items and goodwill excluding discontinued operations.
Ready-to-drink (RTD)
These are drinks which are sold in a premixed format.
Reserves
Mainly profits and surpluses retained within the business.
Return on investment (ROI)
Trading profit after tax expressed as a percentage of the average and total of capital and reserves plus net debt and goodwill written off.
Same store sales
Sales from established stores that have traded for at least two years and therefore the year on year comparison is not distorted by openings and closings.
Subsidiary undertaking
An entity in which the Group exercises a dominant influence, normally by controlling more than 50% of the voting rights.
Trade working capital
Trade working capital comprises total stock plus trade debtors less trade creditors.
88
Designed and produced by williams and phoa Photography by Lee Funnell
Printed in the UK on paper made from 50% pulp, 50% recycled fibres and is biodegradable.
© 2003 Allied Domecq PLC. All rights reserved. All brands mentioned in this Annual Report are trademarks and are registered and/or otherwise protected in accordance with applicable law.
Allied Domecq PLC
The Pavilions
Bridgwater Road
Bedminster Down
Bristol
BS13 8AR
UK
Registered number: 3771147
Telephone: +44 (0)117 978 5000
www.allieddomecq.com