Exhibit 99.1

Contents
| |
| |
| |
| |
| |
Key messages |
|
| |
| |
| |
Statement of directors’ responsibilities and Board committees |
|
| |
| |
| |
| |
| |
| |
| |
| |
| |
| |
| |
| |
| |
| |
| |
|
Cautionary statement regarding forward-looking information:
Some statements in this Annual Report contain ‘forward-looking’ statements as defined in Section 21E of the United States Securities Exchange Act of 1934. They represent our expectations for our business, and involve risks and uncertainties. You can identify these statements by the use of words such as ‘believes’, ‘expects’, ‘may’, ‘will’, ‘should’, ‘intends’, ‘plans’, ‘anticipates’, ‘estimates’ or other similar words. We have based these forward-looking statements on our current expectations and projections about future events. We believe that our expectations and assumptions with respect to these forward-looking statements are reasonable. However, because these forward-looking statements involve known and unknown risks, uncertainties and other factors which are in some cases beyond our control, our actual results or performance may differ materially from those expressed or implied by such forward-looking statements.
Explanatory notes:
Comparative information in the Operating and Financial Review is based on constant exchange rates. Net turnover is turnover after deducting excise duties. Profit and normalised earnings are stated before goodwill and exceptional items. Volumes are quoted in nine-litre cases unless otherwise specified.
Brands:
All brands mentioned in this Annual Report are trademarks and are registered and/or otherwise protected in accordance with applicable law.
Allied Domecq
…is a dynamic marketing-led brands company. We operate globally in the businesses of Spirits & Wine and Quick Service Restaurants. We will deliver growth through a relentless focus on maximising our portfolio, our presence and the talents of our people. There’s a lot happening at Allied Domecq. It’s time to take a new look…
1
…we operate globally building powerful, exciting brands that drive profitable growth and strong consistent cash flows. By building and innovating our brand portfolio through effective marketing, we will retain consumers who enjoy our brands and attract and excite new consumers to win greater market share.
Spirits & Wine
Allied Domecq Spirits &Wine operates through over 50 businesses worldwide, and owns or controls distribution of approximately 90% of our sales volume. We own or distribute 14 of the top 100 international premium spirit brands and our brand portfolio commands world No.1 or No.2 positions in six leading categories.
Core brands
We focus on nine core brands which account for over half of our Spirits & Wine profit.
|
|
|
|
|
|
|
|
|
|
|
|
Ballantine’s |
| Beefeater |
| Canadian Club |
|
|
|
|
|
|
|
Key markets: |
| Key markets: |
| Key markets: |
|
|
|
|
|
|
|
|
|
|
|
|
Courvoisier |
| Kahlúa |
| Maker’s Mark |
| Malibu |
| Sauza |
| Tia Maria |
|
|
|
|
|
|
|
|
|
|
|
Key markets: |
| Key markets: |
| Key market: |
| Key markets: |
| Key markets: |
| Key markets: |


Premium wine
We are successfully building and running an international business in premium branded wines. Our focus is driving growth in key markets through a specialist sales capability and, where appropriate, leveraging synergies through our existing distribution.
|
|
|
|
|
|
|
|
|
|
|
|
|
|
|
|
|
|
California - US |
| New Zealand |
| Champagne - France |
| Bodegas y Bebidas - |
| Argentina |
|
|
|
|
|
|
|
|
|
Key brands: |
| Key brands: |
| Key brands: |
| Key brands: |
| Key brands: |
2
Quick Service Restaurants
Our Quick Service Restaurants business comprises three great brands and is among the top five in the industry with over 12,000 franchised outlets worldwide. The principal locations are in the US, Canada, Japan, South Korea and the Philippines.
|
|
|
|
|
|
|
|
|
|
Dunkin’ Donuts |
| Baskin-Robbins |
| Togo’s |
The world’s largest coffee and baked goods chain operates in over 28 countries |
| The world’s largest ice cream franchise operates in over 50 countries |
| The legendary Californian sandwich shop |
|
|
|
|
|
|
|
|
| >420 distribution points |
No.1 in the US for serving coffee, donuts, bagels and muffins |
| No.1 in the US for serving ice cream |
|
|


3
…we operate globally in over 50 markets. We have increased our exposure to key markets through investment in distribution and sales capabilities. Our focus is on capitalising existing market strengths and building positions in growth markets. Through prioritising, developing and extending our geographic presence, we will establish strong positions in key markets across the world.
North America |
|
|
|
|
|
|
| Key markets: |
| Turnover: |
|
| US, Canada |
| £720m |
| |
|
|
|
|
| |
| Key brands: |
| Net turnover: |
| |
| Kahlúa, Stolichnaya, |
| £632m |
| |
| Beefeater, Sauza, |
|
|
| |
| Canadian Club, |
| Trading profit: |
| |
| Courvoisier, Malibu, |
| £183m |
| |
| Maker’s Mark |
|
|
| |
|
|
|
|
| |
|
|
|
|
| |
|
|
|
|
|
|
Latin America |
|
|
|
|
|
|
| Key markets: |
| Turnover: |
|
| Mexico, Argentina, |
| £332m |
| |
| Brazil |
|
|
| |
|
|
| Net turnover: |
| |
| Key brands: |
| £268m |
| |
| Sauza, Presidente, |
|
|
| |
| Don Pedro, |
| Trading profit: |
| |
| Ballantine’s, Anejo |
| £44m |
| |
| Los Reyes, Azteca |
|
|
| |
| de Oro |
|
|
| |
|
|
|
|
| |
|
|
|
|
|
|
QSR |
|
|
|
|
|
|
| Key markets: |
| Turnover: |
|
| US, Canada, Japan, |
| £226m |
| |
| South Korea, |
|
|
| |
| Philippines |
| Net turnover: |
| |
|
|
| £226m |
| |
| Key brands: |
|
|
| |
| Dunkin’ Donuts, |
| Trading profit: |
| |
| Baskin-Robbins, |
| £86m |
| |
| Togo’s |
|
|
| |
|
|
|
|
|
|
Europe |
|
|
|
|
|
|
| Key markets: |
| Turnover: |
|
| Spain, UK, France, |
| £1,069m |
| |
| Germany |
|
|
| |
|
|
| Net turnover: |
| |
| Key brands: |
| £734m |
| |
| Ballantine’s, |
|
|
| |
| Malibu, Beefeater, |
| Trading profit: |
| |
| Tia Maria, Whisky |
| £139m |
| |
| DYC, Courvoisier |
|
|
| |
|
|
|
|
| |
|
|
|
|
|
|
Asia Pacific |
|
|
|
|
|
|
| Key markets: |
| Turnover: |
|
| South Korea, |
| £320m |
| |
| Japan, Australia, |
|
|
| |
| Philippines |
| Net turnover: |
| |
|
|
| £226m |
| |
| Key brands: |
|
|
| |
| Ballantine’s, |
| Trading profit: |
| |
| Imperial, Fundador, |
| £68m |
| |
| Kahlúa |
|
|
| |
|
|
|
|
| |
|
|
|
|
| |
|
|
|
|
|
|
Premium Wine |
|
|
|
|
|
|
| Key markets: |
| Turnover: |
|
| US, New Zealand, |
| £517m |
| |
| Spain, UK, France, |
|
|
| |
| Argentina |
| Net turnover: |
| |
|
|
| £475m |
| |
| Key brands: |
|
|
| |
| Clos du Bois, Mumm, |
| Trading profit: |
| |
| Perrier Jouët, |
| £98m |
| |
| Montana, Iverus, |
|
|
| |
| Bodegas Artesanas |
|
|
|


Net turnover by business area%
Total £2,611m
|
| Spirits & Wine |
| £m |
| % |
|
|
|
1 |
| North America |
| 632 |
| 24 |
|
|
|
2 |
| Europe |
| 734 |
| 28 |
|
| |
3 |
| Latin America |
| 268 |
| 10 |
|
| |
4 |
| Asia Pacific |
| 226 |
| 9 |
|
| |
5 |
| Premium Wine |
| 475 |
| 18 |
|
| |
6 |
| Other |
| 50 |
| 2 |
|
| |
7 |
| QSR |
| 226 |
| 9 |
|
| |
|
| Total |
| 2,611 |
|
|
|
|

Trading profit by business area %
Total £657m
|
| Spirits & Wine |
| £m* |
| % |
|
|
|
1 |
| North America |
| 183 |
| 29 |
|
|
|
2 |
| Europe |
| 139 |
| 22 |
|
| |
3 |
| Latin America |
| 44 |
| 7 |
|
| |
4 |
| Asia Pacific |
| 68 |
| 11 |
|
| |
5 |
| Premium Wine |
| 98 |
| 15 |
|
| |
6 |
| Other |
| 16 |
| 2 |
|
| |
7 |
| QSR |
| 86 |
| 14 |
|
| |
|
| Total |
| 634 |
|
|
|
|
* Excludes £23m of Britannia
4
…our 12,000 employees worldwide are the key to unlocking the value of our brands. We encourage our people to be passionate about our brands by providing opportunities for development, rewarding good performance and recognising achievement. By developing our people, harnessing their talents and being an ‘employer of choice’, we will attract and retain the best people to deliver our business goals.
Our people |
|
|
|
|
|
|
|
|
|
|
|
|
|
|
|
|
|
|
|
|
|
|
|
|
|
|
|
|
|
|
|
|
|
|
|
|
|
|
|
|
|
|
|
|
|
|
|
|
|
|
|
|
|
|
|
|
|
|
|
|
|
|
|
|
|
|
|
|
|
|
|
|
|
|
|
|
|
|
|
|
|
|
|
|
|
|
|
|
|
|
|
|
|
|
|
|
|
|
|
|
|
|
|
|
|
|
|
|
|
|
|
|
|
|
|
|
|
|
|
|
Ed Valle |
| Sandy Mayo |
| Allison O’Hanlon |
| Keith Seard |
| Katie Duncan |
| Luis Alfonso Diaz |


5
Financial highlights
|
| 2004 |
| Restated |
| Growth |
| Growth at |
| ||
|
|
|
|
|
| % |
| % |
| ||
|
|
|
|
|
|
|
|
|
| ||
Spirits & Wine net turnover |
| £ | 2,385 | m | £ | 2,387 | m | 0 |
| 5 |
|
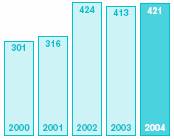
Marketing investment behind Spirits & Wine |
| £ | 421 | m | £ | 413 | m | 2 |
| 6 |
|
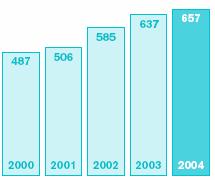
Group trading profit |
| £ | 657 | m | £ | 637 | m | 3 |
| 11 |
|
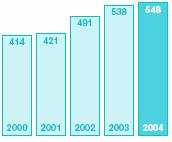
Group profit before tax |
| £ | 521 | m | £ | 491 | m | 6 |
| 15 |
|
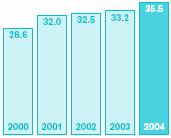
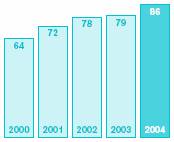
Normalised earnings per share |
| 35.5 | p | 33.2 | p | 7 |
| 16 |
| ||
Dividend |
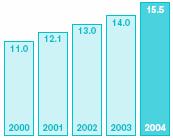
| 15.5 | p | 14.0 | p | 11 |
|
|
| ||
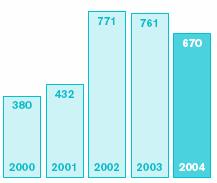
Net cash flow from operating activities |
| £ | 655 | m | £ | 702 | m |
|
|
|
|
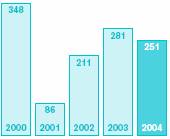
Free cash flow (after dividends) |
| £ | 251 | m | £ | 243 | m |
|
|
|
|
Figures are stated before goodwill and exceptional items. Figures for the year ended 31 August 2003 have been restated for ‘FRS 17 – Retirement benefits’, ‘UITF 38 – Accounting for ESOP Trusts’ and ‘FRS 5 – Reporting the substance of transactions – Application Note G’, see page 33. Cash flow from operating activities excludes the pre-tax benefit of the Mexican excise rebate (2004: £nil; 2003: £46m); free cash flow excludes the post-tax benefit (2004: £nil; 2003: £38m).
Business highlights
Spirits & Wine
• Volumes up 2%
• Net turnover up 5%
• Marketing spend up 6%
• Net brand contribution up 4%
• Trading profit up 9%
Core brands
• Volumes up 8%
• Net turnover up 7%
• Marketing spend up 9%
• Net brand contribution up 7%
Premium wine
• Volumes flat
• Net turnover up 7%
• Marketing spend up 9%
• Trading profit up 13%
Quick Service Restaurants
• Distribution points up 6%
• Combination stores up 18%
• System-wide sales up 12%
• Trading profit up 21%
Delivering improved efficiencies and cash flow
• Efficiency improvements – overheads flat, benefiting from restructuring activities
• Strong cash generation – £251m free cash flow (£407m before dividends)
• Continued debt reduction – £471m reduction
Normalised earnings per share |
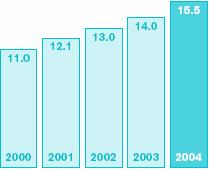
| Dividends per Ordinary Share |
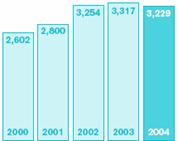
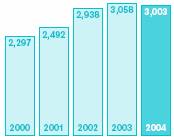
| Turnover £m* |
|
pence* |
| pence |
|
|
|
|
|
|
|
|
|
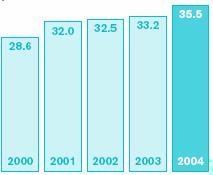
Figures here and in the Operating and Financial Review are stated before goodwill and exceptional items, and comparative information is based on constant exchange rates unless otherwise specified. All five-year graphs are at reported rates. *Turnover, trading profit and earnings per share for 2001 to 2003 have been restated for the impact of ‘FRS 17 – Retirement benefits’ and ‘Application Note G – revenue recognition’ an amendment to ‘FRS 5 – Reporting the substance of transactions’.
6

These results reflect the continued transformation of Allied Domecq into a business that can drive sustained brand growth and improving earnings. This has been achieved against a background of challenging economies and adverse foreign exchange movements. Reported earnings per share grew by 7% but on constant currencies, earnings per share were up 16%. This is the fifth year of earnings growth since the sale of the UK pub business in 1999. Over this time, earnings per share have grown by almost 60% and this has been achieved after absorbing over £100m of adverse foreign exchange and pension costs. This reflects the consistent underlying strength of the business.
The Spirits & Wine business was a key driver of these results with profits up 9% at constant currencies. We saw the strongest performances in the US and in Europe, supported by excellent growth from the core spirits brands with volumes up 8%. The strength of the core brand performance is a reflection of the sustained investment in brand building over the past few years. In addition, we have continued to revitalise the portfolio through innovation. For example, we launched the new Malibu flavours, mango and pineapple, which have delivered encouraging early results. We have also introduced premium brand extensions such as Ballantine’s Black, Stolichnaya Elit and Imperial 17 year old.
The premium wine brands also performed strongly with profits up 13% in spite of the challenges facing the wine industry in some markets around the world. We continue to benefit from the diversity that our broad geographic portfolio brings and from the strength of our brands and our sales and marketing capabilities. The portfolio has also benefited from innovation with the introduction of new brands and brand extensions. We are confident that the business remains firmly on track to meet our return on investment targets.
We own some of the world’s best known spirits and wine brands, as well as leading quick service restaurant brands. More importantly, we recognise that we have a duty to market our products responsibly and to encourage our consumers to drink responsibly. At Allied Domecq, we aim to go ‘beyond compliance’ and have developed a code of marketing practices that is being applied worldwide. It goes beyond existing legislation or voluntary codes and sets a standard if there is neither. In support, we have a marketing review board, with independent experts to ensure compliance with the code. We have also been rolling out responsible drinking messages as part of our advertising. Further information on these activities and other areas was published this year in our first social report.
Others have also recognised our progress in this area; for example, we continue to lead the beverages sector in the Business in the Community Corporate Responsibility Index.
It has also been an excellent year for our Quick Service Restaurants business, with profits up 21%. The key drivers have been strong like-for-like growth through innovation and new store openings. Same store sales growth at Dunkin’ Donuts has continued to outpace the industry, supported by its successful innovation programme around new coffee offerings such as latte, cappuccino and espresso. We have also continued to extend the presence of the brands across the US and internationally.
Allied Domecq today is a very different business from that of five years ago, with a stronger portfolio of brands and improved access to key growth markets. This good progress reflects the strength of the management team led by Philip Bowman and the valuable contribution made by all the employees at Allied Domecq.
/s/ Gerry Robinson |
|
| |
Sir Gerry Robinson | |
Chairman | |
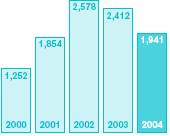
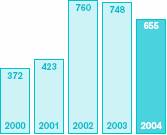
Trading profit £m* |
| Operating cash flow £m |
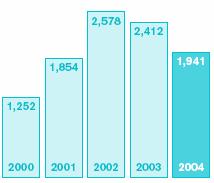
| Net debt £m |
|
|
|
|
|
|
|
|
|
|
|
|
|
7

8
a fresh twist
Let’s be straight about this. There has to be a point to being different. And for us that’s being brave. And quick. And nimble.
Take wine. People said you couldn’t make money out of it. So we went in worldwide. With good reason. Producing in five
countries on four continents. And the result? Profits up 13% this year.
9
10
investing in brands
Our business is about brands. We’re spending more on our core brands, and spending better, because consumers will pay a premium for a brand that they know and they trust. Increased sales, premium prices, higher margins, and faster growth mean more cash to continue investing. It’s a virtuous circle. It’s the lifeblood. It’s where the value comes from.
11

12
getting connected
It’s good to talk. But we prefer to listen. Hear what people tell us. Like what sort of coffee they want. And how quickly. And how they want it at a good price. And how it tastes better when the language is simple – like small, medium and large. And that’s why Dunkin’ Donuts sells more cups of coffee in the US than anyone else. Did you hear that?
13

14
round thinking

We bottle bubbles. Think bubbles. We find out what consumers want. See a need, like super-premium vodka in the US. We think around it. We could buy one. No. Let’s bottle Stolichnaya Elit. Or we see an opportunity in flavoured white spirits. We think about that too. And bottle Malibu in mango. Or maybe tempt Spain with a premium Scotch? Yes. Hola Ballantine’s Black.
15

16
switched on
Don’t get us wrong, we know what we’re doing. But we also know that whatever you do there’s a better way of doing it.
There always is. And that’s what we’re always looking for. The new way. The way beyond best practice. The process,
the thinking, the structure to give us an edge. No one here gets fired for challenging the status quo.
17

18
handle with care
You can’t be too careful selling alcohol. It’s not just another product. Of course we want people to enjoy our brands – but responsibly. And we lead by example, acting responsibly, promoting our brands to a stringent code of standards. Then we let an independent panel guard the code. They won’t let us challenge even the spirit of those standards. It’s not worth it.
19

20
the world over

There’s just one bottle of money and the whole world to spend it in. So we put some into markets like China where growth is high. We like the look of Russia and South America too. So they have some. Europe and the US have different needs. But we see where the best opportunities are and pour our resources accordingly.
21

22
working together
It doesn’t matter if you’ve got the greatest brands (which we have) and the greatest strategy (which we do). Unless you’ve also got the best people, you’re like a day-old doughnut. It’s people who unlock the value in the brands. It’s people who take the strategy and make it work. We know what our people are worth and where we’d be without them.
23
Operating and financial review

‘We have delivered earnings growth of 16% reflecting a strong performance from the core spirits brands and good profit growth from our premium wines and Quick Service Restaurants.’
Philip Bowman,
Chief Executive
Normalised earnings per share
Pence
Dividends per Ordinary Share
Pence
Summary
At constant currency, normalised earnings per share have grown by 16% and reported normalised earnings per share have increased by 7% to 35.5p. The three key drivers have been:
• The growth of Spirits & Wine gross profit, particularly from the core brands, which contributed the majority of the incremental gross profit;
• The good mix growth of the premium wine brands; and
• The strong growth in Quick Service Restaurants.
From a geographic perspective, the growth in Spirits & Wine profit has been driven by good trading in North America, a recovery involumes in Spain and strong value growth in the premium wine portfolio in the US and UK. This has been partly offset by declines in some markets in Western Europe and in Asia Pacific due to localeconomic and trading challenges. Encouragingly we stabilised the profit declines in Asia Pacific during the secondhalf. The Quick Service Restaurants business has delivered double-digit profit growth by implementing its strategy of driving same store sales growth, new store openings and cost efficiencies.
At constant exchange rates, Spirits & Wine net turnover grew £105m (5%) to £2,385m. However, Quick Service Restaurants turnover declined by £7m reflecting the final transition of Baskin-Robbins from producing and selling ice cream to US franchisees (which is now fully contracted out) to a wholly royalty-based model. Group turnover grew by 2% at constant exchange rates. Reported turnover for the Group declined by £88m (3%) to £3,229m of which £161m related to adverse year-on- year foreign exchange movements.
At constant currency, normalised profit before tax increased by 15%. Reported profit before tax increased 6% to £521m which reflects an adverse foreign currency translation and transaction movement of £38m on restating the profit for the prior period at this year’s rates.
The Directors are recommending a final dividend of 9.67p per share giving a total for the year of 15.5p, an increase of 11%.
Outlook
Looking ahead, we anticipate that the continued momentum of the core brands, supported by our focused marketing investment, will drive volume and turnovergrowth, as well as higher gross margins, even though certain markets remain challenging. The premium wine brands are on track to meet the five-year return on investment targets that we set out two years ago. We anticipate that further innovation and new store openings will continue to drive double-digit profit growth in our Quick Service Restaurants business. Together, this momentum will provide us with the platform to deliver continued earnings growth in 2005.
Business drivers
Our strategy is delivering good growth in the core spirits and premium wine brands and from Quick Service Restaurants. We focus on three areas to drive competitive advantage and sustainable future growth:
• Portfolio: By building and innovating our brand portfolio through effective marketing, we will retain consumers who enjoy our brands and attract and excite new consumers to win greater market share.
• Presence: Through prioritising, developing and extending our geographic presence, we will establish strong positions in key markets across the world.
• People: By developing our people, harnessing their talents and being an ‘employer of choice’, we will attract and retain the best people to deliver our business goals.
Our increased investment in these areas, particularly advertising and promotion, over the past four years is driving robust brand growth and strong financial results.
24

(1) Pepe Padilla
Operations
Spain
(2) Hugh Abedin-Zadeh
Audit Services
UK
(3) Hey-Won Kim
Logistics
Korea
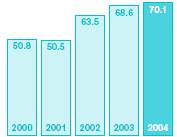
Spirits & Wine volumes
million cases
Spirits & Wine revenue
£m
Spirits & Wine advertising and promotion
£m
Spirits & Wine trading profit
£m
Spirits & Wine
|
| 2004 |
| 2003 |
| Growth |
| ||
|
|
|
|
|
| % |
| ||
Volume (9L cases) |
| 70.1 | m | 68.6 | m | 2 |
| ||
Net turnover |
| £ | 2,385 | m | £ | 2,280 | m | 5 |
|
Advertising and promotion |
| £ | 421 | m | £ | 396 | m | 6 |
|
Trading profit |
| £ | 548 | m | £ | 503 | m | 9 |
|
Spirits & Wine net turnover has increased through the growth of our core spirits brands and premium wine brands. Net turnover grew 5% with two percentage points from volume growth and three percentage points from price/mix improvements. Gross profit increased by £64m, or 5%, reflecting volume growth (£32m), price/mix improvements (£30m) and a lower cost of goods (£2m). The core brands and premium wines are the key drivers of the gross profit improvement.
Trading profit grew £45m (9%) after advertising and promotion investment increased by £25m (6%). Overheads were held flat even after investing significantlyin our sales and marketing capabilities in the US and behind the premium wine brands. This has been achieved by driving efficiency benefits from the restructuring of the Spirits & Wine operations. The increase in advertising and promotion spend has been directed behind selectedbrand market combinations, particularly Sauza in the US and Mexico, Ballantine’s in Spain, Malibu in the US and Spain, Kahlúa in the US, Whisky DYC in Spain and Imperial in South Korea. This continues to reflect the rigorous way in which we allocate spend behind brands and markets; directing more behind the core brands including new campaigns and innovation, and withdrawing spend from less effective areas. As a result,we are continuing to achieve greater impact from our marketing investment.
Brand review
We manage the Spirits & Wine portfolio as four groups: core brands, local market leaders, premium wine and other Spirits &Wine brands.
Core brand volumes grew 8% and net turnover increased by 7% driven by strong growth across nearly all the brands. There is one percentage point of mix dilutioncaused by the successful growth of the lower margin ready-to-drink extensions, which grew volumes by 15%. Excluding the ready-to-drinks, core brand volumes and net turnover both grew by 7%. Advertisingand promotion behind the core brands was up 9% resulting in net brand contribution increasing by 7%.
Spirits & Wine volume and net turnover growth
|
| Volume |
| Volume |
| Net |
|
|
|
|
| % |
| % |
|
Core brands |
|
|
|
|
|
|
|
Ballantine’s |
| 5.9 |
| 6 |
| 6 |
|
Beefeater |
| 2.4 |
| 8 |
| 10 |
|
Canadian Club |
| 2.6 |
| 7 |
| 0 |
|
Courvoisier |
| 1.1 |
| 3 |
| 3 |
|
Kahlúa |
| 3.0 |
| (1 | ) | 2 |
|
Maker’s Mark |
| 0.5 |
| 10 |
| 15 |
|
Malibu |
| 3.0 |
| 17 |
| 15 |
|
Sauza |
| 2.9 |
| 20 |
| 16 |
|
Tia Maria |
| 0.8 |
| (11 | ) | (13 | ) |
Core brands |
| 22.2 |
| 8 |
| 7 |
|
|
|
|
|
|
|
|
|
Local market leaders |
| 11.7 |
| (2 | ) | (2 | ) |
|
|
|
|
|
|
|
|
Premium wine |
| 15.6 |
| 0 |
| 7 |
|
|
|
|
|
|
|
|
|
Other Spirits & Wine brands |
|
|
|
|
|
|
|
Other spirits |
| 12.7 |
| 0 |
| 4 |
|
Other wine |
| 7.9 |
| 5 |
| 3 |
|
Other Spirits & Wine total |
| 20.6 |
| 2 |
| 3 |
|
Total |
| 70.1 |
| 2 |
| 5 |
|
The core brands are key drivers of gross profit growth with their premium positioning commanding high margins. The average gross profit per case of the core brands is more than twice that of the rest of the portfolio. As a result, they contributed the majority of the incremental Spirits & Wine gross profit. Ballantine’s and Beefeater grew well reflecting a recovery in volumes in Spain. Canadian Club volumes grew 7% with flat turnover growth reflecting the price repositioning in the US and mix dilution
25
Operating and financial review

Spirits & Wine volumes
70.1m nine-litre cases
|
|
|
|
| % |
|
| 1 | Core brands |
| 32 |
| |
2 | Local market leaders |
| 17 |
| ||
3 | Premium wine |
| 22 |
| ||
4 | Other Spirits & Wine |
| 29 |
| ||
|
|
|
|
| ||
|
|
|
|
|
|
Spirits & Wine net turnover |
|
|
|
|
|
|
£2,385m |
|
|
|
|
|
|
|
|
|
|
|
|
|
|
|
|
|
| % |
|
| 1 | Core brands |
| 44 |
| |
| 2 | Local market leaders |
| 17 |
| |
| 3 | Premium wine |
| 19 |
| |
| 4 | Other Spirits & Wine |
| 20 |
| |
|
|
|
|
|
| |
|
|
|
|
|
| |
|
|
|
|
|
|

Spirits & Wine advertising and promotion |
|
|
| |||
£421m |
|
|
|
|
|
|
|
|
|
|
|
|
|
|
|
|
|
| % |
|
| 1 | Core brands |
| 59 |
| |
| 2 | Local market leaders |
| 16 |
| |
| 3 | Premium wine |
| 11 |
| |
| 4 | Other Spirits & Wine |
| 14 |
| |
|
|
|
|
|
| |
|
|
|
|
|
| |
|
|
|
|
|
| |
Spirits & Wine net brand contribution |
|
|
| |||
£1,011m |
|
|
|
|
|
|
|
|
|
|
|
|
|
|
|
|
|
| % |
|
| 1 | Core brands |
| 50 |
| |
| 2 | Local market leaders |
| 17 |
| |
| 3 | Premium wine |
| 15 |
| |
| 4 | Other Spirits & Wine |
| 18 |
| |
|
|
|
|
|
| |
|
|
|
|
|
| |
|
|
|
|
|
| |
from the growth of ready-to-drinks in Australia. Excluding the ready-to-drinks, Canadian Club volumes grew 3% on net turnover down 1%. Courvoisier grew both volumes and net turnover by 3% reflecting good growth in the UK. Kahlúa volumes fell by 1% but price/mix improved net turnover by 2%. Price increases on Maker’s Mark helped to grow net turnover 15% while volumes were up 10%. Malibu grew volumes 17% and net turnover by 15% reflecting a mix dilution from the successful growth of ready-to-drinks in Australia. Excluding the ready-to-drinks, volumes and net turnover both grew 13%. Sauza volumes grew 20% and net turnover was up 16% reflecting price decreases in Mexico following declines in raw material costs. In the US, Sauza grew both volumes and net turnover by 13%. Tia Maria volumes declined by 11% and net turnover fell by13%. This decline mainly reflects the one-off benefit of the initial distribution effect of the Tia Lusso launch which was not repeated this year and lower Tia Maria sales which were affected in the short-term by the focus on Tia Lusso. Looking ahead, we have developed a new marketing campaign to revitalise the Tia Maria brand.
The recovery in core brand volumes in Spain accounted for one percentage point of volume growth and overall core brand volume growth was 7% excluding the Spanish market.
The local market leader brands are important contributors to overall profit and cash generation. In addition, they provide important local scale to support the development of the core brands in key markets. Among the local market leader brands, the strong growth of Stolichnaya in the US and the recovery of volumes of Whisky DYC and Centenaries in Spain were offset by volume declines in the Mexican brandies and Imperial whisky. As a result, overall local market leader volumes and net turnover both declined by 2%. Marketing investment was reduced across the local market leaders by 2% and net brand contribution declined by 2%.
The premium wine brands continued to deliver a significant price/mix improvement with flat volumes and net turnover up by 7%. Marketing spend increased by 9% to deliver a trading profit increase of 13%.
The volumes of the other Spirits & Wine brands grew by 2% with net turnover up by 3%.
Market review – Spirits & Wine
The key geographic drivers are the strong growth in core brand volumes in North America which delivered good turnover and profit growth, a recovery in volumes in Spain and good value growth in the premium wine portfolio. These good results were in part offset by declines in some Western European markets as a result of unfavorable macro-economic conditions and in South Korea where the current consumer credit problems have affected consumption patterns.
The regional performance of our businesses reviewed below.
North America
|
| Growth |
|
|
| % |
|
Volumes (9L cases) |
| 5 |
|
Net turnover |
| 9 |
|
Advertising and promotion |
| 10 |
|
Trading profit |
| 15 |
|
Strong trading in our North American business delivered a net turnover increase of 9% to £632m with volumes up 5%. Trading profit grew 15% to £183m after advertising and promotion grew by 10%.
In the US, we have continued to grow our share of the spirits market, reflecting the strength of our core brand portfolio and the benefits of our partnership approach with US distributors. As a result, we have grown volumes in the US by 7% and achieved good price/mix improvements to increase net turnover by 10%. Price improvements have been achieved particularly behind Maker’s Mark, Malibu and Stolichnaya. To support this momentum, we increased our marketing investment by 11% with the increase being directed mainly behind Malibu, Sauza and Kahlúa.
26
(1) We have successfully revitalized Canadian Club with global volumes up 7%. The brand grew share in the US and benefited from the success of its ready-to-drink extensions in Australia.
(2) Sauza grew volumes by 20% this year and gained share in its key markets of the US and Mexico. The brand continues to benefit from its innovative marketing campaign, ‘Get Lost’.
(3) Maker’s Mark is a handcrafted premium batch bourbon. Volumes were up 10% supported by the brand’s unique marketing campaign.
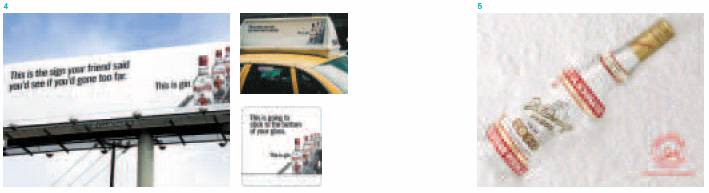
(4) Beefeater grew volumes 8% supported by continued market share gains in Spain. In the US, we have run a new campaign called ‘This Is Gin’ which has many different executions including billboards, coasters and taxis.
(5) Stolichnaya continued to perform well in the US with volumes up 9%. We launched a new campaign in October 2004 called ‘Frozen’ to build brand equity and support future growth.
Malibu has continued to increase its market share of the rum category in the US. Volumes grew 31% with net turnover up 35%, reflecting the successful launch of the new flavours, mango and pineapple. The original coconut flavor has also continued to perform well with volumes up 13%. This reflects the success of the ‘Seriously Easy Going’ campaign.
Sauza grew both volumes and net turnover by 13% in the US. It continued to grow its share of the tequila category as we increased our investment in the successful ‘Get Lost’ marketing campaign. Maker’s Mark had another strong year with further share growth with volumes up 14% and net turnover up 18%.
Stolichnaya continued to perform well with volumes up 9% and net turnover up 11% helped by the introduction of brand extensions such as Stolid Razberi and Stoli Elit. Beefeater grew volumes by 4% and net turnover by 5% supported by a new advertising campaign called ‘This Is Gin’ which has been trialled in three cities and will be rolled out to further cities during 2005.
Our programme to revitalise Canadian Club has delivered volumes up 4% with flat net turnover reflecting the effect of planned price repositioning across selected States. As a result, Canadian Club has also grown its share of the Canadian whisky category. Kahlúa continued to deliver positive consumption trends with net turnover up 3% on flat volumes. Courvoisier volumes fell 2% following a strong performance last year.
Our strategy in the US is continuing to drive market share gains. The ‘first choice supplier’ programme with US distributors has brought further benefits as we have extended the contracts to new States. Around 55% of our Open State volume is now covered by these new contracts which are long-term partnerships based on sustainability and mutual benefit. In addition, the new team we put in place to manage the Control States has provided the necessary focus to drive market share gains.
Europe
|
| Growth |
|
|
| % |
|
Volumes (9L cases) |
| 0 |
|
Net turnover |
| 2 |
|
Advertising and promotion |
| (3 | ) |
Trading profit |
| 14 |
|
Trading profit grew 14% to £139m reflecting a recovery in volumes in Spain and a good performance in the UK and Central and Eastern Europe, offset by declines in other Western European markets caused by the challenging trading conditions. Net turnover grew 2% to £734m on flat volumes. Advertising and promotion declined by 3% as we reallocated our resources into higher growth markets in the US and Asia. In addition, cost saving initiatives held overheads flat. Outside Spain, our European volumes and net turnover both declined 3% despite the core brands growing share in key markets.
Our business in Spain grew volumes by 8% and net turnover by 12% reflecting the recovery in our volumes following last year’s destock by Spanish wholesalers. Ballantine’s grew volumes by 16% and net turnover by 20% and, while the Scotch whisky category is now in decline, the brand has continued to grow its market share to an all-time high. We have significantly increased our investment behind the Ballantine’s ‘Go Play’ campaign in Spain to maintain the brand’s momentum. Volumes for Beefeater grew 9% while net turnover grew 16%. Beefeater became the market leader in the gin category by value with strong market share gains. We have also recently launched WET by Beefeater, a premium brand extension, in high-end on-premise accounts. Malibu has continued to gain share following new television advertising and more than 1,000 on-trade promotion events. The volumes for Whisky DYC increased by 6%, as the new marketing campaign, ‘DYC Une’, helped to improve awareness among target consumers. While the brandy market continues to decline, Centenario has maintained its leadership of the category with a 25% share.
27

(1) Courvoisier grew well in the UK with volumes up 9%, extending its leadership of the cognac category. A new campaign is being launched in late 2004.
(2) The ‘Unleash It’ campaign has helped to reinvigorate Kahlúa in the US through a combination of print and TV executions. A refreshed campaign is being launched for 2005.
(3) Seung-Jin Baik
Marketing Korea
(4) Adriana Vilchis
Presidency Assistant
Daniel Hernandez
Finance Barbara
Benesova
HR
Mexico
The UK business has continued to deliver profit growth. Courvoisier extended its leadership of the cognac category with both volumes and net turnover up 9%. The brand is benefiting from new listings, a programme of on-trade events, particularly around cocktails, and an advertising programme in style magazines. Malibu has continued to grow share in both the on- and off-trade with volumes and net turnover up 8%. A new national TV and cinema campaign with the ‘Seriously Easy Going’ message increased brand awareness along with a marketing focus on mixing with cranberry. Volumes for the overall Tia Maria trademark declined when compared against high volumes associated with the Tia Lusso launch programme last year. However, Tia Lusso has retained its position as the number two selling cream liqueur by value in the UK.
The rest of Western Europe, such as France and Germany, has experienced sluggish economies and slower consumer spending. However, key brands have made good progress with market share growth in these challenging markets. For example, in France, legislative changes including price decreases have made the trading climate difficult, although we achieved market share gains with Ballantine’s. In Germany, while the spirits market has continued to decline, Ballantine’s increased its leadership of the Scotch whisky category. Ballantine’s has also achieved share gains in other markets so that its overall European market share has reached an all-time high.
In addition, we have reviewed our distribution arrangements in a number of our European markets and introduced new partnership arrangements in the Czech Republic, Benelux, Poland and Switzerland. These partnerships provide a more efficient route to market and are delivering overhead savings, improved scale and access. In Central and Eastern Europe, we have seen good profit growth in a number of markets such as Romania, Hungary and Russia and have benefited from the new distribution arrangements in the Czech Republic and Poland.
Latin America
|
| Growth |
|
|
| % |
|
Volumes (9L cases) |
| 4 |
|
Net turnover |
| 3 |
|
Advertising and promotion |
| 6 |
|
Trading profit |
| 5 |
|
Trading profit grew 5% to £44m while net turn over grew 3% to £268m despite the challenging market conditions. This performance reflects a significant improvement in the second half, with volumes up 10%, net turnover up 13% and trading profit up £6m. The key drivers forth year are the growth of the core brands, particularly Sauza in Mexico, and our Argentine wines, which have been partially offset by a decline in Mexican brandies.
Our Mexican business continued to extend its position as the leading spirits business. Sauza continued to grow its share to become the second largest tequila brand in Mexico. Volumes were up 36% and net turnover grew 27% reflecting price reductions caused by the highly competitive tequila market as well as declines in the raw material costs. We have also increased our focus on the core brands which have delivered good growth in Ballantine’s and Kahlúa. The domestic brandy category continues to be affected by the growth of the illegal spirits market in Mexico, which has resulted in a 5% decline in our Mexican brandy volumes. However, our brands have maintained their leadership of the category, and we delivered a better performance in the second half with brandy volumes up 7% driven by Presidente, albeit against weaker comparatives. We have continued to work with the Mexican government on initiatives to tackle the growth of the illegal spirits market. The recently implemented regimes apply excise duties on all alcohol imports and production in order to prevent its diversion to the illegal market. It is too early to determine the effectiveness of these initiatives.
In Argentina, we have extended our market leadership through growth of our core spirits brands, such as Tia Maria and Beefeater, and our Argentine wine portfolio. The Argentine wine portfolio helped to grow
28

(5) We have continued to refresh the ‘Go Play’ campaign for Ballantine’s – our largest brand. This successful campaign was launched in 2002 and has helped to grow Ballantine’s market share to an all-time high in Europe.
(6) We have launched a new campaign for Tia Maria in the UK to revitalise the brand’s growth.
(7) Richard Swan
Global Supply Chain
UK
(8) Kyung-Joon Yoon
Sales Manager
Korea
our domestic wine volumes by 40% and net turnover by 78%. In Brazil, our Latin American wines have also helped to grow our overall Brazilian volumes by 5%. Ballantine’s also continued to perform well in the other Latin American markets.
Asia Pacific
|
| Growth |
|
|
| % |
|
Volumes (9L cases) |
| 2 |
|
Net turnover |
| (3 | ) |
Advertising and promotion |
| 15 |
|
Trading profit |
| (4 | ) |
The challenging trading conditions in South Korea, where a consumer credit squeeze has triggered a significant slowdown in the overall spirits market, has caused the regional trading profit to decline by 4% to £68m. Net turnover for the region fell by 3% to £226m while volumes grew 2%. Core brand volumes in the region grew 14% offsetting the declines in local market leader brands in South Korea and the Philippines. Outside of South Korea, we experienced strong growth in the rest of the region with volumes up 11% driven by good performances in Greater China, Australasia and the emerging new markets.
The consumer credit squeeze in South Korea has slowed consumer spending which has badly affected the spirits industry. As a result the whisky category has declined by 26% since August 2003 but our total market share improved by 1.4 percentage points to 34%. We improved our share across the premium, deluxe and super-premium categories. The premium (12 year old) category has been most affected, declining 29%, while Imperial Scotch whisky maintained its market leadership with volumes down 22%. We have, however, continued to grow our share of the premium whisky category to an all-time high. The more premium-priced brands have fared better as the consumer base is relatively less affected by the credit squeeze. This trend is continuing to support a mix benefit for Ballantine’s aged whisky. In addition, in December we successfully launched Imperial 17 year old Scotch to broaden our access to this more premium-priced category. This was the main driver for the 15% increase in advertising and promotion in the Asia Pacific region. Our work with Imperial 17 year old and Ballantine’s Masters has grown our share of the deluxe premium category in South Korea.
In Australia, our volumes grew 29% driven particularly by the success of our ready-to-drink extensions and good growth from Ballantine’s and Malibu. The ready-to-drink formats are based on Canadian Club, with CC Club and CC Cola growing volumes by 40%, and the recent launch of Malibu Chill which has been very well received. The base Malibu brand also grew strongly in Australia with volumes up 25%. In the Philippines, Fundador has maintained its position as the largest international spirits brand but incurred volume declines of 14% as a result of increasing competition from low-priced Spanish imports and the difficult economy. Sales in Japan improved this year, driven particularly by Ballantine’s aged whisky.
Our business in China has progressed in building organisational capabilities and a sales network. This delivered good growth from a small base such that volumes grew by 75% driven by Ballantine’s, up 90%, and Courvoisier, up 74%.
Premium Wine
|
| Growth |
|
|
| % |
|
Volumes (9L cases) |
| 0 |
|
Net turnover |
| 7 |
|
Advertising and promotion |
| 9 |
|
Trading profit |
| 13 |
|
29

(1) Clos du Bois is our largest US wine brand and grew volumes by 13% this year. We started a new campaign in September 2004 called ‘All The French You Need To Know’.
(2) Trudy Stewart
Contract Administrator
QSR
US
(3) Michael O’Donovan
Research & Development
QSR
US
(4) Joseph Falcao
Strategic Planning
QSR
US
(5) The strong US same store sales at Dunkin’ Donuts continues to outpace the industry which reflects its successful programme of innovation and marketing. The new range of espresso, latte and cappuccino drinks we launched in October 2003 has reinforced Dunkin’ Donuts’ No. 1 position in the US for selling coffee by the cup.
(6) Togo’s is a popular sandwich brand on the West Coast of the US. During the year, we have worked with our franchisees to refurbish around half our stores to refresh the brand’s appeal to consumers.
(7) We have trialled a new store format for Baskin-Robbins in California with encouraging early results. It includes new products such as soft serve ice cream to which customers can create their own toppings and a new beverage bar to increase our focus on high margin beverages.
The premium wine brands have grown strongly with trading profit up 13% to £98m. Net turnover increased by 7% to £475m on flat volumes which reflects a strong price/mix improvement of 7%. Advertising and promotion increased 9% primarily behind our champagne brands. Our continued focus on value and mix improvement is delivering improving returns on investment and we are on track to reach our targets. These excellent results have been achieved at a time when many other wine companies have struggled against a challenging wine market. It demonstrates the strength of our wine brands and the benefits of our geographic diversity which have provided a natural hedge against recent variations in wine cycles. We have also improved our capital efficiency both by better working capital management and through disposal of non-strategic assets. These capital savings along with the profit growth are driving higher returns.
Our premium-priced wines (£5 or US$7 retail price and above) represent around 55% of the portfolio by volume but around 85% of the portfolio by value. Our strategy is to shift the mix of our wine portfolio towards these more premium categories and away from the value category. As a result, we delivered flat overall volume growth reflecting a strong performance in the premium categories offset by the declines in the value categories. It was helped by a significant growth in premium wine volumes during the second half with overall volumes up 4% and net turnover up 9%.
We had a very strong year in the US, our largest wine market, with overall volumes up 14% and net turnover up 17%. Our largest US brand, Clos du Bois, was the key driver with volumes up 13%. Its core chardonnay varietal grew well and we also benefited from the introduction of a new shiraz varietal. The successful launches of the Jerry Garcia label and Mumm ‘M’ were also helpful growth drivers. Mumm Cuvée Napa experienced overall strong growth with volumes up 14%. The addition of the Gary Farrell icon wines into the portfolio has also helped to improve the credibility and breadth of the US domestic portfolio. The other key growth driver was the continued introduction of wine imports into the US market, particularly from New Zealand, Champagne and Spain. The New Zealand wines, which we market under the Brancott label in the US, delivered volume growth of 38% and our champagne volumes in the US increased by 36%. Both our domestic and imported brands benefited from broader distribution and improved sales and marketing capabilities within the US market.
The UK wine business delivered good growth with volumes up 7% and net turnover up 10%. There was good growth from a range of brands from different production regions. The New Zealand brands grew volumes and net turnover by 9% in spite of the supply shortage resulting from last year’s reduced grape harvest. The Spanish Rioja brands benefited from the strength of our UK distribution, with Campo Viejo volumes up 24% and net turnover up 34%. The champagnes have also delivered net turnover growth of 6% as we have increased prices, particularly on Mumm. Our largest Argentine wine brand, Graffigna, also saw good growth with volumes up 17% and net turnover up 26%.
Our wine sales in Australia and New Zealand had a slow start to the year. The domestic sales in New Zealand declined, primarily reflecting the grape supply shortage caused by last year’s frost damage. Consolidation among the retailers also put pressure on sales. However, we restructured our operations in New Zealand and Australia and, coupled with the improving supply situation, we saw good net turnover growth across all brand categories in the second half. The grape harvest in 2004 was at record levels and will support future growth even though overall supply remains tight in the New Zealand market. The premium positioning of our portfolio and the tension in grape supply will support continued value growth from our New Zealand operations.
In Spain, we restructured our operations and continued to focus on driving the mix shift from low value table wine to more premium categories. In the second half, our volumes grew 5% and net turnover grew 10% with good growth across the premium portfolio. In the year as a whole,
30

Quick Service Restaurants trading profit
£m
Quick Service Restaurants distribution points
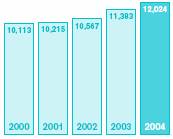
Quick Service Restaurants distribution points |
|
|
| |||
12,024 points |
|
|
|
|
|
|
|
|
|
|
|
|
|
|
|
|
|
| % |
|
| 1 | Dunkin’ Donuts |
| 51 |
| |
| 2 | Baskin-Robbins |
| 45 |
| |
| 3 | Togo’s |
| 4 |
| |
|
|
|
|
|
| |
|
|
|
|
|
| |
|
|
|
|
|
| |
|
|
|
|
|
| |
Quick Service Restaurants system-wide sales |
|
|
| |||
£2,718m |
|
|
|
|
|
|
|
|
|
|
|
|
|
|
|
|
|
| % |
|
| 1 | North America |
| 84 |
| |
| 2 | International |
| 16 |
| |
|
|
|
|
|
| |
|
|
|
|
|
| |
|
|
|
|
|
| |
|
|
|
|
|
| |
|
|
|
|
|
| |
volumes declined 7% but delivered seven percentage points of price/mix improvement to give flat overall turnover.
Global Operations and Duty Free
During the year, we restructured our Global Operations activities around a simpler functional model based upon regional manufacturing units, supply chain, procurement, finance, human resources and technical operations. This new structure is enabling us to leverage our global scale more effectively, to transfer best practice, to speed up decision-making and deliver better utilisation of our assets. Global Operations has continued to improve productivity by 3% for Spirits & Wine, measured as cases produced per employee. This improvement has been achieved across the key production centres.
Our Duty Free business has grown well with core brand volumes up 8%. The growth came from nearly all the brands with particularly strong performances from aged Ballantine’s in Asia, Sauza in the US and Europe, Beefeater and Canadian Club in the US. Traffic numbers have improved during the year, particularly in Asia and the US which were affected by the SARS virus and the Gulf War, respectively, last year. The premium wine brands also performed well with good growth from across the portfolio following improved distribution and listings in airport shops.
Quick Service Restaurants
• Distribution points up 6%
• Number of combination stores up 18%
• System-wide sales growth of 12%
• Turnover down 3%
• Trading profit up 21%
Quick Service Restaurants had an excellent year with profits up 21% to £86m driven by continued growth in same store sales, the contribution from new stores and from the cost savings resulting from last year’s reorganisation. Distribution points increased by 6% with new store openings in both the US and internationally. Global system-wide sales increased by 12%. However, overall turnover has fallen by 3% (£7m) to £226m, reflecting the final transition of Baskin-Robbins from producing and selling ice cream to US franchisees (which is now fully contracted out) to a wholly royalty-based model. Excluding the effect of this outsourcing, turnover is up 6%. Gross profit increased by 6% to £208m.
Dunkin’ Donuts is the key growth driver for QSR with a 13% increase in global system-wide sales. This reflects US same store sales up 6.9% and a 6% increase in global distribution points. The same store sales growth exceeds the rate for the overall industry and is driven by innovation and excellent marketing. In particular, a new range of coffee offerings including latte, cappuccino and espresso products was launched in October 2003. During the summer, the range was extended to include iced coffee options which also proved very popular. The launch exceeded all expectations and helped beverages to grow by 13%. The launch has been supported by the introduction of new high-speed coffee machines that support Dunkin’ Donuts’ reputation for speed, quality and value for money. On the baked goods side, we introduced a new apple pie product and new breakfast sandwich formats.
Baskin-Robbins grew global system-wide sales by 10%. This was driven by same store sales growth and a 7% increase in new store openings. US same store sales grew 2.1%, benefiting from a movie co-promotion with the recent Dreamworks film, Shrek 2, which saw the launch of new flavours such as Fiona’s Fairytale, Shrek’d Out Chocolate Mint and Shrek’s Hot Sludge Sundae. We also relaunched Cappuccino Blast for the summer with good results and successfully trialled a new store format in California. The key innovations for the new store concept are a beverage bar, a new cake display and the introduction of a new soft-serve ice cream to which customers can add their own toppings. The initial
31

‘Our focus on consistent profit growth and working capital management is delivering improved cash flows. As a result, we have continued to reduce our net debt.’
Graham Hetherington,
Chief Financial Officer
Net debt
£m
Net cash flow from operating activities
£m
results are encouraging. To support the international business, which accounts for almost half of Baskin-Robbins stores, we introduced a global advertising fund in conjunction with the franchisees to deliver a more co-ordinated and cost-effective approach to marketing in our international markets.
The difficult economic conditions in California and the increasingly competitive environment has held back the sales of Togo’s which recorded an 8% decline in system-wide sales. However, the store innovation and refurbishment programme, which has now covered around half of the stores, is delivering improved results. The new store formats provide improved menu boards and we have introduced new products such as low carbohydrate bread and new salad dressings.
Multi-branded stores, which combine the Dunkin’ Donuts and Baskin-Robbins restaurants in one location, increased by 18% to over 1,300 store locations. This is a key driver of new store openings and is supported by the brands’ complementary day-part offering and brings significant benefits to our franchisees through improved scale and operating efficiencies, along with increased choice for consumers.
This year’s results also reflect the benefit of the restructuring that we implemented during 2003. The new structure has increased the focus on the three brands and is improving operational systems and standards, menu and product development and the expansion of the international business. We have also generated cost savings in the period of £6m.
Britannia Soft Drinks
The Group’s share of Britannia’s profits for the period was £23m (2003: £20m). Allied Domecq and the other shareholders of Britannia Soft Drinks Limited have also agreed subject, inter alia, to market conditions, to consider an initial public offering of Britannia Soft Drinks, between 1 January 2005 and 31 December 2008. Allied Domecq has a 23.75% share of Britannia Soft Drinks Limited.
Taxation
The normalised tax charge for the year has remained at 24%, in line with last year.
Goodwill and exceptional items
Goodwill amortisation totalled £40m (2003: £40m). The exceptional items include profits on property disposals (£14m),an additional profit on the disposal of Panrico (£20m), offset by costs incurred in restructuring the Spirits & Wine business (£31m) and asset write-downs (£5m).
Property disposals related primarily to assets within the premium wine business. The consideration for the disposal of our 50% interest in Panrico in March 2000 included an additional payment of £20m to be paid by the end of March 2006 or earlier, contingent upon future events. On 19 August 2004, we agreed to receive this payment from Panrico in full and final settlement of the original sale and purchase agreement.
The restructuring programme is aimed at reducing the overlap between central, regional and market-focused functions and has enabled us to be leaner and more efficient, speed up decision-making and reinforce accountability throughout the business. The programme has delivered operational savings this year of £15m.
Cash flow
Last year, cash flow benefited from the Mexican excise rebate of £38m (net of tax) and the timing of duty payments of around £40m. Excluding these non-repeatable items, free cash flow improved by £88m despite absorbing a number of additional outlays such as increased pension contributions and restructuring costs. We have continued to focus on trade working capital management and reducing the level of capital expenditure and active management of the asset base through disposals of non-strategic assets. Our interest payments were £10m lower compared with last year, benefiting from the lower average net debt.
32

(1) Louise Crawford
Pensions
UK
(2) Heather Sabia
Sales
US
(3) Jong-Mi Lee
Assistant Manager
Korea
(4) Juan Laso
Treasury
Spain
Free cash flow after dividends
£m
Treasury operations and foreign exchange
The Group operates a centralised treasury managing interest rate and foreign exchange risk and financing. The Board agrees and reviews risk management policies.
We operate a prudent hedging policy. Net currency exposures on transactions are hedged forward for between 12 and 18 months using a blend of foreign exchange forwards and options. As hedges fall away, if the currencies remain depreciated, the margins of the imported products are negatively affected.
It is our policy not to hedge the impact of foreign exchange movements on the translation of our overseas earnings into Sterling. For constant rate reporting purposes, our prior year profit before tax was reduced by £38m, primarily due to the weakening of the US dollar and Mexican peso.
We anticipate, based on current exchange rates and the hedge contracts in place, that trading profit will be adversely affected during the next financial year by around £30m, including £20m from currency exposures on transactions.
Our balance sheet is also exposed to currency translation impacts. Our policy is to match our currency of debt in proportion to foreign currency earnings in order to reduce this exposure.
The amount of risk to any counterparty is restricted according to their credit rating. We continually monitor our exposure to counterparties and for any changes in their credit rating.
Exposures to interest rate fluctuations charged against our borrowings are managed using interest rate swaps and interest rate options. It is our policy to keep between 60% and 80% of net debt at fixed rates of interest with a target of 70%.
Net debt has reduced by £471m during the year from £2,412m to £1,941m. This improvement includes a favourable currency translation impact on our borrowings of £193m, which is largely due to the US dollar weakness. Net debt reduction from cash flows was £278m, benefiting from the Panrico receipt (£20m).
At 31 August 2004, EV gearing (net debt as a percentage of market capitalisation plus net debt) was 28% (2003: 36%). Interest cover based on normalised EBITDA was 5.4 times and cover based on normalised EBITA was 4.8 times.
Pensions
As anticipated, the profit and loss charge under FRS 17 was £51m (2003: £49m), with a £32m (2003: £29m) charge within trading profit and a £19m (2003: £20m) impact within finance charges. Within the framework of FRS 17, we are able to confirm the charge for 2005 will be similar to 2004.
The post-tax deficit included in the balance sheet at 31 August 2004 was £387m compared with £405m at 31 August 2003.
New accounting standards and other global GAAP issues
UK standards
We have adopted ‘FRS 17 – Retirement benefits’ from 1 September 2003 which has led to a restatement of the figures for the year ended 31 August 2003, with a £16m increase in trading profit, a £20m increase in finance charges and a £1m decrease in the tax charge.
The amendment to ‘FRS 5 – Reporting the substance of transactions’ has resulted in a number of items which were previously classified as operating costs (£69m) and advertising and promotion (£24m) to be treated as discounts, reducing turnover by £93m for the year ended 31 August 2003. Trading profit was not affected.
33

(1) Chung-Hwan Moon
Production
Korea
(2) Maria Gálvez
IT
Spain
(3) Kev Rowlands
Finance
UK
(4) Raquel Campillo
Paralegal
Spain
(5) Richard Hill
World Wines
UK
(6) John Petch
Customer Management
Lani Montoya
Human Resources
US
The impact of these accounting standards on the profit and loss account for the year ended 31 August 2003 is summarised in the tables opposite.
We have also complied with ‘UITF 38 – Accounting for ESOP Trusts’ which has resulted in a reclassification of shares held in employee trusts from investments to Shareholders’ funds, reducing net assets by £129m at 31 August 2003. There were no changes to reported profits for the year ended 31 August 2003.
International Financial Reporting Standards
All EU companies listed on an EU stock exchange will be required to report their consolidated accounts in accordance with International Financial Reporting Standards (‘IFRS’), as published by the International Accounting Standards Board (‘IASB’), for all accounting periods commencing on or after 1 January 2005.
Accordingly, we will present our first set of full financial statements under IFRS for the year ending 31 August 2006. This will require a full profit and loss account, balance sheet and cash flow statement for the year ending 31 August 2005 for comparative purposes. For US GAAP reporting, the US Securities and Exchange Commission has yet to determine whether we are also required to present comparatives for the year ended 31 August 2004.
We have established a project team to ensure that appropriate processes and procedures are in place to achieve the transition to IFRS. The project team is addressing all implementation aspects, including changes to accounting policies, systems implications and wider business issues that may arise. The implementation plan is dependent upon the completion of the standard-setting process by the IASB and the endorsement of such standards by the EU.
The Group has not yet determined the full effects of adopting IFRS. However, at this stage we believe that the major differences between our current accounting practice and IFRS will relate to accounting for financial instruments, accounting for business combinations, and accounting for fixed assets and stock under the agriculture standard.
US GAAP
In the course of our preparatory work to convert our financial statements from UK GAAP to IFRS, we have identified the need to correct our prior reconciliation to US GAAP. The correction relates to the foreign currency translation of certain assets and liabilities in connection with the functional currencies used in past business combinations. The Group has restated the US GAAP reconciliation for prior periods and the impact in 2003 was a £1m charge on net income, a £105m credit to comprehensive income and a £26m reduction in Shareholders’ equity. Further information can be found on page 82. This reconciliation does not affect any of our UK GAAP financial statements or cash flows under US or UK GAAP.
34

Constant exchange rate reporting
The following tables provide a reconciliation between the 2003 reported results and those shown at constant exchange rates in the Operating and Financial Review.
Geographical analysis – Group turnover and trading profit
In line with previous statements, the trading profits of the regions shown in this review are on a management reporting basis at constant exchange rates, rather than on a statutory basis at each year’s actual exchange rates, as shown in note 2 to the accounts. The table to the right shows the foreign exchange effect of restating last year’s reported trading profit for each region at this year’s actual exchange rates. ‘Others’ in the table includes Global Operations (including profit from the sale of bulk whisky), stand-alone duty free operations and central costs not allocated to sales and marketing regions. The profit decline in ‘Others’ principally reflects increased central marketing costs and the additional costs associated with the implementation of the requirements of the Sarbanes-Oxley Act of 2002 and International Financial Reporting Standards.
|
| 2003 |
| 2004 |
| ||||||||
|
| Reported |
| FRS 5/ |
| Foreign |
| At 2004 |
| Reported |
| Growth |
|
|
| £m |
| £m |
| £m |
| £m |
| £m |
| % |
|
Group |
|
|
|
|
|
|
|
|
|
|
|
|
|
Turnover |
| 3,410 |
| (93 | ) | (161 | ) | 3,156 |
| 3,229 |
| 2 |
|
Trading profit |
| 621 |
| 16 |
| (43 | ) | 594 |
| 657 |
| 11 |
|
Finance charges |
| (126 | ) | (20 | ) | 5 |
| (141 | ) | (136 | ) | (4 | ) |
Profit before tax |
| 495 |
| (4 | ) | (38 | ) | 453 |
| 521 |
| 15 |
|
Taxation |
| (119 | ) | 1 |
| 9 |
| (109 | ) | (125 | ) | 15 |
|
Minority interests |
| (16 | ) | — |
| — |
| (16 | ) | (14 | ) | (13 | ) |
Earnings |
| 360 |
| (3 | ) | (29 | ) | 328 |
| 382 |
| 16 |
|
Weighted average number of Ordinary |
|
|
|
|
|
|
|
|
|
|
|
|
|
Shares (millions) |
| 1,075 |
| — |
| — |
| 1,075 |
| 1,076 |
|
|
|
Normalised earnings per share (pence) |
| 33.5 |
| (0.3 | ) | (2.7 | ) | 30.5 |
| 35.5 |
| 16 |
|
|
| 2003 |
| 2004 |
| ||||||||
|
| Reported |
| FRS 5/ |
| Foreign |
| At 2004 |
| Reported |
| Growth |
|
|
| £m |
| £m |
| £m |
| £m |
| £m |
| % |
|
Spirits & Wine |
|
|
|
|
|
|
|
|
|
|
|
|
|
Turnover |
| 3,151 |
| (93 | ) | (135 | ) | 2,923 |
| 3,003 |
| 3 |
|
Duty |
| (671 | ) | — |
| 28 |
| (643 | ) | (618 | ) | (4 | ) |
Net turnover |
| 2,480 |
| (93 | ) | (107 | ) | 2,280 |
| 2,385 |
| 5 |
|
Advertising and promotion |
| (437 | ) | 24 |
| 17 |
| (396 | ) | (421 | ) | 6 |
|
Trading profit |
| 522 |
| 16 |
| (35 | ) | 503 |
| 548 |
| 9 |
|
Geographical analysis – Group net turnover
|
| 2003 |
| 2004 |
| ||||||||
|
| Reported |
| FRS 5/ |
| Foreign |
| At 2004 |
| Reported |
| Growth |
|
|
| £m |
| £m |
| £m |
| £m |
| £m |
| % |
|
North America |
| 649 |
| (15 | ) | (55 | ) | 579 |
| 632 |
| 9 |
|
Europe |
| 762 |
| (49 | ) | 10 |
| 723 |
| 734 |
| 2 |
|
Latin America |
| 303 |
| (2 | ) | (41 | ) | 260 |
| 268 |
| 3 |
|
Asia Pacific |
| 258 |
| (12 | ) | (14 | ) | 232 |
| 226 |
| (3 | ) |
Premium Wine |
| 463 |
| (12 | ) | (5 | ) | 446 |
| 475 |
| 7 |
|
Others |
| 45 |
| (3 | ) | (2 | ) | 40 |
| 50 |
| 25 |
|
Spirits & Wine |
| 2,480 |
| (93 | ) | (107 | ) | 2,280 |
| 2,385 |
| 5 |
|
QSR |
| 259 |
| — |
| (26 | ) | 233 |
| 226 |
| (3 | ) |
Total |
| 2,739 |
| (93 | ) | (133 | ) | 2,513 |
| 2,611 |
| 4 |
|
Geographical analysis – Group trading profit
|
| 2003 |
| 2004 |
| ||||||||
|
| Reported |
| FRS 5/ |
| Foreign |
| At 2004 |
| Reported |
| Growth |
|
|
| £m |
| £m |
| £m |
| £m |
| £m |
| % |
|
North America |
| 182 |
| — |
| (23 | ) | 159 |
| 183 |
| 15 |
|
Europe |
| 114 |
| — |
| 8 |
| 122 |
| 139 |
| 14 |
|
Latin America |
| 54 |
| — |
| (12 | ) | 42 |
| 44 |
| 5 |
|
Asia Pacific |
| 78 |
| — |
| (7 | ) | 71 |
| 68 |
| (4 | ) |
Premium Wine |
| 95 |
| — |
| (8 | ) | 87 |
| 98 |
| 13 |
|
Others |
| (1 | ) | 16 |
| 7 |
| 22 |
| 16 |
| (27 | ) |
Spirits & Wine |
| 522 |
| 16 |
| (35 | ) | 503 |
| 548 |
| 9 |
|
QSR |
| 79 |
| — |
| (8 | ) | 71 |
| 86 |
| 21 |
|
Britannia |
| 20 |
| — |
| — |
| 20 |
| 23 |
| 15 |
|
Total |
| 621 |
| 16 |
| (43 | ) | 594 |
| 657 |
| 11 |
|
35
Corporate social responsibility
Our Shareholders don’t want us chasing short-term profits at the expense of long-term prosperity. Rather, they want us to build a sustainable business. So we have to balance three different sets of priorities: economic, environmental and social.


We scored 92% in the 2003 Business in the Community UK index of corporate responsibility, compared with 78% in 2002. This places us in the premier league of companies, coming 24th. These figures establish us as sector leaders, ahead of both Diageo (34th) and Scottish and Newcastle (82nd) in the ‘Top 100 Companies that Count’. We’re also listed in the FTSE4Good and the Dow Jones Sustainability Index.
Economic
We exist to make money for our shareholders, both now and in the long-term. But companies are increasingly going to be judged by how they behave as well as how much they earn. Through the jobs we create, the taxes we pay and the services they help to fund, we have an impact on the wider economies of every place we operate. And experience tells us that being responsible in our approach to society and the environment makes sound business sense in the long-term.
Environmental
We strive to make a positive difference in the places where we operate – to the people who live and work there as well as to the natural environment. What we’ve already achieved in this area has put us at the forefront of our industry. The Maker’s Mark distillery in Kentucky, for example, this year achieved three international standards for quality, environmental, and health and safety (ISO 9001:2000; ISO 14001; and OHSAS 18001) and Allied Domecq is working towards all production units achieving these three standards.
We’re the leader in our sector for the eighth consecutive year in the Business in the Environment index. And we’re doing more every year though our commitment to ISO14001 as our global production standard. Over 80% of our production sites have plans in place to minimise water use, reduce waste and CO2 emissions and save energy.
Examples of the practical impact of our environmental policy can be found in the ‘our responsibilities’ section of our website (www.allieddomecq.com).
Social
As one of the world’s largest producers of alcoholic drinks we have always been aware that our business has responsibilities that go well beyond our duty to make money for shareholders.
Alcohol can be life enhancing, and brings pleasure to millions of people. But if it’s abused it can cause damage.
We’re in regular touch with the scientific, medical and public health communities, and encourage active debate on the development of public health policies for alcohol that balance government legislation, industry self-regulation and individual responsibility.
As a company that operates all over the world, we’re highly sensitive to the different attitudes to alcohol in different societies. The age at which young people are first introduced to alcohol varies widely, as do legal drinking ages. But all young people should be protected from the ill-effects of inappropriate or under-age drinking, and every year we support suitable programmes.
Whenever and wherever we market our products we take enormous care not to encourage excessive drinking, or inadvertently target people under the legal drinking age. We believe in sticking to our own marketing code, even when it’s more restrictive than local legislation.
Indeed, as far as we know, we’re the only major alcoholic drinks company in the world that asks an independent review board to check the integrity of its marketing.
The Marketing Review Board advises us on whether we are abiding by our own standards and helps us identify and address any risks that a particular campaign might pose to our reputation – locally or across the world. The board is also helping us develop our standards so that we will be able to anticipate issues and act before problems arise.
36

(1) Allied Domecq
Social Report 2004.
(2) Nori Arienza
European POS Lead Buyer Spain
(3) Allied Domecq’s corporate advertisement for responsible drinking.
We want to lead our industry in the move towards a more sustainable and self-regulatory approach to advertising, and the Marketing Review Board shows that this can be done.
In April 2004, we enhanced our ethical trading policy, the ownership of which rests ultimately with the main Board Director responsible for our social accountability. To assess compliance we issued a self-assessment questionnaire to current suppliers and, by August 2004, 715 suppliers, equating to an annualised spend of £680m, had completed it. The new policy is now part of all new and renewed contracts.
We believe our suppliers have a role to play in ensuring that we build a truly sustainable business. High workplace standards, good health and safety, fair pay and employment conditions, no discrimination or bribery, and care for the environment are elements of any successful, professionally-run business.
We’re a big company and that means we can have an influence on the ethical and environmental standards in place throughout our supply chain – though where we buy on open commodity markets we aren’t in direct control of the impact we have. But some raw materials, such as agave and grapes, do come direct from farmers, and in these cases we can work with our suppliers to improve conditions.
The next steps will include extending the coverage of the policy and resolving areas of non-compliance. We recognise, however, that within our supply chain, there are many different national cultures, with their own laws, norms and traditions, which we must respect. Some suppliers will face more complex issues than others in implementing the policy. In these areas, we are committed to working with all relevant bodies to deliver effective action plans for change.
Also in April 2004, we published our first Social Report. This describes Allied Domecq’s performance in respect of the broader responsibilities of the business and towards the people who work for it. Once again a copy can be found in the ‘our responsibilities’ section of the corporate website (www.allieddomecq.com).
Our people determine what sort of place Allied Domecq is and what it feels like to work here. As a company we have values that we try to live by, that reflect how we are and what we aspire to. And we like to think that ours are more than just words.
We pay attention to the work/life balance; we’re investing in better data collection systems to measure our health and safety, and environmental performance. When we make decisions we want them to be based on facts not gut feelings.
We carry out six-monthly surveys of our staff to find out what they think and feel about the Company – and if they say we need to change things, we do.
These surveys have been carried out since 1997 and we have seen an overall improvement over that time. Our most recent results were again higher and we also benchmark well against other companies.
We know we don’t have all the answers yet and there are a lot of things we need to do better. But we’ve made a start.
37
|
|
|
|
|
|
|
|
|
|
|
|
|
|
|
|
|
|
|
|
|
|
UK |
| US |
| US |
| Spain |
| Mexico |
| New Zealand |
Allied Domecq, employment charity Tomorrow’s People, and The Salvation Army have launched an innovative new project to help Bristol’s homeless and unemployed – a difficult-to-reach group, many of whom are unable to find a job as they have no home, and can’t find a home as they have no job. |
| Our Hiram Walker plant in Fort Smith, Arkansas, held an ‘Earth Day’ celebration for employees and their families. about how to save energy at work. |
| The Maker’s Mark distillery in Kentucky has achieved three international standards for quality, environmental and health and safety with flying colours. |
| By employing people with disabilities in the Asprodema workshops in La Rioja to stick the jute sackcloth covering on to bottles of Siglo Saco, Bodegas y Bebidas is helping to overcome the basic hurdle these people face – finding a job. |
| Workers at the Sauza distillery are teaching their colleagues to read and write after research indicated that only 26% of field workers had completed secondary education. have been trained as teachers by the Institute of State Education. |
| In order to enable the people of Auckland to enjoy the beauty of the indigenous bush and have access to the region’s largest stands of ancient kauri trees, Allied Domecq Wines New Zealand provided $200,000 over two years to enable the construction of an eight-kilometre walking trail. |


Mosaic
We want to inspire every individual who works for us, and every one of our business units, to find their own way to do something positive for the world around them, as part of their everyday business life.
Because we’ve found that we make the most positive contribution to a local neighbourhood when we allow our people who live and work there to decide how best to do it.
We call this approach our Mosaic – thousands of small pieces that together add up to something truly worthwhile.
Here are just a few examples of the £4.5m spent on local projects by our companies around the world – half of which is on projects in the local community, a quarter on alcohol education and responsible drinking, and the rest on a variety of arts and environmental initiatives.
38

(1) At Dunkin’ Donuts, we have introduced in-store information on healthier choices and the nutritional content of our products.
(2) Steve Bennett
Finance
JC Nierle
Administration US
Marketing Review Board
Our Marketing Review Board meets four times a year to go over our advertising, marketing and sponsorship material and give its view on whether it meets both the letter and the spirit of the Allied Domecq code.
The five independent external members of the board have extensive knowledge of our key markets, and broad expertise in consumer issues, marketing and the regulatory environment. They are:
Jodie Bernstein, US
Ms Bernstein has recently completed six years as Director of Consumer Protection at the US Federal Trade Commission (FTC). She was part of the 1999 FTC review of self-regulation in the alcohol industry that reported to Congress.
Hugh Burkitt, UK
Currently Director of the UK Marketing Society. Previous Chairman of Burkitt DDB, a London-based advertising agency with an involvement in alcohol advertising for 20 years. As a regulator, Mr Burkitt spent six years on the Advertising Standards Authority complaints panel and has previously sat on the UK Portman Group’s independent complaints panel.
Guillermo Cabanellas, Argentina
Sr Cabanellas has worked as a lawyer for more than 30 years, in Argentina and the US. He has experience with the Argentine Ministries of Economics and of Justice and in the 1980s helped to draft Argentina’s Antitrust Law. He served as Commissioner of the Argentine International Trade Commission between 1994–1996.
Jose Massaguer, Spain
Sr Massaguer is a professor of law in Spain, and a partner in the law firm Uria & Mendendez. Allied Domecq is one of its clients. Even though he has a relationship with the Company, he is President of the Second Chamber of the Jury on self-regulation in advertising and is a respected international expert in intellectual property law.
Lisa Graham Keegan, US
Ms Keegan is the CEO of Education Leaders Council (ELC), and one of America’s most prominent educational reformers. A former member of the Arizona House of Representatives, she was seriously considered for the post of US Secretary of Education.
Allied Domecq’s approach to ABI Guidelines
Allied Domecq complies with the Association of British Insurers’ Guidelines, which recommend that social, environmental and ethical (SEE) matters be addressed in the Annual Report and Accounts.
The Board regularly reviews these matters and has an Executive Director, David Scotland, who is responsible for the Company’s policies.
The Board regularly examines the business and strategic risks posed by SEE matters and Directors are trained in risks to the reputation of the business.
In addition to the information included here, we publish our health and safety, environmental and supply chain policies, our marketing code and employee code of practice, and details of our quality systems in the ‘our responsibilities’ section at www.allieddomecq.com
Wellness and nutrition
There is growing concern about the issues of obesity, health and ‘wellness’ in many countries.
As a major provider of foodstuffs through our Quick Service Restaurants businesses –Dunkin’ Donuts, Baskin-Robbins and Togo’s – we have a role to play in addressing this issue by encouraging nutritional awareness among consumers.
Balance, moderation, health awareness and physical activity are key to a healthy lifestyle, and these should be considered alongside nutritional factors, not in isolation from them.
But we have a responsibility to support industry efforts on issues of wellness and nutrition, and are working hard to ensure we do so.
Our strategy has three key elements:
• Offering healthier choices to consumers whenever possible;
• Emphasising moderation in our outlets and marketing materials; and
• Developing alliances with other organisations with experience and credibility in the fight against obesity.
39
Sir Gerry Robinson Non-Executive Chairman
Appointed a Director in February 2002 and Non-Executive Chairman in April 2002. He was formerly Chairman of Arts Council England, Granada, British Sky Broadcasting Group and ITN. Aged 55.
Paul Adams
Appointed a Non-Executive Director in December 2003. He is the Chief Executive of British American Tobacco. Aged 51.
Bruno Angelici
Joined the Group as a Non-Executive Director in August 2003. He is the Executive Vice-President, Europe, Japan, Asia Pacific and Latin America at Astra Zeneca. Aged 57.
Philip Bowman Chief Executive
Joined the Board in 1998 and was appointed Chief Executive in August 1999. He has previously served as an Executive Director of Bass and Coles Myer, a Non-Executive Director of British Sky Broadcasting Group and Chairman of Liberty. He is currently a Non-Executive Director of Burberry. Aged 51.
Donald Brydon Senior Independent Non-Executive Director Joined the Group as a Non-Executive Director in 1997 and is Chairman of the Allied Domecq pension trusts. He is Chairman of AXA Investment Managers, Smiths Group and the London Metal Exchange and a Non-Executive Director of Scottish Power. Aged 59.
Graham Hetherington Chief Financial Officer
Joined the Group in 1991 and Allied Domecq Spirits & Wine in 1995. He was appointed Finance Director of Allied Domecq Spirits & Wine in 1998. He became a Director of Allied Domecq in June 1999 and was appointed Chief Financial Officer in August 1999. Aged 45.
John Rishton
Appointed a Non-Executive Director in December 2003. He is the Chief Financial Officer of British Airways. Aged 46.
David Scotland President, Wines
Has been a Director of Allied Domecq Spirits & Wine since 1992 and a Director of Allied Domecq since 1995. He is also a Non-Executive Director of Photo-Me International and Brixton. Aged 56.
Richard Turner President, Global Operations
Joined the Group in 1982. Appointed President, Global Operations of Allied Domecq Spirits & Wine in 1995. He was appointed a Director of Allied Domecq in June 1999. Aged 55.
Leonard Quaranto
General Counsel & Company Secretary
40
Statement of Directors’ responsibilities | Board Committees |
Company law requires the Directors to prepare financial statements for each financial year which give a true and fair view of the state of affairs of the Company and the Group and of the profit or loss for that year. In preparing those financial statements the Directors are required to:
• Select suitable accounting policies and then apply them consistently;
• Make judgements and estimates that are reasonable and prudent;
• State whether applicable accounting standards have been followed, subject to any material departures disclosed and explained in the financial statements; and
• Prepare the financial statements on a going concern basis unless it is inappropriate to presume that the Group will continue in business.
The Directors are responsible for keeping proper accounting records which disclose with reasonable accuracy at any time the financial position of the Company and the Group and to enable them to ensure that the financial statements comply with the Companies Act 1985. They have general responsibilities for taking such steps as are reasonably open to them to safeguard the assets of the Group and to prevent and detect fraud and other irregularities.
Audit Committee
John Rishton (Chairman)
Paul Adams
Bruno Angelici
Donald Brydon
Sir Gerry Robinson
Summary terms of reference: to assist the Board in exercising its responsibilities for accounting, financial reporting and internal control and risk assessment, to keep the work of internal and external audit under review and to oversee the independence of the external auditor.
Remuneration Committee
Donald Brydon (Chairman)
Paul Adams
Bruno Angelici
John Rishton
Sir Gerry Robinson
Summary terms of reference: to set terms of employment, including remuneration, for Executive Directors and the Chairman.
Nomination Committee
Sir Gerry Robinson (Chairman)
Philip Bowman
Donald Brydon
John Rishton
Summary terms of reference: to consider and recommend candidates for appointment to the Board.
Executive Committee
This Committee comprises mainly the Executive Directors.
Summary terms of reference: to formalise Group strategy, run the day-to-day operations of the Group, approve projects within capital expenditure limits delegated by the Board and lead the management development process.
Financing Committee
This Committee comprises mainly the Executive Directors.
Summary terms of reference: to exercise the powers of the Company concerning the financing of approved acquisitions and the refinancing of debt.
The full terms of reference of the Board Committees are available on request from the General Counsel & Company Secretary and also appear on the Company’s website at www.allieddomecq.com
41
Directors’ report
The Directors are pleased to present their Annual Report and Accounts for the year ended 31 August 2004.
Business review and future developments
The Chairman’s Statement and the Operating and Financial Review on page 7 and pages 24 to 35 provide a review of the business and likely future developments.
Main trading activities
The Group’s main trading activities are the production, marketing and sale of Spirits & Wine and the franchising of Quick Service Restaurants.
Dividends
An interim dividend of 5.83p per share was paid on 30 July 2004 and the Directors are pleased to recommend a final ordinary dividend of 9.67p per share, making a total for the year of 15.5p. The final dividend will be paid on 2 February 2005 to shareholders on the register on 7 January 2005.
Annual General Meeting
The AGM will be held on 28 January 2005 at the Landmark London Hotel, 222 Marylebone Road, London NW1 6JQ. Details of the business to be considered at the AGM and the Notice of Meeting are included in the accompanying Chairman’s Letter.
Share capital
Details of the Company’s share capital and options over the Company’s shares under the Group’s employee share plans are given in note 22 of the accounts on pages 74 and 75. As at 31 August 2004 the Company had authority to purchase up to 10% of its Ordinary Shares. Shareholders’ approval is being sought for the renewal of this authority.
Substantial interests
The Company has been notified of the following disclosable interests in Allied Domecq Ordinary Shares:
Suntory Limited |
| 37,834,591 shares |
| (3.42 | )% |
Aviva plc |
| 33,451,589 shares | * | (3.02 | )% |
FMR Corp./ |
|
|
|
|
|
Fidelity International Limited |
| 43,139,248 shares |
| (3.9 | )% |
* 33,382,252 of the shares are held by Morley Fund Management Limited, a subsidiary of Aviva plc.
Employees
Allied Domecq operates a policy of equal opportunity and continues to give full and fair consideration to applications for employment made by disabled persons. Employees who become disabled will, wherever possible and practicable, be retained in employment and, where necessary, appropriate training will be provided. Employees are encouraged to become Shareholders in the Company. Grants of options over a total of 13,159,067 Ordinary Shares (including options over American Depositary Shares, representing underlying Ordinary Shares) were made to eligible employees under the Company’s employee share option plans during the year.
Communications and involvement
Considerable emphasis is placed by the Group on communications with its employees. In addition to obtaining a comprehensive range of attitudes and views from employees through employee opinion surveys, Group companies involve and consult them with regard to the activities and performance of their businesses and any matters of concern to them. It is normal practice to use formal joint consultative bodies locally for one-to-one and group meetings. Allied Domecq has a European Council which acts as a forum for Pan-European consultation and discussion.
Health, safety and welfare
The Group recognises that occupational health and safety management is among one of our highest corporate responsibilities. Group companies are now establishing health and safety management systems based on OHSAS 18001 (Occupational Health and Safety Assessment Series) and have achieved, or are working towards, external certification. Our global programme to benchmark our health and safety performance and practice bi-annually, using independent external facilitation, is continuing with the next benchmark due at the beginning of 2005. This enables us to measure our impact and further progress our targets and key performance indicators, towards our goal of continual improvement. The Group’s full health and safety report is posted on the Company’s website at www.allieddomecq.com
Research and development
The amount spent by the Group on research and development during the period was £1m but this does not include the full cost of new product development.
Creditor payment policy
The Company’s policy, in relation to all of its suppliers, is to settle the terms of payment when agreeing the terms of the transaction, to ensure that suppliers are aware of the terms of payment and to abide by those terms provided it is satisfied that the goods or services were supplied in accordance with the agreed terms and conditions. The Company does not follow any particular code or standard on payment practice. Creditor days have not been calculated as the Company had no trade creditors at 31 August 2004. The Company’s invoices for goods and services are settled by subsidiaries acting as agents for the Company.
Directors
The names and brief biographical details of the Directors as at 20 October 2004 are given on page 40. During the year Paul Adams and John Rishton were appointed and Sir Ross Buckland, Peter Jacobs and David Malpas retired as Non-Executive Directors. In accordance with the Articles of Association, Graham Hetherington, David Scotland and Richard Turner retire at the forthcoming AGM and offer themselves for re-election.
42
Political and charitable contributions
The Group’s continuing policy is not to make political donations or contributions within the EU. However, to be certain that we comply with the Political Parties, Elections and Referendums Act 2000 we disclose the following activities by Allied Domecq (Holdings) PLC individually valued over £200 that could be considered as affecting public support for European Union based political parties:
• Sensible drinking advertisement for two days in the Labour Party Conference daily Newsletter: £3,500 plus VAT;
• Sensible drinking advertisement in the Conservative Party Conference daily Newsletter: £1,175 plus VAT;
• Fees for attendance of two employees at Labour Party Annual Conference Corporate Day: £2,600 plus VAT; and
• Gift of champagne (at cost) for the Labour Party Gala Dinner: £340.
Charitable contributions in the UK totalled £183,000. In addition, the Allied Domecq Trust gave £52,000 to charitable causes, and charitable contributions of over £4.3m were made outside the UK.
Auditor
KPMG Audit Plc has expressed its willingness to continue in office as Auditor of the Company and the Audit Committee has approved its reappointment. Resolutions for the reappointment of the Auditor, at a rate of remuneration to be determined by the Directors, acting through the Audit Committee, will be proposed at the AGM.
By Order of the Board
Leonard Quaranto
General Counsel & Company Secretary
20 October 2004
Introduction
The Directors of Allied Domecq PLC are committed to the high standards of corporate governance set out in the Principles of Good Governance and Code of Best Practice, which together comprise theCombined Code appended to the Listing Rules of the Financial Services Authority. The Directors are accountable to the Shareholders for ensuring that these principles are understood and implemented throughout the Company’s operations and this statement describes the manner in which Allied Domecq PLC has applied the Principles and Provisions of the Code during the financial year. In July 2003, a New Combined Code was issued by the Financial Reporting Council. The Directors support the spirit of the New Combined Code and comply with the majority of its provisions. They are not, however, required to report on their compliance with the New Combined Code until they report to Shareholders in respect of the financial year ending 31 August 2005.
As a Company listed on the New York Stock Exchange (NYSE), as well as being subject to UK legislation and practice, Allied Domecq is subject to the rules of the US Securities and Exchange Commission (SEC). We continually monitor our compliance with such rules as applicable to foreign registrants and are in compliance with the rules that are currently in force. The Company follows UK corporate governance practice and its practice does not differ significantly from the corporate governance standards set out in section 303A of the NYSE Listed Company Manual, except that the Nomination Committee required by section 303A.4. of the NYSE Listed Company Manual is comprised of a majority, rather than entirely, of independent Directors and it does not have responsibility for corporate governance, which is dealt with by the full Board and the Audit Committee.
Executive and Non-Executive Directors
The Executive Directors are engaged on employment contracts subject to 12 months’ written notice given by either party. Non-Executive Directors are appointed for three-year terms and are generally limited to six years of service. In accordance with the Company’s Articles of Association, all Directors are subject to election by Shareholders at the first opportunity after their appointment, and to re-election thereafter at intervals of no more than three years. The Non-Executive Directors’ (excluding the Chairman’s) fee levels are determined by the Board of Directors with reference to market practice, whilst the Executive Directors’ salary levels and the Chairman’s fee level are determined by the Remuneration Committee. Directors do not participate in decisions regarding their own remuneration.
The remuneration policy and the terms and conditions of service of the Executive and Non-Executive Directors appear in the Directors’ Remuneration Report on pages 46 to 53. Allied Domecq is in compliance with Schedules A and B of the Combined Code relating to remuneration.
43
Organisation and functions of the Board and key Board Committees
The Board is responsible for the overall direction, strategy, performance, values, standards and leadership of Allied Domecq PLC and management succession planning. It is currently comprised of four Executive Directors and five independent Non-Executive Directors (including the independent Chairman). Throughout the financial year, the roles of Chairman and Chief Executive officer have been held separately.
The Board and its Committees have formal terms of reference setting out their authorities and duties and there is a formal written division of responsibilities between the Chairman and Chief Executive.
All Board members have access to the advice and services of the General Counsel & Company Secretary and, in accordance with agreed procedures, are also able to obtain independent professional advice as required at the Company’s expense.
On appointment, new Directors are given the opportunity to participate in an external professional programme for Directors and are offered other appropriate induction and training.
All of the Non-Executive Directors bring a wide range of experience to the Board and participate fully in decisions on key issues facing the Group. All Non-Executive Directors (including the Chairman) are considered by the Board to be independent of management and free from any business or other relationship which could materially interfere with the exercise of independent judgement. The particular role of the Non-Executive Directors includes constructively challenging and contributing to the development of strategy; scrutinising the performance of, and where necessary removing, management; ensuring the Group’s systems of risk management are robust and defensible; determining appropriate levels of remuneration for Executive Directors; and challenging and contributing towards management succession planning.
The Board generally meets at least six times a year focusing on strategic issues and financial performance. The Board has a formal schedule of matters reserved to it for decision and decisions are communicated widely throughout the Allied Domecq Group of companies. Included within this formal schedule of matters is responsibility for the Group’s risk management strategy. All Board members are provided with sufficient information on a timely basis in order to ensure their ability to discharge their duties.
The evaluation of the performance of the Board, Board Committees, the Chief Executive and the individual Non-Executive Directors is the responsibility of the Chairman. The Chairman’s performance is evaluated by the full Board. The performance of the individual Executive Directors, excluding the Chief Executive, is formally evaluated by the Chief Executive.
The Group has a formal Code of Business Conduct which applies to all Directors and employees.
The Board of Allied Domecq Spirits & Wine Limited and the Quick Service Restaurants’ Executive generally meet monthly. These groups, together with the Executive Committee of the Board, implement the strategy set by the main Board and oversee day-to-day operations of the Group, approve projects within capital expenditure limits delegated by the main Board, and lead the management development process.
The Board has established a number of Board Committees, each of which has formal terms of reference. Membership of Board Committees and details of individual attendance at meetings is shown below.
Attendance at meetings
The following table identifies the number of scheduled meetings of the full Board, Audit Committee, Remuneration Committee and Nomination Committee held during the year ended 31 August 2004 and the attendance of each individual Director:
|
| Board |
| Audit |
| Remuneration |
| Nomination |
|
Number of meetings in the year |
| 8 |
| 2 |
| 3 |
| 1 |
|
Sir Gerry Robinson |
| 8 |
| 2 |
| 3 |
| 1 |
|
Philip Bowman |
| 8 |
| — |
| — |
| 1 |
|
Graham Hetherington |
| 8 |
| — |
| — |
| — |
|
David Scotland |
| 8 |
| — |
| — |
| — |
|
Richard Turner |
| 7 |
| — |
| — |
| — |
|
Paul Adams (1) |
| 5 |
| 1 |
| 1 |
| — |
|
Bruno Angelici |
| 8 |
| 2 |
| 3 |
| — |
|
Donald Brydon |
| 8 |
| 2 |
| 3 |
| 1 |
|
John Rishton (2) |
| 5 |
| 1 |
| 2 |
| — |
|
Notes
(1) Appointed 5 December 2003 and has attended all scheduled meetings since appointment, except one Board meeting and one Remuneration Committee meeting.
(2) Appointed 5 December 2003 and has attended all scheduled meetings since appointment, except one Board meeting.
The Audit Committee monitors and reviews the system of financial and operational controls of the Group. It also considers the Group’s compliance with the Combined Code and oversees the objectivity, effectiveness and independence of the auditors. The Committee is comprised of the five independent Non-Executive Directors, including the independent Chairman. The Committee can request the external auditors, Executive Directors and any other officers of the Group to attend its meetings. Additionally, the Group’s internal and external auditors have direct access to the Committee to raise any matters of concern. Going forward the Committee is required to meet at least three times each year and met twice during the financial year ended 31 August 2004. The Committee receives periodic reports from the internal audit function, the external auditors and management summarising audit issues noted and corrective actions planned. It also approves the provision of audit, audit-related and non-audit services to the Group by the external auditors. The Committee has approved detailed procedures regarding ‘up the ladder’ reporting of violations of US securities laws and procedures to ensure compliance with the auditor independence provisions of the Sarbanes-Oxley Act of 2002 to generally safeguard auditor objectivity and independence.
The Remuneration Committee is comprised of the five independent Non-Executive Directors and is responsible for determining the remuneration policy and the terms and conditions of service of the Executive Directors and the Chairman. The Chairman does not participate in decisions regarding his own remuneration. It also reviews external appointments offered to Executive Directors. The Committee generally meets at least twice per year. Committee members are not eligible for any share options, bonuses or pension entitlements. The Committee has access to the services of independent advisers as required.
44
The Nomination Committee has responsibility for leading the process for Board appointments and making recommendations to the Board. It is comprised of a majority of independent Non-Executive Directors and meets from time to time, as required. The Committee met once during the year to approve the appointments of Paul Adams and John Rishton to the Board. Prior to the appointment of a new Director, the Nomination Committee will generally utilise the services of an executive search consultancy to identify suitable candidates who match the role specification prepared and have the experience required. Members of the Nomination Committee interview potential candidates prior to formal consideration by the full Committee and the decision being made to make an appointment.
The Turnbull guidance for directors on internal control was issued in September 1999.
The Board confirms that it has established a process that meets the Turnbull guidance. The process has been in place for the whole of the year to 31 August 2004 and, as part of this process, the Board has received and reviewed regular reports during the year on internal control and risk and has reviewed the effectiveness of the Group’s system of internal control.
Internal control
The Board of Directors has final responsibility for the system of internal control maintained by the Group. The responsibility for establishing and operating detailed control procedures within each operating business lies with the operating Board and local management. The approach to internal control is risk based, with risk management processes including an evaluation of the likelihood and impact of risks. This system provides reasonable, but not absolute, assurance against material loss and includes the safeguarding of assets, the maintenance of proper accounting records, the reliability of financial information, compliance with appropriate legislation, regulation and best practice, and the identification and mitigation of business risks.
Group and local management are responsible for the identification and evaluation of key applicable business, operational, compliance and financial risks. These risks are assessed on a continual basis, taking into account the overall risk environment, and may be associated with a variety of internal or external sources including control breakdowns, disruption in information systems, competition, natural catastrophe and regulatory requirements.
Group businesses participate in periodic strategic reviews which include consideration of long-term financial projections and the evaluation of business alternatives. Operating units prepare annual budgets; performance against budget is actively monitored both at the level of the Board of Allied Domecq Spirits & Wine Limited and the Quick Service Restaurants’ Executive and the main Board, supported by regular forecasts.
A process of annual control self-assessment and hierarchical reporting provides for a documented and auditable trail of accountability from the local business unit to regional management to executive management. This process includes an internal control questionnaire which is completed for all business units and Group functions and reviewed by regional management. The questionnaire is tailored by region to reflect the potential risks and the control environment of the region and each region has appointed a business risk champion to challenge, validate and collate the responses into regionally owned reports. These self-assessment tools provide for successive assurances at increasingly higher levels of management and, finally, to the Board.
The process and the supporting documentation are reviewed by the internal auditors for completeness, accuracy and compliance with Combined Code requirements. Planned corrective actions, where applicable, are independently monitored for timely completion.
Through these mechanisms, risk assessment and internal control have been embedded in ongoing operations. Business performance is continually monitored, risks identified in a timely manner, their financial implications assessed, control procedures re-evaluated and corrective actions agreed and implemented.
The Company will be required to comply with section 404 of the Sarbanes-Oxley Act of 2002 for the financial year ending 31 August 2005. This will require the Chief Executive and Chief Financial Officer to conclude on the effectiveness of internal controls over financial reporting to meet US SEC reporting requirements. Further testing and monitoring procedures are being put in place to enable these reporting requirements to be met. In addition, our external Auditor, KPMG Audit Plc, will be required to report on the procedures established by management to enable compliance and also to conclude on the effectiveness of internal controls over financial reporting.
In addition, throughout the year, the Company has operated a Disclosure Committee, as recommended by the SEC, which is responsible for considering the accuracy, completeness and materiality of information to be included in its financial reports or other public statements as well as determining the Group’s disclosure obligations on a timely basis. The Disclosure Committee reports to the Chief Executive and Chief Financial Officer.
Relations with Shareholders
The Board believes it is important to respond adequately to all the queries of both institutional and private Shareholders. At the AGM, Shareholders are offered an opportunity to raise with the Board and the respective Board Committee Chairmen any specific questions they have concerning the Group. In addition, meetings are also held between the Chief Executive and Chief Financial Officer and institutional Shareholders at various times during the year, and the Chairman and Senior Independent Director will respond as appropriate to requests from institutional Shareholders for meetings. The Directors develop an understanding of major Shareholder views about the Company through receiving regular updates on broker forecasts, media commentary and feedback from institutional meetings. At the AGM the Company conducts the formal business of the meeting by a poll on each separate resolution and the notices covering each AGM are sent to the Shareholders at least 20 working days before the meeting.
Going concern
After making enquiries, the Directors, at the time of approving the financial statements, have determined that there is reasonable expectation that the Company and the Group have adequate resources to continue operating for the foreseeable future. For this reason, the Directors have adopted the going concern basis in preparing the financial statements.
Compliance with Combined Code
The Company was in compliance throughout the financial year with the Code provisions set out in Section 1 of the Combined Code except that Executive Directors were engaged on employment contracts subject to 24 months’ written notice given by either party until new employment contracts with a 12 months’ written notice period were entered into on 20 October 2003.
Our Auditor, KPMG Audit Plc, has reviewed the Directors’ statement on the Company’s compliance to the extent required by the Listing Rules and its report appears on page 54.
45
Directors’ remuneration report
The information contained in this report has been audited by KPMG Audit Plc to the extent required by the Companies Act 1985.
The Remuneration Committee
The Remuneration Committee is a committee of independent Nonexclusive Directors, the members of which are: Donald Brydon (Chairman), Paul Adams, Bruno Angelici, John Rishton and Sir Gerry Robinson. The Committee establishes the terms of employment and remuneration for the Executive Directors and the Chairman.
The Remuneration Committee has appointed Kepler Associates as its executive remuneration advisers and Linklaters as its legal advisers. Kepler Associates provides no other services to the Company; Linklaters also acts as one of the Group’s corporate legal advisers. The Chief Executive normally attends meetings of the Remuneration Committee and assists the Committee on matters relating to the other Executive Directors’ performance and remuneration; he does not participate in decisions regarding his own remuneration. Additionally, the Remuneration Committee is materially assisted by the Group’s Corporate Secretariat and Human Resources functions.
Remuneration policy
This report sets out the Company’s policy on Directors’ remuneration. During the year the Remuneration Committee has conducted a review of the long term incentive arrangements for the Group’s senior executives. This review has been designed to maintain essentially the same overall level of remuneration. Details of the proposed changes are included below.
Allied Domecq operates in global and highly competitive markets. With over 90% of trading profit generated outside the UK and over half of trading profit derived in the Americas, it is vital that the Company operates a remuneration policy appropriate to its global executive talent pool.
Accordingly, the Remuneration policy is designed to provide remuneration which:
• Takes account of practice in the relevant markets;
• Aligns the interests of executives with those of Shareholders by placing heavy emphasis on the linkage between pay and sustained business performance; and
• Provides a high proportion of total reward in Allied Domecq shares delivered over a number of years.
The Group’s reward strategy is for base salaries and benefits including pensions (or cash allowances paid in lieu of benefits) to reflect the relevant market median position and for total compensation to be performance-driven to higher than market median levels as appropriate. This strategy is consistent with the Group’s belief that performance should determine a significant proportion of the total remuneration package for all employees (including Executive Directors).
The fees of the independent Non-Executive Directors (excluding the Chairman) are determined by the Board as a whole, on the recommendation of the Executive Directors, within the overall amount authorised by Shareholders. Directors do not participate in decisions regarding their own remuneration. The fees paid to independent Non-Executive Directors are designed to recognise the significant responsibilities of Directors and to attract individuals with the necessary experience and ability to make an important contribution to the Group’s affairs. The fees, which are neither performance-related nor pensionable, are comparable with those paid by other FTSE 100 companies. Non-Executive Directors do not receive any share options or long term incentive awards.
Remuneration
Proportion of total remuneration
The relative importance of fixed and performance-related remuneration for the Executive Directors based on the remuneration policy set out in this report is broadly as follows:
Remuneration mix
1 | Base salary/benefits |
|
2 | Performance-related bonuses | |
3 | Long Term Incentives | |
|
| |
|
| |
|
| |
|
|
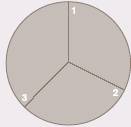
|
| Base |
| Performance- |
| Long Term |
| Total |
|
All Executive Directors |
| 28–34 | % | 26–32 | % | 30–45 | % | 100 | % |
Note
(1) The above information is based on current base salaries and other benefits, maximum potential bonus payments and associated maximum deferral/matching of bonuses and expected value for long-term incentives. It excludes pension benefits or pension allowances paid in lieu thereof and participation in all-employee share plans.
Base salary
Salaries of the Executive Directors are reviewed annually on 1 January of each year, taking into consideration the pay levels in a comparator group of approximately 20 other international FMCG companies of a size and complexity relevant to that of Allied Domecq.
46
Pensions
The Company recognises that pension provision is an important component of total remuneration. David Scotland and Graham Hetherington are eligible for a pension from the Allied Domecq Pension Fund, subject to the UK Inland Revenue Earnings Cap. Executive Directors who have joined the Group since 1998 have not been invited to join the Fund. As a result of this policy, Philip Bowman is not a member of the Fund and hence accrues no pension benefits. To the extent that Executive Directors receive salary that is not pensionable, they are paid an allowance in lieu of pension benefits.
Details of the accrued pension benefits of those Executive Directors who participate in the Company’s non-contributory pension scheme are shown on page 51. Details of allowances paid in lieu of pensions are reported in the Directors’ Remuneration table shown on page 50.
Benefits
Benefits include the provision of private health, life and other insurances, car allowances, pension allowances for those Directors who do not participate in the Company-sponsored pension plans or whose benefits under the Company plans are limited by the UK Inland Revenue Earnings Cap, business-related partner travel costs and certain other minor benefits. These benefits do not form part of pensionable earnings.
Performance-related bonuses
The Company operates a Deferred Bonus Plan for the Executive Directors and certain other senior executives. The Remuneration Committee sets performance targets annually based on relevant market measures and, for the year ended 31 August 2004, the bonuses were based on earnings per share growth and completion of key management and business objectives.
The bonus payable to participants in respect of the year was the equivalent of 14% of their annual base salary for every 1% of real growth in the Company’s normalised earnings per share (adjusted by the Remuneration Committee to measure underlying business performance). The maximum bonus receivable based on earnings per share growth was 80% of base salary.
An additional bonus of up to 20% of salary was available under the Plan on the achievement of certain key management and business objectives.
In order to promote share ownership and to aid retention, 25% of the bonus awarded is automatically, and up to a further 25% of the bonus awarded may be voluntarily, deferred and invested in Allied Domecq shares, which are forfeitable under certain circumstances. A matching award of an equal number of shares is awarded subject to the executive remaining in employment. 50% of the shares are released to the executive after two years and the remaining 50% of the shares are released to the executive after three years. The matching award is not subject to the achievement of any further performance conditions because it relates to the deferred element of a bonus which has already been earned.
Long Term Incentives
The Executive Directors currently participate in the Group’s Executive Share Option Schemes and Long Term Incentive Scheme. When determining awards under the Schemes the Remuneration Committee takes account of the role and responsibility of the individual and relevant market practice. In accordance with market practice, awards are currently made annually.
At the time of grant the combined awards have an expected value of up to 2 x base salary for the Chief Executive and up to 1 x base salary for all other Executive Directors. Expected value for awards made during the year ended 31 August 2004 was calculated at 22.5% of face value for options granted under the Executive Share Option Schemes and 40% of face value for awards under the Long Term Incentive Scheme.
The performance conditions selected by the Remuneration Committee for the Executive Share Option Schemes and the Long Term Incentive Scheme are designed to be challenging, to align the interests of management with those of the Shareholders and were agreed following extensive consultation with Shareholder representative bodies.
Executive Share Option Schemes
The Group operates Executive Share Option Schemes for Executive Directors, other senior executives and other employees for exceptional performance. The Schemes are the Inland Revenue Approved Executive Share Option Scheme 1999, the Executive Share Option Scheme 1999 (incorporating US Schedule) and the Share Appreciation Rights Plan 1999. The Executive Share Option Schemes provide for the grant of options or share appreciation rights at an exercise price of not less than market value which under normal circumstances remain exercisable between the third and tenth anniversaries of the date of grant (though shorter life options or share appreciation rights may be granted under certain of the Schemes). The Remuneration Committee sets performance conditions that must be met before the options or share appreciation rights become exercisable.
During the year ended 31 August 2004, options were granted with a face value of 275% of base salary to the Chief Executive and 175% of base salary at the date of grant to all other Executive Directors.
Options become exercisable if Allied Domecq’s growth in normalised earnings per share exceeds the growth in the UK retail prices index (excluding mortgage interest) by 9% over three years. If the performance condition is not met over the three years following the grant of options, the condition is re-tested after four years and, if necessary, again after five years, with a consequent increase in earnings per share growth to 12% over four years or 15% over five years. If the performance condition is not met after five years, the options will lapse.
As a result of the Remuneration Committee’s review of long term incentive arrangements, it is proposed to replace the grant of options under the Executive Share Option Schemes with the award of conditional shares under a new Performance Share Plan. Introduction of the new Plan is subject to Shareholder approval at the Company’s AGM to be held on 28 January 2005 and a detailed summary of the plan is contained in the Chairman’s Letter to Shareholders accompanying this Annual Report and Accounts. Vesting of conditional awards under the Plan will be subject to Allied Domecq’s annualised growth in normalised earnings per share exceeding the growth in the UK retail prices index (excluding mortgage interest) over three years, according to the following schedule:
3% real EPS growth per annum | 20% vesting |
7% real EPS growth per annum | 100% vesting |
For performance that is between 3% and 7% real EPS growth per annum, the number of shares that vest is determined on a straight line basis.
47
There is no performance re-testing under the new Plan.
When considering the achievement of the performance conditions under both the Executive Share Option Schemes and the new Performance Share Plan, the Remuneration Committee has the discretion to adjust earnings per share to measure the underlying business performance of the Group.
Long Term Incentive Scheme
Under the Long Term Incentive Scheme 1999, awards are made to the Executive Directors and certain other senior executives, subject to the achievement of performance conditions set by the Remuneration Committee at award.
During the year ended 31 August 2004, awards were made under the Long Term Incentive Scheme with a face value of 200% of base salary for the Chief Executive and 100% of base salary to all other Executive Directors.
These awards are subject to Allied Domecq’s Total Shareholder Return performance over a three-year period relative to a comparator group of companies. No shares will be delivered unless Total Shareholder Return is above median of the comparator group and for performance at the median of the comparator group 40% of the shares can be earned. The full number of shares can only be earned if the Total Shareholder Return is at or above upper quartile. For performance that is between median and upper quartile the number of shares that vest is determined on a straight line basis. In addition, awards will only vest if the Remuneration Committee is satisfied that underlying financial performance is satisfactory. As a result of the Remuneration Committee’s review of long term incentive arrangements, for the year ending 31 August 2005 the number of shares that can be earned for median performance is being reduced to 20% of the number initially awarded. In addition, it is proposed to amend the Scheme rules to result in the accrual of dividends on shares earned. This amendment is subject to Shareholder approval at the Company’s AGM to be held on 28 January 2005.
The comparator groups for the various awards under the Long Term Incentive Scheme comprise the following companies from the FMCG sector:
Year ended 31 August 2002
Associated British Foods |
|
Six Continents (1) |
|
British American Tobacco |
|
Cadbury Schweppes |
|
Diageo |
|
Gallaher Group |
|
Imperial Tobacco |
|
Scottish & Newcastle |
|
SAB Miller |
|
Tate & Lyle |
|
Unilever |
|
Whitbread |
|
Years ended 31 August 2003 and 2004
Altria Group |
|
Anheuser-Busch |
|
Associated British Foods |
|
British American Tobacco |
|
Brown Forman |
|
Cadbury Schweppes |
|
Carlsberg |
|
Diageo |
|
Gallaher Group |
|
Heineken |
|
Imperial Tobacco |
|
Kellogg |
|
Nestlé |
|
Pernod Ricard |
|
Procter and Gamble |
|
SAB Miller |
|
Scottish & Newcastle |
|
Six Continents/Mitchells and Butlers (1) |
|
Tate & Lyle |
|
Unilever |
|
Whitbread |
|
|
|
Note
(1) Following the demerger of Six Continents, the methodology followed to track TSR performance has been to synthesise the effect of the transaction. On demerger, Six Continents shareholders received 50 Mitchells and Butlers (MAB) shares, 50 Intercontinental Hotels Group (IHG) shares and 81 pence in cash for every 59 Six Continents shares held. The cash payment has been applied as a special dividend reinvested equally in shares of MAB and IHG. For awards made during the year ended 31 August 2004, Six Continents was replaced in the comparator group by Mitchells and Butlers.
It is currently intended that the current comparator group, as described above, will be the comparator group used for future awards under the Long Term Incentive Scheme.
Despite the very strong TSR performance of the Company relative to the FTSE 100 Index over the past five years, illustrated on the graph on page 49, the options granted under the Long Term Incentive Scheme in May 2001 did not vest.
All-employee share plans
The Executive Directors are also eligible to participate in the other share plans that are open to all employees in certain jurisdictions. These plans are the SAYE plans, namely the SAYE Scheme 1999, the International SAYE Scheme 1999 and the United States Share Purchase Plan, and the Share Partnership Plan. The SAYE plans offer savings contracts and the right to buy shares with the projected savings proceeds at an exercise price of not less than 80% of the market value of the shares at grant. There have been no options granted under the SAYE plans since those granted during the year ended 31 August 2002. The Share Partnership Plan is an Inland Revenue approved share incentive plan; eligible employees may purchase shares on a monthly basis from gross pay and the Company matches their investment on a one-for-four basis. As is normal practice for share plans that are open to all employees, performance conditions do not apply to the all-employee share plans.
Service agreements
Executive Directors
Details of the Executive Directors’ service agreements are as follows:
|
| Agreement |
| Unexpired |
| Notice |
|
Philip Bowman |
| 20 October 2003 |
| Rolling 12 months |
| 12 months |
|
Graham Hetherington |
| 20 October 2003 |
| Rolling 12 months |
| 12 months |
|
David Scotland |
| 20 October 2003 |
| Rolling 12 months |
| 12 months |
|
Richard Turner |
| 20 October 2003 |
| Rolling 12 months |
| 12 months |
|
48
The Executive Directors previously had service agreements requiring not less than 24 months’ notice of termination to be given by either party. The Remuneration Committee reviewed this policy in October 2003 and it was agreed that the Executive Directors would enter into new service agreements requiring not less than 12 months’ notice of termination to be given by either party.
The current service agreements contain provisions for compensation to be payable to the Directors upon early termination of employment without cause (ie without a reason or reasons otherwise entitling the Company to terminate an Executive Director’s employment in accordance with the terms of the agreement). Such compensation broadly provides for the payment to an Executive Director whose employment is terminated without cause of a sum equal to 95% of annual base salary, contractual benefits and bonuses.
Non-Executive Directors
The independent Non-Executive Directors (including the independent Chairman) do not have service agreements with the Company. It is the policy of the Company to appoint Non-Executive Directors for an initial period of three years renewable for a further period of three years, subject to election and re-election by Shareholders in general meeting. The Board has to ratify any further period of appointment after this six-year period. Following completion of his second three-year term, Donald Brydon has been reappointed by the Board on an annual basis. The Chairman has a letter of appointment dated 29 January 2002 which requires not less than 12 months’ notice of termination to be given by either party.
External appointments
Allied Domecq encourages its Executive Directors to serve as Non-Executive Directors of other leading companies subject to such appointments being conducive to their personal development, the time spent being reasonable and there being no conflict of interest. The policy relating to fees is that generally the Director may retain the fees, as such positions entail personal responsibility on their part.
Performance graph
The graph below shows Allied Domecq’s Total Shareholder Return for the five years to 31 August 2004 measured against the Total Shareholder Return of the FTSE 100 Index for the same period. As Allied Domecq has been a constituent of the FTSE 100 Index for nearly the whole of this five-year period, that index is considered to be the most appropriate benchmark.

Source: Datastream
49
Directors’ remuneration and interests
Remuneration (audited)
|
| Salary/fees |
| Pension allowance (4) |
| Other benefits |
| Performance-related |
| Total |
| ||||||||||
|
| Year to |
| Year to |
| Year to |
| Year to |
| Year to |
| Year to |
| Year to |
| Year to |
| Year to |
| Year to |
|
|
| 31 Aug |
| 31 Aug |
| 31 Aug |
| 31 Aug |
| 31 Aug |
| 31 Aug |
| 31 Aug |
| 31 Aug |
| 31 Aug |
| 31 Aug |
|
|
| 2004 |
| 2003 |
| 2004 |
| 2003 |
| 2004 |
| 2003 |
| 2004 |
| 2003 |
| 2004 |
| 2003 |
|
|
| £’000 |
| £’000 |
| £’000 |
| £’000 |
| £’000 |
| £’000 |
| £’000 |
| £’000 |
| £’000 |
| £’000 |
|
Executive Directors |
|
|
|
|
|
|
|
|
|
|
|
|
|
|
|
|
|
|
|
|
|
Philip Bowman |
| 730 |
| 665 |
| 307 |
| 279 |
| 25 |
| 24 |
| 1,125 |
| 1,035 |
| 2,187 |
| 2,003 |
|
Graham Hetherington |
| 357 |
| 335 |
| 77 |
| 71 |
| 16 |
| 15 |
| 529 |
| 507 |
| 979 |
| 928 |
|
David Scotland |
| 374 |
| 353 |
| 82 |
| 77 |
| 33 |
| 28 |
| 570 |
| 542 |
| 1,059 |
| 1,000 |
|
Richard Turner |
| 344 |
| 324 |
| — |
| — |
| 20 |
| 13 |
| 520 |
| 415 |
| 884 |
| 752 |
|
|
|
|
|
|
|
|
|
|
|
|
|
|
|
|
|
|
|
|
|
|
|
Non-Executive Directors |
|
|
|
|
|
|
|
|
|
|
|
|
|
|
|
|
|
|
|
|
|
Sir Gerry Robinson |
| 200 |
| 200 |
| — |
| — |
| — |
| 11 |
| — |
| — |
| 200 |
| 211 |
|
Paul Adams (1) (appointed 5 December 2003) |
| 30 |
| — |
| — |
| — |
| — |
| — |
| — |
| — |
| 30 |
| — |
|
Bruno Angelici |
| 40 |
| — |
| — |
| — |
| — |
| — |
| — |
| — |
| 40 |
| — |
|
Donald Brydon (2) |
| 69 |
| 66 |
| — |
| — |
| — |
| — |
| — |
| — |
| 69 |
| 66 |
|
Sir Ross Buckland |
| 17 |
| 34 |
| — |
| — |
| — |
| — |
| — |
| — |
| 17 |
| 34 |
|
Peter Jacobs |
| 19 |
| 39 |
| — |
| — |
| — |
| — |
| — |
| — |
| 19 |
| 39 |
|
David Malpas (retired 20 October 2003) |
| 6 |
| 39 |
| — |
| — |
| — |
| — |
| — |
| — |
| 6 |
| 39 |
|
John Rishton (appointed 5 December 2003) |
| 33 |
| — |
| — |
| — |
| — |
| — |
| — |
| — |
| 33 |
| — |
|
|
|
|
|
|
|
|
|
|
|
|
|
|
|
|
|
|
|
|
|
|
|
Payment to former Director (3) |
|
|
|
|
|
|
|
|
|
|
|
|
|
|
|
|
| 270 |
| — |
|
Total |
| 2,219 |
| 2,055 |
| 466 |
| 427 |
| 94 |
| 91 |
| 2,744 |
| 2,499 |
| 5,793 |
| 5,072 |
|
Notes
(1) Paul Adam’s fee as Non-Executive Director is paid directly to his principal employer, British American Tobacco p.l.c.
(2) Donald Brydon’s fee as Senior Independent Non-Executive Director includes his roles as Chairman of the Remuneration Committee and Chairman of the Allied Domecq pensions trusts.
(3) The ‘Payment to former Director’ is in respect of a phantom arrangement related to the share options of George McCarthy who retired as a Director on 29 February 2000.
(4) Philip Bowman is not a member of any Allied Domecq pension scheme. Both Graham Hetherington and David Scotland are members of the Allied Domecq Executives Pension Fund but their pension benefits only relate to that part of their salary up to the Inland Revenue Earnings Cap (currently £102,000 per annum).
(5) The performance-related bonus figures shown above include the deferred and matching elements of the bonus that are received in shares. The deferred bonus shares are forfeitable in certain circumstances and 50% of the deferred bonus shares are released to the executive after two years and the remaining 50% of the deferred bonus shares are released to the executive after three years. It should be noted that the matching shares are conditional, except under exceptional circumstances, on continued employment with the Group and therefore a significant amount of the performance-related bonus reported in the table above is not received by the Director until the end of the deferral period that operates under the Deferred Bonus Plan. A breakdown of the total bonuses reported is as follows:
|
|
|
| Amount of deferred |
|
|
|
|
|
|
|
|
| bonus taken in |
| Current value of |
|
|
|
|
| Cash bonus |
| forfeitable shares |
| matching shares |
| Total |
|
|
| £’000 |
| £’000 |
| £’000 |
| £’000 |
|
Philip Bowman |
| 375 |
| 375 |
| 375 |
| 1,125 |
|
Graham Hetherington |
| 176.4 |
| 176.4 |
| 176.4 |
| 529.2 |
|
David Scotland |
| 190 |
| 190 |
| 190 |
| 570 |
|
Richard Turner |
| 173.25 |
| 173.25 |
| 173.25 |
| 519.75 |
|
50
Pension entitlements (audited)
|
|
|
|
|
| Additional |
|
|
|
|
|
|
| Additional |
|
|
|
|
|
|
|
|
| pension |
|
|
|
|
|
|
| pension |
|
|
|
|
|
|
|
|
| earned to |
|
|
|
|
|
|
| earned to |
| Transfer |
|
|
|
|
|
|
| 31 August |
|
|
|
|
|
|
| 31 August |
| value of the |
|
|
| Accrued |
| Accrued |
| 2004 |
| Transfer |
| Transfer |
|
|
| 2004 |
| increase in |
|
|
| pension at |
| pension at |
| (including |
| value at |
| value at |
| Change in |
| (excluding |
| pension |
|
|
| 31 August |
| 31 August |
| inflation |
| 31 August |
| 31 August |
| transfer |
| inflation |
| (excluding |
|
|
| 2004 |
| 2003 |
| increase) |
| 2004 |
| 2003 |
| value |
| increase) |
| inflation) |
|
|
| £’000 pa |
| £’000 pa |
| £’000 pa |
| £’000 |
| £’000 |
| £’000 |
| £’000 pa |
| £’000 pa |
|
Graham Hetherington |
| 31 |
| 37 |
| (6 | ) | 342 |
| 380 |
| (38 | ) | (7 | ) | (74 | ) |
David Scotland |
| 41 |
| 36 |
| 5 |
| 704 |
| 600 |
| 104 |
| 3 |
| 60 |
|
Richard Turner |
| 230 |
| 217 |
| 13 |
| 3,793 |
| 3,419 |
| 374 |
| 7 |
| 107 |
|
Notes
(1) The pension entitlement shown above is that which would be paid annually on retirement based on service to the end of the year.
(2) The transfer value has been calculated on the basis of actuarial advice in accordance with Actuarial Guidance Note GN11. No contractual contributions were due to have been paid by Directors during the period.
(3) Members of the Allied Domecq Executives Pension Fund have the option to pay additional voluntary contributions to secure additional pension benefits. Neither the contributions nor the resulting benefits are included in the above table.
(4) Details of the Company’s policy on Directors’ pensions are included on page 47 of this report.
Directors’ interests
The Company’s Register of Directors’ Interests contains full details of the Directors’ shareholdings and options to acquire shares in the Company.
Shareholdings
The beneficial interests of Directors in the Ordinary Share capital of the Company at 31 August 2004 were as follows:
|
|
|
| At 1 September 2003 |
|
|
| At 31 August 2004 |
| (or date of appointment, if later) |
|
|
| Number of Ordinary Shares* |
| Number of Ordinary Shares* |
|
Paul Adams |
| — |
| — |
|
Bruno Angelici |
| 2,000 |
| — |
|
Philip Bowman |
| 430,653 |
| 308,833 |
|
Donald Brydon |
| 11,500 |
| 11,500 |
|
Graham Hetherington |
| 156,724 |
| 107,253 |
|
John Rishton |
| — |
| — |
|
Sir Gerry Robinson |
| — |
| — |
|
David Scotland |
| 142,746 |
| 77,766 |
|
Richard Turner |
| 131,977 |
| 106,875 |
|
Total |
| 875,600 |
| 612,227 |
|
Notes
(1) At 31 August 2004 the Allied Domecq employee trusts held 27,073,905 (2003: 32,549,067) unallocated Ordinary Shares* in the Company on discretionary terms for the benefit of certain Group employees. The Executive Directors were treated as interested in these shares in their capacity as potential beneficiaries. As at 20 October 2004 these holdings had reduced to 26,183,923 Ordinary Shares*.
(2) The above table includes interests in deferred bonus shares awarded under the Company’s Deferred Bonus Plan and partnership shares purchased pursuant to the Company’s Share Partnership Plan and associated matching shares. The Directors beneficially own such shares, however certain of these shares are forfeitable in specific circumstances. The table excludes interests in matching shares under the Company’s Deferred Bonus Plan and interests in the Company’s Share Option and Long Term Incentive Schemes disclosed on pages 52 and 53.
(3) Philip Bowman purchased a further 66 shares and Richard Turner purchased a further 181 shares between 1 September 2004 and 20 October 2004. No Director had a non-beneficial interest in shares or stocks of the Company at any time either during the year ended 31 August 2004 or between 1 September 2004 and 20 October 2004.
* Includes American Depositary Shares representing underlying Ordinary Shares.
As a result of the Remuneration Committee’s review of long term incentive arrangements, the Committee has introduced guidelines under which the Executive Directors are expected to build up significant personal holdings of Allied Domecq shares. We believe this will further align their interests with those of Shareholders. The guidelines are 2 x salary for the Chief Executive and 1 x salary for other Executive Directors.
51
Deferred Bonus Plan awards (audited)
As at 31 August 2004 the Executive Directors were interested in the following shares pursuant to matching share awards made under the Company’s Deferred Bonus Plan:
|
| At 1 September 2003 |
| Awarded during year |
| Vested during year |
| Lapsed during year |
| At 31 August 2004 |
|
|
|
|
| Ordinary Shares |
| Ordinary Shares |
| Ordinary Shares |
| Ordinary Shares |
| Ordinary Shares |
| Release date |
|
Philip Bowman |
| 67,873 |
| — |
| 67,873 |
| — |
| — |
| 31.08.04 |
|
|
| 62,579 |
| — |
| — |
| — |
| 62,579 |
| 31.08.05 |
|
|
| — |
| 44,620 |
| — |
| — |
| 44,620 |
| 31.08.05 |
|
|
| — |
| 44,619 |
| — |
| — |
| 44,619 |
| 31.08.06 |
|
Total |
| 130,452 |
| 89,239 |
| 67,873 |
| — |
| 151,818 |
|
|
|
Graham Hetherington |
| 32,239 |
| — |
| 32,239 |
| — |
| — |
| 31.08.04 |
|
|
| 31,035 |
| — |
| — |
| — |
| 31,035 |
| 31.08.05 |
|
|
| — |
| 21,841 |
| — |
| — |
| 21,841 |
| 31.08.05 |
|
|
| — |
| 21,841 |
| — |
| — |
| 21,841 |
| 31.08.06 |
|
Total |
| 63,274 |
| 43,682 |
| 32,239 |
| — |
| 74,717 |
|
|
|
David Scotland |
| 18,267 |
| — |
| 18,267 |
| — |
| — |
| 31.08.04 |
|
|
| 16,942 |
| — |
| — |
| — |
| 16,942 |
| 31.08.05 |
|
|
| — |
| 23,357 |
| — |
| — |
| 23,357 |
| 31.08.05 |
|
|
| — |
| 23,356 |
| — |
| — |
| 23,356 |
| 31.08.06 |
|
Total |
| 35,209 |
| 46,713 |
| 18,267 |
| — |
| 63,655 |
|
|
|
Richard Turner |
| 15,837 |
| — |
| 15,837 |
| — |
| — |
| 31.08.04 |
|
|
| 15,619 |
| — |
| — |
| — |
| 15,619 |
| 31.08.05 |
|
|
| — |
| 10,735 |
| — |
| — |
| 10,735 |
| 31.08.05 |
|
|
| — |
| 10,734 |
| — |
| — |
| 10,734 |
| 31.08.06 |
|
Total |
| 31,456 |
| 21,469 |
| 15,837 |
| — |
| 37,088 |
|
|
|
Note
(1) Full details covering the operation of the Company’s Deferred Bonus Plan are included on page 47 of this report.
Cash award (audited)
As reported last year, in November 2002, the Remuneration Committee made awards of deferred cash bonuses to certain senior executives including the four Executive Directors. These awards were made to take the place of grants of options under the Long Term Incentive Scheme which would have been made but in the event could not properly be made because of consolidation activity in the industry. In making these awards the Remuneration Committee took account of the value created for Shareholders. The structure of the award has been designed to retain those executives who are eligible to receive the awards. The award was equal to 100% of base salary as at 1 January 2003. The payment of the award was subject to the executive remaining in employment on the payment dates. Half of the award was paid on 1 September 2003 and the other half was paid on 1 September 2004.
|
| At 1 September 2003 |
| Awarded during year |
| Vested during year |
| Lapsed during year |
| At 31 August 2004 |
| Release date |
|
|
| £’000 |
| £’000 |
| £’000 |
| £’000 |
| £’000 |
|
|
|
Philip Bowman |
| 345 |
| — |
| 345 |
| — |
| — |
| 01.09.03 |
|
|
| 345 |
| — |
| — |
| — |
| 345 |
| 01.09.04 |
|
Total |
| 690 |
| — |
| 345 |
| — |
| 345 |
|
|
|
Graham Hetherington |
| 175 |
| — |
| 175 |
| — |
| — |
| 01.09.03 |
|
|
| 175 |
| — |
| — |
| — |
| 175 |
| 01.09.04 |
|
Total |
| 350 |
| — |
| 175 |
| — |
| 175 |
|
|
|
David Scotland |
| 181.5 |
| — |
| 181.5 |
| — |
| — |
| 01.09.03 |
|
|
| 181.5 |
| — |
| — |
| — |
| 181.5 |
| 01.09.04 |
|
Total |
| 363 |
| — |
| 181.5 |
| — |
| 181.5 |
|
|
|
Richard Turner |
| 166 |
| — |
| 166 |
| — |
| — |
| 01.09.03 |
|
|
| 166 |
| — |
| — |
| — |
| 166 |
| 01.09.04 |
|
Total |
| 332 |
| — |
| 166 |
| — |
| 166 |
|
|
|
52
Share Options and Long Term Incentive awards (audited)
The following movements in Share Option and Long Term Incentive Scheme awards occurred during the year:
|
|
| Number of |
| Options |
| Options |
| Options |
| Number of |
|
|
|
|
|
|
|
|
|
|
|
|
|
|
|
|
|
| options at |
| granted |
| exercised |
| lapsed |
| options at |
|
|
|
|
|
|
|
|
|
|
|
|
|
|
|
|
|
| 1 September |
| during |
| during |
| during |
| 31 August |
|
|
|
|
|
|
|
|
| Date |
|
|
|
|
|
|
|
| 2003 |
| year |
| year |
| year |
| 2004 |
|
|
| Market price |
| Gain |
|
|
| from |
|
|
| Exercisable/ |
|
|
|
| Ordinary |
| Ordinary |
| Ordinary |
| Ordinary |
| Ordinary |
| Exercise |
| at date of |
| made on |
| Date of |
| which |
| Expiry |
| not |
|
|
|
| Shares |
| Shares |
| Shares |
| Shares |
| Shares |
| price |
| exercise |
| exercise |
| grant |
| exercisable |
| date |
| exercisable |
|
|
|
|
|
|
|
|
|
|
|
|
|
|
|
|
|
| £ |
|
|
|
|
|
|
|
|
|
P Bowman | (b) |
| 608,187 |
| — |
| — |
| — |
| 608,187 |
| 342 | p | — |
| — |
| 01.11.99 |
| 01.11.02 |
| 31.10.09 |
|
| * |
| (c) |
| 441,176 |
| — |
| — |
| 441,176 |
| — |
| 0.1 | p | — |
| — |
| — |
| — |
| 07.05.11 |
| n/a |
|
| (c) |
| 512,091 |
| — |
| — |
| — |
| 512,091 |
| 0.1 | p | — |
| — |
| 02.11.01 |
| 02.11.04 |
| 01.11.11 |
|
| ** |
| (d) |
| 7,853 |
| — |
| — |
| — |
| 7,853 |
| 382 | p | — |
| — |
| 01.11.02 |
| 01.11.05 |
| 31.10.12 |
|
| ** |
| (b) |
| 434,882 |
| — |
| — |
| — |
| 434,882 |
| 382 | p | — |
| — |
| 01.11.02 |
| 01.11.05 |
| 31.10.12 |
|
| ** |
| (c) |
| 321,989 |
| — |
| — |
| — |
| 321,989 |
| 0.1 | p | — |
| — |
| 01.11.02 |
| 01.11.05 |
| 31.10.12 |
|
| ** |
| (b) |
| — |
| 495,430 |
| — |
| — |
| 495,430 |
| 383 | p | — |
| — |
| 23.10.03 |
| 23.10.06 |
| 22.10.13 |
|
| ** |
| (c) |
| — |
| 360,313 |
| — |
| — |
| 360,313 |
| 0.1 | p | — |
| — |
| 23.10.03 |
| 23.10.06 |
| 22.10.13 |
|
| ** |
Total |
|
| 2,326,178 |
| 855,743 |
| — |
| 441,176 |
| 2,740,745 |
|
|
|
|
| — |
|
|
|
|
|
|
|
|
|
G Hetherington | (a) |
| 6,440 |
| — |
| — |
| — |
| 6,440 |
| 262 | p | — |
| — |
| 03.12.99 |
| 01.01.05 |
| 30.06.05 |
|
| ** |
| (b) |
| 263,157 |
| — |
| — |
| — |
| 263,157 |
| 342 | p | — |
| — |
| 01.11.99 |
| 01.11.02 |
| 31.10.09 |
|
| * |
| (c) |
| 104,779 |
| — |
| — |
| 104,779 |
| — |
| 0.1 | p | — |
| — |
| — |
| — |
| 07.05.11 |
| n/a |
|
| (c) |
| 121,621 |
| — |
| — |
| — |
| 121,621 |
| 0.1 | p | — |
| — |
| 02.11.01 |
| 02.11.04 |
| 01.11.11 |
|
| ** |
| (d) |
| 7,853 |
| — |
| — |
| — |
| 7,853 |
| 382 | p | — |
| — |
| 01.11.02 |
| 01.11.05 |
| 31.10.12 |
|
| ** |
| (b) |
| 131,872 |
| — |
| — |
| — |
| 131,872 |
| 382 | p | — |
| — |
| 01.11.02 |
| 01.11.05 |
| 31.10.12 |
|
| ** |
| (c) |
| 79,842 |
| — |
| — |
| — |
| 79,842 |
| 0.1 | p | — |
| — |
| 01.11.02 |
| 01.11.05 |
| 31.10.12 |
|
| ** |
| (b) |
| — |
| 159,921 |
| — |
| — |
| 159,921 |
| 383 | p | — |
| — |
| 23.10.03 |
| 23.10.06 |
| 22.10.13 |
|
| ** |
| (c) |
| — |
| 91,383 |
| — |
| — |
| 91,383 |
| 0.1 | p | — |
| — |
| 23.10.03 |
| 23.10.06 |
| 22.10.13 |
|
| ** |
Total |
|
| 715,564 |
| 251,304 |
| — |
| 104,779 |
| 862,089 |
|
|
|
|
| — |
|
|
|
|
|
|
|
|
|
D Scotland | (b) |
| 350,877 |
| — |
| — |
| — |
| 350,877 |
| 342 | p | — |
| — |
| 01.11.99 |
| 01.11.02 |
| 31.10.09 |
|
| * |
| (c) |
| 119,485 |
| — |
| — |
| 119,485 |
| — |
| 0.1 | p | — |
| — |
| — |
| — |
| 07.05.11 |
| n/a |
|
| (c) |
| 138,691 |
| — |
| — |
| — |
| 138,691 |
| 0.1 | p | — |
| — |
| 02.11.01 |
| 02.11.04 |
| 01.11.11 |
|
| ** |
| (d) |
| 7,853 |
| — |
| — |
| — |
| 7,853 |
| 382 | p | — |
| — |
| 01.11.02 |
| 01.11.05 |
| 31.10.12 |
|
| ** |
| (b) |
| 144,699 |
| — |
| — |
| — |
| 144,699 |
| 382 | p | — |
| — |
| 01.11.02 |
| 01.11.05 |
| 31.10.12 |
|
| ** |
| (c) |
| 87,172 |
| — |
| — |
| — |
| 87,172 |
| 0.1 | p | — |
| — |
| 01.11.02 |
| 01.11.05 |
| 31.10.12 |
|
| ** |
| (b) |
| — |
| 165,861 |
| — |
| — |
| 165,861 |
| 383 | p | — |
| — |
| 23.10.03 |
| 23.10.06 |
| 22.10.13 |
|
| ** |
| (c) |
| — |
| 94,778 |
| — |
| — |
| 94,778 |
| 0.1 | p | — |
| — |
| 23.10.03 |
| 23.10.06 |
| 22.10.13 |
|
| ** |
Total |
|
| 848,777 |
| 260,639 |
| — |
| 119,485 |
| 989,931 |
|
|
| — |
|
|
|
|
|
|
|
|
|
|
|
R Turner | (b) |
| 304,093 |
| — |
| — |
| — |
| 304,093 |
| 342 | p | — |
| — |
| 01.11.99 |
| 01.11.02 |
| 31.10.09 |
|
| * |
| (c) |
| 102,941 |
| — |
| — |
| 102,941 |
| — |
| 0.1 | p | — |
| — |
| — |
| — |
| 07.05.11 |
| n/a |
|
| (c) |
| 119,487 |
| — |
| — |
| — |
| 119,487 |
| 0.1 | p | — |
| — |
| 02.11.01 |
| 02.11.04 |
| 01.11.11 |
|
| ** |
| (d) |
| 7,853 |
| — |
| — |
| — |
| 7,853 |
| 382 | p | — |
| — |
| 01.11.02 |
| 01.11.05 |
| 31.10.12 |
|
| ** |
| (b) |
| 132,788 |
| — |
| — |
| — |
| 132,788 |
| 382 | p | — |
| — |
| 01.11.02 |
| 01.11.05 |
| 31.10.12 |
|
| ** |
| (c) |
| 80,366 |
| — |
| — |
| — |
| 80,366 |
| 0.1 | p | — |
| — |
| 01.11.02 |
| 01.11.05 |
| 31.10.12 |
|
| ** |
| (b) |
| — |
| 151,697 |
| — |
| — |
| 151,697 |
| 383 | p | — |
| — |
| 23.10.03 |
| 23.10.06 |
| 22.10.13 |
|
| ** |
| (c) |
| — |
| 86,684 |
| — |
| — |
| 86,684 |
| 0.1 | p | — |
| — |
| 23.10.03 |
| 23.10.06 |
| 22.10.13 |
|
| ** |
Total |
|
| 747,528 |
| 238,381 |
| — |
| 102,941 |
| 882,968 |
|
|
|
|
| — |
|
|
|
|
|
|
|
|
|
(a) SAYE Scheme 1999 (b) Executive Share Option Scheme 1999 (c) Long Term Incentive Scheme 1999 (d) Inland Revenue Approved Executive Share Option Scheme 1999
Notes
* Exercisable
** Not exercisable
(1) The middle market price of the Ordinary Shares at 31 August 2004 was 444.00p and the range during the year to 31 August 2003 was 366.50p to 482.25p.
(2) Details of the performance conditions related to the Executive Share Option Schemes and the Long Term Incentive Scheme are included on pages 47 and 48 of this report.
By Order of the Board
Leonard Quaranto
General Counsel & Company Secretary
20 October 2004
53
Independent auditor’s report to the members of Allied Domecq PLC
We have audited the accounts on pages 55 to 79. We have also audited the information in the Directors’ Remuneration Report that is described as having been audited.
This report is made solely to the Company’s members, as a body, in accordance with section 235 of the Companies Act 1985. Our audit work has been undertaken so that we might state to the Company’s members those matters we are required to state to them in an auditor’s report and for no other purpose. To the fullest extent permitted by law, we do not accept or assume responsibility to anyone other than the Company and the Company’s members as a body, for our audit work, or for the opinions we have formed.
Respective responsibilities of directors and auditors
The Directors are responsible for preparing the Annual Report and the Directors’ Remuneration Report. As described on page 41 this includes responsibility for preparing the accounts in accordance with applicable United Kingdom law and accounting standards. Our responsibilities, as independent auditors, are established in the United Kingdom by statute, the Auditing Practices Board, the Listing Rules of the Financial Services Authority, and by our profession’s ethical guidance.
We report to you our opinion as to whether the accounts give a true and fair view and whether the accounts and the part of the Directors’ Remuneration Report to be audited have been properly prepared in accordance with the Companies Act 1985. We also report to you if, in our opinion, the Directors’ Report is not consistent with the accounts, if the Company has not kept proper accounting records, if we have not received all the information and explanations we require for our audit, or if information specified by law regarding directors’ remuneration and transactions with the Group is not disclosed.
We review whether the statement on pages 43 to 45 reflects the Company’s compliance with the seven provisions of the Combined Code specified for our review by the Listing Rules, and we report if it does not. We are not required to consider whether the Board’s statements on internal control cover all risks and controls, or form an opinion on the effectiveness of the Group’s corporate governance procedures or its risk and control procedures.
We read the other information contained in the Annual Report, including the corporate governance statement and the unaudited part of the Directors’ Remuneration Report, and consider whether it is consistent with the audited accounts. We consider the implications for our report if we become aware of any apparent misstatements or material inconsistencies with the financial statements.
Basis of audit opinion
We conducted our audit in accordance with Auditing Standards issued by the Auditing Practices Board. An audit includes examination, on a test basis, of evidence relevant to the amounts and disclosures in the accounts and the part of the Directors’ Remuneration Report to be audited. It also includes an assessment of the significant estimates and judgements made by the Directors in the preparation of the accounts, and of whether the accounting policies are appropriate to the Group’s circumstances, consistently applied and adequately disclosed.
We planned and performed our audit so as to obtain all the information and explanations which we considered necessary in order to provide us with sufficient evidence to give reasonable assurance that the accounts and the part of the Directors’ Remuneration Report to be audited are free from material misstatement, whether caused by fraud or other irregularity or error. In forming our opinion we also evaluated the overall adequacy of the presentation of information in the accounts and the part of the Directors’ Remuneration Report to be audited.
Opinion
In our opinion the accounts give a true and fair view of the state of affairs of the Company and the Group as at 31 August 2004 and of the profit of the Group for the year then ended and the accounts and the part of the Directors’ Remuneration Report to be audited have been properly prepared in accordance with the Companies Act 1985.
KPMG Audit Plc
Chartered Accountants
Registered Auditor
London
20 October 2004
54
Year to 31 August 2004
Basis of accounting
The accounts are prepared under the historical cost convention and comply with accounting policies generally accepted in the United Kingdom (‘UK GAAP’).
The significant differences between UK GAAP and US generally accepted accounting principles (‘US GAAP’) and a reconciliation of net income and Shareholders’ equity from UK GAAP to US GAAP as a result of such differences are shown on pages 82 to 85.
Changes in accounting policies
The Group has adopted ‘FRS 17 – Retirement benefits’ in full from 1 September 2003 (see note 5). In prior years the Group has complied with the transitional disclosure requirements of this standard. The Group has also adopted ‘Application Note G –revenue recognition’ an amendment to ‘FRS 5 – Reporting the substance of transactions’ (see note 1) and has complied with ‘UITF 38 – Accounting for ESOP Trusts’ (see note 14).
The impact of the adoption of these accounting standards has been reflected throughout the accounts. Prior year comparatives have been restated where appropriate (see note 23).
Basis of consolidation
Allied Domecq PLC (the ‘Group’ or ‘Company’) accounts consolidate the accounts of the Company and its interests in subsidiary undertakings. Interests in associated undertakings are included using the equity method of accounting. The results of businesses acquired or disposed of during the year are consolidated for the period from, or up to, the date control passes.
Acquisitions
On the acquisition of a business, or an interest in an associate, fair values, that reflect conditions at the date of the acquisition, are attributed to the net assets acquired. Adjustments are also made to bring accounting policies in line with those of the Group.
Intangible fixed assets
Goodwill arising on acquisitions of a business since 1 September 1998 is capitalised and amortised by equal instalments over its anticipated useful life, but not exceeding 20 years. Goodwill arising on acquisitions prior to 1 September 1998 was charged directly to reserves. On disposal of a business, any attributable goodwill previously eliminated against reserves is included in the calculation of any gain or loss. Purchased intangible assets are also capitalised and amortised over their estimated useful economic lives on a straight line basis, except for purchased brand intangible assets. Purchased brand intangible assets are considered by the Board of Directors to have an indefinite life given the proven longevity of premium spirits brands and the continued level of marketing support. We do not amortise purchased brand intangible assets but they are subject to annual impairment reviews.
Tangible fixed assets
Tangible fixed assets are capitalised at cost. Depreciation is provided to write off the cost less the estimated residual value of assets by equal instalments over their estimated useful economic lives as follows: land and buildings – the shorter of 50 years or the length of the lease; distilling and maturing equipment – 20 years; storage tanks – 20 to 50 years; other plant and equipment and fixtures and fittings – 5 to 12 years; and computer software – 4 years. Vineyard developments are not depreciated in the first 3 years unless they become productive within that time. No depreciation is provided on freehold land.
Fixed asset investments
Fixed asset investments are stated at cost, less provision for any permanent diminution in value.
Turnover
Turnover represents sales to external customers (including excise duties but excluding sales taxes) and franchise income.
Stocks
Stocks are valued at the lower of cost and net realisable value. Cost comprises purchase price or direct production cost, together with duties and manufacturing overheads. The cost of spirits and wine stocks is determined by the weighted average cost method. Stocks are included in current assets, although a portion of such stocks may be held for periods longer than one year.
Deferred tax
Full provision is made for deferred tax assets and liabilities arising from timing differences. Deferred tax assets are recognised to the extent that they are regarded as recoverable.
Financial instruments
The Group uses financial derivative instruments to manage exposures to movements in interest and exchange rates. Transactions involving financial instruments are accounted for as follows:
(i) Gains or losses arising on forward exchange contracts are taken to the profit and loss account in the same period as the underlying transaction. Premiums paid or received on foreign currency options are taken to the profit and loss account when the option expires or matures.
(ii) Net interest arising on interest rate agreements is taken to the profit and loss account over the life of the agreement.
(iii) Gains and losses on foreign currency debt and foreign exchange contracts held for the purposes of hedging balance sheet translation exposures are taken to reserves.
Foreign currencies
Monetary assets and liabilities arising from transactions in foreign currencies are translated at the rate of exchange prevailing at the date of transaction. Subsequent movements in exchange rates are included in the Group profit and loss account. The results of undertakings outside the UK are translated at weighted average exchange rates each month. The closing balance sheets of undertakings outside the UK are translated at year end rates. Exchange rate differences arising from the translation of foreign currency denominated balance sheets to closing rates are dealt with through reserves.
Pension and post employment benefits
In accordance with ‘FRS 17 – Retirement benefits’, the operating and financing costs of pension and post-retirement schemes are recognised separately in the profit and loss account. Service costs are systematically spread over the service lives of the employees and financing costs are recognised in the period in which they arise. The costs of past service benefit enhancements, settlements and curtailments are also recognised in the period in which they arise.
The difference between actual and expected returns on assets during the year, including changes in actuarial assumptions, are recognised in the statement of total recognised gains and losses.
55
Year to 31 August 2004
|
|
|
| Year to 31 August 2004 |
| Year to 31 August 2003 (restated) |
| |||||||||
|
|
|
| Before |
|
|
|
|
| Before |
|
|
|
|
| |
|
|
|
| goodwill |
| Goodwill |
|
|
| goodwill |
| Goodwill |
|
|
| |
|
|
|
| and |
| and |
|
|
| and |
| and |
|
|
| |
|
|
|
| exceptional |
| exceptional |
|
|
| exceptional |
| exceptional |
|
|
| |
|
| Note |
| items |
| items |
| Total |
| items |
| items |
| Total |
| |
|
|
|
| £m |
| £m |
| £m |
| £m |
| £m |
| £m |
| |
Turnover |
| 1 |
| 3,229 |
| — |
| 3,229 |
| 3,317 |
| — |
| 3,317 |
| |
Operating costs | – goodwill amortisation |
| 6 |
| — |
| (40 | ) | (40 | ) | — |
| (40 | ) | (40 | ) |
| – Mexican excise rebate |
| 6 |
| — |
| — |
| — |
| — |
| 38 |
| 38 |
|
| – other |
| 6 |
| (2,604 | ) | (36 | ) | (2,640 | ) | (2,704 | ) | (10 | ) | (2,714 | ) |
Operating profit from continuing operations |
|
|
| 625 |
| (76 | ) | 549 |
| 613 |
| (12 | ) | 601 |
| |
Share of profits of associated undertakings |
| 15 |
| 32 |
| — |
| 32 |
| 24 |
| — |
| 24 |
| |
Trading profit on ordinary activities before finance charges |
| 1 |
| 657 |
| (76 | ) | 581 |
| 637 |
| (12 | ) | 625 |
| |
Profit on sale of businesses in discontinued activities |
| 7 |
| — |
| 20 |
| 20 |
| — |
| — |
| — |
| |
Profit on disposal of fixed assets in continuing activities |
| 7 |
| — |
| 14 |
| 14 |
| — |
| — |
| — |
| |
Profit on ordinary activities before finance charges |
|
|
| 657 |
| (42 | ) | 615 |
| 637 |
| (12 | ) | 625 |
| |
Interest payable |
| 8 |
| (117 | ) | — |
| (117 | ) | (126 | ) | — |
| (126 | ) | |
Other finance charges |
| 5 |
| (19 | ) | — |
| (19 | ) | (20 | ) | — |
| (20 | ) | |
Profit on ordinary activities before taxation |
|
|
| 521 |
| (42 | ) | 479 |
| 491 |
| (12 | ) | 479 |
| |
Taxation |
| 9 |
| (125 | ) | 16 |
| (109 | ) | (118 | ) | (8 | ) | (126 | ) | |
Profit on ordinary activities after taxation |
|
|
| 396 |
| (26 | ) | 370 |
| 373 |
| (20 | ) | 353 |
| |
Minority interests – equity and non-equity |
| 24 |
| (14 | ) | — |
| (14 | ) | (16 | ) | — |
| (16 | ) | |
Profit earned for Ordinary Shareholders for the year |
| 23 |
| 382 |
| (26 | ) | 356 |
| 357 |
| (20 | ) | 337 |
| |
Ordinary dividends |
| 11 |
|
|
|
|
| (167 | ) |
|
|
|
| (150 | ) | |
Retained profit |
|
|
|
|
|
|
| 189 |
|
|
|
|
| 187 |
| |
Earnings per Ordinary Share: |
|
|
|
|
|
|
|
|
|
|
|
|
|
|
| |
– basic |
| 10 |
|
|
|
|
| 33.1 | p |
|
|
|
| 31.3 | p | |
– diluted |
| 10 |
|
|
|
|
| 32.9 | p |
|
|
|
| 31.3 | p | |
– normalised |
| 10 |
| 35.5 | p |
|
|
|
| 33.2 | p |
|
|
|
| |
56
At 31 August 2004
|
|
|
| 31 August |
| 31 August |
| |
|
| Note |
| 2004 |
| 2003 |
| |
|
|
|
|
|
| (restated) |
| |
|
|
|
| £m |
| £m |
| |
Fixed assets |
|
|
|
|
|
|
| |
Intangible assets |
| 12 |
| 1,234 |
| 1,273 |
| |
Tangible assets |
| 13 |
| 921 |
| 966 |
| |
Investments and loans |
| 14 |
| 21 |
| 31 |
| |
Investments in associates |
| 15 |
| 73 |
| 85 |
| |
Total fixed assets |
|
|
| 2,249 |
| 2,355 |
| |
Current assets |
|
|
|
|
|
|
| |
Stocks |
| 16 |
| 1,343 |
| 1,407 |
| |
Debtors |
| 17 |
| 636 |
| 701 |
| |
Cash at bank and in hand |
|
|
| 129 |
| 175 |
| |
Total current assets |
|
|
| 2,108 |
| 2,283 |
| |
Creditors (due within one year) |
|
|
|
|
|
|
| |
Short-term borrowings |
| 20 |
| (378 | ) | (772 | ) | |
Other creditors |
| 18 |
| (1,088 | ) | (1,161 | ) | |
Total current liabilities |
|
|
| (1,466 | ) | (1,933 | ) | |
Net current assets |
|
|
| 642 |
| 350 |
| |
Total assets less current liabilities |
|
|
| 2,891 |
| 2,705 |
| |
Creditors (due after more than one year) |
|
|
|
|
|
|
| |
Loan capital |
| 20 |
| (1,692 | ) | (1,815 | ) | |
Other creditors |
| 18 |
| (43 | ) | (46 | ) | |
Total creditors due after more than one year |
|
|
| (1,735 | ) | (1,861 | ) | |
Provisions for liabilities and charges |
| 19 |
| (179 | ) | (126 | ) | |
Net assets excluding pension and post-retirement liabilities |
|
|
| 977 |
| 718 |
| |
Pension and post-retirement liabilities (net of deferred taxation) |
|
|
| (387 | ) | (405 | ) | |
Net assets including pension and post-retirement liabilities |
|
|
| 590 |
| 313 |
| |
Capital and reserves |
|
|
|
|
|
|
| |
Called up share capital |
| 22 |
| 277 |
| 277 |
| |
Share premium account |
| 23 |
| 165 |
| 165 |
| |
Merger reserve |
| 23 |
| (823 | ) | (823 | ) | |
Shares held in employee trusts |
| 23 |
| (112 | ) | (129 | ) | |
Profit and loss account |
| 23 |
| 1,003 |
| 747 |
| |
Shareholders’ funds | – equity |
|
|
| 510 |
| 237 |
|
Minority interests | – equity and non-equity |
| 24 |
| 80 |
| 76 |
|
|
|
|
| 590 |
| 313 |
| |
Approved by the Board on 20 October 2004 and signed on its behalf by:
/s/ Sir Gerry Robinson |
| /s/ Graham Hetherington |
|
Sir Gerry Robinson, | Graham Hetherington, | ||
Chairman | Director | ||
57
Year to 31 August 2004
|
|
|
| Year to |
| Year to |
|
|
|
|
| 31 August |
| 31 August |
|
|
| Note |
| 2004 |
| 2003 |
|
|
|
|
|
|
| (restated) |
|
|
|
|
| £m |
| £m |
|
Reconciliation of operating profit to net cash inflow from operating activities |
|
|
|
|
|
|
|
Operating profit |
|
|
| 549 |
| 601 |
|
Goodwill amortisation |
|
|
| 40 |
| 40 |
|
Exceptional operating costs |
|
|
| 8 |
| 4 |
|
Depreciation |
|
|
| 78 |
| 75 |
|
Increase in stocks |
|
|
| (5 | ) | (72 | ) |
(Decrease)/increase in debtors |
|
|
| (3 | ) | 58 |
|
Increase in creditors |
|
|
| 9 |
| 65 |
|
Expenditure against provisions for reorganisation and restructuring costs |
|
|
| (34 | ) | (29 | ) |
Other items |
|
|
| 13 |
| 6 |
|
Net cash inflow from operating activities |
|
|
| 655 |
| 748 |
|
|
|
|
|
|
|
|
|
Group cash flow statement |
|
|
|
|
|
|
|
Net cash inflow from operating activities |
|
|
| 655 |
| 748 |
|
Dividends received from associated undertakings |
|
|
| 15 |
| 13 |
|
Returns on investments and servicing of finance |
| 25 |
| (122 | ) | (148 | ) |
Taxation paid |
| 25 |
| (82 | ) | (65 | ) |
Capital expenditure and financial investment |
| 25 |
| (58 | ) | (120 | ) |
Acquisitions and disposals |
| 25 |
| 9 |
| — |
|
Equity dividends paid |
|
|
| (156 | ) | (144 | ) |
Cash inflow before use of liquid resources and financing |
|
|
| 261 |
| 284 |
|
Management of liquid resources |
|
|
| (4 | ) | 50 |
|
Financing |
| 25 |
| 16 |
| (200 | ) |
Increase in cash in the year |
|
|
| 273 |
| 134 |
|
|
|
|
|
|
|
|
|
Reconciliation of net cash flow to movement in net debt |
|
|
|
|
|
|
|
Increase in cash in the year |
|
|
| 273 |
| 134 |
|
Increase/(decrease) in liquid resources |
|
|
| 4 |
| (50 | ) |
Decrease in loan capital |
|
|
| 1 |
| 164 |
|
Movement in net debt resulting from cash flows |
|
|
| 278 |
| 248 |
|
Exchange adjustments |
|
|
| 193 |
| (82 | ) |
Movement in net debt during the year |
|
|
| 471 |
| 166 |
|
Opening net debt |
|
|
| (2,412 | ) | (2,578 | ) |
Closing net debt |
| 27 |
| (1,941 | ) | (2,412 | ) |
58
Group statement of total recognised gains and losses
Year to 31 August 2004
|
| Year to |
| Year to |
|
|
| 31 August |
| 31 August |
|
|
| 2004 |
| 2003 |
|
|
|
|
| (restated) |
|
|
| £m |
| £m |
|
Profit earned for Ordinary Shareholders for the year |
| 356 |
| 337 |
|
Currency translation differences on foreign currency net investments |
| 108 |
| 4 |
|
Taxation on translation differences |
| (26 | ) | 19 |
|
Associated undertaking reserve movement (see note 15) |
| (17 | ) | — |
|
Actuarial gains/(losses) on net pension liabilities |
| 2 |
| (65 | ) |
Total recognised gains and losses for the year |
| 423 |
| 295 |
|
Prior year adjustment |
| (552 | ) |
|
|
Total gains and losses recognised since the last Annual Report and Accounts |
| (129 | ) | 295 |
|
Group note of historical cost profits and losses
Year to 31 August 2004
There is no difference between the profit earned for Ordinary Shareholders as disclosed in the profit and loss account and the profit stated on an historical cost basis.
Group reconciliation of movements in Shareholders’ funds
Year to 31 August 2004
|
| Year to |
| Year to |
|
|
| 31 August |
| 31 August |
|
|
| 2004 |
| 2003 |
|
|
|
|
| (restated) |
|
|
| £m |
| £m |
|
Total recognised gains and losses for the year |
| 423 |
| 295 |
|
Movement on shares in employee trusts |
| 17 |
| (36 | ) |
Ordinary dividends |
| (167 | ) | (150 | ) |
Net movement in Shareholders’ funds |
| 273 |
| 109 |
|
Shareholders’ funds at the beginning of the year as originally reported |
| 918 |
| 706 |
|
Prior year adjustment (see note 23) |
| (681 | ) | (578 | ) |
Shareholders’ funds at the beginning of the year as restated |
| 237 |
| 128 |
|
Shareholders’ funds at the end of the year |
| 510 |
| 237 |
|
59
At 31 August 2004
|
|
|
| 31 August |
| 31 August |
|
|
| Note |
| 2004 |
| 2003 |
|
|
|
|
|
|
| (restated) |
|
|
|
|
| £m |
| £m |
|
Fixed asset investments |
| 14 |
| 4,086 |
| 4,086 |
|
|
|
|
|
|
|
|
|
Current assets |
|
|
|
|
|
|
|
Debtors |
| 17 |
| 98 |
| 12 |
|
Creditors (due within one year) |
|
|
|
|
|
|
|
Other creditors |
| 18 |
| (115 | ) | (180 | ) |
Net current liabilities |
|
|
| (17 | ) | (168 | ) |
Net assets |
|
|
| 4,069 |
| 3,918 |
|
Capital and reserves |
|
|
|
|
|
|
|
Called up share capital |
| 22 |
| 277 |
| 277 |
|
Share premium account |
| 23 |
| 165 |
| 165 |
|
Merger reserve |
| 23 |
| 2,420 |
| 2,420 |
|
Capital reserve |
| 23 |
| 651 |
| 651 |
|
Shares held in employee trusts |
| 23 |
| (112 | ) | (129 | ) |
Profit and loss account |
| 23 |
| 668 |
| 534 |
|
Shareholders’ funds – equity |
|
|
| 4,069 |
| 3,918 |
|
Approved by the Board on 20 October 2004 and signed on its behalf by:
/s/ Sir Gerry Robinson |
| /s/ Graham Hetherington |
|
Sir Gerry Robinson, | Graham Hetherington, | ||
Chairman | Director | ||
Profits of the Parent Company
Under s230 (4) of the Companies Act 1985, a separate profit and loss account for the Parent Company is not presented.
Profits for the year arising in the Parent Company are disclosed in note 23.
60
1. Activity analysis
|
| Spirits & |
|
|
|
|
| Total |
|
|
|
|
|
|
| Wine |
| QSR |
| Britannia |
| continuing |
| Discontinued |
| Total |
|
|
| £m |
| £m |
| £m |
| £m |
| £m |
| £m |
|
Year to 31 August 2004 |
|
|
|
|
|
|
|
|
|
|
|
|
|
Turnover |
| 3,003 |
| 226 |
| — |
| 3,229 |
| — |
| 3,229 |
|
Trading profit before exceptional items and goodwill |
| 548 |
| 86 |
| 23 |
| 657 |
| — |
| 657 |
|
Goodwill amortisation |
| (40 | ) | — |
| — |
| (40 | ) | — |
| (40 | ) |
Exceptional items |
| (34 | ) | (2 | ) | — |
| (36 | ) | — |
| (36 | ) |
Trading profit after goodwill and exceptional items |
| 474 |
| 84 |
| 23 |
| 581 |
| — |
| 581 |
|
Profit on sale of businesses in discontinued activities |
| — |
| — |
| — |
| — |
| 20 |
| 20 |
|
Profit/(loss) on disposal of fixed assets in continuing activities |
| 15 |
| (1 | ) | — |
| 14 |
| — |
| 14 |
|
Profit before finance charges |
| 489 |
| 83 |
| 23 |
| 595 |
| 20 |
| 615 |
|
Finance charges |
|
|
|
|
|
|
|
|
|
|
| (136 | ) |
Profit on ordinary activities before taxation |
|
|
|
|
|
|
|
|
|
|
| 479 |
|
Depreciation |
| 68 |
| 10 |
| — |
| 78 |
| — |
| 78 |
|
Capital expenditure |
| 91 |
| 21 |
| — |
| 112 |
| — |
| 112 |
|
Assets employed |
| 2,616 |
| 134 |
| 36 |
| 2,786 |
| — |
| 2,786 |
|
Average numbers of employees |
| 10,762 |
| 923 |
| — |
| 11,685 |
| — |
| 11,685 |
|
|
|
|
|
|
|
|
|
|
|
|
|
|
|
Year to 31 August 2003 (restated) |
|
|
|
|
|
|
|
|
|
|
|
|
|
Turnover |
| 3,058 |
| 259 |
| — |
| 3,317 |
| — |
| 3,317 |
|
Trading profit before exceptional items and goodwill |
| 538 |
| 79 |
| 20 |
| 637 |
| — |
| 637 |
|
Goodwill amortisation |
| (40 | ) | — |
| — |
| (40 | ) | — |
| (40 | ) |
Exceptional items |
| 37 |
| (9 | ) | — |
| 28 |
| — |
| 28 |
|
Profit before finance charges |
| 535 |
| 70 |
| 20 |
| 625 |
| — |
| 625 |
|
Finance charges |
|
|
|
|
|
|
|
|
|
|
| (146 | ) |
Profit on ordinary activities before taxation |
|
|
|
|
|
|
|
|
|
|
| 479 |
|
Depreciation |
| 64 |
| 11 |
| — |
| 75 |
| — |
| 75 |
|
Capital expenditure |
| 114 |
| 27 |
| — |
| 141 |
| — |
| 141 |
|
Assets employed |
| 2,777 |
| 103 |
| 49 |
| 2,929 |
| — |
| 2,929 |
|
Average numbers of employees |
| 11,343 |
| 1,206 |
| — |
| 12,549 |
| — |
| 12,549 |
|
Notes
(a) The Group has adopted ‘Application Note G’ an amendment to ‘FRS 5 – Reporting the substance of transactions’. This has resulted in a number of items that were previously classified as operating costs (£69m) and advertising and promotion (£24m) to be treated as discounts. Trading profit was not affected.
(b) Normalised profit before tax is £521m (2003: £491m) being trading profit £657m (2003: £637m) less finance charges £136m (2003: £146m).
(c) Spirits & Wine goodwill is amortised over 20 years and relates principally to Mumm, Perrier Jouët and Montana acquired in 2001 and Jinro Ballantines acquired in 2000.
(d) Assets employed are before deducting net borrowings of £1,941m (2003: £2,412m), tax payable of £151m (2003: £111m) and dividends payable of £104m (2003: £93m) to give net assets of £590m (2003: £313m).
(e) Trading profit includes the Group’s share of profits of associated undertakings whose turnover is not included.
(f) Acquired activities in 2004 had no material input on turnover and trading profit.
61
Notes to the accounts
2. Geographical analysis
|
|
|
|
|
| Rest of |
|
|
| |
|
| Europe |
| Americas |
| World |
| Total |
| |
|
| £m |
| £m |
| £m |
| £m |
| |
By country of operation |
|
|
|
|
|
|
|
|
| |
Year to 31 August 2004 |
|
|
|
|
|
|
|
|
| |
Turnover | – continuing activities |
| 2,106 |
| 1,685 |
| 368 |
| 4,159 |
|
| – to Group companies |
|
|
|
|
|
|
| (930 | ) |
| – external |
|
|
|
|
|
|
| 3,229 |
|
Trading profit | – continuing activities |
| 250 |
| 348 |
| 59 |
| 657 |
|
| – goodwill amortisation in continuing activities |
| (20 | ) | (2 | ) | (18 | ) | (40 | ) |
| – exceptional items in continuing activities |
| (23 | ) | (10 | ) | (3 | ) | (36 | ) |
Trading profit after goodwill and exceptional items |
| 207 |
| 336 |
| 38 |
| 581 |
| |
Profit on sale of businesses in discontinued activities |
| 20 |
| — |
| — |
| 20 |
| |
Profit on disposal of fixed assets in continuing activities |
| 14 |
| — |
| — |
| 14 |
| |
Profit before finance charges |
| 241 |
| 336 |
| 38 |
| 615 |
| |
Assets employed |
| 1,081 |
| 1,079 |
| 626 |
| 2,786 |
| |
|
|
|
|
|
|
|
|
|
| |
Year to 31 August 2003 (restated) |
|
|
|
|
|
|
|
|
| |
Turnover | – continuing activities |
| 2,029 |
| 1,804 |
| 411 |
| 4,244 |
|
| – to Group companies |
|
|
|
|
|
|
| (927 | ) |
| – external |
|
|
|
|
|
|
| 3,317 |
|
Trading profit | – continuing activities |
| 246 |
| 326 |
| 65 |
| 637 |
|
| – goodwill amortisation in continuing activities |
| (20 | ) | (2 | ) | (18 | ) | (40 | ) |
| – exceptional items in continuing activities |
| 4 |
| 24 |
| — |
| 28 |
|
Profit before finance charges |
| 230 |
| 348 |
| 47 |
| 625 |
| |
Assets employed |
| 1,113 |
| 1,196 |
| 620 |
| 2,929 |
| |
Notes
(a) Export sales from the United Kingdom were £431m (2003: £419m) including £301m (2003: £300m) sales to Group companies.
(b) Trading profit includes the Group’s share of profits of associated undertakings whose turnover is not included.
|
|
|
|
|
| Rest of |
|
|
| |
|
| Europe |
| Americas |
| World |
| Total |
| |
|
| £m |
| £m |
| £m |
| £m |
| |
By country of destination |
|
|
|
|
|
|
|
|
| |
Turnover | – continuing activities |
| 1,356 |
| 1,392 |
| 481 |
| 3,229 |
|
Trading profit | – continuing activities |
| 235 |
| 327 |
| 95 |
| 657 |
|
| – goodwill amortisation in continuing activities |
| (20 | ) | (2 | ) | (18 | ) | (40 | ) |
| – exceptional items in continuing activities |
| (23 | ) | (10 | ) | (3 | ) | (36 | ) |
Trading profit after goodwill and exceptional items |
| 192 |
| 315 |
| 74 |
| 581 |
| |
Profit on sale of businesses in discontinued activities |
| 20 |
| — |
| — |
| 20 |
| |
Profit on disposal of fixed assets in continuing activities |
| 14 |
| — |
| — |
| 14 |
| |
Profit before finance charges |
| 226 |
| 315 |
| 74 |
| 615 |
| |
|
|
|
|
|
|
|
|
|
| |
Year to 31 August 2003 (restated) |
|
|
|
|
|
|
|
|
| |
Turnover | – continuing activities |
| 1,326 |
| 1,478 |
| 513 |
| 3,317 |
|
Trading profit | – continuing activities |
| 204 |
| 330 |
| 103 |
| 637 |
|
| – goodwill amortisation in continuing activities |
| (20 | ) | (2 | ) | (18 | ) | (40 | ) |
| – exceptional items in continuing activities |
| 4 |
| 24 |
| — |
| 28 |
|
Profit before finance charges |
| 188 |
| 352 |
| 85 |
| 625 |
| |
Notes
(a) Turnover excludes sales to Group companies.
(b) Trading profit includes the Group’s share of profits of associated undertakings whose turnover is not included.
62
3. Exchange rates
The significant translation rates to £1:
|
| Average rate |
| Closing rate |
| ||||
|
|
|
|
|
| 31 August |
| 31 August |
|
|
| 2004 |
| 2003 |
| 2004 |
| 2003 |
|
United States dollar |
| 1.78 |
| 1.60 |
| 1.81 |
| 1.58 |
|
Mexican peso |
| 19.92 |
| 16.72 |
| 20.55 |
| 17.48 |
|
Euro |
| 1.47 |
| 1.49 |
| 1.48 |
| 1.45 |
|
4. Staff costs
|
|
|
|
|
|
|
|
|
|
|
|
|
| Year to |
| |
|
|
|
|
|
|
|
|
|
|
|
| Year to |
| 31 August |
| |
|
|
|
| Full-time |
| Part-time |
| 31 August |
| 2003 |
| |||||
|
|
|
| United |
|
|
| United |
|
|
| 2004 |
| (restated) |
| |
|
| Note |
| Kingdom |
| Overseas |
| Kingdom |
| Overseas |
| Total |
| Total |
| |
|
|
|
| £m |
| £m |
| £m |
| £m |
| £m |
| £m |
| |
Remuneration |
|
|
| 71 |
| 270 |
| 2 |
| 7 |
| 350 |
| 377 |
| |
Social security |
|
|
| 9 |
| 35 |
| — |
| — |
| 44 |
| 44 |
| |
Pension schemes | – United Kingdom |
| 5 |
| 11 |
| — |
| — |
| — |
| 11 |
| 10 |
|
| – Overseas |
| 5 |
| — |
| 17 |
| — |
| — |
| 17 |
| 14 |
|
Post-retirement medical benefits (PRMB) |
| 5 |
| 1 |
| 3 |
| — |
| — |
| 4 |
| 5 |
| |
|
|
|
| 92 |
| 325 |
| 2 |
| 7 |
| 426 |
| 450 |
| |
Average numbers employed |
|
|
|
|
|
|
|
|
|
|
|
|
|
|
| |
2004 – continuing operations |
|
|
| 1,699 |
| 8,856 |
| 71 |
| 1,059 |
| 11,685 |
|
|
| |
2003 – continuing operations |
|
|
| 1,804 |
| 9,319 |
| 187 |
| 1,239 |
|
|
| 12,549 |
| |
Directors’ remuneration
The amounts relating to emoluments, share options, other long term incentive interests and Directors’ pension entitlements are disclosed within the Directors’ Remuneration Report.
5. Pension and post-retirement benefit schemes
The Group operates a number of pension and post-retirement healthcare schemes throughout the world. The major schemes are of the defined benefit type and the assets of the schemes are largely held in separate trustee administered funds. The UK funds represent approximately 80% of the overall pension liabilities of the Group and are closed to new members.
The Group operates defined benefit pension and post-retirement medical benefit plans in several countries overseas, with the most significant being in the US and Canada. In addition there are a small number of defined contribution schemes.
The assets and liabilities of the defined benefit schemes are reviewed regularly by independent professionally qualified actuaries. For the UK schemes a full assessment is undertaken every three years for funding purposes and the latest full actuarial valuation of the UK schemes was carried out as at 6 April 2003 using the projected unit credit method. The latest actuarial reviews of the US and Canadian schemes were carried out as at 1 January 2004.
The Group has adopted ‘FRS 17 – Retirement benefits’ in full from 1 September 2003. In prior years, the Group has complied with the transitional disclosure requirements of this standard.
The Group’s investment strategy for its funded pension schemes has been developed within the framework of local statutory requirements. The Group’s policy for the allocation of assets within the schemes has the objective of maintaining the right balance between controlling risk and achieving the long-term returns which will minimise the cost to the Group. The Group aims to invest a significant proportion of the assets (50%) into equities which the Group believes offer the best returns over the longer term. In addition the Group invests approximately 40% of the assets into bonds with the remainder in properties and cash.
The total cost of pension and post-retirement benefits for the Group was £51m (2003: £49m) of which £32m (2003: £29m) has been charged against operating profit and £19m (2003: £20m) has been charged within other finance charges.
63
Notes to the accounts
(a) The major assumptions used were:
|
| 31 August 2004 |
| 31 August 2003 |
| 31 August 2002 |
| ||||||
|
| United |
|
|
| United |
|
|
| United |
|
|
|
|
| Kingdom |
| Overseas |
| Kingdom |
| Overseas |
| Kingdom |
| Overseas |
|
|
| % |
| % |
| % |
| % |
| % |
| % |
|
Inflation |
| 2.9 |
| 3.0 |
| 2.5 |
| 3.0 |
| 2.3 |
| 2.1 |
|
Rate of general increase in salaries |
| 4.4 |
| 4.3 |
| 4.0 |
| 4.4 |
| 4.1 |
| 4.8 |
|
Rate of increase to benefits |
| 3.2 |
| 1.8 |
| 3.1 |
| 1.8 |
| 3.1 |
| 2.1 |
|
Discount rate for scheme liabilities |
| 5.8 |
| 5.7 |
| 5.6 |
| 6.0 |
| 6.0 |
| 6.5 |
|
The expected long-term rate of return of the significant schemes is: |
|
|
|
|
|
|
|
|
|
|
|
|
|
Equities |
| 7.7 |
| 8.1 |
| 7.5 |
| 8.2 |
| 7.5 |
| 8.7 |
|
Bonds |
| 5.4 |
| 6.0 |
| 5.0 |
| 5.8 |
| 5.0 |
| 6.1 |
|
Property and other |
| 4.7 |
| 4.0 |
| 5.5 |
| 4.3 |
| 5.2 |
| 4.4 |
|
(b) The net pension and post-retirement medical benefits (PRMB) liability of the Group as at 31 August 2004 was:
|
| 31 August 2004 |
| 31 August 2003 |
| 31 August 2002 |
| ||||||
|
| United |
|
|
| United |
|
|
| United |
|
|
|
|
| Kingdom |
| Overseas |
| Kingdom |
| Overseas |
| Kingdom |
| Overseas |
|
|
| market |
| market |
| market |
| market |
| market |
| market |
|
|
| value |
| value |
| value |
| value |
| value |
| value |
|
|
| £m |
| £m |
| £m |
| £m |
| £m |
| £m |
|
Equities |
| 821 |
| 134 |
| 814 |
| 156 |
| 896 |
| 206 |
|
Bonds |
| 616 |
| 136 |
| 594 |
| 161 |
| 458 |
| 115 |
|
Property and other |
| 159 |
| 33 |
| 143 |
| 14 |
| 197 |
| 6 |
|
Total market value of assets |
| 1,596 |
| 303 |
| 1,551 |
| 331 |
| 1,551 |
| 327 |
|
Present value of scheme liabilities |
| (2,002 | ) | (458 | ) | (2,004 | ) | (464 | ) | (1,941 | ) | (417 | ) |
Deficit in the schemes |
| (406 | ) | (155 | ) | (453 | ) | (133 | ) | (390 | ) | (90 | ) |
Related deferred tax asset |
| 122 |
| 52 |
| 136 |
| 45 |
| 117 |
| 27 |
|
Net pension and PRMB liability |
| (284 | ) | (103 | ) | (317 | ) | (88 | ) | (273 | ) | (63 | ) |
(c) Profit and loss account charges
The amounts charged to operating profit during the year were:
|
| 31 August 2004 |
| 31 August 2003 |
| ||||
|
| United |
|
|
| United |
|
|
|
|
| Kingdom |
| Overseas |
| Kingdom |
| Overseas |
|
|
| £m |
| £m |
| £m |
| £m |
|
Current service cost |
| 11 |
| 21 |
| 10 |
| 19 |
|
Total included within operating profit |
| 11 |
| 21 |
| 10 |
| 19 |
|
|
|
|
|
|
|
|
|
|
|
The amounts charged to other finance charges during the year were: |
|
|
|
|
|
|
|
|
|
Interest cost |
| 110 |
| 25 |
| 114 |
| 26 |
|
Expected return on assets |
| (97 | ) | (19 | ) | (98 | ) | (22 | ) |
Total included within other finance charges |
| 13 |
| 6 |
| 16 |
| 4 |
|
(d) Analysis of amount that has been included within the Group statement of total recognised gains and losses:
|
| 31 August 2004 |
| 31 August 2003 |
| ||||
|
| United |
|
|
| United |
|
|
|
|
| Kingdom |
| Overseas |
| Kingdom |
| Overseas |
|
|
| £m |
| £m |
| £m |
| £m |
|
Actual return less expected return on pension scheme assets |
| 10 |
| 5 |
| (12 | ) | (6 | ) |
Experience gains and losses arising on the scheme liabilities |
| (17 | ) | (3 | ) | 20 |
| (4 | ) |
Changes in assumptions underlying the present value of the scheme liabilities |
| 34 |
| (26 | ) | (71 | ) | (22 | ) |
Actuarial gain/(loss) recognised in Group statement of total recognised gains and losses |
| 27 |
| (24 | ) | (63 | ) | (32 | ) |
Deferred tax movement |
| (8 | ) | 7 |
| 19 |
| 11 |
|
Actuarial gain/(loss) recognised in Group statement of total recognised gains and losses – net of tax |
| 19 |
| (17 | ) | (44 | ) | (21 | ) |
64
(e) The movement in deficit during the year was:
|
| 31 August 2004 |
| 31 August 2003 |
| ||||
|
| United |
|
|
| United |
|
|
|
|
| Kingdom |
| Overseas |
| Kingdom |
| Overseas |
|
|
| £m |
| £m |
| £m |
| £m |
|
Deficit in scheme at beginning of year |
| (453 | ) | (133 | ) | (390 | ) | (90 | ) |
Movement in year: |
|
|
|
|
|
|
|
|
|
Current service cost |
| (11 | ) | (21 | ) | (10 | ) | (19 | ) |
Contributions |
| 44 |
| 13 |
| 26 |
| 16 |
|
Other finance income |
| (13 | ) | (6 | ) | (16 | ) | (4 | ) |
Currency translation adjustment |
| — |
| 16 |
| — |
| (4 | ) |
Actuarial gain/(loss) |
| 27 |
| (24 | ) | (63 | ) | (32 | ) |
Deficit in scheme at the end of the year |
| (406 | ) | (155 | ) | (453 | ) | (133 | ) |
Based on current market conditions we anticipate that contributions to the funds will be approximately £60m in 2005 and 2006.
(f) The history of experience gains and losses is:
|
| 31 August 2004 |
| 31 August 2003 |
| 31 August 2002 |
| ||||||
|
| United |
|
|
| United |
|
|
| United |
|
|
|
|
| Kingdom |
| Overseas |
| Kingdom |
| Overseas |
| Kingdom |
| Overseas |
|
Actual return less expected return on pension scheme assets |
|
|
|
|
|
|
|
|
|
|
|
|
|
Amount (£m) |
| 10 |
| 5 |
| (12 | ) | (6 | ) | (320 | ) | (64 | ) |
Percentage of the scheme assets |
| 1 | % | 2 | % | (1 | )% | (2 | )% | (21 | )% | (20 | )% |
Experience gains and losses arising on the scheme liabilities |
|
|
|
|
|
|
|
|
|
|
|
|
|
Amount (£m) |
| (17 | ) | (3 | ) | 20 |
| (4 | ) | (62 | ) | — |
|
Percentage of the present value of the scheme liabilities |
| 1 | % | 1 | % | (1 | )% | 1 | % | 3 | % | — |
|
Actuarial loss recognised in Group statement of total recognised gains and losses |
|
|
|
|
|
|
|
|
|
|
|
|
|
Amount (£m) |
| 27 |
| (24 | ) | (63 | ) | (32 | ) | (401 | ) | (83 | ) |
Percentage of the present value of the scheme liabilities |
| (1 | )% | 5 | % | 3 | % | 7 | % | 21 | % | 20 | % |
6. Operating costs
|
|
|
| Year to |
| Year to |
| |
|
|
|
| 31 August |
| 31 August |
| |
|
| Note |
| 2004 |
| 2003 |
| |
|
|
|
|
|
| (restated) |
| |
|
|
|
| £m |
| £m |
| |
Change in stocks of finished goods and work in progress |
|
|
| (5 | ) | (72 | ) | |
Raw materials and consumables |
|
|
| 810 |
| 838 |
| |
Customs and excise duties paid | • ongoing |
|
|
| 618 |
| 671 |
|
| • Mexican excise rebate |
|
|
| — |
| (38 | ) |
Staff costs |
| 4 |
| 426 |
| 450 |
| |
Depreciation |
| 13 |
| 78 |
| 75 |
| |
Goodwill amortisation |
|
|
| 40 |
| 40 |
| |
Other operating charges including exceptional items |
|
|
| 654 |
| 690 |
| |
Operating leases | • hire of equipment |
|
|
| 11 |
| 11 |
|
| • property rents |
|
|
| 45 |
| 48 |
|
Payments to auditor | • fees for audit |
|
|
| 3 |
| 3 |
|
|
|
|
| 2,680 |
| 2,716 |
| |
The Parent Company audit fee was nil (2003: nil). Other payments to the auditor were £1m (2003: £1m) which primarily relate to taxation services.
65
7. Goodwill amortisation and exceptional items
|
| Year to |
| Year to |
|
|
| 31 August |
| 31 August |
|
|
| 2004 |
| 2003 |
|
|
| £m |
| £m |
|
Goodwill amortisation |
| (40 | ) | (40 | ) |
Exceptional items |
|
|
|
|
|
Mexican excise rebate |
| — |
| 38 |
|
Acquisition integration costs |
| — |
| (3 | ) |
Asset write-downs |
| (5 | ) | 2 |
|
Restructuring |
| (31 | ) | (9 | ) |
Total exceptional items within operating costs |
| (36 | ) | 28 |
|
Profit on sale of businesses |
| 20 |
| — |
|
Profit on disposal of fixed assets |
| 14 |
| — |
|
Goodwill amortisation and exceptional items before taxation |
| (42 | ) | (12 | ) |
Taxation |
| 16 |
| (8 | ) |
Goodwill amortisation and exceptional items after taxation |
| (26 | ) | (20 | ) |
|
|
|
|
|
|
8. Interest payable |
|
|
|
|
|
|
|
|
|
|
|
|
| Year to |
| Year to |
|
|
| 31 August |
| 31 August |
|
|
| 2004 |
| 2003 |
|
|
| £m |
| £m |
|
Interest on bank loans and overdrafts |
| 21 |
| 31 |
|
Interest on other loans |
| 103 |
| 107 |
|
Less: deposit and other interest receivable |
| (7 | ) | (12 | ) |
Interest payable |
| 117 |
| 126 |
|
|
|
|
|
|
|
9. Taxation |
|
|
|
|
|
|
|
|
|
|
|
|
| Year to |
| Year to |
|
|
| 31 August |
| 31 August |
|
|
| 2004 |
| 2003 |
|
|
|
|
| (restated) |
|
|
| £m |
| £m |
|
The charge for taxation on the profit for the period comprises: |
|
|
|
|
|
Current tax |
|
|
|
|
|
United Kingdom taxation |
|
|
|
|
|
Corporation tax at 30% (2003: 30%) |
| (3 | ) | 25 |
|
Adjustment in respect of prior periods |
| (11 | ) | (1 | ) |
Double taxation relief |
| (3 | ) | (1 | ) |
|
| (17 | ) | 23 |
|
Overseas taxation |
|
|
|
|
|
Corporation tax |
| 65 |
| 60 |
|
Adjustment in respect of prior periods |
| 1 |
| 9 |
|
|
| 66 |
| 69 |
|
Taxation on attributable profit of associated undertakings |
| 10 |
| 10 |
|
Total current tax |
| 59 |
| 102 |
|
|
|
|
|
|
|
Deferred tax |
|
|
|
|
|
Origination and reversal of timing differences |
| 57 |
| 64 |
|
Adjustment in respect of prior periods |
| (7 | ) | (32 | ) |
Recognition of deferred tax assets arising in prior periods |
| — |
| (8 | ) |
Total tax charge |
| 109 |
| 126 |
|
66
A reconciliation of the current tax charge at the UK corporation tax rate of 30% (2003: 30%) to the Group’s current tax on profit on ordinary activities is shown below:
|
| Year to |
| Year to |
|
|
| 31 August |
| 31 August |
|
|
| 2004 |
| 2003 |
|
|
|
|
| (restated) |
|
|
| £m |
| £m |
|
Profit on ordinary activities before taxation |
| 479 |
| 479 |
|
Notional charge at UK corporation tax rate of 30% |
| 144 |
| 144 |
|
Differences in effective overseas tax rates |
| 11 |
| 16 |
|
Adjustments to prior period tax charges |
| (10 | ) | 8 |
|
Taxable intra-group dividend income |
| — |
| 5 |
|
Non deductible expenditure |
| 7 |
| 13 |
|
Non taxable income and gains |
| (33 | ) | (12 | ) |
Losses and other timing differences |
| (57 | ) | (64 | ) |
Other current year items |
| (3 | ) | (8 | ) |
Current tax charge |
| 59 |
| 102 |
|
10. Earnings per share
Basic earnings per share of 33.1p (2003: 31.3p) has been calculated on earnings of £356m (2003: £337m) divided by the average number of shares of 1,076m (2003: 1,075m).
Diluted earnings per share of 32.9p (2003: 31.3p) has been calculated on earnings of £356m (2003: £337m) and after including the effect of all dilutive potential Ordinary Shares, the average number of shares is 1,083m (2003: 1,076m).
To show earnings per share on a comparable basis, normalised earnings per share of 35.5p (2003: 33.2p) has been calculated on normalised earnings of £382m (2003: £357m) divided by the average number of shares of 1,076m (2003: 1,075m). Normalised earnings has been calculated as follows:
|
| Year to |
| Year to |
|
|
| 31 August |
| 31 August |
|
|
| 2004 |
| 2003 |
|
|
|
|
| (restated) |
|
|
| £m |
| £m |
|
Earnings as reported |
| 356 |
| 337 |
|
Adjustment for exceptional items net of tax |
| (10 | ) | (18 | ) |
Adjustment for goodwill amortisation net of tax |
| 36 |
| 38 |
|
Normalised earnings |
| 382 |
| 357 |
|
|
|
|
|
|
|
Average number of shares |
| Millions |
| Millions |
|
Weighted average Ordinary Shares in issue during the year |
| 1,107 |
| 1,107 |
|
Weighted average Ordinary Shares owned by the Allied Domecq employee trusts* |
| (31 | ) | (32 | ) |
Weighted average Ordinary Shares used in earnings per share calculation |
| 1,076 |
| 1,075 |
|
* Includes American Depositary Shares representing underlying Ordinary Shares.
11. Ordinary dividends
|
| Year to |
| Year to |
| Year to |
| Year to |
|
|
| 31 August |
| 31 August |
| 31 August |
| 31 August |
|
|
| 2004 |
| 2003 |
| 2004 |
| 2003 |
|
|
| £m |
| £m |
| p |
| p |
|
Interim |
| 63 |
| 57 |
| 5.83 |
| 5.30 |
|
Final |
| 104 |
| 93 |
| 9.67 |
| 8.70 |
|
|
| 167 |
| 150 |
| 15.50 |
| 14.00 |
|
The 2004 interim dividend was paid on 30 July 2004 and the final dividend will be paid on 2 February 2005.
67
12. Intangible assets
|
|
|
|
|
|
|
| 31 August |
| 31 August |
|
|
|
|
|
|
| Other |
| 2004 |
| 2003 |
|
|
| Goodwill |
| Brands |
| intangibles |
| Total |
| Total |
|
|
| £m |
| £m |
| £m |
| £m |
| £m |
|
Cost |
|
|
|
|
|
|
|
|
|
|
|
At the beginning of the year |
| 785 |
| 555 |
| 35 |
| 1,375 |
| 1,375 |
|
Currency translation adjustment |
| — |
| — |
| — |
| — |
| — |
|
Additions |
| 4 |
| — |
| — |
| 4 |
| — |
|
At the end of the year |
| 789 |
| 555 |
| 35 |
| 1,379 |
| 1,375 |
|
Amortisation |
|
|
|
|
|
|
|
|
|
|
|
At the beginning of the year |
| (93 | ) | — |
| (9 | ) | (102 | ) | (59 | ) |
Currency translation adjustment |
| — |
| — |
| — |
| — |
| — |
|
Charge for the year |
| (40 | ) | — |
| (3 | ) | (43 | ) | (43 | ) |
At the end of the year |
| (133 | ) | — |
| (12 | ) | (145 | ) | (102 | ) |
Net balance at the end of the year |
| 656 |
| 555 |
| 23 |
| 1,234 |
| 1,273 |
|
Goodwill is being amortised over 20 years. Brands relates to the acquisition of Malibu in 2002. The acquired brand intangible asset is determined to have an indefinite useful economic life. An impairment review was carried out at the balance sheet date and the Board of Directors are satisfied that the brand has not suffered any loss in value. Other intangibles are being amortised over ten years.
13. Tangible assets
|
|
|
| Land and |
| Plant and |
|
|
| |
|
|
|
| buildings |
| equipment |
| Total |
| |
|
|
|
| £m |
| £m |
| £m |
| |
Cost |
|
|
|
|
|
|
|
|
| |
At the beginning of the year |
|
|
| 773 |
| 721 |
| 1,494 |
| |
Currency translation adjustment |
|
|
| (45 | ) | (39 | ) | (84 | ) | |
|
|
|
| 728 |
| 682 |
| 1,410 |
| |
Additions | – acquisitions |
|
|
| 2 |
| 1 |
| 3 |
|
| – capital expenditure |
|
|
| 31 |
| 81 |
| 112 |
|
Disposals and transfers |
|
|
| (38 | ) | (33 | ) | (71 | ) | |
At the end of the year |
|
|
| 723 |
| 731 |
| 1,454 |
| |
Depreciation |
|
|
|
|
|
|
|
|
| |
At the beginning of the year |
|
|
| (169 | ) | (359 | ) | (528 | ) | |
Currency translation adjustment |
|
|
| 12 |
| 20 |
| 32 |
| |
|
|
|
| (157 | ) | (339 | ) | (496 | ) | |
Disposals and transfers |
|
|
| 15 |
| 26 |
| 41 |
| |
Charge for the year |
|
|
| (17 | ) | (61 | ) | (78 | ) | |
At the end of the year |
|
|
| (159 | ) | (374 | ) | (533 | ) | |
|
|
|
|
|
|
|
|
|
| |
Net book value at 31 August 2004 |
|
|
| 564 |
| 357 |
| 921 |
| |
Net book value at 31 August 2003 |
|
|
| 604 |
| 362 |
| 966 |
| |
|
|
|
|
|
|
|
|
|
| |
|
| 31 August 2004 |
| 31 August 2003 |
| |||||
|
| At |
| Net book |
| At |
| Net book |
| |
|
| cost |
| value |
| cost |
| value |
| |
|
| £m |
| £m |
| £m |
| £m |
| |
Freehold land and buildings |
| 638 |
| 506 |
| 689 |
| 548 |
| |
Long lease land and buildings |
| 16 |
| 14 |
| 17 |
| 15 |
| |
Short lease land and buildings |
| 69 |
| 44 |
| 67 |
| 41 |
| |
Total land and buildings |
| 723 |
| 564 |
| 773 |
| 604 |
| |
68
14. Investments and loans
|
|
|
|
|
| Franchise |
|
|
|
|
| Investments |
| and trade |
|
|
| ||
|
| Listed |
| Unlisted |
| loans |
| Total |
|
|
| £m |
| £m |
| £m |
| £m |
|
Group |
|
|
|
|
|
|
|
|
|
At the beginning of the year |
| 139 |
| 13 |
| 8 |
| 160 |
|
Prior year adjustment |
| (129 | ) | — |
| — |
| (129 | ) |
At the beginning of the year (restated) |
| 10 |
| 13 |
| 8 |
| 31 |
|
Currency translation adjustment |
| — |
| — |
| (1 | ) | (1 | ) |
Disposals and transfers |
| (8 | ) | — |
| (1 | ) | (9 | ) |
At the end of the year |
| 2 |
| 13 |
| 6 |
| 21 |
|
The Group has complied with ‘UITF 38 – Accounting for ESOP Trusts’. This has resulted in the reclassification of shares held in employee trusts from investments to Shareholders’ funds and has been accounted for as a prior year adjustment. The Parent Company lends funds to the employee trusts to purchase the shares; a similar prior year adjustment has been made in that company.
The unlisted investments include a holding of 1% in Suntory Limited, incorporated in Japan.
|
| Investment |
|
|
|
|
|
|
| in subsidiary |
| Listed |
|
|
|
|
| undertaking |
| investments |
| Total |
|
|
|
|
| (restated) |
|
|
|
|
| £m |
| £m |
| £m |
|
Parent Company |
|
|
|
|
|
|
|
At the beginning of the year |
| 4,086 |
| 129 |
| 4,215 |
|
Prior year adjustment |
| — |
| (129 | ) | (129 | ) |
At the beginning of the year (restated) |
| 4,086 |
| — |
| 4,086 |
|
Additions |
| — |
| — |
| — |
|
At the end of the year |
| 4,086 |
| — |
| 4,086 |
|
15. Investments in associates
|
|
|
| Unlisted |
| Listed |
|
|
|
|
|
|
|
|
| companies’ |
| companies’ |
|
|
|
|
|
|
|
|
| share of |
| share of |
|
|
|
|
|
|
| Cost |
| reserves |
| reserves |
| Loans |
| Total |
|
|
| £m |
| £m |
| £m |
| £m |
| £m |
|
At the beginning of the year |
| 43 |
| 26 |
| 14 |
| 2 |
| 85 |
|
Currency translation adjustment |
| (1 | ) | (1 | ) | (1 | ) | — |
| (3 | ) |
Additions |
| 1 |
| — |
| — |
| — |
| 1 |
|
Other reserve movement |
| — |
| (17 | ) | — |
| — |
| (17 | ) |
Share of retained profit for the year |
| — |
| 7 |
| — |
| — |
| 7 |
|
At the end of the year |
| 43 |
| 15 |
| 13 |
| 2 |
| 73 |
|
The share of profits before taxation was £32m (2003: £24m) and dividends received were £15m (2003: £13m).
The principal associate is a 23.75% (2003: 25%) equity interest in Britannia Soft Drinks Limited, a company engaged in the manufacture and sale of soft drinks. Britannia has established a defined benefit pension scheme which has resulted in a £17m reduction in the Group’s share of net assets.
Other associates include Baskin-Robbins Japan (44% equity interest), Baskin-Robbins Korea (33% equity interest) and the Group’s interest in the Miller RTD commercial partnership.
The above figures comprise the amounts attributable to the Group based on the latest accounts it has been practicable to obtain, some of which are unaudited management accounts.
69
16. Stocks
|
| 31 August |
| 31 August |
|
|
| 2004 |
| 2003 |
|
|
| £m |
| £m |
|
Raw materials and consumables |
| 27 |
| 45 |
|
Maturing inventory |
| 1,025 |
| 1,047 |
|
Finished products |
| 273 |
| 293 |
|
Bottles, cases and pallets |
| 18 |
| 22 |
|
|
| 1,343 |
| 1,407 |
|
17. Debtors
|
| Group |
| Parent Company |
| ||||
|
| 31 August |
| 31 August |
| 31 August |
| 31 August |
|
|
| 2004 |
| 2003 |
| 2004 |
| 2003 |
|
|
|
|
| (restated) |
|
|
|
|
|
|
| £m |
| £m |
| £m |
| £m |
|
Amounts falling due within one year |
|
|
|
|
|
|
|
|
|
Trade debtors |
| 450 |
| 501 |
| — |
| — |
|
Amounts due from subsidiary undertakings |
| — |
| — |
| 94 |
| — |
|
Deferred tax assets (note 19) |
| 18 |
| 22 |
| — |
| — |
|
Other debtors |
| 94 |
| 108 |
| 4 |
| 12 |
|
Prepayments and accrued income |
| 58 |
| 53 |
| — |
| — |
|
|
| 620 |
| 684 |
| 98 |
| 12 |
|
Amounts due after more than one year |
|
|
|
|
|
|
|
|
|
Other debtors |
| 3 |
| 2 |
| — |
| — |
|
Prepayments and accrued income |
| 13 |
| 15 |
| — |
| — |
|
|
| 16 |
| 17 |
| — |
| — |
|
Debtors |
| 636 |
| 701 |
| 98 |
| 12 |
|
The Group has adopted ‘FRS 17 – Retirement benefits’. As a result pension assets and liabilities are now included within the new balance sheet classification ‘Pension and post-retirement liabilities’. This has been accounted for as a prior year adjustment.
18. Creditors
|
| Group |
| Parent Company |
| ||||
|
| 31 August |
| 31 August |
| 31 August |
| 31 August |
|
|
| 2004 |
| 2003 |
| 2004 |
| 2003 |
|
|
| £m |
| £m |
| £m |
| £m |
|
Amounts due within one year |
|
|
|
|
|
|
|
|
|
Trade creditors |
| 233 |
| 216 |
| — |
| — |
|
Bills payable |
| 18 |
| 17 |
| — |
| — |
|
Amounts owed to subsidiary undertakings |
| — |
| — |
| — |
| 81 |
|
Other creditors |
| 255 |
| 312 |
| 11 |
| 6 |
|
Social security |
| 9 |
| 10 |
| — |
| — |
|
Taxation |
| 196 |
| 228 |
| — |
| — |
|
Accruals and deferred income |
| 273 |
| 285 |
| — |
| — |
|
Proposed dividend (note 11) |
| 104 |
| 93 |
| 104 |
| 93 |
|
|
| 1,088 |
| 1,161 |
| 115 |
| 180 |
|
Amounts due after more than one year |
|
|
|
|
|
|
|
|
|
Other creditors |
| 33 |
| 34 |
| — |
| — |
|
Accruals and deferred income |
| 10 |
| 12 |
| — |
| — |
|
|
| 43 |
| 46 |
| — |
| — |
|
70
19. Provisions for liabilities and charges
|
| Post- |
|
|
|
|
|
|
|
|
|
|
| retirement |
| Reorganisation |
|
|
|
|
|
|
|
|
| medical |
| and |
| Surplus |
| Deferred |
|
|
|
|
| Benefits |
| restructuring |
| properties |
| taxation |
| Total |
|
|
| (restated) |
|
|
|
|
| (restated) |
|
|
|
|
| £m |
| £m |
| £m |
| £m |
| £m |
|
At the beginning of the year |
| 90 |
| 31 |
| 9 |
| 153 |
| 283 |
|
Prior year adjustment |
| (90 | ) | — |
| — |
| (67 | ) | (157 | ) |
At the beginning of the year (restated) |
| — |
| 31 |
| 9 |
| 86 |
| 126 |
|
Currency translation adjustment |
| — |
| 4 |
| — |
| (5 | ) | (1 | ) |
Timing differences within statement of total recognised gains and losses |
| — |
| — |
| — |
| 23 |
| 23 |
|
Utilised during the year |
| — |
| (43 | ) | — |
| — |
| (43 | ) |
Charged during the year |
| — |
| 31 |
| — |
| 43 |
| 74 |
|
At the end of the year |
| — |
| 23 |
| 9 |
| 147 |
| 179 |
|
The Group has adopted ‘FRS 17 – Retirement benefits’. As a result, pensions and post-retirement medical liabilities and the related deferred tax are now included within the new balance sheet classification ‘Pension and post-retirement liabilities’. This has been accounted for as a prior year adjustment.
£11m of reorganisation and restructuring provisions brought forward from previous years were utilised during the year. New provisions totalling £7m were created during the year. Of the provisions outstanding at the year end, £11m relates to the termination of a land lease in California and £2m for the trust fund established for social and community projects in Mexico. The remainder relates to the the Group restructuring programme.
It is expected that the majority of reorganisation and restructuring costs will be incurred in the financial year ending 31 August 2005, whilst the trust funds will be disbursed as the projects develop.
The provision for surplus properties will be utilised over the terms of the leases to which the provisions relate.
|
| 31 August |
| 31 August |
|
|
| 2004 |
| 2003 |
|
|
|
|
| (restated) |
|
|
| £m |
| £m |
|
Deferred taxation |
|
|
|
|
|
Accelerated capital allowances |
| 37 |
| 16 |
|
Goodwill and other intangible assets |
| 117 |
| 82 |
|
Tax losses and credits |
| (58 | ) | (37 | ) |
Pensions and post-retirement benefits |
| (174 | ) | (181 | ) |
Other timing differences |
| 33 |
| 3 |
|
Net deferred taxation asset |
| (45 | ) | (117 | ) |
Comprising: |
|
|
|
|
|
Deferred tax asset (note 17) |
| (18 | ) | (22 | ) |
Deferred tax liability |
| 147 |
| 86 |
|
Pensions and post-retirement benefits (note 5) |
| (174 | ) | (181 | ) |
|
| (45 | ) | (117 | ) |
|
| 31 August |
|
|
| 2004 |
|
|
| £m |
|
Movement in deferred taxation |
|
|
|
At the beginning of the year |
| 136 |
|
Prior year adjustment |
| (253 | ) |
At the beginning of the year (restated) |
| (117 | ) |
Timing differences within statement of total recognised gains and losses |
| 22 |
|
Charged during the year |
| 50 |
|
At the end of the year |
| (45 | ) |
The prior year adjustment arises following the introduction of ‘FRS 17 – Retirement benefits’.
Deferred tax assets of £39m at 31 August 2004 (2003: £42m) have not been recognised due to the degree of uncertainty over the utilisation of the underlying tax losses and deductions in certain tax jurisdictions.
Deferred tax has not been provided for liabilities which might arise on unremitted earnings of overseas subsidiaries and associates, as such earnings are reinvested by the Group and no tax is expected to be payable on them in the foreseeable future.
71
20. Net debt
|
| Redemption |
| 31 August |
| 31 August |
|
|
| date |
| 2004 |
| 2003 |
|
|
|
|
| £m |
| £m |
|
Unsecured loans |
|
|
|
|
|
|
|
GBP250m Bond (6.625%)* |
| 2014 |
| 247 |
| 247 |
|
EUR600m Bond (5.875%)* |
| 2009 |
| 402 |
| 410 |
|
GBP450m Bond (6.625%)* |
| 2011 |
| 448 |
| 447 |
|
EUR800m Bond (5.5%)* |
| 2006 |
| 539 |
| 550 |
|
NZD125m Capital Notes (9.3%) |
| 2006 |
| 45 |
| 45 |
|
DEM500m Notes (4.75%)* |
| 2005 |
| 173 |
| 176 |
|
NZD100m Revolving Credit Facility* |
| 2006 |
| 19 |
| 23 |
|
MXN 600m Revolving Credit Facility |
| 2008 |
| 28 |
| 34 |
|
Foreign currency swaps |
| Various |
| (209 | ) | (115 | ) |
|
|
|
| 1,692 |
| 1,817 |
|
Less amounts repayable within one year |
|
|
| — |
| (2 | ) |
Loan capital |
|
|
| 1,692 |
| 1,815 |
|
Short-term borrowings |
|
|
| 378 |
| 772 |
|
Cash at bank and in hand |
|
|
| (129 | ) | (175 | ) |
Net debt |
|
|
| 1,941 |
| 2,412 |
|
* Borrowings and interest guaranteed by Allied Domecq PLC or Allied Domecq (Holdings) PLC.
The Euro and GBP Bonds have been partially swapped into floating rate US dollars.
The Parent Company has short-term borrowings of nil (2003: nil).
|
| 31 August |
| 31 August |
|
|
| 2004 |
| 2003 |
|
|
| £m |
| £m |
|
Repayment schedule |
|
|
|
|
|
More than five years |
| 695 |
| 1,104 |
|
Between two and five years |
| 222 |
| 711 |
|
Between one and two years |
| 775 |
| — |
|
Loan capital |
| 1,692 |
| 1,815 |
|
Short-term borrowings |
| 378 |
| 772 |
|
Total borrowings |
| 2,070 |
| 2,587 |
|
The funding policy of the Group is to maintain a broad portfolio of debt, diversified by source and maturity and to maintain committed facilities sufficient to cover with a minimum of £300m above peak borrowing requirements. At 31 August 2004 the Group had available undrawn committed bank facilities of £1,192m (2003: £1,346m) of which £77m (2003: £167m) matures in less than one year and £1,115m (2003: £1,179m) between two and five years.
21. Financial instruments
The Group’s treasury policies are set out in the Operating and Financial Review. Set out below is a year end comparison of the current and book values of the Group’s financial instruments by category, excluding short-term debtors and creditors. Where available, market rates have been used to determine current values. Where market rates are not available, current values have been calculated by discounting cash flows at prevailing interest and exchange rates.
|
| 31 August 2004 |
| 31 August 2003 |
| ||||
|
| Book |
| Current |
| Book |
| Current |
|
|
| value |
| value |
| value |
| value |
|
|
| £m |
| £m |
| £m |
| £m |
|
Cash at bank and in hand |
| 129 |
| 129 |
| 175 |
| 175 |
|
Short-term borrowings |
| (378 | ) | (378 | ) | (772 | ) | (772 | ) |
Loan capital |
| (1,692 | ) | (1,799 | ) | (1,815 | ) | (1,932 | ) |
Net debt |
| (1,941 | ) | (2,048 | ) | (2,412 | ) | (2,529 | ) |
72
Interest rate risk management
Exposure to interest rate fluctuations on borrowings and deposits is managed by using cross-currency swaps, interest rate swaps and purchased interest rate options. The Group has a fixed/floating debt target of 70% +/- 10%. At the year end, taking account of swaps, 71% (2003: 70%) of net debt was at fixed rates of interest. At the year end, the weighted average maturity of net debt was approximately 3.4 years (2003: 4 years).
|
| 31 August 2004 |
| 31 August 2003 |
| ||||
|
| Book |
| Current |
| Book |
| Current |
|
|
| value |
| value |
| value |
| value |
|
|
| £m |
| £m |
| £m |
| £m |
|
Interest rate swaps |
| 1 |
| (30 | ) | 1 |
| (34 | ) |
Cross-currency swaps |
| 8 |
| 32 |
| 7 |
| 44 |
|
|
| 9 |
| 2 |
| 8 |
| 10 |
|
There is a deferred loss in respect of interest rate swaps, being the net of the current value less book value, of which £10m (2003: £9m) relates to the financial year ending 31 August 2005 and £21m (2003: £26m) thereafter.
There is a deferred gain in respect of cross-currency swaps, being the net of the current value less book value, of which £4m (2003: £6m) relates to the financial year ending 31 August 2005 and £20m (2003: £31m) thereafter.
After taking account of cross-currency and interest rate swaps, the currency and interest rate exposure of net debt as at 31 August 2004 was:
|
| 31 August 2004 |
| 31 August 2003 |
| ||||||||||||||||
|
|
|
|
|
| Fixed rate debt |
|
|
|
|
| Fixed rate debt |
| ||||||||
|
|
|
|
|
|
|
|
|
| Weighted |
|
|
|
|
|
|
|
|
| Weighted |
|
|
|
|
|
|
|
|
|
|
| average time |
|
|
|
|
|
|
|
|
| average time |
|
|
|
|
| Floating |
|
|
| Weighted |
| for which |
|
|
| Floating |
|
|
| Weighted |
| for which |
|
|
| Net |
| rate |
| Fixed rate |
| average |
| rate is fixed |
| Net |
| rate |
| Fixed rate |
| average |
| rate is fixed |
|
|
| debt |
| net debt |
| debt |
| interest rate |
| Years |
| debt |
| net debt |
| debt |
| interest rate |
| Years |
|
|
| £m |
| £m |
| £m |
| % |
|
|
| £m |
| £m |
| £m |
| % |
|
|
|
Sterling |
| 18 |
| 18 |
| — |
| — |
| — |
| 65 |
| 5 |
| 60 |
| 11.2 |
| 8 |
|
US dollar |
| 1,205 |
| 443 |
| 762 |
| 5.8 |
| 5 |
| 1,471 |
| 523 |
| 948 |
| 5.7 |
| 5 |
|
Euro |
| 562 |
| 89 |
| 473 |
| 5.2 |
| 2 |
| 701 |
| 166 |
| 535 |
| 5.1 |
| 4 |
|
NZ dollar |
| 95 |
| 22 |
| 73 |
| 8.1 |
| 2 |
| 108 |
| 35 |
| 73 |
| 8.1 |
| 3 |
|
Japanese Yen |
| 103 |
| 34 |
| 69 |
| 0.7 |
| 3 |
| 110 |
| 36 |
| 74 |
| 0.7 |
| 4 |
|
Other |
| (42 | ) | (42 | ) | — |
| — |
| — |
| (43 | ) | (43 | ) | — |
| — |
| — |
|
Net debt |
| 1,941 |
| 564 |
| 1,377 |
| 5.7 |
| 4 |
| 2,412 |
| 722 |
| 1,690 |
| 5.6 |
| 6 |
|
Some of the interest rate swaps included in the above table are cancellable at the option of the banks at various dates between 1 September 2004 and 31 August 2006.
The floating rate debt includes bank debt bearing interest at rates based on the relevant inter-bank rate and on commercial paper rates in the UK, US, Canada and France. These rates are fixed in advance for periods up to six months. The weighted average interest rate on floating net debt as at 31 August 2004 was approximately 3.6% (2003: 2.8%).
Foreign exchange
The Group estimates its net transaction cash flows in its main currencies of business which are then hedged forward for up to 18 months using a combination of forward exchange contracts and purchased foreign exchange options. At the year end 82% (2003: 84%) of such currency exposures had been hedged for the following 12 months.
The estimated current value of the foreign exchange cover forward contracts and options entered into to hedge future transaction flows is set out below based on quoted market prices where available and option pricing models.
|
| 31 August 2004 |
| 31 August 2003 |
| |||||||||
|
| Nominal |
|
|
|
|
| Nominal |
|
|
|
|
| |
|
| value of |
| Book |
| Current |
| value of |
| Book |
| Current |
| |
|
| derivatives |
| value |
| value |
| derivatives |
| value |
| value |
| |
|
| £m |
| £m |
| £m |
| £m |
| £m |
| £m |
| |
Foreign exchange forward rate contracts | – assets |
| 140 |
| — |
| 5 |
| 155 |
| — |
| 4 |
|
| – liabilities |
| 53 |
| — |
| (1 | ) | 72 |
| — |
| (4 | ) |
Options | – assets |
| 110 |
| — |
| 3 |
| 19 |
| — |
| — |
|
| – liabilities |
| — |
| — |
| — |
| 19 |
| — |
| — |
|
|
| 303 |
| — |
| 7 |
| 265 |
| — |
| — |
| |
A net gain of £13m was recognised on all foreign exchange forward contracts and options maturing in the year to 31 August 2004 (2003: £13m).
At 31 August 2004 and 31 August 2003, there were no material monetary assets or liabilities in currencies other than the functional currencies of Group companies, having taken into account the effect of derivative financial instruments that have been used to hedge foreign currency exposure.
73
22. Share capital
|
| Authorised |
| Allotted, called up |
| ||||
|
| 31 August |
| 31 August |
| 31 August |
| 31 August |
|
|
| 2004 |
| 2003 |
| 2004 |
| 2003 |
|
|
| £m |
| £m |
| £m |
| £m |
|
Equity |
|
|
|
|
|
|
|
|
|
Ordinary Shares of 25p |
| 400 |
| 400 |
| 277 |
| 277 |
|
|
| Authorised |
| Issued |
| ||||
|
| Million |
| Million |
| Million |
| Million |
|
Number of shares |
| 1,600 |
| 1,600 |
| 1,107 |
| 1,107 |
|
Share option schemes
During the year options have been granted under the existing employee share option schemes over both Ordinary Shares and American Depositary Shares (ADSs) totalling 13,159,067* shares. Options were exercised over 3,986,000* shares and options over 2,349,338* shares lapsed during the year.
* These totals include ADSs each of which represents four underlying Ordinary Shares.
Details of the unexercised options granted under the Company’s employee share option schemes at 31 August 2004 were as follows:
|
|
|
| Option |
| Ordinary |
|
|
| Date of grant |
| price (p) |
| Shares |
|
Options over Ordinary Shares |
|
|
|
|
|
|
|
SAYE Scheme 1999 |
| 3 December 1999 |
| 262.0 |
| 593,197 |
|
International SAYE Scheme 1999 |
| 2 June 2000 |
| 265.0 |
| 117,883 |
|
|
| 30 November 2001 |
| 282.0 |
| 522,009 |
|
Approved Executive Share Option Scheme 1999 |
| 5 May 2000 |
| 331.0 |
| 9,063 |
|
|
| 8 May 2001 |
| 408.0 |
| 845,480 |
|
|
| 2 November 2001 |
| 351.5 |
| 298,442 |
|
|
| 3 May 2002 |
| 438.0 |
| 34,245 |
|
|
| 1 November 2002 |
| 382.0 |
| 426,548 |
|
|
| 1 May 2003 |
| 351.0 |
| 25,641 |
|
|
| 23 October 2003 |
| 383.0 |
| 353,751 |
|
|
| 26 April 2004 |
| 455.25 |
| 6,589 |
|
Executive Share Option Scheme 1999 |
| 1 November 1999 |
| 342.0 |
| 3,524,647 |
|
|
| 16 November 1999 |
| 331.5 |
| 292,500 |
|
|
| 5 May 2000 |
| 331.0 |
| 15,937 |
|
|
| 8 May 2001 |
| 408.0 |
| 2,679,218 |
|
|
| 2 November 2001 |
| 351.5 |
| 4,465,579 |
|
|
| 3 May 2002 |
| 438.0 |
| 214,353 |
|
|
| 1 November 2002 |
| 382.0 |
| 7,122,334 |
|
|
| 1 May 2003 |
| 351.0 |
| 64,359 |
|
|
| 23 October 2003 |
| 383.0 |
| 8,209,060 |
|
|
| 26 April 2004 |
| 455.25 |
| 129,901 |
|
Long Term Incentive Scheme 1999 |
| 2 November 2001 |
| 0.1 |
| 1,563,889 |
|
|
| 3 May 2002 |
| 0.1 |
| 77,054 |
|
|
| 1 November 2002 |
| 0.1 |
| 1,015,906 |
|
|
| 23 October 2003 |
| 0.1 |
| 1,051,959 |
|
|
| 26 April 2004 |
| 0.1 |
| 49,423 |
|
|
|
|
|
|
| 33,708,967 |
|
74
|
|
|
| Option |
|
|
|
|
| Date of grant |
| price $ |
| ADSs |
|
Options over ADSs |
|
|
|
|
|
|
|
US Schedule to the Executive Share Option Scheme 1999 |
| 1 November 2002 |
| 24.45 |
| 425,715 |
|
|
| 8 January 2003 |
| 25.85 |
| 3,868 |
|
|
| 1 May 2003 |
| 22.93 |
| 3,750 |
|
|
| 1 October 2003 |
| 26.16 |
| 373,566 |
|
Executive Share Option Scheme 1999 |
| 1 November 2002 |
| 24.45 |
| 37,975 |
|
|
| 8 January 2003 |
| 25.85 |
| 33,366 |
|
|
| 1 May 2003 |
| 22.93 |
| 1,750 |
|
|
| 23 October 2003 |
| 26.16 |
| 337,638 |
|
Long Term Incentive Scheme 1999 |
| 8 January 2003 |
| 0.006 |
| 21,276 |
|
|
| 26 April 2004 |
| 0.006 |
| 41,952 |
|
|
|
|
|
|
| 1,280,856 |
|
The Company currently satisfies the exercise of options using existing shares that are purchased in the market by the Company’s employee trusts. The profit and loss expense under the option plans is determined based upon the excess of the option price of the underlying options and the market value on the date of the award and is amortised over the vesting period. As at 31 August 2004 the Company’s employee trusts held 27,073,905 shares (including ADSs) in the Company all of which were the subject of awards made under the Company’s employee share schemes. The Trustees are obliged to waive the dividends on these shares. The options exercised during the year were all satisfied by the transfer of shares to participants by the employee trusts.
23. Capital and reserves
|
|
|
|
|
|
|
| Shares |
|
|
|
|
|
|
|
|
| Share |
|
|
| held in |
| Profit |
|
|
|
|
| Share |
| premium |
| Merger |
| employee |
| and loss |
|
|
|
|
| capital |
| account |
| reserve |
| trusts |
| account |
| Total |
|
|
|
|
|
|
|
|
| (restated) |
| (restated) |
|
|
|
|
| £m |
| £m |
| £m |
| £m |
| £m |
| £m |
|
Group |
|
|
|
|
|
|
|
|
|
|
|
|
|
At the beginning of the year |
| 277 |
| 165 |
| (823 | ) | — |
| 1,299 |
| 918 |
|
Prior year adjustment |
| — |
| — |
| — |
| (129 | ) | (552 | ) | (681 | ) |
At the beginning of the year (restated) |
| 277 |
| 165 |
| (823 | ) | (129 | ) | 747 |
| 237 |
|
Profit earned for Shareholders for the year |
| — |
| — |
| — |
| — |
| 356 |
| 356 |
|
Currency translation differences on foreign currency net investments |
| — |
| — |
| — |
| — |
| 108 |
| 108 |
|
Taxation on translation differences |
| — |
| — |
| — |
| — |
| (26 | ) | (26 | ) |
Movement on shares in employee trusts |
| — |
| — |
| — |
| 17 |
| — |
| 17 |
|
Associated undertaking reserve movement |
| — |
| — |
| — |
| — |
| (17 | ) | (17 | ) |
Actuarial gain on pension liabilities (net of deferred tax) |
| — |
| — |
| — |
| — |
| 2 |
| 2 |
|
Ordinary dividends |
| — |
| — |
| — |
| — |
| (167 | ) | (167 | ) |
At the end of the year |
| 277 |
| 165 |
| (823 | ) | (112 | ) | 1,003 |
| 510 |
|
Goodwill (at historic exchange rates) of £2,284m has been written off to reserves.
75
The following adjustments have been made to opening Shareholders’ funds as a result of the adoption of ‘FRS 17 – Retirement benefits’, ‘Application Note G – revenue recognition’ an amendment to ‘FRS 5 – Reporting the substance of transactions’ and ‘UITF 38 – Accounting for ESOP Trusts’.
|
| 31 August |
|
|
| £m |
|
Reversal of SSAP 24 pension debtor |
| (309 | ) |
Reversal of SSAP 24 post-retirement medical benefit |
| 90 |
|
Gross pension and post-retirement benefits reported under FRS 17 |
| (586 | ) |
Deferred taxation adjustments on above |
| 253 |
|
UITF 38 reclassification of shares held by employee trusts |
| (129 | ) |
Total prior year adjustments |
| (681 | ) |
|
| Share |
| Share |
| Merger |
| Capital |
| Shares |
| Profit |
| Total |
|
|
|
|
|
|
|
|
|
|
| (restated) |
|
|
|
|
|
|
| £m |
| £m |
| £m |
| £m |
| £m |
| £m |
| £m |
|
Parent Company |
|
|
|
|
|
|
|
|
|
|
|
|
|
|
|
At the beginning of the year |
| 277 |
| 165 |
| 2,420 |
| 651 |
| — |
| 534 |
| 4,047 |
|
Prior year adjustment |
| — |
| — |
| — |
| — |
| (129 | ) | — |
| (129 | ) |
At the beginning of the year (restated) |
| 277 |
| 165 |
| 2,420 |
| 651 |
| (129 | ) | 534 |
| 3,918 |
|
Profit earned for Shareholders for the year |
| — |
| — |
| — |
| — |
| — |
| 301 |
| 301 |
|
Movement on shares in employee trusts |
| — |
| — |
| — |
| — |
| 17 |
| — |
| 17 |
|
Ordinary dividends |
| — |
| — |
| — |
| — |
| — |
| (167 | ) | (167 | ) |
At the end of the year |
| 277 |
| 165 |
| 2,420 |
| 651 |
| (112 | ) | 668 |
| 4,069 |
|
24. Minority interests
|
| Equity |
| Non-equity |
| Total |
|
|
| £m |
| £m |
| £m |
|
At the beginning of the year |
| 72 |
| 4 |
| 76 |
|
Currency translation adjustment |
| (3 | ) | — |
| (3 | ) |
Share of profits of subsidiary undertakings |
| 12 |
| 2 |
| 14 |
|
Dividends declared |
| (4 | ) | (1 | ) | (5 | ) |
Disposals |
| (2 | ) | — |
| (2 | ) |
At the end of the year |
| 75 |
| 5 |
| 80 |
|
The principal minority shareholdings relate to Jinro Ballentines Company Limited and Corby Distilleries Limited.
76
25. Detailed analysis of gross cash flows
|
| Year to |
| Year to |
|
|
|
|
| (restated) |
|
|
| £m |
| £m |
|
Returns on investments and servicing of finance |
|
|
|
|
|
Interest received |
| 7 |
| 22 |
|
Interest paid |
| (124 | ) | (149 | ) |
Dividends paid to minority shareholders |
| (5 | ) | (21 | ) |
|
| (122 | ) | (148 | ) |
Taxation paid |
|
|
|
|
|
UK taxation |
| (1 | ) | — |
|
Overseas taxation |
| (81 | ) | (65 | ) |
|
| (82 | ) | (65 | ) |
Capital expenditure and financial investment |
|
|
|
|
|
Purchase of tangible fixed assets |
| (112 | ) | (144 | ) |
Sale of tangible fixed assets |
| 53 |
| 21 |
|
Purchase of intangible fixed assets |
| (8 | ) | — |
|
Purchase of trade investments |
| — |
| (3 | ) |
Disposal of trade investments |
| 9 |
| 6 |
|
|
| (58 | ) | (120 | ) |
Acquisitions and disposals |
|
|
|
|
|
Purchase of subsidiary undertaking |
| (10 | ) | — |
|
Purchase of associated undertaking |
| (1 | ) | — |
|
Sale of subsidiary undertaking |
| 20 |
| — |
|
|
| 9 |
| — |
|
Financing |
|
|
|
|
|
Net movement of Ordinary Share capital within employee trusts* |
| 17 |
| (36 | ) |
Redemption of debt |
| — |
| (175 | ) |
(Decrease)/increase in other borrowings |
| (1 | ) | 11 |
|
|
| 16 |
| (200 | ) |
Following the adoption of ‘UITF 38 – Accounting for ESOP Trusts’ the net cash outflow arising from the purchase and disposal of shares by the trusts in 2003 has been reclassified from ‘Capital expenditure and financial investment’ to ‘Financing’.
* Includes American Depositary Shares representing underlying Ordinary Shares.
26. Reconciliation of net cash inflow from operating activities to free cash flow
|
| Year to |
| Year to |
| |
|
| £m |
| £m |
| |
Net cash inflow from operating activities |
| 655 |
| 748 |
| |
Capital expenditure net of sale of tangible assets |
| (59 | ) | (123 | ) | |
Dividends received from associated undertakings |
| 15 |
| 13 |
| |
Operating cash net of fixed assets |
| 611 |
| 638 |
| |
Taxation paid |
| (82 | ) | (65 | ) | |
Net interest paid |
| (117 | ) | (127 | ) | |
Dividends paid | – Ordinary Shareholders |
| (156 | ) | (144 | ) |
| – minorities |
| (5 | ) | (21 | ) |
Free cash flow |
| 251 |
| 281 |
| |
77
27. Net debt
|
|
|
|
|
| Other |
|
|
|
|
|
|
|
|
|
|
|
|
| short-term |
|
|
| Year to 31 August |
| ||
|
| Cash at |
| Overdrafts |
| borrowings |
| Loan capital |
| 2004 |
| 2003 |
|
|
| bank and |
| due within |
| due within |
| due after |
| Net |
| Net |
|
|
| in hand |
| one year |
| one year |
| one year |
| debt |
| debt |
|
|
| £m |
| £m |
| £m |
| £m |
| £m |
| £m |
|
At the beginning of the year |
| 175 |
| (90 | ) | (682 | ) | (1,815 | ) | (2,412 | ) | (2,578 | ) |
(Decrease)/increase in cash |
| (37 | ) | — |
| 310 |
| — |
| 273 |
| 134 |
|
Increase/(decrease) in liquid resources |
| 4 |
| — |
| — |
| — |
| 4 |
| (50 | ) |
Decrease/(increase) in loan capital and other loans |
| — |
| — |
| 2 |
| (1 | ) | 1 |
| 164 |
|
Exchange adjustments |
| (13 | ) | 16 |
| 66 |
| 124 |
| 193 |
| (82 | ) |
At the end of the year |
| 129 |
| (74 | ) | (304 | ) | (1,692 | ) | (1,941 | ) | (2,412 | ) |
Liquid resources comprise short-term deposits which have maturity dates of less than three months.
28 Capital commitments
|
| 31 August |
| 31 August |
|
|
| £m |
| £m |
|
Contracted for but not provided in the accounts |
| 3 |
| 1 |
|
29 Operating lease commitments
|
| Land and |
| Other |
| Land and |
| Other |
|
|
| £m |
| £m |
| £m |
| £m |
|
The minimum operating lease payments to be made in the year ending 31 August 2005 for leases expiring: |
|
|
|
|
|
|
|
|
|
Within one year |
| 5 |
| 4 |
| 4 |
| 1 |
|
Within two to five years |
| 24 |
| 7 |
| 14 |
| 8 |
|
After five years |
| 21 |
| — |
| 26 |
| — |
|
|
| 50 |
| 11 |
| 44 |
| 9 |
|
30. Contingent liabilities
|
| Parent Company |
| ||
|
| 31 August |
| 31 August |
|
|
| £m |
| £m |
|
Guarantees in respect of liabilities of subsidiary undertakings |
| 2,188 |
| 2,555 |
|
In the normal course of business, the Group has a number of legal claims or potential claims against it, none of which are expected to give rise to significant loss. We are not currently involved in any legal or arbitration proceedings, including any proceedings which are threatened or pending of which we are aware, which may have a material effect on our financial position, results of operations or liquidity. Allied Domecq, together with the other players in the US drinks industry, has been named in a putative class action lawsuit in the State of Ohio alleging a consistent, long-running, deceptive programme of advertising and marketing which is illegally targeted at children and under-age drinkers and claiming disgorgement of unlawful profits. The lawsuit, which is being vigorously defended, is in the very early pre-discovery, pre-trial pleading stages; accordingly, it is too early to determine the materiality of the contingent liability arising from this lawsuit and no reserve has been established in connection therewith.
78
31. Related party transactions
Transactions with associated undertakings
All transactions with these undertakings arise in the normal course of the business.
|
| Year to |
| Year to |
|
|
| £m |
| £m |
|
Sales to associated undertakings |
| 52 |
| 43 |
|
Purchases of goods and other services |
| (2 | ) | (11 | ) |
Marketing expenditure charged |
| (11 | ) | (14 | ) |
Dividends received |
| 15 |
| 13 |
|
|
| As at |
| As at |
|
|
| £m |
| £m |
|
Loans to associated undertakings |
| 2 |
| 2 |
|
Net amounts due from associated undertakings |
| 10 |
| 6 |
|
Transactions with Directors
Remuneration and shareholdings of Directors are disclosed in the Directors’ Remuneration Report on pages 46 to 53.
79
Profit and loss account for the year |
| 2000 |
| 2001 |
| 2002 |
| 2003 |
| 2004 |
| |
|
| £m |
| £m |
| £m |
| £m |
| £m |
| |
Continuing operations |
| 2,602 |
| 2,800 |
| 3,254 |
| 3,317 |
| 3,229 |
| |
Discontinued operations |
| 18 |
| — |
| — |
| — |
| — |
| |
Turnover |
| 2,620 |
| 2,800 |
| 3,254 |
| 3,317 |
| 3,229 |
| |
Continuing operations |
| 487 |
| 506 |
| 585 |
| 637 |
| 657 |
| |
Discontinued operations |
| 13 |
| — |
| — |
| — |
| — |
| |
Trading profit |
| 500 |
| 506 |
| 585 |
| 637 |
| 657 |
| |
Finance charges |
| (83 | ) | (39 | ) | (106 | ) | (146 | ) | (136 | ) | |
Normalised profit before the following items: |
| 417 |
| 467 |
| 479 |
| 491 |
| 521 |
| |
Goodwill amortisation |
| (3 | ) | (12 | ) | (38 | ) | (40 | ) | (40 | ) | |
Exceptional operating costs |
| (54 | ) | 38 |
| 129 |
| 28 |
| (36 | ) | |
Profits/(losses) on sales of businesses and fixed assets |
| 59 |
| 6 |
| — |
| — |
| 34 |
| |
Profit on ordinary operations before taxation |
| 419 |
| 499 |
| 570 |
| 479 |
| 479 |
| |
Taxation |
| (80 | ) | (132 | ) | (166 | ) | (126 | ) | (109 | ) | |
Minority interests and preference dividends |
| (9 | ) | (13 | ) | (13 | ) | (16 | ) | (14 | ) | |
Earned for Ordinary Shareholders |
| 330 |
| 354 |
| 391 |
| 337 |
| 356 |
| |
Earnings and dividends |
|
|
|
|
|
|
|
|
|
|
| |
Earnings per Ordinary Share | – basic |
| 31.2 | p | 33.6 | p | 36.7 | p | 31.3 | p | 33.1 | p |
| – normalised |
| 28.6 | p | 32.0 | p | 32.5 | p | 33.2 | p | 35.5 | p |
Dividends per Ordinary Share |
| 11.0 | p | 12.1 | p | 13.0 | p | 14.0 | p | 15.5 | p | |
Normalised cover for ordinary dividends |
| 2.5 | x | 2.6 | x | 2.5 | x | 2.4 | x | 2.3 | x | |
Normalised earnings per Ordinary Share exclude discontinued operations and the taxation thereon.
Balance sheet at year end |
| 2000 |
| 2001 |
| 2002 |
| 2003 |
| 2004 |
|
|
| £m |
| £m |
| £m |
| £m |
| £m |
|
Assets employed |
|
|
|
|
|
|
|
|
|
|
|
Fixed assets |
| 762 |
| 1,486 |
| 2,297 |
| 2,355 |
| 2,249 |
|
Net current assets excluding net borrowings |
| 1,009 |
| 724 |
| 1,046 |
| 947 |
| 891 |
|
Creditors over one year and provisions |
| (316 | ) | (145 | ) | (221 | ) | (172 | ) | (222 | ) |
Pension and post-retirement liabilities (net of deferred taxation) |
| — |
| (25 | ) | (336 | ) | (405 | ) | (387 | ) |
Total assets |
| 1,455 |
| 2,040 |
| 2,786 |
| 2,725 |
| 2,531 |
|
Short-term borrowings less cash |
| (446 | ) | (659 | ) | (802 | ) | (597 | ) | (249 | ) |
Loan capital |
| (806 | ) | (1,195 | ) | (1,776 | ) | (1,815 | ) | (1,692 | ) |
Net assets |
| 203 |
| 186 |
| 208 |
| 313 |
| 590 |
|
Financed by |
|
|
|
|
|
|
|
|
|
|
|
Share capital and share premium |
| 293 |
| 293 |
| 442 |
| 442 |
| 442 |
|
Merger reserve |
| (823 | ) | (823 | ) | (823 | ) | (823 | ) | (823 | ) |
Shares held in employee trusts |
| — |
| (61 | ) | (93 | ) | (129 | ) | (112 | ) |
Profit and loss account |
| 667 |
| 709 |
| 602 |
| 747 |
| 1,003 |
|
Minority interests |
| 66 |
| 68 |
| 80 |
| 76 |
| 80 |
|
Shareholders’ funds and minorities |
| 203 |
| 186 |
| 208 |
| 313 |
| 590 |
|
The profit and loss account and balance sheets for 2001 to 2003 have been restated for the impact of the adoption of ‘FRS 17 – Retirement benefits’, ‘Application Note G – revenue recognition’ an amendment to ‘FRS 5 – Reporting the substance of transactions’ and ‘UITF 38 – Accounting for ESOP Trusts’. Comparatives for 2000 have not been restated, in the opinion of the Directors unnecessary expense would be incurred to obtain the relevant information.
80
Cash flow statement for the year |
| 2000 |
| 2001 |
| 2002 |
| 2003 |
| 2004 |
| |
|
| £m |
| £m |
| £m |
| £m |
| £m |
| |
Operating cash flow |
| 380 |
| 432 |
| 771 |
| 761 |
| 670 |
| |
Capital expenditure |
| (87 | ) | (97 | ) | (133 | ) | (144 | ) | (112 | ) | |
Proceeds from sale of fixed assets |
| 115 |
| 24 |
| 17 |
| 21 |
| 53 |
| |
Operating cash net of fixed assets |
| 408 |
| 359 |
| 655 |
| 638 |
| 611 |
| |
Tax repaid/(paid) |
| 21 |
| (34 | ) | (178 | ) | (65 | ) | (82 | ) | |
Interest paid |
| (77 | ) | (72 | ) | (129 | ) | (127 | ) | (117 | ) | |
Dividends paid | – to Shareholders |
| — |
| (163 | ) | (133 | ) | (144 | ) | (156 | ) |
| – to minorities |
| (4 | ) | (4 | ) | (4 | ) | (21 | ) | (5 | ) |
Free cash flow after dividends paid |
| 348 |
| 86 |
| 211 |
| 281 |
| 251 |
| |
Acquisitions |
| (103 | ) | (658 | ) | (1,155 | ) | (3 | ) | (19 | ) | |
Disposals |
| (114 | ) | 4 |
| 7 |
| 6 |
| 29 |
| |
Share capital (acquired)/issued |
| (39 | ) | (26 | ) | 115 |
| (36 | ) | 17 |
| |
Foreign currency translation of net debt |
| (29 | ) | (8 | ) | 98 |
| (82 | ) | 193 |
| |
Movement in net debt |
| 63 |
| (602 | ) | (724 | ) | 166 |
| 471 |
| |
Opening net debt |
| (1,315 | ) | (1,252 | ) | (1,854 | ) | (2,578 | ) | (2,412 | ) | |
Closing net debt |
| (1,252 | ) | (1,854 | ) | (2,578 | ) | (2,412 | ) | (1,941 | ) | |
Group highlights in the Euro and US dollars
|
| Sterling |
| Euro |
| US dollar |
| ||||||
|
| 2004 |
| 2003 |
| 2004 |
| 2003 |
| 2004 |
| 2003 |
|
|
| £ |
| £ |
| € |
| € |
| $ |
| $ |
|
EBITA |
| 657 | m | 637 | m | 972 | m | 924 | m | 1,189 | m | 1,006 | m |
EBITDA |
| 735 | m | 712 | m | 1,088 | m | 1,032 | m | 1,330 | m | 1,125 | m |
Earnings per share |
| 0.355 |
| 0.332 |
| 0.525 |
| 0.481 |
| 0.643 |
| 0.525 |
|
Dividends per share |
| 0.155 |
| 0.140 |
| 0.229 |
| 0.203 |
| 0.281 |
| 0.221 |
|
Net assets |
| 590 | m | 296 | m | 873 | m | 429 | m | 1,068 | m | 468 | m |
Free cash flow after dividends paid |
| 251 | m | 281 | m | 371 | m | 407 | m | 454 | m | 444 | m |
Figures stated in the Euro and US dollars have been translated at the 31 August closing rates of exchange for each year.
81
US GAAP reconciliation
Allied Domecq PLC listed on the New York Stock Exchange on 31 July 2002. Pages 82 to 85 provide an explanation and reconciliation from UK to US GAAP.
Differences between UK and US Generally Accepted Accounting Principles
The Group’s consolidated financial statements are prepared in accordance with UK GAAP, which differ from those generally accepted in the United States (‘US GAAP’). The significant differences between UK GAAP and US GAAP which affect the Group’s net income and Shareholders’ equity are summarised below.
Restatement of previously reported US GAAP information
In the course of doing preparatory work to convert its financial statements from UK GAAP to International Financial Reporting Standards (IFRS), the Group has identified an error in its prior reconciliation to US GAAP. The error relates to the foreign currency translation of certain assets and liabilities in connection with past business combinations. The principal assets and liabilities involved are brands, goodwill and related deferred tax. As a result, we have restated the US GAAP reconciliation for prior periods. This reconciliation adjustment does not affect any of our UK GAAP financial statements.
‘SFAS No. 52 – Foreign Currency Translation’, requires the Group to use the functional currency of the acquired entity to measure these assets and liabilities. As exchange rates between pounds sterling (the Group’s reporting currency) and the various functional currencies of the acquired entities move, SFAS No. 52 requires a corresponding change in the valuation of these assets and liabilities in the Group’s consolidated financial statements, with an offsetting charge or credit to currency translation adjustments within other comprehensive income.
In prior US GAAP reconciliations, the Group used pounds sterling in measuring certain of these assets and liabilities and as a result, the Group did not follow SFAS No. 52. The Group has followed SFAS No. 52 in the US GAAP reconciliation of its 2004 consolidated financial statements. The Group has restated the US GAAP reconciliation for prior periods and the impact in 2003 was a £1m charge on net income, a £105m credit to comprehensive income and a reduction in Shareholders’ equity of £26m. The impact of these restatements for prior periods 2000 to 2003 is as follows:
US GAAP reconciliation changes |
| Year ended |
| Year ended |
| Year ended |
| Year ended |
|
|
| £m |
| £m |
| £m |
| £m |
|
Net income as reported |
| 280 |
| 406 |
| 332 |
| 1,554 |
|
Effects of restatement: |
|
|
|
|
|
|
|
|
|
Brands |
| — |
| — |
| 2 |
| 3 |
|
Goodwill |
| — |
| — |
| 2 |
| 1 |
|
Stock |
| (1 | ) | 1 |
| — |
| — |
|
Deferred taxation |
| — |
| — |
| (1 | ) | (1 | ) |
Net income as restated |
| 279 |
| 407 |
| 335 |
| 1,557 |
|
|
|
|
|
|
|
|
|
|
|
Net earnings per Ordinary Share (pence) |
|
|
|
|
|
|
|
|
|
Basic as reported |
| 26.0 | p | 38.0 | p | 31.5 | p | 146.7 | p |
Effect of net income restatement |
| — |
| 0.1 | p | 0.3 | p | 0.3 | p |
Basic as restated |
| 26.0 | p | 38.1 | p | 31.8 | p | 147.0 | p |
|
|
|
|
|
|
|
|
|
|
Diluted as reported |
| 26.0 | p | 38.0 | p | 31.5 | p | 146.7 | p |
Effect of net income restatement |
| (0.1 | )p | 0.1 | p | 0.3 | p | 0.3 | p |
Diluted as restated |
| 25.9 | p | 38.1 | p | 31.8 | p | 147.0 | p |
|
|
|
|
|
|
|
|
|
|
Comprehensive income as reported |
| 297 |
| 73 |
| 114 |
| 1,592 |
|
Effects of restatement: |
|
|
|
|
|
|
|
|
|
Currency translation differences |
| 106 |
| (48 | ) | (10 | ) | 3 |
|
Restatement of net income |
| (1 | ) | 1 |
| 3 |
| 3 |
|
Comprehensive income as restated |
| 402 |
| 26 |
| 107 |
| 1,598 |
|
|
|
|
|
|
|
|
|
|
|
Shareholders’ equity as reported |
| 1,657 |
| 1,541 |
| 1,484 |
| 1,513 |
|
Effects of restatement: |
|
|
|
|
|
|
|
|
|
Brands |
| (48 | ) | (110 | ) | (60 | ) | (51 | ) |
Goodwill |
| 17 |
| (49 | ) | (44 | ) | (48 | ) |
Other intangible assets |
| — |
| — |
| 1 |
| — |
|
Stock |
| 3 |
| — |
| (1 | ) | — |
|
Deferred taxation |
| 2 |
| 28 |
| 20 |
| 21 |
|
Other |
| — |
| — |
| — |
| 1 |
|
Shareholders’ equity as restated |
| 1,631 |
| 1,410 |
| 1,400 |
| 1,436 |
|
82
(a) Brands, goodwill and other intangible assets
Under UK GAAP, goodwill arising on acquisitions of a business since 1 September 1998 is capitalised and is held in pounds sterling and amortised by equal instalments over its anticipated useful life, but not exceeding 20 years. Goodwill arising on acquisitions prior to 1 September 1998 was charged directly to reserves. On disposal of a business, any attributable goodwill previously eliminated against reserves is included in the calculation of any gain or loss. Purchased intangible assets are capitalised and amortised over their estimated useful economic lives on a straight line basis, except for purchased brand intangible assets. Purchased brand intangible assets are considered by the Board of Directors, to have an indefinite life given the long-term nature of premium spirits brands and the level of marketing support. We do not amortise purchased brand intangible assets but they are subject to annual impairment reviews.
Under US GAAP, prior to the adoption of ‘Statement of Financial Accounting Standards (‘SFAS’) No. 141 – Business Combinations’ and ‘SFAS No. 142 – Goodwill and Other Intangible Assets’, goodwill and other intangible assets arising on acquisition were capitalised and amortised over their useful economic lives, but not exceeding 40 years. The Group adopted the provisions of SFAS No. 141 as at 1 July 2001, and SFAS No. 142 as at 1 September 2001. Under SFAS No. 52 purchase accounting adjustments of acquired assets, liabilities and goodwill should be translated into the functional currency of the entity to which they relate. Goodwill and intangible assets determined to have an indefinite useful life acquired in a purchase business combination are no longer amortised and are subjected to annual impairment testing. Accordingly, net income no longer includes amortisation of brands, and goodwill amortisation recognised under UK GAAP is reversed.
The amount of goodwill under UK GAAP differs to that under US GAAP due to currency translation and the fair values allocated to intangible assets (including significant brands), stock, and the exclusion from the purchase price consideration of certain costs.
(b) Associated undertakings
The principal difference between UK GAAP and US GAAP relates to the accounting treatment of goodwill which is discussed in note (a).
(c) Stocks
Under UK GAAP, stock acquired through a business combination is valued at the lower of replacement cost and net realisable value. Under US GAAP, stock acquired through a business combination reflects the selling price less costs to complete, costs of disposal and a reasonable element of profit for the selling effort by the acquiring company. The GAAP difference relates to maturing stock, which is being released over a number of years when it is sold to third parties.
(d) Restructuring costs
Under UK GAAP, provisions are made for restructuring costs once a detailed formal plan is in place and valid expectations have been raised in those affected that the restructuring will be carried out. Provision is made for voluntary redundancy payments to the extent that it is expected that volunteers will come forward. US GAAP requires a number of specific criteria to be met before restructuring costs can be recognised as an expense. Also, to the extent restructuring costs are related to the activities of an acquired company, US GAAP allows them to be recognised as a liability upon acquisition provided certain specific criteria are met whereas UK GAAP does not. Accordingly, timing differences arise between UK GAAP and US GAAP recognition of restructuring costs.
(e) Pension and other post-retirement benefits
In accordance with ‘FRS 17 – Retirement benefits’, the operating and financing costs of pension and post-retirement schemes are recognised separately in the profit and loss account. Service costs are systematically spread over the service lives of the employees and financing costs are recognised in the period in which they arise. Financing costs include the interest cost and the expected return on assets (calculated using the market value of assets).The costs of past service benefit enhancements, settlements and curtailments are also recognised in the period in which they arise. The difference between actual and expected returns on assets during the year, including changes in actuarial assumptions, are recognised in the statement of total recognised gains and losses.
Under US GAAP, ‘SFAS No. 87 – Employers’ Accounting for Pensions’, where the unfunded accumulated benefit obligation (being the actuarial present value of benefits attributed by the pension benefit formula to employee service rendered prior to that date and based on current and past compensation levels) exceeds the fair value of plan assets, a liability must be recognised in the statement of financial position. If this liability exceeds the unrecognised prior service cost, the excess is recorded as a reduction of Shareholders’ equity, net of tax.
(f) Share compensation
Under UK GAAP, the cost of share option plans are amortised based on the excess of the option price of the underlying options and the market value at the date of the grant. Under US GAAP, compensation for fixed plan awards is determined at the date of grant, based on the cost of the fair value of the shares subject to the award, less the option exercise or purchase price, if any, except for allowable discounts with respect to certain qualified plans where the discount is no greater than 15% of the fair value of the shares. Compensation costs for variable plan awards is estimated at the end of each period from the date of grant to the date final compensation costs are determinable based on the difference between the fair value of the shares subject to the award and the option exercise or purchase price. Such cost is allocated to compensation expense over the vesting period and, if performance criteria are applicable to the award, based on actual performance attained.
83
(g) Proposed dividends
Under UK GAAP, the proposed dividends on Ordinary Shares, as recommended by the Directors, are deducted from Shareholders’ equity and shown as a liability in the balance sheet at the end of the period to which they relate, including proposed dividends which have been recommended but not yet approved by Shareholders. Under US GAAP, such dividends are only deducted from Shareholders’ equity at the date of declaration of the dividend.
(h) Derivative instruments and debt translation
The Group’s foreign currency, interest rate and commodity contracts that hedge against forecast exposures do not meet the US GAAP hedge accounting criteria. Under US GAAP, these contracts are marked to market at the balance sheet date and gains and losses arising are included in net income. Under UK GAAP, these gains and losses can be deferred until the hedged transactions actually occur.
Under UK GAAP, where the Group issues or holds foreign currency debt outside of its domestic country, translation gains and losses together with foreign exchange gains and losses on related cross currency swaps, are recorded in reserves. Under US GAAP, the Group does not meet the hedge accounting criteria and therefore both translation gains and losses on such debt and the mark to market on related swaps are recorded in income.
The Group may enter into foreign currency contracts to hedge the purchase price consideration on certain acquisitions. Under UK GAAP, the gains and losses arising on these foreign currency contracts are recognised in the purchase price consideration. Under US GAAP, the gains and losses arising on these foreign currency contracts are recognised within net income.
(i) Deferred taxation
Other than the tax effect of other UK to US GAAP differences there was only one material difference in the year ended 31 August 2003 between UK GAAP and US GAAP. This difference related to the recognition criteria for recording deferred tax assets under US GAAP and UK GAAP. Under US GAAP, the calculation of current and deferred tax assets is based on the probable tax treatment of the tax position taken. Once it is determined that there is a probable deferred tax asset, it is then reduced by a valuation allowance to the extent it is deemed more likely than not (a likelihood of more than 50%) that some portion or all of the deferred tax asset will not be realised. Under UK GAAP, both the existence of the asset and the probability of its recoverability are considered in combination, and a deferred tax asset is recognised only to the extent that its existence and recoverability are more likely than not.
(j) Exceptional items
Under UK GAAP, exceptional items are material charges or gains that are associated with the ordinary activities of the Group that the Board of Directors determine, individually or in aggregate, would have a material impact on the true and fair view of specific line items in the consolidated financial statements. Such items are included within the profit and loss account heading and disclosed in the notes to the consolidated financial statements. Under US GAAP, there is no such concept as exceptional items. Exceptional items would not be considered extraordinary or non-operating items under US GAAP.
(k) Mexican excise rebate
Under UK GAAP, we recognised the amount due when offset against future excise duty and other taxes payable. Under US GAAP, the Mexican excise rebate was recognised upon the issuance of a favourable court judgment and additional interest and inflation adjustments were recognised as they accrued.
(l) Liabilities
The Group is contractually obligated to make a payment to a business venture partner upon termination of the venture which, unless renewed, is scheduled to terminate in 2029. Under UK GAAP, the Group records the obligation at the present value of the payment obligation, discounted at a risk-adjusted rate to reflect the time value of money, and recognises interest expense each period such that the recorded obligation will equal the payment obligation at the currently best estimated scheduled maturity. Under US GAAP, the obligation is recorded at the amount payable at maturity (i.e. undiscounted).
(m) Franchise income
The Group has entered into agreements to sell the right to develop multiple stores within a specified territory, which entitles the Group to non-refundable franchise fees. Under UK GAAP, these franchise fees are recognised upon signing of the agreement. Under US GAAP, the revenue recognition is based on store openings or until the rights to develop the territory have been forfeited.
84
|
| Note |
| Year to |
| Year to |
|
|
|
|
|
|
| (restated) |
|
|
|
|
| £m |
| £m |
|
Profit earned for Ordinary Shareholders in accordance with UK GAAP (as restated, see page 55) |
|
|
| 356 |
| 337 |
|
Adjustments to conform with US GAAP: |
|
|
|
|
|
|
|
Brands |
| (a | ) | (69 | ) | — |
|
Goodwill |
| (a | ) | 42 |
| 42 |
|
Other intangible assets |
| (a | ) | (3 | ) | (3 | ) |
Stocks |
| (c | ) | (14 | ) | (23 | ) |
Restructuring costs |
| (d | ) | — |
| (7 | ) |
Pension costs and other post-retirement benefits |
| (e | ) | (26 | ) | 24 |
|
Share compensation |
| (f | ) | (17 | ) | 5 |
|
Derivative instruments and debt translation |
| (h | ) | 205 |
| (61 | ) |
Mexican excise rebate |
| (k | ) | — |
| (40 | ) |
Franchise income |
| (m | ) | (6 | ) | (10 | ) |
Other |
|
|
| 6 |
| (3 | ) |
Deferred taxation – other |
| (i | ) | — |
| (11 | ) |
Deferred taxation – on above US GAAP adjustments |
| (i | ) | (18 | ) | 29 |
|
Minority share of above adjustments |
|
|
| — |
| — |
|
Net income in accordance with US GAAP |
|
|
| 456 |
| 279 |
|
Other comprehensive income: |
|
|
|
|
|
|
|
Minimum pension liability |
|
|
| 8 |
| (61 | ) |
Currency translation differences |
|
|
| (175 | ) | 184 |
|
Comprehensive income in accordance with US GAAP |
|
|
| 289 |
| 402 |
|
Net earnings per Ordinary Share |
|
|
|
|
|
|
|
Basic |
|
|
| 42.4 | p | 26.0 | p |
Diluted |
|
|
| 42.1 | p | 25.9 | p |
Shareholders’ equity
|
| Note |
| Year to |
| Year to |
|
|
|
|
|
|
| (restated) |
|
|
|
|
| £m |
| £m |
|
Shareholders’ funds as reported in the Group balance sheet (as restated, see page 55) |
|
|
| 510 |
| 237 |
|
Adjustments to conform with US GAAP: |
|
|
|
|
|
|
|
Brands |
| (a | ) | 1,144 |
| 1,361 |
|
Goodwill |
| (a | ) | 270 |
| 244 |
|
Other intangible assets – costs |
| (a | ) | 159 |
| 179 |
|
Other intangible assets – accumulated amortisation |
| (a | ) | (143 | ) | (158 | ) |
Associated undertakings |
| (b | ) | 54 |
| 57 |
|
Stock |
| (c | ) | 12 |
| 26 |
|
Restructuring costs |
| (d | ) | 1 |
| 1 |
|
Pension and other post-retirement benefits |
| (e | ) | 104 |
| 185 |
|
Share compensation |
| (f | ) | (8 | ) | 6 |
|
Proposed dividends |
| (g | ) | 104 |
| 93 |
|
Derivative instruments and debt translation |
| (h | ) | (1 | ) | (18 | ) |
Liabilities |
| (l | ) | (38 | ) | (42 | ) |
Franchise income |
| (m | ) | (23 | ) | (19 | ) |
Other |
|
|
| 17 |
| 8 |
|
Deferred taxation – other |
| (i | ) | — |
| — |
|
Deferred taxation – on above US GAAP adjustments |
| (i | ) | (425 | ) | (529 | ) |
Minority share of above adjustments |
|
|
| — |
| — |
|
Shareholders’ equity in accordance with US GAAP |
|
|
| 1,737 |
| 1,631 |
|
85
Principal subsidiaries and associates
Allied Domecq PLC is the holding company of the Group. We have over 500 subsidiaries incorporated in over 50 countries. We have a 100% equity interest in all of our principal subsidiaries. We list those subsidiaries as at 31 August 2004 below together with their country of incorporation and operation.
Name |
| Country of incorporation and operation |
|
Allied Domecq (Holdings) PLC |
| England & Wales |
|
Allied Domecq Spirits & Wine Holdings PLC |
| England & Wales |
|
Allied Domecq Spirits & Wine Limited |
| England & Wales |
|
Allied Domecq Financial Services PLC |
| England & Wales |
|
Allied Domecq Overseas Limited |
| England & Wales |
|
Allied Domecq Overseas (Canada) Limited |
| England & Wales |
|
Allied Domecq Overseas Holdings Limited |
| Cayman Islands |
|
Allied Domecq Overseas (Europe) Limited |
| England & Wales |
|
Allied Domecq International Holdings B.V. |
| Netherlands |
|
Allied Domecq Netherlands B.V. |
| Netherlands |
|
Allied Domecq Luxembourg Holdings S.a.r.l. |
| Luxembourg |
|
Allied Domecq Luxembourg S.a.r.l. |
| Luxembourg |
|
Allied Domecq Canada Limited |
| Canada |
|
Hiram Walker-Gooderham & Worts Limited |
| Canada |
|
Allied Domecq North America Corp. |
| USA |
|
Allied Domecq Spirits & Wine Americas, Inc. |
| USA |
|
Allied Domecq Spirits & Wine USA, Inc. |
| USA |
|
The Group also has companies/investments in a number of other countries including Argentina, Australia, Austria, Barbados, Bolivia, Bosnia, Brazil, Bulgaria, Chile, China, Colombia, Croatia, Czech Republic, Denmark, Estonia, Finland, France, Germany, Greece, Hong Kong, Hungary, Iceland, India, Italy, Jamaica, Japan, Malaysia, Madeira, Mexico, New Zealand, Norway, Philippines, Poland, Portugal, Romania, Scotland, Singapore, Slovak Republic, Slovenia, South Korea, Spain, Sweden, Switzerland, Taiwan, Thailand, Uruguay, Venezuela, Vietnam and Yugoslavia.
Other than Allied Domecq (Holdings) PLC, none of the principal subsidiaries and associates listed are directly owned by Allied Domecq PLC. A complete list of subsidiaries will be included in the Company’s next annual return.
Other interest
The Group has an investment in Britannia Soft Drinks Limited (23.75% equity interest).
86
Analysis of shareholdings
The tables below show an analysis of Ordinary Shareholdings as at 31 August 2004:
|
| Holders |
| Percentage |
| Shares held |
| Percentage |
|
Private holders |
| 35,465 |
| 86.31 |
| 48,167,530 |
| 4.35 |
|
Corporate holders |
| 5,625 |
| 13.69 |
| 1,058,402,784 |
| 95.65 |
|
|
| 41,090 |
| 100.00 |
| 1,106,570,314 |
| 100.00 |
|
Number of shares held: |
|
|
|
|
|
|
|
|
|
1 – 10,000 |
| 39,520 |
| 96.18 |
| 45,976,196 |
| 4.16 |
|
10,001 – 50,000 |
| 812 |
| 1.98 |
| 17,693,587 |
| 1.60 |
|
50,001 – 250,000 |
| 396 |
| 0.96 |
| 45,922,092 |
| 4.15 |
|
250,001 – 1,000,000 |
| 197 |
| 0.48 |
| 99,628,650 |
| 9.00 |
|
Over 1,000,000 |
| 165 |
| 0.40 |
| 897,349,789 |
| 81.09 |
|
|
| 41,090 |
| 100.00 |
| 1,106,570,314 |
| 100.00 |
|
Financial calendar |
|
|
|
Ex dividend date for final dividend |
| 5 January 2005 |
|
Record date for final dividend |
| 7 January 2005 |
|
Annual General Meeting |
| 28 January 2005 |
|
Final dividend payable (Ordinary Shares) |
| 2 February 2005 |
|
Final dividend payable (ADRs) |
| 9 February 2005 |
|
Interim results announced (provisional) |
| 21 April 2005 |
|
Ex dividend date for interim dividend (provisional) |
| 29 June 2005 |
|
Record date for interim dividend (provisional) |
| 1 July 2005 |
|
Interim dividend payable (Ordinary Shares) (provisional) |
| 29 July 2005 |
|
Interim dividend payable (ADRs) (provisional) |
| 5 August 2005 |
|
Annual General Meeting
The AGM of the Company will be held at 2.00pm on 28 January 2005 at the Landmark London Hotel, 222 Marylebone Road, London NW1 6JQ. The Notice of Meeting is set out in the Chairman’s Letter to Shareholders.
87
![]()
Shareholder enquiries
UK – Registrars
Enquiries relating to your shareholding, dividend payments and other administrative matters should be addressed to the Company’s Registrar at
Computershare Investor Services PLC, PO Box 82,
The Pavilions, Bridgwater Road, Bristol BS99 7NH, UK.
Tel: +44 (0)870 702 0000
email: web.queries@computershare.co.uk
web address: www.computershare.com
Electronic communication
Allied Domecq offers Shareholders the opportunity to receive corporate documents such as the Report and Accounts and Notices of Meetings in electronic form. If you choose to take advantage of this you will receive an email notification each time a publication is made on the corporate website. Receiving corporate documents electronically has clear environmental benefits by reducing the amount of paper we use each time we produce and dispatch documents to Shareholders.
To register to receive Shareholder communications in this way and not receive printed copies by post, please follow the instructions below to record your email address:
1. Log on to www.allieddomecq.com
2. Click on Investor Relations
3. Click on Shareholder Services
4. Click on Registrar Services
5. Click on Online Shareholder Services
6. Enter your personal details – Shareholder Reference Number (this is the 11 – digit number printed on your form of proxy), surname, country or postcode, and click on ‘submit’
7. Click on Electronic Shareholder Communications
8. Read the Terms and Conditions and, if you agree to them, press ‘enter’
9. Register your email address and click on ‘submit’
If you do not register an email address you will continue to receive all future Shareholder communications in paper form through the post as before. If you decide to register you will be able to change your instruction or request paper copies of Shareholder information at any time. It is your responsibility to notify Computershare Investor Services PLC of any change in your contact details. Your email address can be changed online, but any change to your name or postal address must be notified in writing to Computershare Investor Services PLC.
![]()
USA – ADR administration
The depositary bank is the JPMorgan Chase Bank and enquiries on ADR holdings should be made to:
JPMorgan Chase Bank, Shareholder Relations,
PO Box 43013, Providence,
RI 02940-3013, USA.
Tel: +1 781 575 4328
email: adr@jpmorgan.com
web address: www.adr.com/shareholder
Company Secretary and Registered Office
Other enquiries should be addressed to:
Corporate Secretariat,
Allied Domecq PLC,
The Pavilions, Bridgwater Road,
Bedminster Down, Bristol BS13 8AR, UK.
Tel: +44 (0)117 978 5000
Institutional Shareholder enquiries
Institutional Shareholder enquiries should be addressed to:
Peter Durman, Director of Group Investor Relations, at the Registered Office address above.
Tel: +44 (0)117 978 5753
email: investor.relations@adsw.com
Environment and alcohol issues
For further details about our environmental and alcohol policies and related literature, please write to:
Jan Buckingham, Director, Group Social & Environmental Policy, at the Registered Office address above.
Corporate information and internet
Corporate information, including press releases, Annual Reports and presentations, can be downloaded from the Group’s website at www.allieddomecq.com
Share price quotation
For information on the market prices of the Company’s Ordinary Shares and ADRs, please refer to the investor relations section of the Group’s website.
Low-cost dealing service
For information on a low-cost dealing service for Shareholders, please refer to the Group’s website at www.allieddomecq.com or contact the Corporate Secretariat at the Registered Office (details above).
88
Advertising and promotion (A&P)
Expenditure on advertising and promotion of brands.
Associated undertaking
An entity in which the Group is able to exercise significant influence, normally by controlling more than 20% of the voting rights.
BMC
Brand Market Combination. For example, Ballantine’s in Spain is a BMC.
Bulk sales
Sales of unbottled/unbranded spirit sold in bulk to other spirits and wine producers.
Constant actual exchange
Profits or earnings where the prior year results of operations outside the UK are stated in sterling at the current year weighted average exchange rate to give a constant measure of growth year on year.
Core brands
The global priority brands are Ballantine’s, Beefeater, Canadian Club, Courvoisier, Kahlúa, Maker’s Mark, Malibu, Sauza and Tia Maria.
Dividend cover
Earnings per share divided by dividends per share, to assess the Group’s ability to pay dividends.
Earnings per share (EPS)
Profit for the year after tax and minority interests (Earnings) divided by the average number of shares.
EBITA
Earnings Before Interest and Tax and Amortisation of intangible fixed assets.
EBITDA
Earnings Before Interest, Tax, Depreciation of tangible fixed assets and Amortisation of intangible fixed assets.
Exceptional items
Gains or costs that are disclosed separately because they arise outside the normal business activity.
Franchising
Business where individuals and/or corporations are provided with the rights to market a specific company’s goods and/or services in a designated area for a designated fee.
Free cash flow
Operating cash less taxation, interest and dividends paid to shareholders and minority interest.
Gearing – enterprise value (EV)
Net debt expressed as a percentage of the total of the Group’s market capitalisation plus net debt.
Goodwill
The difference between the price paid for an acquisition and the fair value of the assets and liabilities acquired.
Liquid resources
Liquid resources comprise short-term deposits which have maturity dates of less than three months.
Local market leaders
These are brands that have a strong position in a particular market. These will include such brands as Stolichnaya and Hiram Walker Liqueurs in the US; Mexican brandies; Whisky DYC and Centenario in Spain; Imperial in Korea; Fundador in the Philippines; Teacher’s in the UK and Kuemmerling in Germany. These brands fall into two categories: those that deliver critical mass in key markets and those that provide an opportunity for strong value growth.
Market capitalisation
The price of one of the Company’s Ordinary Shares multiplied by the number of shares in issue.
Net brand contribution (NBC)
A measure of brand profitability before overhead costs but after A&P has been allocated.
Net turnover
Gross turnover excluding excise duty.
Normalised
Profits or earnings before exceptional items and goodwill excluding discontinued operations.
Ready-to-drink (RTD)
These are drinks which are sold in a premixed format.
Reserves
Mainly profits and surpluses retained within the business.
Return on investment (ROI)
Trading profit after tax expressed as a percentage of the average and total of capital and reserves plus net debt and goodwill written off.
Same store sales
Sales from established stores that have traded for at least two years and therefore the year on year comparison is not distorted by openings and closings.
Subsidiary undertaking
An entity in which the Group exercises a dominant influence, normally by controlling more than 50% of the voting rights.
Trade working capital
Trade working capital comprises total stock plus trade debtors less trade creditors.
Designed and produced by williams and phoa. Photography by John Ross
Printed in the UK on paper made from 50% pulp, 50% recycled fibres and is biodegradable.
© 2004 Allied Domecq PLC. All rights reserved. All brands mentioned in this Annual Report are trademarks and are registered and/or otherwise protected in accordance with applicable law.
Allied Domecq PLC
The Pavilions
Bridgwater Road
Bedminster Down
Bristol
BS13 8AR
UK
Registered number: 3771147
Registered in England and Wales
Telephone: +44 (0)117 978 5000
www.allieddomecq.com