UNITED STATES
SECURITIES AND EXCHANGE COMMISSION
Washington, D.C. 20549
FORM N-CSR
CERTIFIED SHAREHOLDER REPORT OF REGISTERED MANAGEMENT INVESTMENT COMPANIES
Investment Company Act file number: 811-02405, 811-09739 and 811-21434
Name of Fund: BlackRock Balanced Capital Fund, Inc., Master Large Cap Core Portfolio of Master Large Cap
Series LLC and Master Total Return Portfolio of Master Bond LLC
Fund Address: 100 Bellevue Parkway, Wilmington, DE 19809
Name and address of agent for service: John M. Perlowski, Chief Executive Officer, BlackRock Balanced Capital Fund, Inc., Master Large Cap Core Portfolio of Master Large Cap Series LLC and Master Total Return Portfolio of Master Bond LLC, 55 East 52nd Street, New York, NY 10055
Registrants’ telephone number, including area code: (800) 441-7762
Date of fiscal year end: 09/30/2013
Date of reporting period: 09/30/2013
Item 1 – Report to Stockholders
SEPTEMBER 30, 2013
BlackRock Balanced Capital Fund, Inc.
| | |
| Not FDIC Insured ¡ May Lose Value ¡ No Bank Guarantee | | |
| | | | | | |
| 2 | | BLACKROCK BALANCED CAPITAL FUND, INC. | | SEPTEMBER 30, 2013 | | |
Dear Shareholder
One year ago, financial markets were in a soft patch as global trade slowed, driven by a recession in Europe and decelerating growth in China. Volatility increased toward the end of 2012 due to growing concern that bipartisan gridlock in Washington, D.C. would preclude a timely resolution to US budget negotiations. Failure to reach an agreement before the end of the year would have triggered the “fiscal cliff” of pre-mandated tax increases and spending cuts as of the beginning of 2013, putting the US economy at risk for recession. The worst of the fiscal cliff was averted, however, with a last-minute tax deal, allowing markets to get off to a strong start in 2013. Money that had been pulled to the sidelines amid year-end tax-rate uncertainty poured back into the markets in January. Key indicators signaling modest but broad-based improvements in the world’s major economies, coupled with the absence of negative headlines from Europe, fostered an aura of comfort for investors. Global equities surged, while rising US Treasury yields pressured high quality fixed income assets. (Bond prices fall when yields rise.)
Global economic momentum slowed in February and the pace of the rally moderated. In the months that followed, US stocks outperformed international stocks, as the US recovery showed greater stability compared to most other regions. Slow, but positive, growth in the United States was sufficient to support corporate earnings, while uncomfortably high unemployment reinforced expectations that the Federal Reserve would keep interest rates low. International markets experienced higher levels of volatility given a resurgence of political instability in Italy, a severe banking crisis in Cyprus and a generally poor outlook for European economies. Emerging markets significantly lagged the rest of the world as growth in these economies, particularly in China and Brazil, fell short of expectations.
In May, comments from the Fed suggesting a possible reduction of its bond-buying stimulus program before the end of 2013 roiled markets around the world. Equities plummeted and a dramatic increase in US Treasury yields resulted in tumbling bond prices. Markets rebounded in late June when the tone of the US central bank turned more dovish. Improving economic indicators and a positive outlook for corporate earnings further boosted risk assets in July, with major US equity indices hitting new record highs.
Markets slumped again in August as investors became wary amid looming macro risks. Mixed economic data stirred up worries about global growth and renewed anxieties about when and how much the Fed would scale back on its asset purchase program. Additional volatility stemmed from the escalation of the revolution in Egypt and the civil war in Syria. These conflicts underscored the broader issue of rising geopolitical instability in the Middle East/North Africa region and put upward pressure on oil prices, creating an additional headwind for global economic growth.
September was surprisingly positive for investors thanks to the easing of several key risks. Most importantly, the Federal Reserve defied market expectations with its decision to maintain the current pace of its asset purchase program. Additionally, the more hawkish candidate to become the next Federal Reserve Chairman, Larry Summers, withdrew from the race. On the geopolitical front, the violence in Egypt subsided and the situation in Syria no longer appeared to warrant foreign military intervention. In Europe, the re-election of Angela Merkel as Chancellor of Germany was welcomed as a continuation of the status quo. These developments drove all asset classes generally higher for the month of September even though the final week of the month saw risk markets decline due to political wrangling over US fiscal policy, which ultimately led to a government shutdown at the close of the period.
Though we’ve seen periods of heightened uncertainty and market volatility over the past year, riskier asset classes generally outperformed lower-risk investments. Developed market equities generated the strongest returns for the 6- and 12-month periods ended September 30, 2013. Emerging markets, in contrast, struggled with slowing growth and weakening currencies. Rising interest rates resulted in poor performance for most fixed income assets, especially US Treasury bonds and other higher quality sectors such as tax-exempt municipals and investment grade corporate bonds. High yield bonds, on the other hand, generated positive returns as investors looked to the asset class for income in the low-rate environment. Short-term interest rates remained near zero, keeping yields on money market securities near historical lows.
At BlackRock, we believe investors need to think globally and extend their scope across a broader array of asset classes and be prepared to move freely as market conditions change over time. We encourage you to talk with your financial advisor and visit www.blackrock.com for further insight about investing in today’s world.
Sincerely,

Rob Kapito
President, BlackRock Advisors, LLC

“Though we’ve seen periods of heightened uncertainty and market volatility over the past year, riskier asset classes generally outperformed lower-risk investments.”
Rob Kapito
President, BlackRock Advisors, LLC
| | | | | | | | |
| Total Returns as of September 30, 2013 | |
| | | 6-month | | | 12-month | |
US large cap equities
(S&P 500® Index) | | | 8.31 | % | | | 19.34 | % |
US small cap equities
(Russell 2000® Index) | | | 13.61 | | | | 30.06 | |
International equities
(MSCI Europe, Australasia, Far East Index) | | | 10.47 | | | | 23.77 | |
Emerging market equities
(MSCI Emerging Markets Index) | | | (2.78 | ) | | | 0.98 | |
3-month Treasury bill
(BofA Merrill Lynch
3-Month US Treasury
Bill Index) | | | 0.04 | | | | 0.10 | |
US Treasury securities
(BofA Merrill Lynch
10-Year US Treasury
Index) | | | (5.19 | ) | | | (5.71 | ) |
US investment grade
bonds (Barclays US
Aggregate Bond Index) | | | (1.77 | ) | | | (1.68 | ) |
Tax-exempt municipal
bonds (S&P Municipal Bond Index) | | | (3.47 | ) | | | (2.25 | ) |
US high yield bonds
(Barclays US Corporate
High Yield 2% Issuer
Capped Index) | | | 0.81 | | | | 7.14 | |
|
| Past performance is no guarantee of future results. Index performance is shown for illustrative purposes only. You cannot invest directly in an index. | |
| | | | | | |
| | | THIS PAGE NOT PART OF YOUR FUND REPORT | | | | 3 |
| | |
| Fund Summary as of September 30, 2013 | | |
BlackRock Balanced Capital Fund, Inc.’s (the “Fund”) investment objective is to seek the highest total investment return through a fully managed investment policy utilizing equity, debt (including money market) and convertible securities.
|
| Portfolio Management Commentary |
How did the Fund perform?
| Ÿ | | For the 12-month period ended September 30, 2013, through its investments in Master Large Cap Core Portfolio of Master Large Cap Series LLC (the “equity allocation” or the “Master Large Cap Core Portfolio”) and Master Total Return Portfolio of Master Bond LLC (the “fixed income allocation” or the “Master Total Return Portfolio”) (collectively, the “Master Portfolios”), the Fund’s Institutional, Investor A and Class R Shares outperformed the blended reference benchmark (60% Russell 1000® Index/40% Barclays US Aggregate Bond Index), while the Fund’s Investor B and Investor C Shares underperformed the blended reference benchmark. For the same period, all of the Fund’s share classes outperformed the fixed income benchmark, the Barclays US Aggregate Bond Index, and underperformed the equity benchmark, the Russell 1000® Index. |
What factors influenced performance?
| Ÿ | | From an asset allocation perspective, the Fund benefited from its overweight in equities relative to the blended reference benchmark as equities outperformed fixed income over the 12-month period. The Master Large Cap Core Portfolio generated strong positive returns, but underperformed the Russell 1000® Index, while the Master Total Return Portfolio outperformed the Barclays US Aggregate Bond Index. |
| Ÿ | | Relative to the Russell 1000® Index, the Master Large Cap Core Portfolio benefited from maintaining a broad underweight to high-yielding, high-payout stocks, which outperformed in the first four months of 2013, but subsequently lagged. An analysis of these defensive groups, such as consumer staples, utilities, real estate investment trusts (“REITs”) and telecom stocks, indicated their relative valuations were higher than nearly any point in the last 30 years, thus the Master Large Cap Core Portfolio maintained underweights or entirely avoided these industries. Additional positive performance in the Fund’s equity allocation came from stock selection within financials, where an overweight in US money center banks and the avoidance of REITs proved advantageous. In the industrials sector, an overweight to airline stocks enhanced results. The Master Large Cap Core Portfolio underperformed the Russell 1000® Index due to stock selection within health care, where a lack of exposure to biotechnology - the top-performing industry in the sector - hindered results, while positioning within pharmaceuticals was another source of weakness. Additionally, within the information technology (“IT”) sector, holdings in the computers & peripherals and IT services industries hurt returns. |
| Ÿ | | The Master Total Return Portfolio outperformed the Barclays US Aggregate Bond Index due largely to its positioning in spread sectors. Specifically, security selection and sector allocations in corporate credit, particularly within industrials, floating rate bank loans and high yield debt |
| | | contributed positively to performance. Among securitized assets, a non-benchmark allocation to non-agency residential mortgage-backed securities (“MBS”) had a positive impact on results, as did positioning within commercial mortgage-backed securities (“CMBS”) and asset-backed securities (“ABS”). Also driving performance was the Master Total Return Portfolio’s exposure to non-US dollar-denominated securities as well as currency exposures via foreign exchange contracts, particularly in the euro, Japanese yen and Australian dollar. Yield curve and duration positioning (management of interest rate risk) helped performance as well. Detracting from performance in the fixed income allocation was positioning within agency MBS, specifically an underweight in 30-year pass-through securities. A small exposure to equity indices, primarily for the purpose of hedging risk, also had a negative impact on results. |
Describe recent portfolio activity.
| Ÿ | | From a broad asset allocation perspective, the Fund’s equity allocation drifted higher due to strong market value appreciation during the 12-month period. Within equities, the Master Large Cap Core Portfolio significantly increased exposure to the financials, industrials and IT sectors, while notably reducing its weightings in consumer staples and utilities. In fixed income, the Master Total Return Portfolio significantly added to positions in CMBS and ABS and increased its allocations to US Treasury inflation-protected securities and agency MBS, particularly lower-coupon 30-year mortgage pass-through securities. The Master Total Return Portfolio reduced its allocation to investment grade corporate credit, particularly in the context of relatively unattractive valuations, embedded duration risk as well as potential leveraged buy-out event risks. Exposure to non-US dollar-denominated securities was also reduced, while the weighting in non-agency residential MBS remained relatively unchanged. |
Describe portfolio positioning at period end.
| Ÿ | | At period end, the Fund continued to be slightly overweight in equities and underweight in fixed income relative to the blended reference benchmark. In equities, the Master Large Cap Core Portfolio held its largest sector overweights relative to the Russell 1000® Index in financials and health care, while consumer staples and utilities were the most significant underweights. Relative to the Barclays US Aggregate Bond Index, the Master Total Return Portfolio remained generally underweight in government-related sectors in favor of non-government spread sectors. Within spread sectors, the most significant overweights were CMBS and ABS, while the Master Total Return Portfolio maintained an underweight in investment grade corporate credit. Within the government space, the Master Total Return Portfolio was underweight in US Treasuries and agency debentures and held an overweight in agency MBS. |
The views expressed reflect the opinions of BlackRock as of the date of this report and are subject to change based on changes in market, economic or other conditions. These views are not intended to be a forecast of future events and are no guarantee of future results.
| | | | | | |
| 4 | | BLACKROCK BALANCED CAPITAL FUND, INC. | | SEPTEMBER 30, 2013 | | |
|
| Total Return Based on a $10,000 Investment |
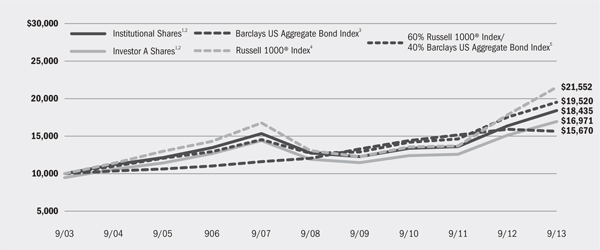
| | 1 | Assuming maximum sales charges, if any, transaction costs and other operating expenses, including investment advisory and administration fees. Institutional Shares do not have a sales charge. |
| | 2 | The Fund invests in equity securities (including common stock, preferred stock, securities convertible into common stock, or securities or other instruments whose price is linked to the value of common stock) and fixed-income securities (including debt securities, convertible securities and short term securities). |
| | 3 | This unmanaged market-weighted index is comprised of investment grade corporate bonds (rated BBB or better), mortgages and US Treasury and government agency issues with at least one year to maturity. |
| | 4 | This unmanaged broad-based index measures the performance of the 1,000 largest companies in the Russell 3000® Index, which represents approximately 90% of the total market capitalization of the Russell 3000® Index. |
| | 5 | The Fund compares its performance to that of a customized weighted index comprised of the returns of the Russell 1000® Index (60%) and Barclays U.S. Aggregate Bond Index (40%). |
| | | | | | | | | | | | | | | | | | | | | | | | | | | | | | | | | | | | |
| Performance Summary for the Period Ended September 30, 2013 | |
| | | | | | | | | | | | Average Annual Total Returns6 | |
| | | | | | | | | | | | 1 Year | | | 5 Years | | | 10 Years | |
| | | Standardized 30-Day Yields | | | Unsubsidized 30-Day Yields | | | 6-Month Total Returns | | | w/o sales charge | | | w/ sales charge | | | w/o sales charge | | | w/ sales charge | | | w/o sales charge | | | w/ sales charge | |
Institutional | | | 1.69 | % | | | 1.38 | % | | | 4.82 | % | | | 12.42 | % | | | N/A | | | | 7.64 | % | | | N/A | | | | 6.31 | % | | | N/A | |
Investor A | | | 1.35 | | | | 1.05 | | | | 4.71 | | | | 12.14 | | | | 6.25 | % | | | 7.32 | | | | 6.17 | % | | | 6.00 | | | | 5.43 | % |
Investor B | | | 0.61 | | | | 0.30 | | | | 4.13 | | | | 10.94 | | | | 6.44 | | | | 6.28 | | | | 5.96 | | | | 5.27 | | | | 5.27 | |
Investor C | | | 0.66 | | | | 0.35 | | | | 4.28 | | | | 11.22 | | | | 10.22 | | | | 6.47 | | | | 6.47 | | | | 5.17 | | | | 5.17 | |
Class R | | | 1.22 | | | | 0.91 | | | | 4.50 | | | | 11.66 | | | | N/A | | | | 6.87 | | | | N/A | | | | 5.63 | | | | N/A | |
60% Russell 1000® Index/40% Barclays US Aggregate Bond Index | | | — | | | | — | | | | 4.53 | | | | 11.45 | | | | N/A | | | | 8.91 | | | | N/A | | | | 6.92 | | | | N/A | |
Barclays US Aggregate Bond Index | | | — | | | | — | | | | (1.77 | ) | | | (1.68 | ) | | | N/A | | | | 5.41 | | | | N/A | | | | 4.59 | | | | N/A | |
Russell 1000® Index | | | — | | | | — | | | | 8.83 | | | | 20.91 | | | | N/A | | | | 10.53 | | | | N/A | | | | 7.98 | | | | N/A | |
| | 6 | Assuming maximum sales charges, if any. Average annual total returns with and without sales charges reflect reductions for distribution and service fees. See “About Fund Performance” on page 6 for a detailed description of share classes, including any related sales charges and fees. |
| | | N/A—Not applicable as share class and index do not have a sales charge. |
| | | Past performance is not indicative of future results. |
| | | | | | | | | | | | | | |
| Expense Example | | | | | | | | | | | | | | |
| | | Actual | | Hypothetical8 | | |
| | | Beginning
Account Value
April 1, 2013 | | Ending
Account Value
September 30, 2013 | | Expenses Paid During the Period7 | | Beginning
Account Value
April 1, 2013 | | Ending
Account Value
September 30, 2013 | | Expenses Paid During the Period7 | | Annualized Expense Ratio |
Institutional | | $1,000.00 | | $1,048.20 | | $3.42 | | $1,000.00 | | $1,021.59 | | $3.38 | | 0.67% |
Investor A | | $1,000.00 | | $1,047.10 | | $4.90 | | $1,000.00 | | $1,020.14 | | $4.84 | | 0.96% |
Investor B | | $1,000.00 | | $1,041.30 | | $10.08 | | $1,000.00 | | $1,015.06 | | $9.95 | | 1.98% |
Investor C | | $1,000.00 | | $1,042.80 | | $8.86 | | $1,000.00 | | $1,016.26 | | $8.75 | | 1.74% |
Class R | | $1,000.00 | | $1,045.00 | | $6.53 | | $1,000.00 | | $1,018.55 | | $6.44 | | 1.28% |
| | 7 | For each class of the Fund, expenses are equal to the annualized expense ratio for the class, multiplied by the average account value over the period, multiplied by 183/365 (to reflect the one-half year period shown). Because the Fund invests significantly in the Master Portfolios, the expense table example reflects the net expenses of both the Fund and the Master Portfolios in which it invests. |
| | 8 | Hypothetical 5% annual return before expenses is calculated by pro rating the number of days in the most recent fiscal half year divided by 365. |
| | | See “Disclosure of Expenses” on page 6 for further information on how expenses were calculated. |
| | | | | | |
| | | BLACKROCK BALANCED CAPITAL FUND, INC. | | SEPTEMBER 30, 2013 | | 5 |
| Ÿ | | Institutional Shares are not subject to any sales charge. These shares bear no ongoing distribution or service fees and are available only to eligible investors. |
| Ÿ | | Investor A Shares incur a maximum initial sales charge (front-end load) of 5.25% and a service fee of 0.25% per year (but no distribution fee). Certain redemptions of these shares may be subject to a contingent deferred sales charge (“CDSC”) where no initial sales charge was paid at the time of purchase. |
| Ÿ | | Investor B Shares are subject to a maximum CDSC of 4.50% declining to 0% after six years. In addition, Investor B Shares are subject to a distribution fee of 0.75% per year and a service fee of 0.25% per year. Investor B Shares automatically convert to Investor A Shares after approximately eight years. (There is no initial sales charge for automatic share conversions.) All returns for periods greater than eight years reflect this conversion. Investor B Shares of the Fund are only available through exchanges and dividend reinvestments by existing shareholders and for purchase by certain employer-sponsored retirement plans. |
| Ÿ | | Investor C Shares are subject to a distribution fee of 0.75% per year and a service fee of 0.25% per year. In addition, these shares are subject to a 1.00% CDSC if redeemed within one year of purchase. |
| Ÿ | | Class R Shares do not incur a maximum initial sales charge (front-end load) or CDSC. These shares are subject to a distribution fee of 0.25% per year and a service fee of 0.25% per year. These shares are available only to certain employer-sponsored retirement plans. |
Performance information reflects past performance and does not guarantee future results. The performance information for periods prior to
October 1, 2003 does not reflect any investment by the Fund in the Master Total Return Portfolio, and the performance information for periods prior to February 2009 does not reflect any investment by the Fund in the Master Large Cap Core Portfolio. Current performance may be lower or higher than the performance data quoted. Refer to www.blackrock.com/funds to obtain performance data current to the most recent month end. Performance results do not reflect the deduction of taxes that a shareholder would pay on Fund distributions or the redemption of Fund shares. Figures shown in the performance table on the previous page assume reinvestment of all dividends and distributions, if any, at net asset value (“NAV”) on the ex-dividend dates. Investment return and principal value of shares will fluctuate so that shares, when redeemed, may be worth more or less than their original cost.
BlackRock Advisors, LLC (the “Manager”), the Fund’s investment advisor, waived and/or reimbursed a portion of the Fund’s expenses. Without such waiver and/or reimbursement, a Fund’s performance would have been lower. The Manager is under no obligation to waive or reimburse or to continue waiving or reimbursing its fees after the applicable termination date. See Note 3 of the Notes to Financial Statements for additional information on waivers and reimbursements. Dividends paid to each class of shares will vary because of the different levels of service, distribution and transfer agency fees applicable to each class, which are deducted from the income available to be paid to shareholders. The standardized 30-day yield includes the effects of any waivers and/or reimbursements. The unsubsidized 30-day yield excludes the effects of any waiver and/or reimbursements.
Shareholders of the Fund may incur the following charges: (a) transactional expenses, such as sales charges; and (b) operating expenses, including investment advisory fees, administration fees, service and distribution fees, including 12b-1 fees, acquired fund fees and expenses and other Fund expenses. The expense example on the previous page (which is based on a hypothetical investment of $1,000 invested on April 1, 2013 and held through September 30, 2013) is intended to assist shareholders both in calculating expenses based on an investment in the Fund and in comparing these expenses with similar costs of investing in other mutual funds.
The expense example provides information about actual account values and actual expenses. In order to estimate the expenses a shareholder paid during the period covered by this report, shareholders can divide their account value by $1,000 and then multiply the result by the number corresponding to their share class under the heading entitled “Expenses Paid During the Period.”
The expense example also provides information about hypothetical account values and hypothetical expenses based on the Fund’s actual expense ratio and an assumed rate of return of 5% per year before expenses. In order to assist shareholders in comparing the ongoing expenses of investing in the Fund and other funds, compare the 5% hypothetical examples with the 5% hypothetical examples that appear in other funds’ shareholder reports.
The expenses shown in the expense example are intended to highlight shareholders’ ongoing costs only and do not reflect any transactional expenses, such as sales charges, if any. Therefore, the hypothetical example is useful in comparing ongoing expenses only, and will not help shareholders determine the relative total expenses of owning different funds. If these transactional expenses were included, shareholder expenses would have been higher.
| | | | | | |
| 6 | | BLACKROCK BALANCED CAPITAL FUND, INC. | | SEPTEMBER 30, 2013 | | |
| | |
| The Benefits and Risks of Leveraging | | |
The Master Total Return Portfolio may utilize leverage to seek to enhance its yield and NAV. However, these objectives cannot be achieved in all interest rate environments.
The Master Total Return Portfolio may utilize leverage by entering into reverse repurchase agreements and/or treasury roll transactions. In general, the concept of leveraging is based on the premise that the financing cost of assets to be obtained from leverage, which will be based on short-term interest rates, will normally be lower than the income earned by the Master Total Return Portfolio on its longer-term portfolio investments. To the extent that the total assets of the Master Total Return Portfolio (including the assets obtained from leverage) are invested in higher-yielding portfolio investments, the Master Total Return Portfolio’s shareholders will benefit from the incremental net income.
The interest earned on securities purchased with the proceeds from leverage is paid to shareholders in the form of dividends, and the value of these portfolio holdings is reflected in the per share NAV. However, in order to benefit shareholders, the yield curve must be positively sloped; that is, short-term interest rates must be lower than long-term interest rates. If the yield curve becomes negatively sloped, meaning short-term interest rates exceed long-term interest rates, income to shareholders will be lower than if the Master Total Return Portfolio had not used leverage.
If short-term interest rates rise, narrowing the differential between short-term and long-term interest rates, the incremental net income pickup will be reduced or eliminated completely. Furthermore, if prevailing short-term interest rates rise above long-term interest rates, the yield curve has a negative slope. In this case, the Master Total Return Portfolio pays higher short-term interest rates whereas the Master Total Return Portfolio’s total portfolio earns income based on lower long-term interest rates.
Furthermore, the value of the Master Total Return Portfolio’s portfolio investments generally varies inversely with the direction of long-term interest rates, although other factors can influence the value of portfolio investments. As a result, changes in interest rates can influence the Master Total Return Portfolio’s NAV positively or negatively in addition to the impact on the Master Total Return Portfolio’s performance from leverage and borrowings discussed above.
The use of leverage may enhance opportunities for increased income to the Master Total Return Portfolio, but as described above, it also creates risks as short- or long-term interest rates fluctuate. Leverage also will generally cause greater changes in the Master Total Return Portfolio’s NAVs and dividend rates than comparable portfolios without leverage. If the income derived from securities purchased with assets received from leverage exceeds the cost of leverage, the Master Total Return Portfolio’s net income will be greater than if leverage had not been used. Conversely, if the income from the securities purchased is not sufficient to cover the cost of leverage, the Master Total Return Portfolio’s net income will be less than if leverage had not been used, and therefore the amount available for distribution to shareholders will be reduced. The Master Total Return Portfolio may be required to sell portfolio securities at inopportune times or at distressed values in order to comply with regulatory requirements applicable to the use of leverage or as required by the terms of leverage instruments, which may cause the Master Total Return Portfolio to incur losses. The use of leverage may limit the Master Total Return Portfolio’s ability to invest in certain types of securities or use certain types of hedging strategies. The Master Total Return Portfolio will incur expenses in connection with the use of leverage, all of which are borne by the Master Total Return Portfolio shareholders and may reduce income.
| | |
| Derivative Financial Instruments | | |
The Master Portfolios may invest in various derivative financial instruments, including financial futures contracts, foreign currency exchange contracts, options and swaps, as specified in Note 4 of each of the Master Portfolio’s Notes to Consolidated Financial Statements, which may constitute forms of economic leverage. Such derivative financial instruments are used to obtain exposure to a security, index and/or market without owning or taking physical custody of securities or to hedge market, equity, credit, interest rate, foreign currency exchange rate and/or other risks. Derivative financial instruments involve risks, including the imperfect correlation between the value of a derivative financial instrument and the underlying asset, possible default of the counterparty to the transaction or illiquidity of the derivative financial instrument. The
Master Portfolios’ ability to use a derivative financial instrument successfully depends on the investment advisor’s ability to predict pertinent market movements accurately, which cannot be assured. The use of derivative financial instruments may result in losses greater than if they had not been used, may require the Master Portfolios to sell or purchase portfolio investments at inopportune times or for distressed values, may limit the amount of appreciation the Master Portfolios can realize on an investment, may result in lower dividends paid to shareholders or may cause the Master Portfolios to hold an investment that they might otherwise sell. The Master Portfolios’ investments in these instruments are discussed in detail in each of the Master Portfolio’s Notes to Consolidated Financial Statements.
| | | | | | |
| | | BLACKROCK BALANCED CAPITAL FUND, INC. | | SEPTEMBER 30, 2013 | | 7 |
| | | | |
| Statement of Assets and Liabilities | | | BlackRock Balanced Capital Fund, Inc. | |
| | | | |
| September 30, 2013 | | | |
| | | | |
| Assets | | | | |
Investments at value — Master Large Cap Core Portfolio (cost — $429,511,328) | | $ | 540,220,041 | |
Investments at value — Master Total Return Portfolio (cost — $281,110,113) | | | 284,578,832 | |
Investments in BlackRock Liquidity Funds, TempFund, Institutional Class, 0.03% (shares — 16,206,029; cost — $16,206,029) | | | 16,206,029 | |
Capital shares sold receivable | | | 470,413 | |
Dividends receivable — affiliated | | | 515 | |
Prepaid expenses | | | 49,414 | |
| | | | |
Total assets | | | 841,525,244 | |
| | | | |
| | | | |
| Liabilities | | | | |
Capital shares redeemed payable | | | 646,375 | |
Service and distribution fees payable | | | 151,553 | |
Investment advisory fees payable | | | 77,028 | |
Other affiliates payable | | | 34,796 | |
Officer’s fees payable | | | 7,025 | |
Other accrued expenses payable | | | 320,347 | |
| | | | |
Total liabilities | | | 1,237,124 | |
| | | | |
Net Assets | | $ | 840,288,120 | |
| | | | |
| | | | |
| Net Assets Consist of | | | | |
Paid-in capital | | $ | 642,328,108 | |
Undistributed net investment income | | | 3,541,325 | |
Accumulated net realized gain | | | 80,241,256 | |
Net unrealized appreciation/depreciation | | | 114,177,431 | |
| | | | |
Net Assets | | $ | 840,288,120 | |
| | | | |
| | | | |
| Net Asset Value | | | | |
Institutional — Based on net assets of $317,571,950 and 12,619,851 shares outstanding, 400 million shares authorized, $0.10 par value | | $ | 25.16 | |
| | | | |
Investor A — Based on net assets of $445,295,356 and 17,736,583 shares outstanding, 200 million shares authorized, $0.10 par value | | $ | 25.11 | |
| | | | |
Investor B — Based on net assets of $4,925,976 and 201,319 shares outstanding, 500 million shares authorized, $0.10 par value | | $ | 24.47 | |
| | | | |
Investor C — Based on net assets of $63,952,408 and 2,757,095 shares outstanding, 200 million shares authorized, $0.10 par value | | $ | 23.20 | |
| | | | |
Class R — Based on net assets of $8,542,430 and 356,475 shares outstanding, 500 million shares authorized, $0.10 par value | | $ | 23.96 | |
| | | | |
See Notes to Financial Statements.
| | | | | | |
| 8 | | BLACKROCK BALANCED CAPITAL FUND, INC. | | SEPTEMBER 30, 2013 | | |
| | | | |
| Statement of Operations | | | BlackRock Balanced Capital Fund, Inc. | |
| | | | |
| Year Ended September 30, 2013 | | | |
| | | | |
| Investment Income | | | | |
Dividends — affiliated | | $ | 2,141 | |
Net investment income allocated from the Master Portfolios: | | | | |
Interest — unaffiliated | | | 13,009,202 | |
Interest — affiliated | | | 4 | |
Dividends — unaffiliated | | | 9,586,822 | |
Foreign taxes withheld | | | (31,661 | ) |
Securities lending — affiliated | | | 5,772 | |
Dividends — affiliated | | | 71,826 | |
Total expenses | | | (3,739,564 | ) |
Fees waived | | | 6,449 | |
| | | | |
Total income | | | 18,910,991 | |
| | | | |
| | | | |
| Fund Expenses | | | | |
Investment advisory | | | 3,824,235 | |
Service — Investor A | | | 1,107,548 | |
Service and distribution — Investor B | | | 59,628 | |
Service and distribution — Investor C | | | 623,065 | |
Service and distribution — Class R | | | 42,188 | |
Transfer agent — Institutional | | | 326,353 | |
Transfer agent — Investor A | | | 605,485 | |
Transfer agent — Investor B | | | 26,047 | |
Transfer agent — Investor C | | | 104,133 | |
Transfer agent — Class R | | | 21,064 | |
Printing | | | 100,837 | |
Professional | | | 97,209 | |
Registration | | | 78,293 | |
Officer | | | 38,017 | |
Custodian | | | 2,455 | |
Miscellaneous | | | 34,549 | |
| | | | |
Total expenses | | | 7,091,106 | |
Less fees waived by Manager | | | (2,826,242 | ) |
| | | | |
Total expenses after fees waived | | | 4,264,864 | |
| | | | |
Net investment income | | | 14,646,127 | |
| | | | |
| | | | |
| Realized and Unrealized Gain Allocated from the Master Portfolios | | | | |
Net realized gain from investments, financial futures contracts, options written, swaps, foreign currency transactions and borrowed bonds | | | 72,425,988 | |
Net change in unrealized appreciation/depreciation on investments, financial futures contracts, options written, swaps, foreign currency translations and borrowed bonds | | | 13,989,532 | |
| | | | |
Total realized and unrealized gain | | | 86,415,520 | |
| | | | |
Net Increase in Net Assets Resulting from Operations | | $ | 101,061,647 | |
| | | | |
See Notes to Financial Statements.
| | | | | | |
| | | BLACKROCK BALANCED CAPITAL FUND, INC. | | SEPTEMBER 30, 2013 | | 9 |
| | | | |
| Statements of Changes in Net Assets | | | BlackRock Balanced Capital Fund, Inc. | |
| | | | | | | | |
| | | Year Ended September 30, | |
| Increase in Net Assets: | | 2013 | | | 2012 | |
| | | | | | | | |
| Operations | | | | | | | | |
Net investment income | | $ | 14,646,127 | | | $ | 22,260,482 | |
Net realized gain | | | 72,425,988 | | | | 36,492,085 | |
Net change in unrealized appreciation/depreciation | | | 13,989,532 | | | | 133,899,018 | |
| | | | |
Net increase in net assets resulting from operations | | | 101,061,647 | | | | 192,651,585 | |
| | | | |
| | | | | | | | |
| Dividends and Distributions to Shareholders From1 | | | | | | | | |
Net investment income: | | | | | | | | |
Institutional | | | (8,049,416 | ) | | | (10,752,228 | ) |
Investor A | | | (7,536,107 | ) | | | (8,660,377 | ) |
Investor B | | | (33,652 | ) | | | (66,562 | ) |
Investor C | | | (470,066 | ) | | | (825,009 | ) |
Class R | | | (110,809 | ) | | | (145,892 | ) |
Net realized gain: | | | | | | | | |
Institutional | | | (15,801,809 | ) | | | — | |
Investor A | | | (16,530,590 | ) | | | — | |
Investor B | | | (255,878 | ) | | | — | |
Investor C | | | (2,479,925 | ) | | | — | |
Class R | | | (352,601 | ) | | | — | |
| | | | |
Decrease in net assets resulting from dividends and distributions to shareholders | | | (51,620,853 | ) | | | (20,450,068 | ) |
| | | | |
| | | | | | | | |
| Capital Share Transactions | | | | | | | | |
Net decrease in net assets derived from capital share transactions | | | (160,432,633 | ) | | | (232,710,814 | ) |
| | | | |
| | | | | | | | |
| Net Assets | | | | | | | | |
Total decrease in net assets | | | (110,991,839 | ) | | | (60,509,297 | ) |
Beginning of year | | | 951,279,959 | | | | 1,011,789,256 | |
| | | | |
End of year | | $ | 840,288,120 | | | $ | 951,279,959 | |
| | | | |
Undistributed net investment income, end of year | | $ | 3,541,325 | | | $ | 4,093,021 | |
| | | | |
| | 1 | Distributions are determined in accordance with federal income tax regulations. |
See Notes to Financial Statements.
| | | | | | |
| 10 | | BLACKROCK BALANCED CAPITAL FUND, INC. | | SEPTEMBER 30, 2013 | | |
| | | | |
| Financial Highlights | | | BlackRock Balanced Capital Fund, Inc. | |
| | | | | | | | | | | | | | | | | | | | | | | | | | | | | | | | | | | | | | | | |
| | | Institutional | | | Investor A | |
| | | Year Ended September 30, | | | Year Ended September 30, | |
| | | 2013 | | | 2012 | | | 2011 | | | 2010 | | | 2009 | | | 2013 | | | 2012 | | | 2011 | | | 2010 | | | 2009 | |
| Per Share Operating Performance | | | | | | | | | | | | | | | | | | | | | |
Net asset value, beginning of year | | $ | 23.77 | | | $ | 20.18 | | | $ | 20.28 | | | $ | 19.17 | | | $ | 21.96 | | | $ | 23.68 | | | $ | 20.10 | | | $ | 20.21 | | | $ | 19.11 | | | $ | 21.88 | |
| | | | | | | | |
Net investment income1 | | | 0.47 | | | | 0.55 | | | | 0.51 | | | | 0.46 | | | | 0.54 | | | | 0.38 | | | | 0.47 | | | | 0.40 | | | | 0.39 | | | | 0.48 | |
Net realized and unrealized gain (loss) | | | 2.35 | | | | 3.55 | | | | (0.13 | ) | | | 1.20 | | | | (1.60 | ) | | | 2.37 | | | | 3.55 | | | | (0.10 | ) | | | 1.19 | | | | (1.58 | ) |
| | | | | | | | |
Net increase (decrease) from investment operations | | | 2.82 | | | | 4.10 | | | | 0.38 | | | | 1.66 | | | | (1.06 | ) | | | 2.75 | | | | 4.02 | | | | 0.30 | | | | 1.58 | | | | (1.10 | ) |
| | | | | | | | |
Dividends and distributions from:2 | | | | | | | | | | | | | | | | | | | | | | | | | | | | | | | | | | | | | | | | |
Net investment income | | | (0.53 | ) | | | (0.51 | ) | | | (0.48 | ) | | | (0.55 | ) | | | (0.62 | ) | | | (0.42 | ) | | | (0.44 | ) | | | (0.41 | ) | | | (0.48 | ) | | | (0.56 | ) |
Net realized gain | | | (0.90 | ) | | | — | | | | — | | | | — | | | | (1.11 | ) | | | (0.90 | ) | | | — | | | | — | | | | — | | | | (1.11 | ) |
| | | | | | | | |
Total dividends and distributions | | | (1.43 | ) | | | (0.51 | ) | | | (0.48 | ) | | | (0.55 | ) | | | (1.73 | ) | | | (1.32 | ) | | | (0.44 | ) | | | (0.41 | ) | | | (0.48 | ) | | | (1.67 | ) |
| | | | | | | | |
Net asset value, end of year | | $ | 25.16 | | | $ | 23.77 | | | $ | 20.18 | | | $ | 20.28 | | | $ | 19.17 | | | $ | 25.11 | | | $ | 23.68 | | | $ | 20.10 | | | $ | 20.21 | | | $ | 19.11 | |
| | | | | | | | |
| | | | | | | | | | | | | | | | | | | | | | | | | | | | | | | | | | | | | | | | |
| Total Investment Return3 | | | | | | | | | | | | | | | | | | | | | |
Based on net asset value | | | 12.42 | % | | | 20.52 | % | | | 1.67 | % | | | 8.75 | %4 | | | (3.53 | )%5 | | | 12.14 | % | | | 20.16 | % | | | 1.31 | % | | | 8.38 | %6 | | | (3.79 | )%7 |
| | | | | | | | |
| | | | | | | | | | | | | | | | | | | | | | | | | | | | | | | | | | | | | | | | |
| Ratios to Average Net Assets8 | | | | | | | | | | | | | | | | | | | | | |
Total expenses | | | 0.98 | % | | | 0.96 | % | | | 1.07 | % | | | 1.08 | % | | | 0.85 | % | | | 1.29 | % | | | 1.28 | % | | | 1.39 | % | | | 1.40 | % | | | 1.17 | % |
| | | | | | | | |
Total expenses after fees waived | | | 0.66 | % | | | 0.66 | % | | | 0.76 | % | | | 0.76 | % | | | 0.64 | % | | | 0.97 | % | | | 0.97 | % | | | 1.07 | % | | | 1.08 | % | | | 0.95 | % |
| | | | | | | | |
Net investment income | | | 1.87 | % | | | 2.45 | % | | | 2.33 | % | | | 2.28 | % | | | 3.12 | % | | | 1.51 | % | | | 2.12 | % | | | 1.83 | % | | | 1.96 | % | | | 2.80 | % |
| | | | | | | | |
| | | | | | | | | | | | | | | | | | | | | | | | | | | | | | | | | | | | | | | | |
| Supplemental Data | | | | | | | | | | | | | | | | | | | | | |
Net assets, end of year (000) | | $ | 317,572 | | | $ | 426,027 | | | $ | 511,458 | | | $ | 547,721 | | | $ | 626,711 | | | $ | 445,295 | | | $ | 447,620 | | | $ | 426,819 | | | $ | 488,087 | | | $ | 529,120 | |
| | | | | | | | |
Portfolio turnover of the Fund9 | | | — | | | | — | | | | — | | | | — | | | | 94 | %10 | | | — | | | | — | | | | — | | | | — | | | | 94 | %10 |
| | | | | | | | |
Portfolio turnover of the Master Total Return Portfolio | | | 777 | %11 | | | 1,346 | %12 | | | 1,771 | %13 | | | 1,754 | %14 | | | 708 | %15 | | | 777 | %11 | | | 1,346 | %12 | | | 1,771 | %13 | | | 1,754 | %14 | | | 708 | %15 |
| | | | | | | | |
Portfolio turnover of the Master Large Cap Core Portfolio | | | 50 | % | | | 128 | % | | | 129 | % | | | 173 | % | | | 168 | %16 | | | 50 | % | | | 128 | % | | | 129 | % | | | 173 | % | | | 168 | %16 |
| | | | | | | | |
| | 1 | Based on average shares outstanding. |
| | 2 | Dividends and distributions are determined in accordance with federal income tax regulations. |
| | 3 | Where applicable, total investment returns exclude the effects of any sales charges and assume the reinvestment of dividends and distributions. |
| | 4 | Includes proceeds received from a settlement of litigation, through its investment in Master Large Cap Core Portfolio, which impacted the Fund’s total return. Excluding these proceeds, the Fund’s total return would have been 8.32%. |
| | 5 | Includes proceeds received from a settlement of litigation, through its investment in Master Large Cap Core Portfolio, which impacted the Fund’s total return. Excluding these proceeds, the Fund’s total return would have been (3.88)%. |
| | 6 | Includes proceeds received from a settlement of litigation, through its investment in Master Large Cap Core Portfolio, which impacted the Fund’s total return. Excluding these proceeds, the Fund’s total return would have been 7.95%. |
| | 7 | Includes proceeds received from a settlement of litigation, through its investment in Master Large Cap Core Portfolio, which impacted the Fund’s total return. Excluding these proceeds, the Fund’s total return would have been (4.19)%. |
| | 8 | Includes the Fund’s share of the Master Portfolios’ allocated expenses and/or net investment income. |
| | 9 | Excludes transactions in the Master Portfolios. |
| | 10 | Represents portfolio turnover for the period October 1, 2008 to January 30, 2009. |
| | 11 | Includes mortgage dollar roll transactions; excluding these transactions the portfolio turnover would have been 450%. |
| | 12 | Includes mortgage dollar roll transactions; excluding these transactions the portfolio turnover would have been 752%. |
| | 13 | Includes mortgage dollar roll transactions; excluding these transactions the portfolio turnover would have been 1,379%. |
| | 14 | Includes mortgage dollar roll transactions; excluding these transactions the portfolio turnover would have been 1,248%. |
| | 15 | Includes mortgage dollar roll transactions; excluding these transactions the portfolio turnover would have been 469%. |
| | 16 | Represents portfolio turnover for the period November 1, 2008 to September 30, 2009. |
See Notes to Financial Statements.
| | | | | | |
| | | BLACKROCK BALANCED CAPITAL FUND, INC. | | SEPTEMBER 30, 2013 | | 11 |
| | | | |
| Financial Highlights (continued) | | | BlackRock Balanced Capital Fund, Inc. | |
| | | | | | | | | | | | | | | | | | | | | | | | | | | | | | | | | | | | | | | | |
| | | Investor B | | | Investor C | |
| | | Year Ended September 30, | | | Year Ended September 30, | |
| | | 2013 | | | 2012 | | | 2011 | | | 2010 | | | 2009 | | | 2013 | | | 2012 | | | 2011 | | | 2010 | | | 2009 | |
| Per Share Operating Performance | | | | | | | | | | | | | | | | | | | | | |
Net asset value, beginning of year | | $ | 23.07 | | | $ | 19.55 | | | $ | 19.65 | | | $ | 18.56 | | | $ | 21.24 | | | $ | 21.92 | | | $ | 18.64 | | | $ | 18.77 | | | $ | 17.79 | | | $ | 20.51 | |
| | | | | | | | |
Net investment income1 | | | 0.13 | | | | 0.24 | | | | 0.18 | | | | 0.20 | | | | 0.32 | | | | 0.18 | | | | 0.28 | | | | 0.21 | | | | 0.21 | | | | 0.32 | |
Net realized and unrealized gain (loss) | | | 2.29 | | | | 3.46 | | | | (0.10 | ) | | | 1.16 | | | | (1.55 | ) | | | 2.17 | | | | 3.28 | | | | (0.08 | ) | | | 1.12 | | | | (1.50 | ) |
| | | | | | | | |
Net increase (decrease) from investment operations | | | 2.42 | | | | 3.70 | | | | 0.08 | | | | 1.36 | | | | (1.23 | ) | | | 2.35 | | | | 3.56 | | | | 0.13 | | | | 1.33 | | | | (1.18 | ) |
| | | | | | | | |
Dividends and distributions from:2 | | | | | | | | | | | | | | | | | | | | | | | | | | | | | | | | | | | | | | | | |
Net investment income | | | (0.12 | ) | | | (0.18 | ) | | | (0.18 | ) | | | (0.27 | ) | | | (0.34 | ) | | | (0.17 | ) | | | (0.28 | ) | | | (0.26 | ) | | | (0.35 | ) | | | (0.43 | ) |
Net realized gain | | | (0.90 | ) | | | — | | | | — | | | | — | | | | (1.11 | ) | | | (0.90 | ) | | | — | | | | — | | | | — | | | | (1.11 | ) |
| | | | | | | | |
Total dividends and distributions | | | (1.02 | ) | | | (0.18 | ) | | | (0.18 | ) | | | (0.27 | ) | | | (1.45 | ) | | | (1.07 | ) | | | (0.28 | ) | | | (0.26 | ) | | | (0.35 | ) | | | (1.54 | ) |
| | | | | | | | |
Net asset value, end of year | | $ | 24.47 | | | $ | 23.07 | | | $ | 19.55 | | | $ | 19.65 | | | $ | 18.56 | | | $ | 23.20 | | | $ | 21.92 | | | $ | 18.64 | | | $ | 18.77 | | | $ | 17.79 | |
| | | | | | | | |
| | | | | | | | | | | | | | | | | | | | | | | | | | | | | | | | | | | | | | | | |
| Total Investment Return3 | | | | | | | | | | | | | | | | | | | | | |
Based on net asset value | | | 10.94 | % | | | 19.01 | % | | | 0.34 | % | | | 7.37 | %4 | | | (4.69 | )%5 | | | 11.22 | % | | | 19.22 | % | | | 0.55 | % | | | 7.53 | %6 | | | (4.56 | )%7 |
| | | | | | | | |
| | | | | | | | | | | | | | | | | | | | | | | | | | | | | | | | | | | | | | | | |
| Ratios to Average Net Assets8 | | | | | | | | | | | | | | | | | | | | | |
Total expenses | | | 2.33 | % | | | 2.29 | % | | | 2.36 | % | | | 2.34 | % | | | 2.09 | % | | | 2.07 | % | | | 2.06 | % | | | 2.18 | % | | | 2.20 | % | | | 1.97 | % |
| | | | | | | | |
Total expenses after fees waived | | | 2.01 | % | | | 1.98 | % | | | 2.04 | % | | | 2.02 | % | | | 1.90 | % | | | 1.75 | % | | | 1.75 | % | | | 1.87 | % | | | 1.88 | % | | | 1.76 | % |
| | | | | | | | |
Net investment income | | | 0.51 | % | | | 1.13 | % | | | 0.86 | % | | | 1.03 | % | | | 1.93 | % | | | 0.72 | % | | | 1.33 | % | | | 1.04 | % | | | 1.16 | % | | | 2.00 | % |
| | | | | | | | |
| | | | | | | | | | | | | | | | | | | | | | | | | | | | | | | | | | | | | | | | |
| Supplemental Data | | | | | | | | | | | | | | | | | | | | | |
Net assets, end of year (000) | | $ | 4,926 | | | $ | 7,128 | | | $ | 8,786 | | | $ | 14,374 | | | $ | 23,963 | | | $ | 63,952 | | | $ | 61,541 | | | $ | 56,608 | | | $ | 61,017 | | | $ | 60,461 | |
| | | | | | | | |
Portfolio turnover of the Fund9 | | | — | | | | — | | | | — | | | | — | | | | 94 | %10 | | | — | | | | — | | | | — | | | | — | | | | 94 | %10 |
| | | | | | | | |
Portfolio turnover of the Master Total Return Portfolio | | | 777 | %11 | | | 1,346 | %12 | | | 1,771 | %13 | | | 1,754 | %14 | | | 708 | %15 | | | 777 | %11 | | | 1,346 | %12 | | | 1,771 | %13 | | | 1,754 | %14 | | | 708 | %15 |
| | | | | | | | |
Portfolio turnover of the Master Large Cap Core Portfolio | | | 50 | % | | | 128 | % | | | 129 | % | | | 173 | % | | | 168 | %16 | | | 50 | % | | | 128 | % | | | 129 | % | | | 173 | % | | | 168 | %16 |
| | | | | | | | |
| | 1 | Based on average shares outstanding. |
| | 2 | Dividends and distributions are determined in accordance with federal income tax regulations. |
| | 3 | Where applicable, total investment returns exclude the effects of any sales charges and assume the reinvestment of dividends and distributions. |
| | 4 | Includes proceeds received from a settlement of litigation, through its investment in Master Large Cap Core Portfolio, which impacted the Fund’s total return. Excluding these proceeds, the Fund’s total return would have been 6.82%. |
| | 5 | Includes proceeds received from a settlement of litigation, through its investment in Master Large Cap Core Portfolio, which impacted the Fund’s total return. Excluding these proceeds, the Fund’s total return would have been (5.10)%. |
| | 6 | Includes proceeds received from a settlement of litigation, through its investment in Master Large Cap Core Portfolio, which impacted the Fund’s total return. Excluding these proceeds, the Fund’s total return would have been 7.12%. |
| | 7 | Includes proceeds received from a settlement of litigation, through its investment in Master Large Cap Core Portfolio, which impacted the Fund’s total return. Excluding these proceeds, the Fund’s total return would have been (4.94)%. |
| | 8 | Includes the Fund’s share of the Master Portfolios’ allocated expenses and/or net investment income. |
| | 9 | Excludes transactions in the Master Portfolios. |
| | 10 | Represents portfolio turnover for the period October 1, 2008 to January 30, 2009. |
| | 11 | Includes mortgage dollar roll transactions; excluding these transactions the portfolio turnover would have been 450%. |
| | 12 | Includes mortgage dollar roll transactions; excluding these transactions the portfolio turnover would have been 752%. |
| | 13 | Includes mortgage dollar roll transactions; excluding these transactions the portfolio turnover would have been 1,379%. |
| | 14 | Includes mortgage dollar roll transactions; excluding these transactions the portfolio turnover would have been 1,248%. |
| | 15 | Includes mortgage dollar roll transactions; excluding these transactions the portfolio turnover would have been 469%. |
| | 16 | Represents portfolio turnover for the period November 1, 2008 to September 30, 2009. |
See Notes to Financial Statements.
| | | | | | |
| 12 | | BLACKROCK BALANCED CAPITAL FUND, INC. | | SEPTEMBER 30, 2013 | | |
| | | | |
| Financial Highlights (concluded) | | | BlackRock Balanced Capital Fund, Inc. | |
| | | | | | | | | | | | | | | | | | | | |
| | | Class R | |
| | | Year Ended September 30, | |
| | | 2013 | | | 2012 | | | 2011 | | | 2010 | | | 2009 | |
| Per Share Operating Performance | | | | | | | | | | | | | | | | | | | | |
Net asset value, beginning of year | | $ | 22.63 | | | $ | 19.22 | | | $ | 19.33 | | | $ | 18.31 | | | $ | 21.06 | |
| | | | |
Net investment income1 | | | 0.28 | | | | 0.37 | | | | 0.30 | | | | 0.29 | | | | 0.38 | |
Net realized and unrealized gain (loss) | | | 2.24 | | | | 3.39 | | | | (0.09 | ) | | | 1.14 | | | | (1.54 | ) |
| | | | |
Net increase (decrease) from investment operations | | | 2.52 | | | | 3.76 | | | | 0.21 | | | | 1.43 | | | | (1.16 | ) |
Dividends and distributions from:2 | | | | | | | | | | | | | | | | | | | | |
Net investment income | | | (0.29 | ) | | | (0.35 | ) | | | (0.32 | ) | | | (0.41 | ) | | | (0.48 | ) |
Net realized gain | | | (0.90 | ) | | | — | | | | — | | | | — | | | | (1.11 | ) |
| | | | |
Total dividends and distributions | | | (1.19 | ) | | | (0.35 | ) | | | (0.32 | ) | | | (0.41 | ) | | | (1.59 | ) |
| | | | |
Net asset value, end of year | | $ | 23.96 | | | $ | 22.63 | | | $ | 19.22 | | | $ | 19.33 | | | $ | 18.31 | |
| | | | |
| | | | | | | | | | | | | | | | | | | | |
| Total Investment Return3 | | | | | | | | | | | | | | | | | | | | |
Based on net asset value | | | 11.66 | % | | | 19.73 | % | | | 0.96 | % | | | 7.87 | %4 | | | (4.25 | )%5 |
| | | | |
| | | | | | | | | | | | | | | | | | | | |
| Ratios to Average Net Assets6 | | | | | | | | | | | | | | | | | | | | |
Total expenses | | | 1.66 | % | | | 1.67 | % | | | 1.77 | % | | | 1.84 | % | | | 1.64 | % |
| | | | |
Total expenses after fees waived | | | 1.33 | % | | | 1.36 | % | | | 1.46 | % | | | 1.52 | % | | | 1.42 | % |
| | | | |
Net investment income | | | 1.16 | % | | | 1.73 | % | | | 1.44 | % | | | 1.51 | % | | | 2.29 | % |
| | | | |
| | | | | | | | | | | | | | | | | | | | |
| Supplemental Data | | | | | | | | | | | | | | | | | | | | |
Net assets, end of year (000) | | $ | 8,542 | | | $ | 8,963 | | | $ | 8,118 | | | $ | 9,737 | | | $ | 10,194 | |
| | | | |
Portfolio turnover of the Fund7 | | | — | | | | — | | | | — | | | | — | | | | 94 | %8 |
| | | | |
Portfolio turnover of the Master Total Return Portfolio | | | 777 | %9 | | | 1,346 | %10 | | | 1,771 | %11 | | | 1,754 | %12 | | | 708 | %13 |
| | | | |
Portfolio turnover of the Master Large Cap Core Portfolio | | | 50 | % | | | 128 | % | | | 129 | % | | | 173 | % | | | 168 | %14 |
| | | | |
| | 1 | Based on average shares outstanding. |
| | 2 | Dividends and distributions are determined in accordance with federal income tax regulations. |
| | 3 | Where applicable, total investment returns assume the reinvestment of dividends and distributions. |
| | 4 | Includes proceeds received from a settlement of litigation, through its investment in Master Large Cap Core Portfolio, which impacted the Fund’s total return. Excluding these proceeds, the Fund’s total return would have been 7.53%. |
| | 5 | Includes proceeds received from a settlement of litigation, through its investment in Master Large Cap Core Portfolio, which impacted the Fund’s total return. Excluding these proceeds, the Fund’s total return would have been (4.62)%. |
| | 6 | Includes the Fund’s share of the Master Portfolios’ allocated expenses and/or net investment income. |
| | 7 | Excludes transactions in the Master Portfolios. |
| | 8 | Represents portfolio turnover for the period October 1, 2008 to January 30, 2009. |
| | 9 | Includes mortgage dollar roll transactions; excluding these transactions the portfolio turnover would have been 450%. |
| | 10 | Includes mortgage dollar roll transactions; excluding these transactions the portfolio turnover would have been 752%. |
| | 11 | Includes mortgage dollar roll transactions; excluding these transactions the portfolio turnover would have been 1,379%. |
| | 12 | Includes mortgage dollar roll transactions; excluding these transactions the portfolio turnover would have been 1,248%. |
| | 13 | Includes mortgage dollar roll transactions; excluding these transactions the portfolio turnover would have been 469%. |
| | 14 | Represents portfolio turnover for the period November 1, 2008 to September 30, 2009. |
See Notes to Financial Statements.
| | | | | | |
| | | BLACKROCK BALANCED CAPITAL FUND, INC. | | SEPTEMBER 30, 2013 | | 13 |
| | | | |
| Notes to Financial Statements | | | BlackRock Balanced Capital Fund, Inc. | |
1. Organization:
BlackRock Balanced Capital Fund, Inc. (the “Fund”) is registered under the Investment Company Act of 1940, as amended (the “1940 Act”), as a diversified, open-end management investment company. The Fund is organized as a Maryland corporation. The Fund seeks to achieve its investment objective by investing the fixed income portion of its assets in Master Total Return Portfolio (the “Master Total Return Portfolio”) of Master Bond LLC, a mutual fund that has an investment objective and strategy consistent with that of the fixed income portion of the Fund, and investing the equity portion of its assets in Master Large Cap Core Portfolio (the “Master Large Cap Core Portfolio”) of Master Large Cap Series LLC, a mutual fund that has an investment objective and strategy consistent with that of the equity portion of the Fund. Master Total Return Portfolio and Master Large Cap Core Portfolio, both affiliates of the Fund, are collectively referred to as the “Master Portfolios.” The value of the Fund’s investment in the Master Portfolios reflects the Fund’s proportionate interest in the net assets of the Master Portfolios. The percentages of the Master Large Cap Core Portfolio and Master Total Return Portfolio owned by the Fund at September 30, 2013 were 23.4% and 8.5%, respectively. The performance of the Fund is directly affected by the performance of the Master Portfolios. The financial statements of the Master Portfolios, including the Schedules of Investments, are included elsewhere in this report and should be read in conjunction with the Fund’s financial statements. The Fund offers multiple classes of shares. Institutional Shares are sold without a sales charge and only to certain eligible investors. Investor A Shares are generally sold with an initial sales charge, but may be subject to a CDSC for certain redemptions where no initial sales charge was paid at the time of purchase. Investor B and Investor C Shares may be subject to a CDSC. Class R Shares are sold without a sales charge and only to certain employer-sponsored retirement plans. All classes of shares have identical voting, dividend, liquidation and other rights and are subject to the same terms and conditions, except that Investor A, Investor B, Investor C and Class R Shares bear certain expenses related to the shareholder servicing of such shares, and Investor B, Investor C and Class R Shares also bear certain expenses related to the distribution of such shares. Investor B Shares automatically convert to Investor A Shares after approximately eight years. Investor B Shares are only available through exchanges and dividend reinvestments by existing shareholders and for purchase by certain employer-sponsored retirement plans. Each class has exclusive voting rights with respect to matters relating to its shareholder servicing and distribution expenditures (except that Investor B shareholders may vote on material changes to the Investor A distribution plan).
2. Significant Accounting Policies:
The Fund’s financial statements are prepared in conformity with accounting principles generally accepted in the United States of America (“US GAAP”), which may require management to make estimates and assumptions that affect the reported amounts of assets and liabilities in the financial statements and the reported amounts of increases and decreases in net assets from operations during the reporting period. Actual results could differ from those estimates. The following is a summary of the significant accounting policies followed by the Fund:
Valuation: US GAAP defines fair value as the price the Fund would receive to sell an asset or pay to transfer a liability in an orderly transaction between market participants at the measurement date. The Fund’s policy is to fair value its financial instruments at market value. The Fund records its investment in the Master Portfolios at fair value based on the Fund’s proportionate interest in the net assets of the Master Portfolios. Valuation of securities held by the Master Portfolios is discussed in Note 2 of each Master Portfolio’s Notes to Financial Statements, which are included elsewhere in this report. Investments in open-end registered investment companies are valued at NAV each business day.
| • | | Fair Value Measurements — Various inputs are used in determining the fair value of investments. These inputs to valuation techniques are categorized into a disclosure hierarchy consisting of three broad levels for financial statement purposes as follows: |
| | • | | Level 1 — unadjusted price quotations in active markets/exchanges for identical assets or liabilities that the Fund has the ability to access |
| | • | | Level 2 — other observable inputs (including, but not limited to, quoted prices for similar assets or liabilities in markets that are active, quoted prices for identical or similar assets or liabilities in markets that are not active, inputs other than quoted prices that are observable for the assets or liabilities (such as interest rates, yield curves, volatilities, prepayment speeds, loss severities, credit risks and default rates) or other market–corroborated inputs) |
| | • | | Level 3 — unobservable inputs based on the best information available in the circumstances, to the extent observable inputs are not available (including the Fund’s own assumptions used in determining the fair value of investments) |
The hierarchy gives the highest priority to unadjusted quoted prices in active markets for identical assets or liabilities (Level 1 measurements) and the lowest priority to unobservable inputs (Level 3 measurements). Accordingly, the degree of judgment exercised in determining fair value is greatest for instruments categorized in Level 3. The inputs used to measure fair value may fall into different levels of the fair value hierarchy. In such cases, for disclosure purposes, the fair value hierarchy classification is determined based on the lowest level input that is significant to the fair value measurement in its entirety.
Changes in valuation techniques may result in transfers into or out of an assigned level within the disclosure hierarchy. In accordance with the Fund’s policy, transfers between different levels of the fair value disclosure hierarchy are deemed to have occurred as of the beginning of the reporting period. The categorization of a value determined for investments is based on the pricing transparency of the investment and is not necessarily an indication of the risks associated with investing in those securities.
The following table summarizes the Fund’s investments categorized in the disclosure hierarchy as of September 30, 2013:
| | | | | | |
| 14 | | BLACKROCK BALANCED CAPITAL FUND, INC. | | SEPTEMBER 30, 2013 | | |
| | | | |
| Notes to Financial Statements (continued) | | | BlackRock Balanced Capital Fund, Inc. | |
| | | | | | | | | | | | | | | | |
| | | Level 1 | | | Level 2 | | | Level 3 | | | Total | |
BlackRock Liquidity Funds, TempFund, Institutional Class | | $ | 16,206,029 | | | | — | | | | — | | | $ | 16,206,029 | |
There were no transfers between levels during the year ended September 30, 2013.
Investment Transactions and Investment Income: For financial reporting purposes, contributions to and withdrawals from the Master Portfolios are accounted on a trade date basis. The Fund records daily its proportionate share of the Master Portfolios’ income, expenses and realized and unrealized gains and losses. In addition, the Fund accrues its own expenses. Income, expenses, and realized and unrealized gains and losses are allocated daily to each class based on its relative net assets.
Dividends and Distributions: Dividends and distributions paid by the Fund are recorded on the ex-dividend dates. The portion of distributions that exceeds a Fund’s current and accumulated earnings and profits, which are measured on a tax basis, will constitute a nontaxable return of capital. Distributions in excess of a Fund’s taxable income and net capital gains, but not in excess of a Fund’s earnings and profits, will be taxable to shareholders as ordinary income and will not constitute a non-taxable return of capital. The character and timing of dividends and distributions are determined in accordance with federal income tax regulations, which may differ from US GAAP.
Income Taxes: It is the Fund’s policy to comply with the requirements of the Internal Revenue Code of 1986, as amended, applicable to regulated investment companies and to distribute substantially all of its taxable income to its shareholders. Therefore, no federal income tax provision is required.
The Fund files US federal and various state and local tax returns. No income tax returns are currently under examination. The statute of limitations on the Fund’s US federal tax returns remains open for each of the four years ended September 30, 2013. The statutes of limitations on the Fund’s state and local tax returns may remain open for an additional year depending upon the jurisdiction. Management does not believe there are any uncertain tax positions that require recognition of a tax liability.
Other: Expenses directly related to the Fund or its classes are charged to the Fund or class. Other operating expenses shared by several funds are pro rated among those funds on the basis of relative net assets or other appropriate methods. Expenses directly related to the Fund and other shared expenses pro rated to the Fund are allocated daily to each class based on its relative net assets or other appropriate methods.
The Fund has an arrangement with the custodian whereby fees may be reduced by credits earned on uninvested cash balances, which, if applicable, are shown as fees paid indirectly in the Statement of Operations. The custodian imposes fees on overdrawn cash balances, which can be offset by accumulated credits earned or may result in additional custody charges.
3. Investment Advisory Agreement and Other Transactions with Affiliates:
The PNC Financial Services Group, Inc. is the largest stockholder and an affiliate, for 1940 Act purposes, of BlackRock, Inc. (“BlackRock”).
The Fund entered into an Investment Advisory Agreement with the Manager, the Fund’s investment advisor, an indirect, wholly owned subsidiary of BlackRock, to provide investment advisory and administration services. The Manager is responsible for the management of the Fund’s portfolio and provides the necessary personnel, facilities, equipment and certain other services necessary to the operations of the Fund. For such services, the Fund paid the Manager a monthly fee based on a percentage of the Fund’s average daily net assets at the following annual rates:
| | | | |
| Average Daily Net Assets | | Investment
Advisory Fee | |
First $250 million | | | 0.500 | % |
$250 million - $ 300 million | | | 0.450 | % |
$300 million - $ 400 million | | | 0.425 | % |
Greater than $400 million | | | 0.400 | % |
The Fund also pays an investment advisory fee to the Manager, which is the investment advisor of Master Total Return Portfolio and Master Large Cap Core Portfolio, to the extent it invests in the Master Total Return Portfolio and Master Large Cap Core Portfolio. The Manager has contractually agreed to waive its investment advisory fee by the amount the Fund pays in connection with its investments in the Master Portfolios. For the year ended September 30, 2013, the Manager waived $2,823,447, which is included in fees waived by Manager in the Statement of Operations.
Investments in companies considered to be an affiliate of the Fund, for purposes of Section 2(a)(3) of the Investment Company Act of 1940, were as follows:
| | | | | | | | | | | | | | | | |
| Affiliate | | Shares Held at
September 30,
2012 | | | Net
Activity | | | Shares Held at
September 30,
2013 | | | Income | |
BlackRock Liquidity Funds, TempFund, Institutional Class | | | 6,285,043 | | | | 9,920,986 | | | | 16,206,029 | | | $ | 2,141 | |
The Manager voluntarily agreed to waive its investment advisory fees by the amount of investment advisory fees the Fund pays to the Manager indirectly through its investment in affiliated money market funds. However, the Manager does not waive its investment advisory fees by the amount of investment advisory fees paid in connection with the Fund’s investment in other affiliated investment companies except to the extent noted above with respect to Master Total Return Portfolio and Master Large Cap Core Portfolio, if any. For the year ended September 30, 2013, the Manager waived $2,795, which is included in fees waived by Manager in the Statement of Operations.
The Manager entered into a sub-advisory agreement with BlackRock Investment Management, LLC (“BIM”), an affiliate of the Manager. The Manager pays BIM, for services it provides, a monthly fee that is a percentage of the investment advisory fees paid by the Fund to the Manager.
| | | | | | |
| | | BLACKROCK BALANCED CAPITAL FUND, INC. | | SEPTEMBER 30, 2013 | | 15 |
| | | | |
| Notes to Financial Statements (continued) | | | BlackRock Balanced Capital Fund, Inc. | |
The Fund entered into a Distribution Agreement and Distribution and Service Plan with BlackRock Investments, LLC (“BRIL”), an affiliate of the Manager. Pursuant to the Distribution and Service Plan and in accordance with Rule 12b-1 under the 1940 Act, the Fund pays BRIL ongoing service and distribution fees. The fees are accrued daily and paid monthly at annual rates based upon the average daily net assets of the shares of the Fund as follows:
| | | | | | | | |
| | | Service
Fee | | | Distribution
Fee | |
Investor A | | | 0.25 | % | | | — | |
Investor B | | | 0.25 | % | | | 0.75 | % |
Investor C | | | 0.25 | % | | | 0.75 | % |
Class R | | | 0.25 | % | | | 0.25 | % |
Pursuant to sub-agreements with BRIL, broker-dealers and BRIL provide shareholder servicing and distribution services to the Fund. The ongoing service and/or distribution fee compensates BRIL and each broker-dealer for providing shareholder servicing and/or distribution related services to Investor A, Investor B, Investor C and Class R shareholders.
The Manager maintains a call center, which is responsible for providing certain shareholder services to the Fund, such as responding to shareholder inquiries and processing transactions based upon instructions from shareholders with respect to the subscription and redemption of Fund shares. For the year ended September 30, 2013, the Fund reimbursed the Manager the following amounts for costs incurred in running the call center, which are included in transfer agent — class specific in the Statement of Operations:
| | | | |
Institutional | | $ | 21,094 | |
Investor A | | $ | 27,474 | |
Investor B | | $ | 1,421 | |
Investor C | | $ | 4,414 | |
Class R | | $ | 281 | |
For the year ended September 30, 2013, affiliates earned underwriting discounts, direct commissions and dealer concessions on sales of the Fund’s Investor A Shares, which totaled $12,663.
For the year ended September 30, 2013, affiliates received CDSCs as follows:
| | | | |
Investor B | | $ | 2,800 | |
Investor C | | $ | 2,094 | |
Certain officers and/or directors of the Fund are officers and/or directors of BlackRock or its affiliates. The Fund reimburses the Manager for a portion of the compensation paid to the Fund’s Chief Compliance Officer.
4. Income Tax Information:
US GAAP requires that certain components of net assets be adjusted to reflect permanent differences between financial and tax reporting. These
reclassifications have no effect on net assets or net asset values per share. The following permanent differences as of September 30, 2013 attributable to foreign currency transactions, the accounting for swap agreements, net paydown losses and the classification of investments were reclassified to the following accounts:
| | | | |
Undistributed net investment income | | $ | 1,002,227 | |
Accumulated net realized gain | | $ | (1,002,227 | ) |
The tax character of distributions paid during the fiscal years ended September 30, 2013 and September 30, 2012 was as follows:
| | | | | | | | |
| | | 9/30/13 | | | 9/30/12 | |
Ordinary income | | $ | 19,580,917 | | | $ | 20,450,068 | |
Long-term capital gains | | | 32,039,936 | | | | — | |
| | | | |
Total | | $ | 51,620,853 | | | $ | 20,450,068 | |
| | | | |
As of September 30, 2013, the tax components of accumulated net earnings were as follows:
| | | | |
Undistributed ordinary income | | $ | 27,889,733 | |
Undistributed long-term capital gains | | | 42,959,793 | |
Net unrealized gains1 | | | 127,110,486 | |
| | | | |
Total | | $ | 197,960,012 | |
| | | | |
| | 1 | The difference between book-basis and tax-basis net unrealized gains was attributable primarily to the timing and recognition of partnership income. |
5. Borrowings:
The Fund, along with certain other funds managed by the Manager and its affiliates (“Participating Funds”), is a party to a 364-day, $800 million credit agreement with a group of lenders, under which the Fund may borrow to fund shareholder redemptions. The agreement expires in April 2014. Excluding commitments designated for a certain individual fund, other Participating Funds, including the Fund, can borrow up to an aggregate commitment amount of $500 million, subject to asset coverage and other limitations as specified in the agreement. The credit agreement has the following terms: a fee of 0.065% per annum on unused commitment amounts and interest at a rate equal to the higher of (a) the one-month LIBOR plus 0.80% per annum or (b) the Fed Funds rate plus 0.80% per annum on amounts borrowed. Participating Funds paid administration and arrangement fees, which, along with commitment fees, were allocated among such funds based upon portions of the aggregate commitment available to them and relative net assets of Participating Funds. The Fund did not borrow under the credit agreement during the year ended September 30, 2013.
| | | | | | |
| 16 | | BLACKROCK BALANCED CAPITAL FUND, INC. | | SEPTEMBER 30, 2013 | | |
| | | | |
| Notes to Financial Statements (concluded) | | | BlackRock Balanced Capital Fund, Inc. | |
6. Capital Share Transactions:
Transactions in capital shares for each class were as follows:
| | | | | | | | | | | | | | | | | | |
| | | Year Ended
September 30, 2013 | | | | | Year Ended
September 30, 2012 | |
| | | Shares | | | Amount | | | | | Shares | | | Amount | |
Institutional | | | | | | | | | | | | | | | | | | |
Shares sold | | | 587,970 | | | $ | 14,063,136 | | | | | | 1,073,577 | | | $ | 24,117,916 | |
Shares issued to shareholders in reinvestment of dividends and distributions | | | 862,779 | | | | 19,913,174 | | | | | | 416,633 | | | | 9,131,872 | |
Shares redeemed | | | (6,751,385 | ) | | | (161,100,560 | ) | | | | | (8,919,131 | ) | | | (205,195,951 | ) |
| | | | | | | | | | |
Net decrease | | | (5,300,636 | ) | | $ | (127,124,250 | ) | | | | | (7,428,921 | ) | | $ | (171,946,163 | ) |
| | | | | | | | | | |
| | | | | | | | | | | | | | | | | | |
Investor A | | | | | | | | | | | | | | | | | | |
Shares sold and automatic conversion of shares | | | 1,091,500 | | | $ | 26,552,253 | | | | | | 652,208 | | | $ | 14,663,133 | |
Shares issued to shareholders in reinvestment of dividends and distributions | | | 906,027 | | | | 20,869,711 | | | | | | 339,412 | | | | 7,454,026 | |
Shares redeemed | | | (3,160,000 | ) | | | (76,081,120 | ) | | | | | (3,323,937 | ) | | | (74,381,031 | ) |
| | | | | | | | | | |
Net decrease | | | (1,162,473 | ) | | $ | (28,659,156 | ) | | | | | (2,332,317 | ) | | $ | (52,263,872 | ) |
| | | | | | | | | | |
| | | | | | | | | | | | | | | | | | |
Investor B | | | | | | | | | | | | | | | | | | |
Shares sold | | | 15,539 | | | $ | 368,166 | | | | | | 19,198 | | | $ | 418,334 | |
Shares issued to shareholders in reinvestment of dividends and distributions | | | 10,919 | | | | 242,308 | | | | | | 2,546 | | | | 54,515 | |
Shares redeemed and automatic conversion of shares | | | (134,128 | ) | | | (3,134,895 | ) | | | | | (162,078 | ) | | | (3,515,240 | ) |
| | | | | | | | | | |
Net decrease | | | (107,670 | ) | | $ | (2,524,421 | ) | | | | | (140,334 | ) | | $ | (3,042,391 | ) |
| | | | | | | | | | |
| | | | | | | | | | | | | | | | | | |
Investor C | | | | | | | | | | | | | | | | | | |
Shares sold | | | 382,333 | | | $ | 8,560,685 | | | | | | 378,641 | | | $ | 7,719,246 | |
Shares issued to shareholders in reinvestment of dividends and distributions | | | 121,509 | | | | 2,558,974 | | | | | | 34,624 | | | | 706,396 | |
Shares redeemed | | | (554,790 | ) | | | (12,372,766 | ) | | | | | (642,851 | ) | | | (13,310,001 | ) |
| | | | | | | | | | |
Net decrease | | | (50,948 | ) | | $ | (1,253,107 | ) | | | | | (229,586 | ) | | $ | (4,884,359 | ) |
| | | | | | | | | | |
| | | | | | | | | | | | | | | | | | |
Class R | | | | | | | | | | | | | | | | | | |
Shares sold | | | 101,324 | | | $ | 2,340,471 | | | | | | 111,890 | | | $ | 2,378,885 | |
Shares issued to shareholders in reinvestment of dividends and distributions | | | 21,204 | | | | 463,410 | | | | | | 6,922 | | | | 145,567 | |
Shares redeemed | | | (162,165 | ) | | | (3,675,580 | ) | | | | | (145,021 | ) | | | (3,098,481 | ) |
| | | | | | | | | | |
Net decrease | | | (39,637 | ) | | $ | (871,699 | ) | | | | | (26,209 | ) | | $ | (574,029 | ) |
| | | | | | | | | | | | | | | | | | |
Total Net Decrease | | | (6,661,364 | ) | | $ | (160,432,633 | ) | | | | | (10,157,367 | ) | | $ | (232,710,814 | ) |
| | | | | | | | | | |
7. Subsequent Events:
Management has evaluated the impact of all subsequent events on the Fund through the date the financial statements were issued and has determined that there were no subsequent events requiring adjustment or additional disclosure in the financial statements.
| | | | | | |
| | | BLACKROCK BALANCED CAPITAL FUND, INC. | | SEPTEMBER 30, 2013 | | 17 |
| | |
| Report of Independent Registered Public Accounting Firm | | |
To the Shareholders and Board of Directors of BlackRock Balanced Capital Fund, Inc.:
We have audited the accompanying statement of assets and liabilities of BlackRock Balanced Capital Fund, Inc. (the “Fund”) as of September 30, 2013, and the related statement of operations for the year then ended, the statements of changes in net assets for each of the two years in the period then ended, and the financial highlights for each of the periods presented. These financial statements and financial highlights are the responsibility of the Fund’s management. Our responsibility is to express an opinion on these financial statements and financial highlights based on our audits.
We conducted our audits in accordance with the standards of the Public Company Accounting Oversight Board (United States). Those standards require that we plan and perform the audit to obtain reasonable assurance about whether the financial statements and financial highlights are free of material misstatement. The Fund is not required to have, nor were we engaged to perform, an audit of its internal control over financial reporting. Our audits included consideration of internal control over financial reporting as a basis for designing audit procedures that are appropriate in the circumstances, but not for the purpose of expressing an opinion on the effectiveness of the Fund’s internal control over
financial reporting. Accordingly, we express no such opinion. An audit also includes examining, on a test basis, evidence supporting the amounts and disclosures in the financial statements, assessing the accounting principles used and significant estimates made by management, as well as evaluating the overall financial statement presentation. Our procedures included confirmation of securities owned as of September 30, 2013, by correspondence with the custodian and brokers. We believe that our audits provide a reasonable basis for our opinion.
In our opinion, the financial statements and financial highlights referred to above present fairly, in all material respects, the financial position of BlackRock Balanced Capital Fund, Inc. as of September 30, 2013, the results of its operations for the year then ended, the changes in its net assets for each of the two years in the period then ended, and the financial highlights for each of the periods presented, in conformity with accounting principles generally accepted in the United States of America.
Deloitte & Touche LLP
Philadelphia, Pennsylvania
November 26, 2013
|
| Important Tax Information (Unaudited) |
The following information is provided with respect to the ordinary income distributions paid by the Fund during the fiscal year ended September 30, 2013:
| | | | | | | | |
| | | Payable Dates | |
| | | | 12/24/12 | | | | 7/19/13 | |
Qualified Dividend Income for Individuals1 | | | 41.56 | % | | | 19.07 | % |
Dividends Qualifying for the Dividends Received Deduction for Corporations1 | | | 40.03 | % | | | 18.43 | % |
Federal Obligation Interest2 | | | 3.18 | % | | | 4.42 | % |
Interest-Related Dividends and Qualified Short-Term Capital Gains for Non-US Residents3 | | | 42.69 | % | | | 80.86 | % |
| 1 | The Fund hereby designates the percentage indicated above or the maximum amount allowable by law. |
| 2 | The law varies in each state as to whether and what percentage of ordinary income dividends attributable to federal obligations is exempt from state income tax. We recommend that you consult your tax advisor to determine if any portion of the dividends you received is exempt from state income taxes. |
| 3 | Represents the portion of the taxable ordinary income dividends eligible for exemption from U.S. withholding tax for nonresident aliens and foreign corporations. |
Additionally, the Fund distributed long-term capital gains of $0.813871 per share to shareholders of record on December 20, 2012.
| | | | | | |
| 18 | | BLACKROCK BALANCED CAPITAL FUND, INC. | | SEPTEMBER 30, 2013 | | |
| | | | |
| Portfolio Summary | | | Master Large Cap Core Portfolio | |
| | | | |
| Master Large Cap Core Portfolio | | Percent of
Long-Term Investments | |
Google, Inc., Class A | | | 3 | % |
Mastercard, Inc., Class A | | | 3 | |
3M Co. | | | 3 | |
JPMorgan Chase & Co. | | | 3 | |
Bank of America Corp. | | | 3 | |
Lowe’s Cos., Inc. | | | 3 | |
Comcast Corp., Class A | | | 3 | |
Citigroup, Inc. | | | 3 | |
U.S. Bancorp | | | 3 | |
Pfizer, Inc. | | | 3 | |
| | | | |
| Master Large Cap Core Portfolio | | Percent of
Long-Term Investments | |
Financials | | | 22 | % |
Information Technology | | | 21 | |
Health Care | | | 17 | |
Consumer Discretionary | | | 12 | |
Industrials | | | 11 | |
Energy | | | 11 | |
Materials | | | 3 | |
Consumer Staples | | | 3 | |
For Portfolio compliance purposes, the Portfolio’s sector classifications refer to any one or more of the sector sub-classifications used by one or more widely recognized market indexes or ratings group indexes, and/or as defined by Portfolio management. These definitions may not apply for purposes of this report, which may combine sector sub-classifications for reporting ease.
| | | | | | |
| | | BLACKROCK BALANCED CAPITAL FUND, INC. | | SEPTEMBER 30, 2013 | | 19 |
| | | | |
| Schedule of Investments September 30, 2013 | | | Master Large Cap Core Portfolio | |
| | | (Percentages shown are based on Net Assets) | |
| | | | | | | | |
| Common Stocks | | Shares | | | Value | |
Aerospace & Defense — 1.5% | | | | | | | | |
The Boeing Co. | | | 246,900 | | | $ | 29,010,750 | |
Rockwell Collins, Inc. | | | 98,000 | | | | 6,650,280 | |
| | | | | | | | |
| | | | | | | | 35,661,030 | |
Airlines — 1.8% | | | | | | | | |
United Continental Holdings, Inc. (a) | | | 1,368,468 | | | | 42,025,652 | |
Auto Components — 2.2% | | | | | | | | |
BorgWarner, Inc. | | | 140,350 | | | | 14,230,087 | |
TRW Automotive Holdings Corp. (a) | | | 511,339 | | | | 36,463,584 | |
| | | | | | | | |
| | | | | | | | 50,693,671 | |
Biotechnology — 2.7% | | | | | | | | |
Amgen, Inc. | | | 217,100 | | | | 24,302,174 | |
Biogen Idec, Inc. (a) | | | 58,400 | | | | 14,060,384 | |
Celgene Corp. (a) | | | 109,700 | | | | 16,886,121 | |
Gilead Sciences, Inc. (a) | | | 107,300 | | | | 6,742,732 | |
| | | | | | | | |
| | | | | | | | 61,991,411 | |
Capital Markets — 1.6% | | | | | | | | |
The Goldman Sachs Group, Inc. | | | 227,131 | | | | 35,934,395 | |
Chemicals — 0.3% | | | | | | | | |
Cabot Corp. | | | 178,974 | | | | 7,643,980 | |
Commercial Banks — 4.1% | | | | | | | | |
Regions Financial Corp. | | | 810,500 | | | | 7,505,230 | |
SunTrust Banks, Inc. | | | 852,700 | | | | 27,644,534 | |
U.S. Bancorp | | | 1,650,775 | | | | 60,385,349 | |
| | | | | | | | |
| | | | | | | | 95,535,113 | |
Commercial Services & Supplies — 0.6% | | | | | | | | |
Tyco International Ltd. | | | 403,800 | | | | 14,124,924 | |
Communications Equipment — 2.0% | | | | | | | | |
Brocade Communications Systems, Inc. (a) | | | 1,122,800 | | | | 9,038,540 | |
Cisco Systems, Inc. | | | 1,578,600 | | | | 36,970,812 | |
| | | | | | | | |
| | | | | | | | 46,009,352 | |
Computers & Peripherals — 4.8% | | | | | | | | |
Apple, Inc. | | | 89,550 | | | | 42,692,963 | |
EMC Corp. | | | 1,631,500 | | | | 41,701,140 | |
NetApp, Inc. | | | 475,800 | | | | 20,278,596 | |
Western Digital Corp. | | | 106,695 | | | | 6,764,463 | |
| | | | | | | | |
| | | | | | | | 111,437,162 | |
Construction & Engineering — 0.9% | | | | | | | | |
KBR, Inc. | | | 648,800 | | | | 21,176,832 | |
Consumer Finance — 2.3% | | | | | | | | |
Discover Financial Services | | | 1,068,000 | | | | 53,976,720 | |
Containers & Packaging — 1.1% | | | | | | | | |
Packaging Corp. of America | | | 464,713 | | | | 26,530,465 | |
Diversified Financial Services — 8.3% | | | | | | | | |
Bank of America Corp. | | | 4,719,096 | | | | 65,123,525 | |
Citigroup, Inc. | | | 1,249,718 | | | | 60,623,820 | |
JPMorgan Chase & Co. | | | 1,289,624 | | | | 66,660,665 | |
| | | | | | | | |
| | | | | | | | 192,408,010 | |
Electronic Equipment, Instruments & Components — 1.1% | | | | | |
Avnet, Inc. | | | 365,000 | | | | 15,224,150 | |
TE Connectivity Ltd. | | | 175,300 | | | | 9,077,034 | |
| | | | | | | | |
| | | | | | | | 24,301,184 | |
Energy Equipment & Services — 3.1% | | | | | | | | |
Halliburton Co. | | | 396,600 | | | | 19,096,290 | |
Oceaneering International, Inc. | | | 223,800 | | | | 18,181,512 | |
Schlumberger Ltd. | | | 379,800 | | | | 33,559,128 | |
| | | | | | | | |
| | | | | | | | 70,836,930 | |
| | | | | | | | |
| Common Stocks | | Shares | | | Value | |
Food & Staples Retailing — 2.8% | | | | | | | | |
CVS Caremark Corp. | | | 1,056,825 | | | $ | 59,974,819 | |
Wal-Mart Stores, Inc. | | | 61,250 | | | | 4,530,050 | |
| | | | | | | | |
| | | | | | | | 64,504,869 | |
Health Care Equipment & Supplies — 2.1% | | | | | | | | |
Abbott Laboratories | | | 554,900 | | | | 18,417,131 | |
Medtronic, Inc. | | | 568,800 | | | | 30,288,600 | |
| | | | | | | | |
| | | | | | | | 48,705,731 | |
Health Care Providers & Services — 3.0% | | | | | | | | |
Aetna, Inc. | | | 312,100 | | | | 19,980,642 | |
Envision Healthcare Holdings, Inc. (a) | | | 55,500 | | | | 1,444,665 | |
McKesson Corp. | | | 294,425 | | | | 37,774,727 | |
Universal Health Services, Inc., Class B | | | 129,700 | | | | 9,726,203 | |
| | | | | | | | |
| | | | | | | | 68,926,237 | |
Industrial Conglomerates — 3.7% | | | | | | | | |
3M Co. | | | 585,975 | | | | 69,971,275 | |
General Electric Co. | | | 605,250 | | | | 14,459,423 | |
| | | | | | | | |
| | | | | | | | 84,430,698 | |
Insurance — 5.3% | | | | | | | | |
Allied World Assurance Co. Holdings AG | | | 75,500 | | | | 7,503,945 | |
American Financial Group, Inc. | | | 106,700 | | | | 5,768,202 | |
American International Group, Inc. | | | 1,231,300 | | | | 59,878,119 | |
The Chubb Corp. | | | 171,700 | | | | 15,325,942 | |
The Travelers Cos., Inc. | | | 405,900 | | | | 34,408,143 | |
| | | | | | | | |
| | | | | | | | 122,884,351 | |
Internet Software & Services — 3.6% | | | | | | | | |
AOL, Inc. (b) | | | 283,100 | | | | 9,789,598 | |
Google, Inc., Class A (a) | | | 82,615 | | | | 72,363,305 | |
| | | | | | | | |
| | | | | | | | 82,152,903 | |
IT Services — 3.9% | | | | | | | | |
Mastercard, Inc., Class A | | | 107,250 | | | | 72,155,655 | |
Teradata Corp. (a)(b) | | | 304,300 | | | | 16,870,392 | |
| | | | | | | | |
| | | | | | | | 89,026,047 | |
Life Sciences Tools & Services — 1.4% | | | | | | | | |
Agilent Technologies, Inc. | | | 628,800 | | | | 32,226,000 | |
Machinery — 2.3% | | | | | | | | |
Ingersoll-Rand PLC | | | 419,600 | | | | 27,248,824 | |
Oshkosh Corp. (a) | | | 246,500 | | | | 12,073,570 | |
WABCO Holdings, Inc. (a) | | | 151,600 | | | | 12,773,816 | |
| | | | | | | | |
| | | | | | | | 52,096,210 | |
Media — 4.1% | | | | | | | | |
Comcast Corp., Class A | | | 1,350,900 | | | | 60,993,135 | |
Twenty-First Century Fox, Inc. | | | 973,920 | | | | 32,626,320 | |
| | | | | | | | |
| | | | | | | | 93,619,455 | |
Multiline Retail — 1.0% | | | | | | | | |
Dillard’s, Inc., Class A | | | 139,865 | | | | 10,951,429 | |
Macy’s, Inc. | | | 283,300 | | | | 12,258,391 | |
| | | | | | | | |
| | | | | | | | 23,209,820 | |
Oil, Gas & Consumable Fuels — 7.6% | | | | | | | | |
Chevron Corp. | | | 359,275 | | | | 43,651,913 | |
Exxon Mobil Corp. | | | 306,600 | | | | 26,379,864 | |
Marathon Petroleum Corp. | | | 535,088 | | | | 34,416,860 | |
PBF Energy, Inc. | | | 555,238 | | | | 12,465,093 | |
Suncor Energy, Inc. | | | 1,310,040 | | | | 46,873,231 | |
Tesoro Corp. | | | 242,093 | | | | 10,647,250 | |
| | | | | | | | |
| | | | | | | | 174,434,211 | |
See Notes to Financial Statements.
| | | | | | |
| 20 | | BLACKROCK BALANCED CAPITAL FUND, INC. | | SEPTEMBER 30, 2013 | | |
| | | | |
| Schedule of Investments (continued) | | | Master Large Cap Core Portfolio | |
| | | (Percentages shown are based on Net Assets) | |
| | | | | | | | |
| Common Stocks | | Shares | | | Value | |
Paper & Forest Products — 1.5% | | | | | | | | |
Domtar Corp. | | | 243,200 | | | $ | 19,314,944 | |
International Paper Co. | | | 348,500 | | | | 15,612,800 | |
| | | | | | | | |
| | | | | | | | 34,927,744 | |
Pharmaceuticals — 7.2% | | | | | | | | |
AbbVie, Inc. | | | 532,900 | | | | 23,836,617 | |
Eli Lilly & Co. | | | 360,975 | | | | 18,167,872 | |
Johnson & Johnson | | | 124,225 | | | | 10,769,065 | |
Merck & Co., Inc. | | | 1,131,200 | | | | 53,856,432 | |
Pfizer, Inc. | | | 2,099,875 | | | | 60,287,411 | |
| | | | | | | | |
| | | | | | | | 166,917,397 | |
Semiconductors & Semiconductor Equipment — 1.7% | | | | | |
Applied Materials, Inc. | | | 1,759,780 | | | | 30,866,541 | |
Teradyne, Inc. (a) | | | 534,300 | | | | 8,826,636 | |
| | | | | | | | |
| | | | | | | | 39,693,177 | |
Software — 3.2% | | | | | | | | |
Activision Blizzard, Inc. | | | 415,100 | | | | 6,919,717 | |
Microsoft Corp. | | | 386,450 | | | | 12,872,649 | |
Oracle Corp. | | | 1,251,200 | | | | 41,502,304 | |
Symantec Corp. | | | 543,700 | | | | 13,456,575 | |
| | | | | | | | |
| | | | | | | | 74,751,245 | |
Specialty Retail — 4.7% | | | | | | | | |
Lowe’s Cos., Inc. | | | 1,283,800 | | | | 61,121,718 | |
Ross Stores, Inc. | | | 636,900 | | | | 46,366,320 | |
| | | | | | | | |
| | | | | | | | 107,488,038 | |
| | | | | | | | |
| Common Stocks | | Shares | | | Value | |
Tobacco — 0.1% | | | | | | | | |
Philip Morris International, Inc. | | | 26,675 | | | $ | 2,309,788 | |
Trading Companies & Distributors — 0.2% | | | | | |
MRC Global, Inc. (a)(b) | | | 192,600 | | | | 5,161,680 | |
Total Long-Term Investments (Cost — $1,730,999,815) — 97.8% | | | | 2,257,752,432 | |
| | | | | | | | |
| Short-Term Securities | | | | | | |
BlackRock Liquidity Funds, TempFund, Institutional Class, 0.03% (c)(d) | | | 47,573,194 | | | | 47,573,194 | |
| | |
| | | Beneficial Interest (000) | | | | |
BlackRock Liquidity Series, LLC, Money Market Series, 0.17% (c)(d)(e) | | $ | 18,692 | | | | 18,691,623 | |
Total Short-Term Securities (Cost — $66,264,817) — 2.9% | | | | 66,264,817 | |
Total Investments (Cost — $1,797,264,632*) — 100.7% | | | | 2,324,017,249 | |
Liabilities in Excess of Other Assets — (0.7)% | | | | (15,120,854 | ) |
| | | | | | | | |
Net Assets — 100.0% | | | $ | 2,308,896,395 | |
| | | | | | | | |
| | | | | | | | | |
|
| Notes to Schedule of Investments |
| * | As of September 30, 2013, gross unrealized appreciation and gross unrealized depreciation based on cost for federal income tax purposes were as follows: |
| | | | |
Tax cost | | $ | 1,800,103,762 | |
| | | | |
Gross unrealized appreciation | | $ | 546,562,116 | |
Gross unrealized depreciation | | | (22,648,629 | ) |
| | | | |
Net unrealized appreciation | | $ | 523,913,487 | |
| | | | |
| (a) | Non-income producing security. |
| (b) | Security, or a portion of security, is on loan. |
| (c) | Investments in issuers considered to be an affiliate of the Portfolio during the year ended September 30, 2013, for purposes of Section 2(a)(3) of the Investment Company Act of 1940, as amended, were as follows: |
| | | | | | | | | | | | | | | | |
| Affiliate | | Shares/Beneficial
Interest Held at
September 30, 2012 | | | Net
Activity | | | Shares/Beneficial
Interest Held at
September 30, 2013 | | | Income | |
BlackRock Liquidity Funds, TempFund, Institutional Class | | | 40,033,302 | | | | 7,539,892 | | | | 47,573,194 | | | $ | 22,452 | |
BlackRock Liquidity Series, LLC, Money Market Series | | $ | 22,802,709 | | | $ | (4,111,086 | ) | | $ | 18,691,623 | | | $ | 24,091 | |
| (d) | Represents the current yield as of report date. |
| (e) | Security was purchased with the cash collateral from loaned securities. The Portfolio may withdraw up to 25% of its investment daily, although the manager of the BlackRock Liquidity Series, LLC, Money Market Series, in its sole discretion, may permit an investor to withdraw more than 25% on any one day. |
| Ÿ | | For Portfolio compliance purposes, the Portfolio’s industry classifications refer to any one or more of the industry sub-classifications used by one or more widely recognized market indexes or ratings group indexes, and/or as defined by Portfolio management. These definitions may not apply for purposes of this report, which may combine such industry sub-classifications for reporting ease. |
See Notes to Financial Statements.
| | | | | | |
| | | BLACKROCK BALANCED CAPITAL FUND, INC. | | SEPTEMBER 30, 2013 | | 21 |
| | | | |
| Schedule of Investments (concluded) | | | Master Large Cap Core Portfolio | |
| Ÿ | | Fair Value Measurements — Various inputs are used in determining the fair value of investments. These inputs to valuation techniques are categorized into a disclosure hierarchy consisting of three broad levels for financial statement purposes as follows: |
| | Ÿ | | Level 1 — unadjusted price quotations in active markets/exchanges for identical assets or liabilities that the Portfolio has the ability to access |
| | Ÿ | | Level 2 — other observable inputs (including, but not limited to, quoted prices for similar assets or liabilities in markets that are active, quoted prices for identical or similar assets or liabilities in markets that are not active, inputs other than quoted prices that are observable for the assets or liabilities (such as interest rates, yield curves, volatilities, prepayment speeds, loss severities, credit risks and default rates) or other market–corroborated inputs) |
| | Ÿ | | Level 3 — unobservable inputs based on the best information available in the circumstances, to the extent observable inputs are not available (including the Portfolio’s own assumptions used in determining the fair value of investments) |
The hierarchy gives the highest priority to unadjusted quoted prices in active markets for identical assets or liabilities (Level 1 measurements) and the lowest priority to unobservable inputs (Level 3 measurements). Accordingly, the degree of judgment exercised in determining fair value is greatest for instruments categorized in Level 3. The inputs used to measure fair value may fall into different levels of the fair value hierarchy. In such cases, for disclosure purposes, the fair value hierarchy classification is determined based on the lowest level input that is significant to the fair value measurement in its entirety.
Changes in valuation techniques may result in transfers into or out of an assigned level within the disclosure hierarchy. In accordance with the Portfolio’s policy, transfers between different levels of the fair value disclosure hierarchy are deemed to have occurred as of the beginning of the reporting period. The categorization of a value determined for investments is based on the pricing transparency of the investment and is not necessarily an indication of the risks associated with investing in those securities. For information about the Portfolio’s policy regarding valuation of investments, please refer to Note 2 of the Notes to Financial Statements.
The following table summarizes the Portfolio’s investments categorized in the disclosure hierarchy as of September 30, 2013:
| | | | | | | | | | | | | | | | |
| | | Level 1 | | | Level 2 | | | Level 3 | | | Total | |
Assets: | | | | | | | | | | | | | | | | |
Investments: | | | | | | | | | | | | | | | | |
Long-Term Investments1 | | $ | 2,257,752,432 | | | | — | | | | — | | | $ | 2,257,752,432 | |
Short-Term Securities | | | 47,573,194 | | | $ | 18,691,623 | | | | — | | | | 66,264,817 | |
Total | | $ | 2,305,325,626 | | | $ | 18,691,623 | | | | — | | | $ | 2,324,017,249 | |
| | | | |
1 See above Schedule of Investments for values in each industry. | | | | | | | | | | | | | | | | |
|
| Certain of the Portfolio’s liabilities are held at carrying amount, which approximates fair value for financial statement purposes. As of September 30, 2013, such liabilities are categorized within the disclosure hierarchy as follows: | |
| | | | | | | | | | | | | | | | |
| | | Level 1 | | | Level 2 | | | Level 3 | | | Total | |
Liabilities: | | | | | | | | | | | | | | | | |
Collateral on securities loaned at value | | | — | | | $ | (18,691,623 | ) | | | — | | | $ | (18,691,623 | ) |
Bank overdraft | | | — | | | | (117,784 | ) | | | — | | | | (117,784 | ) |
Total | | | — | | | $ | (18,809,407 | ) | | | — | | | $ | (18,809,407 | ) |
| | | | |
There were no transfers between levels during the year ended September 30, 2013.
See Notes to Financial Statements.
| | | | | | |
| 22 | | BLACKROCK BALANCED CAPITAL FUND, INC. | | SEPTEMBER 30, 2013 | | |
| | | | |
| Statement of Assets and Liabilities | | | Master Large Cap Core Portfolio | |
| | | | |
| September 30, 2013 | | | |
| | | | |
| Assets | | | | |
Investments at value — unaffiliated1,2 | | $ | 2,257,752,432 | |
Investments at value — affiliated3 | | | 66,264,817 | |
Investments sold receivable | | | 13,282,024 | |
Contributions receivable from investors | | | 1,740,606 | |
Dividends receivable | | | 2,515,877 | |
Securities lending income receivable — affiliated | | | 2,238 | |
Prepaid expenses | | | 18,157 | |
| | | | |
Total assets | | | 2,341,576,151 | |
| | | | |
| | | | |
| Liabilities | | | | |
Bank overdraft | | | 117,784 | |
Collateral on securities loaned at value | | | 18,691,623 | |
Investments purchased payable | | | 10,062,851 | |
Withdrawals payable to investors | | | 2,779,472 | |
Investment advisory fees payable | | | 895,362 | |
Directors’ fees payable | | | 17,221 | |
Other affiliates payable | | | 5,957 | |
Other accrued expenses payable | | | 109,486 | |
| | | | |
Total liabilities | | | 32,679,756 | |
| | | | |
Net Assets | | $ | 2,308,896,395 | |
| | | | |
| | | | |
| Net Assets Consist of | | | | |
Investors’ capital | | $ | 1,782,143,778 | |
Net unrealized appreciation/depreciation | | | 526,752,617 | |
| | | | |
Net Assets | | $ | 2,308,896,395 | |
| | | | |
1 Investments at cost — unaffiliated | | $ | 1,730,999,815 | |
2 Securities loaned at value | | $ | 17,968,618 | |
3 Investments at cost — affiliated | | $ | 66,264,817 | |
See Notes to Financial Statements.
| | | | | | |
| | | BLACKROCK BALANCED CAPITAL FUND, INC. | | SEPTEMBER 30, 2013 | | 23 |
| | | | |
| Statement of Operations | | | Master Large Cap Core Portfolio | |
| | | | |
| Year Ended September 30, 2013 | | | |
| | | | |
| Investment Income | | | | |
Dividends — unaffiliated | | $ | 40,993,765 | |
Foreign taxes withheld | | | (131,490 | ) |
Securities lending — affiliated | | | 24,091 | |
Dividends — affiliated | | | 22,452 | |
| | | | |
Total income | | | 40,908,818 | |
| | | | |
| | | | |
| Expenses | | | | |
Investment advisory | | | 10,773,589 | |
Accounting services | | | 385,897 | |
Custodian | | | 77,818 | |
Directors | | | 73,178 | |
Professional | | | 70,113 | |
Printing | | | 12,630 | |
Miscellaneous | | | 29,483 | |
| | | | |
Total expenses | | | 11,422,708 | |
Less fees waived by Manager | | | (19,256 | ) |
| | | | |
Total expenses after fees waived | | | 11,403,452 | |
| | | | |
Net investment income | | | 29,505,366 | |
| | | | |
| | | | |
| Realized and Unrealized Gain (Loss) | | | | |
Net realized gain (loss) from: | | | | |
Investments | | | 284,666,969 | |
Foreign currency transactions | | | (18,284 | ) |
| | | | |
| | | 284,648,685 | |
| | | | |
Net change in unrealized appreciation/depreciation on investments | | | 106,688,133 | |
| | | | |
Total realized and unrealized gain | | | 391,336,818 | |
| | | | |
Net Increase in Net Assets Resulting from Operations | | $ | 420,842,184 | |
| | | | |
See Notes to Financial Statements.
| | | | | | |
| 24 | | BLACKROCK BALANCED CAPITAL FUND, INC. | | SEPTEMBER 30, 2013 | | |
| | | | |
| Statements of Changes in Net Assets | | | Master Large Cap Core Portfolio | |
| | | | | | | | |
| | | Year Ended September 30, | |
| Increase (Decrease) in Net Assets: | | 2013 | | | 2012 | |
| | | | | | | | |
| Operations | | | | | | | | |
Net investment income | | $ | 29,505,366 | | | $ | 40,780,497 | |
Net realized gain | | | 284,648,685 | | | | 115,001,657 | |
Net change in unrealized appreciation/depreciation | | | 106,688,133 | | | | 492,381,340 | |
| | | | |
Net increase in net assets resulting from operations | | | 420,842,184 | | | | 648,163,494 | |
| | | | |
| | | | | | | | |
| Capital Share Transactions | | | | | | | | |
Proceeds from contributions | | | 204,778,111 | | | | 328,459,593 | |
Value of withdrawals | | | (635,574,653 | ) | | | (964,485,911 | ) |
| | | | |
Net decrease in net assets derived from capital share transactions | | | (430,796,542 | ) | | | (636,026,318 | ) |
| | | | |
| | | | | | | | |
| Net Assets | | | | | | | | |
Total increase (decrease) in net assets | | | (9,954,358 | ) | | | 12,137,176 | |
Beginning of year | | | 2,318,850,753 | | | | 2,306,713,577 | |
| | | | |
End of year | | $ | 2,308,896,395 | | | $ | 2,318,850,753 | |
| | | | |
See Notes to Financial Statements.
| | | | | | |
| | | BLACKROCK BALANCED CAPITAL FUND, INC. | | SEPTEMBER 30, 2013 | | 25 |
| | | | |
| Financial Highlights | | | Master Large Cap Core Portfolio | |
| | | | | | | | | | | | | | | | | | | | | | | | |
| | | Year Ended September 30, | | | Period
November 1,
2008 to
September 30,
2009 | | | Year Ended
October 31,
2008 | |
| | | 2013 | | | 2012 | | | 2011 | | | 2010 | | | |
| | | | | | | | | | | | | | | | | | | | | | | | |
| Total Investment Return | | | | | | | | | | | | | | | | | | | | | | | | |
Total investment return | | | 20.39 | % | | | 29.97 | % | | | (1.61 | )% | | | 6.16 | % | | | 12.63 | %1,2 | | | (38.84 | )% |
| | | | |
| | | | | | | | | | | | | | | | | | | | | | | | |
| Ratios to Average Net Assets | | | | | | | | | | | | | | | | | | | | | | | | |
Total expenses | | | 0.50 | % | | | 0.50 | % | | | 0.49 | % | | | 0.49 | % | | | 0.50 | %3 | | | 0.50 | % |
| | | | |
Net investment income | | | 1.29 | % | | | 1.67 | % | | | 1.13 | % | | | 1.11 | % | | | 1.56 | %3 | | | 0.93 | % |
| | | | |
| | | | | | | | | | | | | | | | | | | | | | | | |
| Supplemental Data | | | | | | | | | | | | | | | | | | | | | | | | |
Net assets, end of period (000) | | $ | 2,308,896 | | | $ | 2,318,851 | | | $ | 2,306,714 | | | $ | 3,209,486 | | | $ | 3,946,322 | | | $ | 2,843,515 | |
| | | | |
Portfolio turnover | | | 50 | % | | | 128 | % | | | 129 | % | | | 173 | % | | | 168 | % | | | 109 | % |
| | | | |
| | 1 | Includes proceeds received from a settlement of litigation, which impacted the Portfolio’s total investment return. Not including these proceeds, the Portfolio’s total investment return would have been 12.39%. |
| | 2 | Aggregate total investment return. |
See Notes to Financial Statements.
| | | | | | |
| 26 | | BLACKROCK BALANCED CAPITAL FUND, INC. | | SEPTEMBER 30, 2013 | | |
| | | | |
| Notes to Financial Statements | | | Master Large Cap Core Portfolio | |
1. Organization:
Master Large Cap Core Portfolio (the “Portfolio”) is a series of Master Large Cap Series LLC (the “Master LLC”). The Master LLC is registered under the Investment Company Act of 1940, as amended (the “1940 Act”), as an open-end management investment company and is organized as a Delaware limited liability company. The Portfolio is classified as diversified. The Limited Liability Company Agreement of the Master LLC permits the Board of Directors of the Master LLC (the “Board”) to issue non-transferable interests in the Master LLC, subject to certain limitations.
2. Significant Accounting Policies:
The Portfolio’s financial statements are prepared in conformity with accounting principles generally accepted in the United States of America (“US GAAP”), which may require management to make estimates and assumptions that affect the reported amounts of assets and liabilities in the financial statements and the reported amount of increases and decreases in net assets from operations during the reporting period. Actual results could differ from those estimates. The following is a summary of significant accounting policies followed by the Portfolio:
Valuation: US GAAP defines fair value as the price the Portfolio would receive to sell an asset or pay to transfer a liability in an orderly transaction between market participants at the measurement date. The Portfolio determines the fair value of its financial instruments at market value using independent dealers or pricing services under policies approved by the Board. The BlackRock Global Valuation Methodologies Committee (the “Global Valuation Committee”) is the committee formed by management to develop global pricing policies and procedures and to provide oversight of the pricing function for the Portfolio for all financial instruments.
Equity investments traded on a recognized securities exchange or the NASDAQ Stock Market (“NASDAQ”) are valued at the last reported sale price that day or the NASDAQ official closing price, if applicable. For equity investments traded on more than one exchange, the last reported sale price on the exchange where the stock is primarily traded is used. Equity investments traded on a recognized exchange for which there were no sales on that day are valued at the last available bid (long positions) or ask (short positions) price. Investments in open-end registered investment companies are valued at NAV each business day. Short-term securities with remaining maturities of 60 days or less may be valued at amortized cost, which approximates fair value.
The Portfolio values its investment in BlackRock Liquidity Series, LLC, Money Market Series (the “Money Market Series”) at fair value, which is ordinarily based upon its pro rata ownership in the underlying fund’s net assets. The Money Market Series seeks current income consistent with maintaining liquidity and preserving capital. Although the Money Market Series is not registered under the 1940 Act, its investments will follow the parameters of investments by a money market fund that is subject to Rule 2a-7 under the 1940 Act. The Portfolio may withdraw up to 25% of its investment daily, although the manager of the Money Market Series, in its sole discretion, may permit an investor to withdraw more than 25% on any one day.
In the event that application of these methods of valuation results in a price for an investment which is deemed not to be representative of the market value of such investment or if a price is not available, the investment will be valued by the Global Valuation Committee, or its delegate, in accordance with a policy approved by the Board as reflecting fair value (“Fair Value Assets”). When determining the price for Fair Value Assets, the Global Valuation Committee, or its delegate, seeks to determine the price that the Portfolio might reasonably expect to receive from the current sale of that asset in an arm’s-length transaction. Fair value determinations shall be based upon all available factors that the Global Valuation Committee, or its delegate, deem relevant consistent with the principles of fair value measurement, which include the market approach, income approach and/or in the case of recent investments, the cost approach, as appropriate. The market approach generally consists of using comparable market transactions. The income approach generally is used to discount future cash flows to present value and adjusted for liquidity as appropriate. These factors include but are not limited to (i) attributes specific to the investment or asset; (ii) the principal market for the investment or asset; (iii) the customary participants in the principal market for the investment or asset; (iv) data assumptions by market participants for the investment or asset, if reasonably available; (v) quoted prices for similar investments or assets in active markets; and (vi) other factors, such as future cash flows, interest rates, yield curves, volatilities, prepayment speeds, loss severities, credit risks, recovery rates, liquidation amounts and/or default rates. Due to the inherent uncertainty of valuations of such investments, the fair values may differ from the values that would have been used had an active market existed. The Global Valuation Committee, or its delegate, employs various methods for calibrating valuation approaches for investments where an active market does not exist including regular due diligence of the Portfolio’s pricing vendors, regular reviews of key inputs and assumptions, transactional back-testing or disposition analysis to compare unrealized gains and losses to realized gains and losses, reviews of missing or stale prices and large movements in market values and reviews of any market related activity. The pricing of all Fair Value Assets is subsequently reported to the Board or a committee thereof on a quarterly basis.
Foreign Currency: The Portfolio’s books and records are maintained in US dollars. Purchases and sales of investment securities are recorded at the rates of exchange prevailing on the respective date of such transactions. Generally, when the US dollar rises in value against a foreign currency, the Portfolio’s investments denominated in that currency will lose value because that currency is worth fewer US dollars; the opposite effect occurs if the US dollar falls in relative value.
The Portfolio does not isolate the portion of the results of operations arising as a result of changes in the foreign exchange rates from the changes in the market prices of foreign-denominated equity and fixed income investments held for financial reporting purposes. Accordingly, the effects of changes in foreign currency exchange rates on those investments held are not segregated in the Statement of Operations from the effects of changes in market prices and are included as a component of net unrealized gain (loss) from investments. The Portfolio does not isolate the portion of the results of operations arising as a result of changes in the foreign exchange rates from the changes in the market prices upon the sale of foreign-denominated equity investments for
| | | | | | |
| | | BLACKROCK BALANCED CAPITAL FUND, INC. | | SEPTEMBER 30, 2013 | | 27 |
| | | | |
| Notes to Financial Statements (continued) | | | Master Large Cap Core Portfolio | |
financial reporting purposes and are included as a component of net realized gain (loss) from investments. However, the Portfolio does isolate the effect of fluctuations in foreign exchange rates when determining the realized gain (loss) upon the sale or maturity of foreign-denominated fixed income investments and are categorized as net realized gain (loss) from foreign currency transactions for financial reporting which may be treated as ordinary income for federal income tax purposes.
Segregation and Collateralization: In cases in which the 1940 Act and the interpretive positions of the Securities and Exchange Commission (“SEC”) require that the Portfolio either deliver collateral or segregate assets in connection with certain investments (e.g., foreign currency exchange contracts), the Portfolio will, consistent with SEC rules and/or certain interpretive letters issued by the SEC, segregate collateral or designate on its books and records cash or liquid securities having a market value at least equal to the amount that would otherwise be required to be physically segregated. Furthermore, based on requirements and agreements with certain exchanges and third party broker-dealers, a Portfolio engaging in such transactions may have requirements to deliver/deposit securities to/with an exchange or broker-dealer as collateral for certain investments.
Investment Transactions and Investment Income: For financial reporting purposes, investment transactions are recorded on the dates the transactions are entered into (the trade dates). Realized gains and losses on investment transactions are determined on the identified cost basis. Dividend income is recorded on the ex-dividend dates. Dividends from foreign securities where the ex-dividend date may have passed are subsequently recorded when the Portfolio is informed of the ex-dividend date. Under the applicable foreign tax laws, a withholding tax at various rates may be imposed on capital gains, dividends and interest. Upon notification from issuers, some of the dividend income received from a real estate investment trust may be redesignated as a reduction of cost of the related investment and/or realized gain.
Income Taxes: The Portfolio is classified as a partnership for federal income tax purposes. As such, each investor in the Portfolio is treated as the owner of its proportionate share of net assets, income, expenses and realized and unrealized gains and losses of the Portfolio. Therefore, no federal income tax provision is required. It is intended that the Portfolio’s assets will be managed so an investor in the Portfolio can satisfy the requirements of Subchapter M of the Internal Revenue Code of 1986, as amended.
The Portfolio files US federal and various state and local tax returns. No income tax returns are currently are currently under examination. The statute of limitations on the Portfolio’s US federal tax returns remains open for each of the four years ended September 30, 2013. The statutes of limitations on the Portfolio’s state and local tax returns may remain open for an additional year depending upon the jurisdiction. Management does not believe there are any uncertain tax positions that require recognition of a tax liability.
Recent Accounting Standards: In December 2011, the Financial Accounting Standards Board (the “FASB”) issued guidance that will expand current disclosure requirements on the offsetting of certain
assets and liabilities. The new disclosures will be required for investments and derivative financial instruments subject to master netting or similar agreements, which are eligible for offset in the Statement of Assets and Liabilities and will require an entity to disclose both gross and net information about such investments and transactions in the financial statements. In January 2013, the FASB issued guidance that clarifies which investments and transactions are subject to the offsetting disclosure requirements. The scope of the disclosure requirements for offsetting will be limited to derivative instruments, repurchase agreements and reverse repurchase agreements, and securities borrowing and securities lending transactions. The guidance is effective for financial statements with fiscal years beginning on or after January 1, 2013, and interim periods within those fiscal years. Management is evaluating the impact, if any, of this guidance on the Portfolio’s financial statement disclosures.
Other: Expenses directly related to the Portfolio are charged to the Portfolio. Other operating expenses shared by several funds are pro rated among those funds on the basis of relative net assets or other appropriate methods.
The Portfolio has an arrangement with the custodian whereby fees may be reduced by credits earned on uninvested cash balances, which, if applicable, are shown as fees paid indirectly in the Statement of Operations. The custodian imposes fees on overdrawn cash balances, which can be offset by accumulated credits earned or may result in additional custody charges.
3. Securities and Other Investments:
Securities Lending: The Portfolio may lend securities to approved borrowers, such as banks, brokers and other financial institutions. The borrower pledges cash, securities issued or guaranteed by the US government or irrevocable letters of credit issued by a bank as collateral. The initial collateral received by the Portfolio should have a value of at least 102% of the current value of the loaned securities for securities traded on US exchanges and a value of at least 105% for all other securities. The collateral is maintained thereafter in an amount equal to at least 100% of the current market value of the loaned securities. The market value of the loaned securities is determined at the close of business of the Portfolio and any additional required collateral is delivered to the Portfolio on the next business day. Securities lending income, as disclosed in the Statement of Operations, represents the income earned from the investment of the cash collateral, net of rebates paid to, or fees paid by, borrowers and less the fees paid to the securities lending agent. During the term of the loan, the Portfolio earns dividend or interest income on the securities loaned but does not receive interest income on the securities received as collateral. Loans of securities are terminable at any time and the borrower, after notice, is required to return borrowed securities within the standard time period for settlement of securities transactions.
The market value of securities on loan and the value of the related collateral are shown separately in the Statement of Assets and Liabilities as a component of investments at value, and collateral on securities loaned
| | | | | | |
| 28 | | BLACKROCK BALANCED CAPITAL FUND, INC. | | SEPTEMBER 30, 2013 | | |
| | | | |
| Notes to Financial Statements (continued) | | | Master Large Cap Core Portfolio | |
at value, respectively. The cash collateral invested by the securities lending agent, BlackRock Investment Management, LLC (“BIM”), if any, is disclosed in the Schedule of Investments.
Securities lending transactions are entered into by the Portfolio under Master Securities Lending Agreements (“MSLA”) which provide the right, in the event of default (including bankruptcy or insolvency) for the non-defaulting party to liquidate the collateral and calculate a net exposure to the defaulting party or request additional collateral. In the event that a borrower defaults, the Portfolio, as lender, would offset the market value of the collateral received against the market value of the securities loaned. The value of the collateral is typically greater than that of the market value of the securities loaned, leaving the lender with a net amount payable to the defaulting party. However, bankruptcy or insolvency laws of a particular jurisdiction may impose restrictions on or prohibitions against such a right of offset in the event of a MSLA counterparty’s bankruptcy or insolvency. Under the MSLA, the borrower can resell or re-pledge the loaned securities, and the Portfolio can reinvest cash collateral, or, upon the event of default, resell or re-pledge the collateral.
The risks of securities lending also include the risk that the borrower may not provide additional collateral when required or may not return the securities when due. To mitigate this risk, the Portfolio benefits from a borrower default indemnity provided by BlackRock, Inc. (“BlackRock”). BlackRock’s indemnity allows for full replacement of securities lent. The Portfolio also could suffer a loss if the value of an investment purchased with cash collateral falls below the market value of loaned securities or if the value of an investment purchased with cash collateral falls below the value of the original cash collateral received. During the year ended September 30, 2013, any securities on loan were collateralized by cash.
4. Derivative Financial Instruments:
The Portfolio engages in various portfolio investment strategies using derivative contracts both to increase the returns of the Portfolio and/or to economically hedge, or protect, its exposure to certain risks such as equity risk, interest rate risk and foreign currency exchange rate risk. These contracts may be transacted on an exchange or over-the-counter (“OTC”).
Foreign Currency Exchange Contracts: The Portfolio enters into foreign currency exchange contracts as an economic hedge against either specific transactions or portfolio instruments or to obtain exposure to, or hedge exposure away from, foreign currencies (foreign currency exchange rate risk). A foreign currency exchange contract is an agreement between two parties to buy and sell a currency at a set exchange rate on a future date. Foreign currency exchange contracts, when used by the Portfolio, help to manage the overall exposure to the currencies in which some of the investments held by the Portfolio are denominated. The contract is marked-to-market daily and the change in market value is recorded by the Portfolio as an unrealized gain or loss. When the contract is closed, the Portfolio records a realized gain or loss equal to the difference between the value at the time it was opened and the value at the time it was closed. The use of foreign currency exchange contracts involves the risk that the value of a foreign currency exchange contract
changes unfavorably due to movements in the value of the referenced foreign currencies.
The following is a summary of the Portfolio’s derivative financial instruments categorized by risk exposure:
| | | | |
The Effect of Derivative Financial Instruments in the Statement of Operations
Year Ended September 30, 2013 | |
| | | Net Realized Gain (Loss) From | |
Foreign currency exchange contracts: | | | | |
Foreign currency exchange contracts | | $ | (18,284 | ) |
| | | | |
For the year ended September 30, 2013, the average quarterly balances of outstanding derivative instruments were as follows:
| | | | |
Foreign currency exchange contracts: | |
Average number of contracts - US dollars purchased | | | 1 | 1 |
Average US dollar amounts purchased | | $ | 134,532 | |
| | 1 | Actual contract amount shown due to limited activity. |
Counterparty Credit Risk: A derivative contract may suffer a mark to market loss if the value of the contract decreases due to an unfavorable change in the market rates or values of the underlying instrument. Losses can also occur if the counterparty does not perform under the contract.
With exchange traded futures, there is less counterparty credit risk to the Portfolio since the exchange or clearinghouse, as counterparty to such instruments, guarantees against a possible default. The clearinghouse stands between the buyer and the seller of the contract; therefore, the credit risk is limited to failure of the clearinghouse. Credit risk exists in exchange traded futures with respect to initial and variation margin that is held in a clearing broker’s customer accounts. While clearing brokers are required to segregate customer margin from their own assets, in the event that a clearing broker becomes insolvent or goes into bankruptcy and at that time there is a shortfall in the aggregate amount of margin held by the clearing broker for all its clients, typically the shortfall would be allocated on a pro rata basis across all the clearing broker’s customers, potentially resulting in losses to the Portfolio.
In order to better define its contractual rights and to secure rights that will help the Portfolio mitigate its counterparty risk, the Portfolio may enter into an International Swaps and Derivatives Association, Inc. Master Agreement (“ISDA Master Agreement”) or similar agreement with its derivative contract counterparties. An ISDA Master Agreement is a bilateral agreement between the Portfolio and a counterparty that governs OTC derivatives and foreign exchange contracts and typically contains, among other things, collateral posting terms and netting provisions in the event of a default and/or termination event. Under an ISDA Master Agreement, the Portfolio may, under certain circumstances, offset with the counterparty certain derivative financial instruments’ payables and/or receivables with collateral held and/or posted and create one single net payment. The provisions of the ISDA Master Agreement typically permit a single net payment in the event of default including the bankruptcy or insolvency of the counterparty. However, bankruptcy or insolvency laws of a particular jurisdiction may impose restrictions on or prohibitions against the right of offset in bankruptcy, insolvency or other events. In addition, certain ISDA Master Agreements allow
| | | | | | |
| | | BLACKROCK BALANCED CAPITAL FUND, INC. | | SEPTEMBER 30, 2013 | | 29 |
| | | | |
| Notes to Financial Statements (continued) | | | Master Large Cap Core Portfolio | |
counterparties to OTC derivatives to terminate derivative contracts prior to maturity in the event the Portfolio’s net assets decline by a stated percentage or the Portfolio fails to meet the terms of its ISDA Master Agreements, which would cause the Portfolio to accelerate payment of any net liability owed to the counterparty.
5. Investment Advisory Agreement and Other Transactions with Affiliates:
The PNC Financial Services Group, Inc. is the largest stockholder and an affiliate, for 1940 Act purposes, of BlackRock.
The Master LLC, on behalf of the Portfolio, entered into an Investment Advisory Agreement with BlackRock Advisors, LLC (the “Manager”), the Portfolio’s investment advisor, an indirect, wholly owned subsidiary of BlackRock, to provide investment advisory and administration services. The Manager is responsible for the management of the Portfolio and provides the necessary personnel, facilities, equipment and certain other services necessary to the operations of the Portfolio. For such services, the Portfolio pays the Manager a monthly fee based on a percentage of the Portfolio’s average daily net assets at the following annual rates:
| | | | |
| Average Daily Net Assets | | Rate | |
Not exceeding $1 Billion | | | 0.50 | % |
In excess of $1 Billion, but not exceeding $5 Billion | | | 0.45 | % |
In excess of $5 Billion | | | 0.40 | % |
The Manager voluntarily agreed to waive its investment advisory fees by the amount of investment advisory fees the Portfolio pays to the Manager indirectly through its investment in affiliated money market funds. However, the Manager does not waive its investment advisory fees by the amount of investment advisory fees paid in connection with the Portfolio’s investment in other affiliated investment companies, if any. For the year ended September 30, 2013, $19,256 is shown as fees waived by Manager in the Statement of Operations.
The Manager entered into a sub-advisory agreement with BIM, an affiliate of the Manager. The Manager pays BIM, for services it provides, a monthly fee that is a percentage of the investment advisory fees paid by the Portfolio to the Manager.
For the year ended September 30, 2013, the Portfolio reimbursed the Manager $21,936 for certain accounting services, which is included in accounting services in the Statement of Operations.
The Portfolio received an exemptive order from the SEC permitting it, among other things, to pay an affiliated securities lending agent a fee based on a share of the income derived from the securities lending activities and has retained BIM as the securities lending agent. BIM may, on behalf of the Portfolio, invest cash collateral received by the Portfolio for such loans in a private investment company managed by the Manager or in registered money market funds advised by the Manager or its affiliates. The market value of securities on loan and the value of the related collateral, if applicable, is shown in the Statement of Assets and Liabilities as securities loaned at value and collateral on securities loaned at value, respectively. The cash collateral invested by BIM, if any, is disclosed in the Schedule of Investments. Securities lending
income is equal to the total of income earned from the reinvestment of cash collateral, net of rebates paid to, or fees paid by, borrowers of securities. The Portfolio retains 65% of securities lending income and pay a fee to BIM equal to 35% of such income. The Portfolio benefits from a borrower default indemnity provided by BlackRock. As a securities lending agent, BIM bears all operational costs directly related to securities lending as well as the cost of the borrower default indemnification. BIM does not receive any fees for managing cash collateral. The share of income earned by the Portfolio on the reinvestment of cash collateral is shown as securities lending — affiliated — net in the Statement of Operations. For the year ended September 30, 2013, BIM received $9,630 in securities lending agent fees related to securities lending activities for the Portfolio.
Certain officers and/or directors of the Master LLC are officers and/or directors of BlackRock or its affiliates.
6. Purchases and Sales:
Purchases and sales of investments, excluding short-term securities, for the year ended September 30, 2013, were $1,116,175,493 and $1,521,191,468, respectively.
7. Bank Borrowings:
The Master LLC, on behalf of the Portfolio, along with certain other funds managed by the Manager and its affiliates (“Participating Funds”), is a party to a 364-day, $800 million credit agreement with a group of lenders, under which the Portfolio may borrow to fund shareholder redemptions. The agreement expires in April 2014. Excluding commitments designated for a certain individual fund, other Participating Funds, including the Portfolio, can borrow up to an aggregate commitment amount of $500 million, subject to asset coverage and other limitations as specified in the agreement. The credit agreement has the following terms: a fee of 0.065% per annum based on the Portfolio’s pro rata share of the unused commitment amounts and interest at a rate equal to the higher of (a) the one-month LIBOR plus 0.80% per annum or (b) the Fed Funds rate plus 0.80% per annum on amounts borrowed. Participating Funds paid administration and arrangement fees, which, along with commitment fees, were allocated among such funds based upon portions of the aggregate commitment available to them and relative net assets of Participating Funds. The Portfolio did not borrow under the credit agreement during the year ended September 30, 2013.
8. Concentration, Market and Credit Risk:
In the normal course of business, the Portfolio invests in securities and enter into transactions where risks exist due to fluctuations in the market (market risk) or failure of the issuer of a security to meet all its obligations (issuer credit risk). The value of securities held by the Portfolio may decline in response to certain events, including those directly involving the issuers whose securities are owned by the Portfolio; conditions affecting the general economy; overall market changes; local, regional or global political, social or economic instability; and currency and interest rate and price fluctuations. Similar to issuer credit risk, the Portfolio may be exposed to counterparty credit risk, or the risk that an entity with which the Portfolio has unsettled or open transactions may fail to or be unable to perform on its commitments. The Portfolio manages
| | | | | | |
| 30 | | BLACKROCK BALANCED CAPITAL FUND, INC. | | SEPTEMBER 30, 2013 | | |
| | | | |
| Notes to Financial Statements (concluded) | | | Master Large Cap Core Portfolio | |
counterparty credit risk by entering into transactions only with counterparties that they believe have the financial resources to honor their obligations and by monitoring the financial stability of those counterparties. Financial assets, which potentially expose the Portfolio to market, issuer and counterparty credit risks, consist principally of financial instruments and receivables due from counterparties. The extent of the Portfolio’s exposure to market, issuer and counterparty credit risks with respect to these financial assets is generally approximated by its value recorded in the Statement of Assets and Liabilities, less any collateral held by the Portfolio.
As of September 30, 2013, the Portfolio invested a significant portion of its assets in securities in the Information Technology and Financials
sectors. Changes in economic conditions affecting the Information Technology and Financials sectors would have a greater impact on the Portfolio and could affect the value, income and/or liquidity of positions in such securities.
9. Subsequent Events:
Management has evaluated the impact of all subsequent events on the Portfolio through the date the financial statements were issued and has determined that there were no subsequent events requiring adjustment or additional disclosure in the financial statements.
| | | | | | |
| | | BLACKROCK BALANCED CAPITAL FUND, INC. | | SEPTEMBER 30, 2013 | | 31 |
| | | | |
| Report of Independent Registered Public Accounting Firm | | | Master Large Cap Core Portfolio | |
To the Investors of Master Large Cap Core Portfolio and Board of Directors of Master Large Cap Series LLC:
We have audited the accompanying statement of assets and liabilities, including the schedule of investments, of Master Large Cap Core Portfolio, one of the portfolios constituting Master Large Cap Series LLC (the “Master LLC”), as of September 30, 2013, and the related statement of operations for the year then ended, the statement of changes in net assets for each of the two years in the period then ended, and the financial highlights for each of the periods presented. These financial statements and financial highlights are the responsibility of the Master LLC’s management. Our responsibility is to express an opinion on these financial statements and financial highlights based on our audits.
We conducted our audits in accordance with the standards of the Public Company Accounting Oversight Board (United States). Those standards require that we plan and perform the audit to obtain reasonable assurance about whether the financial statements and financial highlights are free of material misstatement. The Master LLC is not required to have, nor were we engaged to perform, an audit of its internal control over financial reporting. Our audits included consideration of internal control over financial reporting as a basis for designing audit procedures that are appropriate in the circumstances, but not for the purpose of expressing an opinion on the effectiveness of the Master LLC’s internal
control over financial reporting. Accordingly, we express no such opinion. An audit also includes examining, on a test basis, evidence supporting the amounts and disclosures in the financial statements, assessing the accounting principles used and significant estimates made by management, as well as evaluating the overall financial statement presentation. Our procedures included confirmation of securities owned as of September 30, 2013, by correspondence with the custodian and brokers; where replies were not received from brokers, we performed other auditing procedures. We believe that our audits provide a reasonable basis for our opinion.
In our opinion, the financial statements and financial highlights referred to above present fairly, in all material respects, the financial position of Master Large Cap Core Portfolio of Master Large Cap Series LLC as of September 30, 2013, the results of its operations for the year then ended, the changes in its net assets for each of the two years in the period then ended, and the financial highlights for each of the of the periods presented, in conformity with accounting principles generally accepted in the United States of America.
Deloitte & Touche LLP
Philadelphia, Pennsylvania
November 26, 2013
| | | | | | |
| 32 | | BLACKROCK BALANCED CAPITAL FUND, INC. | | SEPTEMBER 30, 2013 | | |
| | |
Officers and Directors of Master Large Cap Series LLC | | |
| | | | | | | | | | |
Name, Address, and Year of Birth | | Position(s)
Held with the
Corporation/
Master LLC | | Length of Time
Served as a Director2 | | Principal Occupation(s) During Past 5 Years | | Number of BlackRock-
Advised Registered
Investment Companies
(“RICs”) Consisting of
Investment Portfolios
(“Portfolios”) Overseen | | Public
Directorships |
| Independent Directors1 | | | | | | | | | | |
Ronald W. Forbes 55 East 52nd Street New York, NY 10055 1940 | | Co-Chairman of the Board and Director | | Since 2007 | | Professor Emeritus of Finance, School of Business, State University of New York at Albany since 2000. | | 33 RICs consisting of 109 Portfolios | | None |
Rodney D. Johnson 55 East 52nd Street New York, NY 10055 1941 | | Co-Chairman of the Board and Director | | Since 2007 | | President, Fairmount Capital Advisors, Inc. since 1987; Member of the Archdiocesan Investment Committee of the Archdiocese of Philadelphia from 2004 to 2012; Director, The Committee of Seventy (civic) from 2006 to 2012; Director, Fox Chase Cancer Center from 2004 to 2011. | | 33 RICs consisting of 109 Portfolios | | None |
David O. Beim 55 East 52nd Street New York, NY 10055 1940 | | Director | | Since 2007 | | Professor of Professional Practice at the Columbia University Graduate School of Business since 1991; Trustee, Phillips Exeter Academy from 2002 to 2012; Chairman, Wave Hill, Inc. (public garden and cultural center) from 1990 to 2006. | | 33 RICs consisting of 109 Portfolios | | None |
Dr. Matina S. Horner 55 East 52nd Street New York, NY 10055 1939 | | Director | | Since 2007 | | Executive Vice President of Teachers Insurance and Annuity Association and College Retirement Equities Fund from 1989 to 2003. | | 33 RICs consisting of 109 Portfolios | | NSTAR (electric and gas utility) |
Herbert I. London 55 East 52nd Street New York, NY 10055 1939 | | Director | | Since 1999 | | Professor Emeritus, New York University since 2005; John M. Olin Professor of Humanities, New York University from 1993 to 2005 and Professor thereof from 1980 to 2005; President Emeritus, Hudson Institute (policy research organization) from 2011 to 2012, President thereof from 1997 to 2011 and Trustee from 1980 to 2012; Chairman of the Board of Trustees for Grantham University since 2006; Director, InnoCentive, Inc. since 2005; Director, Cerego, LLC (educational software) since 2005; Director, Cybersettle (online adjudication) since 2009; Director, AIMS Worldwide, Inc. from 2007 to 2012. | | 33 RICs consisting of 109 Portfolios | | None |
Ian A. MacKinnon 55 East 52nd Street New York, NY 10055 1948 | | Director | | Since 2012 | | Director, Kennett Capital, Inc. (investments) since 2006; Director, Free Library of Philadelphia from 1999 to 2008. | | 33 RICs consisting of 109 Portfolios | | None |
Cynthia A. Montgomery 55 East 52nd Street New York, NY 10055 1952 | | Director | | Since 2007 | | Professor, Harvard Business School since 1989; Director, McLean Hospital from 2005 to 2012; Director, Harvard Business School Publishing from 2005 to 2010 | | 33 RICs consisting of 109 Portfolios | | Newell Rubbermaid, Inc. (manufacturing) |
Joseph P. Platt 55 East 52nd Street New York, NY 10055 1947 | | Director | | Since 2007 | | Director, Jones and Brown (Canadian insurance broker) since 1998; Director, The West Penn Allegheny Health System (a not-for-profit health system) since 2008; General Partner, Thorn Partners, LP (private investments) since 1998; Director, WQED Multi-Media (public broadcasting not-for-profit) since 2001; Partner, Amarna Corporation, LLC (private investment company) from 2002 to 2008. | | 33 RICs consisting of 109 Portfolios | | Greenlight Capital Re, Ltd. (reinsurance company) |
Robert C. Robb, Jr. 55 East 52nd Street New York, NY 10055 1945 | | Director | | Since 2007 | | Partner, Lewis, Eckert, Robb and Company (management and financial consulting firm) since 1981. | | 33 RICs consisting of 109 Portfolios | | None |
Toby Rosenblatt 55 East 52nd Street New York, NY 10055 1938 | | Director | | Since 2007 | | President, Founders Investments Ltd. (private investments) since 1999; Director, Forward Management, LLC since 2007; Director, College Access Foundation of California (philanthropic foundation) since 2009; Director, A.P. Pharma, Inc. (specialty pharmaceuticals) from 1983 to 2011; Director, The James Irvine Foundation (philanthropic foundation) from 1998 to 2008. | | 33 RICs consisting of 109 Portfolios | | None |
| | | | | | |
| | | BLACKROCK BALANCED CAPITAL FUND, INC. | | SEPTEMBER 30, 2013 | | 33 |
| | |
| Officers and Directors of Master Large Cap Series LLC (continued) | | |
| | | | | | | | | | |
Name, Address, and Year of Birth | | Position(s)
Held with the
Corporation/
Master LLC | | Length of Time
Served as a Director2 | | Principal Occupation(s) During Past 5 Years | | Number of BlackRock-
Advised Registered
Investment Companies
(“RICs”) Consisting of
Investment Portfolios
(“Portfolios”) Overseen | | Public
Directorships |
| Independent Directors1 (concluded) | | | | | | |
Kenneth L. Urish 55 East 52nd Street New York, NY 10055 1951 | | Director | | Since 2007 | | Managing Partner, Urish Popeck & Co., LLC (certified public accountants and consultants) since 1976; Chairman of the Professional Ethics Committee of the Pennsylvania Institute of Certified Public Accountants since 2010 and Committee Member thereof since 2007; Member of External Advisory Board, The Pennsylvania State University Accounting Department since 2001; Trustee, The Holy Family Institute from 2001 to 2010; President and Trustee, Pittsburgh Catholic Publishing Associates from 2003 to 2008; Director, Inter-Tel from 2006 to 2007. | | 33 RICs consisting of 109 Portfolios | | None |
Frederick W. Winter 55 East 52nd Street New York, NY 10055 1945 | | Director | | Since 2007 | | Professor and Dean Emeritus of the Joseph M. Katz School of Business, University of Pittsburgh since 2005 and Dean thereof from 1997 to 2005; Director, Alkon Corporation (pneumatics) since 1992; Director, Tippman Sports (recreation) since 2005; Director, Indotronix International (IT services) from 2004 to 2008. | | 33 RICs consisting of 109 Portfolios | | None |
| | 1 Directors serve until their resignation, removal or death, or until December 31 of the year in which they turn 72. The Board has approved one-year extensions in terms of Directors who turn 72 prior to December 31, 2013. |
| | 2 Date shown is the earliest date a person has served for the Corporation/Master LLC covered by this annual report. Following the combination of Merrill Lynch Investment Managers, L.P. (“MLIM”) and BlackRock in September 2006, the various legacy MLIM and legacy BlackRock Fund boards were realigned and consolidated into three new fund boards in 2007. As a result, although the chart shows certain Directors as joining the Corporation’s Board in 2007, those Directors first became members of the boards of other legacy MLIM or legacy BlackRock Funds as follows: David O. Beim, 1998; Ronald W. Forbes, 1977; Dr. Matina S. Horner, 2004; Rodney D. Johnson, 1995; Herbert I. London, 1987; Cynthia A. Montgomery, 1994; Joseph P. Platt, 1999; Robert C. Robb, Jr., 1998; Toby Rosenblatt, 2005; Kenneth L. Urish, 1999; and Frederick W. Winter, 1999. |
| Interested Directors3 | | | | | | | | | | |
Paul L. Audet 55 East 52nd Street New York, NY 10055 1953 | | Director | | Since 2011 | | Senior Managing Director of BlackRock and Head of U.S. Mutual Funds since 2011; Chair of the U.S. Mutual Funds Committee reporting to the Global Executive Committee since 2011; Head of BlackRock’s Real Estate business from 2008 to 2011; Member of BlackRock’s Global Operating and Corporate Risk Management Committees and of the BlackRock Alternative Investors Executive Committee and Investment Committee for the Private Equity Fund of Funds business since 2008; Head of BlackRock’s Global Cash Management business from 2005 to 2010; Acting Chief Financial Officer of BlackRock from 2007 to 2008; Chief Financial Officer of BlackRock from 1998 to 2005. | | 155 RICs consisting of 283 Portfolios | | None |
Henry Gabbay 55 East 52nd Street New York, NY 10055 1947 | | Director | | Since 2007 | | Consultant, BlackRock from 2007 to 2008; Managing Director, BlackRock from 1989 to 2007; Chief Administrative Officer, BlackRock Advisors, LLC from 1998 to 2007; President of BlackRock Funds and BlackRock Bond Allocation Target Shares from 2005 to 2007 and Treasurer of certain closed-end funds in the BlackRock fund complex from 1989 to 2006. | | 155 RICs consisting of 283 Portfolios | | None |
| | 3 Mr. Audet is an “interested person,” as defined in the 1940 Act, of the Corporation/Master LLC based on his position with BlackRock and its affiliates. Mr. Gabbay is an “interested person” of the Corporation/Master LLC based on his former positions with BlackRock and its affiliates as well as his ownership of BlackRock and The PNC Financial Services Group, Inc. securities. Mr. Audet and Mr. Gabbay are also Directors of the BlackRock registered closed-end funds and Directors of other BlackRock registered open-end funds. Directors serve until their resignation, removal or death,or until December 31 of the year in which they turn 72. |
| | | | | | |
| 34 | | BLACKROCK BALANCED CAPITAL FUND, INC. | | SEPTEMBER 30, 2013 | | |
| | |
| Officers and Directors of Master Large Cap Series LLC (concluded) | | |
| | | | | | |
Name, Address, and Year of Birth | | Position(s)
Held with the
Corporation/
Master LLC | | Length of Time Served | | Principal Occupation(s) During Past 5 Years |
| Officers1 | | | | | | |
John M. Perlowski 55 East 52nd Street New York, NY 10055 1964 | | President and Chief Executive Officer | | Since 2010 | | Managing Director of BlackRock since 2009; Global Head of BlackRock Fund Services since 2009; Managing Director and Chief Operating Officer of the Global Product Group at Goldman Sachs Asset Management, L.P. from 2003 to 2009; Treasurer of Goldman Sachs Mutual Funds from 2003 to 2009 and Senior Vice President thereof from 2007 to 2009; Director of Goldman Sachs Offshore Funds from 2002 to 2009; Director of Family Resource Network (charitable foundation) since 2009. |
Brendan Kyne 55 East 52nd Street New York, NY 10055 1977 | | Vice President | | Since 2009 | | Managing Director of BlackRock since 2010; Director of BlackRock from 2008 to 2009; Head of Product Development and Management for BlackRock’s U.S. Retail Group since 2009; and Co-head thereof from 2007 to 2009; Vice President of BlackRock from 2005 to 2008. |
Neal Andrews 55 East 52nd Street New York, NY 10055 1966 | | Chief Financial Officer | | Since 2007 | | Managing Director of BlackRock since 2006; Senior Vice President and Line of Business Head of Fund Accounting and Administration at PNC Global Investment Servicing (U.S.) Inc. from 1992 to 2006. |
Jay Fife 55 East 52nd Street New York, NY 10055 1970 | | Treasurer | | Since 2007 | | Managing Director of BlackRock since 2007; Director of BlackRock in 2006; Assistant Treasurer of the MLIM and Fund Asset Management, L.P. advised funds from 2005 to 2006; Director of MLIM Fund Services Group from 2001 to 2006. |
Brian Kindelan 55 East 52nd Street New York, NY 10055 1959 | | Chief Compliance Officer and Anti-Money Laundering Officer | | Since 2007 | | Chief Compliance Officer of the BlackRock-advised funds since 2007; Managing Director and Senior Counsel of BlackRock since 2005. |
Benjamin Archibald 55 East 52nd Street New York, NY 10055 1975 | | Secretary | | Since 2012 | | Director of BlackRock since 2010; Assistant Secretary to the funds from 2010 to 2012; General Counsel and Chief Operating Officer of Uhuru Capital Management from 2009 to 2010; Executive Director and Counsel of Goldman Sachs Asset Management from 2005 to 2009. |
| | 1 Officers of the Corporation/Master LLC serve at the pleasure of the Board. |
| | | Further information about the Officers and Directors is available in the Corporation’s Statement of Additional Information, which can be obtained without charge by calling 1-800-441-7762. |
| | | | | | |
Investment Advisor BlackRock Advisors, LLC Wilmington, DE 19809 | | Sub-Advisor BlackRock Investment Management, LLC Princeton, NJ 08540 | | Custodian Brown Brothers Harriman & Co. Boston, MA 02109 | | Distributor BlackRock Investments, LLC New York, NY 10022 |
| | | | | | |
Accounting Agent and Transfer Agent BNY Mellon Investment Servicing (US) Inc. Wilmington, DE 19809 | | Legal Counsel Sidley Austin LLP New York, NY 10019 | | Independent Registered Public Accounting Firm Deloitte & Touche LLP Philadelphia, PA 19103 | | Address of the Corporation/ Master LLC 100 Bellevue Parkway Wilmington, DE 19809 |
| | | | | | |
| | | BLACKROCK BALANCED CAPITAL FUND, INC. | | SEPTEMBER 30, 2013 | | 35 |
| | | | |
| Master Portfolio Information | | | Master Total Return Portfolio | |
| | |
| Portfolio Composition | | Percent of
Long-Term Investments |
| | | | |
U.S. Government Sponsored Agency Securities | | | 33 | % |
Corporate Bonds | | | 17 | |
U.S. Treasury Obligations | | | 16 | |
Asset-Backed Securities | | | 13 | |
Non-Agency Mortgage-Backed Securities | | | 12 | |
Foreign Government Obligations | | | 5 | |
Floating Rate Loan Interests | | | 2 | |
Preferred Securities | | | 1 | |
Foreign Agency Obligations | | | 1 | |
| | |
| Credit Quality Allocation1 | | Percent of
Long-Term Investments |
| | | | |
AAA/Aaa2 | | | 58 | % |
AA/Aa | | | 5 | |
A | | | 8 | |
BBB/Baa | | | 10 | |
BB/Ba | | | 5 | |
B | | | 3 | |
CCC/Caa | | | 1 | |
Not Rated | | | 10 | |
| 1 | Using the higher of Standard & Poor’s (“S&P’s”) or Moody’s Investor Service ratings. |
| 2 | Includes US Government Sponsored Agency Securities which are deemed AAA/ Aaa by the investment advisor. |
| | | | | | |
| 36 | | BLACKROCK BALANCED CAPITAL FUND, INC. | | SEPTEMBER 30, 2013 | | |
| | | | |
| Consolidated Schedule of Investments September 30, 2013 | | | Master Total Return Portfolio | |
| | | (Percentages shown are based on Net Assets) | |
| | | | | | | | | | | | |
| Asset-Backed Securities | | Par (000) | | | Value | |
ACE Securities Corp. Home Equity Loan Trust: | | | | | | | | | | | | |
Series 2003-OP1, Class A2,
0.90%, 12/25/33 (a) | | | USD | | | | 581 | | | $ | 522,236 | |
Series 2006-CW1, Class A2C,
0.32%, 7/25/36 (a) | | | | | | | 1,496 | | | | 997,261 | |
AmeriCredit Automobile Receivables Trust: | | | | | | | | | | | | |
Series 2011-5, Class C, 3.44%, 10/08/17 | | | | | | | 4,050 | | | | 4,204,021 | |
Series 2012-2, Class C, 2.64%, 10/10/17 | | | | | | | 3,080 | | | | 3,144,067 | |
Series 2012-3, Class C, 2.42%, 5/08/18 | | | | | | | 2,880 | | | | 2,923,131 | |
Series 2012-4, Class B, 1.31%, 11/08/17 | | | | | | | 1,825 | | | | 1,823,927 | |
Series 2012-4, Class C, 1.93%, 8/08/18 | | | | | | | 2,865 | | | | 2,859,110 | |
Series 2012-5, Class C, 1.69%, 11/08/18 | | | | | | | 2,270 | | | | 2,254,845 | |
Series 2013-4, Class B, 1.66%, 9/10/18 | | | | | | | 1,280 | | | | 1,282,372 | |
Series 2013-4, Class C, 2.72%, 9/09/19 | | | | | | | 780 | | | | 788,870 | |
Series 2013-4, Class D, 3.31%, 10/08/19 | | | | | | | 1,830 | | | | 1,836,132 | |
Anchorage Capital CLO Ltd., Series 2013-1A, Class A1, 1.47%, 7/13/25 (a)(b) | | | | | | | 7,350 | | | | 7,307,370 | |
AUTO ABS, Series 2012-2, Class A,
2.80%, 4/27/25 | | | EUR | | | | 4,116 | | | | 5,617,346 | |
Battalion CLO Ltd., Series 2013-4A, Class A1,
1.69%, 10/22/25 (a)(b) | | | USD | | | | 4,715 | | | | 4,703,212 | |
Bear Stearns Asset-Backed Securities I Trust, Series 2006-HE10, Class 21A1,
0.25%, 12/25/36 (a) | | | | | | | 1,069 | | | | 1,049,870 | |
Benefit Street Partners CLO II Ltd., Series 2013-IIA, Class A1, 1.47%, 7/15/24 (a)(b) | | | | | | | 2,090 | | | | 2,064,084 | |
BlueMountain CLO Ltd., Series 2012-2A, Class B1, 2.22%, 11/20/24 (a)(b) | | | | | | | 3,150 | | | | 3,147,480 | |
Capital Auto Receivables Asset Trust, Series 2013-1, Class B, 1.29%, 4/20/18 | | | | | | | 3,660 | | | | 3,607,713 | |
Carlyle Global Market Strategies CLO Ltd., Series 2012-4A, Class A, 1.66%, 1/20/25 (a)(b) | | | | | | | 13,730 | | | | 13,730,000 | |
Cavalry CLO II, Series 2A, Class B1,
2.27%, 1/17/24 (a)(b) | | | | | | | 7,090 | | | | 7,090,000 | |
Chesapeake Funding LLC: | | | | | | | | | | | | |
Series 2012-1A, Class B, 1.78%, 11/07/23 (a)(b) | | | | | | | 2,630 | | | | 2,641,988 | |
Series 2012-1A, Class C, 2.18%, 11/07/23 (a)(b) | | | | | | | 1,690 | | | | 1,697,674 | |
CHLUPA Trust, Series 2013-VM, Class A,
3.33%, 8/15/20 (b) | | | | | | | 7,489 | | | | 7,488,982 | |
CIFC Funding Ltd.: | | | | | | | | | | | | |
Series 2012-3A, Class A1L, 1.64%, 1/29/25 (a)(b) | | | | | | | 5,000 | | | | 4,987,500 | |
Series 2012-3A, Class A2L, 2.51%, 1/29/25 (a)(b) | | | | | | | 4,480 | | | | 4,468,800 | |
| | | | | | | | | | | | |
| Asset-Backed Securities | | Par (000) | | | Value | |
Countrywide Asset-Backed Certificates: | | | | | | | | | | | | |
Series 2003-BC3, Class A2,
0.80%, 9/25/33 (a) | | | USD | | | | 672 | | | $ | 619,126 | |
Series 2004-5, Class A,
1.08%, 10/25/34 (a) | | | | | | | 752 | | | | 737,685 | |
Series 2006-17, Class 2A2,
0.33%, 3/25/47 (a) | | | | | | | 876 | | | | 635,554 | |
Series 2007-12, Class 2A1,
0.53%, 8/25/47 (a) | | | | | | | 2 | | | | 1,866 | |
Credit Acceptance Auto Loan Trust: | | | | | | | | | | | | |
Series 2012-2A, Class A, 1.52%, 3/16/20 (b) | | | | | | | 4,165 | | | | 4,177,466 | |
Series 2013-1A, Class A, 1.21%, 10/15/20 (b) | | | | | | | 2,580 | | | | 2,579,260 | |
CT CDO IV Ltd., Series 2006-4A, Class A1,
0.49%, 10/20/43 (a)(b) | | | | | | | 3,845 | | | | 3,579,490 | |
DT Auto Owner Trust: | | | | | | | | | | | | |
Series 2011-3A, Class C, 4.03%, 2/15/17 (b) | | | | | | | 2,460 | | | | 2,468,325 | |
Series 2012-1A, Class B, 2.26%, 10/16/17 (b) | | | | | | | 1,970 | | | | 1,972,737 | |
Series 2012-1A, Class C, 3.38%, 10/16/17 (b) | | | | | | | 1,780 | | | | 1,789,155 | |
Series 2012-1A, Class D, 4.94%, 7/16/18 (b) | | | | | | | 3,885 | | | | 3,956,857 | |
Series 2012-2A, Class B, 1.85%, 4/17/17 (b) | | | | | | | 530 | | | | 530,784 | |
Series 2012-2A, Class C, 2.72%, 4/17/17 (b) | | | | | | | 200 | | | | 201,584 | |
ECP CLO Ltd., Series 2012-4A, Class A1,
1.60%, 6/19/24 (a)(b) | | | | | | | 4,910 | | | | 4,910,786 | |
Fannie Mae REMIC Trust, Series 2003-W5, Class A,
0.40%, 4/25/33 (a) | | | | | | | 7 | | | | 6,398 | |
Ford Credit Floorplan Master Owner Trust: | | | | | | | | | | | | |
Series 2012-1, Class C, 1.68%, 1/15/16 (a) | | | | | | | 4,380 | | | | 4,392,452 | |
Series 2012-1, Class D, 2.28%, 1/15/16 (a) | | | | | | | 4,100 | | | | 4,114,592 | |
Series 2012-2, Class C, 2.86%, 1/15/19 | | | | | | | 1,030 | | | | 1,059,042 | |
Series 2012-2, Class D, 3.50%, 1/15/19 | | | | | | | 1,820 | | | | 1,882,102 | |
Series 2012-4, Class C, 1.39%, 9/15/16 | | | | | | | 2,125 | | | | 2,132,892 | |
Series 2012-4, Class D, 2.09%, 9/15/16 | | | | | | | 3,710 | | | | 3,731,733 | |
GoldenTree Loan Opportunities VII Ltd., Series 2013-7A, Class A, 1.41%, 4/25/25 (a)(b) | | | | | | | 5,810 | | | | 5,768,168 | |
GSAA Home Equity Trust, Series 2006-5, Class 2A1,
0.25%, 3/25/36 (a) | | | | | | | 28 | | | | 16,338 | |
GT Loan Financing I Ltd., Series 2013-1A, Class A,
1.47%, 10/28/24 (a)(b) | | | | | | | 5,105 | | | | 5,076,412 | |
| | | | |
| Portfolio Abbreviations | | | | |
| To simplify the listings of portfolio holdings in the Consolidated Schedules of Investments, the names and descriptions of many of the securities have been abbreviated according to the following list: | | AUD Australian Dollar BRL Brazilian Real CAD Canadian Dollar CHF Swiss Franc ETF Exchange-Traded Fund EUR Euro EURIBOR Euro Interbank Offered Rate FKA Formerly Known As GBP British Pound INR Indian Rupee JPY Japanese Yen | | LIBOR London Interbank Offered Rate MXN Mexican Peso RB Revenue Bonds RUB Russian Ruble SEK Swedish Krona SPDR Standard & Poor’s Depositary Receipts TBA To-be-announced TRY Turkish Lira USD US Dollar ZAR South African Rand |
See Notes to Consolidated Financial Statements.
| | | | | | |
| | | BLACKROCK BALANCED CAPITAL FUND, INC. | | SEPTEMBER 30, 2013 | | 37 |
| | | | |
| Consolidated Schedule of Investments (continued) | | | Master Total Return Portfolio | |
| | | (Percentages shown are based on Net Assets) | |
| | | | | | | | | | | | |
| Asset-Backed Securities | | Par (000) | | | Value | |
HLSS Servicer Advance Receivables Backed Notes: | | | | | | | | | | | | |
Series 2012-T2, Class A1,
1.34%, 10/15/43 (b) | | | USD | | | | 1,535 | | | $ | 1,535,460 | |
Series 2012-T2, Class A2,
1.99%, 10/15/45 (b) | | | | | | | 3,135 | | | | 3,148,794 | |
Series 2013-T1, Class A2,
1.50%, 5/16/44-1/16/46 (a)(b) | | | | | | | 12,315 | | | | 12,269,657 | |
Series 2013-T1, Class B2,
1.74%, 1/16/46 (a)(b) | | | | | | | 1,000 | | | | 990,300 | |
Series 2013-T3, Class A3,
1.79%, 5/15/46 (b) | | | | | | | 16,230 | | | | 15,971,943 | |
Series 2013-T4, Class AT4,
1.18%, 8/15/44 (b) | | | | | | | 7,545 | | | | 7,540,473 | |
Series 2013-T5, Class AT5,
1.98%, 8/15/46 (b) | | | | | | | 2,895 | | | | 2,906,001 | |
Series 2013-T6, Class AT6,
1.29%, 9/15/44 (b) | | | | | | | 5,610 | | | | 5,610,000 | |
Hyundai Auto Receivables Trust, Series 2012-A, Class D, 2.61%, 5/15/18 | | | | | | | 2,555 | | | | 2,600,737 | |
ING Investment Management CLO Ltd., Series 2012-2A, Class A, 1.80%, 10/15/22 (a)(b) | | | | | | | 2,850 | | | | 2,855,700 | |
JG Wentworth XX LLC, Series 2010-1A, Class A, 5.56%, 7/15/59 (b) | | | | | | | 9,654 | | | | 10,977,730 | |
JG Wentworth XXI LLC, Series 2010-2A, Class A, 4.07%, 1/15/48 (b) | | | | | | | 1,254 | | | | 1,331,059 | |
JG Wentworth XXII LLC, Series 2010-3A, Class A, 3.82%, 12/15/48 (b) | | | | | | | 4,364 | | | | 4,571,441 | |
KKR CLO Trust, Series 2013-1A, Class A1,
1.45%, 7/15/25 (a)(b) | | | | | | | 4,515 | | | | 4,472,785 | |
KKR Financial CLO Corp., Series 2007-AA, Class A,
1.02%, 10/15/17 (a)(b) | | | | | | | 6,466 | | | | 6,425,421 | |
Lehman XS Trust, Series 2007-1, Class 2A1,
5.87%, 2/25/37 (a) | | | | | | | 6,631 | | | | 5,810,210 | |
Morgan Stanley ABS Capital I, Inc., Trust, Series 2005-HE1, Class A2MZ, 0.78%, 12/25/34 (a) | | | | | | | 820 | | | | 754,801 | |
Nationstar Mortgage Advance Receivables Trust: | | | | | | | | | | | | |
Series 2013-T1A, Class A1,
1.08%, 6/20/44 (b) | | | | | | | 9,115 | | | | 9,111,600 | |
Series 2013-T2A, Class A2,
1.68%, 6/20/46 (b) | | | | | | | 12,970 | | | | 12,936,070 | |
Nelnet Student Loan Trust: | | | | | | | | | | | | |
Series 2006-1, Class A5,
0.37%, 8/23/27 (a) | | | | | | | 6,505 | | | | 6,329,150 | |
Series 2008-3, Class A4,
1.91%, 11/25/24 (a) | | | | | | | 5,600 | | | | 5,887,750 | |
New Century Home Equity Loan Trust, Series
2005-2, Class A2MZ, 0.44%, 6/25/35 (a) | | | | | | | 2,543 | | | | 2,533,071 | |
Northwoods Capital Corp./Northwoods Capital Ltd.: | | | | | | | | | | | | |
Series 2012-9A, Class A,
1.69%, 1/18/24 (a)(b) | | | | | | | 4,300 | | | | 4,300,000 | |
Series 2012-9A, Class B1,
2.52%, 1/18/24 (a)(b) | | | | | | | 4,090 | | | | 4,090,000 | |
Octagon Investment Partners XVI Ltd., Series 2013-1A, Class A, 1.39%, 7/17/25 (a)(b) | | | | | | | 5,195 | | | | 5,148,245 | |
OHA Loan Funding Ltd., Series 2013-2A, Class A,
1.68%, 8/23/24 (a)(b) | | | | | | | 5,315 | | | | 5,288,425 | |
Option One Mortgage Acceptance Corp. Asset Back Certificates, Series 2003-4, Class A2,
0.82%, 7/25/33 (a) | | | | | | | 1,347 | | | | 1,221,444 | |
OZLM Funding Ltd.: | | | | | | | | | | | | |
Series 2012-2A, Class A1,
1.75%, 10/30/23 (a)(b) | | | | | | | 7,530 | | | | 7,578,945 | |
| | | | | | | | | | | | |
| Asset-Backed Securities | | Par (000) | | | Value | |
Series 2013-4A, Class A1,
1.47%, 7/22/25 (a)(b) | | | USD | | | | 8,895 | | | $ | 8,806,050 | |
PFS Financing Corp., Series 2012-AA, Class A,
1.38%, 2/15/16 (a)(b) | | | | | | | 5,830 | | | | 5,839,765 | |
Prestige Auto Receivables Trust: | | | | | | | | | | | | |
Series 2013-1A, Class A2,
1.09%, 2/15/18 (b) | | | | | | | 4,361 | | | | 4,367,564 | |
Series 2013-1A, Class A3,
1.33%, 5/15/19 (b) | | | | | | | 2,470 | | | | 2,458,418 | |
RAAC Trust, Series 2005-SP2, Class 2A,
0.48%, 6/25/44 (a) | | | | | | | 4,780 | | | | 3,657,224 | |
RASC Trust, Series 2003-KS5, Class AIIB,
0.76%, 7/25/33 (a) | | | | | | | 641 | | | | 521,882 | |
Santander Drive Auto Receivables Trust: | | | | | | | | | | | | |
Series 2011-S1A, Class B,
1.48%, 5/15/17 (b) | | | | | | | 2,008 | | | | 2,013,178 | |
Series 2012-1, Class C, 3.78%,
11/15/17-10/15/19 (b) | | | | | | | 4,510 | | | | 4,580,399 | |
Series 2012-3, Class B,
1.94%, 12/15/16-3/15/18 | | | | | | | 8,705 | | | | 8,756,562 | |
Series 2012-4, Class C, 2.94%, 12/15/17 | | | | | | | 4,600 | | | | 4,690,349 | |
Series 2012-5, Class B, 1.56%, 8/15/18 | | | | | | | 4,090 | | | | 4,124,618 | |
Series 2012-5, Class C, 2.70%, 8/15/18 | | | | | | | 1,950 | | | | 1,962,281 | |
Series 2012-6, Class B,
1.33%, 5/15/17- 3/15/18 | | | | | | | 12,265 | | | | 12,187,283 | |
Series 2012-AA, Class B,
1.21%, 10/16/17 (b) | | | | | | | 9,060 | | | | 9,037,567 | |
Series 2012-AA, Class C,
1.78%, 11/15/18 (b) | | | | | | | 17,345 | | | | 16,973,626 | |
Series 2013-3, Class B, 1.19%, 5/15/18 | | | | | | | 8,000 | | | | 7,898,160 | |
Series 2013-4, Class B, 2.16%, 1/15/20 | | | | | | | 4,610 | | | | 4,689,573 | |
Series 2013-4, Class C, 3.25%, 1/15/20 | | | | | | | 3,890 | | | | 3,950,583 | |
Series 2013-4, Class E, 4.67%, 1/15/20 (b) | | | | | | | 8,250 | | | | 8,246,131 | |
Series 2013-A, Class A2,
0.80%, 10/17/16 (b) | | | | | | | 2,675 | | | | 2,672,325 | |
Series 2013-A, Class B, 1.89%, 10/15/19 (b) | | | | | | | 5,810 | | | | 5,806,514 | |
Series 2013-A, Class C, 3.12%, 10/15/19 (b) | | | | | | | 2,250 | | | | 2,251,125 | |
Series 2012-1, Class B, 2.72%, 5/16/16 | | | | | | | 2,260 | | | | 2,295,168 | |
Series 2012-2, Class C, 3.20%, 2/15/18 | | | | | | | 6,490 | | | | 6,674,913 | |
Series 2012-3, Class C, 3.01%, 4/16/18 | | | | | | | 8,515 | | | | 8,740,179 | |
SASCO Mortgage Loan Trust, Series 2005-GEL2, Class A, 0.46%, 4/25/35 (a) | | | | | | | 357 | | | | 345,514 | |
Scholar Funding Trust, Series 2011-A, Class A,
1.16%, 10/28/43 (a)(b) | | | | | | | 4,092 | | | | 4,069,901 | |
SLC Private Student Loan Trust, Series 2006-A, Class A5, 0.44%, 7/15/36 (a) | | | | | | | 9,515 | | | | 9,245,840 | |
SLM Private Credit Student Loan Trust: | | | | | | | | | | | | |
Series 2004-B, Class A2, 0.45%, 6/15/21 (a) | | | | | | | 4,172 | | | | 4,101,302 | |
Series 2004-B, Class B, 0.72%, 9/15/33 (a) | | | | | | | 597 | | | | 515,323 | |
Series 2005-B, Class A2, 0.43%, 3/15/23 (a) | | | | | | | 3,298 | | | | 3,222,575 | |
SLM Private Education Loan Trust: | | | | | | | | | | | | |
Series 2011-B, Class A2, 3.74%, 2/15/29 (b) | | | | | | | 1,420 | | | | 1,489,995 | |
Series 2011-C, Class A2B,
4.54%, 10/17/44 (b) | | | | | | | 4,120 | | | | 4,497,281 | |
Series 2012-A, Class A1,
1.58%, 8/15/25 (a)(b) | | | | | | | 2,306 | | | | 2,323,560 | |
See Notes to Consolidated Financial Statements.
| | | | | | |
| 38 | | BLACKROCK BALANCED CAPITAL FUND, INC. | | SEPTEMBER 30, 2013 | | |
| | | | |
| Consolidated Schedule of Investments (continued) | | | Master Total Return Portfolio | |
| | | (Percentages shown are based on Net Assets) | |
| | | | | | | | | | | | |
| Asset-Backed Securities | | Par (000) | | | Value | |
Series 2012-A, Class A2,
3.83%, 1/17/45 (b) | | | USD | | | | 7,470 | | | $ | 7,799,673 | |
Series 2012-B, Class A2,
3.48%, 10/15/30 (b) | | | | | | | 730 | | | | 765,086 | |
Series 2012-C, Class A1,
1.28%, 8/15/23 (a)(b) | | | | | | | 6,365 | | | | 6,391,579 | |
Series 2012-C, Class A2,
3.31%, 10/15/46 (b) | | | | | | | 10,125 | | | | 10,511,421 | |
Series 2012-D, Class A2,
2.95%, 2/15/46 (b) | | | | | | | 12,220 | | | | 12,584,694 | |
Series 2012-E, Class A1,
0.93%, 10/16/23 (a)(b) | | | | | | | 4,403 | | | | 4,396,676 | |
Series 2013-A, Class A2A,
1.77%, 5/17/27 (b) | | | | | | | 16,655 | | | | 16,279,030 | |
Series 2013-A, Class A2B,
1.23%, 5/17/27 (a)(b) | | | | | | | 11,170 | | | | 11,040,696 | |
Series 2013-B, Class A1,
0.83%, 7/15/22 (a)(b) | | | | | | | 2,712 | | | | 2,699,862 | |
Series 2013-B, Class A2A,
1.85%, 6/17/30 (b) | | | | | | | 16,210 | | | | 15,670,110 | |
SLM Student Loan Trust: | | | | | | | | | | | | |
Series 2003-11, Class A6,
0.54%, 12/15/25 (a)(b) | | | | | | | 8,430 | | | | 8,416,470 | |
Series 2008-5, Class A4,
1.97%, 7/25/23 (a) | | | | | | | 4,690 | | | | 4,901,439 | |
Series 2013-C, Class A1,
1.03%, 2/15/22 (a)(b) | | | | | | | 8,415 | | | | 8,415,000 | |
Series 2013-C, Class A2A,
2.94%, 10/15/31 (b) | | | | | | | 6,190 | | | | 6,253,819 | |
SpringCastle America Funding LLC, Series 2013-1A, Class A, 3.75%, 4/03/21 (b) | | | | | | | 16,342 | | | | 16,195,536 | |
Structured Asset Securities Corp. Assistance Loan Trust, Series 2003-AL2, Class A,
3.36%, 1/25/31 (b) | | | | | | | 1,047 | | | | 1,026,956 | |
Structured Asset Securities Corp. Mortgage Pass-Through Certificates, Series 2004-23XS, Class 2A1, 0.48%, 1/25/35 (a) | | | | | | | 1,804 | | | | 1,586,213 | |
Vibrant CLO Ltd.: | | | | | | | | | | | | |
Series 2012-1A, Class A1,
1.75%, 7/17/24 (a)(b) | | | | | | | 13,740 | | | | 13,745,496 | |
Series 2012-1A, Class A2,
2.67%, 7/17/24 (a)(b) | | | | | | | 2,600 | | | | 2,607,280 | |
World Financial Network Credit Card Master Trust: | | | | | | | | | | | | |
Series 2012-C, Class A, 2.23%, 8/15/22 | | | | | | | 8,570 | | | | 8,511,210 | |
Series 2012-C, Class B, 3.57%, 8/15/22 | | | | | | | 3,000 | | | | 3,053,718 | |
Series 2012-C, Class C, 4.55%, 8/15/22 | | | | | | | 5,030 | | | | 5,290,086 | |
Series 2012-D, Class A, 2.15%, 4/17/23 | | | | | | | 11,030 | | | | 10,756,246 | |
Series 2012-D, Class B, 3.34%, 4/17/23 | | | | | | | 3,551 | | | | 3,405,576 | |
Series 2012-D, Class M, 3.09%, 4/17/23 | | | | | | | 2,725 | | | | 2,652,597 | |
Total Asset-Backed Securities — 19.8% | | | | | | | | | | | 660,745,204 | |
| | | | | | | | | | | | |
| Common Stocks | | | | | Shares | | | | |
Communications Equipment — 0.0% | | | | | | | | | | | | |
Nokia Oyj | | | | | | | 72,496 | | | | 476,454 | |
| | | | | | | | | | | | |
| Corporate Bonds | | Par (000) | | | | |
Aerospace & Defense — 0.1% | | | | | | | | | | | | |
Meccanica Holdings USA, Inc.: | | | | | | | | | | | | |
6.25%, 7/15/19 (b) | | | USD | | | | 2,254 | | | | 2,321,620 | |
6.25%, 1/15/40 (b) | | | | | | | 2,330 | | | | 1,945,550 | |
| | | | | | | | | | | | |
| | | | | | | | | | | | 4,267,170 | |
| | | | | | | | | | | | |
| Corporate Bonds | | Par (000) | | | Value | |
Air Freight & Logistics — 0.0% | | | | | | | | | | | | |
Deutsche Post AG, 1.50%, 10/09/18 | | | EUR | | | | 100 | | | $ | 134,210 | |
Airlines — 0.0% | | | | | | | | | | | | |
Scandinavian Airlines System Denmark-
Norway- Sweden: | | | | | | | | | | | | |
9.65%, 6/16/14 | | | | | | | 800 | | | | 1,103,944 | |
10.50%, 6/16/14 | | | SEK | | | | 1,000 | | | | 161,436 | |
| | | | | | | | | | | | |
| | | | | | | | | | | | 1,265,380 | |
Auto Components — 0.3% | | | | | | | | | | | | |
Continental Rubber of America Corp.,
4.50%, 9/15/19 (b) | | | USD | | | | 3,140 | | | | 3,275,020 | |
GKN Holdings PLC, 5.38%, 9/19/22 | | | GBP | | | | 1,530 | | | | 2,565,209 | |
Plastic Omnium SA, 2.88%, 5/29/20 | | | EUR | | | | 2,000 | | | | 2,576,937 | |
Servus Luxembourg Holding SCA, 7.75%, 6/15/18 | | | | | | | 1,747 | | | | 2,399,354 | |
Valeo SA, 5.75%, 1/19/17 | | | | | | | 100 | | | | 152,390 | |
| | | | | | | | | | | | |
| | | | | | | | | | | | 10,968,910 | |
Automobiles — 0.2% | | | | | | | | | | | | |
General Motors Co.: | | | | | | | | | | | | |
4.88%, 10/02/23 (b) | | | USD | | | | 2,765 | | | | 2,702,787 | |
6.25%, 10/02/43 (b) | | | | | | | 1,565 | | | | 1,541,525 | |
Jaguar Land Rover Automotive PLC,
8.25%, 3/15/20 | | | GBP | | | | 290 | | | | 521,831 | |
| | | | | | | | | | | | |
| | | | | | | | | | | | 4,766,143 | |
Beverages — 0.1% | | | | | | | | | | | | |
Anheuser-Busch InBev NV, 4.00%, 9/24/25 | | | | | | | 100 | | | | 165,580 | |
Bacardi Ltd., 2.75%, 7/03/23 | | | EUR | | | | 110 | | | | 147,079 | |
Davide Campari-Milano SpA, 4.50%, 10/25/19 | | | | | | | 100 | | | | 142,592 | |
PepsiCo, Inc., 3.60%, 8/13/42 | | | USD | | | | 2,825 | | | | 2,347,654 | |
SABMiller Holdings, Inc., 1.88%, 1/20/20 | | | EUR | | | | 100 | | | | 134,216 | |
| | | | | | | | | | | | |
| | | | | | | | | | | | 2,937,121 | |
Building Products — 0.1% | | | | | | | | | | | | |
Buzzi Unicem SpA, 6.25%, 9/28/18 | | | | | | | 900 | | | | 1,301,882 | |
Lafarge SA, 4.75%, 9/30/20 | | | | | | | 590 | | | | 807,161 | |
| | | | | | | | | | | | |
| | | | | | | | | | | | 2,109,043 | |
Capital Markets — 0.4% | | | | | | | | | | | | |
Credit Suisse AG, 5.75%, 9/18/25 (a) | | | | | | | 100 | | | | 134,717 | |
The Goldman Sachs Group, Inc.: | | | | | | | | | | | | |
4.38%, 3/16/17 | | | | | | | 50 | | | | 73,654 | |
2.63%, 8/19/20 | | | | | | | 65 | | | | 88,043 | |
5.75%, 1/24/22 | | | USD | | | | 2,001 | | | | 2,218,395 | |
3.63%, 1/22/23 | | | | | | | 8,155 | | | | 7,798,284 | |
Morgan Stanley, 3.80%, 4/29/16 | | | | | | | 2,520 | | | | 2,652,363 | |
UBS AG, 4.75%, 5/22/23 (a) | | | | | | | 1,340 | | | | 1,283,050 | |
| | | | | | | | | | | | |
| | | | | | | | | | | | 14,248,506 | |
Chemicals — 0.8% | | | | | | | | | | | | |
Evonik Industries AG, 1.88%, 4/08/20 | | | EUR | | | | 1,035 | | | | 1,382,698 | |
INEOS Finance PLC, 7.50%, 5/01/20 (b) | | | USD | | | | 565 | | | | 605,963 | |
LYB International Finance BV: | | | | | | | | | | | | |
4.00%, 7/15/23 | | | | | | | 1,902 | | | | 1,885,612 | |
5.25%, 7/15/43 | | | | | | | 43 | | | | 42,284 | |
LyondellBasell Industries NV, 5.00%, 4/15/19 | | | | | | | 14,482 | | | | 15,941,004 | |
Momentive Performance Materials, Inc.,
8.88%, 10/15/20 | | | | | | | 2,035 | | | | 2,136,750 | |
Rockwood Specialties Group, Inc.,
4.63%, 10/15/20 | | | | | | | 2,355 | | | | 2,366,775 | |
Tronox Finance LLC, 6.38%, 8/15/20 | | | | | | | 1,083 | | | | 1,072,170 | |
See Notes to Consolidated Financial Statements.
| | | | | | |
| | | BLACKROCK BALANCED CAPITAL FUND, INC. | | SEPTEMBER 30, 2013 | | 39 |
| | | | |
| Consolidated Schedule of Investments (continued) | | | Master Total Return Portfolio | |
| | | (Percentages shown are based on Net Assets) | |
| | | | | | | | | | | | |
| Corporate Bonds | | Par (000) | | | Value | |
Chemicals (concluded) | | | | | | | | | | | | |
US Coatings Acquisition, Inc./Axalta Coating Systems Dutch Holding B BV,
7.38%, 5/01/21 (b) | | | USD | | | | 630 | | | $ | 658,350 | |
| | | | | | | | | | | | |
| | | | | | | | | | | | 26,091,606 | |
Commercial Banks — 1.8% | | | | | | | | | | | | |
Abbey National Treasury Services PLC,
2.63%, 7/16/20 | | | EUR | | | | 1,810 | | | | 2,462,151 | |
ABN AMRO Bank NV: | | | | | | | | | | | | |
3.63%, 10/06/17 | | | | | | | 70 | | | | 102,192 | |
7.13%, 7/06/22 | | | | | | | 200 | | | | 312,077 | |
2.50%, 9/05/23 | | | | | | | 100 | | | | 136,043 | |
2.50%, 11/29/23 | | | | | | | 100 | | | | 129,028 | |
AIB Mortgage Bank, 2.63%, 7/28/17 | | | | | | | 1,260 | | | | 1,732,189 | |
Banca Monte dei Paschi di Siena SpA,
4.88%, 9/15/16 | | | | | | | 1,018 | | | | 1,420,669 | |
Banco Santander SA, 3.25%, 2/17/15 | | | | | | | 2,100 | | | | 2,917,809 | |
Bank of Ireland Mortgage Bank, 3.63%, 10/02/20 | | | | | | | 420 | | | | 572,373 | |
Bankinter SA, 3.88%, 10/30/15 | | | | | | | 1,550 | | | | 2,186,666 | |
Banque Federative du Credit Mutuel SA: | | | | | | | | | | | | |
2.00%, 9/19/19 | | | | | | | 100 | | | | 132,935 | |
2.63%, 2/24/21 | | | | | | | 100 | | | | 135,343 | |
Barclays Bank PLC, 6.63%, 3/30/22 | | | | | | | 930 | | | | 1,441,008 | |
BNP Paribas SA: | | | | | | | | | | | | |
1.38%, 11/21/18 | | | | | | | 74 | | | | 98,047 | |
2.88%, 9/26/23 | | | | | | | 100 | | | | 134,850 | |
BPCE SA, 4.63%, 7/18/23 | | | | | | | 100 | | | | 134,795 | |
BPCE SFH SA, 2.13%, 9/17/20 | | | | | | | 200 | | | | 274,638 | |
CaixaBank SA, 3.13%, 5/14/18 | | | | | | | 1,700 | | | | 2,299,929 | |
Caja Rural de Navarra, Sociedad Cooperativa de Crédito Ltd., 2.88%, 6/11/18 | | | | | | | 1,400 | | | | 1,877,500 | |
Commerzbank AG, 7.75%, 3/16/21 | | | | | | | 900 | | | | 1,298,667 | |
Cooperatieve Centrale Raiffeisen-Boerenleenbank BA: | | | | | | | | | | | | |
3.75%, 11/09/20 | | | | | | | 50 | | | | 69,227 | |
4.00%, 1/11/22 | | | | | | | 980 | | | | 1,466,328 | |
3.88%, 7/25/23 | | | | | | | 2,430 | | | | 3,251,870 | |
HBOS PLC, 4.88%, 3/20/15 | | | | | | | 50 | | | | 70,146 | |
HSBC Bank Brasil SA - Banco Multiplo,
4.00%, 5/11/16 (b) | | | | | | | 15,610 | | | | 16,031,470 | |
HSBC Holdings PLC, 3.38%, 1/10/24 (a) | | | | | | | 100 | | | | 136,722 | |
ING Bank NV: | | | | | | | | | | | | |
0.94%, 5/23/16 (a) | | | USD | | | | 600 | | | | 580,500 | |
1.88%, 2/27/18 | | | EUR | | | | 100 | | | | 135,812 | |
3.25%, 4/03/19 | | | | | | | 100 | | | | 143,419 | |
Kutxabank SA, 3.00%, 2/01/17 | | | | | | | 1,400 | | | | 1,941,776 | |
Lloyds Bank PLC: | | | | | | | | | | | | |
5.38%, 9/03/19 | | | | | | | 100 | | | | 159,673 | |
6.50%, 3/24/20 | | | | | | | 1,848 | | | | 2,837,677 | |
6.50%, 9/17/40 | | | GBP | | | | 350 | | | | 704,712 | |
Nordea Bank AB: | | | | | | | | | | | | |
4.50%, 3/26/20 | | | EUR | | | | 100 | | | | 146,814 | |
4.00%, 6/29/20 | | | | | | | 100 | | | | 150,910 | |
Oversea-Chinese Banking Corp. Ltd.,
3.75%, 11/15/22 (a) | | | USD | | | | 10,000 | | | | 10,283,800 | |
Société Générale SA, 2.38%, 2/28/18 | | | EUR | | | | 100 | | | | 139,054 | |
Standard Chartered PLC, 1.75%, 10/29/17 | | | | | | | 100 | | | | 136,201 | |
Svenska Handelsbanken AB, 2.63%, 8/23/22 | | | | | | | 180 | | | | 244,727 | |
Wells Fargo & Co.: | | | | | | | | | | | | |
2.25%, 9/03/20 | | | | | | | 100 | | | | 135,888 | |
2.63%, 8/16/22 | | | | | | | 100 | | | | 136,186 | |
2.25%, 5/02/23 | | | | | | | 1,835 | | | | 2,409,744 | |
| | | | | | | | | | | | |
| | | | | | | | | | | | 61,111,565 | |
| | | | | | | | | | | | |
| Corporate Bonds | | Par (000) | | | Value | |
Commercial Services & Supplies — 0.1% | | | | | | | | | | | | |
Algeco Scotsman Global Finance PLC,
9.00%, 10/15/18 | | | EUR | | | | 300 | | | $ | 430,206 | |
GCL Holdings SCA, 9.38%, 4/15/18 | | | | | | | 290 | | | | 421,751 | |
IVS F. SpA, 7.13%, 4/01/20 | | | | | | | 1,957 | | | | 2,657,457 | |
La Financiere Atalian SA, 7.25%, 1/15/20 | | | | | | | 300 | | | | 405,855 | |
Verisure Holding AB, 8.75%, 12/01/18 | | | | | | | 300 | | | | 431,221 | |
| | | | | | | | | | | | |
| | | | | | | | | | | | 4,346,490 | |
Communications Equipment — 0.1% | | | | | | | | | | | | |
Nokia Oyj, 5.00%, 10/26/17 | | | | | | | 1,100 | | | | 2,967,342 | |
Construction & Engineering — 0.1% | | | | | | | | | | | | |
Odebrecht Offshore Drilling Finance Ltd.,
6.75%, 10/01/22 (b) | | | USD | | | | 3,053 | | | | 3,129,325 | |
Containers & Packaging — 0.1% | | | | | | | | | | | | |
Ardagh Glass Finance PLC, 8.75%, 2/01/20 | | | EUR | | | | 171 | | | | 234,849 | |
Ardagh Packaging Finance PLC, 9.25%, 10/15/20 | | | | | | | 146 | | | | 205,926 | |
Rock Tenn Co., 4.00%, 3/01/23 | | | USD | | | | 1,510 | | | | 1,462,998 | |
| | | | | | | | | | | | |
| | | | | | | | | | | | 1,903,773 | |
Distributors — 0.1% | | | | | | | | | | | | |
VWR Funding, Inc., 7.25%, 9/15/17 | | | | | | | 3,926 | | | | 4,141,930 | |
Diversified Financial Services — 2.5% | | | | | | | | | | | | |
AA Bond Co. Ltd., 6.27%, 7/31/25 | | | GBP | | | | 440 | | | | 754,774 | |
American Honda Finance Corp., 1.88%, 9/04/19 | | | EUR | | | | 100 | | | | 135,954 | |
Annington Finance No. 4 PLC, 1.48%, 1/10/23 (a) | | | GBP | | | | 2,671 | | | | 4,191,123 | |
AyT Cedulas Cajas Global: | | | | | | | | | | | | |
4.00%, 3/21/17 | | | EUR | | | | 1,600 | | | | 2,191,412 | |
4.00%, 3/24/21 | | | | | | | 800 | | | | 1,007,906 | |
AyT Cedulas Cajas X Fondo de Titulizacion: | | | | | | | | | | | | |
0.29%, 6/30/15 (a) | | | | | | | 500 | | | | 648,354 | |
3.75%, 6/30/25 | | | | | | | 600 | | | | 654,536 | |
AyT Cedulas Cajas XXIII Fondo de Titulizacion de Activos, 4.75%, 6/15/16 | | | | | | | 2,300 | | | | 3,248,682 | |
Bank of America Corp.: | | | | | | | | | | | | |
2.50%, 7/27/20 | | | | | | | 120 | | | | 161,633 | |
3.30%, 1/11/23 | | | USD | | | | 14,510 | | | | 13,592,388 | |
4.10%, 7/24/23 | | | | | | | 12,165 | | | | 12,089,394 | |
BP Capital Markets PLC, 2.75%, 5/10/23 | | | | | | | 5,255 | | | | 4,799,575 | |
Cedulas TDA 6 Fondo de Titulizacion de Activos: | | | | | | | | | | | | |
3.88%, 5/23/25 | | | EUR | | | | 900 | | | | 984,743 | |
4.25%, 4/10/31 | | | | | | | 900 | | | | 934,615 | |
Cedulas TDA 7 Fondo de Titulizacion de Activos, | | | | | | | | | | | | |
3.50%, 6/20/17 | | | | | | | 100 | | | | 131,649 | |
Citigroup, Inc.: | | | | | | | | | | | | |
4.45%, 1/10/17 | | | USD | | | | 1,900 | | | | 2,057,259 | |
7.38%, 9/04/19 | | | EUR | | | | 50 | | | | 86,400 | |
3.38%, 3/01/23 | | | USD | | | | 3,505 | | | | 3,335,246 | |
Deutsche Pfandbriefbank AG, 2.96%, 9/11/17 | | | EUR | | | | 1,900 | | | | 2,557,166 | |
EC Finance PLC, 9.75%, 8/01/17 | | | | | | | 329 | | | | 484,033 | |
FCE Bank PLC, 1.75%, 5/21/18 | | | | | | | 100 | | | | 133,881 | |
Ford Motor Credit Co. LLC: | | | | | | | | | | | | |
5.00%, 5/15/18 | | | USD | | | | 4,997 | | | | 5,474,468 | |
4.38%, 8/06/23 | | | | | | | 1,746 | | | | 1,746,986 | |
GE Capital European Funding Ltd.,
1.00%, 5/02/17 | | | EUR | | | | 3,130 | | | | 4,205,204 | |
JPMorgan Chase & Co.: | | | | | | | | | | | | |
3.25%, 9/23/22 | | | USD | | | | 2,651 | | | | 2,500,935 | |
3.20%, 1/25/23 | | | | | | | 3,785 | | | | 3,540,936 | |
JPMorgan Chase Bank NA, 4.38%, 11/30/21 (a) | | | EUR | | | | 100 | | | | 141,204 | |
See Notes to Consolidated Financial Statements.
| | | | | | |
| 40 | | BLACKROCK BALANCED CAPITAL FUND, INC. | | SEPTEMBER 30, 2013 | | |
| | | | |
| Consolidated Schedule of Investments (continued) | | | Master Total Return Portfolio | |
| | | (Percentages shown are based on Net Assets) | |
| | | | | | | | | | | | |
| Corporate Bonds | | Par (000) | | | Value | |
Diversified Financial Services (concluded) | | | | | | | | | | | | |
Merck Financial Services GmbH, 4.50%, 3/24/20 | | | EUR | | | | 85 | | | $ | 132,759 | |
Nationwide Building Society, 4.13%, 3/20/23 (a) | | | | | | | 1,749 | | | | 2,346,908 | |
Novus USA Trust, Series 2013-1,
1.56%, 2/28/14 (a)(b) | | | USD | | | | 6,940 | | | | 6,929,590 | |
Pohjola Bank PLC, 1.75%, 8/29/18 | | | EUR | | | | 100 | | | | 135,534 | |
| | | | | | | | | | | | |
| | | | | | | | | | | | 81,335,247 | |
Diversified Telecommunication Services — 2.6% | |
Deutsche Telekom International Finance BV,
5.75%, 3/23/16 | | | USD | | | | 75 | | | | 82,912 | |
Intelsat Jackson Holdings SA, 7.25%, 4/01/19 | | | | | | | 4,072 | | | | 4,357,040 | |
Level 3 Financing, Inc., 8.13%, 7/01/19 | | | | | | | 4,474 | | | | 4,787,180 | |
TDC A/S, 4.38%, 2/23/18 | | | EUR | | | | 120 | | | | 180,515 | |
Telecom Italia Finance SA, 7.75%, 1/24/33 | | | | | | | 440 | | | | 645,578 | |
Telecom Italia SpA: | | | | | | | | | | | | |
4.50%, 9/20/17 | | | | | | | 160 | | | | 218,710 | |
5.88%, 5/19/23 | | | GBP | | | | 650 | | | | 974,655 | |
Telefonica Emisiones SAU, 4.97%, 2/03/16 | | | EUR | | | | 100 | | | | 144,319 | |
Telenet Finance V Luxembourg SCA,
6.75%, 8/15/24 | | | | | | | 400 | | | | 551,963 | |
Telstra Corp. Ltd., 2.50%, 9/15/23 | | | | | | | 100 | | | | 131,857 | |
Verizon Communications, Inc.: | | | | | | | | | | | | |
3.65%, 9/14/18 | | | USD | | | | 18,095 | | | | 19,066,575 | |
2.45%, 11/01/22 | | | | | | | 3,050 | | | | 2,704,377 | |
5.15%, 9/15/23 | | | | | | | 18,666 | | | | 20,005,957 | |
3.85%, 11/01/42 | | | | | | | 14,771 | | | | 11,663,920 | |
6.55%, 9/15/43 | | | | | | | 15,753 | | | | 17,784,145 | |
Vivendi SA, 2.38%, 1/21/19 | | | EUR | | | | 1,300 | | | | 1,740,070 | |
Ziggo BV, 3.63%, 3/27/20 | | | | | | | 416 | | | | 556,454 | |
| | | | | | | | | | | | |
| | | | | | | | | | | | 85,596,227 | |
Electric Utilities — 1.1% | | | | | | | | | | | | |
The Cleveland Electric Illuminating Co.: | | | | | | | | | | | | |
8.88%, 11/15/18 | | | USD | | | | 1,199 | | | | 1,538,005 | |
5.95%, 12/15/36 | | | | | | | 2,175 | | | | 2,221,156 | |
Duke Energy Carolinas LLC, 4.25%, 12/15/41 | | | | | | | 3,915 | | | | 3,686,583 | |
Duke Energy Florida, Inc., 6.40%, 6/15/38 | | | | | | | 2,646 | | | | 3,222,929 | |
Enel Finance International NV, 4.88%, 4/17/23 | | | EUR | | | | 969 | | | | 1,374,124 | |
Energy Future Intermediate Holding Co. LLC/EFIH Finance, Inc., 10.00%, 12/01/20 | | | USD | | | | 7,690 | | | | 8,103,337 | |
Georgia Power Co., 3.00%, 4/15/16 | | | | | | | 8,985 | | | | 9,370,403 | |
Iberdrola International BV, 4.50%, 9/21/17 | | | EUR | | | | 100 | | | | 147,269 | |
Jersey Central Power & Light Co., 7.35%, 2/01/19 | | | USD | | | | 2,730 | | | | 3,274,883 | |
MidAmerican Energy Holdings Co.,
6.50%, 9/15/37 | | | | | | | 25 | | | | 29,529 | |
Trans-Allegheny Interstate Line Co.,
4.00%, 1/15/15 (b) | | | | | | | 2,815 | | | | 2,906,820 | |
| | | | | | | | | | | | |
| | | | | | | | | | | | 35,875,038 | |
Electrical Equipment — 0.0% | | | | | | | | | | | | |
Trionista Holdco GmbH, 5.00%, 4/30/20 | | | EUR | | | | 406 | | | | 554,750 | |
Trionista TopCo GmbH, 6.88%, 4/30/21 | | | | | | | 198 | | | | 275,231 | |
| | | | | | | | | | | | |
| | | | | | | | | | | | 829,981 | |
Electronic Equipment, Instruments & Components — 0.0% | |
Belden, Inc., 5.50%, 4/15/23 | | | | | | | 140 | | | | 183,622 | |
Energy Equipment & Services — 0.9% | | | | | | | | | | | | |
Transocean, Inc.: | | | | | | | | | | | | |
5.05%, 12/15/16 | | | USD | | | | 5,700 | | | | 6,246,562 | |
2.50%, 10/15/17 | | | | | | | 8,495 | | | | 8,517,801 | |
6.00%, 3/15/18 | | | | | | | 9,850 | | | | 11,098,645 | |
| | | | | | | | | | | | |
| Corporate Bonds | | Par (000) | | | Value | |
Energy Equipment & Services (concluded) | | | | | | | | | | | | |
6.50%, 11/15/20 | | | USD | | | | 3,925 | | | $ | 4,381,266 | |
| | | | | | | | | | | | |
| | | | | | | | | | | | 30,244,274 | |
Food & Staples Retailing — 0.2% | | | | | | | | | | | | |
Co-operative Group Holdings, 7.50%, 7/08/26 (c) | | | GBP | | | | 1,270 | | | | 1,901,813 | |
Wal-Mart Stores, Inc., 4.00%, 4/11/43 | | | USD | | | | 3,102 | | | | 2,765,399 | |
WM Morrison Supermarkets PLC, 2.25%, 6/19/20 | | | EUR | | | | 110 | | | | 147,702 | |
WM Treasury PLC, 4.63%, 12/03/42 | | | GBP | | | | 1,140 | | | | 1,802,038 | |
| | | | | | | | | | | | |
| | | | | | | | | | | | 6,616,952 | |
Food Products — 0.0% | | | | | | | | | | | | |
Bakkavor Finance 2 PLC: | | | | | | | | | | | | |
8.25%, 2/15/18 | | | | | | | 280 | | | | 475,959 | |
8.75%, 6/15/20 | | | | | | | 270 | | | | 461,164 | |
Louis Dreyfus Commodities BV, 3.88%, 7/30/18 | | | EUR | | | | 100 | | | | 137,635 | |
Unilever NV, 1.75%, 8/05/20 | | | | | | | 105 | | | | 141,494 | |
| | | | | | | | | | | | |
| | | | | | | | | | | | 1,216,252 | |
Gas Utilities — 0.1% | | | | | | | | | | | | |
Madrilena Red de Gas Finance BV, 3.78%, 9/11/18 | | | | | | | 315 | | | | 434,660 | |
Snam SpA, 3.88%, 3/19/18 | | | | | | | 1,810 | | | | 2,598,297 | |
| | | | | | | | | | | | |
| | | | | | | | | | | | 3,032,957 | |
Health Care Equipment & Supplies — 0.2% | | | | | | | | | | | | |
Boston Scientific Corp., 2.65%, 10/01/18 | | | USD | | | | 1,255 | | | | 1,255,548 | |
Edwards Lifesciences Corp., 2.88%, 10/15/18 | | | | | | | 5,887 | | | | 5,863,823 | |
Ontex IV SA, 9.00%, 4/15/19 | | | EUR | | | | 369 | | | | 527,906 | |
| | | | | | | | | | | | |
| | | | | | | | | | | | 7,647,277 | |
Health Care Providers & Services — 0.7% | | | | | | | | | | | | |
Coventry Health Care, Inc., 5.45%, 6/15/21 | | | USD | | | | 3,862 | | | | 4,289,921 | |
HCA, Inc., 7.25%, 9/15/20 | | | | | | | 3,925 | | | | 4,268,437 | |
IDH Finance PLC: | | | | | | | | | | | | |
6.00%, 12/01/18 | | | GBP | | | | 309 | | | | 502,119 | |
6.00%, 12/01/18 (b) | | | | | | | 200 | | | | 324,996 | |
Priory Group No. 3 PLC, 7.00%, 2/15/18 | | | | | | | 360 | | | | 598,834 | |
Tenet Healthcare Corp., 4.75%, 6/01/20 | | | USD | | | | 1,977 | | | | 1,902,863 | |
UnitedHealth Group, Inc., 3.38%, 11/15/21 | | | | | | | 1,630 | | | | 1,625,115 | |
Voyage Care BondCo PLC, 11.00%, 2/01/19 | | | GBP | | | | 1,800 | | | | 3,118,019 | |
WellPoint, Inc.: | | | | | | | | | | | | |
1.88%, 1/15/18 | | | USD | | | | 4,775 | | | | 4,733,166 | |
2.30%, 7/15/18 | | | | | | | 318 | | | | 318,147 | |
| | | | | | | | | | | | |
| | | | | | | | | | | | 21,681,617 | |
Hotels, Restaurants & Leisure — 0.2% | | | | | | | | | | | | |
Cirsa Funding Luxembourg SA, 8.75%, 5/15/18 | | | EUR | | | | 348 | | | | 487,270 | |
Enterprise Inns PLC, 6.50%, 12/06/18 | | | GBP | | | | 574 | | | | 952,485 | |
Gala Group Finance PLC, 8.88%, 9/01/18 | | | | | | | 280 | | | | 490,746 | |
Intralot Finance Luxembourg SA, 9.75%, 8/15/18 | | | EUR | | | | 1,575 | | | | 2,221,296 | |
Lottomatica Group SpA, 3.50%, 3/05/20 | | | | | | | 1,300 | | | | 1,809,687 | |
| | | | | | | | | | | | |
| | | | | | | | | | | | 5,961,484 | |
Household Durables — 0.2% | | | | | | | | | | | | |
K. Hovnanian Enterprises, Inc., 7.25%, 10/15/20 (b) | | | USD | | | | 3,615 | | | | 3,804,787 | |
Magnolia BC SA, 9.00%, 8/01/20 | | | EUR | | | | 125 | | | | 172,928 | |
Together Housing Finance PLC, 4.50%, 12/17/42 | | | GBP | | | | 1,185 | | | | 1,868,452 | |
| | | | | | | | | | | | |
| | | | | | | | | | | | 5,846,167 | |
See Notes to Consolidated Financial Statements.
| | | | | | |
| | | BLACKROCK BALANCED CAPITAL FUND, INC. | | SEPTEMBER 30, 2013 | | 41 |
| | | | |
| Consolidated Schedule of Investments (continued) | | | Master Total Return Portfolio | |
| | | (Percentages shown are based on Net Assets) | |
| | | | | | | | | | | | |
| Corporate Bonds | | Par (000) | | | Value | |
Household Products — 0.1% | | | | | | | | | | | | |
Reynolds Group Issuer, Inc./Reynolds Group Issuer LLC/Reynolds Group Issuer Luxembourg SA, 6.88%, 2/15/21 | | | USD | | | | 3,120 | | | $ | 3,330,600 | |
Insurance — 1.8% | | | | | | | | | | | | |
Achmea BV, 6.00%, 4/04/43 (a) | | | EUR | | | | 1,122 | | | | 1,578,614 | |
Allianz Finance II BV, 5.75%, 7/08/41 | | | | | | | 2,000 | | | | 3,003,057 | |
American International Group, Inc.: | | | | | | | | | | | | |
3.80%, 3/22/17 | | | USD | | | | 8,028 | | | | 8,537,866 | |
5.45%, 5/18/17 | | | | | | | 4,150 | | | | 4,638,936 | |
3.38%, 8/15/20 | | | | | | | 6,230 | | | | 6,233,794 | |
4.88%, 6/01/22 | | | | | | | 4,674 | | | | 5,014,085 | |
4.13%, 2/15/24 | | | | | | | 3,498 | | | | 3,500,410 | |
BUPA Finance PLC, 5.00%, 4/25/23 | | | GBP | | | | 820 | | | | 1,299,322 | |
Cloverie PLC for Zurich Insurance Co. Ltd.,
7.50%, 7/24/39 (a) | | | EUR | | | | 800 | | | | 1,301,215 | |
Genworth Holdings, Inc., 4.90%, 8/15/23 | | | USD | | | | 876 | | | | 879,527 | |
Manulife Financial Corp., 3.40%, 9/17/15 | | | | | | | 3,185 | | | | 3,318,467 | |
Metropolitan Life Global Funding I,
5.13%, 6/10/14 (b) | | | | | | | 1,600 | | | | 1,651,253 | |
Muenchener Rueckversicherungs AG,
6.00%, 5/26/41 (a) | | | EUR | | | | 900 | | | | 1,390,167 | |
Prudential Financial, Inc.: | | | | | | | | | | | | |
4.75%, 9/17/15 | | | USD | | | | 8,549 | | | | 9,172,650 | |
7.38%, 6/15/19 | | | | | | | 3,690 | | | | 4,569,176 | |
5.38%, 6/21/20 | | | | | | | 2,085 | | | | 2,352,026 | |
Scottish Widows PLC, 5.60%, 6/16/23 | | | GBP | | | | 1,385 | | | | 2,203,278 | |
Swiss Reinsurance Co via ELM BV, 5.25% (a)(i) | | | EUR | | | | 100 | | | | 139,005 | |
| | | | | | | | | | | | |
| | | | | | | | | | | | 60,782,848 | |
IT Services — 0.3% | | | | | | | | | | | | |
Amadeus Capital Markets SA, 4.88%, 7/15/16 | | | | | | | 100 | | | | 147,706 | |
APX Group, Inc., 6.38%, 12/01/19 (b) | | | USD | | | | 2,282 | | | | 2,156,490 | |
Cerved Technologies SpA: | | | | | | | | | | | | |
6.38%, 1/15/20 | | | EUR | | | | 582 | | | | 803,106 | |
8.00%, 1/15/21 | | | | | | | 300 | | | | 416,001 | |
International Business Machines Corp.,
3.38%, 8/01/23 | | | USD | | | | 7,940 | | | | 7,833,588 | |
| | | | | | | | | | | | |
| | | | | | | | | | | | 11,356,891 | |
Life Sciences Tools & Services — 0.1% | | | | | | | | | | | | |
Life Technologies Corp., 6.00%, 3/01/20 | | | | | | | 2,720 | | | | 3,062,946 | |
Media — 1.8% | | | | | | | | | | | | |
CBS Corp.: | | | | | | | | | | | | |
4.63%, 5/15/18 | | | | | | | 1,785 | | | | 1,954,302 | |
8.88%, 5/15/19 | | | | | | | 3,440 | | | | 4,397,493 | |
5.75%, 4/15/20 | | | | | | | 1,410 | | | | 1,574,881 | |
Clear Channel Worldwide Holdings, Inc., Series B,
6.50%, 11/15/22 | | | | | | | 4,844 | | | | 4,940,880 | |
Comcast Cable Communications Holdings, Inc.,
9.46%, 11/15/22 | | | | | | | 2,225 | | | | 3,136,638 | |
Comcast Corp.: | | | | | | | | | | | | |
5.88%, 2/15/18 | | | | | | | 6,350 | | | | 7,408,672 | |
4.65%, 7/15/42 | | | | | | | 10,445 | | | | 9,932,495 | |
COX Communications, Inc.: | | | | | | | | | | | | |
2.95%, 6/30/23 (b) | | | | | | | 3,265 | | | | 2,818,168 | |
8.38%, 3/01/39 (b) | | | | | | | 6,180 | | | | 7,330,469 | |
4.70%, 12/15/42 (b) | | | | | | | 2,159 | | | | 1,748,542 | |
DIRECTV Holdings LLC/DIRECTV Financing Co., Inc., 3.80%, 3/15/22 | | | | | | | 3,635 | | | | 3,392,724 | |
Eutelsat SA, 3.13%, 10/10/22 | | | EUR | | | | 1,900 | | | | 2,544,146 | |
Lynx I Corp., 6.00%, 4/15/21 | | | GBP | | | | 310 | | | | 509,390 | |
NBCUniversal Media LLC: | | | | | | | | | | | | |
5.15%, 4/30/20 | | | USD | | | | 3,508 | | | | 3,977,946 | |
4.45%, 1/15/43 | | | | | | | 3,337 | | | | 3,084,135 | |
Odeon & UCI Finco PLC, 9.00%, 8/01/18 | | | GBP | | | | 272 | | | | 442,545 | |
SES SA, 4.63%, 3/09/20 | | | EUR | | | | 255 | | | | 390,771 | |
| | | | | | | | | | | | |
| Corporate Bonds | | Par (000) | | | Value | |
Media (concluded) | | | | | | | | | | | | |
Unitymedia KabelBW GmbH, 9.50%, 3/15/21 | | | EUR | | | | 340 | | | $ | 523,224 | |
| | | | | | | | | | | | |
| | | | | | | | | | | | 60,107,421 | |
Metals & Mining — 0.6% | | | | | | | | | | | | |
BHP Billiton Finance Ltd., 2.13%, 11/29/18 | | | | | | | 100 | | | | 138,696 | |
BHP Billiton Finance USA Ltd.: | | | | | | | | | | | | |
3.85%, 9/30/23 | | | USD | | | | 5,154 | | | | 5,193,511 | |
5.00%, 9/30/43 | | | | | | | 2,025 | | | | 2,062,440 | |
Eco-Bat Finance PLC, 7.75%, 2/15/17 | | | EUR | | | | 300 | | | | 418,031 | |
Novelis, Inc., 8.75%, 12/15/20 | | | USD | | | | 6,865 | | | | 7,534,337 | |
Steel Dynamics, Inc., 6.38%, 8/15/22 | | | | | | | 1,345 | | | | 1,392,075 | |
Teck Resources Ltd., 5.40%, 2/01/43 | | | | | | | 1,955 | | | | 1,708,647 | |
ThyssenKrupp AG, 4.00%, 8/27/18 | | | EUR | | | | 1,770 | | | | 2,430,890 | |
Xstrata Finance Dubai Ltd., 1.75%, 5/19/16 | | | | | | | 135 | | | | 183,409 | |
| | | | | | | | | | | | |
| | | | | | | | | | | | 21,062,036 | |
Multi-Utilities — 0.2% | | | | | | | | | | | | |
Dominion Resources, Inc., 1.95%, 8/15/16 | | | USD | | | | 6,345 | | | | 6,474,368 | |
Oil, Gas & Consumable Fuels — 3.1% | | | | | | | | | | | | |
Access Midstream Partners LP/ACMP Finance Corp., 4.88%, 5/15/23 | | | | | | | 1,345 | | | | 1,264,300 | |
Apache Corp., 4.25%, 1/15/44 | | | | | | | 2,315 | | | | 2,025,243 | |
CONSOL Energy, Inc., 8.25%, 4/01/20 | | | | | | | 549 | | | | 588,803 | |
Energy Transfer Partners LP: | | | | | | | | | | | | |
4.15%, 10/01/20 | | | | | | | 6,140 | | | | 6,310,170 | |
3.60%, 2/01/23 | | | | | | | 6,325 | | | | 5,891,649 | |
Enterprise Products Operating LLC, 4.45%, 2/15/43 | | | | | | | 2,420 | | | | 2,140,858 | |
EP Energy LLC/EP Energy Finance, Inc.,
9.38%, 5/01/20 | | | | | | | 1,525 | | | | 1,715,625 | |
EP Energy LLC/Everest Acquisition Finance, Inc., 6.88%, 5/01/19 | | | | | | | 1,260 | | | | 1,345,050 | |
IVG Finance BV, 1.75%, 3/29/17 | | | EUR | | | | 2,000 | | | | 2,013,312 | |
Laredo Petroleum, Inc.: | | | | | | | | | | | | |
9.50%, 2/15/19 | | | USD | | | | 1,925 | | | | 2,136,750 | |
7.38%, 5/01/22 | | | | | | | 655 | | | | 694,300 | |
Linn Energy LLC/Linn Energy Finance Corp., 6.75%, 11/01/19 (b) | | | | | | | 3,995 | | | | 3,765,287 | |
MarkWest Energy Partners LP/MarkWest Energy Finance Corp., 4.50%, 7/15/23 | | | | | | | 1,105 | | | | 1,041,463 | |
MEG Energy Corp., 6.50%, 3/15/21 (b) | | | | | | | 910 | | | | 916,825 | |
Murphy Oil Corp.: | | | | | | | | | | | | |
4.00%, 6/01/22 | | | | | | | 1,217 | | | | 1,163,812 | |
3.70%, 12/01/22 | | | | | | | 2,883 | | | | 2,687,138 | |
Noble Energy, Inc.: | | | | | | | | | | | | |
8.25%, 3/01/19 | | | | | | | 2,660 | | | | 3,324,013 | |
4.15%, 12/15/21 | | | | | | | 2,770 | | | | 2,883,775 | |
6.00%, 3/01/41 | | | | | | | 3,070 | | | | 3,454,754 | |
Noble Holding International Ltd.: | | | | | | | | | | | | |
3.95%, 3/15/22 | | | | | | | 1,110 | | | | 1,070,695 | |
5.25%, 3/15/42 | | | | | | | 5,790 | | | | 5,272,484 | |
Novatek OAO via Novatek Finance Ltd.,
4.42%, 12/13/22 (b) | | | | | | | 2,725 | | | | 2,500,187 | |
Origin Energy Finance Ltd., 3.50%, 10/04/21 | | | EUR | | | | 200 | | | | 270,245 | |
Peabody Energy Corp., 6.00%, 11/15/18 | | | USD | | | | 614 | | | | 612,465 | |
Repsol International Finance BV, 2.63%, 5/28/20 | | | EUR | | | | 100 | | | | 130,312 | |
Sabine Pass Liquefaction LLC: | | | | | | | | | | | | |
5.63%, 2/01/21 (b) | | | USD | | | | 4,005 | | | | 3,919,894 | |
5.63%, 4/15/23 (b) | | | | | | | 1,053 | | | | 1,009,564 | |
Sabine Pass LNG LP: | | | | | | | | | | | | |
7.50%, 11/30/16 | | | | | | | 5,000 | | | | 5,500,000 | |
6.50%, 11/01/20 (b) | | | | | | | 1,225 | | | | 1,243,375 | |
Shell International Finance BV, 4.55%, 8/12/43 | | | USD | | | | 5,371 | | | | 5,291,380 | |
Sibur Securities Ltd., 3.91%, 1/31/18 (b) | | | | | | | 2,150 | | | | 2,042,500 | |
See Notes to Consolidated Financial Statements.
| | | | | | |
| 42 | | BLACKROCK BALANCED CAPITAL FUND, INC. | | SEPTEMBER 30, 2013 | | |
| | | | |
| Consolidated Schedule of Investments (continued) | | | Master Total Return Portfolio | |
| | | (Percentages shown are based on Net Assets) | |
| | | | | | | | | | | | |
| Corporate Bonds | | Par (000) | | | Value | |
Oil, Gas & Consumable Fuels (concluded) | | | | | | | | | | | | |
Total Capital International SA, 3.70%, 1/15/24 | | | USD | | | | 10,870 | | | $ | 10,918,687 | |
Vier Gas Transport GmbH, 3.13%, 7/10/23 | | | EUR | | | | 835 | | | | 1,163,632 | |
Western Gas Partners LP: | | | | | | | | | | | | |
5.38%, 6/01/21 | | | USD | | | | 5,172 | | | | 5,531,242 | |
4.00%, 7/01/22 | | | | | | | 2,516 | | | | 2,441,808 | |
The Williams Cos., Inc.: | | | | | | | | | | | | |
7.88%, 9/01/21 | | | | | | | 1,849 | | | | 2,205,082 | |
3.70%, 1/15/23 | | | | | | | 8,115 | | | | 7,328,957 | |
| | | | | | | | | | | | |
| | | | | | | | | | | | 103,815,636 | |
Paper & Forest Products — 0.5% | | | | | | | | | | | | |
International Paper Co., 4.75%, 2/15/22 | | | | | | | 13,456 | | | | 14,171,267 | |
Mondi Finance PLC, 5.75%, 4/03/17 | | | EUR | | | | 1,150 | | | | 1,757,732 | |
| | | | | | | | | | | | |
| | | | | | | | | | | | 15,928,999 | |
Pharmaceuticals — 0.1% | | | | | | | | | | | | |
Teva Pharmaceutical Finance Co. BV,
3.65%, 11/10/21 | | | USD | | | | 2,120 | | | | 2,104,187 | |
UCB SA, 4.13%, 1/04/21 | | | | | | | 120 | | | | 162,959 | |
| | | | | | | | | | | | |
| | | | | | | | | | | | 2,267,146 | |
Professional Services — 0.0% | | | | | | | | | | | | |
TMF Group Holding BV, 9.88%, 12/01/19 | | | EUR | | | | 326 | | | | 464,862 | |
Real Estate Investment Trusts (REITs) — 0.3% | | | | | | | | | | | | |
Gecina SA, 2.88%, 5/30/23 | | | | | | | 800 | | | | 1,034,675 | |
GELF Bond Issuer I SA, 3.13%, 4/03/18 | | | | | | | 1,795 | | | | 2,473,952 | |
ICADE, 3.38%, 9/29/23 | | | | | | | 100 | | | | 136,110 | |
Unibail-Rodamco SE, 2.38%, 2/25/21 | | | | | | | 210 | | | | 281,902 | |
Ventas Realty LP/Ventas Capital Corp.,
2.70%, 4/01/20 | | | USD | | | | 1,272 | | | | 1,212,310 | |
Vornado Realty LP, 5.00%, 1/15/22 | | | | | | | 2,830 | | | | 2,967,204 | |
| | | | | | | | | | | | |
| | | | | | | | | | | | 8,106,153 | |
Real Estate Management & Development — 0.3% | |
Atrium European Real Estate Ltd., 4.00%, 4/20/20 | | | EUR | | | | 1,575 | | | | 2,126,073 | |
Citycon Oyj, 3.75%, 6/24/20 | | | | | | | 1,750 | | | | 2,376,743 | |
Great Places Housing Group Ltd.,
4.75%, 10/22/42 | | | GBP | | | | 1,086 | | | | 1,780,622 | |
The Unique Pub Finance Co. PLC: | | | | | | | | | | | | |
Series A3, 6.54%, 3/30/21 | | | | | | | 500 | | | | 827,667 | |
Series A4, 5.66%, 6/30/27 | | | | | | | 1,566 | | | | 2,427,293 | |
| | | | | | | | | | | | |
| | | | | | | | | | | | 9,538,398 | |
Road & Rail — 0.3% | | | | | | | | | | | | |
Autoroutes du Sud de la France SA: | | | | | | | | | | | | |
4.13%, 4/13/20 | | | EUR | | | | 1,600 | | | | 2,416,979 | |
2.88%, 1/18/23 | | | | | | | 1,800 | | | | 2,465,935 | |
Burlington Northern Santa Fe LLC,
3.00%, 3/15/23 | | | USD | | | | 5,675 | | | | 5,340,073 | |
| | | | | | | | | | | | |
| | | | | | | | | | | | 10,222,987 | |
Semiconductors & Semiconductor Equipment — 0.1% | |
ASML Holding NV, 3.38%, 9/19/23 | | | EUR | | | | 1,090 | | | | 1,486,183 | |
Software — 0.2% | | | | | | | | | | | | |
First Data Corp., 7.38%, 6/15/19 (b) | | | USD | | | | 2,290 | | | | 2,410,225 | |
Oracle Corp.: | | | | | | | | | | | | |
2.50%, 10/15/22 | | | | | | | 5,255 | | | | 4,844,337 | |
3.63%, 7/15/23 | | | | | | | 285 | | | | 284,239 | |
SAP AG, 2.13%, 11/13/19 | | | EUR | | | | 150 | | | | 205,704 | |
| | | | | | | | | | | | |
| | | | | | | | | | | | 7,744,505 | |
Specialty Retail — 0.3% | | | | | | | | | | | | |
DFS Furniture Holdings PLC, 7.63%, 8/15/18 | | | GBP | | | | 278 | | | | 475,935 | |
Dufry Finance SCA, 5.50%, 10/15/20 (b) | | | USD | | | | 1,760 | | | | 1,774,805 | |
House of Fraser Funding PLC, 8.88%, 8/15/18 | | | GBP | | | | 891 | | | | 1,539,236 | |
| | | | | | | | | | | | |
| Corporate Bonds | | Par (000) | | | Value | |
Specialty Retail (concluded) | | | | | | | | | | | | |
Kering: | | | | | | | | | | | | |
3.75%, 4/08/15 | | | EUR | | | | 70 | | | $ | 98,906 | |
2.50%, 7/15/20 | | | | | | | 800 | | | | 1,083,980 | |
Marks & Spencer PLC, 4.75%, 6/12/25 | | | GBP | | | | 630 | | | | 1,023,221 | |
Punch Taverns Finance B Ltd.: | | | | | | | | | | | | |
Series A6, 5.94%, 12/30/24 | | | | | | | 176 | | | | 272,106 | |
Series A7, 4.77%, 6/30/33 | | | | | | | 884 | | | | 1,331,563 | |
Rent-A-Center, Inc., 4.75%, 5/01/21 (b) | | | | | | | 2,295 | | | | 2,134,350 | |
| | | | | | | | | | | | |
| | | | | | | | | | | | 9,734,102 | |
Tobacco — 0.0% | | | | | | | | | | | | |
Imperial Tobacco Finance PLC, 4.50%, 7/05/18 | | | EUR | | | | 816 | | | | 1,234,666 | |
Philip Morris International, Inc., 2.75%, 3/19/25 | | | | | | | 110 | | | | 145,662 | |
| | | | | | | | | | | | |
| | | | | | | | | | | | 1,380,328 | |
Trading Companies & Distributors — 0.3% | |
Aircastle Ltd., 6.25%, 12/01/19 | | | USD | | | | 2,100 | | | | 2,220,750 | |
H&E Equipment Services, Inc.,
7.00%, 9/01/22 | | | | | | | 1,605 | | | | 1,709,325 | |
United Rentals North America, Inc.: | | | | | | | | | | | | |
5.75%, 7/15/18 | | | | | | | 753 | | | | 790,650 | |
7.38%, 5/15/20 | | | | | | | 3,535 | | | | 3,808,963 | |
7.63%, 4/15/22 | | | | | | | 1,874 | | | | 2,037,975 | |
| | | | | | | | | | | | |
| | | | | | | | | | | | 10,567,663 | |
Transportation Infrastructure — 0.0% | | | | | | | | | | | | |
Gategroup Finance Luxembourg SA,
6.75%, 3/01/19 | | | EUR | | | | 300 | | | | 417,032 | |
Wireless Telecommunication Services — 1.1% | |
America Movil SAB de CV, 2.38%, 9/08/16 | | | USD | | | | 8,025 | | | | 8,159,820 | |
Crown Castle International Corp.,
5.25%, 1/15/23 | | | | | | | 2,235 | | | | 2,056,200 | |
Crown Castle Towers LLC, 6.11%, 1/15/40 (b) | | | | | | | 6,156 | | | | 6,962,824 | |
SBA Tower Trust, 5.10%, 4/15/42 (b) | | | | | | | 634 | | | | 684,366 | |
Sprint Communications, Inc.,
9.00%, 11/15/18 (b) | | | | | | | 10,660 | | | | 12,498,850 | |
Sprint Corp., 7.88%, 9/15/23 (b) | | | | | | | 3,190 | | | | 3,253,800 | |
Vodafone Group PLC, 8.13%, 11/26/18 | | | GBP | | | | 1,220 | | | | 2,503,736 | |
| | | | | | | | | | | | |
| | | | | | | | | | | | 36,119,596 | |
Total Corporate Bonds — 24.5% | | | | | | | | | | | 814,426,309 | |
| | | | | | | | | | | | |
| Floating Rate Loan Interests (a) | | | | | | | | | |
Diversified Financial Services — 0.0% | | | | | | | | | | | | |
Nuveen Investments, Inc., Tranche B First-Lien Term Loan, 4.18%, 5/13/17 | | | USD | | | | 467 | | | | 461,003 | |
Springleaf Financial Funding Co. (FKA American General Finance Corp.), Initial Loan, 5.50%, 5/10/17 | | | | | | | 587 | | | | 586,790 | |
| | | | | | | | | | | | |
| | | | | | | | | | | | 1,047,793 | |
Diversified Telecommunication Services — 0.9% | |
Intelsat Jackson Holdings Ltd., Tranche B-1 Term Loan, 4.25%, 4/02/18 | | | | | | | 12,423 | | | | 12,432,005 | |
Level 3 Financing, Inc.: | | | | | | | | | | | | |
Tranche B 2020 Term Loan, 4.00%, 1/15/20 | | | | | | | 8,090 | | | | 8,073,173 | |
Tranche B-II 2019 Term Loan, 4.75%, 8/01/19 | | | | | | | 8,000 | | | | 7,984,960 | |
| | | | | | | | | | | | |
| | | | | | | | | | | | 28,490,138 | |
See Notes to Consolidated Financial Statements.
| | | | | | |
| | | BLACKROCK BALANCED CAPITAL FUND, INC. | | SEPTEMBER 30, 2013 | | 43 |
| | | | |
| Consolidated Schedule of Investments (continued) | | | Master Total Return Portfolio | |
| | | (Percentages shown are based on Net Assets) | |
| | | | | | | | | | | | |
| Floating Rate Loan Interests (a) | | Par (000) | | | Value | |
Food Products — 0.1% | | | | | | | | | | | | |
Del Monte Foods Co., Initial Term Loan,
4.00%, 3/08/18 | | | USD | | | | 2,324 | | | $ | 2,313,449 | |
Health Care Providers & Services — 0.0% | | | | | | | | | | | | |
Emdeon, Inc., Term B-2 Loan, 3.75%, 11/02/18 | | | | | | | 919 | | | | 917,416 | |
Hotels, Restaurants & Leisure — 1.9% | | | | | | | | | | | | |
Hilton Fort Lauderdale, Term Loan A Notes,
7.38%, 2/22/16 | | | | | | | 6,540 | | | | 6,540,000 | |
Hilton Worldwide, Inc. (FKA Hilton Hotels Corp.): | | | | | | | | | | | | |
Mezzanine B Loan, 2.13%, 11/12/15 | | | | | | | 6,000 | | | | 6,015,000 | |
Mezzanine D Loan, 3.93%, 11/12/15 | | | | | | | 4,000 | | | | 3,985,000 | |
Mezzanine F Loan, 4.43%, 11/15/15 | | | | | | | 14,704 | | | | 14,648,772 | |
Mezzanine G Loan, 4.50%, 11/12/16 | | | | | | | 10,620 | | | | 10,566,756 | |
Term Loan B2, 3.00%, 9/23/20 | | | | | | | 16,639 | | | | 16,609,196 | |
Motel 6, Loan, 10.00%, 10/15/17 (b) | | | | | | | 6,015 | | | | 6,195,329 | |
| | | | | | | | | | | | |
| | | | | | | | | | | | 64,560,053 | |
Life Sciences Tools & Services — 0.0% | | | | | | | | | | | | |
Pharmaceutical Product Development, Inc. (Jaguar Holdings LLC), 2013 Term Loan, 4.25%, 12/05/18 | | | | | | | 983 | | | | 982,821 | |
Oil, Gas & Consumable Fuels — 0.2% | | | | | | | | | | | | |
Obsidian Natural Gas Trust, Loan,
7.00%, 11/02/15 | | | | | | | 6,676 | | | | 6,676,072 | |
Pharmaceuticals — 0.1% | | | | | | | | | | | | |
inVentiv Health, Inc. (FKA Ventive Health, Inc.), Consolidated Term Loan, 7.50%, 8/04/16 | | | | | | | 2,649 | | | | 2,549,391 | |
Real Estate Investment Trusts (REITs) — 0.0% | |
iStar Financial, Inc., Loan, 4.50%, 10/15/17 | | | | | | | 462 | | | | 462,523 | |
Real Estate Management & Development — 0.0% | |
Realogy Corp., Extended Synthetic Commitment, 0.03% - 4.40%, 10/10/16 | | | | | | | 178 | | | | 179,192 | |
Software — 0.2% | | | | | | | | | | | | |
First Data Corp., 2018 Dollar Term Loan,
4.18%, 3/23/18 | | | | | | | 6,090 | | | | 6,024,425 | |
Total Floating Rate Loan Interests — 3.4% | | | | | | | | | | | 114,203,273 | |
| | | | | | | | | | | | |
| Foreign Agency Obligations | | | | | | | | | |
Brazil — 0.6% | | | | | | | | | | | | |
Caixa Economica Federal, 2.38%, 11/06/17 (b) | | | | | | | 3,950 | | | | 3,693,250 | |
Petrobras International Finance Co.,
3.88%, 1/27/16 | | | | | | | 15,335 | | | | 15,822,484 | |
| | | | | | | | | | | | |
| | | | | | | | | | | | 19,515,734 | |
Canada — 0.1% | | | | | | | | | | | | |
Nexen, Inc.: | | | | | | | | | | | | |
5.88%, 3/10/35 | | | | | | | 240 | | | | 248,414 | |
7.50%, 7/30/39 | | | | | | | 1,780 | | | | 2,184,565 | |
| | | | | | | | | | | | |
| | | | | | | | | | | | 2,432,979 | |
France — 0.1% | | | | | | | | | | | | |
Aeroports de Paris, 2.75%, 6/05/28 | | | EUR | | | | 1,100 | | | | 1,442,459 | |
Electricite de France SA, 2.75%, 3/10/23 | | | | | | | 1,600 | | | | 2,173,868 | |
RTE Reseau de Transport d’Electricite SA,
2.88%, 9/12/23 | | | | | | | 600 | | | | 818,113 | |
| | | | | | | | | | | | |
| | | | | | | | | | | | 4,434,440 | |
| | | | | | | | | | | | |
| Foreign Agency Obligations | | Par (000) | | | Value | |
Germany — 0.1% | | | | | | | | | | | | |
HSH Nordbank AG: | | | | | | | | | | | | |
1.03%, 2/14/17 (a) | | | USD | | | | 289 | | | $ | 250,223 | |
1.07%, 2/14/17 (a) | | | | | | | 1,561 | | | | 1,350,517 | |
| | | | | | | | | | | | |
| | | | | | | | | | | | 1,600,740 | |
India — 0.1% | | | | | | | | | | | | |
Bank of India, 6.25%, 2/16/21 | | | | | | | 4,670 | | | | 4,719,698 | |
Norway — 0.0% | | | | | | | | | | | | |
Eksportfinans ASA, 5.50%, 6/26/17 | | | | | | | 275 | | | | 285,656 | |
Statoil ASA, 2.95%, 9/10/25 | | | EUR | | | | 130 | | | | 178,615 | |
| | | | | | | | | | | | |
| | | | | | | | | | | | 464,271 | |
Portugal — 0.1% | | | | | | | | | | | | |
Caixa Geral de Depositos SA, 5.63%, 12/04/15 | | | | | | | 2,000 | | | | 2,763,549 | |
Russia — 0.1% | | | | | | | | | | | | |
Sberbank of Russia Via SB Capital SA,
6.13%, 2/07/22 | | | | | | | 3,260 | | | | 3,414,850 | |
Total Foreign Agency Obligations — 1.2% | | | | | | | | | | | 39,346,261 | |
| | | | | | | | | | | | |
| Foreign Government Obligations | | | | | | | | | |
Belgium — 0.2% | | | | | | | | | | | | |
Kingdom of Belgium, 4.00%, 3/28/18 | | | | | | | 6,250 | | | | 7,023,438 | |
Brazil — 0.3% | | | | | | | | | | | | |
Brazil Notas do Tesouro Nacional Series F,
10.00%, 1/01/17 | | | BRL | | | | 20,000 | | | | 8,723,548 | |
Federative Republic of Brazil, 7.13%, 1/20/37 | | | USD | | | | 1,725 | | | | 2,026,875 | |
| | | | | | | | | | | | |
| | | | | | | | | | | | 10,750,423 | |
France — 0.1% | | | | | | | | | | | | |
France Government Bond OAT,
2.25%, 10/25/22 | | | | | | | 358 | | | | 485,389 | |
Republic of France, 4.25%, 10/25/23 | | | | | | | 2,840 | | | | 4,467,973 | |
| | | | | | | | | | | | |
| | | | | | | | | | | | 4,953,362 | |
Germany — 0.1% | | | | | | | | | | | | |
Federal Republic of Germany, 2.00%, 1/04/22 | | | | | | | 2,750 | | | | 3,883,327 | |
Italy — 0.8% | | | | | | | | | | | | |
Buoni Poliennali Del Tesoro: | | | | | | | | | | | | |
3.50%, 11/01/17 | | | | | | | 11,820 | | | | 16,238,772 | |
5.50%, 11/01/22 | | | | | | | 6,200 | | | | 9,058,687 | |
| | | | | | | | | | | | |
| | | | | | | | | | | | 25,297,459 | |
Mexico — 0.4% | | | | | | | | | | | | |
United Mexican States, 4.00%, 10/02/23 | | | | | | | 12,115 | | | | 12,039,281 | |
Netherlands — 4.3% | | | | | | | | | | | | |
Kingdom of the Netherlands, 1.25%, 1/15/18 | | | EUR | | | | 104,000 | | | | 142,590,222 | |
Portugal — 0.4% | | | | | | | | | | | | |
Republic of Portugal, 3.50%, 3/25/15 | | | USD | | | | 12,800 | | | | 12,627,200 | |
Russia — 0.5% | | | | | | | | | | | | |
Russian Federation: | | | | | | | | | | | | |
8.15%, 2/03/27 | | | RUB | | | | 140,790 | | | | 4,549,392 | |
7.05%, 1/19/28 | | | | | | | 122,000 | | | | 3,567,582 | |
7.50%, 3/31/30 (c) | | | | | | | 6,567 | | | | 7,739,402 | |
| | | | | | | | | | | | |
| | | | | | | | | | | | 15,856,376 | |
South Africa — 0.1% | | | | | | | | | | | | |
Republic of South Africa, 5.50%, 3/09/20 | | | USD | | | | 3,165 | | | | 3,398,419 | |
See Notes to Consolidated Financial Statements.
| | | | | | |
| 44 | | BLACKROCK BALANCED CAPITAL FUND, INC. | | SEPTEMBER 30, 2013 | | |
| | | | |
| Consolidated Schedule of Investments (continued) | | | Master Total Return Portfolio | |
| | | (Percentages shown are based on Net Assets) | |
| | | | | | | | | | | | |
| Foreign Government Obligations | | Par (000) | | | Value | |
Spain — 0.4% | | | | | | | | | | | | |
Autonomous Community of Madrid Spain,
3.00%, 7/29/14 | | | CHF | | | | 410 | | | $ | 454,407 | |
Autonomous Community of Valencia Spain: | | | | | | | | | | | | |
4.75%, 3/20/14 | | | EUR | | | | 1,700 | | | | 2,306,975 | |
3.25%, 7/06/15 | | | | | | | 1,280 | | | | 1,694,072 | |
4.38%, 7/16/15 | | | | | | | 1,860 | | | | 2,517,958 | |
Spain Letras del Tesoro, 2.98%, 4/16/14 (d) | | | | | | | 5,200 | | | | 7,000,211 | |
| | | | | | | | | | | | |
| | | | | | | | | | | | 13,973,623 | |
Total Foreign Government Obligations — 7.6% | | | | 252,393,130 | |
| | | | | | | | | | | | |
| Investment Companies | | | | | Shares | | | | |
iShares iBoxx $ High Yield Corporate
Bond ETF (e) | | | | | | | 190,000 | | | | 17,396,400 | |
iShares JPMorgan USD Emerging Markets Bond Fund (e) | | | | | | | 114,500 | | | | 12,480,500 | |
Total Investment Companies — 0.9% | | | | | | | | | | | 29,876,900 | |
| | | | | | | | | | | | |
| Non-Agency Mortgage-Backed Securities | | Par (000) | | | | |
Collateralized Mortgage Obligations — 4.5% | |
Citigroup Mortgage Loan Trust, Series 2007-2, Class 2A, 6.00%, 11/25/36 | | | USD | �� | | | 201 | | | | 188,970 | |
Collateralized Mortgage Obligation Trust,
Series 57, Class D, 9.90%, 2/01/19 | | | | | | | 7 | | | | 8,124 | |
Countrywide Alternative Loan Trust: | | | | | | | | | | | | |
Series 2005-21CB, Class A17, 6.00%, 6/25/35 | | | | | | | 12,817 | | | | 12,063,940 | |
Series 2006-43CB, Class 1A10, 6.00%, 2/25/37 | | | | | | | 5,415 | | | | 4,278,215 | |
Series 2006-J4, Class 2A8, 6.00%, 7/25/36 | | | | | | | 10,237 | | | | 8,619,230 | |
Series 2006-OA21, Class A1, 0.37%, 3/20/47 (a) | | | | | | | 21,627 | | | | 14,929,845 | |
Series 2007-22, Class 2A16, 6.50%, 9/25/37 | | | | | | | 23,272 | | | | 17,945,863 | |
Countrywide Home Loan Mortgage
Pass-Through Trust: | | | | | | | | | | | | |
Series 2004-29, Class 1A1, 0.72%, 2/25/35 (a) | | | | | | | 836 | | | | 774,732 | |
Series 2005-HYB9, Class 2A1, 2.42%, 2/20/36 (a) | | | | | | | 14,591 | | | | 11,812,444 | |
Credit Suisse Mortgage Capital Certificates: | | | | | | | | | | | | |
Series 2010-20R, Class 9A1, 2.76%, 1/27/36 (a)(b) | | | | | | | 6,705 | | | | 6,699,965 | |
Series 2011-2R, Class 1A1, 2.60%, 3/27/37 (a)(b) | | | | | | | 3,673 | | | | 3,584,958 | |
Series 2011-2R, Class 2A1, 2.63%, 7/27/36 (a)(b) | | | | | | | 12,599 | | | | 12,550,771 | |
Series 2011-5R, Class 3A1, 5.12%, 9/27/47 (a)(b) | | | | | | | 4,747 | | | | 4,644,571 | |
Deutsche Alt-A Securities Mortgage Loan Trust, Series 2007-RMP1, Class A2,
0.33%, 12/25/36 (a) | | | | | | | 5,169 | | | | 4,050,608 | |
First Horizon Mortgage Pass-Through Trust, Series 2005-AR3, Class 3A1,
2.59%, 8/25/35 (a) | | | | | | | 1,635 | | | | 1,435,473 | |
Fosse Master Issuer PLC, Series 2012-1A, Class 2A2, 1.66%, 10/18/54 (a)(b) | | | | | | | 3,645 | | | | 3,660,163 | |
Gemgarto, Series 2012-1, Class A1,
3.46%, 5/14/45 (a) | | | GBP | | | | 1,579 | | | | 2,644,376 | |
GSR Mortgage Loan Trust, Series 2005-AR2, Class 2A1, 2.81%, 4/25/35 (a) | | | USD | | | | 4,609 | | | | 4,538,470 | |
| | | | | | | | | | | | |
| Non-Agency Mortgage-Backed Securities | | Par (000) | | | Value | |
Collateralized Mortgage Obligations (concluded) | | | | | | | | | | | | |
HomeBanc Mortgage Trust: | | | | | | | | | | | | |
Series 2005-4, Class A1, 0.45%, 10/25/35 (a) | | | USD | | | | 21,251 | | | $ | 17,947,578 | |
Series 2006-2, Class A1, 0.36%, 12/25/36 (a) | | | | | | | 5,848 | | | | 4,890,977 | |
Impac Secured Assets CMN Owner Trust, Series 2004-3, Class 1A4, 0.98%, 11/25/34 (a) | | | | | | | 948 | | | | 875,777 | |
Lanark Master Issuer PLC, Series 2012-2X, Class 2A, 2.14%, 12/22/54 (a) | | | GBP | | | | 2,673 | | | | 4,474,261 | |
Paragon Mortgages No. 13 PLC, Series 13X, Class A2C, 0.45%, 1/15/39 (a) | | | USD | | | | 494 | | | | 431,696 | |
Residential Mortgage Securities Ltd., Series 26, Class A1, 2.76%, 2/14/41 (a) | | | GBP | | | | 1,930 | | | | 3,190,963 | |
Silk Road Finance Number Three PLC, Series
2012-1, Class A, 1.87%, 6/21/55 (a) | | | | | | | 1,679 | | | | 2,753,686 | |
| | | | | | | | | | | | |
| | | | | | | | | | | | 148,995,656 | |
Commercial Mortgage-Backed Securities — 12.1% | |
Banc of America Commercial Mortgage Trust: | | | | | | | | | | | | |
Series 2007-3, Class A1A, 5.86%, 6/10/49 (a) | | | USD | | | | 8,606 | | | | 9,420,577 | |
Series 2007-3, Class A4, 5.86%, 6/10/49 (a) | | | | | | | 2,730 | | | | 3,038,831 | |
Banc of America Large Loan Trust, Series 2010-HLTN, Class HLTN,
2.48%, 11/15/15 (a)(b) | | | | | | | 15,320 | | | | 15,344,968 | |
Banc of America Merrill Lynch Commercial Mortgage, Inc., Series 2005-3, Class A3A,
4.62%, 7/10/43 | | | | | | | 850 | | | | 866,388 | |
Bear Stearns Commercial Mortgage
Securities Trust: | | | | | | | | | | | | |
Series 2005-PW10, Class AM, 5.45%, 12/11/40 (a) | | | | | | | 1,350 | | | | 1,446,657 | |
Series 2006-PW14, Class A1A, 5.19%, 12/11/38 | | | | | | | 7,609 | | | | 8,381,768 | |
Series 2007-PW15, Class A1A, 5.32%, 2/11/44 | | | | | | | 5,213 | | | | 5,750,189 | |
Series 2007-PW17, Class A1A, 5.65%, 6/11/50 (a) | | | | | | | 5,215 | | | | 5,816,058 | |
Citigroup/Deutsche Bank Commercial
Mortgage Trust: | | | | | | | | | | | | |
Series 2007-CD4, Class A2B, 5.21%, 12/11/49 | | | | | | | 285 | | | | 284,963 | |
Series 2007-CD4, Class AMFX, 5.37%, 12/11/49 (a) | | | | | | | 5,945 | | | | 5,977,287 | |
Series 2007-CD5, Class AMA, 6.32%, 11/15/44 (a) | | | | | | | 640 | | | | 724,331 | |
Commercial Mortgage Pass-Through Certificates: | | | | | | | | | | | | |
Series 2010-RR1, Class GEB, 5.54%, 12/11/49 (a)(b) | | | | | | | 2,260 | | | | 2,451,582 | |
Series 2012-LTRT, Class A2, 3.40%, 10/05/30 (b) | | | | | | | 3,755 | | | | 3,509,949 | |
Series 2013-GAM, Class A2, 3.37%, 2/10/28 (b) | | | | | | | 4,900 | | | | 4,716,554 | |
Credit Suisse First Boston Mortgage Securities Corp., Series 2005-C3, Class AJ,
4.77%, 7/15/37 | | | | | | | 920 | | | | 957,166 | |
Credit Suisse Mortgage Capital Certificates: | | | | | | | | | | | | |
Series 2007-TF2A, Class A3, 0.45%, 4/15/22 (a)(b) | | | | | | | 6,590 | | | | 6,279,987 | |
Series 2010-RR1, Class 2A, 5.70%, 9/15/40 (a)(b) | | | | | | | 4,730 | | | | 5,296,313 | |
Del Coronado Trust, Series 2013-HDMZ, Class M,
5.18%, 3/15/18 (a)(b) | | | | | | | 3,820 | | | | 3,836,808 | |
Deutsche Bank ReREMIC Trust: | | | | | | | | | | | | |
Series 2011-C32, Class A3A, 5.94%, 6/17/49 (a)(b) | | | | | | | 3,800 | | | | 4,256,000 | |
See Notes to Consolidated Financial Statements.
| | | | | | |
| | | BLACKROCK BALANCED CAPITAL FUND, INC. | | SEPTEMBER 30, 2013 | | 45 |
| | | | |
| Consolidated Schedule of Investments (continued) | | | Master Total Return Portfolio | |
| | | (Percentages shown are based on Net Assets) | |
| | | | | | | | | | | | |
| Non-Agency Mortgage-Backed Securities | | Par (000) | | | Value | |
Commercial Mortgage-Backed Securities (continued) | | | | | |
Series 2012-EZ1, Class A, 0.95%, 9/25/45 (b) | | | USD | | | | 12,263 | | | $ | 12,257,816 | |
Series 2013-EZ3, Class A, 1.64%, 12/18/49 (a)(b) | | | | | | | 4,005 | | | | 3,998,906 | |
Extended Stay America Trust, Series 2013-ESH7, Class A27, 2.96%, 12/05/31 (b) | | | | | | | 3,850 | | | | 3,762,386 | |
GE Capital Commercial Mortgage Corp. Trust, Series 2007-C1, Class A2, 5.42%, 12/10/49 | | | | | | | 18,063 | | | | 18,070,377 | |
German Residential Funding PLC, Series 2013-1,
Class E, 4.37%, 8/27/24 (a) | | | EUR | | | | 1,187 | | | | 1,626,003 | |
Greenwich Capital Commercial Funding Corp.: | | | | | | | | | | | | |
Series 2005-GG3, Class A3, 4.57%, 8/10/42 | | | USD | | | | 551 | | | | 550,571 | |
Series 2007-GG11, Class A4, 5.74%, 12/10/49 | | | | | | | 1,850 | | | | 2,077,918 | |
Series 2007-GG11, Class AM, 5.87%, 12/10/49 (a) | | | | | | | 1,670 | | | | 1,817,810 | |
Series 2007-GG9, Class AM, 5.48%, 3/10/39 | | | | | | | 595 | | | | 626,921 | |
Series 2007-GG9, Class AMFX, 5.48%, 3/10/39 | | | | | | | 485 | | | | 507,162 | |
GS Mortgage Securities Corp. II, Series 2005-GG4,
Class A4, 4.76%, 7/10/39 | | | | | | | 13,351 | | | | 13,957,242 | |
GS Mortgage Securities Corp. Trust, Series 2012-SHOP, Class C, 3.63%, 6/05/31 (b) | | | | | | | 820 | | | | 819,220 | |
GS Mortgage Securities Trust: | | | | | | | | | | | | |
Series 2006-GG8, Class AJ, 5.62%, 11/10/39 | | | | | | | 725 | | | | 693,138 | |
Series 2006-GG8, Class AM, 5.59%, 11/10/39 | | | | | | | 1,470 | | | | 1,592,729 | |
Series 2007-GG10, Class A1A, 5.99%, 8/10/45 (a) | | | | | | | 5,907 | | | | 6,528,900 | |
JPMorgan Chase Commercial Mortgage
Securities Trust: | | | | | | | | | | | | |
Series 2006-CB14, Class AM, 5.63%, 12/12/44 (a) | | | | | | | 5,065 | | | | 5,473,011 | |
Series 2006-LDP8, Class AJ, 5.48%, 5/15/45 (a) | | | | | | | 2,000 | | | | 2,063,006 | |
Series 2006-LDP9, Class AM, 5.37%, 5/15/47 | | | | | | | 6,930 | | | | 7,415,571 | |
Series 2007-CB18, Class A1A, 5.43%, 6/12/47 (a) | | | | | | | 10,728 | | | | 11,856,767 | |
Series 2007-CB20, Class AJ, 6.28%, 2/12/51 (a) | | | | | | | 11,095 | | | | 11,293,933 | |
Series 2007-CB20, Class AM, 6.08%, 2/12/51 (a) | | | | | | | 1,000 | | | | 1,125,478 | |
Series 2007-LD11, Class A2, 5.99%, 6/15/49 (a) | | | | | | | 13,937 | | | | 14,268,684 | |
Series 2007-LD12, Class A1A, 5.85%, 2/15/51 (a) | | | | | | | 9,858 | | | | 11,150,303 | |
Series 2007-LDPX, Class A1A, 5.44%, 1/15/49 | | | | | | | 7,752 | | | | 8,611,404 | |
Series 2008-C2, Class ASB, 6.13%, 2/12/51 (a) | | | | | | | 2,109 | | | | 2,278,451 | |
Series 2013-C10, Class C, 4.30%, 12/15/47 (a) | | | | | | | 1,885 | | | | 1,754,296 | |
LB-UBS Commercial Mortgage Trust: | | | | | | | | | | | | |
Series 2005-C2, Class AJ, 5.21%, 4/15/30 (a) | | | | | | | 3,055 | | | | 3,167,943 | |
Series 2007-C1, Class AJ, 5.48%, 2/15/40 | | | | | | | 5,670 | | | | 5,669,087 | |
Series 2007-C7, Class A3, 5.87%, 9/15/45 (a) | | | | | | | 2,887 | | | | 3,230,283 | |
| | | | | | | | | | | | |
| Non-Agency Mortgage-Backed Securities | | Par (000) | | | Value | |
Commercial Mortgage-Backed Securities (concluded) | | | | | |
Merrill Lynch Mortgage Trust, Series 2005-CKI1, Class AJ, 5.46%, 11/12/37 (a) | | | USD | | | | 4,160 | | | $ | 4,369,123 | |
ML-CFC Commercial Mortgage Trust: | | | | | | | | | | | | |
Series 2006-1, Class AJ, 5.75%, 2/12/39 (a) | | | | | | | 3,100 | | | | 3,211,777 | |
Series 2007-9, Class ASB, 5.64%, 9/12/49 | | | | | | | 20,149 | | | | 20,678,920 | |
Morgan Stanley Bank of America Merrill Lynch Trust, Series 2012-CKSV, Class CK,
4.30%, 10/15/30 (b) | | | | | | | 8,496 | | | | 7,469,843 | |
Morgan Stanley Capital I Trust: | | | | | | | | | | | | |
Series 2007-HQ12, Class A2FX, 5.58%, 4/12/49 (a) | | | | | | | 753 | | | | 767,366 | |
Series 2007-HQ12, Class AM, 5.76%, 4/12/49 (a) | | | | | | | 6,695 | | | | 7,108,035 | |
Series 2007-IQ13, Class A1A, 5.31%, 3/15/44 | | | | | | | 10,647 | | | | 11,749,804 | |
Series 2007-IQ14, Class A1A, 5.67%, 4/15/49 (a) | | | | | | | 4,001 | | | | 4,396,194 | |
Series 2007-IQ14, Class AM, 5.87%, 4/15/49 (a) | | | | | | | 6,600 | | | | 6,732,667 | |
Series 2007-IQ15, Class AM, 6.11%, 6/11/49 (a) | | | | | | | 4,505 | | | | 4,832,428 | |
Morgan Stanley Capital I, Inc., Series 1998-WF2, Class G, 6.34%, 7/15/30 (a)(b) | | | | | | | 1,205 | | | | 1,226,256 | |
Morgan Stanley ReREMIC Trust: | | | | | | | | | | | | |
Series 2009-IO, Class B, 0.00%, 7/17/56 (b)(d) | | | | | | | 5,789 | | | | 5,644,682 | |
Series 2011-IO, Class A, 2.50%, 3/23/51 (b) | | | | | | | 1,181 | | | | 1,182,788 | |
Series 2012-IO, Class AXB1, 1.00%, 3/27/51 (b) | | | | | | | 3,142 | | | | 3,113,103 | |
Series 2012-IO, Class AXB2, 1.00%, 3/27/51 (b) | | | | | | | 2,680 | | | | 2,585,369 | |
Series 2012-XA, Class A, 2.00%, 7/27/49 (b) | | | | | | | 4,996 | | | | 5,030,456 | |
Motel 6 Trust, Series 2012-MTL6, Class B,
2.74%, 10/05/25 (b) | | | | | | | 2,655 | | | | 2,628,798 | |
New York Securitization Trust, Series 2012-1, Class A, 6.68%, 12/27/47 (a)(b) | | | | | | | 12,069 | | | | 12,069,000 | |
ORES NPL LLC, Series 2012-LV1, Class A,
4.00%, 9/25/44 (b) | | | | | | | 454 | | | | 454,031 | |
RBSCF Trust, Series 2010-RR3, Class WBTA,
6.12%, 2/16/51 (a)(b) | | | | | | | 14,186 | | | | 15,405,816 | |
RCMC LLC, Series 2012-CRE1, Class A,
5.62%, 11/15/44 (b) | | | | | | | 6,999 | | | | 7,000,652 | |
SMA Issuer I LLC, Series 2012-LV1, Class A,
3.50%, 8/20/25 (b) | | | | | | | 2,145 | | | | 2,148,605 | |
STRIPs Ltd., Series 2012-1A, Class A,
1.50%, 12/25/44 (b) | | | | | | | 7,728 | | | | 7,612,470 | |
Wachovia Bank Commercial Mortgage Trust: | | | | | | | | | | | | |
Series 2006-C28, Class A2, 5.50%, 10/15/48 | | | | | | | 1,202 | | | | 1,210,656 | |
Series 2007-C33, Class A4, 6.12%, 2/15/51 (a) | | | | | | | 4,310 | | | | 4,762,934 | |
Series 2007-C33, Class AJ, 6.12%, 2/15/51 (a) | | | | | | | 3,775 | | | | 3,626,337 | |
Wells Fargo Resecuritization Trust, Series 2012-IO, Class A, 1.75%, 8/20/21 (b) | | | | | | | 4,444 | | | | 4,429,282 | |
WF-RBS Commercial Mortgage Trust, Series 2013-C11, Class A4, 3.04%, 3/15/45 | | | | | | | 5,745 | | | | 5,479,501 | |
| | | | | | | | | | | | |
| | | | | | | | | | | | 403,528,585 | |
See Notes to Consolidated Financial Statements.
| | | | | | |
| 46 | | BLACKROCK BALANCED CAPITAL FUND, INC. | | SEPTEMBER 30, 2013 | | |
| | | | |
| Consolidated Schedule of Investments (continued) | | | Master Total Return Portfolio | |
| | | (Percentages shown are based on Net Assets) | |
| | | | | | | | | | | | |
| Non-Agency Mortgage-Backed Securities | | Par (000) | | | Value | |
Interest Only Commercial Mortgage-Backed Securities — 0.9% | |
Citigroup Commercial Mortgage Trust, Series 2013-GC15, Class XA,
1.31%, 9/10/46 (a) | | | USD | | | | 29,170 | | | $ | 2,231,505 | |
Commercial Mortgage Pass-Through Certificates: | | | | | | | | | | | | |
Series 2012-CR1, Class XA, 2.42%, 5/15/45 (a) | | | | | | | 21,810 | | | | 2,728,222 | |
Series 2013-CR6, Class XA, 1.70%, 3/10/46 (a) | | | | | | | 54,970 | | | | 4,381,555 | |
GS Mortgage Securities Corp. II, Series 2013-KYO, Class XB1,
3.25%, 11/08/29 (a)(b) | | | | | | | 30,760 | | | | 1,671,372 | |
JPMorgan Chase Commercial Mortgage
Securities Trust: | | | | | | | | | | | | |
Series 2012-CBX, Class XA, 2.20%, 6/15/45 (a) | | | | | | | 20,720 | | | | 2,134,762 | |
Series 2013-LC11, Class XA, 1.73%, 4/15/46 (a) | | | | | | | 25,987 | | | | 2,601,184 | |
Series 2013-LC11, Class XB, 0.73%, 4/15/46 (a) | | | | | | | 4,570 | | | | 206,532 | |
Morgan Stanley Bank of America Merrill Lynch Trust, Series 2013-C7, Class XA,
1.89%, 2/15/46 (a) | | | | | | | 22,172 | | | | 2,281,544 | |
Morgan Stanley Capital I Trust, Series 2012-C4, Class XA,
2.86%, 3/15/45 (a)(b) | | | | | | | 41,389 | | | | 5,316,208 | |
WaMu Commercial Mortgage Securities Trust, Series 2005-C1A, Class X,
0.81%, 5/25/36 (a)(b) | | | | | | | 1,627 | | | | 22,039 | |
WF-RBS Commercial Mortgage Trust: | | | | | | | | | | | | |
Series 2012-C10, Class XA, 1.98%, 12/15/45 (a)(b) | | | | | | | 36,448 | | | | 4,093,343 | |
Series 2013-C15, Class XA, 0.87%, 8/15/46 (a) | | | | | | | 41,396 | | | | 1,822,125 | |
| | | | | | | | | | | | |
| | | | | | | | | | | | 29,490,391 | |
Total Non-Agency Mortgage-Backed Securities — 17.5% | | | | 582,014,632 | |
| | | | | | | | | | | | |
| Other Interests (f) | | | | | Beneficial
Interest (000) | | | | |
Capital Markets — 0.0% | | | | | | | | | | | | |
Lehman Brothers Holdings Capital
Trust VII (g)(h) | | | | | | | 1,888 | | | | — | |
Lehman Brothers Holdings, Inc. (g)(h) | | | | | | | 7,360 | | | | 1 | |
Total Other Interests — 0.0% | | | | | | | | | | | 1 | |
| | | | | | | | | | | | |
| Preferred Securities | | | | | | | | | |
| Capital Trusts | | Par (000) | | | | |
Automobiles — 0.0% | | | | | | | | | | | | |
Volkswagen International Finance NV,
3.88% (a)(i) | | | EUR | | | | 100 | | | | 135,623 | |
Capital Markets — 0.0% | | | | | | | | | | | | |
State Street Capital Trust IV,
1.25%, 6/01/77 (a) | | | USD | | | | 770 | | | | 600,600 | |
Commercial Banks — 0.0% | | | | | | | | | | | | |
Barclays Bank PLC, 4.75% (a)(i) | | | EUR | | | | 410 | | | | 438,188 | |
Barclays Bank PLC, 4.88% (a)(i) | | | | | | | 500 | | | | 573,270 | |
Deutsche Bank Capital Funding
Trust XI, 9.50% (i) | | | | | | | 80 | | | | 115,787 | |
HSBC Capital Funding LP, 5.37% (a)(i) | | | | | | | 100 | | | | 136,300 | |
| | | | | | | | | | | | |
| | | | | | | | | | | | 1,263,545 | |
| | | | | | | | | | | | |
| Capital Trusts | | Par (000) | | | Value | |
Diversified Financial Services — 0.2% | |
JPMorgan Chase & Co.: | | | | | | | | | | | | |
5.15% (a)(i) | | | USD | | | | 2,662 | | | $ | 2,329,250 | |
6.00%, 12/29/49 (a)(i) | | | | | | | 5,875 | | | | 5,507,813 | |
| | | | | | | | | | | | |
| | | | | | | | | | | | 7,837,063 | |
Electric Utilities — 0.1% | | | | | | | | | | | | |
Enel SpA, 8.75%, 9/24/73 (a)(b) | | | USD | | | | 1,375 | | | | 1,399,588 | |
NGG Finance PLC, 4.25%, 6/18/76 (a) | | | EUR | | | | 100 | | | | 133,729 | |
| | | | | | | | | | | | |
| | | | | | | | | | | | 1,533,317 | |
Insurance — 0.3% | | | | | | | | | | | | |
Allianz Finance II BV, 4.38% (a)(i) | | | USD | | | | 100 | | | | 139,513 | |
Generali Finance BV, 5.48% (a)(i) | | | EUR | | | | 50 | | | | 62,908 | |
MetLife Capital Trust IV, 7.88%, 12/15/67 (b) | | | USD | | | | 1,841 | | | | 2,071,125 | |
Prudential Financial, Inc., 5.88%, 9/15/42 (a) | | | | | | | 4,460 | | | | 4,370,800 | |
XL Group PLC, 6.50% (a)(i) | | | | | | | 4,595 | | | | 4,399,713 | |
| | | | | | | | | | | | |
| | | | | | | | | | | | 11,044,059 | |
Media — 0.1% | | | | | | | | | | | | |
NBCUniversal Enterprise, Inc.,
5.25%, 12/19/49 (b)(i) | | | | | | | 3,600 | | | | 3,564,000 | |
Multi-Utilities — 0.0% | | | | | | | | | | | | |
GDF SUEZ, 3.88%, 12/31/49 (a) | | | EUR | | | | 100 | | | | 136,065 | |
RWE AG, 4.63% (a)(i) | | | | | | | 65 | | | | 88,991 | |
| | | | | | | | | | | | |
| | | | | | | | | | | | 225,056 | |
Total Capital Trusts — 0.7% | | | | | | | | | | | 26,203,263 | |
| | | | | | | | | | | | |
| Preferred Stocks | | | | | Shares | | | | |
Commercial Banks — 0.2% | | | | | | | | | | | | |
Wells Fargo & Co., 5.85% (i) | | | | | | | 220,000 | | | | 5,251,400 | |
| | | | | | | | | | | | |
| Trust Preferreds | | | | | | | | | |
Diversified Financial Services — 0.3% | | | | | | | | | | | | |
Citigroup Capital XIII, 7.88%, 10/30/40 | | | | | | | 349,440 | | | | 9,599,117 | |
Total Preferred Securities — 1.2% | | | | | | | | | | | 41,053,780 | |
| | | | | | | | | | | | |
| Taxable Municipal Bonds | | Par (000) | | | | |
New York City Municipal Water Finance
Authority RB: | | | | | | | | | | | | |
5.38%, 6/15/43 | | | USD | | | | 4,410 | | | | 4,681,215 | |
5.50%, 6/15/43 | | | | | | | 5,285 | | | | 5,653,893 | |
Total Taxable Municipal Bonds — 0.3% | | | | | | | | | | | 10,335,108 | |
| | | | | | | | | | | | |
| U.S. Government Sponsored Agency Securities | |
Agency Obligations — 0.9% | | | | | | | | | | | | |
Fannie Mae, 6.63%, 11/15/30 | | | | | | | 1,450 | | | | 1,938,150 | |
Freddie Mac: | | | | | | | | | | | | |
2.50%, 4/23/14 (j) | | | | | | | 6,100 | | | | 6,182,978 | |
3.75%, 3/27/19 (k) | | | | | | | 3,650 | | | | 4,016,537 | |
4.38%, 7/17/15 (j) | | | | | | | 7,950 | | | | 8,528,378 | |
4.88%, 6/13/18 | | | | | | | 4,300 | | | | 4,943,835 | |
See Notes to Consolidated Financial Statements.
| | | | | | |
| | | BLACKROCK BALANCED CAPITAL FUND, INC. | | SEPTEMBER 30, 2013 | | 47 |
| | | | |
| Consolidated Schedule of Investments (continued) | | | Master Total Return Portfolio | |
| | | (Percentages shown are based on Net Assets) | |
| | | | | | | | | | | | |
| U.S. Government Sponsored Agency Securities | | Par (000) | | | Value | |
Agency Obligations (concluded) | | | | | | | | | | | | |
FREMF Mortgage Trust: | | | | | | | | | | | | |
Series 2012-K23, Class B, 3.78%, 10/25/45 (b) | | | USD | | | | 3,060 | | | $ | 2,752,439 | |
Series 2012-K706, Class C, 4.16%, 11/25/44 (a)(b) | | | | | | | 710 | | | | 672,285 | |
Series 2013-K713, Class B, 3.27%, 4/25/20 (a)(b) | | | | | | | 615 | | | | 562,614 | |
U.S. Small Business Administration,
Series 2004-P10A, Class 1, 4.50%, 2/10/14 | | | | | | | 60 | | | | 60,566 | |
| | | | | | | | | | | | |
| | | | | | | | | | | | 29,657,782 | |
Collateralized Mortgage Obligations — 0.0% | | | | | | | | | | | | |
Fannie Mae, Series 2005-48, Class AR,
5.50%, 2/25/35 | | | | | | | 26 | | | | 27,793 | |
Freddie Mac, Series 2825, Class VP,
5.50%, 6/15/15 | | | | | | | 457 | | | | 460,411 | |
| | | | | | | | | | | | |
| | | | | | | | | | | | 488,204 | |
Commercial Mortgage-Backed Securities — 0.9% | |
Fannie Mae, Series 2006-M2, Class A2A,
5.27%, 10/25/32 (a) | | | | | | | 4,225 | | | | 4,843,876 | |
Freddie Mac: | | | | | | | | | | | | |
Series K027, Class A2, 2.64%, 1/25/23 | | | | | | | 7,275 | | | | 6,920,293 | |
Series K030, Class A2, 3.25%, 4/25/23 | | | | | | | 5,505 | | | | 5,482,743 | |
Series K031, Class A2, 3.30%, 4/25/23 | | | | | | | 12,025 | | | | 12,002,092 | |
| | | | | | | | | | | | |
| | | | | | | | | | | | 29,249,004 | |
Interest Only Collateralized Mortgage Obligations — 0.0% | |
Fannie Mae, Series 2013-52, Class EI,
4.00%, 3/25/43 | | | | | | | 4,596 | | | | 570,655 | |
Freddie Mac, Series 3990, Class SN,
6.42%, 2/15/40 (a) | | | | | | | 1,209 | | | | 53,828 | |
| | | | | | | | | | | | |
| | | | | | | | | | | | 624,483 | |
Interest Only Commercial Mortgage-Backed Securities — 0.3% | |
Fannie Mae, Series 2013-M5, Class X2,
2.53%, 1/25/21 | | | | | | | 13,307 | | | | 1,804,269 | |
Freddie Mac: | | | | | | | | | | | | |
Series K019, Class X1, 1.88%, 3/25/22 | | | | | | | 10,196 | | | | 1,142,755 | |
Series K707, Class X1, 1.69%, 1/25/47 | | | | | | | 22,903 | | | | 1,568,520 | |
Series K710, Class X1, 1.91%, 5/25/19 | | | | | | | 17,024 | | | | 1,418,576 | |
Series K009, Class X1, 1.66%, 8/25/20 | | | | | | | 43,407 | | | | 3,284,527 | |
Ginnie Mae, Series 2012-120, Class IO,
1.01%, 2/16/53 | | | | | | | 23,729 | | | | 1,765,580 | |
| | | | | | | | | | | | |
| | | | | | | | | | | | 10,984,227 | |
Mortgage-Backed Securities — 46.3% | | | | | | | | | | | | |
Fannie Mae Mortgage-Backed Securities: | | | | | | | | | | | | |
1.99%, 8/01/43 (a) | | | | | | | 834 | | | | 826,656 | |
2.02%, 12/01/42 (a) | | | | | | | 4,288 | | | | 4,284,070 | |
2.05%, 1/01/43-2/01/43 (a) | | | | | | | 4,357 | | | | 4,351,306 | |
2.05%, 8/01/43 (a) | | | | | | | 508 | | | | 504,346 | |
2.07%, 7/01/43 (a) | | | | | | | 1,323 | | | | 1,314,359 | |
2.08%, 8/01/43 (a) | | | | | | | 3,007 | | | | 2,988,730 | |
2.09%, 6/01/43 (a) | | | | | | | 605 | | | | 600,786 | |
2.16%, 12/01/42 (a) | | | | | | | 2,097 | | | | 2,107,805 | |
2.23%, 10/01/42 (a) | | | | | | | 5,022 | | | | 5,131,919 | |
2.25%, 10/01/42 (a) | | | | | | | 2,120 | | | | 2,131,852 | |
2.25%, 9/01/43 (a) | | | | | | | 2,702 | | | | 2,698,680 | |
2.27%, 7/01/43 (a) | | | | | | | 1,940 | | | | 1,949,396 | |
2.50%, 10/01/28 (l) | | | | | | | 121,400 | | | | 122,082,875 | |
2.97%, 3/01/41 (a) | | | | | | | 1,999 | | | | 2,084,950 | |
3.00%, 10/01/28-10/01/43 (l) | | | | | | | 166,178 | | | | 164,007,344 | |
3.15%, 3/01/41 (a) | | | | | | | 2,273 | | | | 2,364,550 | |
3.23%, 12/01/40 (a) | | | | | | | 4,175 | | | | 4,375,836 | |
| | | | | | | | | | | | |
| U.S. Government Sponsored Agency Securities | | Par (000) | | | Value | |
Mortgage-Backed Securities (concluded) | | | | | | | | | | | | |
3.50%, 7/01/28-10/01/43 (l) | | | USD | | | | 132,767 | | | $ | 135,856,587 | |
4.00%, 1/01/25-10/01/43 (j) | | | | | | | 172,773 | | | | 181,740,887 | |
4.50%, 2/01/25-10/01/43 (l) | | | | | | | 110,999 | | | | 118,552,254 | |
5.00%, 5/01/23-10/01/43 (l) | | | | | | | 72,182 | | | | 78,418,511 | |
5.00%, 8/01/38 (a) | | | | | | | 3,569 | | | | 3,811,998 | |
5.21%, 10/01/38 (a) | | | | | | | 25 | | | | 26,626 | |
5.50%, 12/01/32-10/01/43 (l) | | | | | | | 53,774 | | | | 58,655,416 | |
6.00%, 2/01/34-10/01/43 (l) | | | | | | | 52,377 | | | | 57,418,789 | |
6.50%, 5/01/40 | | | | | | | 16,526 | | | | 18,264,721 | |
Freddie Mac Mortgage-Backed Securities: | | | | | | | | | | | | |
2.10%, 1/01/43 (a) | | | | | | | 2,221 | | | | 2,223,225 | |
2.10%, 6/01/43 (a) | | | | | | | 1,902 | | | | 1,892,950 | |
2.11%, 1/01/43 (a) | | | | | | | 2,134 | | | | 2,135,207 | |
2.14%, 8/01/43 (a) | | | | | | | 2,428 | | | | 2,422,538 | |
2.20%, 8/01/43 (a) | | | | | | | 2,401 | | | | 2,401,498 | |
2.23%, 8/01/43 (a) | | | | | | | 704 | | | | 705,157 | |
2.31%, 10/01/36 (a) | | | | | | | 42 | | | | 44,444 | |
2.48%, 2/01/37 (a) | | | | | | | 30 | | | | 32,091 | |
2.62%, 2/01/37 (a) | | | | | | | 96 | | | | 102,476 | |
2.92%, 6/01/42 (a) | | | | | | | 5,279 | | | | 5,442,335 | |
3.00%, 10/01/28-10/01/43 (l) | | | | | | | 54,359 | | | | 53,653,375 | |
3.03%, 2/01/41 (a) | | | | | | | 3,667 | | | | 3,831,182 | |
3.50%, 10/01/28-10/01/43 (l) | | | | | | | 35,500 | | | | 36,392,500 | |
4.00%, 10/01/28-10/01/43 (l) | | | | | | | 85,100 | | | | 88,982,865 | |
4.50%, 10/01/41-10/01/43 (l) | | | | | | | 58,510 | | | | 62,262,075 | |
5.00%, 7/01/35-10/01/43 (l) | | | | | | | 34,186 | | | | 36,916,997 | |
5.50%, 10/01/43 (l) | | | | | | | 17,000 | | | | 18,418,437 | |
Ginnie Mae Mortgage-Backed Securities: | | | | | | | | | | | | |
1.63%, 5/20/34 (a) | | | | | | | 1,201 | | | | 1,251,868 | |
3.00%, 10/15/43 (l) | | | | | | | 24,600 | | | | 24,311,717 | |
3.50%, 2/15/42-10/15/43 (l) | | | | | | | 57,605 | | | | 59,424,038 | |
4.00%, 10/20/40-10/15/43 (l) | | | | | | | 42,850 | | | | 45,383,385 | |
4.50%, 5/20/41-2/15/42 (j) | | | | | | | 67,381 | | | | 72,923,025 | |
5.00%, 12/15/38-10/15/43 (l) | | | | | | | 38,794 | | | | 42,313,976 | |
| | | | | | | | | | | | |
| | | | | | | | | | | | 1,540,018,610 | |
Total U.S. Government Sponsored Agency Securities — 48.4% | | | | 1,611,022,310 | |
| | | | | | | | | | | | |
| U.S. Treasury Obligations | | | | | | | | | |
U.S. Treasury Bonds, 3.63%, 8/15/43 (j) | | | | | | | 143,743 | | | | 142,081,043 | |
U.S. Treasury Inflation Indexed Bonds,
0.75%, 2/15/42 (j) | | | | | | | 12,137 | | | | 10,387,199 | |
U.S. Treasury Inflation Indexed Notes: | | | | | | | | | | | | |
0.13%, 1/15/23 (j) | | | | | | | 44,402 | | | | 43,194,312 | |
0.38%, 7/15/23 (j) | | | | | | | 93,741 | | | | 93,257,817 | |
U.S. Treasury Notes: | | | | | | | | | | | | |
0.38%, 8/31/15 (j) | | | | | | | 107,122 | | | | 107,247,547 | |
0.88%, 9/15/16-1/31/18 (j) | | | | | | | 260,889 | | | | 262,690,056 | |
0.75%, 2/28/18-3/31/18 | | | | | | | 35 | | | | 34,313 | |
1.50%, 8/31/18 (j) | | | | | | | 34,605 | | | | 34,834,812 | |
1.38%, 9/30/18-5/31/20 (j) | | | | | | | 66,286 | | | | 65,354,815 | |
1.13%, 4/30/20 | | | | | | | 976 | | | | 927,810 | |
2.13%, 8/31/20 (j) | | | | | | | 43,826 | | | | 44,212,896 | |
2.50%, 8/15/23 | | | | | | | 11,950 | | | | 11,828,636 | |
Total U.S. Treasury Obligations — 24.5% | | | | | | | | | | | 816,051,256 | |
Total Long-Term Investments (Cost — $4,930,234,801) — 149.3% | | | | | | | | | | | 4,971,944,618 | |
| | | | | | | | | | | | |
| | | | | | | | | | |
See Notes to Consolidated Financial Statements.
| | | | | | |
| 48 | | BLACKROCK BALANCED CAPITAL FUND, INC. | | SEPTEMBER 30, 2013 | | |
| | | | |
| Consolidated Schedule of Investments (continued) | | | Master Total Return Portfolio | |
| | | (Percentages shown are based on Net Assets) | |
| | | | | | | | | | | | |
| Short-Term Securities | | Par (000) | | | Value | |
Borrowed Bond Agreements — 9.4% | | | | | | | | | | | | |
Barclays Bank PLC, (0.88)%, Open
(Purchased on 5/29/13 to be repurchased at EUR 889,793, collateralized by Buoni Poliennali Del Tesoro, 3.75% due at 8/01/21, par and fair value of EUR 935,000 and $1,284,609, respectively) | | | EUR | | | | 960 | | | $ | 1,298,470 | |
Barclays Bank PLC, (0.45)%, Open
(Purchased on 2/20/13 to be repurchased at EUR 1,990,329, collateralized by Kingdom of Spain, 5.90% due at 7/30/26, par and fair value of EUR 1,870,000 and $2,843,276, respectively) | | | | | | | 2,120 | | | | 2,868,415 | |
Barclays Bank PLC, (0.22)%, Open
(Purchased on 2/06/13 to be repurchased at EUR 2,673,182, collateralized by Buoni Poliennali Del Tesoro, 4.50% due at 3/01/26, par and fair value of EUR 2,600,000 and $3,501,935, respectively) | | | | | | | 2,753 | | | | 3,724,905 | |
Barclays Bank PLC, (0.18)%, Open
(Purchased on 9/04/13 to be repurchased at EUR 1,157,948, collateralized by Buoni Poliennali Del Tesoro, 3.75% due at 8/01/21, par and fair value of EUR 1,170,000 and $1,572,475, respectively) | | | | | | | 1,175 | | | | 1,589,442 | |
Barclays Bank PLC, (0.11)%, Open
(Purchased on 9/04/13 to be repurchased at EUR 908,582, collateralized by Kingdom of Spain, 4.10% due at 7/30/18, par and fair value of EUR 860,000 and $1,222,613, respectively) | | | | | | | 914 | | | | 1,235,917 | |
Barclays Bank PLC, (0.10)%, Open
(Purchased on 5/22/13 to be repurchased at EUR 6,641,543, collateralized by Republic of France, 4.00% due at 4/25/18, par and fair value of EUR 5,680,000 and $8,707,264, respectively) | | | | | | | 6,675 | | | | 9,030,015 | |
Barclays Bank PLC, (0.10)%, Open
(Purchased on 5/22/13 to be repurchased at EUR 663,410, collateralized by Republic of France, 4.00% due at 4/25/18, par and fair value of EUR 570,000 and $869,750, respectively) | | | | | | | 667 | | | | 901,989 | |
Barclays Bank PLC, (0.09)%, Open
(Purchased on 9/02/13 to be repurchased at EUR 13,940,245, collateralized by Buoni Poliennali Del Tesoro, 3.75% due at 8/01/21, par and fair value of EUR 13,959,000 and $18,793,393, respectively) | | | | | | | 14,042 | | | | 18,996,171 | |
Barclays Bank PLC, (0.08)%, Open
(Purchased on 11/14/12 to be repurchased at EUR 29,465,149, collateralized by French Treasury Notes, 1.00% due at 7/25/17, par and fair value of EUR 29,115,000 and $39,647,595, respectively) | | | | | | | 29,578 | | | | 40,014,172 | |
Barclays Bank PLC, (0.08)%, Open
(Purchased on 11/14/12 to be repurchased at EUR 29,470,967, collateralized by French Treasury Notes, 1.00% due at 7/25/17, par and fair value of EUR 29,115,000 and $39,655,424, respectively) | | | | | | | 29,584 | | | | 40,022,073 | |
Barclays Bank PLC, (0.07)%, Open
(Purchased on 2/27/13 to be repurchased at EUR 2,271,005, collateralized by Kingdom of Spain, 5.50% due at 4/30/21, par and fair value of EUR 2,030,000 and $3,042,199, respectively) | | | | | | | 2,284 | | | | 3,090,230 | |
| | | | | | | | | | | | |
| Short-Term Securities | | Par (000) | | | Value | |
Borrowed Bond Agreements (continued) | | | | | | | | | | | | |
Barclays Bank PLC, (0.05)%, Open
(Purchased on 5/22/13 to be repurchased at EUR 666,112, collateralized by Kingdom of Belgium, 4.00% due at 3/28/18, par and fair value of EUR 570,000 and $646,832, respectively) | | | EUR | | | | 668 | | | $ | 903,365 | |
Barclays Bank PLC, (0.05)%, Open
(Purchased on 9/30/13 to be repurchased at EUR 1,802,834, collateralized by Buoni Poliennali Del Tesoro, 4.50% due at 5/01/23, par and fair value of EUR 1,730,000 and $2,359,155, respectively) | | | | | | | 1,812 | | | | 2,450,869 | |
Barclays Bank PLC, (0.04)%, Open
(Purchased on 5/21/13 to be repurchased at EUR 6,569,878, collateralized by Kingdom of Belgium, 4.00% due at 3/28/18, par and fair value of EUR 5,680,000 and $6,376,606, respectively) | | | | | | | 6,583 | | | | 8,905,566 | |
Barclays Bank PLC, (0.02)%, Open
(Purchased on 9/05/13 to be repurchased at EUR 905,135, collateralized by Buoni Poliennali Del Tesoro, 3.75% due at 3/01/21, par and fair value of EUR 890,000 and $1,200,786, respectively) | | | | | | | 907 | | | | 1,226,372 | |
Citigroup Global Markets Holdings, Inc., (0.10)%, Open (Purchased on 11/15/12 to be repurchased at EUR 59,325,691, collateralized by French Treasury Notes, 1.00% due at 7/25/17, par and fair value of EUR 58,800,000 and $79,902,618, respectively) | | | | | | | 59,609 | | | | 80,641,386 | |
Citigroup Global Markets, Inc., (0.10)%, Open
(Purchased on 7/11/13 to be repurchased at $4,145,031, collateralized by General Electric Capital Corp., 1.63% due at 4/02/18, par and fair value of USD 4,250,000 and $4,183,653, respectively) | | | USD | | | | 4,165 | | | | 4,165,000 | |
Credit Suisse Securities (USA) LLC, 0.00%, Open
(Purchased on 9/17/13 to be repurchased at $1,506,000, collateralized by U.S. Treasury Notes, 1.13% due at 3/31/20, par and fair value of USD 1,600,000 and $1,526,274, respectively) | | | | | | | 1,506 | | | | 1,506,000 | |
Credit Suisse Securities (USA) LLC, 0.02%, Open
(Purchased on 9/17/13 to be repurchased at $2,983,746, collateralized by U.S. Treasury Notes, 1.75% due at 5/15/23, par and fair value of USD 3,259,000 and $3,019,923, respectively) | | | | | | | 2,978 | | | | 2,977,911 | |
Credit Suisse Securities (USA) LLC, 0.02%, Open
(Purchased on 9/30/13 to be repurchased at $7,976,831, collateralized by U.S. Treasury Notes, 2.50% due at 8/15/23, par and fair value of USD 8,027,000 and $7,945,478, respectively) | | | | | | | 7,977 | | | | 7,976,831 | |
Credit Suisse Securities (USA) LLC, 0.04%, Open
(Purchased on 9/18/13 to be repurchased at $11,156,778, collateralized by U.S. Treasury Bonds, 2.75% due at 11/15/42, par and fair value of USD 13,550,000 and $11,214,738, respectively) | | | | | | | 11,026 | | | | 11,026,313 | |
See Notes to Consolidated Financial Statements.
| | | | | | |
| | | BLACKROCK BALANCED CAPITAL FUND, INC. | | SEPTEMBER 30, 2013 | | 49 |
| | | | |
| Consolidated Schedule of Investments (continued) | | | Master Total Return Portfolio | |
| | | (Percentages shown are based on Net Assets) | |
| | | | | | | | | | | | |
| Short-Term Securities | | Par (000) | | | Value | |
Borrowed Bond Agreements (concluded) | | | | | | | | | | | | |
Credit Suisse Securities (USA) LLC, 0.06%, Open
(Purchased on 9/03/13 to be repurchased at $1,198,564, collateralized by U.S. Treasury Notes, 1.25% due at 2/29/20, par and fair value of USD 1,260,000 and $1,212,750, respectively) | | | USD | | | | 1,194 | | | $ | 1,193,850 | |
Credit Suisse Securities (USA) LLC, 0.11%, Open
(Purchased on 9/03/13 to be repurchased at $6,596,059, collateralized by U.S. Treasury Notes, 1.13% due at 3/31/20, par and fair value of USD 6,966,000 and $6,636,190, respectively) | | | | | | | 6,548 | | | | 6,548,040 | |
Deutsche Bank Securities, Inc., (0.10)%, Open
(Purchased on 7/09/13 to be repurchased at $4,099,255, collateralized by Teck Resources Ltd., 4.75% due at 1/15/22, par and fair value of USD 4,000,000 and $4,014,076, respectively) | | | | | | | 4,135 | | | | 4,135,000 | |
Deutsche Bank Securities, Inc., (0.10)%, Open
(Purchased on 7/11/13 to be repurchased at $3,323,732, collateralized by Noble Holding International Ltd., 3.95% due at 3/15/22, par and fair value of USD 3,400,000 and $3,279,606, respectively) | | | | | | | 3,353 | | | | 3,353,250 | |
Deutsche Bank Securities, Inc., (0.02)%, Open
(Purchased on 9/23/13 to be repurchased at $31,640,604, collateralized by U.S. Treasury Notes, 0.63% due at 4/30/18, par and fair value of USD 32,734,000 and $31,818,463, respectively) | | | | | | | 31,670 | | | | 31,670,145 | |
Deutsche Bank Securities, Inc., 0.01%, Open
(Purchased on 9/25/13 to be repurchased at $17,244,637, collateralized by U.S. Treasury Bonds, 2.88% due at 5/15/43, par and fair value of USD 19,905,000 and $16,894,369, respectively) | | | | | | | 17,193 | | | | 17,192,944 | |
Morgan Stanley & Co. International PLC, (0.05)%, Open
(Purchased on 3/04/13 to be repurchased at EUR 2,798,482, collateralized by Kingdom of Spain, 5.85% due at 1/31/22, par and fair value of EUR 2,585,000 and $3,922,438, respectively) | | | EUR | | | | 2,811 | | | | 3,803,116 | |
| | | | | | | | | | | | |
| | | | | | | | | | | | 312,447,757 | |
| | | | | | Shares | | | | |
Money Market Funds — 1.5% | | | | | | | | | | | | |
BlackRock Liquidity Funds, TempFund, Institutional Class, 0.03% | | | | | | | 51,436,621 | | | | 51,436,621 | |
Total Short-Term Securities (Cost — $352,558,461) — 10.9% | | | | | | | | | | | 363,884,378 | |
| | | | | | | | | | | | |
| Options Purchased | | | | | | | | | |
(Cost — $6,720,165) — 0.1% | | | | | | | | | | | 3,147,392 | |
Total Investments Before TBA Sale Commitments, Options Written and Borrowed Bonds | | | | | | | | | | | | |
(Cost — $5,289,513,427) — 160.3% | | | | | | | | | | | 5,338,976,388 | |
| | | | | | | | | | | | |
| | | | | | | | | | |
| | | | | | | | | | | | |
| TBA Sale Commitments (l) | | Par (000) | | | Value | |
Fannie Mae Mortgage-Backed Securities: | | | | | | | | | | | | |
2.50%, 10/01/28 | | | USD | | | | 21,900 | | | $ | (22,023,188 | ) |
3.00%, 10/01/28-10/01/43 | | | | | | | 38,500 | | | | (37,633,063 | ) |
3.50%, 10/01/28-10/01/43 | | | | | | | 6,100 | | | | (6,224,484 | ) |
4.00%, 10/01/28-10/01/43 | | | | | | | 140,600 | | | | (147,730,072 | ) |
4.50%, 10/01/43 | | | | | | | 66,500 | | | | (71,019,925 | ) |
5.00%, 10/01/43 | | | | | | | 51,500 | | | | (55,845,312 | ) |
5.50%, 10/01/43 | | | | | | | 16,500 | | | | (17,985,000 | ) |
6.00%, 10/01/43 | | | | | | | 15,900 | | | | (17,390,625 | ) |
6.50%, 10/01/43 | | | | | | | 5,600 | | | | (6,204,625 | ) |
Freddie Mac Mortgage-Backed Securities: | | | | | | | | | | | | |
4.00%, 10/01/43 | | | | | | | 27,700 | | | | (28,950,821 | ) |
4.50%, 10/01/43 | | | | | | | 15,200 | | | | (16,178,500 | ) |
5.00%, 10/01/43 | | | | | | | 7,200 | | | | (7,761,094 | ) |
Ginnie Mae Mortgage-Backed Securities: | | | | | | | | | | | | |
3.50%, 10/15/43 | | | | | | | 16,400 | | | | (16,858,688 | ) |
4.00%, 10/15/43 | | | | | | | 1,300 | | | | (1,371,094 | ) |
4.50%, 10/15/43 | | | | | | | 12,000 | | | | (12,914,063 | ) |
5.00%, 10/15/43 | | | | | | | 1,100 | | | | (1,197,453 | ) |
Total TBA Sale Commitments (Proceeds — $459,888,477) — (14.0)% | | | | | | | | | | | (467,288,007 | ) |
| | | | | | | | | | | | |
| Options Written | | | | | | | | | |
(Premiums Received — $3,486,213) — (0.1)% | | | | | | | | | | | (1,609,661 | ) |
| | | | | | | | | | | | |
| Borrowed Bonds | | | | | | | | | |
Corporate Bonds — (0.3)% | | | | | | | | | | | | |
General Electric Capital Corp., 1.63%, 4/02/18 | | | | | | | 4,250 | | | | (4,183,653 | ) |
Noble Holding International Ltd., 3.95%, 3/15/22 | | | | | | | 3,400 | | | | (3,279,606 | ) |
Teck Resources Ltd., 4.75%, 1/15/22 | | | | | | | 4,000 | | | | (4,014,076 | ) |
| | | | | | | | | | | | |
| | | | | | | | | | | | (11,477,335 | ) |
Foreign Government Obligations — (6.5)% | | | | | | | | | | | | |
Buoni Poliennali Del Tesoro, | | | | | | | | | | | | |
3.75%, 3/01/21-8/01/21 | | | EUR | | | | 16,954 | | | | (22,851,263 | ) |
4.50%, 5/01/23-3/01/26 | | | | | | | 4,330 | | | | (5,861,090 | ) |
French Treasury Notes, | | | | | | | | | | | | |
1.00%, 7/25/17 | | | | | | | 117,030 | | | | (159,205,637 | ) |
Kingdom of Belgium, | | | | | | | | | | | | |
4.00%, 3/28/18 | | | | | | | 6,250 | | | | (7,023,438 | ) |
Kingdom of Spain, | | | | | | | | | | | | |
4.10%, 7/30/18 | | | | | | | 860 | | | | (1,222,613 | ) |
5.50%, 4/30/21 | | | | | | | 2,030 | | | | (3,042,199 | ) |
5.85%, 1/31/22 | | | | | | | 2,585 | | | | (3,922,438 | ) |
5.90%, 7/30/26 | | | | | | | 1,870 | | | | (2,843,276 | ) |
Republic of France, | | | | | | | | | | | | |
4.00%, 4/25/18 | | | | | | | 6,250 | | | | (9,577,014 | ) |
| | | | | | | | | | | | |
| | | | | | | | | | | | (215,548,968 | ) |
U.S. Treasury Obligations — (2.4)% | | | | | | | | | | | | |
U.S. Treasury Bonds, | | | | | | | | | | | | |
2.75%, 11/15/42 | | | USD | | | | 13,435 | | | | (11,119,558 | ) |
2.88%, 5/15/43 | | | | | | | 19,905 | | | | (16,894,369 | ) |
See Notes to Consolidated Financial Statements.
| | | | | | |
| 50 | | BLACKROCK BALANCED CAPITAL FUND, INC. | | SEPTEMBER 30, 2013 | | |
| | | | |
| Consolidated Schedule of Investments (continued) | | | Master Total Return Portfolio | |
| | | (Percentages shown are based on Net Assets) | |
| | | | | | | | | | | | |
| Borrowed Bonds | | Par (000) | | | Value | |
U.S. Treasury Obligations (concluded) | | | | | | | | | | | | |
U.S. Treasury Notes, | | | | | | | | | | | | |
0.63%, 4/30/18 | | | USD | | | | 32,734 | | | $ | (31,818,463 | ) |
1.25%, 2/29/20 | | | | | | | 1,260 | | | | (1,212,750 | ) |
1.13%, 3/31/20 | | | | | | | 8,566 | | | | (8,162,464 | ) |
1.75%, 5/15/23 | | | | | | | 3,259 | | | | (3,019,923 | ) |
2.50%, 8/15/23 | | | | | | | 8,027 | | | | (7,945,478 | ) |
| | | | | | | | | | | | |
| | | | | | | | | | | | (80,173,005 | ) |
Total Borrowed Bonds (Proceeds — $299,903,449) — (9.2)% | | | | | | | | | | | (307,199,308 | ) |
| | | | | | | | | | |
| | | | | | | | | Value | |
Total Investments Net of TBA Sale Commitments, Options Written and Borrowed Bonds — 137.0% | | | | $ | 4,562,879,412 | |
Liabilities in Excess of Other Assets — (37.0)% | | | | | (1,231,721,714 | ) |
| | | | | | | | | | |
Net Assets — 100.0% | | | | | | | | $ | 3,331,157,698 | |
| | | | | | | | | | |
|
| Notes to Consolidated Schedule of Investments |
| * | As of September 30, 2013, gross unrealized appreciation and gross unrealized depreciation based on cost for federal income tax purposes were as follows: |
| | | | |
Tax cost | | $ | 5,304,991,043 | |
| | | | |
Gross unrealized appreciation | | $ | 93,183,577 | |
Gross unrealized depreciation | | | (59,198,232 | ) |
| | | | |
Net unrealized appreciation | | $ | 33,985,345 | |
| | | | |
| (a) | Variable rate security. Rate shown is as of report date. |
| (b) | Security exempt from registration pursuant to Rule 144A under the Securities Act of 1933, as amended. These securities may be resold in transactions exempt from registration to qualified institutional investors. |
| (c) | Represents a step-up bond that pays an initial coupon rate for the first period and then a higher coupon rate for the following periods. Rate shown is as of report date. |
| (d) | Represents a zero-coupon bond. Rate shown reflects the annualized yield at date of purchase. |
| (e) | Investments in issuers considered to be an affiliate of the Master Portfolio during the year ended September 30, 2013, for purposes of Section 2(a)(3) of the Investment Company Act of 1940, as amended, were as follows: |
| | | | | | | | | | | | | | | | | | | | | | | | |
| Affiliate | | Par/Shares
Held at
September 30,
2012 | | | Par/Shares
Purchased | | | Par/Shares
Sold | | | Par/Shares
Held at
September 30,
2013 | | | Value at
September 30,
2013 | | | Income | |
BlackRock Capital Finance LP, Series 1997-R2, Class AP, 1.24%, 12/25/35 | | $ | 8,543 | | | | — | | | $ | (8,543 | ) | | | — | | | | — | | | $ | 52 | |
BlackRock Liquidity Funds, TempFund, Institutional Class | | | 9,146,877 | | | | 42,289,744 | 1 | | | — | | | | 51,436,621 | | | $ | 51,436,621 | | | $ | 10,408 | |
iShares iBoxx $ High Yield Corporate Bond ETF | | | — | | | | 190,000 | | | | — | | | | 190,000 | | | $ | 17,396,400 | | | $ | 177,280 | |
iShares JPMorgan USD Emerging Markets Bond Fund | | | 114,500 | | | | — | | | | — | | | | 114,500 | | | $ | 12,480,500 | | | $ | 577,544 | |
| 1 | Represents net shares purchased. |
| (f) | Other interests represent beneficial interests in liquidation trusts and other reorganization or private entities. |
| (g) | Non-income producing security. |
| (h) | Issuer filed for bankruptcy and/or is in default of principal and/or interest payments. |
| (i) | Security is perpetual in nature and has no stated maturity date. |
| (j) | All or a portion of securities have been pledged as collateral in connection with open reverse repurchase agreements. |
| (k) | All or a portion of security has been pledged in connection with open financial futures contracts. |
| (l) | Represents or includes a TBA transaction. Unsettled TBA transactions as of September 30, 2013 were as follows: |
| | | | | | | | |
| Counterparty | | Value | | | Unrealized
Appreciation
(Depreciation) | |
Barclays Capital, Inc. | | $ | (5,329,812 | ) | | $ | 2,070 | |
Citigroup Global Markets, Inc. | | $ | 49,048,646 | | | $ | 914,084 | |
Credit Suisse Securities (USA) LLC | | $ | 94,645,846 | | | $ | 1,361,276 | |
Deutsche Bank Securities, Inc. | | $ | 2,807,437 | | | $ | (371,664 | ) |
Goldman Sachs & Co. | | $ | 46,078,858 | | | $ | 782,303 | |
J.P. Morgan Securities LLC | | $ | 32,199,480 | | | $ | (262,274 | ) |
Merrill Lynch, Pierce, Fenner & Smith, Inc. | | $ | (12,838,046 | ) | | $ | (84,484 | ) |
Morgan Stanley & Co. LLC | | $ | 38,003,501 | | | $ | 1,386,032 | |
Nomura Securities International, Inc. | | $ | (18,396,813 | ) | | $ | (291,500 | ) |
See Notes to Consolidated Financial Statements.
| | | | | | |
| | | BLACKROCK BALANCED CAPITAL FUND, INC. | | SEPTEMBER 30, 2013 | | 51 |
| | | | |
| Consolidated Schedule of Investments (continued) | | | Master Total Return Portfolio | |
| Ÿ | | For Master Portfolio compliance purposes, the Master Portfolio’s industry classifications refer to any one or more of the industry sub-classifications used by one or more widely recognized market indexes or ratings group indexes, and/or as defined by the Master Portfolio management. These definitions may not apply for purposes of this report, which may combine such industry sub-classifications for reporting ease. |
| Ÿ | | Reverse repurchase agreements outstanding as of September 30, 2013 were as follows: |
| | | | | | | | | | | | | | | | | | |
| Counterparty | | Interest
Rate | | | Trade
Date | | | Maturity
Date | | Face Value | | | Face Value
Including
Accrued
Interest | |
BNP Paribas Securities Corp. | | | 0.07 | % | | | 3/22/13 | | | Open | | $ | 32,320,000 | | | $ | 32,332,129 | |
BNP Paribas Securities Corp. | | | 0.11 | % | | | 4/09/13 | | | Open | | | 13,031,400 | | | | 13,038,368 | |
Merrill Lynch, Pierce, Fenner & Smith, Inc. | | | 0.09 | % | | | 5/13/13 | | | Open | | | 37,381,500 | | | | 37,394,677 | |
Merrill Lynch, Pierce, Fenner & Smith, Inc. | | | 0.09 | % | | | 5/15/13 | | | Open | | | 5,563,556 | | | | 5,565,490 | |
Deutsche Bank Securities, Inc. | | | 0.15 | % | | | 6/20/13 | | | Open | | | 8,745,000 | | | | 8,748,607 | |
Deutsche Bank Securities, Inc. | | | 0.15 | % | | | 6/20/13 | | | Open | | | 6,237,250 | | | | 6,239,823 | |
Credit Suisse Securities (USA) LLC | | | 0.11 | % | | | 9/03/13 | | | Open | | | 33,040,250 | | | | 33,042,976 | |
Credit Suisse Securities (USA) LLC | | | 0.11 | % | | | 9/03/13 | | | Open | | | 28,532,790 | | | | 28,535,144 | |
Credit Suisse Securities (USA) LLC | | | 0.11 | % | | | 9/03/13 | | | Open | | | 8,880,356 | | | | 8,881,089 | |
HSBC Securities (USA), Inc. | | | 0.15 | % | | | 9/12/13 | | | 10/10/13 | | | 28,600,000 | | | | 28,603,337 | |
Credit Suisse Securities (USA) LLC | | | 0.09 | % | | | 9/12/13 | | | Open | | | 10,143,540 | | | | 10,144,022 | |
Barclays Capital, Inc. | | | 0.15 | % | | | 9/16/13 | | | 10/10/13 | | | 44,972,000 | | | | 44,976,497 | |
Morgan Stanley & Co. LLC | | | 0.08 | % | | | 9/23/13 | | | Open | | | 61,966,750 | | | | 61,967,852 | |
RBC Capital Markets, LLC | | | 0.12 | % | | | 9/24/13 | | | 10/01/13 | | | 138,250,000 | | | | 138,253,226 | |
Merrill Lynch, Pierce, Fenner & Smith, Inc. | | | 0.09 | % | | | 9/24/13 | | | Open | | | 8,621,438 | | | | 8,621,588 | |
RBC Capital Markets, LLC | | | 0.16 | % | | | 9/25/13 | | | 10/10/13 | | | 23,319,000 | | | | 23,320,555 | |
BNP Paribas Securities Corp. | | | 0.06 | % | | | 9/27/13 | | | Open | | | 33,330,000 | | | | 33,330,222 | |
BNP Paribas Securities Corp. | | | 0.10 | % | | | 9/30/13 | | | 10/01/13 | | | 107,255,903 | | | | 107,256,200 | |
Deutsche Bank Securities, Inc. | | | 0.06 | % | | | 9/30/13 | | | 10/01/13 | | | 257,189,563 | | | | 257,189,991 | |
Merrill Lynch, Pierce, Fenner & Smith, Inc. | | | 0.11 | % | | | 9/30/13 | | | 10/01/13 | | | 33,845,000 | | | | 33,845,103 | |
Merrill Lynch, Pierce, Fenner & Smith, Inc. | | | 0.00 | % | | | 9/30/13 | | | 10/01/13 | | | 40,617,362 | | | | 40,617,363 | |
RBC Capital Markets, LLC | | | 0.16 | % | | | 9/30/13 | | | 10/10/13 | | | 26,829,000 | | | | 26,830,192 | |
Total | | | | | | | | | | | | $ | 988,671,658 | | | $ | 988,734,451 | |
| | | | | | | | | | | | | | |
| Ÿ | | Financial futures contracts as of September 30, 2013 were as follows: |
| | | | | | | | | | | | | | | | | | | | |
Contracts
Purchased/ (Sold) | | | Issue | | Exchange | | Expiration | | | | | Notional
Value | | | Unrealized
Appreciation
(Depreciation) | |
| | 15 | | | Nikkei 225 Index | | Chicago Mercantile | | December 2013 | | | USD | | | | 1,096,125 | | | $ | (2,740 | ) |
| | 7,579 | | | U.S. Treasury Notes (2 Year) | | Chicago Board of Trade | | December 2013 | | | USD | | | | 1,669,393,172 | | | | 2,822,670 | |
| | 787 | | | U.S. Treasury Notes (5 Year) | | Chicago Board of Trade | | December 2013 | | | USD | | | | 95,263,891 | | | | 362,788 | |
| | 1,119 | | | U.S. Treasury Bonds (30 Year) | | Chicago Board of Trade | | December 2013 | | | USD | | | | 149,246,625 | | | | 1,984,661 | |
| | 114 | | | U.S. Ultra Treasury Bonds | | Chicago Board of Trade | | December 2013 | | | USD | | | | 16,198,688 | | | | 108,856 | |
| | 170 | | | Three Month Sterling | | NYSE Liffe | | September 2015 | | | USD | | | | 33,963,193 | | | | 70,523 | |
| | 143 | | | 3-month EURIBOR | | NYSE Liffe | | September 2016 | | | USD | | | | 47,713,903 | | | | 110,092 | |
| | 145 | | | Euro Dollar Futures | | Chicago Mercantile | | March 2017 | | | USD | | | | 35,347,375 | | | | 32,239 | |
| | 547 | | | Euro Dollar Futures | | Chicago Mercantile | | September 2017 | | | USD | | | | 132,729,550 | | | | 203,102 | |
| | (373 | ) | | Euro-Bobl | | Eurex | | December 2013 | | | USD | | | | (62,794,069 | ) | | | (620,415 | ) |
| | (213 | ) | | Euro-Bund | | Eurex | | December 2013 | | | USD | | | | (40,486,079 | ) | | | (806,620 | ) |
| | (15 | ) | | Euro-Schatz | | Eurex | | December 2013 | | | USD | | | | (2,240,320 | ) | | | (5,348 | ) |
| | (324 | ) | | E-Mini S&P 500 Futures | | Chicago Mercantile | | December 2013 | | | USD | | | | (27,122,850 | ) | | | 101,277 | |
| | (102 | ) | | Gilt British | | NYSE Liffe | | December 2013 | | | USD | | | | (18,217,000 | ) | | | (153,668 | ) |
| | (2,484 | ) | | U.S. Treasury Notes (10 Year) | | Chicago Board of Trade | | December 2013 | | | USD | | | | (313,954,313 | ) | | | (5,634,370 | ) |
| | (141 | ) | | Euro Dollar Futures | | Chicago Mercantile | | December 2014 | | | USD | | | | (35,070,225 | ) | | | (5,173 | ) |
| | (70 | ) | | Euro Dollar Futures | | Chicago Mercantile | | June 2015 | | | USD | | | | (17,366,125 | ) | | | (4,175 | ) |
| | (547 | ) | | Euro Dollar Futures | | Chicago Mercantile | | September 2015 | | | USD | | | | (135,437,200 | ) | | | (144,773 | ) |
| | (1 | ) | | Euro Dollar Futures | | Chicago Mercantile | | March 2016 | | | USD | | | | (246,338 | ) | | | (209 | ) |
| | (143 | ) | | 3-month EURIBOR | | NYSE Liffe | | September 2017 | | | USD | | | | (47,433,389 | ) | | | (101,917 | ) |
| | (145 | ) | | Euro Dollar Futures | | Chicago Mercantile | | March 2018 | | | USD | | | | (35,039,250 | ) | | | (39,069 | ) |
| | Total | | | | | | | | | | | | | | | | | $ | (1,722,269 | ) |
| | | | | | | | | | | | | | | | | | | | |
See Notes to Consolidated Financial Statements.
| | | | | | |
| 52 | | BLACKROCK BALANCED CAPITAL FUND, INC. | | SEPTEMBER 30, 2013 | | |
| | | | |
| Consolidated Schedule of Investments (continued) | | | Master Total Return Portfolio | |
| Ÿ | | Foreign currency exchange contracts as of September 30, 2013 were as follows: |
| | | | | | | | | | | | | | | | | | | | | | |
Currency Purchased | | | Currency
Sold | | | Counterparty | | Settlement
Date | | | Unrealized
Appreciation
(Depreciation) | |
| EUR | | | 530,000 | | | | USD | | | | 716,459 | | | Bank of America N.A. | | | 10/01/13 | | | $ | 551 | |
| USD | | | 3,767,874 | | | | EUR | | | | 2,850,000 | | | JPMorgan Chase Bank N.A. | | | 10/03/13 | | | | (87,778 | ) |
| USD | | | 2,911,045 | | | | EUR | | | | 2,210,000 | | | Deutsche Bank AG | | | 10/04/13 | | | | (78,784 | ) |
| GBP | | | 700,000 | | | | USD | | | | 1,083,737 | | | The Bank of New York Mellon | | | 10/22/13 | | | | 49,284 | |
| GBP | | | 1,049,000 | | | | USD | | | | 1,632,571 | | | The Bank of New York Mellon | | | 10/22/13 | | | | 65,342 | |
| GBP | | | 4,978,000 | | | | USD | | | | 7,580,394 | | | The Bank of New York Mellon | | | 10/22/13 | | | | 477,004 | |
| MXN | | | 85,874,000 | | | | USD | | | | 6,529,101 | | | BNP Paribas S.A. | | | 10/22/13 | | | | 18,110 | |
| USD | | | 694,655 | | | | GBP | | | | 447,000 | | | Citibank N.A. | | | 10/22/13 | | | | (28,860 | ) |
| USD | | | 1,961,433 | | | | GBP | | | | 1,233,000 | | | Citibank N.A. | | | 10/22/13 | | | | (34,303 | ) |
| USD | | | 10,074,181 | | | | GBP | | | | 6,500,000 | | | Credit Suisse International | | | 10/22/13 | | | | (446,729 | ) |
| USD | | | 48,934,762 | | | | GBP | | | | 32,450,000 | | | Deutsche Bank AG | | | 10/22/13 | | | | (3,588,856 | ) |
| USD | | | 4,028,654 | | | | MXN | | | | 52,261,000 | | | Barclays Bank PLC | | | 10/22/13 | | | | 44,168 | |
| USD | | | 1,455,544 | | | | MXN | | | | 18,756,000 | | | BNP Paribas S.A. | | | 10/22/13 | | | | 25,548 | |
| USD | | | 5,311,010 | | | | MXN | | | | 67,118,000 | | | BNP Paribas S.A. | | | 10/22/13 | | | | 193,796 | |
| USD | | | 6,800,690 | | | | EUR | | | | 5,038,000 | | | BNP Paribas S.A. | | | 10/24/13 | | | | (15,369 | ) |
| USD | | | 331,257,350 | | | | EUR | | | | 245,189,743 | | | BNP Paribas S.A. | | | 10/24/13 | | | | (467,093 | ) |
| USD | | | 175,489 | | | | EUR | | | | 129,964 | | | Citibank N.A. | | | 10/24/13 | | | | (343 | ) |
| CAD | | | 2,915,000 | | | | USD | | | | 2,821,676 | | | The Bank of New York Mellon | | | 12/18/13 | | | | 2,595 | |
| CHF | | | 1,526,637 | | | | EUR | | | | 1,242,062 | | | UBS AG | | | 12/18/13 | | | | 8,600 | |
| CHF | | | 1,478,165 | | | | USD | | | | 1,625,000 | | | Citibank N.A. | | | 12/18/13 | | | | 10,636 | |
| EUR | | | 107,062 | | | | USD | | | | 144,434 | | | UBS AG | | | 12/18/13 | | | | 435 | |
| EUR | | | 1,135,000 | | | | USD | | | | 1,531,194 | | | UBS AG | | | 12/18/13 | | | | 4,609 | |
| EUR | | | 1,135,000 | | | | USD | | | | 1,531,194 | | | UBS AG | | | 12/18/13 | | | | 4,609 | |
| INR | | | 466,100,000 | | | | USD | | | | 7,375,000 | | | JPMorgan Chase Bank N.A. | | | 12/18/13 | | | | (89,147 | ) |
| INR | | | 597,793,200 | | | | USD | | | | 9,420,000 | | | Morgan Stanley Capital Services LLC | | | 12/18/13 | | | | (75,582 | ) |
| JPY | | | 139,651,727 | | | | USD | | | | 1,415,000 | | | Deutsche Bank AG | | | 12/18/13 | | | | 6,533 | |
| MXN | | | 30,970,079 | | | | USD | | | | 2,379,000 | | | Barclays Bank PLC | | | 12/18/13 | | | | (28,300 | ) |
| MXN | | | 216,829,913 | | | | USD | | | | 16,655,000 | | | Barclays Bank PLC | | | 12/18/13 | | | | (197,116 | ) |
| MXN | | | 5,896,374 | | | | USD | | | | 461,000 | | | Deutsche Bank AG | | | 12/18/13 | | | | (13,452 | ) |
| MXN | | | 53,337,000 | | | | USD | | | | 4,091,844 | | | The Bank of New York Mellon | | | 12/18/13 | | | | (43,445 | ) |
| USD | | | 2,950,147 | | | | CAD | | | | 3,041,000 | | | Citibank N.A. | | | 12/18/13 | | | | 3,798 | |
| USD | | | 1,555,000 | | | | CAD | | | | 1,605,648 | | | Deutsche Bank AG | | | 12/18/13 | | | | (672 | ) |
| USD | | | 3,249,000 | | | | CHF | | | | 3,004,802 | | | Barclays Bank PLC | | | 12/18/13 | | | | (75,907 | ) |
| USD | | | 1,532,420 | | | | EUR | | | | 1,135,000 | | | UBS AG | | | 12/18/13 | | | | (3,383 | ) |
| USD | | | 1,690,000 | | | | JPY | | | | 166,897,978 | | | BNP Paribas S.A. | | | 12/18/13 | | | | (8,876 | ) |
| USD | | | 8,325,000 | | | | JPY | | | | 822,145,365 | | | BNP Paribas S.A. | | | 12/18/13 | | | | (43,722 | ) |
| USD | | | 1,420,000 | | | | JPY | | | | 139,407,080 | | | Citibank N.A. | | | 12/18/13 | | | | 958 | |
| USD | | | 1,420,000 | | | | MXN | | | | 18,285,550 | | | Citibank N.A. | | | 12/18/13 | | | | 32,085 | |
| USD | | | 1,420,000 | | | | MXN | | | | 18,518,433 | | | Citibank N.A. | | | 12/18/13 | | | | 14,409 | |
| USD | | | 16,830,000 | | | | TRY | | | | 34,145,293 | | | Bank of America N.A. | | | 12/18/13 | | | | 168,482 | |
| ZAR | | | 166,838,315 | | | | USD | | | | 16,830,000 | | | Credit Suisse International | | | 12/18/13 | | | | (411,261 | ) |
| Total | | | | | | | | | | | | | | | | | | | | $ | (4,607,426 | ) |
| | | | | | | | | | | | | | | | | | | | | | |
See Notes to Consolidated Financial Statements.
| | | | | | |
| | | BLACKROCK BALANCED CAPITAL FUND, INC. | | SEPTEMBER 30, 2013 | | 53 |
| | | | |
| Consolidated Schedule of Investments (continued) | | | Master Total Return Portfolio | |
| Ÿ | | Exchange-traded options purchased as of September 30, 2013 were as follows: |
| | | | | | | | | | | | | | | | | | | | | | | | |
| Description | | Put/
Call | | | Strike Price | | | Expiration
Date | | | Contracts | | | Market
Value | |
CBOE Volatility Index | | | Call | | | | USD | | | | 15.00 | | | | 10/16/13 | | | | 1,362 | | | $ | 224,730 | |
CBOE Volatility Index | | | Call | | | | USD | | | | 19.00 | | | | 10/16/13 | | | | 1,362 | | | | 81,720 | |
SPDR S&P 500 ETF Trust | | | Call | | | | USD | | | | 172.00 | | | | 10/19/13 | | | | 5,000 | | | | 300,000 | |
SPDR S&P 500 ETF Trust | | | Call | | | | USD | | | | 175.00 | | | | 12/21/13 | | | | 3,416 | | | | 478,240 | |
EURO STOXX 50 Index | | | Put | | | | EUR | | | | 2,925.00 | | | | 10/18/13 | | | | 341 | | | | 296,169 | |
S&P 500 Index | | | Put | | | | USD | | | | 1,650.00 | | | | 10/19/13 | | | | 39 | | | | 45,942 | |
Total | | | | | | | | | | | | | | | | | | | | | | $ | 1,426,801 | |
| | | | | | | | | | | | | | | | | | | | | | | | |
| Ÿ | | Over-the-counter barrier options purchased as of September 30, 2013 were as follows: |
| | | | | | | | | | | | | | | | | | | | | | | | | | | | | | | | | | |
| Description | | Counterparty | | Strike Price | | | Barrier Price/Range | | | Expiration
Date | | | Notional
Amount
(000) | | | Market Value | |
USD Currency | | Deutsche Bank AG | | | TRY | | | | 2.07 | | | | TRY | | | | 2.2157 | | | | 10/02/13 | | | | USD | | | | 8,740 | | | $ | 2,119 | |
AUD Currency | | Citibank N.A. | | | USD | | | | 0.81 | | | | USD | | | | 0.81 | | | | 12/20/13 | | | | AUD | | | | 3,740 | | | | 67,441 | |
Total | | | | | | | | | | | | | | | | | | | | | | | | | | | | | | | | $ | 69,560 | |
| | | | | | | | | | | | | | | | | | | | | | | | | | | | | | | | | | |
| Ÿ | | Over-the-counter options purchased as of September 30, 2013 were as follows: |
| | | | | | | | | | | | | | | | | | | | | | | | |
| Description | | Counterparty | | Put/
Call | | | Strike Price | | | Expiration
Date | | Notional Amount (000) | | | Market
Value | |
AUD Currency | | BNP Paribas S.A. | | | Call | | | USD | | | 0.92 | | | 10/01/13 | | AUD | | | 33,020 | | | $ | 600,597 | |
USD Currency | | Deutsche Bank AG | | | Call | | | JPY | | | 105.00 | | | 10/03/13 | | USD | | | 6,740 | | | | 1 | |
USD Currency | | BNP Paribas S.A. | | | Call | | | JPY | | | 105.00 | | | 10/31/13 | | USD | | | 46,405 | | | | 17,996 | |
USD Currency | | JPMorgan Chase Bank N.A. | | | Call | | | JPY | | | 100.00 | | | 10/31/13 | | USD | | | 16,895 | | | | 112,367 | |
USD Currency | | JPMorgan Chase Bank N.A. | | | Call | | | JPY | | | 110.00 | | | 10/31/13 | | USD | | | 16,895 | | | | 125 | |
USD Currency | | JPMorgan Chase Bank N.A. | | | Call | | | JPY | | | 100.00 | | | 10/31/13 | | USD | | | 6,305 | | | | 41,934 | |
USD Currency | | JPMorgan Chase Bank N.A. | | | Call | | | JPY | | | 110.00 | | | 10/31/13 | | USD | | | 6,305 | | | | 47 | |
USD Currency | | Deutsche Bank AG | | | Call | | | CHF | | | 0.95 | | | 11/15/13 | | USD | | | 8,120 | | | | 14,796 | |
USD Currency | | Deutsche Bank AG | | | Call | | | MXN | | | 13.16 | | | 11/18/13 | | USD | | | 4,745 | | | | 107,978 | |
USD Currency | | Royal Bank of Scotland PLC | | | Call | | | MXN | | | 13.16 | | | 11/18/13 | | USD | | | 4,750 | | | | 108,091 | |
EUR Currency | | BNP Paribas S.A. | | | Call | | | CHF | | | 1.30 | | | 12/12/13 | | EUR | | | 8,485 | | | | 1,987 | |
EUR Currency | | Deutsche Bank AG | | | Call | | | CHF | | | 1.25 | | | 12/12/13 | | EUR | | | 8,485 | | | | 27,496 | |
EUR Currency | | Royal Bank of Scotland PLC | | | Put | | | USD | | | 1.24 | | | 10/01/13 | | EUR | | | 67,700 | | | | 9 | |
EUR Currency | | Citibank N.A. | | | Put | | | USD | | | 1.25 | | | 11/18/13 | | EUR | | | 11,395 | | | | 2,295 | |
EUR Currency | | Citibank N.A. | | | Put | | | USD | | | 1.21 | | | 11/18/13 | | EUR | | | 11,395 | | | | 137 | |
EUR Currency | | Citibank N.A. | | | Put | | | USD | | | 1.29 | | | 11/18/13 | | EUR | | | 10,590 | | | | 15,599 | |
USD Currency | | Deutsche Bank AG | | | Put | | | MXN | | | 12.00 | | | 11/18/13 | | USD | | | 9,495 | | | | 3,538 | |
GBP Currency | | Barclays Bank PLC | | | Put | | | USD | | | 1.50 | | | 12/06/13 | | GBP | | | 18,295 | | | | 11,533 | |
GBP Currency | | Deutsche Bank AG | | | Put | | | USD | | | 1.54 | | | 12/06/13 | | GBP | | | 18,295 | | | | 44,240 | |
EUR Currency | | UBS AG | | | Put | | | USD | | | 1.32 | | | 12/20/13 | | EUR | | | 11,715 | | | | 95,136 | |
EUR Currency | | UBS AG | | | Put | | | USD | | | 1.33 | | | 12/20/13 | | EUR | | | 7,080 | | | | 74,456 | |
EUR Currency | | UBS AG | | | Put | | | USD | | | 1.33 | | | 12/20/13 | | EUR | | | 7,080 | | | | 74,456 | |
Total | | | | | | | | | | | | | | | | | | | | | | $ | 1,354,814 | |
| | | | | | | | | | | | | | | | | | | | | | | | |
| Ÿ | | Over-the-counter credit default swaptions purchased as of September 30, 2013 were as follows: |
| | | | | | | | | | | | | | | | | | | | | | | | | | | | | | | | | | |
| Description | | Counterparty | | Put/ Call | | | Strike Price | | | Pay/Receive
Floating
Rate Index | | Floating Rate
Index | | | Expiration
Date | | Notional
Amount
(000) | | | Market
Value | |
Bought protection on 5-Year Credit Default Swaps | | Citibank N.A. | | | Put | | | | EUR | | | | 400.00 | | | Receive | |
| iTraxx Crossover
Series 20 Version 1 |
| | 11/20/13 | | | EUR | | | | 5,290 | | | $ | 118,532 | |
Bought protection on 5-Year Credit Default Swaps | | JPMorgan Chase
Bank N.A. | | | Put | | | | EUR | | | | 400.00 | | | Receive | |
| iTraxx Crossover
Series 20 Version 1 |
| | 11/20/13 | | | EUR | | | | 7,930 | | | | 177,685 | |
Total | | | | | | | | | | | | | | | | | | | | | | | | | | | | | | | | $ | 296,217 | |
| | | | | | | | | | | | | | | | | | | | | | | | | | | | | | | | | | |
See Notes to Consolidated Financial Statements.
| | | | | | |
| 54 | | BLACKROCK BALANCED CAPITAL FUND, INC. | | SEPTEMBER 30, 2013 | | |
| | | | |
| Consolidated Schedule of Investments (continued) | | | Master Total Return Portfolio | |
| Ÿ | | Over-the-counter straddle options purchased as of September 30, 2013 were as follows: |
| | | | | | | | | | | | | | | | | | | | |
| Description | | Counterparty | | Strike
Volatility | | | Strike/Maturity
Date1 | | Notional
Amount (000) | | | Market
Value | |
EUR/USD - 2-Month Forward/1-Month Volatility - Forward Volatility Agreement | | JPMorgan Chase Bank N.A. | | | 7.42 | | | 11/29/13 | | | EUR | | | | 21,705 | | | | — | |
| 1 | On strike/maturity date, based on the current volatility level, the option will settle in cash or convert to a 1-month straddle option using the 11/29/13 spot rate. |
| Ÿ | | Exchange-traded options written as of September 30, 2013 were as follows: |
| | | | | | | | | | | | | | | | | | | | | | | | |
| Description | | Put/
Call | | | Strike Price | | | Expiration
Date | | | Contracts | | | Market
Value | |
U.S. Treasury Notes (10 Year) | | | Call | | | | USD | | | | 127.00 | | | | 10/04/13 | | | | 164 | | | $ | (33,311 | ) |
CBOE Volatility Index | | | Call | | | | USD | | | | 17.00 | | | | 10/16/13 | | | | 2,724 | | | | (258,780 | ) |
SPDR S&P 500 ETF Trust | | | Call | | | | USD | | | | 180.00 | | | | 12/21/13 | | | | 1,139 | | | | (53,533 | ) |
Total | | | | | | | | | | | | | | | | | | | | | | $ | (345,624 | ) |
| | | | | | | | | | | | | | | | | | | | | | | | |
| Ÿ | | Over-the-counter options written as of September 30, 2013 were as follows: |
| | | | | | | | | | | | | | | | | | | | | | | | |
| Description | | Counterparty | | Put/
Call | | | Strike Price | | | Expiration
Date | | Notional Amount (000) | | | Market
Value | |
AUD Currency | | BNP Paribas S.A. | | | Call | | | USD | | | 0.92 | | | 10/01/13 | | AUD | | | 33,020 | | | $ | (600,597 | ) |
USD Currency | | Deutsche Bank AG | | | Call | | | JPY | | | 110.00 | | | 10/03/13 | | USD | | | 6,740 | | | | (1 | ) |
USD Currency | | BNP Paribas S.A. | | | Call | | | JPY | | | 110.00 | | | 10/31/13 | | USD | | | 23,200 | | | | (172 | ) |
USD Currency | | BNP Paribas S.A. | | | Call | | | JPY | | | 100.00 | | | 10/31/13 | | USD | | | 23,200 | | | | (154,301 | ) |
USD Currency | | JPMorgan Chase Bank N.A. | | | Call | | | JPY | | | 105.00 | | | 10/31/13 | | USD | | | 12,615 | | | | (4,892 | ) |
USD Currency | | JPMorgan Chase Bank N.A. | | | Call | | | JPY | | | 105.00 | | | 10/31/13 | | USD | | | 33,790 | | | | (13,104 | ) |
USD Currency | | Deutsche Bank AG | | | Call | | | CHF | | | 0.98 | | | 11/15/13 | | USD | | | 8,120 | | | | (2,041 | ) |
USD Currency | | Deutsche Bank AG | | | Call | | | MXN | | | 13.16 | | | 11/18/13 | | USD | | | 9,495 | | | | (216,069 | ) |
EUR Currency | | BNP Paribas S.A. | | | Call | | | CHF | | | 1.25 | | | 12/12/13 | | EUR | | | 8,485 | | | | (27,496 | ) |
EUR Currency | | Deutsche Bank AG | | | Call | | | CHF | | | 1.30 | | | 12/12/13 | | EUR | | | 8,485 | | | | (1,987 | ) |
EUR Currency | | Citibank N.A. | | | Put | | | USD | | | 1.16 | | | 10/01/13 | | EUR | | | 67,700 | | | | (9 | ) |
EUR Currency | | Citibank N.A. | | | Put | | | USD | | | 1.21 | | | 11/18/13 | | EUR | | | 11,395 | | | | (137 | ) |
EUR Currency | | Citibank N.A. | | | Put | | | USD | | | 1.25 | | | 11/18/13 | | EUR | | | 21,180 | | | | (4,266 | ) |
USD Currency | | Deutsche Bank AG | | | Put | | | MXN | | | 12.00 | | | 11/18/13 | | USD | | | 4,745 | | | | (1,768 | ) |
USD Currency | | Royal Bank of Scotland PLC | | | Put | | | MXN | | | 12.00 | | | 11/18/13 | | USD | | | 4,750 | | | | (1,770 | ) |
GBP Currency | | Barclays Bank PLC | | | Put | | | USD | | | 1.54 | | | 12/06/13 | | GBP | | | 18,295 | | | | (44,240 | ) |
GBP Currency | | Deutsche Bank AG | | | Put | | | USD | | | 1.50 | | | 12/06/13 | | GBP | | | 18,295 | | | | (11,533 | ) |
EUR Currency | | UBS AG | | | Put | | | USD | | | 1.30 | | | 12/20/13 | | EUR | | | 7,080 | | | | (33,348 | ) |
EUR Currency | | UBS AG | | | Put | | | USD | | | 1.30 | | | 12/20/13 | | EUR | | | 7,080 | | | | (33,348 | ) |
EUR Currency | | UBS AG | | | Put | | | USD | | | 1.29 | | | 12/20/13 | | EUR | | | 11,715 | | | | (41,550 | ) |
Total | | | | | | | | | | | | | | | | | | | | | | $ | (1,192,629 | ) |
| | | | | | | | | | | | | | | | | | | | | | | | |
| Ÿ | | Over-the-counter credit default swaptions written as of September 30, 2013 were as follows: |
| | | | | | | | | | | | | | | | | | | | | | | | | | | | | | | | | | | | |
| Description | | Counterparty | | Put/
Call | | | Strike Price | | | Pay/Receive
Floating
Rate Index | | Floating Rate
Index | | Credit
Rating1 | | | Expiration
Date | | Notional Amount (000)2 | | | Market
Value | |
Sold protection on 5-Year Credit Default Swaps | | Citibank N.A. | | | Put | | | | EUR | | | | 500.00 | | | Pay | | iTraxx Crossover
Series 20 Version 1 | | | BB- | | | 11/20/13 | | | EUR | | | | 5,290 | | | $ | (28,574 | ) |
Sold protection on 5-Year Credit Default Swaps | | JPMorgan Chase
Bank N.A. | | | Put | | | | EUR | | | | 500.00 | | | Pay | | iTraxx Crossover
Series 20 Version 1 | | | BB- | | | 11/20/13 | | | EUR | | | | 7,930 | | | | (42,834 | ) |
Total | | | | | | | | | | | | | | | | | | | | | | | | | | | | | | | | | | $ | (71,408 | ) |
| | | | | | | | | | | | | | | | | | | | | | | | | | | | | | | | | | | | |
| 1 | Using S&P’s rating of the issuer or the underlying securities of the index, as applicable. |
| 2 | The maximum potential amount the Master Portfolio may pay should a negative credit event take place as defined under the terms of the agreement. |
See Notes to Consolidated Financial Statements.
| | | | | | |
| | | BLACKROCK BALANCED CAPITAL FUND, INC. | | SEPTEMBER 30, 2013 | | 55 |
| | | | |
| Consolidated Schedule of Investments (continued) | | | Master Total Return Portfolio | |
| Ÿ | | Centrally cleared credit default swaps - buy protection outstanding as of September 30, 2013 were as follows: |
| | | | | | | | | | | | | | | | | | | | | | |
| Issuer/Index | | Pay
Fixed Rate | | | Clearinghouse | | Expiration
Date | | | Notional Amount (000) | | | Unrealized
Appreciation
(Depreciation) | |
CDX.NA.HY Series 20 Version 1 | | | 5.00 | % | | Chicago Mercantile | | | 6/20/18 | | | | USD | | | | 47,535 | | | $ | (1,014,951 | ) |
iTraxx Europe Series 20 Version 1 | | | 1.00 | % | | InterContinental Exchange | | | 12/20/18 | | | | EUR | | | | 28,720 | | | | 55,671 | |
Total | | | | | | | | | | | | | | | | | | | | $ | (959,280 | ) |
| | | | | | | | | | | | | | | | | | | | | | |
| Ÿ | | Centrally cleared credit default swaps - sell protection outstanding as of September 30, 2013 were as follows: |
| | | | | | | | | | | | | | | | | | | | | | |
| Issuer/Index | | Pay
Fixed Rate | | | Clearinghouse | | Expiration
Date | | | Notional
Amount
(000) | | | Unrealized
(Depreciation) | |
iTraxx Europe Crossover Series 20 Version 1 | | | 5.00 | % | | InterContinental Exchange | | | 12/20/18 | | | | EUR | | | | 1,820 | | | $ | (1,787 | ) |
| Ÿ | | Centrally cleared interest rate swaps outstanding as of September 30, 2013 were as follows: |
| | | | | | | | | | | | | | | | | | | | | | | | |
Fixed Rate | | Floating Rate | | | Clearinghouse | | | Effective
Date | | Expiration
Date | | Notional Amount (000) | | | Unrealized
Appreciation
(Depreciation) | |
0.50%1 | | | 3-month LIBOR | | | | Chicago Mercantile | | | N/A | | 8/02/15 | | | USD | | | | 855,265 | | | $ | (1,454,542 | ) |
0.48%1 | | | 3-month LIBOR | | | | Chicago Mercantile | | | N/A | | 9/23/15 | | | USD | | | | 846,700 | | | | (436,793 | ) |
1.17%1 | | | 3-month LIBOR | | | | Chicago Mercantile | | | 3/02/152 | | 3/02/16 | | | USD | | | | 84,985 | | | | (247,281 | ) |
1.24%1 | | | 3-month LIBOR | | | | Chicago Mercantile | | | 3/03/152 | | 3/03/16 | | | USD | | | | 339,950 | | | | (1,240,817 | ) |
2.23%1 | | | 3-month LIBOR | | | | Chicago Mercantile | | | 8/01/142 | | 8/01/19 | | | USD | | | | 15,640 | | | | (103,926 | ) |
2.25%1 | | | 3-month LIBOR | | | | Chicago Mercantile | | | 8/08/142 | | 8/08/19 | | | USD | | | | 15,340 | | | | (104,113 | ) |
2.22%1 | | | 3-month LIBOR | | | | Chicago Mercantile | | | 8/11/142 | | 8/11/19 | | | USD | | | | 15,310 | | | | (73,805 | ) |
3.94%3 | | | 3-month LIBOR | | | | Chicago Mercantile | | | 8/29/182 | | 8/29/19 | | | USD | | | | 84,985 | | | | 206,216 | |
4.02%3 | | | 3-month LIBOR | | | | Chicago Mercantile | | | 9/04/182 | | 9/04/19 | | | USD | | | | 339,950 | | | | 1,051,125 | |
2.93%3 | | | 3-month LIBOR | | | | Chicago Mercantile | | | 8/03/152 | | 8/03/20 | | | USD | | | | 15,640 | | | | 100,521 | |
2.96%3 | | | 3-month LIBOR | | | | Chicago Mercantile | | | 8/10/152 | | 8/10/20 | | | USD | | | | 15,340 | | | | 107,337 | |
2.90%3 | | | 3-month LIBOR | | | | Chicago Mercantile | | | 8/10/152 | | 8/10/20 | | | USD | | | | 15,310 | | | | 67,359 | |
2.71%1 | | | 3-month LIBOR | | | | Chicago Mercantile | | | N/A | | 7/05/23 | | | USD | | | | 6,100 | | | | (24,367 | ) |
3.77%3 | | | 3-month LIBOR | | | | Chicago Mercantile | | | N/A | | 9/03/43 | | | USD | | | | 61,720 | | | | 1,235,641 | |
Total | | | | | | | | | | | | | | | | | | | | | | $ | (917,445 | ) |
| | | | | | | | | | | | | | | | | | | | | | | | |
| 1 | Master Portfolio pays the fixed rate and receives the floating rate. |
| 3 | Master Portfolio pays the floating rate and receives the fixed rate. |
| Ÿ | | Over-the-counter credit default swaps - buy protection outstanding as of September 30, 2013 were as follows: |
| | | | | | | | | | | | | | | | | | | | | | | | | | | | |
| Issuer/Index | | Pay
Fixed Rate | | | Counterparty | | Expiration
Date | | Notional
Amount (000) | | | Market
Value | | | Premiums
Paid
(Received) | | | Unrealized
Appreciation
(Depreciation) | |
Kingdom of Spain | | | 1.00 | % | | JPMorgan Chase Bank N.A. | | 6/20/14 | | | USD | | | | 6,720 | | | $ | (13,831 | ) | | $ | 68,844 | | | $ | (82,675 | ) |
Republic of Portugal | | | 1.00 | % | | JPMorgan Chase Bank N.A. | | 6/20/15 | | | USD | | | | 12,800 | | | | 637,507 | | | | 646,274 | | | | (8,767 | ) |
iTraxx Europe Series 18 Version 1 | | | 1.00 | % | | JPMorgan Chase Bank N.A. | | 12/20/15 | | | EUR | | | | 55,200 | | | | (999,260 | ) | | | (414,643 | ) | | | (584,617 | ) |
iTraxx Europe Series 18 Version 1 | | | 1.00 | % | | JPMorgan Chase Bank N.A. | | 12/20/15 | | | EUR | | | | 53,486 | | | | (968,232 | ) | | | (401,768 | ) | | | (566,464 | ) |
Republic of Portugal | | | 1.00 | % | | Barclays Bank PLC | | 12/20/15 | | | USD | | | | 1,200 | | | | 83,569 | | | | 82,679 | | | | 890 | |
See Notes to Consolidated Financial Statements.
| | | | | | |
| 56 | | BLACKROCK BALANCED CAPITAL FUND, INC. | | SEPTEMBER 30, 2013 | | |
| | | | |
| Consolidated Schedule of Investments (continued) | | | Master Total Return Portfolio | |
| Ÿ | | Over-the-counter credit default swaps - buy protection outstanding as of September 30, 2013 were as follows: (continued) |
| | | | | | | | | | | | | | | | | | | | | | | | | | | | |
| Issuer/Index | | Pay
Fixed Rate | | | Counterparty | | Expiration
Date | | Notional
Amount (000) | | | Market
Value | | | Premiums
Paid
(Received) | | | Unrealized
Appreciation
(Depreciation) | |
Republic of Portugal | | | 1.00 | % | | Deutsche Bank AG | | 12/20/15 | | | USD | | | | 1,350 | | | $ | 94,015 | | | $ | 93,014 | | | $ | 1,001 | |
Banca Monte dei Paschi di Siena SpA | | | 5.00 | % | | Deutsche Bank AG | | 12/20/16 | | | EUR | | | | 750 | | | | 145,428 | | | | 108,149 | | | | 37,279 | |
Republic of Ireland | | | 1.00 | % | | Citibank N.A. | | 12/20/16 | | | USD | | | | 4,000 | | | | (11,062 | ) | | | 591,107 | | | | (602,169 | ) |
Transocean Worldwide, Inc. | | | 1.00 | % | | Goldman Sachs Bank USA | | 12/20/16 | | | USD | | | | 5,750 | | | | (159,246 | ) | | | (35,456 | ) | | | (123,790 | ) |
Banca Monte dei Paschi di Siena SpA | | | 5.00 | % | | JPMorgan Chase Bank N.A. | | 3/20/17 | | | EUR | | | | 3,800 | | | | 775,480 | | | | 453,720 | | | | 321,760 | |
Republic of Ireland | | | 1.00 | % | | Citibank N.A. | | 3/20/17 | | | USD | | | | 2,000 | | | | (754 | ) | | | 260,819 | | | | (261,573 | ) |
Banco de Sabadell SA | | | 5.00 | % | | BNP Paribas S.A. | | 6/20/17 | | | EUR | | | | 720 | | | | (78,708 | ) | | | 25,632 | | | | (104,340 | ) |
Caja de Ahorros Y Pensiones de Barcelona | | | 3.00 | % | | BNP Paribas S.A. | | 6/20/17 | | | EUR | | | | 720 | | | | (46,720 | ) | | | (7,678 | ) | | | (39,042 | ) |
Caja de Ahorros Y Pensiones de Barcelona | | | 3.00 | % | | BNP Paribas S.A. | | 6/20/17 | | | EUR | | | | 540 | | | | (35,041 | ) | | | (4,594 | ) | | | (30,447 | ) |
Republic of Portugal | | | 1.00 | % | | Citibank N.A. | | 6/20/17 | | | USD | | | | 6,000 | | | | 715,513 | | | | 1,489,917 | | | | (774,404 | ) |
CDX.NA.IG Series 18 Version 1 | | | 1.00 | % | | Credit Suisse International | | 6/20/17 | | | USD | | | | 103,800 | | | | (1,864,565 | ) | | | (9,172 | ) | | | (1,855,393 | ) |
Peugeot SA | | | 5.00 | % | | BNP Paribas S.A. | | 9/20/17 | | | EUR | | | | 2,975 | | | | (118,313 | ) | | | 301,254 | | | | (419,567 | ) |
Banco Bilbao Vizcaya Argentaria SA | | | 3.00 | % | | Citibank N.A. | | 9/20/17 | | | EUR | | | | 2,230 | | | | (108,144 | ) | | | 100,820 | | | | (208,964 | ) |
Clariant AG | | | 1.00 | % | | BNP Paribas S.A. | | 12/20/17 | | | EUR | | | | 1,300 | | | | 894 | | | | 105,718 | | | | (104,824 | ) |
Henkel AG & Co. KGaA | | | 1.00 | % | | Credit Suisse International | | 12/20/17 | | | EUR | | | | 1,950 | | | | (70,678 | ) | | | (36,040 | ) | | | (34,638 | ) |
Diageo PLC | | | 1.00 | % | | Deutsche Bank AG | | 12/20/17 | | | EUR | | | | 3,650 | | | | (119,322 | ) | | | (63,548 | ) | | | (55,774 | ) |
Compagnie de Saint-Gobain SA | | | 1.00 | % | | Goldman Sachs International | | 12/20/17 | | | EUR | | | | 750 | | | | 4,346 | | | | 24,162 | | | | (19,816 | ) |
Clariant AG | | | 1.00 | % | | JPMorgan Chase Bank N.A. | | 12/20/17 | | | EUR | | | | 2,070 | | | | 1,370 | | | | 477,577 | | | | (476,207 | ) |
Compagnie de Saint-Gobain SA | | | 1.00 | % | | JPMorgan Chase Bank N.A. | | 12/20/17 | | | EUR | | | | 555 | | | | 3,215 | | | | 22,098 | | | | (18,883 | ) |
Finmeccanica SpA | | | 5.00 | % | | Bank of America N.A. | | 3/20/18 | | | EUR | | | | 470 | | | | (56,845 | ) | | | (37,771 | ) | | | (19,074 | ) |
Deutsche Bank AG | | | 1.00 | % | | Barclays Bank PLC | | 3/20/18 | | | EUR | | | | 3,200 | | | | (17,932 | ) | | | (1,631 | ) | | | (16,301 | ) |
Deutsche Bank AG | | | 1.00 | % | | Citibank N.A. | | 3/20/18 | | | EUR | | | | 1,250 | | | | (7,004 | ) | | | (1,278 | ) | | | (5,726 | ) |
Marks & Spencer PLC | | | 1.00 | % | | Credit Suisse International | | 3/20/18 | | | EUR | | | | 1,330 | | | | 28,490 | | | | 61,424 | | | | (32,934 | ) |
Compagnie de Saint-Gobain SA | | | 1.00 | % | | JPMorgan Chase Bank N.A. | | 3/20/18 | | | EUR | | | | 620 | | | | 7,041 | | | | 24,328 | | | | (17,287 | ) |
Republic of Ireland | | | 1.00 | % | | Bank of America N.A. | | 3/20/18 | | | USD | | | | 800 | | | | 8,141 | | | | 26,453 | | | | (18,312 | ) |
Republic of Italy | | | 1.00 | % | | Barclays Bank PLC | | 3/20/18 | | | USD | | | | 6,000 | | | | 352,449 | | | | 329,264 | | | | 23,185 | |
Republic of Ireland | | | 1.00 | % | | Deutsche Bank AG | | 3/20/18 | | | USD | | | | 900 | | | | 9,157 | | | | 29,759 | | | | (20,602 | ) |
AXA SA | | | 1.00 | % | | Barclays Bank PLC | | 6/20/18 | | | EUR | | | | 1,810 | | | | 23,778 | | | | 46,971 | | | | (23,193 | ) |
Deutsche Telekom SA | | | 1.00 | % | | Barclays Bank PLC | | 6/20/18 | | | EUR | | | | 90 | | | | (2,144 | ) | | | (630 | ) | | | (1,514 | ) |
AXA SA | | | 1.00 | % | | BNP Paribas S.A. | | 6/20/18 | | | EUR | | | | 925 | | | | 12,151 | | | | 48,361 | | | | (36,210 | ) |
iTraxx Europe Series 9 3-6% | | | 5.00 | % | | Citibank N.A. | | 6/20/18 | | | EUR | | | | 3,780 | | | | 363,747 | | | | 495,805 | | | | (132,058 | ) |
iTraxx Sub Financials Series 19 Version 1 | | | 1.00 | % | | Citibank N.A. | | 6/20/18 | | | EUR | | | | 540 | | | | 10,362 | | | | 11,993 | | | | (1,631 | ) |
AXA SA | | | 1.00 | % | | Credit Suisse International | | 6/20/18 | | | EUR | | | | 995 | | | | 13,071 | | | | 53,079 | | | | (40,008 | ) |
Finmeccanica SpA | | | 5.00 | % | | Credit Suisse International | | 6/20/18 | | | EUR | | | | 570 | | | | (65,392 | ) | | | (37,956 | ) | | | (27,436 | ) |
Renault SA | | | 1.00 | % | | Credit Suisse International | | 6/20/18 | | | EUR | | | | 1,250 | | | | 80,565 | | | | 109,051 | | | | (28,486 | ) |
Lafarge SA | | | 1.00 | % | | Deutsche Bank AG | | 6/20/18 | | | EUR | | | | 15 | | | | 1,166 | | | | 1,029 | | | | 137 | |
Banco Bilbao Vizcaya Argentaria SA | | | 3.00 | % | | Goldman Sachs International | | 6/20/18 | | | EUR | | | | 330 | | | | (14,238 | ) | | | (1,697 | ) | | | (12,541 | ) |
Clariant AG | | | 1.00 | % | | Goldman Sachs International | | 6/20/18 | | | EUR | | | | 80 | | | | 854 | | | | 1,806 | | | | (952 | ) |
Finmeccanica SpA | | | 5.00 | % | | Goldman Sachs International | | 6/20/18 | | | EUR | | | | 90 | | | | (10,325 | ) | | | (10,452 | ) | | | 127 | |
Credit Agricole SA | | | 3.00 | % | | JPMorgan Chase Bank N.A. | | 6/20/18 | | | EUR | | | | 960 | | | | (89,189 | ) | | | (44,262 | ) | | | (44,927 | ) |
Finmeccanica SpA | | | 5.00 | % | | JPMorgan Chase Bank N.A. | | 6/20/18 | | | EUR | | | | 1,290 | | | | (147,993 | ) | | | (136,627 | ) | | | (11,366 | ) |
Lafarge SA | | | 1.00 | % | | JPMorgan Chase Bank N.A. | | 6/20/18 | | | EUR | | | | 60 | | | | 4,665 | | | | 3,763 | | | | 902 | |
See Notes to Consolidated Financial Statements.
| | | | | | |
| | | BLACKROCK BALANCED CAPITAL FUND, INC. | | SEPTEMBER 30, 2013 | | 57 |
| | | | |
| Consolidated Schedule of Investments (continued) | | | Master Total Return Portfolio | |
| Ÿ | | Over-the-counter credit default swaps - buy protection outstanding as of September 30, 2013 were as follows: (concluded) |
| | | | | | | | | | | | | | | | | | | | | | | | | | | | |
| Issuer/Index | | Pay
Fixed Rate | | | Counterparty | | Expiration
Date | | Notional
Amount
(000) | | | Market
Value | | | Premiums
Paid
(Received) | | | Unrealized
Appreciation
(Depreciation) | |
Société Générale SA | | | 3.00 | % | | JPMorgan Chase Bank N.A. | | 6/20/18 | | | EUR | | | | 960 | | | $ | (96,369 | ) | | $ | (43,170 | ) | | $ | (53,199 | ) |
Republic of France | | | 0.25 | % | | Barclays Bank PLC | | 6/20/18 | | | USD | | | | 2,530 | | | | 39,790 | | | | 42,941 | | | | (3,151 | ) |
Republic of France | | | 0.25 | % | | Citibank N.A. | | 6/20/18 | | | USD | | | | 2,740 | | | | 43,093 | | | | 52,671 | | | | (9,578 | ) |
Republic of France | | | 0.25 | % | | JPMorgan Chase Bank N.A. | | 6/20/18 | | | USD | | | | 2,735 | | | | 43,014 | | | | 40,366 | | | | 2,648 | |
Pernod-Ricard SA | | | 1.00 | % | | Barclays Bank PLC | | 9/20/18 | | | EUR | | | | 100 | | | | (783 | ) | | | 137 | | | | (920 | ) |
Peugeot SA | | | 5.00 | % | | Barclays Bank PLC | | 9/20/18 | | | EUR | | | | 2,975 | | | | (15,520 | ) | | | 106,490 | | | | (122,010 | ) |
Daimler AG | | | 1.00 | % | | JPMorgan Chase Bank N.A. | | 9/20/18 | | | EUR | | | | 100 | | | | (2,159 | ) | | | (845 | ) | | | (1,314 | ) |
Finmeccanica SpA | | | 5.00 | % | | Barclays Bank PLC | | 12/20/18 | | | EUR | | | | 240 | | | | (24,527 | ) | | | (23,746 | ) | | | (781 | ) |
Total | | | | | | | | | | | | | | | | | | $ | (1,641,425 | ) | | $ | 5,024,511 | | | $ | (6,665,936 | ) |
| | | | | | | | | | | | | | | | | | | | |
| Ÿ | | Over-the-counter credit default swaps - sold protection outstanding as of September 30, 2013 were as follows: |
| | | | | | | | | | | | | | | | | | | | | | | | | | | | | | | | |
| Issuer/Index | | Receive
Fixed Rate | | | Counterparty | | Expiration
Date | | Credit
Rating1 | | | Notional
Amount (000)2 | | | Market
Value | | | Premiums
Paid
(Received) | | | Unrealized
Appreciation
(Depreciation) | |
Banca Monte dei Paschi di Siena SpA | | | 3.00 | % | | BNP Paribas S.A. | | 9/20/16 | | | Not Rated | | | | EUR | | | | 2,000 | | | $ | (500,198 | ) | | $ | (210,137 | ) | | $ | (290,061 | ) |
Banca Monte dei Paschi di Siena SpA | | | 5.00 | % | | Deutsche Bank AG | | 9/20/16 | | | Not Rated | | | | EUR | | | | 750 | | | | (137,354 | ) | | | (22,436 | ) | | | (114,918 | ) |
Banca Monte dei Paschi di Siena SpA | | | 3.00 | % | | JPMorgan Chase Bank N.A. | | 9/20/16 | | | Not Rated | | | | EUR | | | | 2,200 | | | | (550,217 | ) | | | (131,693 | ) | | | (418,524 | ) |
Republic of Italy | | | 1.00 | % | | Citibank N.A. | | 12/20/16 | | | BBB | | | | USD | | | | 4,000 | | | | (129,008 | ) | | | (406,810 | ) | | | 277,802 | |
CDX.NA.IG Series 18 Version 1 | | | 1.00 | % | | Citibank N.A. | | 6/20/17 | | | BBB+ | | | | USD | | | | 103,800 | | | | 1,864,566 | | | | 87,215 | | | | 1,777,351 | |
Sunrise Communications Holdings SA | | | 5.00 | % | | Citibank N.A. | | 6/20/17 | | | B- | | | | EUR | | | | 1,160 | | | | 103,496 | | | | (72,402 | ) | | | 175,898 | |
Ardagh Packaging Finance PLC | | | 5.00 | % | | Barclays Bank PLC | | 9/20/17 | | | CCC+ | | | | EUR | | | | 370 | | | | 15,114 | | | | (30,476 | ) | | | 45,590 | |
Ardagh Packaging Finance PLC | | | 5.00 | % | | Credit Suisse International | | 9/20/17 | | | CCC+ | | | | EUR | | | | 550 | | | | 22,466 | | | | (46,560 | ) | | | 69,026 | |
E.ON AG | | | 1.00 | % | | JPMorgan Chase Bank N.A. | | 12/20/17 | | | A- | | | | EUR | | | | 3,250 | | | | 52,267 | | | | 35,733 | | | | 16,534 | |
Imperial Tobacco Group PLC | | | 1.00 | % | | Deutsche Bank AG | | 12/20/17 | | | BBB | | | | EUR | | | | 1,500 | | | | 30,942 | | | | 9,225 | | | | 21,717 | |
iTraxx Europe Series 18 Version 1 | | | 1.00 | % | | JPMorgan Chase Bank N.A. | | 12/20/17 | | | A- | | | | EUR | | | | 41,400 | | | | 417,805 | | | | (328,729 | ) | | | 746,534 | |
iTraxx Europe Series 18 Version 1 | | | 1.00 | % | | JPMorgan Chase Bank N.A. | | 12/20/17 | | | A- | | | | EUR | | | | 27,600 | | | | 278,536 | | | | (219,153 | ) | | | 497,689 | |
Sunrise Communications Holdings SA | | | 5.00 | % | | Credit Suisse International | | 12/20/17 | | | B- | | | | EUR | | | | 610 | | | | 48,677 | | | | 23,378 | | | | 25,299 | |
Sunrise Communications Holdings SA | | | 5.00 | % | | Goldman Sachs International | | 12/20/17 | | | B- | | | | EUR | | | | 710 | | | | 56,657 | | | | 21,275 | | | | 35,382 | |
ThyssenKrupp AG | | | 1.00 | % | | Credit Suisse International | | 12/20/17 | | | BB | | | | EUR | | | | 1,500 | | | | (130,887 | ) | | | (140,050 | ) | | | 9,163 | |
ThyssenKrupp AG | | | 1.00 | % | | Goldman Sachs International | | 12/20/17 | | | BB | | | | EUR | | | | 725 | | | | (63,262 | ) | | | (70,161 | ) | | | 6,899 | |
ThyssenKrupp AG | | | 1.00 | % | | JPMorgan Chase Bank N.A. | | 12/20/17 | | | BB | | | | EUR | | | | 525 | | | | (45,810 | ) | | | (50,806 | ) | | | 4,996 | |
Ardagh Packaging Finance PLC | | | 5.00 | % | | Credit Suisse International | | 3/20/18 | | | CCC+ | | | | EUR | | | | 300 | | | | 6,265 | | | | 3,242 | | | | 3,023 | |
Ardagh Packaging Finance PLC | | | 5.00 | % | | Deutsche Bank AG | | 3/20/18 | | | CCC+ | | | | EUR | | | | 310 | | | | 6,474 | | | | 3,499 | | | | 2,975 | |
Glencore Xstrata PLC | | | 1.00 | % | | JPMorgan Chase Bank N.A. | | 3/20/18 | | | BBB | | | | EUR | | | | 2,690 | | | | (118,008 | ) | | | (126,812 | ) | | | 8,804 | |
Intesa Sanpaolo SpA | | | 1.00 | % | | Bank of America N.A. | | 3/20/18 | | | BBB | | | | EUR | | | | 2,230 | | | | (191,767 | ) | | | (199,008 | ) | | | 7,241 | |
Republic of Italy | | | 1.00 | % | | Barclays Bank PLC | | 3/20/18 | | | BBB | | | | EUR | | | | 4,500 | | | | (265,231 | ) | | | (250,114 | ) | | | (15,117 | ) |
Republic of Italy | | | 1.00 | % | | Barclays Bank PLC | | 3/20/18 | | | BBB | | | | USD | | | | 37 | | | | (2,173 | ) | | | (2,661 | ) | | | 488 | |
Schaeffler Finance BV | | | 5.00 | % | | Barclays Bank PLC | | 3/20/18 | | | B+ | | | | EUR | | | | 660 | | | | 104,079 | | | | 36,975 | | | | 67,104 | |
Schaeffler Finance BV | | | 5.00 | % | | Barclays Bank PLC | | 3/20/18 | | | B+ | | | | EUR | | | | 650 | | | | 102,502 | | | | 28,540 | | | | 73,962 | |
Schaeffler Finance BV | | | 5.00 | % | | Credit Suisse International | | 3/20/18 | | | B+ | | | | EUR | | | | 700 | | | | 110,387 | | | | 33,577 | | | | 76,810 | |
Schaeffler Finance BV | | | 5.00 | % | | Credit Suisse International | | 3/20/18 | | | B+ | | | | EUR | | | | 660 | | | | 104,079 | | | | 36,975 | | | | 67,104 | |
See Notes to Consolidated Financial Statements.
| | | | | | |
| 58 | | BLACKROCK BALANCED CAPITAL FUND, INC. | | SEPTEMBER 30, 2013 | | |
| | | | |
| Consolidated Schedule of Investments (continued) | | | Master Total Return Portfolio | |
| Ÿ | | Over-the-counter credit default swaps - sold protection outstanding as of September 30, 2013 were as follows: (continued) |
| | | | | | | | | | | | | | | | | | | | | | | | | | | | | | | | |
| Issuer/Index | | Receive
Fixed Rate | | | Counterparty | | Expiration
Date | | Credit
Rating1 | | | Notional
Amount
(000)2 | | | Market
Value | | | Premiums
Paid
(Received) | | | Unrealized
Appreciation
(Depreciation) | |
Sunrise Communications Holdings SA | | | 5.00 | % | | Citibank N.A. | | 3/20/18 | | | B- | | | | EUR | | | | 480 | | | $ | 34,144 | | | $ | 18,541 | | | $ | 15,603 | |
Sunrise Communications Holdings SA | | | 5.00 | % | | Goldman Sachs International | | 3/20/18 | | | B- | | | | EUR | | | | 500 | | | | 35,566 | | | | 21,834 | | | | 13,732 | |
Swiss Reinsurance Co. Ltd. | | | 1.00 | % | | Barclays Bank PLC | | 3/20/18 | | | AA- | | | | EUR | | | | 3,200 | | | | 38,543 | | | | 6,237 | | | | 32,306 | |
Swiss Reinsurance Co. Ltd. | | | 1.00 | % | | Citibank N.A. | | 3/20/18 | | | AA- | | | | EUR | | | | 1,250 | | | | 15,056 | | | | 2,000 | | | | 13,056 | |
Tata Motors Finance Ltd. | | | 5.00 | % | | Credit Suisse International | | 3/20/18 | | | BB | | | | EUR | | | | 720 | | | | 106,106 | | | | 78,102 | | | | 28,004 | |
UniCredit SpA | | | 3.00 | % | | Barclays Bank PLC | | 3/20/18 | | | BBB | | | | EUR | | | | 1,100 | | | | 11,218 | | | | 2,699 | | | | 8,519 | |
UniCredit SpA | | | 3.00 | % | | JPMorgan Chase Bank N.A. | | 3/20/18 | | | BBB | | | | EUR | | | | 2,230 | | | | 22,743 | | | | 11,424 | | | | 11,319 | |
Allianz SE | | | 1.00 | % | | JPMorgan Chase Bank N.A. | | 6/20/18 | | | AA | | | | EUR | | | | 2,110 | | | | 42,098 | | | | (5,268 | ) | | | 47,366 | |
ArcelorMittal | | | 1.00 | % | | Deutsche Bank AG | | 6/20/18 | | | BB+ | | | | EUR | | | | 15 | | | | (2,050 | ) | | | (2,175 | ) | | | 125 | |
ArcelorMittal | | | 1.00 | % | | JPMorgan Chase Bank N.A. | | 6/20/18 | | | BB+ | | | | EUR | | | | 40 | | | | (5,464 | ) | | | (5,628 | ) | | | 164 | |
Aviva PLC | | | 1.00 | % | | Barclays Bank PLC | | 6/20/18 | | | Not Rated | | | | EUR | | | | 1,810 | | | | (36,080 | ) | | | (43,903 | ) | | | 7,823 | |
Aviva PLC | | | 1.00 | % | | BNP Paribas S.A. | | 6/20/18 | | | Not Rated | | | | EUR | | | | 925 | | | | (18,438 | ) | | | (47,869 | ) | | | 29,431 | |
Aviva PLC | | | 1.00 | % | | Credit Suisse International | | 6/20/18 | | | Not Rated | | | | EUR | | | | 995 | | | | (19,834 | ) | | | (51,227 | ) | | | 31,393 | |
Compagnie de Saint-Gobain SA | | | 1.00 | % | | Bank of America N.A. | | 6/20/18 | | | BBB | | | | EUR | | | | 1,190 | | | | (20,286 | ) | | | (33,168 | ) | | | 12,882 | |
Compagnie de Saint-Gobain SA | | | 1.00 | % | | BNP Paribas S.A. | | 6/20/18 | | | BBB | | | | EUR | | | | 35 | | | | (597 | ) | | | (986 | ) | | | 389 | |
Compagnie de Saint-Gobain SA | | | 1.00 | % | | JPMorgan Chase Bank N.A. | | 6/20/18 | | | BBB | | | | EUR | | | | 700 | | | | (11,932 | ) | | | (17,639 | ) | | | 5,707 | |
Deutsche Bank AG | | | 1.00 | % | | Barclays Bank PLC | | 6/20/18 | | | A | | | | EUR | | | | 1,260 | | | | 3,256 | | | | (4,014 | ) | | | 7,270 | |
France Telecom SA | | | 1.00 | % | | Barclays Bank PLC | | 6/20/18 | | | BBB+ | | | | EUR | | | | 90 | | | | 440 | | | | (792 | ) | | | 1,232 | |
Glencore Xstrata PLC | | | 1.00 | % | | Citibank N.A. | | 6/20/18 | | | BBB | | | | EUR | | | | 760 | | | | (40,037 | ) | | | (52,933 | ) | | | 12,896 | |
Glencore Xstrata PLC | | | 1.00 | % | | Credit Suisse International | | 6/20/18 | | | BBB | | | | EUR | | | | 830 | | | | (43,723 | ) | | | (34,262 | ) | | | (9,461 | ) |
Glencore Xstrata PLC | | | 1.00 | % | | Goldman Sachs International | | 6/20/18 | | | BBB | | | | EUR | | | | 350 | | | | (18,437 | ) | | | (26,945 | ) | | | 8,508 | |
Glencore Xstrata PLC | | | 1.00 | % | | JPMorgan Chase Bank N.A. | | 6/20/18 | | | BBB | | | | EUR | | | | 850 | | | | (44,777 | ) | | | (36,535 | ) | | | (8,242 | ) |
Glencore Xstrata PLC | | | 1.00 | % | | JPMorgan Chase Bank N.A. | | 6/20/18 | | | BBB | | | | EUR | | | | 700 | | | | (36,874 | ) | | | (54,987 | ) | | | 18,113 | |
Glencore Xstrata PLC | | | 1.00 | % | | JPMorgan Chase Bank N.A. | | 6/20/18 | | | BBB | | | | EUR | | | | 350 | | | | (18,438 | ) | | | (24,648 | ) | | | 6,210 | |
iTraxx Sub Financials Series 19 Version 1 | | | 1.00 | % | | Barclays Bank PLC | | 6/20/18 | | | A | | | | EUR | | | | 2,830 | | | | (54,300 | ) | | | (111,853 | ) | | | 57,553 | |
iTraxx Sub Financials Series 19 Version 1 | | | 1.00 | % | | Barclays Bank PLC | | 6/20/18 | | | A | | | | EUR | | | | 2,230 | | | | (42,788 | ) | | | (47,058 | ) | | | 4,270 | |
iTraxx Sub Financials Series 19 Version 1 | | | 1.00 | % | | Barclays Bank PLC | | 6/20/18 | | | A | | | | EUR | | | | 926 | | | | (17,768 | ) | | | (22,953 | ) | | | 5,185 | |
iTraxx Sub Financials Series 19 Version 1 | | | 1.00 | % | | Deutsche Bank AG | | 6/20/18 | | | A | | | | EUR | | | | 2,570 | | | | (49,312 | ) | | | (56,476 | ) | | | 7,164 | |
Muenchener Rueckversicherungs AG | | | 1.00 | % | | JPMorgan Chase Bank N.A. | | 6/20/18 | | | Not Rated | | | | EUR | | | | 2,110 | | | | 41,758 | | | | 17,973 | | | | 23,785 | |
RWE AG | | | 1.00 | % | | JPMorgan Chase Bank N.A. | | 6/20/18 | | | BBB+ | | | | EUR | | | | 1,190 | | | | 7,115 | | | | 13,542 | | | | (6,427 | ) |
Solvay SA | | | 1.00 | % | | Credit Suisse International | | 6/20/18 | | | BBB+ | | | | EUR | | | | 830 | | | | 3,305 | | | | 852 | | | | 2,453 | |
Techem GmbH | | | 5.00 | % | | Credit Suisse International | | 6/20/18 | | | B+ | | | | EUR | | | | 530 | | | | 56,979 | | | | 49,042 | | | | 7,937 | |
Telecom Italia SpA | | | 1.00 | % | | Bank of America N.A. | | 6/20/18 | | | BBB- | | | | EUR | | | | 700 | | | | (84,017 | ) | | | (83,608 | ) | | | (409 | ) |
Telecom Italia SpA | | | 1.00 | % | | Barclays Bank PLC | | 6/20/18 | | | BBB- | | | | EUR | | | | 350 | | | | (42,008 | ) | | | (45,604 | ) | | | 3,596 | |
Telecom Italia SpA | | | 1.00 | % | | Goldman Sachs International | | 6/20/18 | | | BBB- | | | | EUR | | | | 350 | | | | (42,008 | ) | | | (40,067 | ) | | | (1,941 | ) |
Tesco PLC | | | 1.00 | % | | Goldman Sachs International | | 6/20/18 | | | BBB+ | | | | EUR | | | | 1,180 | | | | 20,034 | | | | 19,113 | | | | 921 | |
Vinci SA | | | 1.00 | % | | JPMorgan Chase Bank N.A. | | 6/20/18 | | | BBB+ | | | | EUR | | | | 830 | | | | 2,708 | | | | 1,348 | | | | 1,360 | |
See Notes to Consolidated Financial Statements.
| | | | | | |
| | | BLACKROCK BALANCED CAPITAL FUND, INC. | | SEPTEMBER 30, 2013 | | 59 |
| | | | |
| Consolidated Schedule of Investments (continued) | | | Master Total Return Portfolio | |
| Ÿ | | Over-the-counter credit default swaps - sold protection outstanding as of September 30, 2013 were as follows: (concluded) |
| | | | | | | | | | | | | | | | | | | | | | | | | | | | | | | | |
| Issuer/Index | | Receive
Fixed Rate | | | Counterparty | | Expiration
Date | | Credit
Rating1 | | | Notional Amount (000)2 | | | Market
Value | | | Premiums
Paid
(Received) | | | Unrealized
Appreciation
(Depreciation) | |
Vivendi SA | | | 1.00 | % | | JPMorgan Chase Bank N.A. | | 6/20/18 | | | BBB | | | | EUR | | | | 850 | | | $ | (16,656 | ) | | $ | (12,217 | ) | | $ | (4,439 | ) |
General Electric Capital | | | 1.00 | % | | Deutsche Bank AG | | 9/20/18 | | | AA+ | | | | USD | | | | 4,250 | | | | 32,118 | | | | (35,729 | ) | | | 67,847 | |
Goldman Sachs Group, Inc. | | | 1.00 | % | | Bank of America N.A. | | 9/20/18 | | | A- | | | | USD | | | | 7,435 | | | | (70,173 | ) | | | (148,107 | ) | | | 77,934 | |
Goldman Sachs Group, Inc. | | | 1.00 | % | | Deutsche Bank AG | | 9/20/18 | | | A- | | | | USD | | | | 4,425 | | | | (41,765 | ) | | | (70,035 | ) | | | 28,270 | |
RWE AG | | | 1.00 | % | | Barclays Bank PLC | | 9/20/18 | | | BBB+ | | | | EUR | | | | 100 | | | | 330 | | | | 109 | | | | 221 | |
Telecom Italia SpA | | | 1.00 | % | | Goldman Sachs International | | 9/20/18 | | | BBB- | | | | EUR | | | | 890 | | | | (117,937 | ) | | | (132,895 | ) | | | 14,958 | |
Valero Energy Corp. | | | 1.00 | % | | Deutsche Bank AG | | 9/20/18 | | | BBB | | | | USD | | | | 2,930 | | | | (34,311 | ) | | | (39,674 | ) | | | 5,363 | |
Vodafone Group PLC | | | 1.00 | % | | JPMorgan Chase Bank N.A. | | 9/20/18 | | | A- | | | | EUR | | | | 100 | | | | 2,280 | | | | 845 | | | | 1,435 | |
Norske Skogindustrier ASA | | | 5.00 | % | | Credit Suisse International | | 12/20/18 | | | CCC | | | | EUR | | | | 130 | | | | (70,368 | ) | | | (70,368 | ) | | | — | |
Republic of France | | | 0.25 | % | | Barclays Bank PLC | | 6/20/23 | | | AA+ | | | | USD | | | | 1,550 | | | | (119,807 | ) | | | (116,641 | ) | | | (3,166 | ) |
Republic of France | | | 0.25 | % | | Citibank N.A. | | 6/20/23 | | | AA+ | | | | USD | | | | 1,670 | | | | (129,081 | ) | | | (132,717 | ) | | | 3,636 | |
Republic of France | | | 0.25 | % | | JPMorgan Chase Bank N.A. | | 6/20/23 | | | AA+ | | | | USD | | | | 1,670 | | | | (129,081 | ) | | | (123,319 | ) | | | (5,762 | ) |
CMBX.NA Series 2 AM | | | 0.50 | % | | Deutsche Bank AG | | 3/15/49 | | | A- | | | | USD | | | | 4,830 | | | | (284,085 | ) | | | (683,595 | ) | | | 399,510 | |
CMBX.NA Series 3 AM | | | 0.50 | % | | Credit Suisse International | | 12/13/49 | | | BBB- | | | | USD | | | | 2,320 | | | | (225,079 | ) | | | (228,174 | ) | | | 3,095 | |
CMBX.NA Series 3 AM | | | 0.50 | % | | JPMorgan Chase Bank N.A. | | 12/13/49 | | | BBB- | | | | USD | | | | 5,000 | | | | (485,083 | ) | | | (472,528 | ) | | | (12,555 | ) |
CMBX.NA Series 3 AM | | | 0.50 | % | | Royal Bank of Scotland PLC | | 12/13/49 | | | BBB- | | | | USD | | | | 2,320 | | | | (225,079 | ) | | | (231,060 | ) | | | 5,981 | |
CMBX.NA Series 4 AM | | | 0.50 | % | | Deutsche Bank AG | | 2/17/51 | | | BB- | | | | USD | | | | 2,000 | | | | (213,233 | ) | | | (296,544 | ) | | | 83,311 | |
Total | | | | | | | | | | | | | | | | | | | | | | $ | (1,144,712 | ) | | $ | (5,388,914 | ) | | $ | 4,244,202 | |
| | | | | | | | | | | | | | | | | | | | | | | | |
| 1 | Using S&P’s rating of the issuer or the underlying securities of the index, as applicable. |
| 2 | The maximum potential amount the Master Portfolio may pay should a negative credit event take place as defined under the terms of the agreement. |
| Ÿ | | Over-the-counter interest rate swaps outstanding as of September 30, 2013 were as follows: |
| | | | | | | | | | | | | | | | | | | | | | | | | | | | |
Fixed Rate | | Floating Rate | | Counterparty | | Effective
Date | | Expiration
Date | | Notional Amount (000) | | | Market
Value | | | Premiums
Paid
(Received) | | | Unrealized
Appreciation
(Depreciation) | |
4.52%1 | | 28-day Mexican
Interbank Rate | | JPMorgan Chase Bank N.A. | | 9/11/142 | | 9/10/15 | | | MXN | | | | 1,071,510 | | | $ | 67,142 | | | | — | | | $ | 67,142 | |
3.27%3 | | 3-month LIBOR | | Deutsche Bank AG | | N/A | | 5/16/21 | | | USD | | | | 9,510 | | | | (759,891 | ) | | | — | | | | (759,891 | ) |
1.75%1 | | 3-month LIBOR | | Citibank N.A. | | N/A | | 12/14/22 | | | USD | | | | 700 | | | | (48,929 | ) | | | — | | | | (48,929 | ) |
2.80%3 | | 3-month LIBOR | | Deutsche Bank AG | | N/A | | 4/23/43 | | | USD | | | | 9,520 | | | | 1,410,400 | | | | — | | | | 1,410,400 | |
3.04%3 | | 3-month LIBOR | | Barclays Bank PLC | | N/A | | 5/23/43 | | | USD | | | | 24,800 | | | | 2,673,738 | | | | — | | | | 2,673,738 | |
3.05%3 | | 3-month LIBOR | | Deutsche Bank AG | | N/A | | 5/24/43 | | | USD | | | | 40,615 | | | | 4,185,360 | | | | — | | | | 4,185,360 | |
3.15%1 | | 3-month LIBOR | | UBS AG | | N/A | | 6/10/43 | | | USD | | | | 5,060 | | | | (449,991 | ) | | | — | | | | (449,991 | ) |
3.23%3 | | 3-month LIBOR | | Goldman Sachs International | | N/A | | 6/11/43 | | | USD | | | | 5,060 | | | | 369,830 | | | | — | | | | 369,830 | |
Total | | | | | | | | | | | | | | | | | | $ | 7,447,659 | | | | — | | | $ | 7,447,659 | |
| | | | | | | | | | | | | | | | | | | | |
| 1 | Master Portfolio pays the floating rate and receives the fixed rate. |
| 3 | Master Portfolio pays the fixed rate and receives the floating rate. |
See Notes to Consolidated Financial Statements.
| | | | | | |
| 60 | | BLACKROCK BALANCED CAPITAL FUND, INC. | | SEPTEMBER 30, 2013 | | |
| | | | |
| Consolidated Schedule of Investments (continued) | | | Master Total Return Portfolio | |
| Ÿ | | Over-the-counter total return swaps outstanding as of September 30, 2013 were as follows: |
| | | | | | | | | | | | | | | | | | | | | | | | | | |
| Reference Entity | | Fixed Rate/ Floating Rate | | Counterparty | | Expiration
Date | | Notional
Amount/
Contract
Amount
(000) | | | Market Value | | | Premiums
Paid
(Received) | | | Unrealized
Appreciation
(Depreciation) | |
Nokia Oyj | | 3-month EURIBOR minus 2.00%1 | | Citibank N.A. | | 5/23/14 | | | EUR | | | | 180 | | | $ | (510,334 | ) | | | — | | | $ | (510,334 | ) |
Nokia Oyj | | 3-month EURIBOR minus 1.50%1 | | JPMorgan Chase Bank N.A. | | 5/26/14 | | | EUR | | | | 180 | | | | (510,005 | ) | | | — | | | | (510,005 | ) |
Nokia Oyj | | 3-month EURIBOR minus 1.25%1 | | BNP Paribas S.A. | | 6/20/14 | | | EUR | | | | 15 | | | | (39,576 | ) | | $ | 253 | | | | (39,829 | ) |
Nokia Oyj | | 3-month EURIBOR minus 1.25%1 | | Bank of America N.A. | | 7/01/14 | | | EUR | | | | 37 | | | | (92,403 | ) | | | — | | | | (92,403 | ) |
Nokia Oyj | | 3-month EURIBOR1 | | JPMorgan Chase Bank N.A. | | 9/16/14 | | | EUR | | | | 21 | | | | (13,506 | ) | | | — | | | | (13,506 | ) |
Nokia Oyj | | 3-month EURIBOR minus 0.25%1 | | JPMorgan Chase Bank N.A. | | 9/22/14 | | | EUR | | | | 13 | | | | (184 | ) | | | — | | | | (184 | ) |
Total | | | | | | | | | | | | | | | | $ | (1,166,008 | ) | | $ | 253 | | | $ | (1,166,261 | ) |
| | | | | | | | | | | | | | | | | | |
| 1 | Master Portfolio pays the total return of the reference entity and receives the fixed rate. Net payment made at termination. |
| Ÿ | | Fair Value Measurements — Various inputs are used in determining the fair value of investments and derivative financial instruments. These inputs to valuation techniques are categorized into a disclosure hierarchy consisting of three broad levels for financial statement purposes as follows: |
| | Ÿ | | Level 1 — unadjusted price quotations in active markets/exchanges for identical assets or liabilities that the Master Portfolio has the ability to access |
| | Ÿ | | Level 2 — other observable inputs (including, but not limited to, quoted prices for similar assets or liabilities in markets that are active, quoted prices for identical or similar assets or liabilities in markets that are not active, inputs other than quoted prices that are observable for the assets or liabilities (such as interest rates, yield curves, volatilities, prepayment speeds, loss severities, credit risks and default rates) or other market–corroborated inputs) |
| | Ÿ | | Level 3 — unobservable inputs based on the best information available in the circumstances, to the extent observable inputs are not available (including the Master Portfolio’s own assumptions used in determining the fair value of investments and derivative financial instruments) |
The hierarchy gives the highest priority to unadjusted quoted prices in active markets for identical assets or liabilities (Level 1 measurements) and the lowest priority to unobservable inputs (Level 3 measurements). Accordingly, the degree of judgment exercised in determining fair value is greatest for instruments categorized in Level 3. The inputs used to measure fair value may fall into different levels of the fair value hierarchy. In such cases, for disclosure purposes, the fair value hierarchy classification is determined based on the lowest level input that is significant to the fair value measurement in its entirety.
Changes in valuation techniques may result in transfers into or out of an assigned level within the disclosure hierarchy. In accordance with the Master Portfolio’s policy, transfers between different levels of the fair value disclosure hierarchy are deemed to have occurred as of the beginning of the reporting period. The categorization of a value determined for investments and derivative financial instruments is based on the pricing transparency of the investment and derivative financial instrument and is not necessarily an indication of the risks associated with investing in those securities. For information about the Master Portfolio’s policy regarding valuation of investments and derivative financial instruments, please refer to Note 2 of the Notes to Consolidated Financial Statements.
See Notes to Consolidated Financial Statements.
| | | | | | |
| | | BLACKROCK BALANCED CAPITAL FUND, INC. | | SEPTEMBER 30, 2013 | | 61 |
| | | | |
| Consolidated Schedule of Investments (continued) | | | Master Total Return Portfolio | |
The following tables summarize the Master Portfolio’s investments and derivative financial instruments categorized in the disclosure hierarchy as of September 30, 2013:
| | | | | | | | | | | | | | | | |
| | | Level 1 | | | Level 2 | | | Level 3 | | | Total | |
Assets: | | | | | | | | | | | | | | | | |
Investments: | | | | | | | | | | | | | | | | |
Long-Term Investments: | | | | | | | | | | | | | | | | |
Asset-Backed Securities | | | — | | | $ | 481,546,814 | | | $ | 179,198,390 | | | $ | 660,745,204 | |
Common Stocks | | | — | | | | 476,454 | | | | — | | | | 476,454 | |
Corporate Bonds | | | — | | | | 806,741,945 | | | | 7,684,364 | | | | 814,426,309 | |
Floating Rate Loan Interests | | | — | | | | 94,791,872 | | | | 19,411,401 | | | | 114,203,273 | |
Foreign Agency Obligations | | | — | | | | 39,346,261 | | | | — | | | | 39,346,261 | |
Foreign Government Obligations | | | — | | | | 252,393,130 | | | | — | | | | 252,393,130 | |
Investment Companies | | $ | 29,876,900 | | | | — | | | | — | | | | 29,876,900 | |
Non-Agency Mortgage-Backed Securities | | | — | | | | 545,305,677 | | | | 36,708,955 | | | | 582,014,632 | |
Other Interests | | | — | | | | — | | | | 1 | | | | 1 | |
Preferred Securities | | | 14,850,517 | | | | 26,203,263 | | | | — | | | | 41,053,780 | |
Taxable Municipal Bonds | | | — | | | | 10,335,108 | | | | — | | | | 10,335,108 | |
U.S. Government Sponsored Agency Securities | | | — | | | | 1,611,022,310 | | | | — | | | | 1,611,022,310 | |
U.S. Treasury Obligations | | | — | | | | 816,051,256 | | | | — | | | | 816,051,256 | |
Short-Term Securities: | | | | | | | | | | | | | | | | |
Borrowed Bond Agreements | | | — | | | | 312,447,757 | | | | — | | | | 312,447,757 | |
Money Market Fund | | | 51,436,621 | | | | — | | | | — | | | | 51,436,621 | |
Options Purchased: | | | | | | | | | | | | | | | | |
Credit Contracts | | | — | | | | 296,217 | | | | — | | | | 296,217 | |
Equity Contracts | | | 1,130,632 | | | | 296,169 | | | | — | | | | 1,426,801 | |
Foreign Currency Exchange Contracts | | | — | | | | 1,424,374 | | | | — | | | | 1,424,374 | |
Liabilities: | | | | | | | | | | | | | | | | |
Investments in Securities: | | | | | | | | | | | | | | | | |
TBA Sale Commitments | | | — | | | | (467,288,007 | ) | | | — | | | | (467,288,007 | ) |
Borrowed Bonds | | | — | | | | (307,199,308 | ) | | | — | | | | (307,199,308 | ) |
Total | | $ | 97,294,670 | | | $ | 4,224,191,292 | | | $ | 243,003,111 | | | $ | 4,564,489,073 | |
| | | | |
| | | | | | | | | | | | | | | | |
| | | Level 1 | | | Level 2 | | | Level 3 | | | Total | |
Derivative Financial Instruments1 | | | | | | | | | | | | | | | | |
Assets: | | | | | | | | | | | | | | | | |
Credit contracts | | | — | | | $ | 5,578,824 | | | | — | | | $ | 5,578,824 | |
Equity contracts | | $ | 101,277 | | | | — | | | | — | | | | 101,277 | |
Foreign currency exchange contracts | | | 551 | | | | 1,131,001 | | | | — | | | | 1,131,552 | |
Interest rate contracts | | | 5,694,931 | | | | 11,474,669 | | | | — | | | | 17,169,600 | |
Liabilities: | | | | | | | | | | | | | | | | |
Credit contracts | | | — | | | | (9,033,033 | ) | | | — | | | | (9,033,033 | ) |
Equity contracts | | | (315,053 | ) | | | (1,166,261 | ) | | | — | | | | (1,481,314 | ) |
Foreign currency exchange contracts | | | — | | | | (6,931,607 | ) | | | — | | | | (6,931,607 | ) |
Interest rate contracts | | | (7,549,048 | ) | | | (4,944,455 | ) | | | — | | | | (12,493,503 | ) |
Total | | $ | (2,067,342 | ) | | $ | (3,890,862 | ) | | | — | | | $ | (5,958,204 | ) |
| | | | |
1 Derivative financial instruments are swaps, financial futures contracts, foreign currency exchange contracts and options written. Swaps, financial futures contracts and foreign currency exchange contracts are valued at the unrealized appreciation/depreciation on the instrument and options written are shown at value. | | | | | |
See Notes to Consolidated Financial Statements.
| | | | | | |
| 62 | | BLACKROCK BALANCED CAPITAL FUND, INC. | | SEPTEMBER 30, 2013 | | |
| | | | |
| Consolidated Schedule of Investments (concluded) | | | Master Total Return Portfolio | |
| | | | | | | | | | | | | | | | |
| Certain of the Master Portfolio’s assets and liabilities are held at carrying amount or face value, which approximates fair value for financial statement purposes. As of September 30, 2013, such assets and liabilities are categorized within the disclosure hierarchy as follows: | | | | | |
| | | | | | | | | | | | | | | | |
| | | Level 1 | | | Level 2 | | | Level 3 | | | Total | |
Assets: | | | | | | | | | | | | | | | | |
Foreign currency at value | | $ | 2,801,862 | | | | — | | | | — | | | $ | 2,801,862 | |
Cash pledged for financial futures contracts | | | 2,160,000 | | | | — | | | | — | | | | 2,160,000 | |
Cash pledged as collateral for over-the-counter derivatives | | | 5,980,000 | | | | — | | | | — | | | | 5,980,000 | |
Cash pledged for centrally cleared swaps | | | 8,770,000 | | | | — | | | | — | | | | 8,770,000 | |
Cash pledged as collateral for reverse repurchase agreements | | | 8,037,000 | | | | — | | | | — | | | | 8,037,000 | |
Liabilities: | | | | | | | | | | | | | | | | |
Reverse repurchase agreements | | | — | | | $ | (988,734,451 | ) | | | — | | | | (988,734,451 | ) |
Bank overdraft | | | — | | | | (41,121,654 | ) | | | — | | | | (41,121,654 | ) |
Cash received as collateral for over the counter derivatives | | | — | | | | (6,400,000 | ) | | | — | | | | (6,400,000 | ) |
Cash received as collateral for reverse repurchase agreements | | | — | | | | (1,330,003 | ) | | | — | | | | (1,330,003 | ) |
Total | | $ | 27,748,862 | | | $ | (1,037,586,108 | ) | | | — | | | $ | (1,009,837,246 | ) |
| | | | |
There were no transfers between Level 1 and Level 2 during the year ended September 30, 2013.
A reconciliation of Level 3 investments is presented when the Master Portfolio had a significant amount of Level 3 investments at the beginning and/or end of the year in relation to net assets. The following table is a reconciliation of Level 3 investments for which significant unobservable inputs were used in determining fair value:
| | | | | | | | | | | | | | | | | | | | | | | | |
| | | Asset-Backed
Securities | | | Corporate
Bonds | | | Floating Rate
Loan Interests | | | Non-Agency
Mortgage-Backed
Securities | | | Other
Interests | | | Total | |
Assets: | | | | | | | | | | | | | | | | | | | | | | | | |
Opening Balance, as of September 30, 2012 | | $ | 11,209,292 | | | $ | 18,466,000 | | | $ | 29,123,026 | | | $ | 48,132,409 | | | | — | | | $ | 106,930,727 | |
Transfers into Level 3 | | | 7,530,000 | | | | — | | | | — | | | | — | | | | — | | | | 7,530,000 | |
Transfers out of Level 31 | | | (4,164,292 | ) | | | — | | | | (5,698,397 | ) | | | (31,569,609 | ) | | | — | | | | (41,432,298 | ) |
Accrued discounts/premiums | | | 36,475 | | | | (1,034 | ) | | | 18,160 | | | | 15,379 | | | $ | 4 | | | | 68,984 | |
Net realized gain (loss) | | | 26,730 | | | | 40,725 | | | | 123,888 | | | | 398,233 | | | | — | | | | 589,576 | |
Net change in unrealized appreciation/depreciation2 | | | 338,275 | | | | (6,043 | ) | | | (30,101 | ) | | | 260,156 | | | | (95 | ) | | | 562,192 | |
Purchases | | | 171,336,738 | | | | 7,650,716 | | | | 6,504,731 | | | | 35,633,790 | | | | 92 | | | | 221,126,067 | |
Sales | | | (7,114,828 | ) | | | (18,466,000 | ) | | | (10,629,906 | ) | | | (16,161,403 | ) | | | — | | | | (52,372,137 | ) |
Closing Balance, as of September 30, 2013 | | $ | 179,198,390 | | | $ | 7,684,364 | | | $ | 19,411,401 | | | $ | 36,708,955 | | | $ | 1 | | | $ | 243,003,111 | |
| | | | |
| 1 | As of September 30, 2013, the Master Portfolio used significant unobservable inputs in determining the value of certain investments. As of September 30, 2013, the Master Portfolio used observable inputs in determining the value of the same investments. As a result, investments with a beginning of period value of $41,432,298 transferred from Level 3 to Level 2 in the disclosure hierarchy. |
| 2 | The change in unrealized appreciation/depreciation on investments still held as of September 30, 2013 was $(539,282). |
The Master Portfolio’s investments that are categorized as Level 3 were valued utilizing third party pricing information without adjustment. Such valuations are based on unobservable inputs. A significant change in third party information could result in a significantly lower or higher value in such Level 3 investments.
See Notes to Consolidated Financial Statements.
| | | | | | |
| | | BLACKROCK BALANCED CAPITAL FUND, INC. | | SEPTEMBER 30, 2013 | | 63 |
| | | | |
| Consolidated Statement of Assets and Liabilities | | | Master Total Return Portfolio | |
| | | | |
| September 30, 2013 | | | |
| | | | |
| Assets | | | | |
Investments at value — unaffiliated (cost — $5,208,218,520) | | $ | 5,257,662,867 | |
Investments at value — affiliated (cost — $81,294,907) | | | 81,313,521 | |
Cash pledged as collateral for reverse repurchase agreements | | | 8,037,000 | |
Cash pledged for financial futures contracts | | | 2,160,000 | |
Cash pledged as collateral for over-the-counter derivatives | | | 5,980,000 | |
Cash pledged for centrally cleared swaps | | | 8,770,000 | |
Foreign currency at value (cost — $2,782,025) | | | 2,801,862 | |
Variation margin receivable on centrally cleared swaps | | | 1,124,675 | |
Variation margin receivable on futures | | | 616,473 | |
Investments sold receivable | | | 87,479,566 | |
Swaps receivable | | | 362,239 | |
TBA sale commitments receivable | | | 459,888,477 | |
Swap premiums paid | | | 6,901,023 | |
Unrealized appreciation on foreign currency exchange contracts | | | 1,131,552 | |
Unrealized appreciation on over-the-counter swaps | | | 14,229,623 | |
Contributions receivable from investors | | | 4,515,496 | |
Interest receivable | | | 22,039,942 | |
Dividends receivable — unaffiliated | | | 249 | |
Prepaid expenses | | | 14,401 | |
Other assets | | | 641,312 | |
| | | | |
Total assets | | | 5,965,670,278 | |
| | | | |
| | | | |
| Liabilities | | | | |
Bank overdraft | | | 41,121,654 | |
Options written at value (premiums received — $3,486,213) | | | 1,609,661 | |
Borrowed bonds at value (proceeds — $299,903,449) | | | 307,199,308 | |
TBA sale commitments at value (proceeds — $459,888,477) | | | 467,288,007 | |
Reverse repurchase agreements | | | 988,734,451 | |
Cash received as collateral for reverse repurchase agreements | | | 1,330,003 | |
Cash received as collateral for over-the-counter derivatives | | | 6,400,000 | |
Variation margin payable on futures | | | 291,830 | |
Investments purchased payable | | | 793,307,193 | |
Swaps payable | | | 1,833,848 | |
Swap premiums received | | | 7,265,173 | |
Unrealized depreciation on foreign currency exchange contracts | | | 5,738,978 | |
Unrealized depreciation on over-the-counter swaps | | | 10,369,959 | |
Interest expense payable | | | 1,426,214 | |
Investment advisory fees payable | | | 196,939 | |
Professional fees payable | | | 118,963 | |
Directors’ fees payable | | | 15,563 | |
Other affiliates payable | | | 8,984 | |
Other accrued expenses payable | | | 255,852 | |
| | | | |
Total liabilities | | | 2,634,512,580 | |
| | | | |
Net Assets | | $ | 3,331,157,698 | |
| | | | |
| | | | |
| Net Assets Consist of | | | | |
Investors’ capital | | $ | 3,298,284,220 | |
Net unrealized appreciation/depreciation | | | 32,873,478 | |
| | | | |
Net Assets | | $ | 3,331,157,698 | |
| | | | |
See Notes to Consolidated Financial Statements.
| | | | | | |
| 64 | | BLACKROCK BALANCED CAPITAL FUND, INC. | | SEPTEMBER 30, 2013 | | |
| | | | |
| Consolidated Statement of Operations | | | Master Total Return Portfolio | |
| | | | |
| Year Ended September 30, 2013 | | | |
| | | | |
| Investment Income | | | | |
Interest — unaffiliated | | $ | 133,565,135 | |
Dividends — affiliated | | | 765,232 | |
Dividends — unaffiliated | | | 411,587 | |
Interest — affiliated | | | 52 | |
| | | | |
Total income | | | 134,742,006 | |
| | | | |
| | | | |
| Expenses | | | | |
Investment advisory | | | 2,470,632 | |
Custodian | | | 604,597 | |
Accounting services | | | 554,118 | |
Professional | | | 156,315 | |
Directors | | | 84,345 | |
Miscellaneous | | | 148,500 | |
| | | | |
Total expenses excluding interest expense | | | 4,018,507 | |
Interest expense | | | 7,123,568 | |
| | | | |
Total expenses | | | 11,142,075 | |
Less fees waived by Manager | | | (9,736 | ) |
| | | | |
Total expenses after fees waived | | | 11,132,339 | |
| | | | |
Net investment income | | | 123,609,667 | |
| | | | |
| | | | |
| Realized and Unrealized Gain (Loss) | | | | |
Net realized gain (loss) from: | | | | |
Investments — unaffiliated | | | (26,086,361 | ) |
Options written | | | (2,527,033 | ) |
Financial futures contracts | | | 6,382,432 | |
Swaps | | | 19,705,604 | |
Foreign currency transactions | | | (7,626,644 | ) |
Borrowed bonds | | | 10,528,095 | |
| | | | |
| | | 376,093 | |
| | | | |
Net change in unrealized appreciation/depreciation on: | | | | |
Investments — unaffiliated | | | (89,983,970 | ) |
Investments — affiliated | | | (1,360,645 | ) |
Options written | | | 3,609,205 | |
Financial futures contracts | | | (1,347,260 | ) |
Swaps | | | 6,352,231 | |
Foreign currency translations | | | 7,176,594 | |
Borrowed bonds | | | (3,647,532 | ) |
| | | | |
| | | (79,201,377 | ) |
| | | | |
Total realized and unrealized (loss) | | | (78,825,284 | ) |
| | | | |
Net Increase in Net Assets Resulting from Operations | | $ | 44,784,383 | |
| | | | |
See Notes to Consolidated Financial Statements.
| | | | | | |
| | | BLACKROCK BALANCED CAPITAL FUND, INC. | | SEPTEMBER 30, 2013 | | 65 |
| | | | |
| Consolidated Statements of Changes in Net Assets | | | Master Total Return Portfolio | |
| | | | | | | | |
| | | Year Ended September 30, | |
| Decrease in Net Assets: | | 2013 | | | 2012 | |
| | | | | | | | |
| Operations | | | | | | | | |
Net investment income | | $ | 123,609,667 | | | $ | 148,152,164 | |
Net realized gain (loss) | | | 376,093 | | | | 60,887,390 | |
Net change in unrealized appreciation/depreciation | | | (79,201,377 | ) | | | 122,434,923 | |
| | | | |
Net increase in net assets resulting from operations | | | 44,784,383 | | | | 331,474,477 | |
| | | | |
| | | | | | | | |
| Capital Transactions | | | | | | | | |
Proceeds from contributions | | | 854,417,121 | | | | 890,293,273 | |
Value of withdrawals | | | (1,038,194,357 | ) | | | (1,650,981,268 | ) |
| | | | |
Net decrease in net assets derived from capital transactions | | | (183,777,236 | ) | | | (760,687,995 | ) |
| | | | |
| | | | | | | | |
| Net Assets | | | | | | | | |
Total decrease in net assets | | | (138,992,853 | ) | | | (429,213,518 | ) |
Beginning of year | | | 3,470,150,551 | | | | 3,899,364,069 | |
| | | | |
End of year | | $ | 3,331,157,698 | | | $ | 3,470,150,551 | |
| | | | |
See Notes to Consolidated Financial Statements.
| | | | | | |
| 66 | | BLACKROCK BALANCED CAPITAL FUND, INC. | | SEPTEMBER 30, 2013 | | |
| | | | |
| Consolidated Statement of Cash Flows | | | Master Total Return Portfolio | |
| | | | |
| Year Ended September 30, 2013 | | | |
| | | | |
| Cash Provided by Operating Activities | | | | |
Net increase in net assets resulting from operations | | $ | 44,784,383 | |
Adjustments to reconcile net increase in net assets resulting from operations to net cash provided by operating activities: | | | | |
Decrease in cash pledged for financial futures contracts | | | 1,012,000 | |
Decrease in cash pledged as collateral for over-the-counter derivatives | | | 9,530,000 | |
Increase in cash pledged as collateral on reverse repurchase agreements | | | (4,390,400 | ) |
Increase in cash pledged for centrally cleared swaps | | | (8,770,000 | ) |
Increase in variation margin receivable on futures | | | (564,166 | ) |
Increase in variation margin receivable on centrally cleared swaps | | | (1,124,675 | ) |
Decrease in swaps receivable | | | 1,260,529 | |
Decrease in swap premiums paid | | | 7,064,662 | |
Decrease in options written receivable | | | 170,854 | |
Decrease in interest receivable | | | 5,232,041 | |
Increase in dividends receivable — unaffiliated | | | (249 | ) |
Decrease in TBA sale commitments receivable | | | 2,102,268,987 | |
Decrease in receivable from principal paydowns | | | 633,322 | |
Decrease in prepaid expenses | | | 11,210 | |
Increase in other assets | | | (639,183 | ) |
Increase in cash received as collateral for reverse repurchase agreements | | | 1,330,003 | |
Increase in collateral received for over-the-counter derivatives | | | 2,851,000 | |
Decrease in variation margin payable on futures | | | (171,728 | ) |
Decrease in swaps payable | | | (701,446 | ) |
Decrease in TBA sale commitments at value | | | (2,101,677,907 | ) |
Decrease in other affiliates payable | | | (23,388 | ) |
Increase in Directors’ fees payable | | | 13,172 | |
Decrease in swap premiums received | | | (5,917,861 | ) |
Decrease in interest expense payable | | | (1,323,113 | ) |
Decrease in investment advisory fees payable | | | (5,167 | ) |
Increase in professional fees payable | | | 118,963 | |
Decrease in other accrued expenses payable | | | (186,638 | ) |
Net realized and unrealized gain (loss) on investments, options written, swaps, borrowed bonds and foreign currency translations | | | 95,968,148 | |
Premiums received from options written | | | 74,153,323 | |
Premiums paid on closing options written | | | (81,923,146 | ) |
Amortization of premium and accretion of discount on investments and swaps | | | 15,047,874 | |
Proceeds from sales of long-term investments and principal paydowns | | | 28,941,807,950 | |
Proceeds from borrowed bond transactions | | | 1,740,867,638 | |
Payments from borrowed bond transactions | | | (1,608,236,496 | ) |
Purchases of long-term investments | | | (28,895,986,300 | ) |
Net payments on purchases of short-term securities | | | (156,027,114 | ) |
| | | | |
Cash provided by operating activities | | | 176,457,082 | |
| | | | |
| | | | |
| Cash Used for Financing Activities | | | | |
Net cash payments from reverse repurchase agreements | | | (40,123,187 | ) |
Proceeds from treasury roll transactions | | | 23,170,875 | |
Payments from treasury roll transactions | | | (23,165,998 | ) |
Cash receipts from contributions | | | 850,066,020 | |
Cash payments on withdrawals | | | (1,033,914,741 | ) |
Increase in bank overdraft | | | 41,121,654 | |
| | | | |
Cash used for financing activities | | | (182,845,377 | ) |
| | | | |
| | | | |
| Cash Impact from Foreign Exchange Fluctuations | | | | |
Cash impact from foreign exchange fluctuations | | | 28,732 | |
| | | | |
| | | | |
| Cash and Foreign Currency | | | | |
Net decrease in cash and foreign currency | | | (6,359,563 | ) |
Cash and foreign currency at beginning of year | | | 9,161,425 | |
| | | | |
Cash and foreign currency at end of year | | $ | 2,801,862 | |
| | | | |
| | | | |
| Cash Flow Information | | | | |
Cash paid during the year for interest | | $ | 8,446,681 | |
| | | | |
See Notes to Consolidated Financial Statements.
| | | | | | |
| | | BLACKROCK BALANCED CAPITAL FUND, INC. | | SEPTEMBER 30, 2013 | | 67 |
| | | | |
| Financial Highlights | | | Master Total Return Portfolio | |
| | | | | | | | | | | | | | | | | | | | |
| | | Year Ended September 30, | |
| | | 20131 | | | 20121 | | | 2011 | | | 2010 | | | 2009 | |
| Total Investment Return | | | | | | | | | | | | | | | | | | | | |
Total investment return | | | 1.30 | % | | | 10.04 | % | | | 2.82 | % | | | 13.05 | % | | | 10.95 | % |
| | | | |
| | | | | | | | | | | | | | | | | | | | |
| Ratios to Average Net Assets | | | | | | | | | | | | | | | | | | | | |
Total expenses | | | 0.32 | % | | | 0.29 | % | | | 0.56 | % | | | 0.58 | % | | | 0.17 | % |
| | | | |
Total expenses after fees waived and paid indirectly | | | 0.32 | % | | | 0.29 | % | | | 0.56 | % | | | 0.58 | % | | | 0.17 | % |
| | | | |
Total expenses after fees waived and paid indirectly and excluding interest expense | | | 0.12 | % | | | 0.12 | % | | | 0.11 | % | | | 0.13 | % | | | 0.13 | % |
| | | | |
Net investment income | | | 3.59 | % | | | 4.20 | % | | | 4.67 | % | | | 4.97 | % | | | 6.10 | % |
| | | | |
| | | | | | | | | | | | | | | | | | | | |
| Supplemental Data | | | | | | | | | | | | | | | | | | | | |
Net assets, end of year (000) | | $ | 3,331,158 | | | $ | 3,470,151 | | | $ | 3,899,364 | | | $ | 3,591,890 | | | $ | 3,123,655 | |
| | | | |
Portfolio turnover | | | 777 | %2 | | | 1,346 | %3 | | | 1,771 | %4 | | | 1,754 | %5 | | | 708 | %6 |
| | | | |
| | 1 | Consolidated Financial Highlights. |
| | 2 | Includes mortgage dollar roll transactions; excluding these transactions the portfolio turnover would have been 450%. |
| | 3 | Includes mortgage dollar roll transactions; excluding these transactions the portfolio turnover would have been 752%. |
| | 4 | Includes mortgage dollar roll transactions; excluding these transactions the portfolio turnover would have been 1,379%. |
| | 5 | Includes mortgage dollar roll transactions; excluding these transactions the portfolio turnover would have been 1,248%. |
| | 6 | Includes mortgage dollar roll transactions; excluding these transactions the portfolio turnover would have been 469%. |
See Notes to Consolidated Financial Statements.
| | | | | | |
| 68 | | BLACKROCK BALANCED CAPITAL FUND, INC. | | SEPTEMBER 30, 2013 | | |
| | | | |
| Notes to Consolidated Financial Statements | | | Master Total Return Portfolio | |
1. Organization:
Master Total Return Portfolio (the “Master Portfolio”), a series of Master Bond LLC (the “Master LLC”), is registered under the Investment Company Act of 1940, as amended (the “1940 Act”), as a diversified, open-end management investment company. The Master LLC is organized as a Delaware limited liability company. The Limited Liability Company Agreement of the Master LLC permits the Board of Directors of the Master LLC (the “Board”) to issue nontransferable interests in the Master LLC, subject to certain limitations.
Basis of Consolidation: The accompanying consolidated financial statements include the accounts of BlackRock Cayman Master Total Return Portfolio I, Ltd. (the “Subsidiary”), which is a wholly owned subsidiary of the Master Portfolio and primarily invests in commodity-related instruments. The Subsidiary enables the Master Portfolio to hold these commodity-related instruments while allowing its investors to satisfy regulated investment company tax requirements. Intercompany accounts and transactions, if any, have been eliminated. The Subsidiary is subject to the same investment policies and restrictions that apply to the Master Portfolio.
2. Significant Accounting Policies:
The Master Portfolio’s consolidated financial statements are prepared in conformity with accounting principles generally accepted in the United States of America (“US GAAP”), which may require management to make estimates and assumptions that affect the reported amounts of assets and liabilities in the consolidated financial statements and the reported amounts of increases and decreases in net assets from operations during the reporting period. Actual results could differ from those estimates. The following is a summary of the significant accounting policies followed by the Master Portfolio:
Valuation: US GAAP defines fair value as the price the Master Portfolio would receive to sell an asset or pay to transfer a liability in an orderly transaction between market participants at the measurement date. The Master Portfolio determines the fair values of its financial instruments at market value using independent dealers or pricing services under policies approved by the Board. The BlackRock Global Valuation Methodologies Committee (the “Global Valuation Committee”) is the committee formed by management to develop global pricing policies and procedures and to provide oversight of the pricing function for the Master Portfolio for all financial instruments.
The Master Portfolio values its bond investments on the basis of last available bid prices or current market quotations provided by dealers or pricing services. Floating rate loan interests are valued at the mean of the bid prices from one or more brokers or dealers as obtained from a pricing service. In determining the value of a particular investment, pricing services may use certain information with respect to transactions in such investments, quotations from dealers, pricing matrixes, market transactions in comparable investments, various relationships observed in the market between investments and calculated yield measures. Asset-backed and mortgage-backed securities are valued by independent pricing services using models that consider estimated cash flows of each tranche of the security, establish a benchmark yield and develop an estimated tranche specific spread to the benchmark yield based on
the unique attributes of the tranche. Financial futures contracts traded on exchanges are valued at their last sale price. To-be-announced (“TBA”) commitments are valued on the basis of last available bid prices or current market quotations provided by pricing services. Swap agreements are valued utilizing quotes received daily by the Master Portfolio’s pricing service or through brokers, which are derived using daily swap curves and models that incorporate a number of market data factors, such as discounted cash flows, trades and values of the underlying reference instruments. Investments in open-end registered investment companies are valued at NAV each business day. Short-term securities with remaining maturities of 60 days or less may be valued at amortized cost, which approximates fair value.
Municipal investments (including commitments to purchase such investments on a “when-issued” basis) are valued on the basis of prices provided by dealers or pricing services. In determining the value of a particular investment, pricing services may use certain information with respect to transactions in such investments, quotations from dealers, pricing matrixes, market transactions in comparable investments and information with respect to various relationships between investments.
Equity investments traded on a recognized securities exchange or the NASDAQ Stock Market (“NASDAQ”) are valued at the last reported sale price that day or the NASDAQ official closing price, if applicable. For equity investments traded on more than one exchange, the last reported sale price on the exchange where the stock is primarily traded is used. Equity investments traded on a recognized exchange for which there were no sales on that day are valued at the last available bid (long positions) or ask (short positions) price.
Securities and other assets and liabilities denominated in foreign currencies are translated into US dollars using exchange rates determined as of the close of business on the New York Stock Exchange (“NYSE”). Foreign currency exchange contracts are valued at the mean between the bid and ask prices and are determined as of the close of business on the NYSE. Interpolated values are derived when the settlement date of the contract is an interim date for which quotations are not available.
Exchange-traded options are valued at the mean between the last bid and ask prices at the close of the options market in which the options trade. An exchange-traded option for which there is no mean price is valued at the last bid (long positions) or ask (short positions) price. If no bid or ask price is available, the prior day’s price will be used, unless it is determined that the prior day’s price no longer reflects the fair value of the option. Over-the-counter (“OTC”) options and swaptions are valued by an independent pricing service using a mathematical model which incorporates a number of market data factors, such as the trades and prices of the underlying instruments.
In the event that application of these methods of valuation results in a price for an investment that is deemed not to be representative of the market value of such investment, or if a price is not available, the investment will be valued by the Global Valuation Committee, or its delegate, in accordance with a policy approved by the Board as reflecting fair value (“Fair Value Assets”). When determining the price for Fair Value
| | | | | | |
| | | BLACKROCK BALANCED CAPITAL FUND, INC. | | SEPTEMBER 30, 2013 | | 69 |
| | | | |
| Notes to Consolidated Financial Statements (continued) | | | Master Total Return Portfolio | |
Assets, the Global Valuation Committee, or its delegate, seeks to determine the price that the Master Portfolio might reasonably expect to receive from the current sale of that asset in an arm’s-length transaction. Fair value determinations shall be based upon all available factors that the Global Valuation Committee, or its delegate, deem relevant consistent with the principles of fair value measurement which include the market approach, income approach and/or in the case of recent investments, the cost approach, as appropriate. The market approach generally consists of using comparable market transactions. The income approach generally is used to discount future cash flows to present value and is adjusted for liquidity as appropriate. These factors include but are not limited to: (i) attributes specific to the investment or asset; (ii) the principal market for the investment or asset; (iii) the customary participants in the principal market for the investment or asset; (iv) data assumptions by market participants for the investment or asset, if reasonably available; (v) quoted prices for similar investments or assets in active markets; and (vi) other factors, such as future cash flows, interest rates, yield curves, volatilities, prepayment speeds, loss severities, credit risks, recovery rates, liquidation amounts and/or default rates. Due to the inherent uncertainty of valuations of such investments, the fair values may differ from the values that would have been used had an active market existed. The Global Valuation Committee, or its delegate, employs various methods for calibrating valuation approaches for investments where an active market does not exist, including regular due diligence of the Master Portfolio’s pricing vendors, regular reviews of key inputs and assumptions, transactional back-testing or disposition analysis to compare unrealized gains and losses to realized gains and losses, reviews of missing or stale prices and large movements in market values and reviews of any market related activity. The pricing of all Fair Value Assets is subsequently reported to the Board or a committee thereof on a quarterly basis.
Generally, trading in foreign instruments is substantially completed each day at various times prior to the close of business on the NYSE. Occasionally, events affecting the values of such instruments may occur between the foreign market close and the close of business on the NYSE that may not be reflected in the computation of the Master Portfolio’s net assets. If events (for example, a company announcement, market volatility or a natural disaster) occur during such periods that are expected to affect the value of such instruments materially, those instruments may be Fair Value Assets and be valued at their fair value, as determined in good faith by the Global Valuation Committee using a pricing service and/or policies approved by the Board.
Foreign Currency: The Master Portfolio’s books and records are maintained in US dollars. Purchases and sales of investment securities are recorded at the rates of exchange prevailing on the respective date of such transactions. Generally, when the US dollar rises in value against a foreign currency, the Master Portfolio’s investments denominated in that currency will lose value because that currency is worth fewer US dollars; the opposite effect occurs if the US dollar falls in relative value.
The Master Portfolio does not isolate the portion of the results of operations arising as a result of changes in the foreign exchange rates from the changes in the market prices of investments held or sold for financial reporting purposes. Accordingly, the effects of changes in foreign
currency exchange rates on investments are not segregated in the Consolidated Statement of Operations from the effects of changes in market prices of those investments but are included as a component of net realized and unrealized gain (loss) from investments. However, the Master Portfolio isolates the effect of fluctuations in foreign currency rates when determining the realized gain or loss upon the sale or maturity of foreign currency denominated debt obligations pursuant to US federal income tax regulations; such amounts are categorized as net realized gain (loss) from foreign currency transactions for both financial reporting and income tax reporting purposes. The Master Portfolio reports realized currency gains (losses) on foreign currency related transactions as components of net realized gain (loss) for financial reporting purposes, whereas such components may be treated as ordinary income for federal income tax purposes.
The Master Portfolio does not isolate the portion of the results of operations arising as a result of changes in the foreign exchange rates from the changes in the market prices of foreign-denominated equity and fixed income investments held for financial reporting purposes. Accordingly, the effects of changes in foreign currency exchange rates on those investments held are not segregated in the Consolidated Statement of Operations from the effects of changes in market prices and are included as a component of net unrealized gain (loss) from investments. The Master Portfolio does not isolate the portion of the results of operations arising as a result of changes in the foreign exchange rates from the changes in the market prices upon the sale of foreign-denominated equity investments for financial reporting purposes and are included as a component of net realized gain (loss) from investments. However, the Master Portfolio does isolate the effect of fluctuations in foreign exchange rates when determining the realized gain (loss) upon the sale or maturity of foreign-denominated fixed income investments and are categorized as net realized gain (loss) from foreign currency transactions for financial reporting which may be treated as ordinary income for federal income tax purposes.
Segregation and Collateralization: In cases in which the 1940 Act and the interpretive positions of the Securities and Exchange Commission (“SEC”) require that the Master Portfolio either deliver collateral or segregate assets in connection with certain investments (e.g., dollar rolls, TBA sale commitments, financial futures contracts, foreign currency exchange contracts, swaps, short sales and options written), or certain borrowings (e.g., reverse repurchase agreements and treasury roll transactions), the Master Portfolio will, consistent with SEC rules and/or certain interpretive letters issued by the SEC, segregate collateral or designate on its books and records cash or liquid securities having a market value at least equal to the amount that would otherwise be required to be physically segregated. Furthermore, based on requirements and agreements with certain exchanges and third party broker-dealers, the Master Portfolio engaging in such transactions may have requirements to deliver/deposit securities to/with an exchange or broker-dealer as collateral for certain investments.
Investment Transactions and Investment Income: For financial reporting purposes, investment transactions are recorded on the dates the transactions are entered into (the trade dates). Realized gains and losses are adjusted utilizing partnership tax allocation rules. In addition, the Master
| | | | | | |
| 70 | | BLACKROCK BALANCED CAPITAL FUND, INC. | | SEPTEMBER 30, 2013 | | |
| | | | |
| Notes to Consolidated Financial Statements (continued) | | | Master Total Return Portfolio | |
Portfolio accrues its own expenses. Income, expenses and realized and unrealized gains and losses are allocated daily to each class based on its relative net assets. Realized gains and losses on investment transactions are determined on the identified cost basis. Dividend income is recorded on the ex-dividend dates. Dividends from foreign securities where the ex-dividend date may have passed are subsequently recorded when the Master Portfolio is informed of the ex-dividend date. Under the applicable foreign tax laws, a withholding tax at various rates may be imposed on capital gains, dividends and interest. Upon notification from issuers, some of the dividend income received from a real estate investment trust may be redesignated as a reduction of cost of the related investment and/or realized gain. Interest income, including amortization and accretion of premiums and discounts on debt securities, is recognized on the accrual basis. Income, expenses and realized and unrealized gains and losses are allocated daily to each class based on its relative net assets.
Income Taxes: The Master Portfolio is classified as a partnership for federal income tax purposes. As such, each investor in the Master Portfolio is treated as the owner of its proportionate share of net assets, income, expenses and realized and unrealized gains and losses of the Master Portfolio. Therefore, no federal income tax provision is required. It is intended that the Master Portfolio’s assets will be managed so an investor in the Master Portfolio can satisfy the requirements of Subchapter M of the Internal Revenue Code of 1986, as amended.
The Master Portfolio files US federal and various state and local tax returns. No income tax returns are currently under examination. The statute of limitations on the Master Portfolio’s US federal tax returns remains open for each of the four years ended September 30, 2013. The statutes of limitations on the Master Portfolio’s state and local tax returns may remain open for an additional year depending upon the jurisdiction. Management does not believe there are any uncertain tax positions that require recognition of a tax liability.
Recent Accounting Standards: Recent Accounting Standards: In December 2011, the Financial Accounting Standards Board (the “FASB”) issued guidance that will expand current disclosure requirements on the offsetting of certain assets and liabilities. The new disclosures will be required for investments and derivative financial instruments subject to master netting or similar agreements, which are eligible for offset in the Statements of Assets and Liabilities and will require an entity to disclose both gross and net information about such investments and transactions in the financial statements. In January 2013, the FASB issued guidance that clarifies which investments and transactions are subject to the offsetting disclosure requirements. The scope of the disclosure requirements for offsetting will be limited to derivative instruments, repurchase agreements and reverse repurchase agreements, and securities borrowing and securities lending transactions. The guidance is effective for financial statements with fiscal years beginning on or after January 1, 2013, and interim periods within those fiscal years. Management is evaluating the impact, if any, of this guidance on the Master Portfolio’s financial statement disclosures.
Other: Expenses directly related to the Master Portfolio are charged to the Master Portfolio. Other operating expenses shared by several funds
are pro rated among those funds on the basis of relative net assets or other appropriate methods. Expenses directly related to the Master Portfolio and other shared expenses pro rated to the Master Portfolio are allocated daily to each class based on its relative net assets or other appropriate methods.
The Master Portfolio has an arrangement with the custodian whereby fees may be reduced by credits earned on uninvested cash balances, which, if applicable, are shown as fees paid indirectly in the Consolidated Statement of Operations. The custodian imposes fees on overdrawn cash balances, which can be offset by accumulated credits earned or may result in additional custody charges.
3. Securities and Other Investments:
Asset-Backed and Mortgage-Backed Securities: The Master Portfolio may invest in asset-backed securities. Asset-backed securities are generally issued as pass-through certificates, which represent undivided fractional ownership interests in an underlying pool of assets, or as debt instruments, which are also known as collateralized obligations, and are generally issued as the debt of a special purpose entity organized solely for the purpose of owning such assets and issuing such debt. Asset-backed securities are often backed by a pool of assets representing the obligations of a number of different parties. The yield characteristics of certain asset-backed securities may differ from traditional debt securities. One such major difference is that all or a principal part of the obligations may be prepaid at any time because the underlying assets (i.e., loans) may be prepaid at any time. As a result, a decrease in interest rates in the market may result in increases in the level of prepayments as borrowers, particularly mortgagors, refinance and repay their loans. An increased prepayment rate with respect to an asset-backed security subject to such a prepayment feature will have the effect of shortening the maturity of the security. In addition, the Master Portfolio may have to subsequently reinvest the proceeds at lower interest rates. If the Master Portfolio has purchased such an asset-backed security at a premium, a faster than anticipated prepayment rate could result in a loss of principal to the extent of the premium paid.
The Master Portfolio may purchase certain mortgage pass-through securities. There are a number of important differences among the agencies and instrumentalities of the US government that issue mortgage-related securities and among the securities that they issue. For example, mortgage-related securities guaranteed by Ginnie Mae are guaranteed as to the timely payment of principal and interest by Ginnie Mae and such guarantee is backed by the full faith and credit of the United States. However, mortgage-related securities issued by Freddie Mac and Fannie Mae, including Freddie Mac and Fannie Mae guaranteed mortgage pass-through certificates, which are solely the obligations of Fred-die Mac and Fannie Mae, are not backed by or entitled to the full faith and credit of the United States but are supported by the right of the issuer to borrow from the Treasury.
Collateralized Debt Obligations: The Master Portfolio may invest in collateralized debt obligations (“CDOs”), which include collateralized bond obligations (“CBOs”) and collateralized loan obligations (“CLOs”). CBOs and CLOs are types of asset-backed securities. A CDO is an entity which is backed by a diversified pool of debt securities (CBOs) or syndicated
| | | | | | |
| | | BLACKROCK BALANCED CAPITAL FUND, INC. | | SEPTEMBER 30, 2013 | | 71 |
| | | | |
| Notes to Consolidated Financial Statements (continued) | | | Master Total Return Portfolio | |
bank loans (CLOs). The cash flows of the CDO can be split into multiple segments, called “tranches”, which will vary in risk profile and yield. The riskiest segment is the subordinated or “equity” tranche. This tranche bears the greatest risk of defaults from the underlying assets in the CDO and serves to protect the other, more senior, tranches from default in all but the most severe circumstances. Since it is shielded from defaults by the more junior tranches, a “senior” tranche will typically have higher credit ratings and lower yields than their underlying securities, and often receive investment grade ratings from one or more of the nationally recognized rating agencies. Despite the protection from the more junior tranches, senior tranches can experience substantial losses due to actual defaults, increased sensitivity to future defaults and the disappearance of one or more protecting tranches as a result of changes in the credit profile of the underlying pool of assets.
Inflation-Indexed Bonds: The Master Portfolio may invest in inflation-indexed bonds. Inflation-indexed bonds are fixed income securities whose principal value is periodically adjusted according to the rate of inflation. If the index measuring inflation rises or falls, the principal value of inflation-indexed bonds will be adjusted upward or downward, and consequently the interest payable on these securities (calculated with respect to a larger or smaller principal amount) will be increased or reduced, respectively. Any upward or downward adjustment in the principal amount of an inflation-indexed bond will be included as interest income in the Consolidated Statement of Operations, even though investors do not receive their principal until maturity. Repayment of the original bond principal upon maturity (as adjusted for inflation) is guaranteed in the case of US Treasury inflation-indexed bonds. For bonds that do not provide a similar guarantee, the adjusted principal value of the bond repaid at maturity may be less than the original principal.
Multiple Class Pass-Through Securities: The Master Portfolio may invest in multiple class pass-through securities, including collateralized mortgage obligations (“CMOs”) and commercial mortgage-backed securities. These multiple class securities may be issued by Ginnie Mae, US government agencies or instrumentalities or by trusts formed by private originators of, or investors in, mortgage loans. In general, CMOs are debt obligations of a legal entity that are collateralized by, and multiple class pass-through securities represent direct ownership interests in, a pool of residential or commercial mortgage loans or mortgage pass-through securities (the “Mortgage Assets”), the payments on which are used to make payments on the CMOs or multiple pass-through securities. Classes of CMOs include interest only (“IOs”), principal only (“POs”), planned amortization classes and targeted amortization classes. IOs and POs are stripped mortgage-backed securities representing interests in a pool of mortgages, the cash flow from which has been separated into interest and principal components. IOs receive the interest portion of the cash flow while POs receive the principal portion. IOs and POs can be extremely volatile in response to changes in interest rates. As interest rates rise and fall, the value of IOs tends to move in the same direction as interest rates. POs perform best when prepayments on the underlying mortgages rise since this increases the rate at which the principal is returned and the yield to maturity on the PO. When payments on mortgages underlying a PO are slower than anticipated, the life of the PO is lengthened and the yield to maturity is reduced. If the underlying Mortgage
Assets experience greater than anticipated pre-payments of principal, the Master Portfolio may not fully recoup its initial investment in IOs.
Stripped Mortgage-Backed Securities: The Master Portfolio may invest in stripped mortgage-backed securities issued by the US government, its agencies and instrumentalities. Stripped mortgage-backed securities are usually structured with two classes that receive different proportions of the interest (IOs) and principal (POs) distributions on a pool of Mortgage Assets. The Master Portfolio also may invest in stripped mortgage-backed securities that are privately issued.
Zero-Coupon Bonds: The Master Portfolio may invest in zero-coupon bonds, which are normally issued at a significant discount from face value and do not provide for periodic interest payments. Zero-coupon bonds may experience greater volatility in market value than similar maturity debt obligations which provide for regular interest payments.
Capital Trusts and Trust Preferred Securities: The Master Portfolio may invest in capital trusts and/or trust preferred securities. These securities are typically issued by corporations, generally in the form of interest bearing notes with preferred securities characteristics, or by an affiliated business trust of a corporation, generally in the form of beneficial interests in subordinated debentures or similarly structured securities. The securities can be structured as either fixed or adjustable coupon securities that can have either a perpetual or stated maturity date. For trust preferred securities, the issuing bank or corporation will pay interest to the trust, which will then be distributed to holders of the trust preferred securities as a dividend. Dividends can be deferred without creating an event of default or acceleration, although maturity cannot take place unless all cumulative payment obligations have been met. The deferral of payments does not affect the purchase or sale of these securities in the open market. Payments on these securities are treated as interest rather than dividends for federal income tax purposes. These securities generally are rated below that of the issuing company’s senior debt securities and are freely callable at the issuer’s option.
Preferred Stock: The Master Portfolio may invest in preferred stock. Preferred stock has a preference over common stock in liquidation (and generally in receiving dividends as well) but is subordinated to the liabilities of the issuer in all respects. As a general rule, the market value of preferred stock with a fixed dividend rate and no conversion element varies inversely with interest rates and perceived credit risk, while the market price of convertible preferred stock generally also reflects some element of conversion value. Because preferred stock is junior to debt securities and other obligations of the issuer, deterioration in the credit quality of the issuer will cause greater changes in the value of a preferred stock than in a more senior debt security with similar stated yield characteristics. Unlike interest payments on debt securities, preferred stock dividends are payable only if declared by the issuer’s board of directors. Preferred stock also may be subject to optional or mandatory redemption provisions.
Floating Rate Loan Interests: The Master Portfolio may invest in floating rate loan interests. The floating rate loan interests the Master Portfolio holds are typically issued to companies (the “borrower”) by banks, other financial institutions, and privately and publicly offered corporations (the
| | | | | | |
| 72 | | BLACKROCK BALANCED CAPITAL FUND, INC. | | SEPTEMBER 30, 2013 | | |
| | | | |
| Notes to Consolidated Financial Statements (continued) | | | Master Total Return Portfolio | |
“lender”). Floating rate loan interests are generally non-investment grade, often involve borrowers whose financial condition is troubled or uncertain and companies that are highly leveraged. The Master Portfolio may invest in obligations of borrowers who are in bankruptcy proceedings. Floating rate loan interests may include fully funded term loans or revolving lines of credit. Floating rate loan interests are typically senior in the corporate capital structure of the borrower. Floating rate loan interests generally pay interest at rates that are periodically determined by reference to a base lending rate plus a premium. The base lending rates are generally the lending rate offered by one or more European banks, such as the London Interbank Offered Rate (“LIBOR”), the prime rate offered by one or more US banks or the certificate of deposit rate. Floating rate loan interests may involve foreign borrowers, and investments may be denominated in foreign currencies. The Master Portfolio considers these investments to be investments in debt securities for purposes of its investment policies.
When the Master Portfolio purchases a floating rate loan interest it may receive a facility fee and when it sells a floating rate loan interest it may pay a facility fee. On an ongoing basis, the Master Portfolio may receive a commitment fee based on the undrawn portion of the underlying line of credit amount of a floating rate loan interest. Facility and commitment fees are typically amortized to income over the term of the loan or term of the commitment, respectively. Consent and amendment fees are recorded to income as earned. Prepayment penalty fees, which may be received by the Master Portfolio upon the prepayment of a floating rate loan interest by a borrower, are recorded as realized gains. The Master Portfolio may invest in multiple series or tranches of a loan. A different series or tranche may have varying terms and carry different associated risks.
Floating rate loan interests are usually freely callable at the borrower’s option. The Master Portfolio may invest in such loans in the form of participations in loans (“Participations”) or assignments (“Assignments”) of all or a portion of loans from third parties. Participations typically will result in the Master Portfolio having a contractual relationship only with the lender, not with the borrower. The Master Portfolio will have the right to receive payments of principal, interest and any fees to which it is entitled only from the lender selling the Participation and only upon receipt by the lender of the payments from the borrower. In connection with purchasing Participations, the Master Portfolio generally will have no right to enforce compliance by the borrower with the terms of the loan agreement, nor any rights of offset against the borrower, and the Master Portfolio may not benefit directly from any collateral supporting the loan in which it has purchased the Participation. As a result, the Master Portfolio will assume the credit risk of both the borrower and the lender that is selling the Participation. The Master Portfolio’s investment in loan participation interests involves the risk of insolvency of the financial intermediaries who are parties to the transactions. In the event of the insolvency of the lender selling the Participation, the Master Portfolio may be treated as a general creditor of the lender and may not benefit from any offset between the lender and the borrower. Assignments typically result in the Master Portfolio having a direct contractual relationship with the borrower, and the Master Portfolio may enforce compliance by the borrower with the terms of the loan agreement.
Forward Commitments and When-Issued Delayed Delivery Securities: The Master Portfolio may purchase securities on a when-issued basis and may purchase or sell securities on a forward commitment basis. Settlement of such transactions normally occurs within a month or more after the purchase or sale commitment is made. The Master Portfolio may purchase securities under such conditions with the intention of actually acquiring them, but may enter into a separate agreement to sell the securities before the settlement date. Since the value of securities purchased may fluctuate prior to settlement, the Master Portfolio may be required to pay more at settlement than the security is worth. In addition, the Master Portfolio is not entitled to any of the interest earned prior to settlement. When purchasing a security on a delayed delivery basis, the Master Portfolio assumes the rights and risks of ownership of the security, including the risk of price and yield fluctuations. In the event of default by the counterparty, the Master Portfolio’s maximum amount of loss is the unrealized appreciation of unsettled when-issued transactions, which is shown in the Consolidated Schedule of Investments.
TBA Commitments: The Master Portfolio may enter into TBA commitments. TBA commitments are forward agreements for the purchase or sale of mortgage-backed securities for a fixed price, with payment and delivery on an agreed upon future settlement date. The specific securities to be delivered are not identified at the trade date. However, delivered securities must meet specified terms, including issuer, rate and mortgage terms. The Master Portfolio generally enters into TBA commitments with the intent to take possession of or deliver the underlying mortgage-backed securities but can extend the settlement or roll the transaction. TBA commitments involve a risk of loss if the value of the security to be purchased or sold declines or increases, respectively, prior to settlement date.
Mortgage Dollar Roll Transactions: The Master Portfolio may sell TBA mortgage-backed securities and simultaneously contract to repurchase substantially similar (same type, coupon and maturity) securities on a specific future date at an agreed upon price. During the period between the sale and repurchase, the Master Portfolio will not be entitled to receive interest and principal payments on the securities sold. The Master Portfolio accounts for mortgage dollar roll transactions as purchases and sales and realizes gains and losses on these transactions. These transactions may increase the Master Portfolio’s portfolio turnover rate. Mortgage dollar rolls involve the risk that the market value of the securities that the Master Portfolio is required to purchase may decline below the agreed upon repurchase price of those securities.
Borrowed Bond Agreements: The Master Portfolio may enter into borrowed bond agreements. In a borrowed bond agreement, the Master Portfolio borrows a bond from a counterparty in exchange for cash collateral with the commitment that the security and the cash will be returned to the counterparty and the Master Portfolio, respectively, at a mutually agreed upon rate and date. Certain agreements have no stated maturity and can be terminated by either party at any time. Borrowed bond agreements are entered into primarily in connection with short sales of bonds. Earnings on cash collateral and compensation to the lender of the bond are based on agreed upon rates between the Master Portfolio and the counterparty. The value of the underlying cash collateral approximates the market value and accrued interest of the borrowed
| | | | | | |
| | | BLACKROCK BALANCED CAPITAL FUND, INC. | | SEPTEMBER 30, 2013 | | 73 |
| | | | |
| Notes to Consolidated Financial Statements (continued) | | | Master Total Return Portfolio | |
bond. To the extent that a borrowed bond transaction exceeds one business day, the value of the cash collateral in the possession of the counterparty is monitored on a daily basis to ensure the adequacy of the collateral. As the market value of the borrowed bond changes, the cash collateral is periodically increased or decreased with a frequency and in amounts prescribed in the borrowed bond agreement. Full realization of the collateral by the Master Portfolio may be limited if the value of an investment purchased with the cash collateral by the lender decreases. The Master Portfolio may also experience delays in gaining access to the collateral.
Reverse Repurchase Agreements: The Master Portfolio may enter into reverse repurchase agreements with qualified third party broker-dealers. In a reverse repurchase agreement, the Master Portfolio sells securities to a bank or broker-dealer and agrees to repurchase the same securities at a mutually agreed upon date and price. Securities sold under reverse repurchase agreements are recorded as a liability in the Consolidated Statement of Assets and Liabilities. Due to the short term nature of the reverse repurchase agreements, face value approximates fair value. During the term of the reverse repurchase agreement, the Master Portfolio continues to receive the principal and interest payments on these securities. Certain agreements have no stated maturity and can be terminated by either party at any time. Interest on the value of the reverse repurchase agreements issued and outstanding is based upon competitive market rates determined at the time of issuance. The Master Portfolio may utilize reverse repurchase agreements when it is anticipated that the interest income to be earned from the investment of the proceeds of the transaction is greater than the interest expense of the transaction. Reverse repurchase agreements involve leverage risk and also the risk that the market value of the securities that the Master Portfolio is obligated to repurchase under the agreement may decline below the repurchase price. In the event the buyer of securities under a reverse repurchase agreement files for bankruptcy or becomes insolvent, the Master Portfolio’s use of the proceeds of the agreement may be restricted while the other party, or its trustee or receiver, determines whether or not to enforce the Master Portfolio’s obligation to repurchase the securities.
Treasury Roll Transactions: The Master Portfolio may enter into treasury roll transactions. In a treasury roll transaction the Master Portfolio sells a Treasury security to a counterparty with a simultaneous agreement to repurchase the same security at an agreed upon price and future settlement date. The Master Portfolio receives cash from the sale of the Treasury security to use for other investment purposes. The difference between the sale price and repurchase price represents net interest income or net interest expense reflective of an agreed upon rate between the Master Portfolio and the counterparty over the term of the borrowing. For US GAAP purposes, a treasury roll transaction is accounted for as a secured borrowing and not as a purchase or sale. During the term of the borrowing, interest income from the Treasury security and the related interest expense on the secured borrowing is recorded by the Master Portfolio on an accrual basis. The Master Portfolio will benefit from the transaction if the income earned on the investment purchased with the cash received in the treasury roll transaction exceeds the interest expense incurred by the Master Portfolio. If the interest expense exceeds the income earned, the Master Portfolio’s net investment income and dividends to shareholders may be adversely impacted. Treasury roll
transactions involve the risk that the market value of the securities that the Master Portfolio is required to repurchase may decline below the agreed upon repurchase price of those securities.
Short Sales: The Master Portfolio may enter into short sale transactions in which the Master Portfolio sells a security it does not hold in anticipation of a decline in the market price of that security. When the Master Portfolio makes a short sale, it will borrow the security sold short (borrowed bond) and deliver the security to the counterparty to which it sold the security short. An amount equal to the proceeds received by the Master Portfolio is reflected as an asset and an equivalent liability. The amount of the liability is subsequently marked-to-market to reflect the market value of the short sale. The Master Portfolio is required to repay the counterparty interest on the security sold short, which is shown as interest expense in the Consolidated Statement of Operations. The Master Portfolio is exposed to market risk based on the amount, if any, that the market value of the security increases beyond the market value at which the position was sold. Thus, a short sale of a security involves the risk that instead of declining, the price of the security sold short will rise. The short sale of securities involves the possibility of a theoretically unlimited loss since there is a theoretically unlimited potential for the market price of the security sold short to increase. A gain, limited to the price at which the Master Portfolio sold the security short, or a loss, unlimited as to the dollar amount, will be recognized upon the termination of a short sale if the market price is either less than or greater than the proceeds originally received. There is no assurance the Master Portfolio will be able to close out a short position at a particular time or at an acceptable price.
4. Derivative Financial Instruments:
The Master Portfolio engages in various portfolio investment strategies using derivative contracts both to increase the returns of the Master Portfolio and/or to economically hedge, or protect, its exposure to certain risks such as credit risk, equity risk, interest rate risk, foreign currency exchange rate risk, or other risk (inflation risk). These contracts may be transacted on an exchange or OTC.
Financial Futures Contracts: The Master Portfolio purchases and/or sells financial futures contracts and options on financial futures contracts to gain exposure to, or economically hedge against, changes in interest rates (interest rate risk), changes in the value of equity securities (equity risk) or foreign currencies (foreign currency exchange rate risk). Financial futures contracts are agreements between the Master Portfolio and a counterparty to buy or sell a specific quantity of an underlying instrument at a specified price and at a specified date. Depending on the terms of the particular contract, financial futures contracts are settled either through physical delivery of the underlying instrument on the settlement date or by payment of a cash settlement amount on the settlement date. Upon entering into a financial futures contract, the Master Portfolio is required to deposit initial margin with the broker in the form of cash or securities in an amount that varies depending on a contract’s size and risk profile. The initial margin deposit must then be maintained at an established level over the life of the contract. Securities deposited as initial margin are designated on the Schedule of Investments and cash deposited, if any, is recorded on the Consolidated Statement of Assets and Liabilities as cash pledged for financial futures
| | | | | | |
| 74 | | BLACKROCK BALANCED CAPITAL FUND, INC. | | SEPTEMBER 30, 2013 | | |
| | | | |
| Notes to Consolidated Financial Statements (continued) | | | Master Total Return Portfolio | |
contracts. Pursuant to the contract, the Master Portfolio agrees to receive from or pay to the broker an amount of cash equal to the daily fluctuation in value of the contract. Such receipts or payments are known as variation margin. Variation margin is recorded by the Master Portfolio as unrealized appreciation or depreciation, and if applicable, as a receivable or payable for variation margin in the Consolidated Statement of Assets and Liabilities. When the contract is closed, the Master Portfolio records a realized gain or loss equal to the difference between the value of the contract at the time it was opened and the value at the time it was closed. The use of financial futures contracts involves the risk of an imperfect correlation in the movements in the price of financial futures contracts, interest or foreign currency exchange rates and the underlying assets
Foreign Currency Exchange Contracts: The Master Portfolio enters into foreign currency exchange contracts as an economic hedge against either specific transactions or portfolio instruments or to obtain exposure to, or hedge exposure away from, foreign currencies (foreign currency exchange rate risk). A foreign currency exchange contract is an agreement between two parties to buy and sell a currency at a set exchange rate on a future date. Foreign currency exchange contracts, when used by the Master Portfolio, help to manage the overall exposure to the currencies in which some of the investments held by the Master Portfolio are denominated. The contract is marked-to-market daily and the change in market value is recorded by the Master Portfolio as an unrealized gain or loss. When the contract is closed, the Master Portfolio records a realized gain or loss equal to the difference between the value at the time it was opened and the value at the time it was closed. The use of foreign currency exchange contracts involves the risk that the value of a foreign currency exchange contract changes unfavorably due to movements in the value of the referenced foreign currencies and the risk that the counterparty to the contract does not perform its obligations under the agreement.
Options: The Master Portfolio purchases and writes call and put options to increase or decrease its exposure to underlying instruments (including credit risk, foreign currency exchange rate risk, equity risk and interest rate risk) and/or, in the case of options written, to generate gains from options premiums. A call option gives the purchaser (holder) of the option the right (but not the obligation) to buy, and obligates the seller (writer) to sell (when the option is exercised), the underlying instrument at the exercise or strike price at any time or at a specified time during the option period. A put option gives the holder the right to sell and obligates the writer to buy the underlying instrument at the exercise or strike price at any time or at a specified time during the option period. When the Master Portfolio purchases (writes) an option, an amount equal to the premium paid (received) by the Master Portfolio is reflected as an asset (liability). The amount of the asset (liability) is subsequently marked-to-market to reflect the current market value of the option purchased (written). When an instrument is purchased or sold through an exercise of an option, the related premium paid (or received) is added to (or deducted from) the basis of the instrument acquired or deducted from (or added to) the proceeds of the instrument sold. When an option expires (or the Master Portfolio enters into a closing transaction), the Master Portfolio realizes a gain or loss on the option to the extent of the premiums received or paid (or gain or loss to the extent the cost of the
closing transaction exceeds the premiums received or paid). When the Master Portfolio writes a call option, such option is “covered,” meaning that the Master Portfolio holds the underlying instrument subject to being called by the option counterparty. When the Master Portfolio writes a put option, such option is covered by cash in an amount sufficient to cover the obligation.
Options on swaps (swaptions) are similar to options on securities except that instead of selling or purchasing the right to buy or sell a security, the writer or purchaser of the swap option is granting or buying the right to enter into a previously agreed upon interest rate or credit default swap agreement (interest rate risk and/or credit risk) at any time before the expiration of the option.
The Master Portfolio also purchases or sells listed or OTC foreign currency options, foreign currency futures and related options on foreign currency futures as a short or long hedge against possible variations in foreign exchange rates or to gain exposure to foreign currencies (foreign currency exchange rate risk). When foreign currency is purchased or sold through an exercise of a foreign currency option, the related premium paid (or received) is added to (or deducted from) the basis of the foreign currency acquired or deducted from (or added to) the proceeds of the foreign currency sold (receipts from the foreign currency purchased). Such transactions may be effected with respect to hedges on non-US dollar denominated instruments owned by the Master Portfolio but not yet delivered, or committed or anticipated to be purchased by the Master Portfolio.
The Funds may also purchase and write a variety of options with nonstandard payout structures or other features (“barrier options”). Barrier options are generally traded OTC. The Funds may invest in various types of barrier options including one-touch options and up-and-out options. One-touch options provide the purchaser of the option an agreed-upon payout if the price of the underlying instrument reaches or surpasses predetermined barrier price level prior to the option’s expiration date. Up-and-out options expire worthless if the price of the underlying instrument increases beyond a predetermined barrier price level prior to the option’s expiration date. Barrier options may also be referred to as knockout options. In a reverse knockout option, the option expires worthless if the price of the underlying instrument decreases beyond a predetermined barrier price level prior to the option’s expiration date.
The Master Portfolio may also purchase and write a variety of options with non-standard payout structures or other features (“barrier options”). Barrier options are generally traded OTC. The Master Portfolio may invest in various types of barrier options including down-and-out options, down-and-in options, double no-touch options and one-touch options. Down-and-out options are similar to standard options, except that the option expires worthless to the purchaser of the option if the price of the underlying instrument reaches a specific barrier price level prior to the option’s expiration date. Down-and-in options expire worthless to the purchaser of the option unless the price of the underlying instrument falls below a specific barrier price level prior to the option’s expiration date. Double no-touch options provide the purchaser of the option an agreed-upon payout if the price of the underlying instrument does not reach or surpass predetermined barrier price levels prior to the
| | | | | | |
| | | BLACKROCK BALANCED CAPITAL FUND, INC. | | SEPTEMBER 30, 2013 | | 75 |
| | | | |
| Notes to Consolidated Financial Statements (continued) | | | Master Total Return Portfolio | |
option’s expiration date. One-touch options provide the purchaser of the option an agreed-upon payout if the price of the underlying instrument reaches or surpasses predetermined barrier price level prior to the option’s expiration date.
In purchasing and writing options, the Master Portfolio bears the risk of an unfavorable change in the value of the underlying instrument or the risk that the Master Portfolio may not be able to enter into a closing transaction due to an illiquid market. Exercise of a written option could result in the Master Portfolio purchasing or selling a security when it otherwise would not, or at a price different from the current market value.
Swaps: The Master Portfolio enter into swap agreements, in which the Master Portfolio and a counterparty agree either to make periodic net payments on a specified notional amount or net payment upon termination. Swap agreements are privately negotiated in the OTC market and may be entered into as a bilateral contract (“OTC swaps”) or centrally cleared (“centrally cleared swaps”). Swaps are marked-to-market daily and changes in value are recorded as unrealized appreciation (depreciation).
For OTC swaps, any upfront premiums paid are recorded as assets and any upfront fees received are recorded as liabilities and are shown as swap premiums paid and swap premiums received, respectively, in the Consolidated Statement of Assets and Liabilities and amortized over the term of the OTC swap. Payments received or made by the Master Portfolio for OTC swaps are recorded in the Consolidated Statement of Operations as realized gains or losses, respectively. When an OTC swap is terminated, the Master Portfolio will record a realized gain or loss equal to the difference between the proceeds from (or cost of) the closing transaction and the Master Portfolio’s basis in the contract, if any. Generally, the basis of the contracts is the premium received or paid.
In a centrally cleared swap, immediately following execution of the swap agreement, the swap agreement is novated to a central counterparty (the “CCP”) and the Master Portfolio’s counterparty on the swap agreement becomes the CCP. The Master Portfolio is required to interface with the CCP through a broker. Upon entering into a centrally cleared swap, the Master Portfolio are required to deposit initial margin with the broker in the form of cash or securities in an amount that varies depending on the size and risk profile of the particular swap. Securities deposited as initial margin are designated on the Schedule of Investments and cash deposited is recorded on the Consolidated Statement of Assets and Liabilities as cash pledged for centrally cleared swaps. The daily change in valuation of centrally cleared swaps is recorded as a receivable or payable for variation margin in the Consolidated Statement of Assets and Liabilities. Payments received from (paid to) the counterparty, including at termination, are recorded as realized gain (loss) in the Consolidated Statement of Operations.
Swap transactions involve, to varying degrees, elements of interest rate, credit and market risk in excess of the amounts recognized in the Consolidated Statement of Assets and Liabilities. Such risks involve the possibility that there will be no liquid market for these agreements, that the counterparty to the agreements may default on its obligation to perform or disagree as to the meaning of the contractual terms in the
agreements, and that there may be unfavorable changes in interest rates and/or market values associated with these transactions.
| Ÿ | | Credit default swaps — The Master Portfolio enters into credit default swaps to manage its exposure to the market or certain sectors of the market, to reduce its risk exposure to defaults of corporate and/or sovereign issuers or to create exposure to corporate and/or sovereign issuers to which it is not otherwise exposed (credit risk). The Master Portfolio may either buy or sell (write) credit default swaps on single-name issuers (corporate or sovereign), a combination or basket of single-name issuers or traded indexes. Credit default swaps on single-name issuers are agreements in which the protection buyer pays fixed periodic payments to the seller in consideration for a guarantee from the protection seller to make a specific payment should a negative credit event take place with respect to the referenced entity (e.g., bankruptcy, failure to pay, obligation accelerators, repudiation, moratorium or restructuring). Credit default swaps on traded indexes are agreements in which the buyer pays fixed periodic payments to the seller in consideration for a guarantee from the seller to make a specific payment should a write-down, principal or interest shortfall or default of all or individual underlying securities included in the index occur. As a buyer, if an underlying credit event occurs, the Master Portfolio will either receive from the seller an amount equal to the notional amount of the swap and deliver the referenced security or underlying securities comprising the index or receive a net settlement of cash equal to the notional amount of the swap less the recovery value of the security or underlying securities comprising the index. As a seller (writer), if an underlying credit event occurs, the Master Portfolio will either pay the buyer an amount equal to the notional amount of the swap and take delivery of the referenced security or underlying securities comprising the index or pay a net settlement of cash equal to the notional amount of the swap less the recovery value of the security or underlying securities comprising the index. |
| Ÿ | | Total return swaps — The Master Portfolio enters into total return swaps to obtain exposure to a security or market without owning such security or investing directly in that market or to transfer the risk/return of one market (e.g., fixed income) to another market (e.g., equity) (equity risk and/or interest rate risk). Total return swaps are agreements in which there is an exchange of cash flows whereby one party commits to make payments based on the total return (coupons plus capital gains/losses) of an underlying instrument in exchange for fixed or floating rate interest payments. To the extent the total return of the instrument or index underlying the transaction exceeds or falls short of the offsetting interest rate obligation, the Master Portfolio will receive a payment from or make a payment to the counterparty. |
| Ÿ | | Interest rate swaps — The Master Portfolio enters into interest rate swaps to gain or reduce exposure to interest rates or to manage duration, the yield curve or interest rate risk by economically hedging the value of the fixed rate bonds which may decrease when interest rates rise (interest rate risk). Interest rate swaps are agreements in which one party pays a stream of interest payments, either fixed or floating, for another party’s stream of interest payments, either fixed or floating, on the same notional amount for a specified period of time. Interest rate floors, which are a type of interest rate swap, are agreements in which one party agrees to make payments to the other party to the extent that |
| | | | | | |
| 76 | | BLACKROCK BALANCED CAPITAL FUND, INC. | | SEPTEMBER 30, 2013 | | |
| | | | |
| Notes to Consolidated Financial Statements (continued) | | | Master Total Return Portfolio | |
| | interest rates fall below a specified rate or floor in return for a premium. In more complex swaps, the notional principal amount may decline (or amortize) over time. |
| Ÿ | | Forward swaps — The Master Portfolio may enter into forward interest rate swaps and forward total return swaps. In a forward swap, the Master Portfolio and the counterparty agree to make either periodic net payments beginning on a specified future effective date or a net payment at termination, unless terminated earlier. |
The following is a summary of the Master Portfolio’s derivative financial instruments categorized by risk exposure:
| | | | | | |
| Fair Values of Derivative Financial Instruments as of September 30, 2013 | |
| | | Derivatives Assets | |
| | | Consolidated Statement of
Assets and Liabilities
Location | | Value | |
Interest rate contracts | | Net unrealized appreciation/depreciation1; Unrealized appreciation on swaps | | $ | 17,169,600 | |
| | | |
Foreign currency exchange contracts | | Unrealized appreciation on foreign currency exchange contracts; Investments at value — unaffiliated2 | | | 2,555,926 | |
| | | |
Credit contracts | | Unrealized appreciation on swaps; Swap premiums paid | | | 12,775,811 | |
| | | |
Equity contracts | | Net unrealized appreciation/depreciation1; Swap premiums paid; Investments at value — unaffiliated2 | | | 1,528,331 | |
| | | |
Total | | | | $ | 34,029,668 | |
| |
| | | | | | |
| | | Derivatives Liabilities | |
| | | Consolidated Statement of
Assets and Liabilities
Location | | Value | |
Interest rate contracts | | Net unrealized appreciation/depreciation1; Unrealized depreciation on swaps; Options written at value | | $ | 11,234,692 | |
| | | |
Foreign currency exchange contracts | | Unrealized depreciation on foreign currency exchange contracts; Options written at value | | | 6,931,607 | |
| | | |
Credit contracts | | Unrealized depreciation on swaps; Swap premiums received; Options written at value | | | 16,298,206 | |
| | | |
Equity contracts | | Net unrealized appreciation/depreciation1; Unrealized depreciation on swaps; Options written at value | | | 1,481,314 | |
| | | |
Total | | | | $ | 35,945,819 | |
| |
| | 1 | Includes cumulative appreciation/depreciation on financial futures contracts and centrally cleared swaps, if any, as reported in the Consolidated Schedule of Investments. Only current day’s variation margin is reported within the Consolidated Statement of Assets and Liabilities. |
| | 2 | Includes options purchased at value as reported within the Consolidated Statement of Assets and Liabilities. |
| | | | |
The Effect of Derivative Financial Instruments in the Consolidated Statement of
Operations Year Ended September 30, 2013 | |
| Net Realized Gain (Loss) From | |
Interest rate contracts: | | | | |
Financial futures contracts | | $ | 5,348,123 | |
Swaps | | | 24,666,176 | |
Options3 | | | (6,779,109 | ) |
| | | | | |
| | | | |
The Effect of Derivative Financial Instruments in the Consolidated Statement of
Operations Year Ended September 30, 2013 | |
| Net Realized Gain (Loss) From | |
Foreign currency exchange contracts: | | | | |
Financial futures contracts | | $ | (38,640 | ) |
Foreign currency transactions | | | (18,088,484 | ) |
Options3 | | | 1,221,521 | |
Credit contracts: | | | | |
Swaps | | | (4,960,572 | ) |
Options3 | | | 632,711 | |
Equity contracts: | | | | |
Financial futures contracts | | | 1,072,949 | |
Options3 | | | 2,397,844 | |
| | | | |
Total | | $ | 5,472,519 | |
| | | | |
| | | | |
| Net Change in Unrealized Appreciation/Depreciation on | |
Interest rate contracts: | | | | |
Financial futures contracts | | $ | (1,486,044 | ) |
Swaps | | | 9,624,537 | |
Options3 | | | 3,092,636 | |
Foreign currency exchange contracts: | | | | |
Foreign currency translations | | | 7,067,418 | |
Options3 | | | (497,287 | ) |
Credit contracts: | | | | |
Swaps | | | (2,767,320 | ) |
Options3 | | | (21,883 | ) |
Equity contracts: | | | | |
Financial futures contracts | | | 138,784 | |
Options3 | | | 301,950 | |
Other contracts: | | | | |
Swaps | | | (504,986 | ) |
| | | | |
Total | | $ | 14,947,805 | |
| | | | |
| | 3 | Options purchased are included in the net realized gain (loss) from investments and net change in unrealized appreciation/depreciation on investments. |
For the year ended September 30, 2013, the average quarterly balances of outstanding derivative financial instruments were as follows:
| | | | |
Financial futures contracts: | | | | |
Average number of contracts purchased | | | 6,192 | |
Average number of contracts sold | | | 5,314 | |
Average notional value of contracts purchased | | $ | 1,180,908,175 | |
Average notional value of contracts sold | | $ | 912,693,727 | |
Foreign currency exchange contracts: | | | | |
Average number of contracts - US dollars purchased | | | 36 | |
Average number of contracts - US dollars sold | | | 25 | |
Average US dollar amounts purchased | | $ | 764,453,215 | |
Average US dollar amounts sold | | $ | 227,389,697 | |
Options: | | | | |
Average number of option contracts purchased | | | 7,607 | |
Average number of option contracts written | | | 4,888 | |
Average notional value of option contracts purchased | | $ | 901,979,785 | |
Average notional value of option contracts written | | $ | 671,059,955 | |
Average number of swaption contracts purchased | | | 5 | |
Average number of swaption contracts written | | | 8 | |
Average notional value of swaption contracts purchased | | $ | 613,145,022 | |
Average notional value of swaption contracts written | | $ | 214,648,671 | |
Credit default swaps: | | | | |
Average number of contracts - buy protection | | | 66 | |
Average number of contracts - sell protection | | | 77 | |
Average notional value - buy protection | | $ | 526,176,238 | |
Average notional value - sell protection | | $ | 378,912,530 | |
| | | | | | |
| | | BLACKROCK BALANCED CAPITAL FUND, INC. | | SEPTEMBER 30, 2013 | | 77 |
| | | | |
| Notes to Consolidated Financial Statements (continued) | | | Master Total Return Portfolio | |
| | | | |
Interest rate swaps: | | | | |
Average number of contracts - pays fixed rate | | | 9 | |
Average number of contracts - receives fixed rate | | | 5 | |
Average notional value - pays fixed rate | | $ | 686,694,750 | |
Average notional value - receives fixed rate | | $ | 380,369,596 | |
Total return swaps: | | | | |
Average number of contracts | | | 6 | |
Average notional value | | $ | 20,234,155 | |
Counterparty Credit Risk: A derivative contract may suffer a mark to market loss if the value of the contract decreases due to an unfavorable change in the market rates or values of the underlying instrument. Losses can also occur if the counterparty does not perform under the contract.
The Master Portfolio’s risk of loss from counterparty credit risk on OTC derivatives is generally limited to the aggregate unrealized gain netted against any collateral held by such Master Portfolios. For OTC options purchased, the Master Portfolio bears the risk of loss of the amount of the premiums paid plus the positive change in market values net of any collateral held by such Master Portfolios should the counterparty fail to perform under the contracts. Options written by the Master Portfolio do not typically give rise to counterparty credit risk, as options written generally obligate the Master Portfolio, and not the counterparty, to perform.
With exchange traded purchased options and futures and centrally cleared swaps, there is less counterparty credit risk to the Master Portfolio since the exchange or clearinghouse, as counterparty to such instruments, guarantees against a possible default. The clearinghouse stands between the buyer and the seller of the contract; therefore, the credit risk is limited to failure of the clearinghouse. Credit risk exists in exchange traded futures and centrally cleared swaps with respect to initial and variation margin that is held in a clearing broker’s customer accounts. While clearing brokers are required to segregate customer margin from their own assets, in the event that a clearing broker becomes insolvent or goes into bankruptcy and at that time there is a shortfall in the aggregate amount of margin held by the clearing broker for all its clients, typically the shortfall would be allocated on a pro rata basis across all the clearing broker’s customers, potentially resulting in losses to the Master Portfolio.
In order to better define its contractual rights and to secure rights that will help the Master Portfolio mitigate its counterparty risk, the Master Portfolio may enter into an International Swaps and Derivatives Association, Inc. Master Agreement (“ISDA Master Agreement”) or similar agreement with its derivative contract counterparties. An ISDA Master Agreement is a bilateral agreement between each Master Portfolio and a
counterparty that governs OTC derivatives and foreign exchange contracts and typically contains, among other things, collateral posting terms and netting provisions in the event of a default and/or termination event. Under an ISDA Master Agreement, the Master Portfolio may, under certain circumstances, offset with the counterparty certain derivative financial instruments’ payables and/or receivables with collateral held and/or posted and create one single net payment. The provisions of the ISDA Master Agreement typically permit a single net payment in the event of default including the bankruptcy or insolvency of the counterparty. However, bankruptcy or insolvency laws of a particular jurisdiction may impose restrictions on or prohibitions against the right of offset in bankruptcy, insolvency or other events. In addition, certain ISDA Master Agreements allow counterparties to OTC derivatives to terminate derivative contracts prior to maturity in the event the Master Portfolio’s net assets decline by a stated percentage or the Master Portfolio fails to meet the terms of its ISDA Master Agreements, which would cause the Master Portfolio to accelerate payment of any net liability owed to the counterparty.
Collateral Requirements: For derivatives traded under an ISDA Master Agreement, the collateral requirements are typically calculated by netting the mark to market amount for each transaction under such agreement and comparing that amount to the value of any collateral currently pledged by the Master Portfolio and the counterparty.
Cash collateral that has been pledged to cover obligations of the Master Portfolio and cash collateral received from the counterparty, if any, is reported separately on the Consolidated Statement of Assets and Liabilities as cash pledged as collateral and cash received as collateral, respectively. Non-cash collateral pledged by the Master Portfolio, if any, is noted in the Schedule of Investments. Generally, the amount of collateral due from or to a party has to exceed a minimum transfer amount threshold (e.g. $500,000) before a transfer is required, which is determined at the close of business of the Master Portfolio and any additional required collateral is delivered to/pledged by the Master Portfolio on the next business day. Typically, the Master Portfolio and counterparties are not permitted to sell, re-pledge or use the collateral they receive. To the extent amounts due to the Master Portfolio from its counterparties are not fully collateralized, contractually or otherwise, the Master Portfolio bears the risk of loss from counterparty non-performance. Each Master Portfolio attempts to mitigate counterparty risk by entering into agreements only with counterparties that it believes have the financial resources to honor their obligations and by monitoring the financial stability of those counterparties.
5. Investment Advisory Agreement and Other Transactions with Affiliates:
The PNC Financial Services Group, Inc. is the largest stockholder and an affiliate, for 1940 Act purposes, of BlackRock, Inc. (“BlackRock”).
The Master LLC, on behalf of the Master Portfolio, entered into an Investment Advisory Agreement with BlackRock Advisors, LLC (the “Manager”), the Master LLC’s investment advisor, an indirect, wholly owned subsidiary of BlackRock, to provide investment advisory and administration services. The Manager is responsible for the management of the Master Portfolio’s portfolio and provides the necessary personnel, facilities, equipment and certain other services necessary to the operations of the Master Portfolio. For such services, the Master Portfolio pays the Manager a monthly fee based on the
| | | | | | |
| 78 | | BLACKROCK BALANCED CAPITAL FUND, INC. | | SEPTEMBER 30, 2013 | | |
| | | | |
| Notes to Consolidated Financial Statements (continued) | | | Master Total Return Portfolio | |
percentage of the Master Portfolio’s average daily net assets at the following annual rates:
| | | | |
| Average Daily Net Assets | | Investment
Advisory Fee | |
First $250 Million | | | 0.20 | % |
$250 Million - $500 Million | | | 0.15 | % |
$500 Million - $750 Million | | | 0.10 | % |
Greater than $750 Million | | | 0.05 | % |
| | | | | |
The Manager voluntarily agreed to waive its investment advisory fees by the amount of investment advisory fees the Master Portfolio pays to the Manager indirectly through its investment in affiliated money market funds. However, the Manager does not waive its investment advisory fees by the amount of investment advisory fees paid in connection with the Master Portfolio’s investment in other affiliated investment companies, if any. This amount is shown as fees waived by Manager in the Consolidated Statement of Operations.
The Manager provides investment management and other services to the Subsidiary. The Manager does not receive separate compensation from the Subsidiary for providing investment management or administrative services. However, the Master Portfolio pays the Manager based on the Master Portfolio’s net assets which includes the assets of the Subsidiary.
The Manager entered into sub-advisory agreements with BlackRock Financial Management, Inc. (“BFM”), BlackRock International Limited (“BIL”) and BlackRock (Singapore) Limited (“BRS”), each an affiliate of the Manager. The Manager pays BFM, BIL and BRS for services they provide, a monthly fee that is a percentage of the investment advisory fees paid by the Master Portfolio to the Manager.
For the year ended September 30, 2013, the Master LLC reimbursed the Manager $9,736 for certain accounting services, which is included in accounting services in the Consolidated Statement of Operations.
Certain officers and/or directors of the Master LLC are officers and/or directors of BlackRock or its affiliates. The Master Portfolio reimburses the Manager for compensation paid to the Master LLC’s Chief Compliance Officer.
The Master Portfolio may purchase securities from, or sell securities to, an affiliated fund provided the affiliation is solely due to having a common investment adviser, common officers, or common trustees. For the six months ended September 30, 2013, the purchase and sale transactions with an affiliated fund in compliance with Rule 17a-7 under the 1940 Act was a purchase of $2,013,448.
6. Purchases and Sales:
Purchases and sales of investments, including paydowns, mortgage dollar roll and TBA transactions and excluding short-term securities and US government securities for the year ended September 30, 2013, were $25,860,246,924 and $26,913,800,702, respectively.
Purchases and sales of US government securities, for the year ended September 30, 2013, were $10,721,928,943 and $10,876,769,251, respectively.
For the year ended September 30, 2013, purchases and sales related to mortgage dollar rolls were $15,399,568,586 and $15,400,245,221, respectively.
Transactions in options written for the year ended September 30, 2013, were as follows:
| | | | | | | | | | | | | | | | | | | | | | | | |
| | | Calls | | | Puts | |
| | | Contracts | | | Notional
(000)1 | | | Premiums
Received | | | Contracts | | | Notional
(000)1 | | | Premiums
Received | |
Outstanding options, beginning of year | | | 2,235 | | | | 257,850 | | | $ | 4,387,271 | | | | — | | | | 403,130 | | | $ | 6,265,484 | |
Options written | | | 32,120 | | | | 2,096,540 | | | | 33,465,414 | | | | 19,601 | | | | 2,526,693 | | | | 40,687,909 | |
Options exercised | | | — | | | | (158,840 | ) | | | (506,754 | ) | | | — | | | | (3,579 | ) | | | (40,798 | ) |
Options expired | | | (4,451 | ) | | | (455,040 | ) | | | (1,609,227 | ) | | | (375 | ) | | | (1,351,030 | ) | | | (7,327,109 | ) |
Options closed | | | (25,877 | ) | | | (1,573,360 | ) | | | (34,022,732 | ) | | | (19,226 | ) | | | (1,389,759 | ) | | | (37,813,245 | ) |
| | | | | | | | |
Outstanding options, end of year | | | 4,027 | | | | 167,150 | | | $ | 1,713,972 | | | | — | | | | 185,455 | | | $ | 1,772,241 | |
| | | | | | | | |
| | 1 | Amount shown is in the currency in which the transaction was denominated. |
| | | | | | |
| | | BLACKROCK BALANCED CAPITAL FUND, INC. | | SEPTEMBER 30, 2013 | | 79 |
| | | | |
| Notes to Consolidated Financial Statements (concluded) | | | Master Total Return Portfolio | |
7. Borrowings:
The Master LLC, on behalf of the Master Portfolio, along with certain other funds managed by the Manager and its affiliates (“Participating Funds”), is a party to a 364-day, $800 million credit agreement with a group of lenders, under which the Master Portfolio may borrow to fund shareholder redemptions. The agreement expires in April 2014. Excluding commitments designated for a certain individual fund, other Participating Funds, including the Master Portfolio, can borrow up to an aggregate commitment amount of $500 million, subject to asset coverage and other limitations as specified in the agreement. The credit agreement has the following terms: a fee of 0.065% per annum on unused commitment amounts and interest at a rate equal to the higher of (a) the one-month LIBOR plus 0.80% per annum or (b) the Fed Funds rate plus 0.80% per annum on amounts borrowed. Participating Funds paid administration and arrangement fees, which, along with commitment fees, were allocated among such funds based upon portions of the aggregate commitment available to them and relative net assets of Participating Funds. The Master Portfolio did not borrow under the credit agreement during the year ended September 30, 2013.
For the year ended September 30, 2013, the average amount of transactions considered as borrowings and the daily weighted average interest rate from reverse repurchase agreements and treasury roll transactions were $1,707,130,339 and 0.12%, respectively.
8. Concentration, Market and Credit Risk:
In the normal course of business, the Master Portfolio invests in securities and enters into transactions where risks exist due to fluctuations in the market (market risk) or failure of the issuer of a security to meet all its obligations (issuer credit risk). The value of securities held by the Master Portfolio may decline in response to certain events, including those directly involving the issuers whose securities are owned by the
Master Portfolio; conditions affecting the general economy; overall market changes; local, regional or global political, social or economic instability; and currency and interest rate and price fluctuations. Similar to issuer credit risk, the Master Portfolio may be exposed to counterparty credit risk, or the risk that an entity with which the Master Portfolio has unsettled or open transactions may fail to or be unable to perform on its commitments. The Master Portfolio manages counterparty credit risk by entering into transactions only with counterparties that it believes have the financial resources to honor their obligations and by monitoring the financial stability of those counterparties. Financial assets, which potentially expose the Master Portfolio to market, issuer and counterparty credit risks, consist principally of financial instruments and receivables due from counterparties. The extent of the Master Portfolio’s exposure to market, issuer and counterparty credit risks with respect to these financial assets is generally approximated by their value recorded in the Consolidated Statement of Assets and Liabilities, less any collateral held by the Master Portfolio.
The Master Portfolio invests a significant portion of its assets in securities backed by commercial or residential mortgage loans or in issuers that hold mortgage and other asset-backed securities. Please see the Consolidated Schedule of Investments for these securities. Changes in economic conditions, including delinquencies and/or defaults on assets underlying these securities, can affect the value, income and/or liquidity of such positions.
9. Subsequent Events:
Management has evaluated the impact of all subsequent events on the Master Portfolio through the date the financial statements were issued and has determined that there were no subsequent events requiring adjustment or additional disclosure in the financial statements.
| | | | | | |
| 80 | | BLACKROCK BALANCED CAPITAL FUND, INC. | | SEPTEMBER 30, 2013 | | |
| | |
| Report of Independent Registered Public Accounting Firm | | |
To the Investors of Master Total Return Portfolio and Board of Directors of Master Bond LLC:
We have audited the consolidated statement of assets and liabilities, including the consolidated schedule of investments, of Master Total Return Portfolio (the “Master Portfolio”) of Master Bond LLC, as of September 30, 2013, and the related consolidated statements of operations and cash flows for the period then ended, the consolidated statements of changes in net assets for each of the two years in the period then ended, the consolidated financial highlights for each of the two years ended September 30, 2013 and September 30, 2012, and the financial highlights for each of the other periods presented. These financial statements and financial highlights are the responsibility of the Master Portfolio’s management. Our responsibility is to express an opinion on these financial statements and financial highlights based on our audits.
We conducted our audits in accordance with the standards of the Public Company Accounting Oversight Board (United States). Those standards require that we plan and perform the audit to obtain reasonable assurance about whether the financial statements and financial highlights are free of material misstatement. The Master Portfolio is not required to have, nor were we engaged to perform, an audit of its internal control over financial reporting. Our audit included consideration of internal control over financial reporting as a basis for designing audit procedures that are appropriate in the circumstances, but not for the purpose of expressing an opinion on the effectiveness of the Master Portfolio’s
internal control over financial reporting. Accordingly, we express no such opinion. An audit also includes examining, on a test basis, evidence supporting the amounts and disclosures in the financial statements, assessing the accounting principles used and significant estimates made by management, as well as evaluating the overall financial statement presentation. Our procedures included confirmation of securities owned as of September 30, 2013, by correspondence with the custodian, brokers and agent banks; where replies were not received from brokers and agent banks, we performed other auditing procedures. We believe that our audits provide a reasonable basis for our opinion.
In our opinion, the financial statements and financial highlights referred to above present fairly, in all material respects, the consolidated financial position of the Master Total Return Portfolio, the consolidated results of its operations and cash flows for the year then ended, the consolidated changes in its net assets for each of the two years in the period then ended, its consolidated financial highlights for each of the two years ended September 30, 2013 and September 30, 2012, and its financial highlights for each of the other periods presented, in conformity with accounting principles generally accepted in the United States of America.
Deloitte & Touche LLP
Philadelphia, Pennsylvania
November 26, 2013
| | | | | | |
| | | BLACKROCK BALANCED CAPITAL FUND, INC. | | SEPTEMBER 30, 2013 | | 81 |
| | |
| Disclosure of Investment Advisory Agreement and Sub-Advisory Agreement | | |
The Board of Directors (the “Board,” and the members of which are referred to as “Board Members”) of the BlackRock Balanced Capital Fund, Inc. (the “Fund”) met in person on April 9, 2013 (the “April Meeting”) and May 14-15, 2013 (the “May Meeting”) to consider the approval of the Fund’s investment advisory agreement (the “Advisory Agreement”) with BlackRock Advisors, LLC (the “Manager”), the Fund’s investment advisor. The Board also considered the approval of the sub-advisory agreement (the “Sub-Advisory Agreement”) between the Manager and BlackRock Investment Management, LLC (the “Sub-Advisor”), with respect to the Fund. The Manager and the Sub-Advisor are referred to herein as “BlackRock.” The Advisory Agreement and the Sub-Advisory Agreement are referred to herein as the “Agreements.”
Activities and Composition of the Board
The Board consists of thirteen individuals, ten of whom are not “interested persons” of the Fund as defined in the Investment Company Act of 1940, as amended (the “1940 Act”) (the “Independent Board Members”). The Board Members are responsible for the oversight of the operations of the Fund and perform the various duties imposed on the directors of investment companies by the 1940 Act. The Independent Board Members have retained independent legal counsel to assist them in connection with their duties. The Chairman of the Board is an Independent Board Member. The Board has established five standing committees: an Audit Committee, a Governance and Nominating Committee, a Compliance Committee, a Performance Oversight Committee and an Executive Committee, each of which is chaired by an Independent Board Member and composed of Independent Board Members (except for the Performance Oversight Committee and the Executive Committee, each of which also has one interested Board Member).
The Agreements
Pursuant to the 1940 Act, the Board is required to consider the continuation of the Agreements on an annual basis. The Board has four quarterly meetings per year, each extending over two days, and a fifth one-day meeting to consider specific information surrounding the consideration of renewing the Agreements. In connection with this process, the Board assessed, among other things, the nature, scope and quality of the services provided to the Fund by BlackRock, its personnel and its affiliates, including investment management, administrative and shareholder services, oversight of fund accounting and custody, marketing services, risk oversight, compliance and assistance in meeting applicable legal and regulatory requirements.
The Board, acting directly and through its committees, considers at each of its meetings, and from time to time as appropriate, factors that are relevant to its annual consideration of the renewal of the Agreements, including the services and support provided by BlackRock to the Fund and its shareholders. Among the matters the Board considered were: (a) investment performance for one-year, three-year, five-year and/or since inception periods, as applicable, against peer funds, and applicable benchmarks, if any, as well as senior management’s and portfolio managers’ analysis of the reasons for any over-performance or
underperformance against its peers and/or benchmark, as applicable; (b) fees, including advisory, administration, if applicable, and other amounts paid to BlackRock and its affiliates by the Fund for services, such as marketing and distribution, call center and fund accounting; (c) Fund operating expenses and how BlackRock allocates expenses to the Fund; (d) the resources devoted to, risk oversight of, and compliance reports relating to, implementation of the Fund’s investment objective, policies and restrictions; (e) the Fund’s compliance with its Code of Ethics and other compliance policies and procedures; (f) the nature, cost and character of non-investment management services provided by BlackRock and its affiliates; (g) BlackRock’s and other service providers’ internal controls and risk and compliance oversight mechanisms; (h) BlackRock’s implementation of the proxy voting policies approved by the Board; (i) the use of brokerage commissions and execution quality of portfolio transactions; (j) BlackRock’s implementation of the Fund’s valuation and liquidity procedures; (k) an analysis of management fees for products with similar investment objectives across the open-end fund, exchange-traded fund (“ETF”), closed-end fund and institutional account product channels, as applicable; (l) BlackRock’s compensation methodology for its investment professionals and the incentives it creates; and (m) periodic updates on BlackRock’s business.
The Board has engaged in an ongoing strategic review with BlackRock of opportunities to consolidate funds and of BlackRock’s commitment to investment performance. In addition, the Board requested and BlackRock provided an analysis of fair valuation and stale pricing policies. BlackRock also furnished information to the Board in response to specific questions. These questions covered issues such as BlackRock’s profitability, investment performance and management fee levels. The Board further considered the importance of: (i) organizational and structural variables to investment performance; (ii) rates of portfolio turnover; (iii) BlackRock’s performance accountability for portfolio managers; (iv) marketing support for the funds; (v) services provided to the Fund by BlackRock affiliates; and (vi) BlackRock’s oversight of relationships with third party service providers.
Board Considerations in Approving the Agreements
The Approval Process: Prior to the April Meeting, the Board requested and received materials specifically relating to the Agreements. The Board is engaged in a process with its independent legal counsel and BlackRock to review the nature and scope of the information provided to better assist its deliberations. The materials provided in connection with the April Meeting included (a) information independently compiled and prepared by Lipper, Inc. (“Lipper”) on Fund fees and expenses as compared with a peer group of funds as determined by Lipper (“Expense Peers”) and the investment performance of the Fund as compared with a peer group of funds as determined by Lipper1; (b) information on the profits realized by BlackRock and its affiliates pursuant to the Agreements and a discussion of fall-out benefits to BlackRock and its affiliates; (c) a general analysis provided by BlackRock concerning investment management fees charged to other clients, such as institutional clients, ETFs and closed-end funds, under similar investment mandates,
| 1 | Lipper ranks funds in quartiles, ranging from first to fourth, where first is the most desirable quartile position and fourth is the least desirable. |
| | | | | | |
| 82 | | BLACKROCK BALANCED CAPITAL FUND, INC. | | SEPTEMBER 30, 2013 | | |
| | |
| Disclosure of Investment Advisory Agreement and Sub-Advisory Agreement (continued) | | |
as well as the performance of such other clients, as applicable; (d) review of non-management fees; (e) the existence, impact and sharing of potential economies of scale; (f) a summary of aggregate amounts paid by the Fund to BlackRock; (g) sales and redemption data regarding the Fund’s shares; and (h) if applicable, a comparison of management fees to similar BlackRock open-end funds, as classified by Lipper.
At the April Meeting, the Board reviewed materials relating to its consideration of the Agreements. As a result of the discussions that occurred during the April Meeting, and as a culmination of the Board’s year-long deliberative process, the Board presented BlackRock with questions and requests for additional information. BlackRock responded to these requests with additional written information in advance of the May Meeting.
At the May Meeting, the Board, including all the Independent Board Members, approved the continuation of the Advisory Agreement between the Manager and the Fund, and the Sub-Advisory Agreement between the Manager and the Sub-Advisor with respect to the Fund, each for a one-year term ending June 30, 2014. In approving the continuation of the Agreements, the Board considered: (a) the nature, extent and quality of the services provided by BlackRock; (b) the investment performance of the Fund and BlackRock; (c) the advisory fee and the cost of the services and profits to be realized by BlackRock and its affiliates from their relationship with the Fund; (d) the Fund’s costs to investors compared to the costs of Expense Peers and performance compared to the relevant performance comparison as previously discussed; (e) economies of scale; (f) fall-out benefits to BlackRock as a result of its relationship with the Fund; and (g) other factors deemed relevant by the Board Members.
The Board also considered other matters it deemed important to the approval process, such as payments made to BlackRock or its affiliates relating to the distribution of Fund shares and securities lending, services related to the valuation and pricing of Fund portfolio holdings, direct and indirect benefits to BlackRock and its affiliates from their relationship with the Fund and advice from independent legal counsel with respect to the review process and materials submitted for the Board’s review. The Board noted the willingness of BlackRock personnel to engage in open, candid discussions with the Board. The Board did not identify any particular information as determinative, and each Board Member may have attributed different weights to the various items considered.
A. Nature, Extent and Quality of the Services Provided by BlackRock: The Board, including the Independent Board Members, reviewed the nature, extent and quality of services provided by BlackRock, including the investment advisory services and the resulting performance of the Fund. Throughout the year, the Board compared Fund performance to the performance of a comparable group of mutual funds and/or the performance of a relevant benchmark, if any. The Board met with BlackRock’s senior management personnel responsible for investment operations, including the senior investment officers. The Board also reviewed the materials provided by the Fund’s portfolio management team discussing the Fund’s performance and the Fund’s investment objective, strategies and outlook.
The Board considered, among other factors, with respect to BlackRock: the number, education and experience of investment personnel generally and the Fund’s portfolio management team; investments by portfolio managers in the funds they manage; portfolio trading capabilities; use of technology; commitment to compliance; credit analysis capabilities; risk analysis and oversight capabilities; and the approach to training and retaining portfolio managers and other research, advisory and management personnel. The Board engaged in a review of BlackRock’s compensation structure with respect to the Fund’s portfolio management team and BlackRock’s ability to attract and retain high-quality talent and create performance incentives.
In addition to advisory services, the Board considered the quality of the administrative and other non-investment advisory services provided to the Fund. BlackRock and its affiliates provide the Fund with certain administrative, shareholder and other services (in addition to any such services provided to the Fund by third parties) and officers and other personnel as are necessary for the operations of the Fund. In particular, BlackRock and its affiliates provide the Fund with the following administrative services including, among others: (i) preparing disclosure documents, such as the prospectus, the summary prospectus (as applicable), the statement of additional information and periodic shareholder reports; (ii) assisting with daily accounting and pricing; (iii) overseeing and coordinating the activities of other service providers; (iv) organizing Board meetings and preparing the materials for such Board meetings; (v) providing legal and compliance support; (vi) furnishing analytical and other support to assist the Board in its consideration of strategic issues such as the merger or consolidation of certain open-end funds; and (vii) performing other administrative functions necessary for the operation of the Fund, such as tax reporting, fulfilling regulatory filing requirements and call center services. The Board reviewed the structure and duties of BlackRock’s fund administration, shareholder services, legal and compliance departments and considered BlackRock’s policies and procedures for assuring compliance with applicable laws and regulations.
B. The Investment Performance of the Fund and BlackRock: The Board, including the Independent Board Members, also reviewed and considered the performance history of the Fund. In preparation for the April Meeting, the Board worked with its independent legal counsel, BlackRock and Lipper to develop a template for, and was provided with, reports independently prepared by Lipper, which included a comprehensive analysis of the Fund’s performance. The Board also reviewed a narrative and statistical analysis of the Lipper data that was prepared by BlackRock, which analyzed various factors that affect Lipper’s rankings. In connection with its review, the Board received and reviewed information regarding the investment performance of the Fund as compared to other funds in its applicable Lipper category. The Board was provided with a description of the methodology used by Lipper to select peer funds and periodically meets with Lipper representatives to review its methodology. The Board and its Performance Oversight Committee regularly review, and meet with Fund management to discuss, the performance of the Fund throughout the year.
The Board noted that the Fund ranked in the third, second and third quartiles against its Lipper Performance Universe for the one-, three- and
| | | | | | |
| | | BLACKROCK BALANCED CAPITAL FUND, INC. | | SEPTEMBER 30, 2013 | | 83 |
| | |
| Disclosure of Investment Advisory Agreement and Sub-Advisory Agreement (continued) | | |
five-year periods reported, respectively; for the one- and five-year periods, the Fund’s performance was in the 53rd and 54th percentile, respectively. The Board and BlackRock reviewed and discussed the reasons for the Fund’s underperformance during the one- and five-year periods compared to its Lipper Performance Universe. The Board was informed that, among other things, the primary detractor was the Fund’s equity component. The Fund’s equity component was positioned too aggressively for the tumultuous environment of the last few years, as it was Fund management’s belief the market would break out of its longstanding trading range and continue moving to the upside. Unfortunately, the thesis did not materialize and the positioning proved to be a significant detractor from performance.
The Board and BlackRock also discussed BlackRock’s strategy for improving the Fund’s performance and BlackRock’s commitment to providing the resources necessary to assist the Fund’s portfolio managers and to improve the Fund’s performance. BlackRock and the Board concurred, given the Fund’s poor historical performance, in making a change within the portfolio management team. Both BlackRock and the Board are hopeful that the change in portfolio management will result in improved performance going forward, although there can be no assurance that will be the case. The Board will continue to monitor the Fund’s performance.
The Board noted that BlackRock has recently made, and continues to make, changes to the organization of BlackRock’s overall portfolio management structure designed to result in strengthened leadership teams.
C. Consideration of the Advisory/Management Fees and the Cost of the Services and Profits to be Realized by BlackRock and its Affiliates from their Relationship with the Fund: The Board, including the Independent Board Members, reviewed the Fund’s contractual management fee rate compared with the other funds in its Lipper category. The contractual management fee rate represents a combination of the advisory fee and any administrative fees, before taking into account any reimbursements or fee waivers. The Board also compared the Fund’s total net operating expense ratio, as well as actual management fee rate, to those of other funds in its Lipper category. The total net operating expense ratio and actual management fee rate both give effect to any expense reimbursements or fee waivers that benefit the funds. The Board considered the services provided and the fees charged by BlackRock to other types of clients with similar investment mandates, including institutional accounts.
The Board received and reviewed statements relating to BlackRock’s financial condition. The Board was also provided with a profitability analysis that detailed the revenues earned and the expenses incurred by BlackRock for services provided to the Fund. The Board reviewed BlackRock’s profitability with respect to the Fund and other funds the Board currently oversees for the year ended December 31, 2012 compared to available aggregate profitability data provided for the two prior years. The Board reviewed BlackRock’s profitability with respect to certain other fund complexes managed by the Manager and/or its affiliates. The Board reviewed BlackRock’s assumptions and methodology of allocating expenses in the profitability analysis, noting the inherent limitations in allocating costs among various advisory products. The Board recognized
that profitability may be affected by numerous factors including, among other things, fee waivers and expense reimbursements by the Manager, the types of funds managed, precision of expense allocations and business mix. As a result, comparing profitability is difficult.
The Board noted that, in general, individual fund or product line profitability of other advisors is not publicly available. The Board reviewed BlackRock’s overall operating margin, in general, compared to that of certain other publicly-traded asset management firms. The Board considered the differences between BlackRock and these other firms, including the contribution of technology at BlackRock, BlackRock’s expense management, and the relative product mix.
In addition, the Board considered the cost of the services provided to the Fund by BlackRock, and BlackRock’s and its affiliates’ profits relating to the management and distribution of the Fund and the other funds advised by BlackRock and its affiliates. As part of its analysis, the Board reviewed BlackRock’s methodology in allocating its costs to the management of the Fund. The Board also considered whether BlackRock has the financial resources necessary to attract and retain high quality investment management personnel to perform its obligations under the Agreements and to continue to provide the high quality of services that is expected by the Board.
The Board noted that the Fund’s contractual management fee rate ranked in the first quartile relative to the Fund’s Expense Peers; the Fund had the lowest expenses relative to its Expense Peers. The Board also noted that the Fund has an advisory fee arrangement that includes breakpoints that adjust the fee rate downward as the size of the Fund increases above certain contractually specified levels. Additionally, the Board noted that BlackRock has contractually agreed to waive a portion of the advisory fee for the Fund.
D. Economies of Scale: The Board, including the Independent Board Members, considered the extent to which economies of scale might be realized as the assets of the Fund increase, as well as the existence of expense caps, as applicable. The Board also considered the extent to which the Fund benefits from such economies and whether there should be changes in the advisory fee rate or breakpoint structure in order to enable the Fund to participate in these economies of scale, for example through the use of revised breakpoints in the advisory fee based upon the asset level of the Fund. In its consideration, the Board Members took into account the existence of any expense caps and further considered the continuation and/or implementation, as applicable, of such caps.
E. Other Factors Deemed Relevant by the Board Members: The Board, including the Independent Board Members, also took into account other ancillary or “fall-out” benefits that BlackRock or its affiliates may derive from their respective relationships with the Fund, both tangible and intangible, such as BlackRock’s ability to leverage its investment professionals who manage other portfolios and risk management personnel, an increase in BlackRock’s profile in the investment advisory community, and the engagement of BlackRock’s affiliates as service providers to the Fund, including for administrative, distribution, securities lending and cash management services. The Board also considered BlackRock’s overall operations and its efforts to expand the scale of, and improve the
| | | | | | |
| 84 | | BLACKROCK BALANCED CAPITAL FUND, INC. | | SEPTEMBER 30, 2013 | | |
| | |
| Disclosure of Investment Advisory Agreement and Sub-Advisory Agreement (concluded) | | |
quality of, its operations. The Board also noted that BlackRock may use and benefit from third party research obtained by soft dollars generated by certain registered fund transactions to assist in managing all or a number of its other client accounts. The Board further noted that it had considered the investment by BlackRock’s funds in ETFs without any offset against the management fees payable by the funds to BlackRock.
In connection with its consideration of the Agreements, the Board also received information regarding BlackRock’s brokerage and soft dollar practices. The Board received reports from BlackRock which included information on brokerage commissions and trade execution practices throughout the year.
The Board noted the competitive nature of the open-end fund marketplace, and that shareholders are able to redeem their Fund shares if they believe that the Fund’s fees and expenses are too high or if they are dissatisfied with the performance of the Fund.
Conclusion
The Board, including all the Independent Board Members, approved the continuation of the Advisory Agreement between the Manager and the
Fund for a one-year term ending June 30, 2014, and the Sub-Advisory Agreement between the Manager and the Sub-Advisor with respect to the Fund for a one-year term ending June 30, 2014. Based upon its evaluation of all of the aforementioned factors in their totality, the Board, including the Independent Board Members, was satisfied that the terms of the Agreements were fair and reasonable and in the best interest of the Fund and its shareholders. In arriving at its decision to approve the Agreements, the Board did not identify any single factor or group of factors as all-important or controlling, but considered all factors together, and different Board Members may have attributed different weights to the various factors considered. The Independent Board Members were also assisted by the advice of independent legal counsel in making this determination. The contractual fee arrangements for the Fund reflect the results of several years of review by the Board Members and predecessor Board Members, and discussions between such Board Members (and predecessor Board Members) and BlackRock. As a result, the Board Members’ conclusions may be based in part on their consideration of these arrangements in prior years.
| | | | | | |
| | | BLACKROCK BALANCED CAPITAL FUND, INC. | | SEPTEMBER 30, 2013 | | 85 |
| | | | | | | | | | |
Name, Address, and Year of Birth | | Position(s)
Held with
the Fund/
Master LLC | | Length of Time
Served as a Director2 | | Principal Occupation(s) During Past 5 Years | | Number of BlackRock-
Advised Registered
Investment Companies
(“RICs”) Consisting of
Investment Portfolios
(“Portfolios”) Overseen | | Public
Directorships |
| Independent Directors1 | | | | | | | | | | |
Robert M. Hernandez 55 East 52nd Street New York, NY 10055 1944 | | Chairman of the Board and Director | | Since 2007 | | Director, Vice Chairman and Chief Financial Officer of USX Corporation (energy and steel business) from 1991 to 2001; Director, TE Connectivity (electronics) from 2006 to 2012. | | 28 RICs consisting of 84 Portfolios | | ACE Limited (insurance company); Eastman Chemical Company; RTI International Metals, Inc. (metals) |
Fred G. Weiss 55 East 52nd Street New York, NY 10055 1941 | | Vice Chairman of the Board and Director | | Since 2007 | | Managing Director, FGW Associates (consulting and investment company) since 1997; Director and Treasurer, Michael J. Fox Foundation for Parkinson’s Research since 2000; Director, BTG International Plc (medical technology commercialization company) from 2001 to 2007. | | 28 RICs consisting of 84 Portfolios | | Actavis, Inc. (pharmaceuticals) |
James H. Bodurtha 55 East 52nd Street New York, NY 10055 1944 | | Director | | Since 2007 | | Director, The China Business Group, Inc. (consulting and investing firm) since 1996 and Executive Vice President thereof from 1996 to 2003; Chairman of the Board, Berkshire Holding Corporation since 1980. | | 28 RICs consisting of 84 Portfolios | | None |
Bruce R. Bond 55 East 52nd Street New York, NY 10055 1946 | | Director | | Since 2007 | | Trustee and Member of the Governance Committee, State Street Research Mutual Funds from 1997 to 2005; Board Member of Governance, Audit and Finance Committee, Avaya Inc. (computer equipment) from 2003 to 2007. | | 28 RICs consisting of 84 Portfolios | | None |
Donald W. Burton 55 East 52nd Street New York, NY 10055 1944 | | Director | | Since 2007 | | Managing General Partner, The Burton Partnership, LP (an investment partnership) since 1979; Managing General Partner, The South Atlantic Venture Funds since 1983 to 2012; Director, IDology, Inc. (technology solutions) since 2006; Director, Knology, Inc. (telecommunications) from 1996 to 2012; Director, Capital Southwest from 2006 to 2012. | | 28 RICs consisting of 84 Portfolios | | None |
Honorable Stuart E. Eizenstat 55 East 52nd Street New York, NY 10055 1943 | | Director | | Since 2007 | | Partner and Head of International Practice, Covington and Burling LLP (law firm) since 2001; International Advisory Board Member, The Coca Cola Company from 2002 to 2011; Advisory Board Member, Veracity Worldwide LLC (risk management) since 2007; Member of the International Advisory Board GML Ltd. (energy) since 2003; Advisory Board Member, BT Americas (telecommunications) since 2004 to 2010. | | 28 RICs consisting of 84 Portfolios | | Alcatel-Lucent (telecommunications); Global Specialty Metallurgical; UPS Corporation (delivery service) |
Kenneth A. Froot 55 East 52nd Street New York, NY 10055 1957 | | Director | | Since 2007 | | Professor, Harvard University since 1992. | | 28 RICs consisting of 84 Portfolios | | None |
John F. O’Brien 55 East 52nd Street New York, NY 10055 1943 | | Director | | Since 2007 | | Chairman of the Corporation, Woods Hole Oceanographic Institute since 2009 and Trustee thereof from 2003 to 2009; Director, Ameresco, Inc. (energy solutions company) from 2006 to 2007. | | 28 RICs consisting of 84 Portfolios | | Cabot Corporation (chemicals); LKQ Corporation (auto parts manufacturing); TJX Companies, Inc. (retailer) |
Roberta Cooper Ramo 55 East 52nd Street New York, NY 10055 1942 | | Director | | Since 2007 | | Shareholder and attorney, Modrall, Sperling, Roehl, Harris & Sisk, P.A. (law firm) since 1993; Chairman of the Board, Cooper’s Inc., (retail) since 1999; Director, ECMC Group (service provider to students, schools and lenders) since 2001; President, The American Law Institute (non-profit) since 2008. | | 28 RICs consisting of 84 Portfolios | | None |
| | | | | | |
| 86 | | BLACKROCK BALANCED CAPITAL FUND, INC. | | SEPTEMBER 30, 2013 | | |
| | |
| Officers and Directors (continued) | | |
| | | | | | | | | | |
Name, Address, and Year of Birth | | Position(s) Held with
the Fund/
Master LLC | | Length of Time
Served as a Director2 | | Principal Occupation(s) During Past 5 Years | | Number of BlackRock-
Advised Registered
Investment Companies
(“RICs”) Consisting of
Investment Portfolios
(“Portfolios”) Overseen | | Public
Directorships |
| Independent Directors1 (concluded) |
David H. Walsh 55 East 52nd Street New York, NY 10055 1941 | | Director | | Since 2007 | | Director, National Museum of Wildlife Art since 2007; Trustee, University of Wyoming Foundation since from 2008 to 2012; Director, Ruckleshaus Institute and Haub School of Natural Resources at the University of Wyoming from 2006 to 2008; Director, The American Museum of Fly Fishing since 1997. | | 28 RICs consisting of 84 Portfolios | | None |
| | 1 Each Independent Director holds office until his or her successor is duly elected and qualifies or until his or her earlier death, resignation or removal as provided by the Fund/Master LLC’s by-laws or charter or statute. In no event may an Independent Director hold office beyond December 31 of the year in which he or she turns 74. 2 Date shown is the earliest date a person has served for the Fund/Master LLC covered by this annual report. Following the combination of Merrill Lynch Investment Managers, L.P. (“MLIM”) and BlackRock, Inc. (“BlackRock”) in September 2006, the various legacy MLIM and legacy BlackRock Fund boards were realigned and consolidated into three new fund boards in 2007. As a result, although the chart shows certain Directors as joining the Fund/Master LLC’s Board in 2007, those Directors first became members of the boards of other legacy MLIM or legacy BlackRock funds as follows: James H. Bodurtha, 1995; Bruce R. Bond, 2005; Donald W. Burton, 2002; Stuart E. Eizenstat, 2001; Kenneth A. Froot, 2005; Robert M. Hernandez, 1996; John F. O’Brien, 2004; Roberta Cooper Ramo, 2000; David H. Walsh, 2003; and Fred G. Weiss, 1998. |
| Interested Directors3 |
Paul L. Audet 55 East 52nd Street New York, NY 10055 1953 | | President and Director | | Since 2011 | | Senior Managing Director of BlackRock and Head of U.S. Mutual Funds since 2011; Chair of the U.S. Mutual Funds Committee reporting to the Global Executive Committee since 2011; Head of BlackRock’s Real Estate business from 2008 to 2011; Member of BlackRock’s Global Operating and Corporate Risk Management Committees and of the BlackRock Alternative Investors Executive Committee and Investment Committee for the Private Equity Fund of Funds business since 2008; Head of BlackRock’s Global Cash Management business from 2005 to 2010; Acting Chief Financial Officer of BlackRock from 2007 to 2008; Chief Financial Officer of BlackRock from 1998 to 2005. | | 155 RICs consisting of 283 Portfolios | | None |
Laurence D. Fink 55 East 52nd Street New York, NY 10055 1952 | | Director | | Since 2007 | | Chairman and Chief Executive Officer of BlackRock since its formation in 1998 and of BlackRock’s predecessor entities since 1988 and Chairman of the Executive and Management Committees; Formerly Managing Director, The First Boston Corporation, Member of its Management Committee, Co-head of its Taxable Fixed Income Division and Head of its Mortgage and Real Estate Products Group; Chairman of the Board of several of BlackRock’s alternative investment vehicles; Director of several of BlackRock’s offshore funds; Member of the Board of Trustees of New York University, Chair of the Financial Affairs Committee and a member of the Executive Committee, the Ad Hoc Committee on Board Governance, and the Committee on Trustees; Co-Chairman of the NYU Hospitals Center Board of Trustees, Chairman of the Development/Trustee Stewardship Committee and Chairman of the Finance Committee; Trustee, The Boys’ Club of New York. | | 28 RICs consisting of 84 Portfolios | | BlackRock |
Henry Gabbay 55 East 52nd Street New York, NY 10055 1947 | | Director | | Since 2007 | | Consultant, BlackRock from 2007 to 2008; Managing Director, BlackRock from 1989 to 2007; Chief Administrative Officer, BlackRock Advisors, LLC from 1998 to 2007; President of BlackRock Funds and BlackRock Bond Allocation Target Shares from 2005 to 2007 and Treasurer of certain closed-end funds in the BlackRock fund complex from 1989 to 2006. | | 155 RICs consisting of 283 Portfolios | | None |
| | 3 Messrs. Audet and Fink are both “interested persons,” as defined in the 1940 Act, of the Fund/Master LLC based on their positions with BlackRock and its affiliates. Mr. Gabbay is an “interested person” of the Fund/Master LLC based on his former positions with BlackRock and its affiliates as well as his ownership of BlackRock and The PNC Financial Services Group, Inc. securities. Mr. Audet and Mr. Gabbay are also Directors of the BlackRock registered closed-end funds and Directors of other BlackRock registered open-ended funds. Interested Directors serve until their resignation, removal or death, or until December 31 of the year in which they turn 72. |
| | | | | | |
| | | BLACKROCK BALANCED CAPITAL FUND, INC. | | SEPTEMBER 30, 2013 | | 87 |
| | |
| Officers and Directors (concluded) | | |
| | | | | | |
Name, Address, and Year of Birth | | Position(s) Held with the Fund/
Master LLC | | Length of Time Served | | Principal Occupation(s) During Past 5 Years |
| Officers1 | | | | | | |
John M. Perlowski 55 East 52nd Street New York, NY 10055 1964 | | President and Chief Executive Officer | | Since 2010 | | Managing Director of BlackRock since 2009; Global Head of BlackRock Fund Services since 2009; Managing Director and Chief Operating Officer of the Global Product Group at Goldman Sachs Asset Management, L.P. from 2003 to 2009; Treasurer of Goldman Sachs Mutual Funds from 2003 to 2009 and Senior Vice President thereof from 2007 to 2009; Director of Goldman Sachs Offshore Funds from 2002 to 2009; Director of Family Resources Network (charitable foundation) since 2009. |
Brendan Kyne 55 East 52nd Street New York, NY 10055 1977 | | Vice President | | Since 2009 | | Managing Director of BlackRock since 2010; Director of BlackRock from 2008 to 2009; Head of Product Development and Management for BlackRock’s U.S. Retail Group since 2009; and Co-head thereof from 2007 to 2009; Vice President of BlackRock from 2005 to 2008. |
Neal Andrews 55 East 52nd Street New York, NY 10055 1966 | | Chief Financial Officer | | Since 2007 | | Managing Director of BlackRock since 2006; Senior Vice President and Line of Business Head of Fund Accounting and Administration at PNC Global Investment Servicing (U.S.) Inc. from 1992 to 2006. |
Jay Fife 55 East 52nd Street New York, NY 10055 1970 | | Treasurer | | Since 2007 | | Managing Director of BlackRock since 2007; Director of BlackRock in 2006; Assistant Treasurer of the MLIM and Fund Asset Management, L.P. advised funds from 2005 to 2006; Director of MLIM Fund Services Group from 2001 to 2006. |
Brian Kindelan 55 East 52nd Street New York, NY 10055 1959 | | Chief Compliance Officer and Anti-Money Laundering Officer | | Since 2007 | | Chief Compliance Officer of the BlackRock-advised Funds since 2007; Managing Director and Senior Counsel of BlackRock since 2005. |
Benjamin Archibald 55 East 52nd Street New York, NY 10055 1975 | | Secretary | | Since 2012 | | Director of BlackRock since 2010; Assistant Secretary to the Funds from 2010 to 2012; General Counsel and Chief Operating Officer of Uhuru Capital Management from 2009 to 2010; Executive Director and Counsel of Goldman Sachs Asset Management from 2005 to 2009. |
| | 1 Officers of the Fund/Master LLC serve at the pleasure of the Board. |
| | | Further information about the Fund/Master LLC’s Officers and Directors is available in the Fund/Master LLC’s Statement of Additional Information, which can be obtained without charge by calling 1-800-441-7762. |
| | | | | | |
Investment Advisor BlackRock Advisors, LLC Wilmington, DE 19809 | | Independent Registered Public Accounting Firm Deloitte & Touche LLP Philadelphia, PA 19103 | | Custodian Bank of New York Mellon New York, NY 10286 | | Accounting Agent and Transfer Agent BNY Mellon Investment Servicing (US) Inc. Wilmington, DE 19809 |
| | | |
| | | |
| | | |
| | | |
| | | | | | |
Sub-Advisors BlackRock Financial Management, Inc. New York, NY 10055 | | Address of the Fund 100 Bellevue Parkway Wilmington, DE 19809 | | Distributor BlackRock Investments, LLC New York, NY 10022 | | Legal Counsel Willkie Farr & Gallagher LLP New York, NY 10019 |
| | | |
| | | |
| | | |
| | | | | | |
BlackRock International Limited Edinburgh, EH3 8JB United Kingdom | | | | | | |
| | | | | | |
| | | | | | |
| | | | | | |
BlackRock (Singapore) Limited 079912 Singapore | | | | | | |
| | | | | | |
| | | | | | |
| 88 | | BLACKROCK BALANCED CAPITAL FUND, INC. | | SEPTEMBER 30, 2013 | | |
Electronic Delivery
Electronic copies of most financial reports and prospectuses are available on the Fund’s website or shareholders can sign up for e-mail notifications of quarterly statements, annual and semi-annual reports and prospectuses by enrolling in the Fund’s electronic delivery program.
To enroll:
Shareholders Who Hold Accounts with Investment Advisors, Banks or Brokerages
Please contact your financial advisor. Please note that not all investment advisors, banks or brokerages may offer this service.
Shareholders Who Hold Accounts Directly With BlackRock
| 1) | Access the BlackRock website at http://www.blackrock.com/edelivery |
| 2) | Select “eDelivery” under the “More Information” section |
Householding
The Fund will mail only one copy of shareholder documents, including prospectuses, annual and semi-annual reports and proxy statements, to shareholders with multiple accounts at the same address. This practice is commonly called “householding” and is intended to reduce expenses and eliminate duplicate mailings of shareholder documents. Mailings of your shareholder documents may be householded indefinitely unless you instruct us otherwise. If you do not want the mailing of these documents to be combined with those for other members of your household, please call the Fund at (800) 441-7762.
Availability of Quarterly Portfolio Schedule
The Fund files its complete schedule of portfolio holdings with the SEC for the first and third quarters of each fiscal year on Form N-Q. The Fund’s Form N-Q is available on the SEC’s website at http:// www.sec.gov and may also be reviewed and copied at the SEC’s Public Reference Room in Washington, D.C. Information on the operation of the Public Reference Room may be obtained by calling (800) SEC-0330. The Fund’s Form N-Q may also be obtained upon request and without charge by calling (800) 441-7762.
Availability of Proxy Voting Policies and Procedures
A description of the policies and procedures that the Fund uses to determine how to vote proxies relating to portfolio securities is available (1) without charge, upon request, by calling (800) 441-7762; (2) at http://www.blackrock.com; and (3) on the SEC’s website at http://www.sec.gov.
Availability of Proxy Voting Record
Information about how the Fund voted proxies relating to securities held in the Fund’s portfolios during the most recent 12-month period ended June 30 is available upon request and without charge (1) at http:// www.blackrock.com or by calling (800) 441-7762 and (2) on the SEC’s website at http://www.sec.gov.
Account Information
Call us at (800) 441-7762 from 8:00 AM to 6:00 PM EST on any business day to get information about your account balances, recent transactions and share prices. You can also reach us on the Web at http://www.blackrock.com/funds.
Automatic Investment Plans
Investor Class shareholders who want to invest regularly can arrange to have $50 or more automatically deducted from their checking or savings account and invested in any of the BlackRock funds.
Systematic Withdrawal Plans
Investor Class shareholders can establish a systematic withdrawal plan and receive periodic payments of $50 or more from their BlackRock funds, as long as their account balance is at least $10,000.
Retirement Plans
Shareholders may make investments in conjunction with Traditional, Rollover, Roth, Coverdell, Simple IRAs, SEP IRAs and 403(b) Plans.
| | | | | | |
| | | BLACKROCK BALANCED CAPITAL FUND, INC. | | SEPTEMBER 30, 2013 | | 89 |
| | |
| Additional Information (concluded) | | |
|
| BlackRock Privacy Principles |
BlackRock is committed to maintaining the privacy of its current and former fund investors and individual clients (collectively, “Clients”) and to safeguarding their non-public personal information. The following information is provided to help you understand what personal information BlackRock collects, how we protect that information and why in certain cases we share such information with select parties.
If you are located in a jurisdiction where specific laws, rules or regulations require BlackRock to provide you with additional or different privacy-related rights beyond what is set forth below, then BlackRock will comply with those specific laws, rules or regulations.
BlackRock obtains or verifies personal non-public information from and about you from different sources, including the following: (i) information we receive from you or, if applicable, your financial intermediary, on applications, forms or other documents; (ii) information about your transactions with us, our affiliates, or others; (iii) information we receive from a consumer reporting agency; and (iv) from visits to our websites.
BlackRock does not sell or disclose to non-affiliated third parties any non-public personal information about its Clients, except as permitted by law or as is necessary to respond to regulatory requests or to service Client accounts. These non-affiliated third parties are required to protect the confidentiality and security of this information and to use it only for its intended purpose.
We may share information with our affiliates to service your account or to provide you with information about other BlackRock products or services that may be of interest to you. In addition, BlackRock restricts access to non-public personal information about its Clients to those BlackRock employees with a legitimate business need for the information. BlackRock maintains physical, electronic and procedural safeguards that are designed to protect the non-public personal information of its Clients, including procedures relating to the proper storage and disposal of such information.
| | | | | | |
| 90 | | BLACKROCK BALANCED CAPITAL FUND, INC. | | SEPTEMBER 30, 2013 | | |
| | |
| A World-Class Mutual Fund Family | | |
BlackRock offers a diverse lineup of open-end mutual funds crossing all investment styles and managed by experts in equity, fixed income and tax-exempt investing.
BlackRock ACWI ex-US Index Fund
BlackRock All-Cap Energy & Resources Portfolio
BlackRock Basic Value Fund
BlackRock Capital Appreciation Fund
BlackRock Commodity Strategies Fund
BlackRock Disciplined Small Cap Core Fund
BlackRock Emerging Markets Dividend Fund
BlackRock Emerging Markets Fund
BlackRock Emerging Markets Long/Short Equity Fund
BlackRock Energy & Resources Portfolio
BlackRock Equity Dividend Fund
BlackRock EuroFund
BlackRock Flexible Equity Fund
BlackRock Focus Growth Fund
BlackRock Global Dividend Portfolio
BlackRock Global Long/Short Equity Fund
BlackRock Global Opportunities Portfolio
BlackRock Global SmallCap Fund
BlackRock Health Sciences Opportunities Portfolio
BlackRock India Fund
BlackRock International Fund
BlackRock International Index Fund
BlackRock International Opportunities Portfolio
BlackRock Large Cap Core Fund
BlackRock Large Cap Core Plus Fund
BlackRock Large Cap Growth Fund
BlackRock Large Cap Value Fund
BlackRock Latin America Fund
BlackRock Long-Horizon Equity Fund
BlackRock Mid-Cap Growth Equity Portfolio
BlackRock Mid-Cap Value Opportunities Fund
BlackRock Natural Resources Trust
BlackRock Pacific Fund
BlackRock Real Estate Securities Fund
BlackRock Russell 1000 Index Fund
BlackRock Science & Technology Opportunities Portfolio
BlackRock Small Cap Growth Equity Portfolio
BlackRock Small Cap Growth Fund II
BlackRock Small Cap Index Fund
BlackRock S&P 500 Stock Fund
BlackRock U.S. Opportunities Portfolio
BlackRock Value Opportunities Fund
BlackRock World Gold Fund
| | | | | | | | |
| Taxable Fixed Income Funds | | | | |
BlackRock Bond Index Fund
BlackRock Core Bond Portfolio
BlackRock CoreAlpha Bond Fund
BlackRock Emerging Market Local Debt Portfolio
BlackRock Floating Rate Income Portfolio
BlackRock Global Long/Short Credit Fund
BlackRock GNMA Portfolio
BlackRock High Yield Bond Portfolio
BlackRock Inflation Protected Bond Portfolio
BlackRock International Bond Portfolio
BlackRock Investment Grade Bond Portfolio
BlackRock Low Duration Bond Portfolio
BlackRock Secured Credit Portfolio
BlackRock Short Obligations Fund
BlackRock Short-Term Treasury Fund
BlackRock Strategic Income Opportunities Portfolio
BlackRock Total Return Fund
BlackRock U.S. Government Bond Portfolio
BlackRock U.S. Mortgage Portfolio
BlackRock Ultra-Short Obligations Fund
BlackRock World Income Fund
| | | | | | | | |
| Municipal Fixed Income Funds | | | | |
BlackRock California Municipal Bond Fund
BlackRock High Yield Municipal Fund
BlackRock Intermediate Municipal Fund
BlackRock National Municipal Fund
BlackRock New Jersey Municipal Bond Fund
BlackRock New York Municipal Bond Fund
BlackRock Pennsylvania Municipal Bond Fund
BlackRock Short-Term Municipal Fund
| | | | | | | | | | | | | | | | |
| BlackRock Balanced Capital Fund | | LifePath Active Portfolios | | LifePath Index Portfolios |
| BlackRock Emerging Market Allocation Portfolio | | 2015 | | | | 2040 | | | | Retirement | | | | 2040 | | |
| BlackRock Global Allocation Fund | | 2020 | | | | 2045 | | | | 2020 | | | | 2045 | | |
| BlackRock Managed Volatility Portfolio | | 2025 | | | | 2050 | | | | 2025 | | | | 2050 | | |
| BlackRock Multi-Asset Income Portfolio | | 2030 | | | | 2055 | | | | 2030 | | | | 2055 | | |
| BlackRock Multi-Asset Real Return Fund | | 2035 | | | | | | | | 2035 | | | | | | |
| BlackRock Strategic Risk Allocation Fund | | | | | | | | | | | | | | | | |
| | | | | |
| BlackRock Prepared Portfolios | | LifePath Portfolios | | | | | | | | |
Conservative Prepared Portfolio | | Retirement | | | | 2040 | | | | | | | | | | |
Moderate Prepared Portfolio | | 2020 | | | | 2045 | | | | | | | | | | |
Growth Prepared Portfolio | | 2025 | | | | 2050 | | | | | | | | | | |
Aggressive Growth Prepared Portfolio | | 2030 | | | | 2055 | | | | | | | | | | |
| | 2035 | | | | | | | | | | | | | | |
BlackRock mutual funds are currently distributed by BlackRock Investments, LLC. You should consider the investment objectives, risks, charges and expenses of the funds under consideration carefully before investing. Each fund’s prospectus contains this and other information and is available at www.blackrock.com or by calling (800) 441-7762 or from your financial advisor. The prospectus should be read carefully before investing.
| | | | | | |
| | | BLACKROCK BALANCED CAPITAL FUND, INC. | | SEPTEMBER 30, 2013 | | 91 |
This report is transmitted to shareholders only. It is not authorized for use as an offer of sale or a solicitation of an offer to buy shares of a Fund unless accompanied or preceded by that Fund’s current prospectus. Past performance results shown in this report should not be considered a representation of future performance. Investment returns and principal value of shares will fluctuate so that shares, when redeemed, may be worth more or less than their original cost. Statements and other information herein are as dated and are subject to change.
Investment in foreign securities involves special risks including fluctuating foreign exchange rates, foreign government regulations, differing degrees of liquidity and the possibility of substantial volatility due to adverse political, economic or other developments.

| | |
| |
BC-9/13-AR | | 
|
| | |
| |
| Item 2 – | | Code of Ethics – Each registrant (or “Fund”) has adopted a code of ethics, as of the end of the period covered by this report, applicable to the registrant’s principal executive officer, principal financial officer, principal accounting officer or controller, or persons performing similar functions. During the period covered by this report, there have been no amendments to or waivers granted under the code of ethics. A copy of the code of ethics is available without charge at www.blackrock.com. |
| |
| Item 3 – | | Audit Committee Financial Expert – Each registrant’s board of directors (the “board of directors”), has determined that (i) the registrant has the following audit committee financial experts serving on its audit committee and (ii) each audit committee financial expert is independent: |
| | Robert M. Hernandez |
| | Fred G. Weiss |
| | Stuart E. Eizenstat |
| |
| | Under applicable securities laws, a person determined to be an audit committee financial expert will not be deemed an “expert” for any purpose, including without limitation for the purposes of Section 11 of the Securities Act of 1933, as a result of being designated or identified as an audit committee financial expert. The designation or identification of a person as an audit committee financial expert does not impose on such person any duties, obligations, or liabilities greater than the duties, obligations, and liabilities imposed on such person as a member of the audit committee and board of directors in the absence of such designation or identification. |
| |
| Item 4 – | | Principal Accountant Fees and Services |
| |
| | The following table presents fees billed by Deloitte & Touche LLP (“D&T”) in each of the last two fiscal years for the services rendered to the Funds: |
| | | | | | | | | | | | | | | | |
| | | (a) Audit Fees | | (b) Audit-Related Fees1 | | (c) Tax Fees2 | | (d) All Other Fees3 |
| Entity Name | | Current
Fiscal Year End | | Previous
Fiscal Year End | | Current
Fiscal Year End | | Previous
Fiscal Year End | | Current
Fiscal Year End | | Previous
Fiscal Year End | | Current
Fiscal Year End | | Previous
Fiscal Year End |
| BlackRock Balanced Capital Fund, Inc. | | $15,563 | | $15,300 | | $0 | | $2,500 | | $15,350 | | $14,850 | | $0 | | $0 |
| Master Large Cap Core Portfolio of Master Large Cap Series LLC | | $36,163 | | $35,900 | | $0 | | $2,500 | | $13,250 | | $13,250 | | $0 | | $0 |
| Master Total Return Portfolio of Master Bond LLC | | $80,263 | | $80,000 | | $0 | | $2,500 | | $13,500 | | $13,500 | | $0 | | $0 |
The following table presents fees billed by D&T that were required to be approved by each registrant’s audit committee (the “Committee”) for services that relate directly to the operations or financial reporting of the Funds and that are rendered on behalf of BlackRock Advisors, LLC (“Investment Adviser” or “BlackRock”) and entities controlling, controlled by, or under common control with BlackRock (not including any sub-adviser whose role is primarily portfolio management and is subcontracted with or overseen by another investment adviser) that provide ongoing services to the Funds (“Fund Service Providers”):
| | | | |
| | | Current Fiscal Year End | | Previous Fiscal Year End |
| (b) Audit-Related Fees1 | | $0 | | $0 |
| (c) Tax Fees2 | | $0 | | $0 |
| (d) All Other Fees3 | | $2,865,000 | | $2,970,000 |
1 The nature of the services includes assurance and related services reasonably related to the performance of the audit of financial statements not included in Audit Fees.
2 The nature of the services includes tax compliance, tax advice and tax planning.
3 Aggregate fees borne by BlackRock in connection with the review of compliance procedures and attestation thereto performed by D&T with respect to all of the registered closed-end funds and some of the registered open-end funds advised by BlackRock.
2
(e)(1) Audit Committee Pre-Approval Policies and Procedures:
The Committee has adopted policies and procedures with regard to the pre-approval of services. Audit, audit-related and tax compliance services provided to the registrants on an annual basis require specific pre-approval by the Committee. The Committee also must approve other non-audit services provided to the registrants and those non-audit services provided to the Investment Adviser and Fund Service Providers that relate directly to the operations and the financial reporting of the registrants. Certain of these non-audit services that the Committee believes are (a) consistent with the SEC’s auditor independence rules and (b) routine and recurring services that will not impair the independence of the independent accountants may be approved by the Committee without consideration on a specific case-by-case basis (“general pre-approval”). The term of any general pre-approval is 12 months from the date of the pre-approval, unless the Committee provides for a different period. Tax or other non-audit services provided to the registrants which have a direct impact on the operations or financial reporting of the registrants will only be deemed pre-approved provided that any individual project does not exceed $10,000 attributable to the registrants or $50,000 per project. For this purpose, multiple projects will be aggregated to determine if they exceed the previously mentioned cost levels.
Any proposed services exceeding the pre-approved cost levels will require specific pre-approval by the Committee, as will any other services not subject to general pre-approval (e.g., unanticipated but permissible services). The Committee is informed of each service approved subject to general pre-approval at the next regularly scheduled in-person board meeting. At this meeting, an analysis of such services is presented to the Committee for ratification. The Committee may delegate to the Committee Chairman the authority to approve the provision of and fees for any specific engagement of permitted non-audit services, including services exceeding pre-approved cost levels.
(e)(2) None of the services described in each of Items 4(b) through (d) were approved by the Committee pursuant to the de minimis exception in paragraph (c)(7)(i)(C) of Rule 2-01 of Regulation S-X.
(f) Not Applicable
(g) The aggregate non-audit fees paid to the accountant for services rendered by the accountant to the registrants, the Investment Adviser and the Fund Service Providers were:
| | | | |
| Entity Name | | Current Fiscal Year End | | Previous Fiscal Year End |
| BlackRock Balanced Capital Fund, Inc. | | $15,350 | | $17,350 |
| Master Large Cap Core Portfolio of Master Large Cap Series LLC | | $13,250 | | $15,750 |
| Master Total Return Portfolio of Master Bond LLC | | $13,500 | | $16,000 |
3
| | |
| | Additionally, SSAE 16 Review (Formerly, SAS No. 70) fees for the current and previous fiscal years of $2,865,000 and $2,970,000, respectively, were billed by D&T to the Investment Adviser. |
| |
| | (h) The Committee has considered and determined that the provision of non-audit services that were rendered to the Investment Adviser and the Fund Service Providers that were not pre-approved pursuant to paragraph (c)(7)(ii) of Rule 2-01 of Regulation S-X is compatible with maintaining the principal accountant’s independence. |
| |
| Item 5 – | | Audit Committee of Listed Registrants – Not Applicable |
| |
| Item 6 – | | Investments |
| | (a) The registrants’ Schedules of Investments are included as part of the Report to Stockholders filed under Item 1 of this Form. |
| | (b) Not Applicable due to no such divestments during the semi-annual period covered since the previous Form N-CSR filing. |
| |
| Item 7 – | | Disclosure of Proxy Voting Policies and Procedures for Closed-End Management Investment Companies – Not Applicable |
| |
| Item 8 – | | Portfolio Managers of Closed-End Management Investment Companies – Not Applicable |
| |
| Item 9 – | | Purchases of Equity Securities by Closed-End Management Investment Company and Affiliated Purchasers – Not Applicable |
| |
| Item 10 – | | Submission of Matters to a Vote of Security Holders – There have been no material changes to these procedures. |
| |
| Item 11 – | | Controls and Procedures |
| |
| | (a) The registrants’ principal executive and principal financial officers, or persons performing similar functions, have concluded that the registrants’ disclosure controls and procedures (as defined in Rule 30a-3(c) under the Investment Company Act of 1940, as amended (the “1940 Act”)) are effective as of a date within 90 days of the filing of this report based on the evaluation of these controls and procedures required by Rule 30a-3(b) under the 1940 Act and Rule 15d-15(b) under the Securities Exchange Act of 1934, as amended. |
| |
| | (b) There were no changes in the registrants’ internal control over financial reporting (as defined in Rule 30a-3(d) under the 1940 Act) that occurred during the second fiscal quarter of the period covered by this report that have materially affected, or are reasonably likely to materially affect, the registrants’ internal control over financial reporting. |
| |
| Item 12 – | | Exhibits attached hereto |
| |
| | (a)(1) Code of Ethics – See Item 2 |
| |
| | (a)(2) Certifications – Attached hereto |
| |
| | (a)(3) Not Applicable |
| |
| | (b) Certifications – Attached hereto |
4
Pursuant to the requirements of the Securities Exchange Act of 1934 and the Investment Company Act of 1940, each registrant has duly caused this report to be signed on its behalf by the undersigned, thereunto duly authorized.
BlackRock Balanced Capital Fund, Inc., Master Large Cap Core Portfolio of Master Large Cap Series LLC and Master Total Return Portfolio of Master Bond LLC
| | |
| By: | | /s/ John M. Perlowski |
| | John M. Perlowski Chief Executive Officer (principal executive officer) of |
BlackRock Balanced Capital Fund, Inc., Master Large Cap Core Portfolio of Master Large Cap Series LLC and Master Total Return Portfolio
of Master Bond LLC
Date: December 3, 2013
Pursuant to the requirements of the Securities Exchange Act of 1934 and the Investment Company Act of 1940, this report has been signed below by the following persons on behalf of each registrant and in the capacities and on the dates indicated.
| | |
| By: | | /s/ John M. Perlowski |
| | John M. Perlowski Chief Executive Officer (principal executive officer) of |
BlackRock Balanced Capital Fund, Inc., Master Large Cap Core Portfolio of Master Large Cap Series LLC and Master Total Return Portfolio
of Master Bond LLC
Date: December 3, 2013
| | |
| By: | | /s/ Neal J. Andrews |
| | Neal J. Andrews Chief Financial Officer (principal financial officer) of |
BlackRock Balanced Capital Fund, Inc., Master Large Cap Core Portfolio of Master Large Cap Series LLC and Master Total Return Portfolio
of Master Bond LLC
Date: December 3, 2013
5