UNITED STATES
SECURITIES AND EXCHANGE COMMISSION
Washington, D.C. 20549
FORM N-CSR
CERTIFIED SHAREHOLDER REPORT
OF REGISTERED MANAGEMENT INVESTMENT COMPANIES
Investment Company Act file number 811-09729
iShares Trust
(Exact name of registrant as specified in charter)
c/o: State Street Bank and Trust Company
One Congress Street, Suite 1Boston, MA 02114-2016
(Address of principal executive offices) (Zip code)
The Corporation Trust Company
1209 Orange Street, Wilmington, DE 19801
(Name and address of agent for service)
Registrant’s telephone number, including area code: (415) 670-2000
Date of fiscal year end: March 31, 2023
Date of reporting period: March 31, 2023
Item 1. Reports to Stockholders.
(a) The Report to Shareholders is attached herewith.
| MARCH 31, 2023 |

| 2023 Annual Report
| |
iShares Trust
· iShares Environmental Infrastructure and Industrials ETF | EFRA | NASDAQ
· iShares Global 100 ETF | IOO | NYSE Arca
· iShares Global Infrastructure ETF | IGF | NASDAQ
· iShares Global Timber & Forestry ETF | WOOD | NASDAQ
Dear Shareholder,
Significant economic headwinds emerged during the 12-month reporting period ended March 31, 2023, as investors navigated changing economic conditions and volatile markets. The U.S. economy shrank in the first half of 2022 before returning to modest growth in the second half of the year, marking a shift to a more challenging post-reopening economic environment. Changes in consumer spending patterns and a tight labor market led to elevated inflation, which reached a 40-year high before beginning to moderate.
Equity prices fell as interest rates rose, particularly during the first half of the reporting period. Both large-and small-capitalization U.S. stocks declined, although equities began to recover in the second half of the period as inflation eased and economic growth resumed. Emerging market stocks and international equities from developed markets declined overall, pressured by rising interest rates and volatile commodities prices.
The 10-year U.S. Treasury yield rose during the reporting period, driving its price down, as investors reacted to fluctuating inflation data and attempted to anticipate its impact on future interest rate changes. The corporate bond market also faced inflationary headwinds, and higher interest rates led to rising borrowing costs for corporate issuers.
The U.S. Federal Reserve (the “Fed”), acknowledging that inflation has been more persistent than expected, raised interest rates eight times. Furthermore, the Fed wound down its bond-buying programs and accelerated the reduction of its balance sheet.
Restricted labor supply kept inflation elevated even as other inflation drivers, such as goods prices and energy costs, moderated. While economic growth slowed in the last year, we believe that taming inflation requires a more substantial decline that lowers demand to a level more in line with the economy’s productive capacity. Although the Fed has decelerated the pace of interest rate hikes, we believe that it still seems determined to get inflation back to target. With this in mind, we believe the possibility of a U.S. recession in the near-term is high, but the dimming economic outlook has not yet been fully reflected in current market prices. We believe investors should expect a period of higher volatility as markets adjust to the new economic reality and policymakers attempt to adapt to rapidly changing conditions. Turmoil in the banking sector late in the period highlighted the potential for the knock-on effects of substantially higher interest rates to disrupt markets with little warning.
While we favor an overweight to equities in the long term, we prefer an underweight stance on equities overall in the near term. Expectations for corporate earnings remain elevated, which seems inconsistent with the possibility of a recession. Nevertheless, we are overweight on emerging market stocks as we believe a weakening U.S. dollar provides a supportive backdrop. We also see long-term opportunities in credit, where we believe that valuations are appealing and higher yields provide attractive income, although we are neutral on credit in the near term, as we’re concerned about tightening credit and financial conditions. However, we believe there are still some strong opportunities for a six- to twelve-month horizon, particularly short-term U.S. Treasuries, global inflation-linked bonds, and emerging market bonds denominated in local currency.
Overall, our view is that investors need to think globally, position themselves to be prepared for a decarbonizing economy, and be nimble as market conditions change. We encourage you to talk with your financial advisor and visit iShares.com for further insight about investing in today’s markets.

Rob Kapito
President, BlackRock, Inc.

Rob Kapito
President, BlackRock, Inc.
| Total Returns as of March 31, 2023 | ||||
| 6-Month | 12-Month | |||
U.S. large cap equities | 15.62% | (7.73)% | ||
U.S. small cap equities | 9.14 | (11.61) | ||
International equities | 27.27 | (1.38) | ||
Emerging market equities | 14.04 | (10.70) | ||
3-month Treasury bills | 1.93 | 2.52 | ||
U.S. Treasury securities | 4.38 | (6.90) | ||
U.S. investment grade bonds (Bloomberg U.S. Aggregate Bond Index) | 4.89 | (4.78) | ||
Tax-exempt municipal bonds (Bloomberg Municipal Bond Index) | 7.00 | 0.26 | ||
U.S. high yield bonds | 7.88 | (3.35) | ||
Past performance is not an indication of future results. Index performance is shown for illustrative purposes only. You cannot invest directly in an index. | ||||
| 2 | THIS PAGE IS NOT PART OF YOUR FUND REPORT |
| Page | ||
| 2 | ||
Annual Report: | ||
| 4 | ||
| 5 | ||
| 12 | ||
| 12 | ||
| 13 | ||
Financial Statements | ||
| 24 | ||
| 25 | ||
| 26 | ||
| 28 | ||
| 32 | ||
| 41 | ||
| 42 | ||
| 43 | ||
| 45 | ||
| 46 | ||
| 47 | ||
| 50 | ||
| 51 | ||
iShares Trust
Global Market Overview
Global equity markets declined during the 12 months ended March 31, 2023 (“reporting period”). The MSCI ACWI, a broad global equity index that includes both developed and emerging markets, returned -7.44% in U.S. dollar terms for the reporting period. In the first half of the reporting period, concerns about the state of the global economy in the face of high inflation and rapidly rising interest rates drove stocks sharply lower. However, stock prices recovered somewhat in the reporting period’s second half, as economic growth proved resilient despite its slower pace.
Inflation was a significant factor in equity markets, and while its impact varied by country, most major economies experienced substantial inflation during the reporting period. This drove a wave of monetary tightening by most of the world’s central banks, which sent interest rates and borrowing costs sharply higher. The U.S. Federal Reserve (“Fed”) raised interest rates eight times, driving an increase in the value of the U.S. dollar relative to most other currencies. Commodities prices were volatile, and as the reporting period began, disruptions in the wake of Russia’s invasion of Ukraine meant high prices for energy commodities and some foods. While oil, gas, and most other commodities declined as markets adjusted to the war’s disruption, elevated prices exacerbated inflationary pressure.
The U.S. economy recovered from a decline in the first half of 2022 to post modest growth in the third and fourth quarters of 2022. Consumers continued to power the economy with growing spending, despite higher prices for many consumer goods and services. The strong labor market supported spending as unemployment remained very low, at one point dropping to the lowest recorded level since 1969. Furthermore, the labor force participation rate—which measures the total proportion of employed persons of working age—rose, indicating that more people were being drawn into the labor force. Amid tightening labor supply, wages rose significantly, with the largest gains at the lower end of the wage spectrum.
In addition to its interest rate increases, the Fed also started to reduce the size of its balance sheet by reducing the store of U.S. Treasuries it had accumulated to stabilize markets in the early phases of the coronavirus pandemic. While the Fed indicated that more tightening could be needed to achieve its long-term inflation goal, it sounded a more cautious note about the potential for further interest rate increases near the end of the reporting period.
European stocks outpaced most other regions of the globe, advancing modestly for the reporting period despite slowing economic growth. European stocks benefited from a solid recovery following the early phases of the war in Ukraine. While the conflict disrupted critical natural gas supplies, new sources were secured and prices began to decline, while a warm winter helped moderate consumption. The European Central Bank (“ECB”) responded to the highest inflation since the introduction of the euro by raising interest rates six times.
While inflation was somewhat more moderate in the Asia-Pacific region, stocks there declined amid higher interest rates and disruption from coronavirus-related lockdowns in China. However, China relaxed its strict anti-coronavirus protocols in December 2022, boosting analysts’ expectations for future growth in the region. Emerging market stocks declined substantially, pressured by slowing economic growth and a stronger U.S. dollar. The Fed’s interest rate increases weighed on emerging market equities by making U.S. assets relatively more attractive.
| 4 | 2 0 2 3 I SHARES ANNUAL REPORT TO SHAREHOLDERS |
| Fund Summary as of March 31, 2023 | iShares® Environmental Infrastructure and Industrials ETF |
Investment Objective
The iShares Environmental Infrastructure and Industrials ETF (the “Fund”) seeks to track the investment results of an index composed of U.S. and non-U.S. companies that provide infrastructure and industrials solutions aiming to support energy efficiency and emissions mitigation, pollution reduction or land and resource optimization, as represented by the FTSE Green Revenues Select Infrastructure and Industrials Index (the “Index”). The Fund invests in a representative sample of securities included in the Index that collectively has an investment profile similar to the Index. Due to the use of representative sampling, the Fund may or may not hold all of the securities that are included in the Index.
Performance
| Cumulative Total Returns | ||||||||||||||||||||
Since Inception | ||||||||||||||||||||
Fund NAV | 9.76 | % | ||||||||||||||||||
Fund Market | 9.90 | |||||||||||||||||||
Index | 9.76 | |||||||||||||||||||
For the fiscal period ended March 31, 2023, the Fund did not have six months of performance and therefore line graphs are not presented.
The inception date of the Fund was November 1, 2022. The first day of secondary market trading was November 3, 2022.
Past performance is not an indication of future results. Performance results do not reflect the deduction of taxes that a shareholder would pay on fund distributions or on the redemption or sale of fund shares. See “About Fund Performance” for more information.
Expense Example
| Actual | Hypothetical 5% Return | |||||||||||||||||||||||||||
| | Beginning Account Value (11/01/22) | (a) | | Ending Account Value (03/31/23) | | | Expenses Paid During the Period | (b) | | Beginning Account Value (10/01/22) | | | Ending Account Value (03/31/23) | | | Expenses Paid During the Period | (b) | | Annualized Expense Ratio | | ||||||||
| $ 1,000.00 | $ 1,097.60 | $ 2.03 | $ 1,000.00 | $ 1,022.60 | $ 2.37 | 0.47 | % | |||||||||||||||||||||
| (a) | Commencement of operations. |
| (b) | Expenses are equal to the annualized expense ratio, multiplied by the average account value over the period, multiplied by 150/365 for actual expenses and 182/365 for hypothetical expenses (to reflect the six month period shown). Other fees, such as brokerage commissions and other fees to financial intermediaries, may be paid which are not reflected in the tables and examples above. See “Disclosure of Expenses” for more information. |
Portfolio Information
SECTOR ALLOCATION
| ||
| Sector | Percent of Total Investments(a) | |
Industrials | 53.8% | |
Utilities | 30.0 | |
Materials | 9.9 | |
Information Technology | 6.3 | |
TEN LARGEST HOLDINGS
| ||
| Security | Percent of Total Investments(a) | |
American Water Works Co. Inc. | 6.3% | |
Xylem Inc./NY | 6.1 | |
Veolia Environnement SA | 6.1 | |
Westinghouse Air Brake Technologies Corp. | 5.8 | |
Essential Utilities Inc. | 4.6 | |
Pentair PLC | 4.1 | |
United Utilities Group PLC | 4.1 | |
Shimadzu Corp. | 3.8 | |
Intertek Group PLC | 3.7 | |
Tetra Tech Inc. | 3.5 | |
| (a) | Excludes money market funds. |
F U N D S U M M A R Y | 5 |
| Fund Summary as of March 31, 2023 | iShares® Global 100 ETF |
Investment Objective
The iShares Global 100 ETF (the “Fund”) seeks to track the investment results of an index composed of 100 large-capitalization global equities, as represented by the S&P Global 100TM (the “Index”). The Fund invests in a representative sample of securities included in the Index that collectively has an investment profile similar to the Index. Due to the use of representative sampling, the Fund may or may not hold all of the securities that are included in the Index.
Performance
| Average Annual Total Returns | Cumulative Total Returns | |||||||||||||||||||||||||
| 1 Year | 5 Years | 10 Years | 1 Year | 5 Years | 10 Years | |||||||||||||||||||||
Fund NAV | (6.02 | )% | 11.14 | % | 10.12 | % | (6.02 | )% | 69.59 | % | 162.33 | % | ||||||||||||||
Fund Market | (6.11 | ) | 11.09 | 10.10 | (6.11 | ) | 69.16 | 161.84 | ||||||||||||||||||
Index | (6.33 | ) | 11.07 | 10.01 | (6.33 | ) | 69.02 | 159.68 | ||||||||||||||||||
GROWTH OF $10,000 INVESTMENT
(AT NET ASSET VALUE)
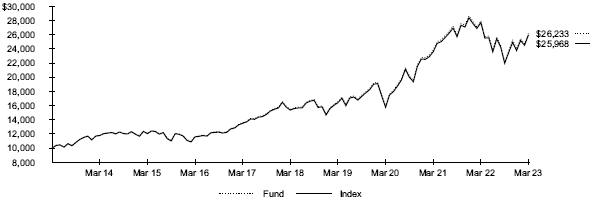
Index performance through January 30, 2013 is calculated using currency exchange (FX) rates corresponding to 5:15 P.M. ET. Index performance beginning on January 31, 2013 is calculated using FX rates corresponding to World Market Reuters 4:00 P.M. London.
Past performance is not an indication of future results. Performance results do not reflect the deduction of taxes that a shareholder would pay on fund distributions or on the redemption or sale of fund shares. See “About Fund Performance” for more information.
Expense Example
| Actual | Hypothetical 5% Return | |||||||||||||||||||||||||||
| | Beginning Account Value (10/01/22) | | | Ending Account Value (03/31/23) | | | Expenses Paid During the Period | (a) | | Beginning Account Value (10/01/22) | | | Ending Account Value (03/31/23) | | | Expenses Paid During the Period | (a) | | Annualized Expense Ratio |
| ||||||||
| $ 1,000.00 | $ 1,184.90 | $ 2.23 | $ 1,000.00 | $ 1,022.90 | $ 2.07 | 0.41 | % | |||||||||||||||||||||
| (a) | Expenses are equal to the annualized expense ratio, multiplied by the average account value over the period, multiplied by 182/365 (to reflect the one-half year period shown). Other fees, such as brokerage commissions and other fees to financial intermediaries, may be paid which are not reflected in the tables and examples above. See “Disclosure of Expenses” for more information. |
| 6 | 2 0 2 3 I SHARES ANNUAL REPORT TO SHAREHOLDERS |
| Fund Summary as of March 31, 2023 (continued) | iShares® Global 100 ETF |
Portfolio Management Commentary
Amid significant inflation and sharply higher interest rates, large-capitalization global stocks declined significantly for the reporting period. Stocks from the U.S., which represented approximately 73% of the Index on average, detracted the most from the Index’s return.
In the U.S., the consumer discretionary sector was the leading source of weakness. While consumer spending continued to grow, rising inflation drove up costs for companies, and consumers increasingly sought bargains as higher prices eroded personal spending power. Individual savings rates declined, while credit card debt and interest rates rose, further pressuring consumers. A tight labor market amid historically low unemployment also meant higher labor costs for the sector.
Within the sector, the internet and direct marketing retail industry was the largest detractor from the Index’s performance. The sharp rise in e-commerce that boosted the industry early in the pandemic waned as more workers returned to the office and brick-and-mortar retailers gained market share. Overbuilding of warehouses during the online shopping surge created excess capacity, which weighed on industry cash flow. Slowing revenue growth from data cloud services also pressured the industry’s profitability, as business customers tried to reduce expenditures amid economic uncertainty.
The communication services sector also declined, as the rising interest rate environment negatively impacted the interactive media and services industry, particularly high-valuation stocks with growth prospects. Demand for online advertisements slowed during the reporting period as businesses cut back on marketing expenditures in a more challenging economic environment. Heightened competition also worked against large companies in the industry, which lost market share to new players.
Swiss stocks also declined, led by the pharmaceuticals industry in the healthcare sector. Diminished demand for diagnostics products related to COVID-19 weighed on the industry. The Japanese consumer discretionary sector was another notable detractor, as the automobiles industry faced investor concerns about the pace of entry into the electric vehicle market.
On the upside, French stocks contributed modestly to the Index’s return. Increased sales of luxury goods buoyed the textiles, apparel, and luxury goods industry in the consumer discretionary sector.
Portfolio Information
SECTOR ALLOCATION
| ||
| Sector | Percent of Total Investments(a) | |
Information Technology | 30.8% | |
Health Care | 12.4 | |
Consumer Staples | 11.8 | |
Consumer Discretionary | 11.7 | |
Financials | 9.6 | |
Communication Services | 7.7 | |
Energy | 7.1 | |
Industrials | 5.5 | |
Materials | 2.1 | |
Other (each representing less than 1%) | 1.3 | |
GEOGRAPHIC ALLOCATION
| ||
| Country/Geographic Region | Percent of Total Investments(a) | |
United States | 72.0% | |
United Kingdom | 7.4 | |
Switzerland | 5.4 | |
France | 5.1 | |
Germany | 3.4 | |
Japan | 3.1 | |
South Korea | 1.5 | |
Australia | 0.9 | |
Spain | 0.9 | |
Netherlands | 0.3 | |
| (a) | Excludes money market funds. |
F U N D S U M M A R Y | 7 |
| Fund Summary as of March 31, 2023 | iShares® Global Infrastructure ETF |
Investment Objective
The iShares Global Infrastructure ETF (the “Fund”) seeks to track the investment results of an index composed of developed market equities in the infrastructure industry, as represented by the S&P Global Infrastructure IndexTM (the “Index”). The Fund invests in a representative sample of securities included in the Index that collectively has an investment profile similar to the Index. Due to the use of representative sampling, the Fund may or may not hold all of the securities that are included in the Index.
Performance
| Average Annual Total Returns | Cumulative Total Returns | |||||||||||||||||||||||||
| 1 Year | 5 Years | 10 Years | 1 Year | 5 Years | 10 Years | |||||||||||||||||||||
Fund NAV | (3.74 | )% | 5.15 | % | 5.63 | % | (3.74 | )% | 28.56 | % | 72.92 | % | ||||||||||||||
Fund Market | (3.83 | ) | 5.08 | 5.62 | (3.83 | ) | 28.12 | 72.78 | ||||||||||||||||||
Index | (4.25 | ) | 4.97 | 5.47 | (4.25 | ) | 27.46 | 70.35 | ||||||||||||||||||
GROWTH OF $10,000 INVESTMENT
(AT NET ASSET VALUE)
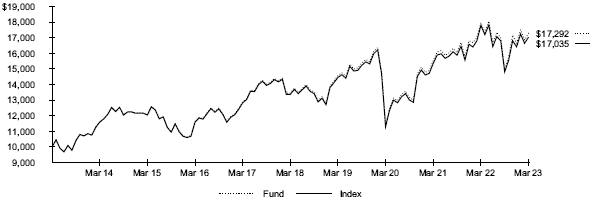
Past performance is not an indication of future results. Performance results do not reflect the deduction of taxes that a shareholder would pay on fund distributions or on the redemption or sale of fund shares. See “About Fund Performance” for more information.
Expense Example
| Actual | Hypothetical 5% Return | |||||||||||||||||||||||||||
| | Beginning Account Value (10/01/22) | | | Ending Account Value (03/31/23) | | | Expenses Paid During the Period | (a) | | Beginning Account Value (10/01/22) | | | Ending Account Value (03/31/23) | | | Expenses Paid During the Period | (a) | | Annualized Expense Ratio |
| ||||||||
| $ 1,000.00 | $ 1,155.20 | $ 2.26 | $ 1,000.00 | $ 1,022.80 | $ 2.12 | 0.42 | % | |||||||||||||||||||||
| (a) | Expenses are equal to the annualized expense ratio, multiplied by the average account value over the period, multiplied by 182/365 (to reflect the one-half year period shown). Other fees, such as brokerage commissions and other fees to financial intermediaries, may be paid which are not reflected in the tables and examples above. See “Disclosure of Expenses” for more information. |
| 8 | 2 0 2 3 I SHARES ANNUAL REPORT TO SHAREHOLDERS |
| Fund Summary as of March 31, 2023 (continued) | iShares® Global Infrastructure ETF |
Portfolio Management Commentary
Global infrastructure stocks declined for the reporting period amid slowing economic growth, high inflation, and concerns about the impact of rising interest rates. Early in the reporting period, high food and oil prices in the wake of Russia’s invasion of Ukraine weighed on infrastructure companies. However, China’s easing of its stringent Covid-19 pandemic restrictions and moderating inflation in the second half of the reporting period eased pressure on global infrastructure stocks.
Companies in the U.S. detracted the most from the Index’s return, particularly in the utilities sector. Increased costs of fuel, supply chain disruptions, and elevated inflation drove higher utility rates for customers and negatively impacted the industry’s finances. Supply-chain constraints and weather extremes also compromised the ability to provide reliable power generation and distribution. In addition, utilities faced difficulties rebuilding natural gas stockpiles amid strong demand as power plants transitioned away from burning coal, while a drought in the western U.S. limited hydropower generation in that region. Renewable energy providers faced similar supply-chain, fuel, and labor challenges that drove costs higher.
In Canada, energy infrastructure stocks detracted from the Index’s performance. The oil and gas storage and transportation industry faced disruption and expenses related to a large spill on a key North American crude oil pipeline and ensuing regulatory limits on the pipeline’s shipments. Concerns and legal battles persisted about the viability of another pipeline running from Canada into Michigan. Meanwhile, earnings declined for pipeline operators as rising interest rates led to higher financing costs in the capital-intensive business.
Conversely, stocks of airport services firms in Mexico contributed to the Index’s return. Many North American companies, responding to supply-chain difficulties that surfaced during the pandemic, returned more of their production base closer to home. Increased travel tied to that trend benefited the industry’s stocks. Overall, air travel in Mexico returned to pre-pandemic levels, and passenger traffic rose in the first 11 months of 2022 compared with the same time frame in 2019. The increase, in part, reflected relaxed U.S. border restrictions with Mexico beginning in late 2021.
Portfolio Information
INDUSTRY ALLOCATION
| ||
| Industry | Percent of Total Investments(a) | |
Electric Utilities | 25.6% | |
Airport Services | 23.3 | |
Oil & Gas Storage & Transportation | 20.2 | |
Highways & Railtracks | 12.0 | |
Multi-Utilities | 11.4 | |
Marine Ports & Services | 4.0 | |
Independent Power Producers & Energy Traders | 1.5 | |
Water Utilities | 1.4 | |
Other (each representing less than 1%) | 0.6 | |
GEOGRAPHIC ALLOCATION
| ||
| Country/Geographic Region | Percent of Total Investments(a) | |
United States | 39.7% | |
Canada | 9.5 | |
Australia | 8.8 | |
Spain | 8.1 | |
Mexico | 7.0 | |
France | 6.0 | |
China | 5.1 | |
New Zealand | 2.9 | |
Italy | 2.5 | |
United Kingdom | 2.2 | |
| (a) | Excludes money market funds. |
F U N D S U M M A R Y | 9 |
| Fund Summary as of March 31, 2023 | iShares® Global Timber & Forestry ETF |
Investment Objective
The iShares Global Timber & Forestry ETF (the “Fund”) seeks to track the investment results of an index composed of global equities in or related to the timber and forestry industry, as represented by the S&P Global Timber & Forestry IndexTM (the “Index”). The Fund invests in a representative sample of securities included in the Index that collectively has an investment profile similar to the Index. Due to the use of representative sampling, the Fund may or may not hold all of the securities that are included in the Index.
Performance
| Average Annual Total Returns | Cumulative Total Returns | |||||||||||||||||||||||||
| 1 Year | 5 Years | 10 Years | 1 Year | 5 Years | 10 Years | |||||||||||||||||||||
Fund NAV | (17.90 | )% | 0.12 | % | 5.55 | % | (17.90 | )% | 0.61 | % | 71.70 | % | ||||||||||||||
Fund Market | (18.26 | ) | 0.02 | 5.51 | (18.26 | ) | 0.12 | 70.92 | ||||||||||||||||||
Index | (18.58 | ) | (0.12 | ) | 5.35 | (18.58 | ) | (0.61 | ) | 68.44 | ||||||||||||||||
GROWTH OF $10,000 INVESTMENT
(AT NET ASSET VALUE)
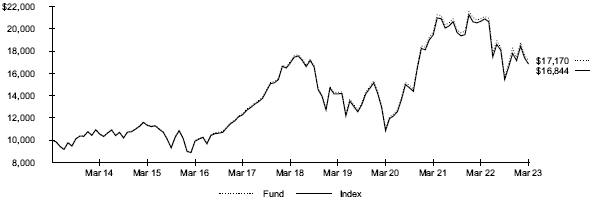
Past performance is not an indication of future results. Performance results do not reflect the deduction of taxes that a shareholder would pay on fund distributions or on the redemption or sale of fund shares. See “About Fund Performance” for more information.
Expense Example
| Actual | Hypothetical 5% Return | |||||||||||||||||||||||||||
| | Beginning Account Value (10/01/22) | | | Ending Account Value (03/31/23) | | | Expenses Paid During the Period | (a) | | Beginning Account Value (10/01/22) | | | Ending Account Value (03/31/23) | | | Expenses Paid During the Period | (a) | | Annualized Expense Ratio |
| ||||||||
| $ 1,000.00 | $ 1,097.00 | $ 2.25 | $ 1,000.00 | $ 1,022.80 | $ 2.17 | 0.43 | % | |||||||||||||||||||||
| (a) | Expenses are equal to the annualized expense ratio, multiplied by the average account value over the period, multiplied by 182/365 (to reflect the one-half year period shown). Other fees, such as brokerage commissions and other fees to financial intermediaries, may be paid which are not reflected in the tables and examples above. See “Disclosure of Expenses” for more information. |
| 10 | 2 0 2 3 I SHARES ANNUAL REPORT TO SHAREHOLDERS |
| Fund Summary as of March 31, 2023 (continued) | iShares® Global Timber & Forestry ETF |
Portfolio Management Commentary
Global timber and forestry stocks declined during the reporting period as rising interest rates weakened construction for new housing, sending lumber prices down sharply. Aggressive efforts by the Fed to slow inflation by raising interest rates forced mortgage rates above 7% for the first time in over two decades. Higher financing costs to purchase a home drove many prospective buyers out of the market, weakening construction of new housing and lumber prices. Construction for new housing trended lower throughout the reporting period, including five successive months of declining housing starts through January 2023. Lumber prices dropped more than 60% during the reporting period to the lowest levels since June 2020. An index of homebuilder confidence dropped in the first nine months of the reporting period to the lowest levels in more than a decade before rebounding during the first three months of 2023.
U.S.-based specialized real estate investment trusts (“REITs”) engaged in logging and forest management detracted the most from the Index’s return. Rising interest rates, which increase REITs’ financing costs while slowing growth, broadly weighed on REITs. Timber REITs are highly sensitive to the price of timber and prevailing homebuilding conditions, and the housing market slowdown and decreased sales of wood products weakened financial performance for the timber industry. Consequently, lumber REITs paid fewer dividends to shareholders.
Swedish stocks, particularly in the paper and forest products sector, also detracted from performance. Lower prices for solid wood products, increased raw material costs, and higher distribution expenses lowered profits.
Canadian stocks also detracted from the Index’s performance, led by paper and forest products companies that produce wood materials such as lumber, plywood, pulp, and newsprint. The fall in lumber prices led to sharply lower sales and profits. Insect infestations, forest fires, and the low availability of wood fiber led the Canadian companies to curtail operations at some of their pulp and paper plants.
Portfolio Information
INDUSTRY ALLOCATION
| ||
| Industry | Percent of Total Investments(a) | |
Paper Products | 39.1% | |
Paper & Plastic Packaging Products & Materials | 22.6 | |
Forest Products | 18.0 | |
Timber REITs | 17.0 | |
Homebuilding | 3.3 | |
GEOGRAPHIC ALLOCATION
| ||
| Country/Geographic Region | Percent of Total Investments(a) | |
United States | 30.5% | |
Sweden | 14.2 | |
Brazil | 11.0 | |
Canada | 10.0 | |
Japan | 9.7 | |
Finland | 9.4 | |
Ireland | 5.6 | |
United Kingdom | 3.9 | |
South Africa | 2.1 | |
China | 2.1 | |
| (a) | Excludes money market funds. |
F U N D S U M M A R Y | 11 |
Past performance is not an indication of future results. Financial markets have experienced extreme volatility and trading in many instruments has been disrupted. These circumstances may continue for an extended period of time and may continue to affect adversely the value and liquidity of each Fund’s investments. As a result, current performance may be lower or higher than the performance data quoted. Performance data current to the most recent month-end is available at iShares.com. Performance results assume reinvestment of all dividends and capital gain distributions and do not reflect the deduction of taxes that a shareholder would pay on fund distributions or on the redemption or sale of fund shares. The investment return and principal value of shares will vary with changes in market conditions. Shares may be worth more or less than their original cost when they are redeemed or sold in the market. Performance for certain funds may reflect a waiver of a portion of investment advisory fees. Without such a waiver, performance would have been lower.
Net asset value or “NAV” is the value of one share of a fund as calculated in accordance with the standard formula for valuing mutual fund shares. Beginning August 10, 2020, the price used to calculate market return (“Market Price”) is the closing price. Prior to August 10, 2020, Market Price was determined using the midpoint between the highest bid and the lowest ask on the primary stock exchange on which shares of a fund are listed for trading, as of the time that such fund’s NAV is calculated. Since shares of a fund may not trade in the secondary market until after the fund’s inception, for the period from inception to the first day of secondary market trading in shares of the fund, the NAV of the fund is used as a proxy for the Market Price to calculate market returns. Market and NAV returns assume that dividends and capital gain distributions have been reinvested at Market Price and NAV, respectively.
An index is a statistical composite that tracks a specified financial market or sector. Unlike a fund, an index does not actually hold a portfolio of securities and therefore does not incur the expenses incurred by a fund. These expenses negatively impact fund performance. Also, market returns do not include brokerage commissions that may be payable on secondary market transactions. If brokerage commissions were included, market returns would be lower.
Shareholders of each Fund may incur the following charges: (1) transactional expenses, including brokerage commissions on purchases and sales of fund shares and (2) ongoing expenses, including management fees and other fund expenses. The expense examples shown (which are based on a hypothetical investment of $1,000 invested at the beginning of the period and held through the end of the period) are intended to assist shareholders both in calculating expenses based on an investment in each Fund and in comparing these expenses with similar costs of investing in other funds.
The expense examples provide information about actual account values and actual expenses. Annualized expense ratios reflect contractual and voluntary fee waivers, if any. In order to estimate the expenses a shareholder paid during the period covered by this report, shareholders can divide their account value by $1,000 and then multiply the result by the number under the heading entitled “Expenses Paid During the Period.”
The expense examples also provide information about hypothetical account values and hypothetical expenses based on a fund’s actual expense ratio and an assumed rate of return of 5% per year before expenses. In order to assist shareholders in comparing the ongoing expenses of investing in the Funds and other funds, compare the 5% hypothetical examples with the 5% hypothetical examples that appear in the shareholder reports of the other funds.
The expenses shown in the expense examples are intended to highlight shareholders’ ongoing costs only and do not reflect any transactional expenses, such as brokerage commissions and other fees paid on purchases and sales of fund shares. Therefore, the hypothetical examples are useful in comparing ongoing expenses only and will not help shareholders determine the relative total expenses of owning different funds. If these transactional expenses were included, shareholder expenses would have been higher.
| 12 | 2 0 2 3 I SHARES ANNUAL REPORT TO SHAREHOLDERS |
March 31, 2023 | iShares® Environmental Infrastructure and Industrials ETF (Percentages shown are based on Net Assets) |
| Security | Shares | Value | ||||||
| ||||||||
Common Stocks | ||||||||
| Building Products — 5.8% | ||||||||
Advanced Drainage Systems Inc. | 1,236 | $ | 104,084 | |||||
China Lesso Group Holdings Ltd. | 18,000 | 16,083 | ||||||
Reliance Worldwide Corp. Ltd. | 15,692 | 39,031 | ||||||
TOTO Ltd. | 2,900 | 97,161 | ||||||
|
| |||||||
| 256,359 | ||||||||
| Chemicals — 3.2% | ||||||||
Umicore SA | 4,072 | 138,127 | ||||||
|
| |||||||
| Commercial Services & Supplies — 11.7% | ||||||||
Befesa SA(a) | 808 | 36,716 | ||||||
Beijing GeoEnviron Engineering & Technology Inc. | 2,400 | 3,559 | ||||||
Clean Harbors Inc.(b) | 1,012 | 144,271 | ||||||
Derichebourg SA | 1,836 | 10,783 | ||||||
Focused Photonics Hangzhou Inc.(b) | 800 | 3,083 | ||||||
Stericycle Inc.(b) | 1,828 | 79,719 | ||||||
Sunny Friend Environmental Technology Co. Ltd. | 1,000 | 5,432 | ||||||
Tetra Tech Inc. | 1,044 | 153,374 | ||||||
TOMRA Systems ASA | 4,652 | 78,537 | ||||||
|
| |||||||
| 515,474 | ||||||||
| Construction & Engineering — 4.1% | ||||||||
Stantec Inc. | 2,208 | 129,082 | ||||||
Sweco AB, Class B | 3,976 | 50,498 | ||||||
|
| |||||||
| 179,580 | ||||||||
| Containers & Packaging — 2.3% | ||||||||
DS Smith PLC | 25,384 | 98,828 | ||||||
|
| |||||||
| Electronic Equipment, Instruments & Components — 6.2% | ||||||||
Badger Meter Inc. | 576 | 70,168 | ||||||
Landis+Gyr Group AG | 484 | 37,252 | ||||||
Shimadzu Corp. | 5,300 | 166,381 | ||||||
|
| |||||||
| 273,801 | ||||||||
| Machinery — 27.0% | ||||||||
Construcciones y Auxiliar de Ferrocarriles SA | 372 | 10,333 | ||||||
Dawonsys Co. Ltd.(b) | 576 | 6,208 | ||||||
Evoqua Water Technologies Corp.(b) | 2,330 | 115,848 | ||||||
Franklin Electric Co. Inc. | 912 | 85,819 | ||||||
Lindsay Corp. | 216 | 32,644 | ||||||
METAWATER Co. Ltd. | 400 | 5,227 | ||||||
Mueller Water Products Inc., Class A | 3,084 | 42,991 | ||||||
NGK Insulators Ltd. | 5,000 | 66,303 | ||||||
Norma Group SE | 636 | 15,030 | ||||||
Organo Corp. | 500 | 13,668 | ||||||
| Security | Shares | Value | ||||||
| ||||||||
| Machinery (continued) | ||||||||
Pentair PLC | 3,272 | $ | 180,843 | |||||
Watts Water Technologies Inc., Class A | 540 | 90,893 | ||||||
Westinghouse Air Brake Technologies Corp. | 2,515 | 254,166 | ||||||
Xylem Inc./NY | 2,571 | 269,184 | ||||||
|
| |||||||
| 1,189,157 | ||||||||
| Metals & Mining — 4.5% | ||||||||
Asahi Holdings Inc. | 1,400 | 21,394 | ||||||
Dowa Holdings Co. Ltd. | 900 | 28,942 | ||||||
Sibanye Stillwater Ltd. | 55,672 | 114,953 | ||||||
Sims Ltd. | 3,204 | 33,412 | ||||||
|
| |||||||
| 198,701 | ||||||||
| Multi-Utilities — 7.0% | ||||||||
Qatar Electricity & Water Co. QSC | 9,044 | 41,561 | ||||||
Veolia Environnement SA | 8,660 | 267,223 | ||||||
|
| |||||||
| 308,784 | ||||||||
| Professional Services — 5.0% | ||||||||
Arcadis NV | 1,440 | 58,959 | ||||||
Intertek Group PLC | 3,208 | 160,672 | ||||||
|
| |||||||
| 219,631 | ||||||||
| Water Utilities — 22.9% | ||||||||
Aguas Andinas SA, Class A | 54,547 | 15,461 | ||||||
American States Water Co. | 728 | 64,712 | ||||||
American Water Works Co. Inc. | 1,896 | 277,745 | ||||||
Beijing Enterprises Water Group Ltd. | 80,000 | 19,990 | ||||||
California Water Service Group | 1,069 | 62,216 | ||||||
China Water Affairs Group Ltd. | 18,000 | 14,697 | ||||||
Cia. de Saneamento Basico do Estado de Sao Paulo | 6,744 | 67,341 | ||||||
Cia. de Saneamento de Minas Gerais-COPASA | 3,788 | 11,756 | ||||||
Essential Utilities Inc. | 4,588 | 200,266 | ||||||
Penno Group PLC | 5,176 | 55,926 | ||||||
SJW Group | 536 | 40,806 | ||||||
United Utilities Group PLC | 13,619 | 178,238 | ||||||
|
| |||||||
| 1,009,154 | ||||||||
Total Investments — 99.7% | 4,387,596 | |||||||
Other Assets Less Liabilities — 0.3% | 14,607 | |||||||
|
| |||||||
Net Assets — 100.0% | $ | 4,402,203 | ||||||
|
| |||||||
| (a) | Security exempt from registration pursuant to Rule 144A under the Securities Act of 1933, as amended. These securities may be resold in transactions exempt from registration to qualified institutional investors. |
| (b) | Non-income producing security. |
Affiliates
Investments in issuers considered to be affiliate(s) of the Fund during the period ended March 31, 2023 for purposes of Section 2(a)(3) of the Investment Company Act of 1940, as amended, were as follows:
| ||||||||||||||||||||||||||||||||||||
| Affiliated Issuer | Value at 11/01/22(a) | Purchases at Cost | Proceeds from Sale | Net Realized Gain (Loss) | Change in Unrealized Appreciation (Depreciation) | Value at 03/31/23 | Shares Held at 03/31/23 | Income | Capital Gain Distributions from Underlying Funds | |||||||||||||||||||||||||||
| ||||||||||||||||||||||||||||||||||||
BlackRock Cash Funds: Institutional, SL Agency Shares(b) | $ | — | $ 2 | (c) | $ | — | $ | (2 | ) | $ | — | $ | — | — | $ | 6 | (d) | $ | — | |||||||||||||||||
BlackRock Cash Funds: Treasury, SL Agency Shares(b) | — | 0 | (c) | — | — | — | — | — | 22 | — | ||||||||||||||||||||||||||
|
|
|
|
|
|
|
|
|
| |||||||||||||||||||||||||||
| $ | (2 | ) | $ | — | $ | — | $ | 28 | $ | — | ||||||||||||||||||||||||||
|
|
|
|
|
|
|
|
|
| |||||||||||||||||||||||||||
| (a) | Commencement of operations. |
SCHEDULE OF INVESTMENTS | 13 |
Schedule of Investments (continued) March 31, 2023 | iShares® Environmental Infrastructure and Industrials ETF |
Affiliates (continued)
| (b) | As of period end, the entity is no longer held. |
| (c) | Represents net amount purchased (sold). |
| (d) | All or a portion represents securities lending income earned from the reinvestment of cash collateral from loaned securities, net of fees and collateral investment expenses, and other payments to and from borrowers of securities. |
Derivative Financial Instruments Outstanding as of Period End
Futures Contracts
| ||||||||||||||||
| Description | Number of Contracts | Expiration Date | Notional Amount (000) | Value/ Unrealized Appreciation (Depreciation) | ||||||||||||
| ||||||||||||||||
Long Contracts | ||||||||||||||||
Micro E-Mini Russell 2000 Index | 1 | 06/16/23 | $ | 9 | $ | 345 | ||||||||||
|
| |||||||||||||||
Derivative Financial Instruments Categorized by Risk Exposure
As of period end, the fair values of derivative financial instruments located in the Statements of Assets and Liabilities were as follows:
| ||||||||||||||||||||||||||||
Commodity Contracts | Credit Contracts | Equity Contracts | Foreign Currency Exchange Contracts | Interest Rate Contracts | Other Contracts | Total | ||||||||||||||||||||||
| ||||||||||||||||||||||||||||
Assets — Derivative Financial Instruments | ||||||||||||||||||||||||||||
Futures contracts | ||||||||||||||||||||||||||||
Unrealized appreciation on futures contracts(a) | $ | — | $ | — | $ | 345 | $ | — | $ | — | $ | — | $ | 345 | ||||||||||||||
|
|
|
|
|
|
|
|
|
|
|
|
|
| |||||||||||||||
| (a) | Net cumulative unrealized appreciation (depreciation) on futures contracts are reported in the Schedule of Investments. In the Statements of Assets and Liabilities, only current day’s variation margin is reported in receivables or payables and the net cumulative unrealized appreciation (depreciation) is included in accumulated earnings (loss). |
For the period ended March 31, 2023, the effect of derivative financial instruments in the Statements of Operations was as follows:
| ||||||||||||||||||||||||||||
Commodity Contracts | Credit Contracts | Equity Contracts | Foreign Currency Exchange Contracts | Interest Rate Contracts | Other Contracts | Total | ||||||||||||||||||||||
| ||||||||||||||||||||||||||||
Net Realized Gain (Loss) from | ||||||||||||||||||||||||||||
Futures contracts | $ | — | $ | — | $ | 646 | $ | — | $ | — | $ | — | $ | 646 | ||||||||||||||
|
|
|
|
|
|
|
|
|
|
|
|
|
| |||||||||||||||
Net Change in Unrealized Appreciation (Depreciation) on | ||||||||||||||||||||||||||||
Futures contracts | $ | — | $ | — | $ | 345 | $ | — | $ | — | $ | — | $ | 345 | ||||||||||||||
|
|
|
|
|
|
|
|
|
|
|
|
|
| |||||||||||||||
Average Quarterly Balances of Outstanding Derivative Financial Instruments
| ||||
Futures contracts | ||||
Average notional value of contracts — long | $ | 8,961 | ||
| ||||
For more information about the Fund’s investment risks regarding derivative financial instruments, refer to the Notes to Financial Statements.
Fair Value Hierarchy as of Period End
Various inputs are used in determining the fair value of financial instruments. For a description of the input levels and information about the Fund’s policy regarding valuation of financial instruments, refer to the Notes to Financial Statements.
The following table summarizes the Fund’s financial instruments categorized in the fair value hierarchy. The breakdown of the Fund’s financial instruments into major categories is disclosed in the Schedule of Investments above.
| ||||||||||||||||
| Level 1 | Level 2 | Level 3 | Total | |||||||||||||
| ||||||||||||||||
Assets | ||||||||||||||||
Investments | ||||||||||||||||
Long-Term Investments | ||||||||||||||||
Common Stocks | $ | 2,538,033 | $ | 1,849,563 | $ | — | $ | 4,387,596 | ||||||||
|
|
|
|
|
|
|
| |||||||||
| 14 | 2 0 2 3 I SHARES ANNUAL REPORT TO SHAREHOLDERS |
Schedule of Investments (continued) March 31, 2023 | iShares® Environmental Infrastructure and Industrials ETF |
Fair Value Hierarchy as of Period End (continued)
| ||||||||||||||||
| Level 1 | Level 2 | Level 3 | Total | |||||||||||||
| ||||||||||||||||
Derivative Financial Instruments(a) | ||||||||||||||||
Assets | ||||||||||||||||
Equity Contracts | $ | 345 | $ | — | $ | — | $ | 345 | ||||||||
|
|
|
|
|
|
|
| |||||||||
| (a) | Derivative financial instruments are futures contracts. Futures contracts are valued at the unrealized appreciation (depreciation) on the instrument. |
See notes to financial statements.
SCHEDULE OF INVESTMENTS | 15 |
Schedule of Investments March 31, 2023 | iShares® Global 100 ETF (Percentages shown are based on Net Assets) |
| Security | Shares | Value | ||||||
| ||||||||
Common Stocks | ||||||||
| Australia — 0.9% | ||||||||
BHP Group Ltd. | 1,052,462 | $ | 33,272,459 | |||||
|
| |||||||
| France — 5.1% | ||||||||
AXA SA | 415,308 | 12,674,191 | ||||||
Cie. de Saint-Gobain | 107,411 | 6,105,624 | ||||||
Engie SA | 387,360 | 6,129,851 | ||||||
L’Oreal SA | 52,260 | 23,351,996 | ||||||
LVMH Moet Hennessy Louis Vuitton SE | 54,215 | 49,764,399 | ||||||
Orange SA | 394,109 | 4,682,083 | ||||||
Sanofi | 238,884 | 25,913,830 | ||||||
Schneider Electric SE | 119,015 | 19,890,236 | ||||||
Societe Generale SA | 156,158 | 3,518,450 | ||||||
TotalEnergies SE | 486,328 | 28,675,684 | ||||||
Vivendi SE | 169,754 | 1,716,476 | ||||||
|
| |||||||
| 182,422,820 | ||||||||
| Germany — 3.4% | ||||||||
Allianz SE, Registered | 83,791 | 19,341,983 | ||||||
BASF SE | 191,442 | 10,050,447 | ||||||
Bayer AG, Registered | 204,197 | 13,044,432 | ||||||
Deutsche Bank AG, Registered | 426,026 | 4,332,342 | ||||||
Deutsche Telekom AG, Registered | 727,093 | 17,619,131 | ||||||
E.ON SE | 470,552 | 5,870,003 | ||||||
Mercedes-Benz Group AG | 162,685 | 12,510,925 | ||||||
Muenchener Rueckversicherungs-Gesellschaft AG in Muenchen, Registered | 29,255 | 10,228,585 | ||||||
RWE AG | 140,624 | 6,050,819 | ||||||
Siemens AG, Registered | 155,610 | 25,209,426 | ||||||
|
| |||||||
| 124,258,093 | ||||||||
| Japan — 3.1% | ||||||||
Bridgestone Corp. | 127,600 | 5,183,457 | ||||||
Canon Inc. | 216,850 | 4,829,218 | ||||||
Honda Motor Co. Ltd. | 352,900 | 9,334,616 | ||||||
Mitsubishi UFJ Financial Group Inc. | 2,538,800 | 16,270,326 | ||||||
Nissan Motor Co. Ltd. | 505,400 | 1,912,730 | ||||||
Panasonic Holdings Corp. | 480,400 | 4,298,192 | ||||||
Seven & i Holdings Co. Ltd. | 166,120 | 7,504,322 | ||||||
Sony Group Corp. | 262,800 | 23,936,713 | ||||||
Toyota Motor Corp. | 2,613,400 | 37,202,790 | ||||||
|
| |||||||
| 110,472,364 | ||||||||
| Netherlands — 0.3% | ||||||||
ING Groep NV | 779,524 | 9,257,108 | ||||||
Koninklijke Philips NV | 187,492 | 3,443,643 | ||||||
|
| |||||||
| 12,700,751 | ||||||||
| South Korea — 1.5% | ||||||||
Samsung Electronics Co. Ltd. | 1,068,725 | 52,849,474 | ||||||
|
| |||||||
| Spain — 0.9% | ||||||||
Banco Bilbao Vizcaya Argentaria SA | 1,256,640 | 8,984,170 | ||||||
Banco Santander SA | 3,478,456 | 12,962,395 | ||||||
Repsol SA | 275,776 | 4,240,845 | ||||||
Telefonica SA | 1,190,813 | 5,128,608 | ||||||
|
| |||||||
| 31,316,018 | ||||||||
| Switzerland — 5.4% | ||||||||
ABB Ltd., Registered | 356,484 | 12,263,585 | ||||||
Credit Suisse Group AG, Registered(a) | 789,904 | 709,353 | ||||||
Nestle SA, Registered | 572,170 | 69,764,976 | ||||||
Novartis AG, Registered | 499,391 | 45,853,341 | ||||||
Roche Holding AG, Bearer | 5,654 | 1,698,974 | ||||||
| Security | Shares | Value | ||||||
| ||||||||
| Switzerland (continued) | ||||||||
Roche Holding AG, NVS | 145,963 | $ | 41,707,827 | |||||
Swiss Re AG | 60,122 | 6,176,540 | ||||||
UBS Group AG, Registered | 732,779 | 15,506,182 | ||||||
|
| |||||||
| 193,680,778 | ||||||||
| United Kingdom — 7.4% | ||||||||
Anglo American PLC | 278,738 | 9,271,241 | ||||||
AstraZeneca PLC | 322,643 | 44,703,565 | ||||||
Aviva PLC | 592,256 | 2,958,398 | ||||||
Barclays PLC | 3,186,327 | 5,735,083 | ||||||
BP PLC | 3,798,138 | 24,006,202 | ||||||
Diageo PLC | 485,333 | 21,660,229 | ||||||
GSK PLC | 833,593 | 14,729,015 | ||||||
HSBC Holdings PLC | 4,148,500 | 28,195,257 | ||||||
National Grid PLC | 801,635 | 10,843,715 | ||||||
Prudential PLC | 567,528 | 7,770,381 | ||||||
Rio Tinto PLC | 221,350 | 15,024,772 | ||||||
Shell PLC | 1,480,866 | 42,202,564 | ||||||
Standard Chartered PLC | 502,407 | 3,807,774 | ||||||
Unilever PLC | 546,245 | 28,305,866 | ||||||
Vodafone Group PLC | 5,559,648 | 6,132,830 | ||||||
|
| |||||||
| 265,346,892 | ||||||||
| United States — 71.7% | ||||||||
3M Co. | 114,001 | 11,982,645 | ||||||
Abbott Laboratories | 362,240 | 36,680,422 | ||||||
Alphabet Inc., Class A(b) | 1,239,020 | 128,523,545 | ||||||
Alphabet Inc., Class C, NVS(b) | 1,080,119 | 112,332,376 | ||||||
Amazon.com Inc.(b) | 1,854,602 | 191,561,841 | ||||||
American Tower Corp. | 96,733 | 19,766,421 | ||||||
Aon PLC, Class A | 42,673 | 13,454,370 | ||||||
Apple Inc. | 3,093,937 | 510,190,211 | ||||||
Bristol-Myers Squibb Co. | 442,303 | 30,656,021 | ||||||
Caterpillar Inc. | 108,134 | 24,745,385 | ||||||
Chevron Corp. | 370,073 | 60,381,111 | ||||||
Citigroup Inc. | 402,396 | 18,868,348 | ||||||
Coca-Cola Co. (The) | 808,605 | 50,157,768 | ||||||
Colgate-Palmolive Co. | 173,914 | 13,069,637 | ||||||
DuPont de Nemours Inc. | 95,179 | 6,830,997 | ||||||
Emerson Electric Co. | 118,713 | 10,344,651 | ||||||
Exxon Mobil Corp. | 856,663 | 93,941,665 | ||||||
Ford Motor Co. | 816,909 | 10,293,053 | ||||||
General Electric Co. | 227,070 | 21,707,892 | ||||||
Goldman Sachs Group Inc. (The) | 70,548 | 23,076,956 | ||||||
Honeywell International Inc. | 139,387 | 26,639,643 | ||||||
HP Inc. | 179,562 | 5,270,145 | ||||||
Intel Corp. | 859,492 | 28,079,604 | ||||||
International Business Machines Corp. | 188,061 | 24,652,917 | ||||||
Johnson & Johnson | 543,888 | 84,302,640 | ||||||
Johnson Controls International PLC | 142,720 | 8,594,598 | ||||||
JPMorgan Chase & Co. | 610,191 | 79,513,989 | ||||||
Kimberly-Clark Corp. | 69,827 | 9,372,180 | ||||||
Marsh & McLennan Companies Inc. | 102,855 | 17,130,500 | ||||||
McDonald’s Corp. | 152,167 | 42,547,415 | ||||||
Merck & Co. Inc. | 527,683 | 56,140,194 | ||||||
Microsoft Corp. | 1,548,526 | 446,440,046 | ||||||
Morgan Stanley | 271,435 | 23,831,993 | ||||||
Nike Inc., Class B | 260,184 | 31,908,966 | ||||||
PepsiCo Inc. | 286,692 | 52,263,952 | ||||||
Pfizer Inc. | 1,168,695 | 47,682,756 | ||||||
Philip Morris International Inc. | 322,095 | 31,323,739 | ||||||
Procter & Gamble Co. (The) | 490,812 | 72,978,836 | ||||||
| 16 | 2 0 2 3 I SHARES ANNUAL REPORT TO SHAREHOLDERS |
Schedule of Investments (continued) March 31, 2023 | iShares® Global 100 ETF (Percentages shown are based on Net Assets) |
| Security | Shares | Value | ||||||
| ||||||||
| United States (continued) | ||||||||
Raytheon Technologies Corp. | 305,086 | $ | 29,877,072 | |||||
Texas Instruments Inc. | 188,517 | 35,066,047 | ||||||
Walmart Inc. | 291,974 | 43,051,566 | ||||||
|
| |||||||
| 2,585,234,113 | ||||||||
|
| |||||||
Total Long-Term Investments — 99.7% | 3,591,553,762 | |||||||
|
| |||||||
Short-Term Securities | ||||||||
| Money Market Funds — 0.1% | ||||||||
BlackRock Cash Funds: Institutional, SL Agency Shares, 5.01%(c)(d)(e) | 607,063 | 607,245 | ||||||
BlackRock Cash Funds: Treasury, SL Agency Shares, 4.73%(c)(d) | 3,900,000 | 3,900,000 | ||||||
|
| |||||||
Total Short-Term Securities — 0.1% | 4,507,245 | |||||||
|
| |||||||
Total Investments — 99.8% | 3,596,061,007 | |||||||
Other Assets Less Liabilities — 0.2% | 8,092,062 | |||||||
|
| |||||||
Net Assets — 100.0% | $ | 3,604,153,069 | ||||||
|
| |||||||
| (a) | All or a portion of this security is on loan. |
| (b) | Non-income producing security. |
| (c) | Affiliate of the Fund. |
| (d) | Annualized 7-day yield as of period end. |
| (e) | All or a portion of this security was purchased with the cash collateral from loaned securities. |
Affiliates
Investments in issuers considered to be affiliate(s) of the Fund during the year ended March 31, 2023 for purposes of Section 2(a)(3) of the Investment Company Act of 1940, as amended, were as follows:
| ||||||||||||||||||||||||||||||||||||
| Affiliated Issuer | Value at 03/31/22 | Purchases at Cost | Proceeds from Sale | Net Realized Gain (Loss) | Change in Unrealized Appreciation (Depreciation) | Value at 03/31/23 | Shares Held at 03/31/23 | Income | Capital Gain Distributions from Underlying Funds | |||||||||||||||||||||||||||
| ||||||||||||||||||||||||||||||||||||
BlackRock Cash Funds: Institutional, SL Agency Shares | $ | — | $608,357 | (a) | $ | — | $ | (1,049 | ) | $ | (63 | ) | $ | 607,245 | 607,063 | $ | 46,637 | (b) | $ | — | ||||||||||||||||
BlackRock Cash Funds: Treasury, SL Agency Shares | 8,396,000 | — | (4,496,000 | )(a) | — | — | 3,900,000 | 3,900,000 | 146,039 | 3 | ||||||||||||||||||||||||||
|
|
|
|
|
|
|
|
|
| |||||||||||||||||||||||||||
| $ | (1,049 | ) | $ | (63 | ) | $ | 4,507,245 | $ | 192,676 | $ | 3 | |||||||||||||||||||||||||
|
|
|
|
|
|
|
|
|
| |||||||||||||||||||||||||||
| (a) | Represents net amount purchased (sold). |
| (b) | All or a portion represents securities lending income earned from the reinvestment of cash collateral from loaned securities, net of fees and collateral investment expenses, and other payments to and from borrowers of securities. |
Derivative Financial Instruments Outstanding as of Period End
Futures Contracts
| ||||||||||||||||
| Description | Number of Contracts | Expiration Date | Notional Amount (000) | Value/ Unrealized Appreciation (Depreciation) | ||||||||||||
| ||||||||||||||||
Long Contracts | ||||||||||||||||
Euro STOXX 50 Index | 25 | 06/16/23 | $ | 1,157 | $ | 55,884 | ||||||||||
FTSE 100 Index | 17 | 06/16/23 | 1,605 | 8,366 | ||||||||||||
S&P 500 E-Mini Index | 38 | 06/16/23 | 7,862 | 426,458 | ||||||||||||
|
| |||||||||||||||
| $ | 490,708 | |||||||||||||||
|
| |||||||||||||||
SCHEDULE OF INVESTMENTS | 17 |
Schedule of Investments (continued) March 31, 2023 | iShares® Global 100 ETF |
Derivative Financial Instruments Categorized by Risk Exposure
As of period end, the fair values of derivative financial instruments located in the Statements of Assets and Liabilities were as follows:
| ||||||||||||||||||||||||||||
Commodity Contracts | Credit Contracts | Equity Contracts | Foreign Currency Exchange Contracts | Interest Rate Contracts | Other Contracts | Total | ||||||||||||||||||||||
| ||||||||||||||||||||||||||||
Assets — Derivative Financial Instruments | ||||||||||||||||||||||||||||
Futures contracts | ||||||||||||||||||||||||||||
Unrealized appreciation on futures contracts(a) | $ | — | $ | — | $ | 490,708 | $ | — | $ | — | $ | — | $ | 490,708 | ||||||||||||||
|
|
|
|
|
|
|
|
|
|
|
|
|
| |||||||||||||||
| (a) | Net cumulative unrealized appreciation (depreciation) on futures contracts are reported in the Schedule of Investments. In the Statements of Assets and Liabilities, only current day’s variation margin is reported in receivables or payables and the net cumulative unrealized appreciation (depreciation) is included in accumulated earnings (loss). |
For the period ended March 31, 2023, the effect of derivative financial instruments in the Statements of Operations was as follows:
| ||||||||||||||||||||||||||||
Commodity Contracts | Credit Contracts | Equity Contracts | Foreign Currency Exchange Contracts | Interest Rate Contracts | Other Contracts | Total | ||||||||||||||||||||||
| ||||||||||||||||||||||||||||
Net Realized Gain (Loss) from | ||||||||||||||||||||||||||||
Futures contracts | $ | — | $ | — | $ | (1,647,999 | ) | $ | — | $ | — | $ | — | $ | (1,647,999 | ) | ||||||||||||
|
|
|
|
|
|
|
|
|
|
|
|
|
| |||||||||||||||
Net Change in Unrealized Appreciation (Depreciation) on | ||||||||||||||||||||||||||||
Futures contracts | $ | — | $ | — | $ | (502,842 | ) | $ | — | $ | — | $ | — | $ | (502,842 | ) | ||||||||||||
|
|
|
|
|
|
|
|
|
|
|
|
|
| |||||||||||||||
Average Quarterly Balances of Outstanding Derivative Financial Instruments
| ||||
Futures contracts | ||||
Average notional value of contracts — long | $ | 8,725,620 | ||
| ||||
For more information about the Fund’s investment risks regarding derivative financial instruments, refer to the Notes to Financial Statements.
Fair Value Hierarchy as of Period End
Various inputs are used in determining the fair value of financial instruments. For a description of the input levels and information about the Fund’s policy regarding valuation of financial instruments, refer to the Notes to Financial Statements.
The following table summarizes the Fund’s financial instruments categorized in the fair value hierarchy. The breakdown of the Fund’s financial instruments into major categories is disclosed in the Schedule of Investments above.
| ||||||||||||||||
| Level 1 | Level 2 | Level 3 | Total | |||||||||||||
| ||||||||||||||||
Assets | ||||||||||||||||
Investments | ||||||||||||||||
Long-Term Investments | ||||||||||||||||
Common Stocks | $ | 2,585,234,113 | $ | 1,006,319,649 | $ | — | $ | 3,591,553,762 | ||||||||
Short-Term Securities | ||||||||||||||||
Money Market Funds | 4,507,245 | — | — | 4,507,245 | ||||||||||||
|
|
|
|
|
|
|
| |||||||||
| $ | 2,589,741,358 | $ | 1,006,319,649 | $ | — | $ | 3,596,061,007 | |||||||||
|
|
|
|
|
|
|
| |||||||||
Derivative Financial Instruments(a) | ||||||||||||||||
Assets | ||||||||||||||||
Equity Contracts | $ | 426,458 | $ | 64,250 | $ | — | $ | 490,708 | ||||||||
|
|
|
|
|
|
|
| |||||||||
| (a) | Derivative financial instruments are futures contracts. Futures contracts are valued at the unrealized appreciation (depreciation) on the instrument. |
See notes to financial statements.
| 18 | 2 0 2 3 I SHARES ANNUAL REPORT TO SHAREHOLDERS |
Schedule of Investments March 31, 2023 | iShares® Global Infrastructure ETF (Percentages shown are based on Net Assets) |
| Security | Shares | Value | ||||||
| ||||||||
Common Stocks | ||||||||
| Argentina — 0.1% | ||||||||
Corp. America Airports SA(a) | 489,781 | $ | 4,985,971 | |||||
|
| |||||||
| Australia — 8.7% | ||||||||
Atlas Arteria Ltd. | 20,316,342 | 85,775,249 | ||||||
Dalrymple Bay Infrastructure Ltd. | 4,214,945 | 7,550,847 | ||||||
Qube Holdings Ltd. | 29,436,144 | 56,840,522 | ||||||
Transurban Group | 19,372,023 | 184,971,471 | ||||||
|
| |||||||
| 335,138,089 | ||||||||
| Belgium — 0.2% | ||||||||
Euronav NV | 364,480 | 6,090,940 | ||||||
|
| |||||||
| Brazil — 0.5% | ||||||||
Centrais Eletricas Brasileiras SA, ADR | 2,028,059 | 13,446,031 | ||||||
Cia. de Saneamento Basico do Estado de Sao Paulo, ADR | 540,204 | 5,407,442 | ||||||
|
| |||||||
| 18,853,473 | ||||||||
| Canada — 9.4% | ||||||||
Enbridge Inc. | 5,006,474 | 190,886,870 | ||||||
Gibson Energy Inc. | 345,641 | 5,524,118 | ||||||
Keyera Corp. | 566,568 | 12,404,549 | ||||||
Pembina Pipeline Corp. | 1,363,712 | 44,175,591 | ||||||
TC Energy Corp. | 2,516,630 | 97,890,669 | ||||||
Westshore Terminals Investment Corp. | 607,487 | 12,154,235 | ||||||
|
| |||||||
| 363,036,032 | ||||||||
| China — 5.1% | ||||||||
Beijing Capital International Airport Co. Ltd., Class H(a)(b) | 27,884,000 | 20,536,235 | ||||||
CGN Power Co. Ltd., Class H(c) | 17,893,000 | 4,285,257 | ||||||
China Gas Holdings Ltd. | 4,730,400 | 6,660,095 | ||||||
China Longyuan Power Group Corp. Ltd., Class H | 5,286,000 | 6,030,340 | ||||||
China Merchants Port Holdings Co. Ltd. | 22,692,000 | 34,836,566 | ||||||
China Resources Gas Group Ltd. | 1,427,300 | 5,250,192 | ||||||
China Resources Power Holdings Co. Ltd. | 2,898,000 | 6,183,158 | ||||||
COSCO SHIPPING Ports Ltd.(b) | 28,678,000 | 19,176,324 | ||||||
Guangdong Investment Ltd.(b) | 4,562,000 | 4,666,805 | ||||||
Hainan Meilan International Airport Co. Ltd., Class H(a) | 2,981,000 | 7,241,613 | ||||||
Jiangsu Expressway Co. Ltd., Class H | 20,372,000 | 18,945,345 | ||||||
Kunlun Energy Co. Ltd. | 6,318,000 | 4,932,643 | ||||||
Shenzhen Expressway Co. Ltd., Class H | 10,218,000 | 9,078,133 | ||||||
Shenzhen International Holdings Ltd. | 23,087,500 | 20,428,089 | ||||||
Yuexiu Transport Infrastructure Ltd. | 15,620,000 | 8,283,157 | ||||||
Zhejiang Expressway Co. Ltd., Class H | 22,708,000 | 18,066,515 | ||||||
|
| |||||||
| 194,600,467 | ||||||||
| France — 6.0% | ||||||||
Aeroports de Paris(a) | 461,924 | 65,945,057 | ||||||
Engie SA | 2,966,503 | 46,887,068 | ||||||
Gaztransport Et Technigaz SA | 54,087 | 5,534,578 | ||||||
Getlink SE | 6,693,204 | 110,234,497 | ||||||
|
| |||||||
| 228,601,200 | ||||||||
| Germany — 2.0% | ||||||||
Fraport AG Frankfurt Airport Services Worldwide(a) | 616,602 | 31,082,795 | ||||||
RWE AG | 1,083,851 | 46,636,322 | ||||||
|
| |||||||
| 77,719,117 | ||||||||
| Italy — 2.4% | ||||||||
Enav SpA(c) | 4,244,636 | 17,765,277 | ||||||
Enel SpA | 12,384,376 | 75,531,647 | ||||||
|
| |||||||
| 93,296,924 | ||||||||
| Security | Shares | Value | ||||||
| ||||||||
| Japan — 2.0% | ||||||||
Japan Airport Terminal Co. Ltd.(a)(b) | 1,552,800 | $ | 77,566,656 | |||||
|
| |||||||
| Mexico — 6.9% | ||||||||
Grupo Aeroportuario del Centro Norte SAB de CV, ADR(b) | 567,370 | 50,785,289 | ||||||
Grupo Aeroportuario del Pacifico SAB de CV, ADR | 603,758 | 117,799,223 | ||||||
Grupo Aeroportuario del Sureste SAB de CV, ADR | 314,062 | 96,250,581 | ||||||
|
| |||||||
| 264,835,093 | ||||||||
| New Zealand — 2.9% | ||||||||
Auckland International Airport Ltd.(a) | 20,133,178 | 109,564,395 | ||||||
|
| |||||||
| Norway — 0.1% | ||||||||
Frontline PLC, NVS | 330,254 | 5,400,876 | ||||||
|
| |||||||
| Singapore — 1.4% | ||||||||
Hutchison Port Holdings Trust, Class U(b) | 84,226,700 | 15,775,829 | ||||||
SATS Ltd.(a)(b) | 14,601,118 | 30,728,046 | ||||||
SIA Engineering Co. Ltd.(a)(b) | 4,301,900 | 7,291,239 | ||||||
|
| |||||||
| 53,795,114 | ||||||||
| South Korea — 0.2% | ||||||||
Sebang Co. Ltd. | 186,697 | 6,596,814 | ||||||
|
| |||||||
| Spain — 8.0% | ||||||||
Aena SME SA(a)(c) | 1,172,082 | 189,535,352 | ||||||
Iberdrola SA | 9,402,376 | 117,132,899 | ||||||
|
| |||||||
| 306,668,251 | ||||||||
| Switzerland — 1.5% | ||||||||
Flughafen Zurich AG, Registered(a) | 317,327 | 58,139,332 | ||||||
|
| |||||||
| United Kingdom — 2.2% | ||||||||
National Grid PLC | 6,212,929 | 84,042,274 | ||||||
|
| |||||||
| United States — 39.3% | ||||||||
American Electric Power Co. Inc. | 823,625 | 74,941,639 | ||||||
American Water Works Co. Inc. | 309,289 | 45,307,746 | ||||||
Cheniere Energy Inc. | 614,796 | 96,891,850 | ||||||
Consolidated Edison Inc. | 568,777 | 54,414,896 | ||||||
Dominion Energy Inc. | 1,335,579 | 74,672,222 | ||||||
DTE Midstream LLC(a) | 239,212 | 11,809,896 | ||||||
Duke Energy Corp. | 1,234,162 | 119,059,608 | ||||||
Edison International | 612,072 | 43,206,162 | ||||||
Equitrans Midstream Corp. | 1,093,075 | 6,317,973 | ||||||
Eversource Energy | 558,269 | 43,690,132 | ||||||
Exelon Corp. | 1,592,777 | 66,721,429 | ||||||
Kinder Morgan Inc. | 4,891,096 | 85,643,091 | ||||||
NextEra Energy Inc. | 2,482,613 | 191,359,810 | ||||||
ONEOK Inc. | 1,105,069 | 70,216,084 | ||||||
PG&E Corp.(a) | 2,580,579 | 41,727,962 | ||||||
Public Service Enterprise Group Inc. | 799,721 | 49,942,576 | ||||||
Sempra Energy | 503,815 | 76,156,675 | ||||||
Southern Co. (The) | 1,744,933 | 121,412,438 | ||||||
Targa Resources Corp. | 559,700 | 40,830,115 | ||||||
WEC Energy Group Inc. | 505,582 | 47,924,118 | ||||||
Williams Companies Inc. (The) | 3,011,438 | 89,921,539 | ||||||
Xcel Energy Inc. | 877,133 | 59,153,850 | ||||||
|
| |||||||
| 1,511,321,811 | ||||||||
|
| |||||||
Total Common Stocks — 98.9% | 3,800,252,829 | |||||||
|
| |||||||
SCHEDULE OF INVESTMENTS | 19 |
Schedule of Investments (continued) March 31, 2023 | iShares® Global Infrastructure ETF (Percentages shown are based on Net Assets) |
| Security | Shares | Value | ||||||
| ||||||||
Preferred Stocks | ||||||||
| Brazil — 0.1% | ||||||||
Cia. Energetica de Minas Gerais, Preference Shares, ADR | 2,316,505 | $ | 5,188,971 | |||||
|
| |||||||
Total Preferred Stocks — 0.1% | 5,188,971 | |||||||
|
| |||||||
Total Long-Term Investments — 99.0% | 3,805,441,800 | |||||||
|
| |||||||
Short-Term Securities | ||||||||
| Money Market Funds — 0.7% | ||||||||
BlackRock Cash Funds: Institutional, SL Agency Shares, 5.01%(d)(e)(f) | 8,021,129 | 8,023,535 | ||||||
BlackRock Cash Funds: Treasury, SL Agency Shares, 4.73%(d)(e) | 16,620,000 | 16,620,000 | ||||||
|
| |||||||
Total Short-Term Securities — 0.7% | 24,643,535 | |||||||
|
| |||||||
Total Investments — 99.7% | 3,830,085,335 | |||||||
Other Assets Less Liabilities — 0.3% | 13,348,655 | |||||||
|
| |||||||
Net Assets — 100.0% | $ | 3,843,433,990 | ||||||
|
| |||||||
| (a) | Non-income producing security. |
| (b) | All or a portion of this security is on loan. |
| (c) | Security exempt from registration pursuant to Rule 144A under the Securities Act of 1933, as amended. These securities may be resold in transactions exempt from registration to qualified institutional investors. |
| (d) | Affiliate of the Fund. |
| (e) | Annualized 7-day yield as of period end. |
| (f) | All or a portion of this security was purchased with the cash collateral from loaned securities. |
Affiliates
Investments in issuers considered to be affiliate(s) of the Fund during the year ended March 31, 2023 for purposes of Section 2(a)(3) of the Investment Company Act of 1940, as amended, were as follows:
| ||||||||||||||||||||||||||||||||||||
| Affiliated Issuer | Value at 03/31/22 | Purchases at Cost | Proceeds from Sale | Net Realized Gain (Loss) | Change in Unrealized Appreciation (Depreciation) | Value at 03/31/23 | Shares Held at 03/31/23 | Income | Capital Gain Distributions from Underlying Funds | |||||||||||||||||||||||||||
| ||||||||||||||||||||||||||||||||||||
BlackRock Cash Funds: Institutional, SL Agency Shares | $ | 1,940,677 | $ | 6,086,396 | (a) | $ | — | $ | (5,398 | ) | $ | 1,860 | $ | 8,023,535 | 8,021,129 | $ | 307,537 | (b) | $ | — | ||||||||||||||||
BlackRock Cash Funds: Treasury, SL Agency Shares | 6,110,000 | 10,510,000 | (a) | — | — | — | 16,620,000 | 16,620,000 | 122,877 | 4 | ||||||||||||||||||||||||||
|
|
|
|
|
|
|
|
|
| |||||||||||||||||||||||||||
| $ | (5,398 | ) | $ | 1,860 | $ | 24,643,535 | $ | 430,414 | $ | 4 | ||||||||||||||||||||||||||
|
|
|
|
|
|
|
|
|
| |||||||||||||||||||||||||||
| (a) | Represents net amount purchased (sold). |
| (b) | All or a portion represents securities lending income earned from the reinvestment of cash collateral from loaned securities, net of fees and collateral investment expenses, and other payments to and from borrowers of securities. |
Derivative Financial Instruments Outstanding as of Period End
Futures Contracts
| ||||||||||||||||
| Description | Number of Contracts | Expiration Date | Notional Amount (000) | Value/ Unrealized Appreciation (Depreciation) | ||||||||||||
| ||||||||||||||||
Long Contracts | ||||||||||||||||
IBEX 35 Index | 81 | 04/21/23 | $ | 8,090 | $ | 249,877 | ||||||||||
S&P/TSX 60 Index | 80 | 06/15/23 | 14,315 | 292,902 | ||||||||||||
SPI 200 Index | 88 | 06/15/23 | 10,621 | 224,331 | ||||||||||||
Dow Jones U.S. Real Estate Index | 162 | 06/16/23 | 5,367 | 255,169 | ||||||||||||
|
| |||||||||||||||
| $ | 1,022,279 | |||||||||||||||
|
| |||||||||||||||
| 20 | 2 0 2 3 I SHARES ANNUAL REPORT TO SHAREHOLDERS |
Schedule of Investments (continued) March 31, 2023 | iShares® Global Infrastructure ETF |
Derivative Financial Instruments Categorized by Risk Exposure
As of period end, the fair values of derivative financial instruments located in the Statements of Assets and Liabilities were as follows:
| ||||||||||||||||||||||||||||
Commodity Contracts | Credit Contracts | Equity Contracts | Foreign Currency Exchange Contracts | Interest Rate Contracts | Other Contracts | Total | ||||||||||||||||||||||
| ||||||||||||||||||||||||||||
Assets — Derivative Financial Instruments | ||||||||||||||||||||||||||||
Futures contracts | ||||||||||||||||||||||||||||
Unrealized appreciation on futures contracts(a) | $ | — | $ | — | $ | 1,022,279 | $ | — | $ | — | $ | — | $ | 1,022,279 | ||||||||||||||
|
|
|
|
|
|
|
|
|
|
|
|
|
| |||||||||||||||
| (a) | Net cumulative unrealized appreciation (depreciation) on futures contracts are reported in the Schedule of Investments. In the Statements of Assets and Liabilities, only current day’s variation margin is reported in receivables or payables and the net cumulative unrealized appreciation (depreciation) is included in accumulated earnings (loss). |
For the period ended March 31, 2023, the effect of derivative financial instruments in the Statements of Operations was as follows:
| ||||||||||||||||||||||||||||
Commodity Contracts | Credit Contracts | Equity Contracts | Foreign Currency Exchange Contracts | Interest Rate Contracts | Other Contracts | Total | ||||||||||||||||||||||
| ||||||||||||||||||||||||||||
Net Realized Gain (Loss) from | ||||||||||||||||||||||||||||
Futures contracts | $ | — | $ | — | $ | (2,315,530 | ) | $ | — | $ | — | $ | — | $ | (2,315,530 | ) | ||||||||||||
|
|
|
|
|
|
|
|
|
|
|
|
|
| |||||||||||||||
Net Change in Unrealized Appreciation (Depreciation) on | ||||||||||||||||||||||||||||
Futures contracts | $ | — | $ | — | $ | 847,114 | $ | — | $ | — | $ | — | $ | 847,114 | ||||||||||||||
|
|
|
|
|
|
|
|
|
|
|
|
|
| |||||||||||||||
Average Quarterly Balances of Outstanding Derivative Financial Instruments
| ||||
Futures contracts | ||||
Average notional value of contracts — long | $ | 22,189,912 | ||
| ||||
For more information about the Fund’s investment risks regarding derivative financial instruments, refer to the Notes to Financial Statements.
Fair Value Hierarchy as of Period End
Various inputs are used in determining the fair value of financial instruments. For a description of the input levels and information about the Fund’s policy regarding valuation of financial instruments, refer to the Notes to Financial Statements.
The following table summarizes the Fund’s financial instruments categorized in the fair value hierarchy. The breakdown of the Fund’s financial instruments into major categories is disclosed in the Schedule of Investments above.
| ||||||||||||||||
| Level 1 | Level 2 | Level 3 | Total | |||||||||||||
| ||||||||||||||||
Assets | ||||||||||||||||
Investments | ||||||||||||||||
Long-Term Investments | ||||||||||||||||
Common Stocks | $ | 2,175,984,103 | $ | 1,624,268,726 | $ | — | $ | 3,800,252,829 | ||||||||
Preferred Stocks | 5,188,971 | — | — | 5,188,971 | ||||||||||||
Short-Term Securities | ||||||||||||||||
Money Market Funds | 24,643,535 | — | — | 24,643,535 | ||||||||||||
|
|
|
|
|
|
|
| |||||||||
| $ | 2,205,816,609 | $ | 1,624,268,726 | $ | — | $ | 3,830,085,335 | |||||||||
|
|
|
|
|
|
|
| |||||||||
Derivative Financial Instruments(a) | ||||||||||||||||
Assets | ||||||||||||||||
Equity Contracts | $ | 548,071 | $ | 474,208 | $ | — | $ | 1,022,279 | ||||||||
|
|
|
|
|
|
|
| |||||||||
| (a) | Derivative financial instruments are futures contracts. Futures contracts are valued at the unrealized appreciation (depreciation) on the instrument. |
See notes to financial statements.
SCHEDULE OF INVESTMENTS | 21 |
Schedule of Investments March 31, 2023 | iShares® Global Timber & Forestry ETF (Percentages shown are based on Net Assets) |
| Security | Shares | Value | ||||||
| ||||||||
Common Stocks | ||||||||
| Brazil — 10.9% | ||||||||
Dexco SA | 800,162 | $ | 928,282 | |||||
Klabin SA | 2,580,978 | 9,211,868 | ||||||
Suzano SA | 1,442,804 | 11,842,012 | ||||||
|
| |||||||
| 21,982,162 | �� | |||||||
| Canada — 9.9% | ||||||||
Canfor Corp.(a) | 269,669 | 4,333,859 | ||||||
Interfor Corp.(a) | 200,044 | 3,259,319 | ||||||
Stella-Jones Inc. | 92,390 | 3,540,420 | ||||||
West Fraser Timber Co. Ltd. | 124,008 | 8,845,262 | ||||||
|
| |||||||
| 19,978,860 | ||||||||
| China — 2.0% | ||||||||
Nine Dragons Paper Holdings Ltd.(b) | 5,493,000 | 4,112,439 | ||||||
|
| |||||||
| Finland — 9.3% | ||||||||
Stora Enso OYJ, Class R | 846,647 | 11,014,770 | ||||||
UPM-Kymmene OYJ | 230,553 | 7,743,806 | ||||||
|
| |||||||
| 18,758,576 | ||||||||
| Ireland — 5.5% | ||||||||
Smurfit Kappa Group PLC | 307,783 | 11,163,312 | ||||||
|
| |||||||
| Japan — 9.6% | ||||||||
Daio Paper Corp. | 315,900 | 2,470,574 | ||||||
Nippon Paper Industries Co. Ltd.(a) | 358,900 | 2,772,579 | ||||||
Oji Holdings Corp. | 1,951,900 | 7,728,267 | ||||||
Sumitomo Forestry Co. Ltd. | 327,400 | 6,503,929 | ||||||
|
| |||||||
| 19,475,349 | ||||||||
| Portugal — 1.5% | ||||||||
Altri SGPS SA(b) | 296,899 | 1,528,885 | ||||||
Navigator Co. SA (The) | 393,397 | 1,406,394 | ||||||
|
| |||||||
| 2,935,279 | ||||||||
| South Africa — 2.1% | ||||||||
Sappi Ltd. | 1,652,358 | 4,251,307 | ||||||
|
| |||||||
| Sweden — 14.1% | ||||||||
Billerud AB | 428,918 | 4,408,496 | ||||||
Holmen AB, Class B | 229,798 | 8,859,228 | ||||||
Svenska Cellulosa AB SCA, Class B | 1,154,188 | 15,201,273 | ||||||
|
| |||||||
| 28,468,997 | ||||||||
| Security | Shares | Value | ||||||
| ||||||||
| United Kingdom — 3.8% | ||||||||
Mondi PLC | 490,506 | $ | 7,787,766 | |||||
|
| |||||||
| United States — 30.2% | ||||||||
Clearwater Paper Corp.(a) | 36,985 | 1,236,039 | ||||||
International Paper Co. | 341,437 | 12,312,218 | ||||||
Mercer International Inc. | 124,988 | 1,221,758 | ||||||
PotlatchDeltic Corp. | 185,572 | 9,185,814 | ||||||
Rayonier Inc. | 277,264 | 9,221,801 | ||||||
Sylvamo Corp. | 92,087 | 4,259,944 | ||||||
Westrock Co. | 267,202 | 8,141,645 | ||||||
Weyerhaeuser Co. | 515,853 | 15,542,651 | ||||||
|
| |||||||
| 61,121,870 | ||||||||
|
| |||||||
Total Long-Term Investments — 98.9% | 200,035,917 | |||||||
|
| |||||||
Short-Term Securities | ||||||||
Money Market Funds — 0.4% | ||||||||
BlackRock Cash Funds: Institutional, SL Agency Shares, 5.01%(c)(d)(e) | 666,360 | 666,559 | ||||||
BlackRock Cash Funds: Treasury, SL Agency Shares, 4.73%(c)(d) | 260,000 | 260,000 | ||||||
|
| |||||||
Total Short-Term Securities — 0.4% | 926,559 | |||||||
|
| |||||||
Total Investments — 99.3% | 200,962,476 | |||||||
Other Assets Less Liabilities — 0.7% | 1,340,877 | |||||||
|
| |||||||
Net Assets — 100.0% | $ | 202,303,353 | ||||||
|
| |||||||
| (a) | Non-income producing security. |
| (b) | All or a portion of this security is on loan. |
| (c) | Affiliate of the Fund. |
| (d) | Annualized 7-day yield as of period end. |
| (e) | All or a portion of this security was purchased with the cash collateral from loaned securities. |
Affiliates
Investments in issuers considered to be affiliate(s) of the Fund during the year ended March 31, 2023 for purposes of Section 2(a)(3) of the Investment Company Act of 1940, as amended, were as follows:
| Affiliated Issuer | Value at 03/31/22 | Purchases at Cost | Proceeds from Sale | Net Realized Gain (Loss) | Change in Unrealized Appreciation (Depreciation) | Value at 03/31/23 | Shares Held at 03/31/23 | Income | Capital Gain Distributions from Underlying Funds | |||||||||||||||||||||||||||
BlackRock Cash Funds: Institutional, SL Agency Shares | $ | — | $667,501 | (a) | $ | — | $ | (704 | ) | $ | (238 | ) | $ | 666,559 | 666,360 | $ | 16,928 | (b) | $ | — | ||||||||||||||||
BlackRock Cash Funds: Treasury, SL Agency Shares | 470,000 | — | (210,000 | )(a) | — | — | 260,000 | 260,000 | 4,402 | — | ||||||||||||||||||||||||||
|
|
|
|
|
|
|
|
|
| |||||||||||||||||||||||||||
| $ | (704 | ) | $ | (238 | ) | $ | 926,559 | $ | 21,330 | $ | — | |||||||||||||||||||||||||
|
|
|
|
|
|
|
|
|
| |||||||||||||||||||||||||||
| (a) | Represents net amount purchased (sold). |
| (b) | All or a portion represents securities lending income earned from the reinvestment of cash collateral from loaned securities, net of fees and collateral investment expenses, and other payments to and from borrowers of securities. |
| 22 | 2 0 2 3 I SHARES ANNUAL REPORT TO SHAREHOLDERS |
Schedule of Investments (continued) March 31, 2023 | iShares® Global Timber & Forestry ETF |
Derivative Financial Instruments Outstanding as of Period End
Futures Contracts
| ||||||||||||||||
| Description | Number of Contracts | Expiration Date | Notional Amount (000) | Value/ Unrealized Appreciation (Depreciation) | ||||||||||||
| ||||||||||||||||
Long Contracts | ||||||||||||||||
Russell 1000 Value Index | 26 | 06/16/23 | $ | 1,966 | $ | 66,260 | ||||||||||
|
| |||||||||||||||
Derivative Financial Instruments Categorized by Risk Exposure
As of period end, the fair values of derivative financial instruments located in the Statements of Assets and Liabilities were as follows:
| ||||||||||||||||||||||||||||
Commodity Contracts | Credit Contracts | Equity Contracts | Foreign Currency Exchange Contracts | Interest Rate Contracts | Other Contracts | Total | ||||||||||||||||||||||
| ||||||||||||||||||||||||||||
Assets — Derivative Financial Instruments | ||||||||||||||||||||||||||||
Futures contracts | ||||||||||||||||||||||||||||
Unrealized appreciation on futures contracts(a) | $ | — | $ | — | $ | 66,260 | $ | — | $ | — | $ | — | $ | 66,260 | ||||||||||||||
|
|
|
|
|
|
|
|
|
|
|
|
|
| |||||||||||||||
| (a) | Net cumulative unrealized appreciation (depreciation) on futures contracts are reported in the Schedule of Investments. In the Statements of Assets and Liabilities, only current day’s variation margin is reported in receivables or payables and the net cumulative unrealized appreciation (depreciation) is included in accumulated earnings (loss). |
For the period ended March 31, 2023, the effect of derivative financial instruments in the Statements of Operations was as follows:
| ||||||||||||||||||||||||||||
Commodity Contracts | Credit Contracts | Equity Contracts | Foreign Currency Exchange Contracts | Interest Rate Contracts | Other Contracts | Total | ||||||||||||||||||||||
| ||||||||||||||||||||||||||||
Net Realized Gain (Loss) from | ||||||||||||||||||||||||||||
Futures contracts | $ | — | $ | — | $ | (252,878 | ) | $ | — | $ | — | $ | — | $ | (252,878 | ) | ||||||||||||
|
|
|
|
|
|
|
|
|
|
|
|
|
| |||||||||||||||
Net Change in Unrealized Appreciation (Depreciation) on | ||||||||||||||||||||||||||||
Futures contracts | $ | — | $ | — | $ | 14,730 | $ | — | $ | — | $ | — | $ | 14,730 | ||||||||||||||
|
|
|
|
|
|
|
|
|
|
|
|
|
| |||||||||||||||
Average Quarterly Balances of Outstanding Derivative Financial Instruments
| ||||
Futures contracts | ||||
Average notional value of contracts — long | $ | 1,566,946 | ||
| ||||
For more information about the Fund’s investment risks regarding derivative financial instruments, refer to the Notes to Financial Statements.
Fair Value Hierarchy as of Period End
Various inputs are used in determining the fair value of financial instruments. For a description of the input levels and information about the Fund’s policy regarding valuation of financial instruments, refer to the Notes to Financial Statements.
The following table summarizes the Fund’s financial instruments categorized in the fair value hierarchy. The breakdown of the Fund’s financial instruments into major categories is disclosed in the Schedule of Investments above.
| ||||||||||||||||
| Level 1 | Level 2 | Level 3 | Total | |||||||||||||
| ||||||||||||||||
Assets | ||||||||||||||||
Investments | ||||||||||||||||
Long-Term Investments | ||||||||||||||||
Common Stocks | $ | 107,334,199 | $ | 92,701,718 | $ | — | $ | 200,035,917 | ||||||||
Short-Term Securities | ||||||||||||||||
Money Market Funds | 926,559 | — | — | 926,559 | ||||||||||||
|
|
|
|
|
|
|
| |||||||||
| $ | 108,260,758 | $ | 92,701,718 | $ | — | $ | 200,962,476 | |||||||||
|
|
|
|
|
|
|
| |||||||||
Derivative Financial Instruments(a) | ||||||||||||||||
Assets | ||||||||||||||||
Equity Contracts | $ | 66,260 | $ | — | $ | — | $ | 66,260 | ||||||||
|
|
|
|
|
|
|
| |||||||||
| (a) | Derivative financial instruments are futures contracts. Futures contracts are valued at the unrealized appreciation (depreciation) on the instrument. |
See notes to financial statements.
SCHEDULE OF INVESTMENTS | 23 |
Statements of Assets and Liabilities
March 31, 2023
iShares Environmental Infrastructure and Industrials ETF | iShares Global 100 ETF | iShares Global | iShares Global Timber & Forestry ETF | |||||||||||||||||
| ||||||||||||||||||||
ASSETS | ||||||||||||||||||||
Investments, at value — unaffiliated(a)(b) | $ | 4,387,596 | $ | 3,591,553,762 | $ | 3,805,441,800 | $ | 200,035,917 | ||||||||||||
Investments, at value — affiliated(c) | — | 4,507,245 | 24,643,535 | 926,559 | ||||||||||||||||
Cash | 1,882 | 6,391 | 22,620 | 52,001 | ||||||||||||||||
Cash pledged for futures contracts | 1,000 | 430,000 | 522,000 | 112,000 | ||||||||||||||||
Foreign currency collateral pledged for futures contracts(d) | — | 187,956 | 2,737,441 | — | ||||||||||||||||
Foreign currency, at value(e) | 6,846 | 2,100,960 | 14,422,557 | 319,589 | ||||||||||||||||
Receivables: | ||||||||||||||||||||
Investments sold | — | — | 178,260,670 | 13,328,983 | ||||||||||||||||
Securities lending income — affiliated | 6 | 2,890 | 117,410 | 559 | ||||||||||||||||
Dividends — unaffiliated | 6,615 | 6,789,680 | 7,659,537 | 986,572 | ||||||||||||||||
Dividends — affiliated | 12 | 20,422 | 17,309 | 515 | ||||||||||||||||
Tax reclaims | 190 | 1,891,132 | 277,891 | 504,145 | ||||||||||||||||
Variation margin on futures contracts | 159 | 125,842 | 505,864 | 23,706 | ||||||||||||||||
|
|
|
|
|
|
|
| |||||||||||||
Total assets | 4,404,306 | 3,607,616,280 | 4,034,628,634 | 216,290,546 | ||||||||||||||||
|
|
|
|
|
|
|
| |||||||||||||
LIABILITIES | ||||||||||||||||||||
Collateral on securities loaned, at value | — | 609,268 | 8,021,119 | 666,811 | ||||||||||||||||
Payables: | ||||||||||||||||||||
Investments purchased | 395 | 32,039 | 181,697,893 | 13,231,007 | ||||||||||||||||
Capital shares redeemed | — | — | 145,280 | — | ||||||||||||||||
Investment advisory fees | 1,708 | 1,170,068 | 1,330,352 | 71,491 | ||||||||||||||||
IRS compliance fee for foreign withholding tax claims | — | 1,494,463 | — | — | ||||||||||||||||
Professional fees | — | 157,373 | — | 17,884 | ||||||||||||||||
|
|
|
|
|
|
|
| |||||||||||||
Total liabilities | 2,103 | 3,463,211 | 191,194,644 | 13,987,193 | ||||||||||||||||
|
|
|
|
|
|
|
| |||||||||||||
NET ASSETS | $ | 4,402,203 | $ | 3,604,153,069 | $ | 3,843,433,990 | $ | 202,303,353 | ||||||||||||
|
|
|
|
|
|
|
| |||||||||||||
NET ASSETS CONSIST OF | ||||||||||||||||||||
Paid-in capital | $ | 4,016,012 | $ | 2,929,955,850 | $ | 3,961,921,115 | $ | 260,086,403 | ||||||||||||
Accumulated earnings (loss) | 386,191 | 674,197,219 | (118,487,125 | ) | (57,783,050 | ) | ||||||||||||||
|
|
|
|
|
|
|
| |||||||||||||
NET ASSETS | $ | 4,402,203 | $ | 3,604,153,069 | $ | 3,843,433,990 | $ | 202,303,353 | ||||||||||||
|
|
|
|
|
|
|
| |||||||||||||
NET ASSETVALUE | ||||||||||||||||||||
Shares outstanding | 160,000 | 51,450,000 | 80,600,000 | 2,820,000 | ||||||||||||||||
|
|
|
|
|
|
|
| |||||||||||||
Net asset value | $ | 27.51 | $ | 70.05 | $ | 47.69 | $ | 71.74 | ||||||||||||
|
|
|
|
|
|
|
| |||||||||||||
Shares authorized | Unlimited | Unlimited | Unlimited | Unlimited | ||||||||||||||||
|
|
|
|
|
|
|
| |||||||||||||
Par value | None | None | None | None | ||||||||||||||||
|
|
|
|
|
|
|
| |||||||||||||
(a) Investments, at cost — unaffiliated | $ | 3,980,465 | $ | 2,748,173,306 | $ | 3,538,806,890 | $ | 229,104,265 | ||||||||||||
(b) Securities loaned, at value | $ | — | $ | 582,061 | $ | 7,163,249 | $ | 616,863 | ||||||||||||
(c) Investments, at cost — affiliated | $ | — | $ | 4,507,308 | $ | 24,640,612 | $ | 926,797 | ||||||||||||
(d) Foreign currency collateral pledged, at cost | $ | — | $ | 188,683 | $ | 2,756,643 | $ | — | ||||||||||||
(e) Foreign currency, at cost | $ | 6,765 | $ | 2,123,077 | $ | 14,409,485 | $ | 319,161 | ||||||||||||
See notes to financial statements.
| 24 | 2 0 2 3 I SHARES ANNUAL REPORT TO SHAREHOLDERS |
Year Ended March 31, 2023
iShares Environmental Infrastructure and Industrials | iShares Global 100 | iShares Global Infrastructure | iShares Global Timber & | |||||||||||||||||
| ETF | (a) | ETF | ETF | Forestry ETF | ||||||||||||||||
| ||||||||||||||||||||
INVESTMENT INCOME | ||||||||||||||||||||
Dividends — unaffiliated | $ | 27,663 | $ | 83,753,562 | $ | 123,051,271 | $ | 5,724,445 | ||||||||||||
Dividends — affiliated | 22 | 146,039 | 122,877 | 4,402 | ||||||||||||||||
Securities lending income — affiliated — net | 6 | 46,637 | 307,537 | 16,928 | ||||||||||||||||
Other income — unaffiliated | — | 1,171,834 | 64,110 | 506 | ||||||||||||||||
Foreign taxes withheld | (1,341 | ) | (3,870,695 | ) | (7,632,922 | ) | (413,705 | ) | ||||||||||||
Foreign withholding tax claims | — | 3,466,320 | 234,674 | 178,307 | ||||||||||||||||
IRS compliance fee for foreign withholding tax claims | — | (1,460,773 | ) | — | 195 | |||||||||||||||
|
|
|
|
|
|
|
| |||||||||||||
Total investment income | 26,350 | 83,252,924 | 116,147,547 | 5,511,078 | ||||||||||||||||
|
|
|
|
|
|
|
| |||||||||||||
EXPENSES | ||||||||||||||||||||
Investment advisory | 8,359 | 14,080,736 | 14,877,540 | 1,019,624 | ||||||||||||||||
Commitment costs | 15 | 3,321 | 5,820 | 1,655 | ||||||||||||||||
Professional | — | 464,099 | 29,883 | 17,881 | ||||||||||||||||
|
|
|
|
|
|
|
| |||||||||||||
Total expenses | 8,374 | 14,548,156 | 14,913,243 | 1,039,160 | ||||||||||||||||
|
|
|
|
|
|
|
| |||||||||||||
Net investment income | 17,976 | 68,704,768 | 101,234,304 | 4,471,918 | ||||||||||||||||
|
|
|
|
|
|
|
| |||||||||||||
REALIZED AND UNREALIZED GAIN (LOSS) | ||||||||||||||||||||
Net realized gain (loss) from: | ||||||||||||||||||||
Investments — unaffiliated | (35,017 | ) | (32,267,941 | ) | (99,379,068 | ) | (16,512,813 | ) | ||||||||||||
Investments — affiliated | (2 | ) | (1,049 | ) | (5,398 | ) | (704 | ) | ||||||||||||
Capital gain distributions from underlying funds — affiliated | — | 3 | 4 | — | ||||||||||||||||
Foreign currency transactions | 801 | (575,716 | ) | 1,060,958 | (28,951 | ) | ||||||||||||||
Futures contracts | 646 | (1,647,999 | ) | (2,315,530 | ) | (252,878 | ) | |||||||||||||
In-kind redemptions — unaffiliated(b) | — | 172,820,875 | 100,177,790 | 4,560,419 | ||||||||||||||||
|
|
|
|
|
|
|
| |||||||||||||
| (33,572 | ) | 138,328,173 | (461,244 | ) | (12,234,927 | ) | ||||||||||||||
|
|
|
|
|
|
|
| |||||||||||||
Net change in unrealized appreciation (depreciation) on: | ||||||||||||||||||||
Investments — unaffiliated | 407,131 | (446,084,468 | ) | (212,265,291 | ) | (45,306,529 | ) | |||||||||||||
Investments — affiliated | — | (63 | ) | 1,860 | (238 | ) | ||||||||||||||
Foreign currency translations | 101 | 23,258 | 361,959 | (49,770 | ) | |||||||||||||||
Futures contracts | 345 | (502,842 | ) | 847,114 | 14,730 | |||||||||||||||
|
|
|
|
|
|
|
| |||||||||||||
| 407,577 | (446,564,115 | ) | (211,054,358 | ) | (45,341,807 | ) | ||||||||||||||
|
|
|
|
|
|
|
| |||||||||||||
Net realized and unrealized gain (loss) | 374,005 | (308,235,942 | ) | (211,515,602 | ) | (57,576,734 | ) | |||||||||||||
|
|
|
|
|
|
|
| |||||||||||||
NET INCREASE (DECREASE) IN NET ASSETS RESULTING FROM OPERATIONS | $ | 391,981 | $ | (239,531,174 | ) | $ | (110,281,298 | ) | $ | (53,104,816 | ) | |||||||||
|
|
|
|
|
|
|
| |||||||||||||
| (a) | For the period from November 01, 2022 (commencement of operations) to March 31, 2023. |
| (b) | See Note 2 of the Notes to Financial Statements. |
See notes to financial statements.
FINANCIAL STATEMENTS | 25 |
Statements of Changes in Net Assets
| iShares Environmental Infrastructure and Industrials ETF | iShares Global 100 ETF | |||||||||||||||
| Period From | ||||||||||||||||
| 11/01/22 | (a) | Year Ended | Year Ended | |||||||||||||
| to 03/31/23 | 03/31/23 | 03/31/22 | ||||||||||||||
| ||||||||||||||||
INCREASE (DECREASE) IN NET ASSETS | ||||||||||||||||
OPERATIONS | ||||||||||||||||
Net investment income | $ | 17,976 | $ | 68,704,768 | $ | 55,780,470 | ||||||||||
Net realized gain (loss) | (33,572 | ) | 138,328,173 | 116,816,003 | ||||||||||||
Net change in unrealized appreciation (depreciation) | 407,577 | (446,564,115 | ) | 345,899,984 | ||||||||||||
|
|
|
|
|
| |||||||||||
Net increase (decrease) in net assets resulting from operations | 391,981 | (239,531,174 | ) | 518,496,457 | ||||||||||||
|
|
|
|
|
| |||||||||||
DISTRIBUTIONS TO SHAREHOLDERS(b) | ||||||||||||||||
Decrease in net assets resulting from distributions to shareholders | (5,790 | ) | (66,133,768 | ) | (56,448,560 | ) | ||||||||||
|
|
|
|
|
| |||||||||||
CAPITAL SHARE TRANSACTIONS | ||||||||||||||||
Net increase in net assets derived from capital share transactions | 4,016,012 | 66,208,396 | 408,496,678 | |||||||||||||
|
|
|
|
|
| |||||||||||
NET ASSETS | ||||||||||||||||
Total increase (decrease) in net assets | 4,402,203 | (239,456,546 | ) | 870,544,575 | ||||||||||||
Beginning of period | — | 3,843,609,615 | 2,973,065,040 | |||||||||||||
|
|
|
|
|
| |||||||||||
End of period | $ | 4,402,203 | $ | 3,604,153,069 | $ | 3,843,609,615 | ||||||||||
|
|
|
|
|
| |||||||||||
| (a) | Commencement of operations. |
| (b) | Distributions for annual periods determined in accordance with U.S. federal income tax regulations. |
See notes to financial statements.
| 26 | 2 0 2 3 I SHARES ANNUAL REPORT TO SHAREHOLDERS |
Statements of Changes in Net Assets (continued)
| iShares Global Infrastructure ETF | iShares Global Timber & Forestry ETF | |||||||||||||||||||
Year Ended 03/31/23 | Year Ended 03/31/22 | Year Ended 03/31/23 | Year Ended 03/31/22 | |||||||||||||||||
| ||||||||||||||||||||
INCREASE (DECREASE) IN NET ASSETS | ||||||||||||||||||||
OPERATIONS | ||||||||||||||||||||
Net investment income | $ | 101,234,304 | $ | 70,322,524 | $ | 4,471,918 | $ | 5,956,846 | ||||||||||||
Net realized gain (loss) | (461,244 | ) | 102,129,926 | (12,234,927 | ) | 41,102,186 | ||||||||||||||
Net change in unrealized appreciation (depreciation) | (211,054,358 | ) | 292,894,503 | (45,341,807 | ) | (34,689,412 | ) | |||||||||||||
|
|
|
|
|
|
|
| |||||||||||||
Net increase (decrease) in net assets resulting from operations | (110,281,298 | ) | 465,346,953 | (53,104,816 | ) | 12,369,620 | ||||||||||||||
|
|
|
|
|
|
|
| |||||||||||||
DISTRIBUTIONS TO SHAREHOLDERS(a) | ||||||||||||||||||||
Decrease in net assets resulting from distributions to shareholders | (92,664,851 | ) | (76,469,201 | ) | (5,674,714 | ) | (4,841,317 | ) | ||||||||||||
|
|
|
|
|
|
|
| |||||||||||||
CAPITAL SHARE TRANSACTIONS | ||||||||||||||||||||
Net increase (decrease) in net assets derived from capital share transactions | 613,390,828 | (19,508,370 | ) | (54,370,685 | ) | (24,124,346 | ) | |||||||||||||
|
|
|
|
|
|
|
| |||||||||||||
NET ASSETS | ||||||||||||||||||||
Total increase (decrease) in net assets | 410,444,679 | 369,369,382 | (113,150,215 | ) | (16,596,043 | ) | ||||||||||||||
Beginning of year | 3,432,989,311 | 3,063,619,929 | 315,453,568 | 332,049,611 | ||||||||||||||||
|
|
|
|
|
|
|
| |||||||||||||
End of year | $ | 3,843,433,990 | $ | 3,432,989,311 | $ | 202,303,353 | $ | 315,453,568 | ||||||||||||
|
|
|
|
|
|
|
| |||||||||||||
| (a) | Distributions for annual periods determined in accordance with U.S. federal income tax regulations. |
See notes to financial statements.
FINANCIAL STATEMENTS | 27 |
(For a share outstanding throughout the period)
iShares Environmental Infrastructure and Industrials ETF | ||||||||
| Period From | ||||||||
| 11/01/22 | (a) | |||||||
| to 03/31/23 | ||||||||
| ||||||||
Net asset value, beginning of period | $ | 25.10 | ||||||
|
| |||||||
Net investment income(b) | 0.11 | |||||||
Net realized and unrealized gain(c) | 2.34 | |||||||
|
| |||||||
Net increase from investment operations | 2.45 | |||||||
|
| |||||||
Distributions from net investment income(d) | (0.04 | ) | ||||||
|
| |||||||
Net asset value, end of period | $ | 27.51 | ||||||
|
| |||||||
Total Return(e) | ||||||||
Based on net asset value | 9.76 | %(f) | ||||||
|
| |||||||
Ratios to Average Net Assets(g) | ||||||||
Total expenses | 0.47 | %(h) | ||||||
|
| |||||||
Net investment income | 1.01 | %(h) | ||||||
|
| |||||||
Supplemental Data | ||||||||
Net assets, end of period (000) | $ | 4,402 | ||||||
|
| |||||||
Portfolio turnover rate(i) | 13 | % | ||||||
|
| |||||||
| (a) | Commencement of operations. |
| (b) | Based on average shares outstanding. |
| (c) | The amounts reported for a share outstanding may not accord with the change in aggregate gains and losses in securities for the fiscal period due to the timing of capital share transactions in relation to the fluctuating market values of the Fund’s underlying securities. |
| (d) | Distributions for annual periods determined in accordance with U.S. federal income tax regulations. |
| (e) | Where applicable, assumes the reinvestment of distributions. |
| (f) | Not annualized. |
| (g) | Excludes fees and expenses incurred indirectly as a result of investments in underlying funds. |
| (h) | Annualized. |
| (i) | Portfolio turnover rate excludes in-kind transactions. |
See notes to financial statements.
| 28 | 2 0 2 3 I SHARES ANNUAL REPORT TO SHAREHOLDERS |
Financial Highlights (continued)
(For a share outstanding throughout each period)
| iShares Global 100 ETF | ||||||||||||||||||||
| | Year Ended 03/31/23 | | | Year Ended 03/31/22 | | | Year Ended 03/31/21 | | | Year Ended 03/31/20 | | | Year Ended 03/31/19 | (a) | ||||||
| ||||||||||||||||||||
Net asset value, beginning of year | $ | 75.96 | $ | 65.92 | $ | 44.71 | $ | 47.57 | $ | 45.54 | ||||||||||
|
|
|
|
|
|
|
|
|
| |||||||||||
Net investment income(b) | 1.30 | (c) | 1.16 | 0.99 | 1.06 | 1.14 | ||||||||||||||
Net realized and unrealized gain (loss)(d) | (5.93 | ) | 10.08 | 21.16 | (2.83 | ) | 1.97 | |||||||||||||
|
|
|
|
|
|
|
|
|
| |||||||||||
Net increase (decrease) from investment operations | (4.63 | ) | 11.24 | 22.15 | (1.77 | ) | 3.11 | |||||||||||||
|
|
|
|
|
|
|
|
|
| |||||||||||
Distributions from net investment income(e) | (1.28 | ) | (1.20 | ) | (0.94 | ) | (1.09 | ) | (1.08 | ) | ||||||||||
|
|
|
|
|
|
|
|
|
| |||||||||||
Net asset value, end of year | $ | 70.05 | $ | 75.96 | $ | 65.92 | $ | 44.71 | $ | 47.57 | ||||||||||
|
|
|
|
|
|
|
|
|
| |||||||||||
Total Return(f) | ||||||||||||||||||||
Based on net asset value | (6.02 | )%(c) | 17.11 | % | 49.88 | % | (3.91 | )% | 7.00 | % | ||||||||||
|
|
|
|
|
|
|
|
|
| |||||||||||
Ratios to Average Net Assets(g) | ||||||||||||||||||||
Total expenses | 0.41 | % | 0.40 | % | 0.40 | % | 0.40 | % | 0.40 | % | ||||||||||
|
|
|
|
|
|
|
|
|
| |||||||||||
Total expenses excluding professional fees for foreign withholding tax claims | 0.40 | % | 0.40 | % | N/A | 0.40 | % | N/A | ||||||||||||
|
|
|
|
|
|
|
|
|
| |||||||||||
Net investment income | 1.95 | %(c) | 1.58 | % | 1.71 | % | 2.11 | % | 2.46 | % | ||||||||||
|
|
|
|
|
|
|
|
|
| |||||||||||
Supplemental Data | ||||||||||||||||||||
Net assets, end of year (000) | $ | 3,604,153 | $ | 3,843,610 | $ | 2,973,065 | $ | 1,855,568 | $ | 2,031,281 | ||||||||||
|
|
|
|
|
|
|
|
|
| |||||||||||
Portfolio turnover rate(h) | 2 | % | 2 | % | 3 | % | 5 | % | 9 | % | ||||||||||
|
|
|
|
|
|
|
|
|
| |||||||||||
| (a) | Per share amounts reflect a two-for-one stock split effective after the close of trading on May 1, 2018. |
| (b) | Based on average shares outstanding. |
| (c) | Reflects positive effect of foreign withholding tax claims, net of the associated professional fees, which resulted in the following increases for the year ended March 31, 2023: |
• Net investment income per share by $0.06.
• Total return by 0.08%.
• Ratio of net investment income to average net assets by 0.09%.
| (d) | The amounts reported for a share outstanding may not accord with the change in aggregate gains and losses in securities for the fiscal period due to the timing of capital share transactions in relation to the fluctuating market values of the Fund’s underlying securities. |
| (e) | Distributions for annual periods determined in accordance with U.S. federal income tax regulations. |
| (f) | Where applicable, assumes the reinvestment of distributions. |
| (g) | Excludes fees and expenses incurred indirectly as a result of investments in underlying funds. |
| (h) | Portfolio turnover rate excludes in-kind transactions. |
See notes to financial statements.
FINANCIAL HIGHLIGHTS | 29 |
Financial Highlights (continued)
(For a share outstanding throughout each period)
| iShares Global Infrastructure ETF | ||||||||||||||||||||
| | Year Ended 03/31/23 | | | Year Ended 03/31/22 | | | Year Ended 03/31/21 | | | Year Ended 03/31/20 | | | Year Ended 03/31/19 | | ||||||
| ||||||||||||||||||||
Net asset value, beginning of year | $ | 50.78 | $ | 45.05 | $ | 33.89 | $ | 44.78 | $ | 42.73 | ||||||||||
|
|
|
|
|
|
|
|
|
| |||||||||||
Net investment income(a) | 1.33 | 1.04 | 1.04 | 1.54 | 1.34 | |||||||||||||||
Net realized and unrealized gain (loss)(b) | (3.20 | ) | 5.84 | 11.14 | (10.86 | ) | 2.10 | |||||||||||||
|
|
|
|
|
|
|
|
|
| |||||||||||
Net increase (decrease) from investment operations | (1.87 | ) | 6.88 | 12.18 | (9.32 | ) | 3.44 | |||||||||||||
|
|
|
|
|
|
|
|
|
| |||||||||||
Distributions from net investment income(c) | (1.22 | ) | (1.15 | ) | (1.02 | ) | (1.57 | ) | (1.39 | ) | ||||||||||
|
|
|
|
|
|
|
|
|
| |||||||||||
Net asset value, end of year | $ | 47.69 | $ | 50.78 | $ | 45.05 | $ | 33.89 | $ | 44.78 | ||||||||||
|
|
|
|
|
|
|
|
|
| |||||||||||
Total Return(d) | ||||||||||||||||||||
Based on net asset value | (3.74 | )%(e) | 15.54 | % | 36.27 | %(f) | (21.75 | )% | 8.40 | % | ||||||||||
|
|
|
|
|
|
|
|
|
| |||||||||||
Ratios to Average Net Assets(g) | ||||||||||||||||||||
Total expenses | 0.41 | % | 0.40 | % | 0.43 | % | 0.46 | % | 0.46 | % | ||||||||||
|
|
|
|
|
|
|
|
|
| |||||||||||
Total expenses excluding professional fees for foreign withholding tax claims | 0.41 | % | N/A | N/A | N/A | N/A | ||||||||||||||
|
|
|
|
|
|
|
|
|
| |||||||||||
Net investment income | 2.81 | %(e) | 2.23 | % | 2.57 | % | 3.38 | % | 3.15 | % | ||||||||||
|
|
|
|
|
|
|
|
|
| |||||||||||
Supplemental Data | ||||||||||||||||||||
Net assets, end of year (000) | $ | 3,843,434 | $ | 3,432,989 | $ | 3,063,620 | $ | 2,741,647 | $ | 2,825,830 | ||||||||||
|
|
|
|
|
|
|
|
|
| |||||||||||
Portfolio turnover rate(h) | 19 | % | 16 | % | 25 | % | 9 | % | 19 | % | ||||||||||
|
|
|
|
|
|
|
|
|
| |||||||||||
| (a) | Based on average shares outstanding. |
| (b) | The amounts reported for a share outstanding may not accord with the change in aggregate gains and losses in securities for the fiscal period due to the timing of capital share transactions in relation to the fluctuating market values of the Fund’s underlying securities. |
| (c) | Distributions for annual periods determined in accordance with U.S. federal income tax regulations. |
| (d) | Where applicable, assumes the reinvestment of distributions. |
| (e) | Reflects the positive effect of foreign withholding tax claims, net of the associated professional fees, which resulted in the following increases for the year ended March 31, 2023: |
• Total return by 0.01%.
• Ratio of net investment income to average net assets by 0.01%.
| (f) | Includes payment received from an affiliate, which had no impact on the Fund’s total return. |
| (g) | Excludes fees and expenses incurred indirectly as a result of investments in underlying funds. |
| (h) | Portfolio turnover rate excludes in-kind transactions. |
See notes to financial statements.
| 30 | 2 0 2 3 I SHARES ANNUAL REPORT TO SHAREHOLDERS |
Financial Highlights (continued)
(For a share outstanding throughout each period)
| iShares Global Timber & Forestry ETF | ||||||||||||||||||||||||||||||||||||||||
| | Year Ended 03/31/23 | | | Year Ended 03/31/22 | | | Year Ended 03/31/21 | | | Year Ended 03/31/20 | | | Year Ended 03/31/19 | | ||||||||||||||||||||||||||
| ||||||||||||||||||||||||||||||||||||||||
Net asset value, beginning of year | $ | 89.11 | $ | 85.14 | $ | 48.10 | $ | 63.82 | $ | 78.11 | ||||||||||||||||||||||||||||||
|
|
|
|
|
|
|
|
|
| |||||||||||||||||||||||||||||||
Net investment income(a) | 1.40 | (b) | 1.58 | (b) | 0.78 | 0.79 | 1.57 | |||||||||||||||||||||||||||||||||
Net realized and unrealized gain (loss)(c) | (17.13 | ) | 3.53 | 37.04 | (15.27 | ) | (14.25 | ) | ||||||||||||||||||||||||||||||||
|
|
|
|
|
|
|
|
|
| |||||||||||||||||||||||||||||||
Net increase (decrease) from investment operations | (15.73 | ) | 5.11 | 37.82 | (14.48 | ) | (12.68 | ) | ||||||||||||||||||||||||||||||||
|
|
|
|
|
|
|
|
|
| |||||||||||||||||||||||||||||||
Distributions from net investment income(d) | (1.64 | ) | (1.14 | ) | (0.78 | ) | (1.24 | ) | (1.61 | ) | ||||||||||||||||||||||||||||||
|
|
|
|
|
|
|
|
|
| |||||||||||||||||||||||||||||||
Net asset value, end of year | $ | 71.74 | $ | 89.11 | $ | 85.14 | $ | 48.10 | $ | 63.82 | ||||||||||||||||||||||||||||||
|
|
|
|
|
|
|
|
|
| |||||||||||||||||||||||||||||||
Total Return(e) | ||||||||||||||||||||||||||||||||||||||||
Based on net asset value | (17.90 | )%(b) | 6.04 | %(b) | 79.23 | % | (23.04 | )% | (16.22 | )% | ||||||||||||||||||||||||||||||
|
|
|
|
|
|
|
|
|
| |||||||||||||||||||||||||||||||
Ratios to Average Net Assets(f) | ||||||||||||||||||||||||||||||||||||||||
Total expenses | 0.42 | % | 0.41 | % | 0.43 | % | 0.46 | % | 0.46 | % | ||||||||||||||||||||||||||||||
|
|
|
|
|
|
|
|
|
| |||||||||||||||||||||||||||||||
Total expenses excluding professional fees for foreign withholding tax claims | 0.41 | % | 0.40 | % | N/A | N/A | 0.46 | % | ||||||||||||||||||||||||||||||||
|
|
|
|
|
|
|
|
|
| |||||||||||||||||||||||||||||||
Net investment income | 1.81 | %(b) | 1.78 | %(b) | 1.15 | % | 1.30 | % | 2.17 | % | ||||||||||||||||||||||||||||||
|
|
|
|
|
|
|
|
|
| |||||||||||||||||||||||||||||||
Supplemental Data | ||||||||||||||||||||||||||||||||||||||||
Net assets, end of year (000) | $ | 202,303 | $ | 315,454 | $ | 332,050 | $ | 173,178 | $ | 279,553 | ||||||||||||||||||||||||||||||
|
|
|
|
|
|
|
|
|
| |||||||||||||||||||||||||||||||
Portfolio turnover rate(g) | 29 | % | 18 | % | 14 | % | 10 | % | 18 | % | ||||||||||||||||||||||||||||||
|
|
|
|
|
|
|
|
|
| |||||||||||||||||||||||||||||||
| (a) | Based on average shares outstanding. |
| (b) | Reflects the positive effect of foreign withholding tax claims, net of the associated professional fees, which resulted in the following increases for the years ended March 31, 2022 and March 31, 2023, respectively: |
• Net investment income per share by $0.07 and $0.05.
• Total return by 0.09% and 0.07%.
• Ratio of net investment income to average net assets by 0.07% and 0.06%.
| (c) | The amounts reported for a share outstanding may not accord with the change in aggregate gains and losses in securities for the fiscal period due to the timing of capital share transactions in relation to the fluctuating market values of the Fund’s underlying securities. |
| (d) | Distributions for annual periods determined in accordance with U.S. federal income tax regulations. |
| (e) | Where applicable, assumes the reinvestment of distributions. |
| (f) | Excludes fees and expenses incurred indirectly as a result of investments in underlying funds. |
| (g) | Portfolio turnover rate excludes in-kind transactions. |
See notes to financial statements.
FINANCIAL HIGHLIGHTS | 31 |
| Notes to Financial Statements |
| 1. | ORGANIZATION |
iShares Trust (the “Trust”) is registered under the Investment Company Act of 1940, as amended (the “1940 Act”), as an open-end management investment company. The Trust is organized as a Delaware statutory trust and is authorized to have multiple series or portfolios.
These financial statements relate only to the following funds (each, a “Fund” and collectively, the “Funds”):
| iShares ETF | Diversification Classification | |||
Environmental Infrastructure and Industrials(a) | Non-diversified | |||
Global 100 | Diversified | |||
Global Infrastructure | Diversified | |||
Global Timber & Forestry | Non-diversified | |||
| (a) | The Fund commenced operations on November 01, 2022. |
| 2. | SIGNIFICANT ACCOUNTING POLICIES |
The financial statements are prepared in conformity with accounting principles generally accepted in the United States of America (“U.S. GAAP”), which may require management to make estimates and assumptions that affect the reported amounts of assets and liabilities in the financial statements, disclosure of contingent assets and liabilities at the date of the financial statements and the reported amounts of increases and decreases in net assets from operations during the reporting period. Actual results could differ from those estimates. Each Fund is considered an investment company under U.S. GAAP and follows the accounting and reporting guidance applicable to investment companies. Below is a summary of significant accounting policies:
Investment Transactions and Income Recognition: For financial reporting purposes, investment transactions are recorded on the dates the transactions are executed. Realized gains and losses on investment transactions are determined using the specific identification method. Dividend income and capital gain distributions, if any, are recorded on the ex-dividend date. Non-cash dividends, if any, are recorded on the ex-dividend date at fair value. Dividends from foreign securities where the ex-dividend date may have passed are subsequently recorded when the Funds are informed of the ex-dividend date. Under the applicable foreign tax laws, a withholding tax at various rates may be imposed on capital gains, dividends and interest. Upon notification from issuers or as estimated by management, a portion of the dividend income received from a real estate investment trust may be redesignated as a reduction of cost of the related investment and/or realized gain.
Foreign Currency Translation: Each Fund’s books and records are maintained in U.S. dollars. Securities and other assets and liabilities denominated in foreign currencies are translated into U.S. dollars using prevailing market rates as quoted by one or more data service providers. Purchases and sales of investments are recorded at the rates of exchange prevailing on the respective dates of such transactions. Generally, when the U.S. dollar rises in value against a foreign currency, the investments denominated in that currency will lose value; the opposite effect occurs if the U.S. dollar falls in relative value.
Each Fund does not isolate the effect of fluctuations in foreign exchange rates from the effect of fluctuations in the market prices of investments for financial reporting purposes. Accordingly, the effects of changes in exchange rates on investments are not segregated in the Statements of Operations from the effects of changes in market prices of those investments, but are included as a component of net realized and unrealized gain (loss) from investments. Each Fund reports realized currency gains (losses) on foreign currency related transactions as components of net realized gain (loss) for financial reporting purposes, whereas such components are generally treated as ordinary income for U.S. federal income tax purposes.
Foreign Taxes: The Funds may be subject to foreign taxes (a portion of which may be reclaimable) on income, stock dividends, capital gains on investments, or certain foreign currency transactions. All foreign taxes are recorded in accordance with the applicable foreign tax regulations and rates that exist in the foreign jurisdictions in which each Fund invests. These foreign taxes, if any, are paid by each Fund and are reflected in its Statements of Operations as follows: foreign taxes withheld at source are presented as a reduction of income, foreign taxes on securities lending income are presented as a reduction of securities lending income, foreign taxes on stock dividends are presented as “Other foreign taxes”, and foreign taxes on capital gains from sales of investments and foreign taxes on foreign currency transactions are included in their respective net realized gain (loss) categories. Foreign taxes payable or deferred as of March 31, 2023, if any, are disclosed in the Statements of Assets and Liabilities.
The Funds file withholding tax reclaims in certain jurisdictions to recover a portion of amounts previously withheld. The Funds may record a reclaim receivable based on collectability, which includes factors such as the jurisdiction’s applicable laws, payment history and market convention. The Statements of Operations includes tax reclaims recorded as well as professional and other fees, if any, associated with recovery of foreign withholding taxes.
Collateralization: If required by an exchange or counterparty agreement, the Funds may be required to deliver/deposit cash and/or securities to/with an exchange, or broker-dealer or custodian as collateral for certain investments.
In-kind Redemptions: For financial reporting purposes, in-kind redemptions are treated as sales of securities resulting in realized capital gains or losses to the Funds. Because such gains or losses are not taxable to the Funds and are not distributed to existing Fund shareholders, the gains or losses are reclassified from accumulated net realized gain (loss) to paid-in capital at the end of the Funds’ tax year. These reclassifications have no effect on net assets or net asset value (“NAV”) per share.
| 32 | 2 0 2 3 I SHARES ANNUAL REPORT TO SHAREHOLDERS |
| Notes to Financial Statements (continued) |
Distributions: Dividends and distributions paid by each Fund are recorded on the ex-dividend dates. Distributions are determined on a tax basis and may differ from net investment income and net realized capital gains for financial reporting purposes. Dividends and distributions are paid in U.S. dollars and cannot be automatically reinvested in additional shares of the Funds. The character and timing of distributions are determined in accordance with U.S. federal income tax regulations, which may differ from U.S. GAAP.
Indemnifications: In the normal course of business, each Fund enters into contracts that contain a variety of representations that provide general indemnification. The Funds’ maximum exposure under these arrangements is unknown because it involves future potential claims against the Funds, which cannot be predicted with any certainty.
| 3. | INVESTMENT VALUATION AND FAIR VALUE MEASUREMENTS |
Investment Valuation Policies: Each Fund’s investments are valued at fair value (also referred to as “market value” within the financial statements) each day that the Fund’s listing exchange is open and, for financial reporting purposes, as of the report date. U.S. GAAP defines fair value as the price a fund would receive to sell an asset or pay to transfer a liability in an orderly transaction between market participants at the measurement date. The Board of Trustees of the Trust (the “Board”) of each Fund has approved the designation of BlackRock Fund Advisors (“BFA”), the Funds’ investment adviser, as the valuation designee for each Fund. Each Fund determines the fair values of its financial instruments using various independent dealers or pricing services under BFA’s policies. If a security’s market price is not readily available or does not otherwise accurately represent the fair value of the security, the security will be valued in accordance with BFA’s policies and procedures as reflecting fair value. BFA has formed a committee (the “Valuation Committee”) to develop pricing policies and procedures and to oversee the pricing function for all financial instruments, with assistance from other BlackRock pricing committees.
Fair Value Inputs and Methodologies: The following methods and inputs are used to establish the fair value of each Fund’s assets and liabilities:
| • | Equity investments traded on a recognized securities exchange are valued at that day’s official closing price, as applicable, on the exchange where the stock is primarily traded. Equity investments traded on a recognized exchange for which there were no sales on that day are valued at the last traded price. |
| • | Investments in open-end U.S. mutual funds (including money market funds) are valued at that day’s published NAV. |
| • | Futures contracts are valued based on that day’s last reported settlement or trade price on the exchange where the contract is traded. |
Generally, trading in foreign instruments is substantially completed each day at various times prior to the close of trading on the New York Stock Exchange (“NYSE”). Each business day, the Funds use current market factors supplied by independent pricing services to value certain foreign instruments (“Systematic Fair Value Price”). The Systematic Fair Value Price is designed to value such foreign securities at fair value as of the close of trading on the NYSE, which follows the close of the local markets.
If events (e.g., market volatility, company announcement or a natural disaster) occur that are expected to materially affect the value of such investment, or in the event that application of these methods of valuation results in a price for an investment that is deemed not to be representative of the market value of such investment, or if a price is not available, the investment will be valued by the Valuation Committee, in accordance with BFA’s policies and procedures as reflecting fair value (“Fair Valued Investments”). The fair valuation approaches that may be used by the Valuation Committee include market approach, income approach and cost approach. Valuation techniques such as discounted cash flow, use of market comparables and matrix pricing are types of valuation approaches and are typically used in determining fair value. When determining the price for Fair Valued Investments, the Valuation Committee seeks to determine the price that each Fund might reasonably expect to receive or pay from the current sale or purchase of that asset or liability in an arm’s-length transaction. Fair value determinations shall be based upon all available factors that the Valuation Committee deems relevant and consistent with the principles of fair value measurement.
Fair value pricing could result in a difference between the prices used to calculate a fund’s NAV and the prices used by the fund’s underlying index, which in turn could result in a difference between the fund’s performance and the performance of the fund’s underlying index.
Fair Value Hierarchy: Various inputs are used in determining the fair value of financial instruments. These inputs to valuation techniques are categorized into a fair value hierarchy consisting of three broad levels for financial reporting purposes as follows:
| • | Level 1 – Unadjusted price quotations in active markets/exchanges for identical assets or liabilities that each Fund has the ability to access; |
| • | Level 2 – Other observable inputs (including, but not limited to, quoted prices for similar assets or liabilities in markets that are active, quoted prices for identical or similar assets or liabilities in markets that are not active, inputs other than quoted prices that are observable for the assets or liabilities (such as interest rates, yield curves, volatilities, prepayment speeds, loss severities, credit risks and default rates) or other market-corroborated inputs); and |
| • | Level 3 – Unobservable inputs based on the best information available in the circumstances, to the extent observable inputs are not available, (including the Valuation Committee’s assumptions used in determining the fair value of financial instruments). |
The hierarchy gives the highest priority to unadjusted quoted prices in active markets for identical assets or liabilities (Level 1 measurements) and the lowest priority to unobservable inputs (Level 3 measurements). Accordingly, the degree of judgment exercised in determining fair value is greatest for instruments categorized in Level 3. The inputs used to measure fair value may fall into different levels of the fair value hierarchy. In such cases, for disclosure purposes, the fair value hierarchy classification is determined based on the lowest level input that is significant to the fair value measurement in its entirety. Investments classified within Level 3 have significant unobservable inputs used by the Valuation Committee in determining the price for Fair Valued Investments. Level 3 investments include equity or debt issued by privately held companies
NOTES TO FINANCIAL STATEMENTS | 33 |
| Notes to Financial Statements (continued) |
or funds that may not have a secondary market and/or may have a limited number of investors. The categorization of a value determined for financial instruments is based on the pricing transparency of the financial instruments and is not necessarily an indication of the risks associated with investing in those securities.
| 4. | SECURITIES AND OTHER INVESTMENTS |
Securities Lending: Each Fund may lend its securities to approved borrowers, such as brokers, dealers and other financial institutions. The borrower pledges and maintains with the Fund collateral consisting of cash, an irrevocable letter of credit issued by an approved bank, or securities issued or guaranteed by the U.S. government. The initial collateral received by each Fund is required to have a value of at least 102% of the current market value of the loaned securities for securities traded on U.S. exchanges and a value of at least 105% for all other securities. The collateral is maintained thereafter at a value equal to at least 100% of the current value of the securities on loan. The market value of the loaned securities is determined at the close of each business day of the Fund and any additional required collateral is delivered to the Fund or excess collateral is returned by the Fund, on the next business day. During the term of the loan, each Fund is entitled to all distributions made on or in respect of the loaned securities but does not receive interest income on securities received as collateral. Loans of securities are terminable at any time and the borrower, after notice, is required to return borrowed securities within the standard time period for settlement of securities transactions.
As of period end, any securities on loan were collateralized by cash and/or U.S. Government obligations. Cash collateral invested in money market funds managed by BFA, or its affiliates is disclosed in the Schedule of Investments. Any non-cash collateral received cannot be sold, re-invested or pledged by the Fund, except in the event of borrower default. The securities on loan, if any, are also disclosed in each Fund’s Schedule of Investments. The market value of any securities on loan and the value of any related cash collateral are disclosed in the Statements of Assets and Liabilities.
Securities lending transactions are entered into by the Funds under Master Securities Lending Agreements (each, an “MSLA”) which provide the right, in the event of default (including bankruptcy or insolvency) for the non-defaulting party to liquidate the collateral and calculate a net exposure to the defaulting party or request additional collateral. In the event that a borrower defaults, the Funds, as lender, would offset the market value of the collateral received against the market value of the securities loaned. When the value of the collateral is greater than that of the market value of the securities loaned, the lender is left with a net amount payable to the defaulting party. However, bankruptcy or insolvency laws of a particular jurisdiction may impose restrictions on or prohibitions against such a right of offset in the event of an MSLA counterparty’s bankruptcy or insolvency. Under the MSLA, absent an event of default, the borrower can resell or re-pledge the loaned securities, and the Funds can reinvest cash collateral received in connection with loaned securities. Upon an event of default, the parties’ obligations to return the securities or collateral to the other party are extinguished, and the parties can resell or re-pledge the loaned securities or the collateral received in connection with the loaned securities in order to satisfy the defaulting party’s net payment obligation for all transactions under the MSLA. The defaulting party remains liable for any deficiency.
As of period end, the following table is a summary of the securities on loan by counterparty which are subject to offset under an MSLA:
| ||||||||||||||||
iShares ETF and Counterparty | | Securities Loaned at Value | | | Cash Collateral Received | (a) | | Non-Cash Collateral Received, at Fair Value | (a) | Net Amount | ||||||
| ||||||||||||||||
Global 100 | ||||||||||||||||
Barclays Bank PLC | $ | 582,061 | $ | (582,061 | ) | $ | — | $ | — | |||||||
|
|
|
|
|
|
|
| |||||||||
Global Infrastructure | ||||||||||||||||
BNP Paribas SA | $ | 689,227 | $ | (689,227 | ) | $ | — | $ | — | |||||||
BofA Securities, Inc. | 76,353 | (76,353 | ) | — | — | |||||||||||
HSBC Bank PLC | 43,831 | (43,831 | ) | — | — | |||||||||||
J.P. Morgan Securities LLC | 1,839,432 | (1,839,432 | ) | — | — | |||||||||||
Macquarie Bank Limited | 2,719,014 | (2,719,014 | ) | — | — | |||||||||||
Morgan Stanley & Co. LLC | 1,795,392 | (1,576,185 | ) | — | 219,207 | (b) | ||||||||||
|
|
|
|
|
|
|
| |||||||||
| $ | 7,163,249 | $ | (6,944,042 | ) | $ | — | $ | 219,207 | ||||||||
|
|
|
|
|
|
|
| |||||||||
Global Timber & Forestry | ||||||||||||||||
BofA Securities, Inc. | $ | 247,061 | $ | (247,061 | ) | $ | — | $ | — | |||||||
J.P. Morgan Securities LLC | 369,802 | (369,802 | ) | — | — | |||||||||||
|
|
|
|
|
|
|
| |||||||||
| $ | 616,863 | $ | (616,863 | ) | $ | — | $ | — | ||||||||
|
|
|
|
|
|
|
| |||||||||
| (a) | Collateral received, if any, in excess of the market value of securities on loan is not presented in this table. The total cash collateral received by each Fund is disclosed in the Fund’s Statements of Assets and Liabilities. |
| (b) | The market value of the loaned securities is determined as of March 31, 2023. Additional collateral is delivered to the Fund on the next business day in accordance with the MSLA. The net amount would be subject to the borrower default indemnity in the event of default by a counterparty. |
The risks of securities lending include the risk that the borrower may not provide additional collateral when required or may not return the securities when due. To mitigate these risks, each Fund benefits from a borrower default indemnity provided by BlackRock, Inc. (“BlackRock”). BlackRock’s indemnity allows for full replacement of the securities loaned to the extent the collateral received does not cover the value of the securities loaned in the event of borrower default. Each Fund could incur a loss if the value of an investment purchased with cash collateral falls below the market value of the loaned securities or if the value of an investment purchased with cash collateral falls below the value of the original cash collateral received. Such losses are borne entirely by each Fund.
| 34 | 2 0 2 3 I SHARES ANNUAL REPORT TO SHAREHOLDERS |
| Notes to Financial Statements (continued) |
| 5. | DERIVATIVE FINANCIAL INSTRUMENTS |
Futures Contracts: Futures contracts are purchased or sold to gain exposure to, or manage exposure to, changes in interest rates (interest rate risk) and changes in the value of equity securities (equity risk) or foreign currencies (foreign currency exchange rate risk).
Futures contracts are exchange-traded agreements between the Funds and a counterparty to buy or sell a specific quantity of an underlying instrument at a specified price and on a specified date. Depending on the terms of a contract, it is settled either through physical delivery of the underlying instrument on the settlement date or by payment of a cash amount on the settlement date. Upon entering into a futures contract, the Funds are required to deposit initial margin with the broker in the form of cash or securities in an amount that varies depending on a contract’s size and risk profile. The initial margin deposit must then be maintained at an established level over the life of the contract. Amounts pledged, which are considered restricted, are included in cash pledged for futures contracts in the Statements of Assets and Liabilities.
Securities deposited as initial margin are designated in the Schedule of Investments and cash deposited, if any, are shown as cash pledged for futures contracts in the Statements of Assets and Liabilities. Pursuant to the contract, the Funds agree to receive from or pay to the broker an amount of cash equal to the daily fluctuation in market value of the contract (“variation margin”). Variation margin is recorded as unrealized appreciation (depreciation) and, if any, shown as variation margin receivable (or payable) on futures contracts in the Statements of Assets and Liabilities. When the contract is closed, a realized gain or loss is recorded in the Statements of Operations equal to the difference between the notional amount of the contract at the time it was opened and the notional amount at the time it was closed. The use of futures contracts involves the risk of an imperfect correlation in the movements in the price of futures contracts and interest rates, foreign currency exchange rates or underlying assets.
| 6. | INVESTMENT ADVISORY AGREEMENT AND OTHER TRANSACTIONS WITH AFFILIATES |
Investment Advisory Fees: Pursuant to an Investment Advisory Agreement with the Trust, BFA manages the investment of each Fund’s assets. BFA is a California corporation indirectly owned by BlackRock. Under the Investment Advisory Agreement, BFA is responsible for substantially all expenses of the Funds, except (i) interest and taxes; (ii) brokerage commissions and other expenses connected with the execution of portfolio transactions; (iii) distribution fees; (iv) the advisory fee payable to BFA; and (v) litigation expenses and any extraordinary expenses (in each case as determined by a majority of the independent trustees).
For its investment advisory services to each of the following Funds, BFA is entitled to an annual investment advisory fee, accrued daily and paid monthly by the Funds, based on the average daily net assets of each Fund as follows:
| iShares ETF | Investment Advisory Fees | |||
Environmental Infrastructure and Industrials | 0.47 | % | ||
Global 100 | 0.40 | |||
For its investment advisory services to each of the iShares Global Infrastructure and iShares Global Timber & Forestry ETFs, BFA is entitled to an annual investment advisory fee, accrued daily and paid monthly by the Funds, based on each Fund’s allocable portion of the aggregate of the average daily net assets of the Fund and certain other iShares funds as follows:
| Aggregate Average Daily Net Assets | Investment Advisory Fees | |||
First $10 billion | 0.4800 | % | ||
Over $10 billion, up to and including $20 billion | 0.4300 | |||
Over $20 billion, up to and including $30 billion | 0.3800 | |||
Over $30 billion, up to and including $40 billion | 0.3420 | |||
Over $40 billion | 0.3078 | |||
Distributor: BlackRock Investments, LLC, an affiliate of BFA, is the distributor for each Fund. Pursuant to the distribution agreement, BFA is responsible for any fees or expenses for distribution services provided to the Funds.
Securities Lending: The U.S. Securities and Exchange Commission (the “SEC”) has issued an exemptive order which permits BlackRock Institutional Trust Company, N.A. (“BTC”), an affiliate of BFA, to serve as securities lending agent for the Funds, subject to applicable conditions. As securities lending agent, BTC bears all operational costs directly related to securities lending, including any custodial costs. Each Fund is responsible for fees in connection with the investment of cash collateral received for securities on loan (the “collateral investment fees”). The cash collateral is invested in a money market fund, BlackRock Cash Funds: Institutional or BlackRock Cash Funds: Treasury, managed by BFA, or its affiliates. However, BTC has agreed to reduce the amount of securities lending income it receives in order to effectively limit the collateral investment fees each Fund bears to an annual rate of 0.04%. The SL Agency Shares of such money market fund will not be subject to a sales load, distribution fee or service fee. The money market fund in which the cash collateral has been invested may, under certain circumstances, impose a liquidity fee of up to 2% of the value redeemed or temporarily restrict redemptions for up to 10 business days during a 90 day period, in the event that the money market fund’s weekly liquid assets fall below certain thresholds.
Securities lending income is equal to the total of income earned from the reinvestment of cash collateral, net of fees and other payments to and from borrowers of securities, and less the collateral investment fees. Each Fund retains a portion of securities lending income and remits the remaining portion to BTC as compensation for its services as securities lending agent.
Pursuant to the current securities lending agreement, the iShares Global 100 ETF (the “Group 1 Fund”), retains 81% of securities lending income (which excludes collateral investment fees) and the amount retained can never be less than 70% of the total of securities lending income plus the collateral investment fees.
NOTES TO FINANCIAL STATEMENTS | 35 |
| Notes to Financial Statements (continued) |
Pursuant to the current securities lending agreement, the iShares Environmental Infrastructure and Industrials ETF. iShares Global Infrastructure ETF and iShares Global Timber & Forestry ETF(the “Group 2 Fund”), retains 82% of securities lending income (which excludes collateral investment fees) and the amount retained can never be less than 70% of the total of securities lending income plus the collateral investment fees.
In addition, commencing the business day following the date that the aggregate securities lending income plus the collateral investment fees generated across all 1940 Act iShares exchange-traded funds (the “iShares ETF Complex”) in a given calendar year exceeds a specified threshold: (1) the Group 1 Fund, pursuant to the securities lending agreement, will retain for the remainder of that calendar year 81% of securities lending income (which excludes collateral investment fees), and the amount retained can never be less than 70% of the total of securities lending income plus the collateral investment fees, and (2) each Group 2 Fund will retain for the remainder of that calendar year 85% of securities lending income (which excludes collateral investment fees), and the amount retained can never be less than 70% of the total of securities lending income plus the collateral investment fees.
The share of securities lending income earned by each Fund is shown as securities lending income – affiliated – net in its Statements of Operations. For the year ended March 31, 2023, the Funds paid BTC the following amounts for securities lending agent services:
| iShares ETF | Amounts | |||
Environmental Infrastructure and Industrials | $ | 2 | ||
Global 100 | 11,635 | |||
Global Infrastructure | 71,754 | |||
Global Timber & Forestry | 4,910 | |||
Officers and Trustees: Certain officers and/or trustees of the Trust are officers and/or trustees of BlackRock or its affiliates.
Other Transactions: Cross trading is the buying or selling of portfolio securities between funds to which BFA (or an affiliate) serves as investment adviser. At its regularly scheduled quarterly meetings, the Board reviews such transactions as of the most recent calendar quarter for compliance with the requirements and restrictions set forth by Rule 17a-7.
For the year ended March 31, 2023, transactions executed by the Funds pursuant to Rule 17a-7 under the 1940 Act were as follows:
| iShares ETF | Purchases | Sales | Net Realized Gain (Loss) | |||||||||
Global 100 | $ | 18,169,944 | $ | 11,582,837 | $ | (6,722,081 | ) | |||||
Global Infrastructure | 6,575,076 | 14,633,680 | (3,281,391 | ) | ||||||||
Global Timber & Forestry | 2,729,869 | 2,431,572 | (234,766 | ) | ||||||||
Each Fund may invest its positive cash balances in certain money market funds managed by BFA or an affiliate. The income earned on these temporary cash investments is shown as dividends – affiliated in the Statements of Operations.
A fund, in order to improve its portfolio liquidity and its ability to track its underlying index, may invest in shares of other iShares funds that invest in securities in the fund’s underlying index.
| 7. | PURCHASES AND SALES |
For the year ended March 31, 2023, purchases and sales of investments, excluding short-term securities and in-kind transactions, were as follows:
| iShares ETF | Purchases | Sales | ||||||
Environmental Infrastructure and Industrials | $ | 753,978 | $ | 748,497 | ||||
Global 100 | 130,298,506 | 85,575,066 | ||||||
Global Infrastructure | 736,377,585 | 659,281,717 | ||||||
Global Timber & Forestry | 72,589,924 | 76,355,842 | ||||||
For the year ended March 31, 2023, in-kind transactions were as follows:
| iShares ETF | In-kind Purchases | In-kind Sales | ||||||
Environmental Infrastructure and Industrials | $ | 4,010,012 | $ | — | ||||
Global 100 | 338,242,775 | 311,132,004 | ||||||
Global Infrastructure | 926,884,181 | 401,111,730 | ||||||
Global Timber & Forestry | — | 49,644,281 | ||||||
| 36 | 2 0 2 3 I SHARES ANNUAL REPORT TO SHAREHOLDERS |
| Notes to Financial Statements (continued) |
| 8. | INCOME TAX INFORMATION |
Each Fund is treated as an entity separate from the Trust’s other funds for federal income tax purposes. It is each Fund’s policy to comply with the requirements of the Internal Revenue Code of 1986, as amended, applicable to regulated investment companies, and to distribute substantially all of its taxable income to its shareholders. Therefore, no U.S. federal income tax provision is required.
Management has analyzed tax laws and regulations and their application to the Funds as of March 31, 2023, inclusive of the open tax return years, and does not believe that there are any uncertain tax positions that require recognition of a tax liability in the Funds’ financial statements.
U.S. GAAP requires that certain components of net assets be adjusted to reflect permanent differences between financial and tax reporting. These reclassifications have no effect on net assets or NAV per share. As of March 31, 2023, permanent differences attributable to realized gains (losses) from in-kind redemptions were reclassified to the following accounts:
| iShares ETF | Paid-in Capital | Accumulated Earnings (Loss) | ||||||
Global 100 | $ | 170,781,074 | $ | (170,781,074 | ) | |||
Global Infrastructure | 92,715,152 | (92,715,152 | ) | |||||
Global Timber & Forestry | 3,821,265 | (3,821,265 | ) | |||||
The tax character of distributions paid was as follows:
| ||||
| iShares ETF | Period Ended 03/31/23 | |||
| ||||
Environmental Infrastructure and Industrials | ||||
Ordinary income | $ | 5,790 | ||
|
| |||
| ||||||||
| iShares ETF | Year Ended 03/31/23 | Year Ended 03/31/22 | ||||||
| ||||||||
Global 100 | ||||||||
Ordinary income | $ | 66,133,768 | $ | 56,448,560 | ||||
|
|
|
| |||||
Global Infrastructure | ||||||||
Ordinary income | $ | 92,664,851 | $ | 76,469,201 | ||||
|
|
|
| |||||
Global Timber & Forestry | ||||||||
Ordinary income | $ | 5,674,714 | $ | 4,841,317 | ||||
|
|
|
| |||||
As of March 31, 2023, the tax components of accumulated net earnings (losses) were as follows:
| iShares ETF | | Undistributed Ordinary Income |
| | Non-expiring Capital Loss Carryforwards |
(a) | | Net Unrealized Gains (Losses) | (b) | Total | ||||||
Environmental Infrastructure and Industrials | $ | 12,995 | $ | (33,072 | ) | $ | 406,268 | $ | 386,191 | |||||||
Global 100 | 19,770,814 | (138,980,093 | ) | 793,406,498 | 674,197,219 | |||||||||||
Global Infrastructure | 17,618,492 | (370,265,257 | ) | 234,159,640 | (118,487,125 | ) | ||||||||||
Global Timber & Forestry | 29,586 | (27,091,323 | ) | (30,721,313 | ) | (57,783,050 | ) | |||||||||
| (a) | Amounts available to offset future realized capital gains. |
| (b) | The difference between book-basis and tax-basis unrealized gains (losses) was attributable primarily to the tax deferral of losses on wash sales, the realization for tax purposes of unrealized gains (losses) on certain futures contracts, the characterization of corporate actions and the realization for tax purposes of unrealized gains on investments in passive foreign investment companies. |
A fund may own shares in certain foreign investment entities, referred to, under U.S. tax law, as “passive foreign investment companies.” Such fund may elect to mark-to-market annually the shares of each passive foreign investment company and would be required to distribute to shareholders any such marked-to-market gains.
NOTES TO FINANCIAL STATEMENTS | 37 |
| Notes to Financial Statements (continued) |
As of March 31, 2023, gross unrealized appreciation and depreciation based on cost of investments (including short positions and derivatives, if any) for U.S. federal income tax purposes were as follows:
| iShares ETF | Tax Cost | Gross Unrealized Appreciation | Gross Unrealized Depreciation | Net Unrealized Appreciation (Depreciation) | ||||||||||||
Environmental Infrastructure and Industrials | $ | 3,981,429 | $ | 458,265 | $ | (52,098 | ) | $ | 406,167 | |||||||
Global 100 | 2,802,627,816 | 997,547,403 | (204,114,212 | ) | 793,433,191 | |||||||||||
Global Infrastructure | 3,596,689,989 | 413,110,635 | (178,948,178 | ) | 234,162,457 | |||||||||||
Global Timber & Forestry | 231,660,638 | 9,022,380 | (39,720,542 | ) | (30,698,162 | ) | ||||||||||
| 9. | LINE OF CREDIT |
The iShares Environmental Infrastructure and Industrials ETF, iShares Global 100 ETF, iShares Global Infrastructure ETF and iShares Global Timber & Forestry ETF, along with certain other iShares funds (“Participating Funds”), are parties to a $800 million credit agreement (“Syndicated Credit Agreement”) with a group of lenders, which expires on August 11, 2023. The line of credit may be used for temporary or emergency purposes, including redemptions, settlement of trades and rebalancing of portfolio holdings in certain target markets. The Funds may borrow up to the aggregate commitment amount subject to asset coverage and other limitations as specified in the Syndicated Credit Agreement. The Syndicated Credit Agreement has the following terms: a commitment fee of 0.15% per annum on the unused portion of the credit agreement and interest at a rate equal to the higher of (a) Daily Simple Secured Overnight Financing Rate (“SOFR”) plus 0.10% and 1.00% per annum or (b) the U.S. Federal Funds rate plus 1.00% per annum on amounts borrowed. The commitment fee is generally allocated to each Participating Fund based on the lesser of a Participating Fund’s relative exposure to certain target markets or a Participating Fund’s maximum borrowing amount as set forth by the terms of the Syndicated Credit Agreement.
During the year ended March 31, 2023, the Funds did not borrow under the Syndicated Credit Agreement.
| 10. | PRINCIPAL RISKS |
In the normal course of business, each Fund invests in securities or other instruments and may enter into certain transactions, and such activities subject the Fund to various risks, including, among others, fluctuations in the market (market risk) or failure of an issuer to meet all of its obligations. The value of securities or other instruments may also be affected by various factors, including, without limitation: (i) the general economy; (ii) the overall market as well as local, regional or global political and/or social instability; (iii) regulation, taxation or international tax treaties between various countries; or (iv) currency, interest rate or price fluctuations. Local, regional or global events such as war, acts of terrorism, the spread of infectious illness or other public health issues, recessions, or other events could have a significant impact on the Funds and their investments. Each Fund’s prospectus provides details of the risks to which the Fund is subject.
BFA uses a “passive” or index approach to try to achieve each Fund’s investment objective following the securities included in its underlying index during upturns as well as downturns. BFA does not take steps to reduce market exposure or to lessen the effects of a declining market. Divergence from the underlying index and the composition of the portfolio is monitored by BFA.
The Funds may be exposed to additional risks when reinvesting cash collateral in money market funds that do not seek to maintain a stable NAV per share of $1.00, which may be subject to redemption gates or liquidity fees under certain circumstances.
Infectious Illness Risk: An outbreak of an infectious illness, such as the COVID-19 pandemic, may adversely impact the economies of many nations and the global economy, and may impact individual issuers and capital markets in ways that cannot be foreseen. An infectious illness outbreak may result in, among other things, closed international borders, prolonged quarantines, supply chain disruptions, market volatility or disruptions and other significant economic, social and political impacts.
Valuation Risk: The market values of equities, such as common stocks and preferred securities or equity related investments, such as futures and options, may decline due to general market conditions which are not specifically related to a particular company. They may also decline due to factors which affect a particular industry or industries. A fund may invest in illiquid investments. An illiquid investment is any investment that a fund reasonably expects cannot be sold or disposed of in current market conditions in seven calendar days or less without the sale or disposition significantly changing the market value of the investment. A fund may experience difficulty in selling illiquid investments in a timely manner at the price that it believes the investments are worth. Prices may fluctuate widely over short or extended periods in response to company, market or economic news. Markets also tend to move in cycles, with periods of rising and falling prices. This volatility may cause a fund’s NAV to experience significant increases or decreases over short periods of time. If there is a general decline in the securities and other markets, the NAV of a fund may lose value, regardless of the individual results of the securities and other instruments in which a fund invests.
Counterparty Credit Risk: The Funds may be exposed to counterparty credit risk, or the risk that an entity may fail to or be unable to perform on its commitments related to unsettled or open transactions, including making timely interest and/or principal payments or otherwise honoring its obligations. The Funds manage counterparty credit risk by entering into transactions only with counterparties that BFA believes have the financial resources to honor their obligations and by monitoring the financial stability of those counterparties. Financial assets, which potentially expose the Funds to market, issuer and counterparty credit risks, consist principally of financial instruments and receivables due from counterparties. The extent of the Funds’ exposure to market, issuer and counterparty credit risks with respect to these financial assets is approximately their value recorded in the Statements of Assets and Liabilities, less any collateral held by the Funds.
| 38 | 2 0 2 3 I SHARES ANNUAL REPORT TO SHAREHOLDERS |
| Notes to Financial Statements (continued) |
A derivative contract may suffer a mark-to-market loss if the value of the contract decreases due to an unfavorable change in the market rates or values of the underlying instrument. Losses can also occur if the counterparty does not perform under the contract.
With exchange-traded futures, there is less counterparty credit risk to the Funds since the exchange or clearinghouse, as counterparty to such instruments, guarantees against a possible default. The clearinghouse stands between the buyer and the seller of the contract; therefore, credit risk is limited to failure of the clearinghouse. While offset rights may exist under applicable law, a fund does not have a contractual right of offset against a clearing broker or clearinghouse in the event of a default (including the bankruptcy or insolvency). Additionally, credit risk exists in exchange-traded futures with respect to initial and variation margin that is held in a clearing broker’s customer accounts. While clearing brokers are required to segregate customer margin from their own assets, in the event that a clearing broker becomes insolvent or goes into bankruptcy and at that time there is a shortfall in the aggregate amount of margin held by the clearing broker for all its clients, typically the shortfall would be allocated on a pro rata basis across all the clearing broker’s customers, potentially resulting in losses to the Funds.
Concentration Risk: A diversified portfolio, where this is appropriate and consistent with a fund’s objectives, minimizes the risk that a price change of a particular investment will have a material impact on the NAV of a fund. The investment concentrations within each Fund’s portfolio are disclosed in its Schedule of Investments.
Certain Funds invest a significant portion of their assets in securities of issuers located in Europe or with significant exposure to European issuers or countries. The European financial markets have recently experienced volatility and adverse trends due to concerns about economic downturns in, or rising government debt levels of, several European countries as well as acts of war in the region. These events may spread to other countries in Europe and may affect the value and liquidity of certain of the Funds’ investments.
Responses to the financial problems by European governments, central banks and others, including austerity measures and reforms, may not work, may result in social unrest and may limit future growth and economic recovery or have other unintended consequences. Further defaults or restructurings by governments and others of their debt could have additional adverse effects on economies, financial markets and asset valuations around the world. The United Kingdom has withdrawn from the European Union, and one or more other countries may withdraw from the European Union and/or abandon the Euro, the common currency of the European Union. These events and actions have adversely affected, and may in the future adversely affect, the value and exchange rate of the Euro and may continue to significantly affect the economies of every country in Europe, including countries that do not use the Euro and non-European Union member states. The impact of these actions, especially if they occur in a disorderly fashion, is not clear but could be significant and far reaching. In addition, Russia launched a large-scale invasion of Ukraine on February 24, 2022. The extent and duration of the military action, resulting sanctions and resulting future market disruptions in the region are impossible to predict, but have been, and may continue to be significant and have a severe adverse effect on the region, including significant negative impacts on the economy and the markets for certain securities and commodities, such as oil and natural gas, as well as other sectors.
Certain Funds invest a significant portion of their assets in securities within a single or limited number of market sectors. When a fund concentrates its investments in this manner, it assumes the risk that economic, regulatory, political and social conditions affecting such sectors may have a significant impact on the fund and could affect the income from, or the value or liquidity of, the fund’s portfolio.
Significant Shareholder Redemption Risk: Certain shareholders may own or manage a substantial amount of fund shares and/or hold their fund investments for a limited period of time. Large redemptions of fund shares by these shareholders may force a fund to sell portfolio securities, which may negatively impact the fund’s NAV, increase the fund’s brokerage costs, and/or accelerate the realization of taxable income/gains and cause the fund to make additional taxable distributions to shareholders.
| 11. | CAPITAL SHARE TRANSACTIONS |
Capital shares are issued and redeemed by each Fund only in aggregations of a specified number of shares or multiples thereof (“Creation Units”) at NAV. Except when aggregated in Creation Units, shares of each Fund are not redeemable.
Transactions in capital shares were as follows:
| ||||||||
Period Ended 03/31/23(a) | ||||||||
|
| |||||||
| iShares ETF | Shares | Amount | ||||||
| ||||||||
Environmental Infrastructure and Industrials | ||||||||
Shares sold | 160,000 | $ | 4,016,012 | |||||
|
|
|
| |||||
| (a) | The Fund commenced operations on November 01, 2022. |
| ||||||||||||||||||||
Year Ended 03/31/23 | Year Ended 03/31/22 | |||||||||||||||||||
|
|
|
| |||||||||||||||||
| iShares ETF | Shares | Amount | Shares | Amount | ||||||||||||||||
| ||||||||||||||||||||
Global 100 | ||||||||||||||||||||
Shares sold | 5,700,000 | $ | 385,994,005 | 8,550,000 | $ | 627,959,649 | ||||||||||||||
Shares redeemed | (4,850,000 | ) | (319,785,609 | ) | (3,050,000 | ) | (219,462,971 | ) | ||||||||||||
|
|
|
|
|
|
|
| |||||||||||||
| 850,000 | $ | 66,208,396 | 5,500,000 | $ | 408,496,678 | |||||||||||||||
|
|
|
|
|
|
|
| |||||||||||||
NOTES TO FINANCIAL STATEMENTS | 39 |
| Notes to Financial Statements (continued) |
| ||||||||||||||||||||
Year Ended 03/31/23 | Year Ended 03/31/22 | |||||||||||||||||||
|
|
|
| |||||||||||||||||
| iShares ETF | Shares | Amount | Shares | Amount | ||||||||||||||||
| ||||||||||||||||||||
Global Infrastructure | ||||||||||||||||||||
Shares sold | 21,600,000 | $ | 1,019,069,803 | 5,600,000 | $ | 265,747,265 | ||||||||||||||
Shares redeemed | (8,600,000 | ) | (405,678,975 | ) | (6,000,000 | ) | (285,255,635 | ) | ||||||||||||
|
|
|
|
|
|
|
| |||||||||||||
| 13,000,000 | $ | 613,390,828 | (400,000 | ) | $ | (19,508,370 | ) | |||||||||||||
|
|
|
|
|
|
|
| |||||||||||||
Global Timber & Forestry | ||||||||||||||||||||
Shares sold | — | $ | (1,137 | ) | 1,380,000 | $ | 129,168,563 | |||||||||||||
Shares redeemed | (720,000 | ) | (54,369,548 | ) | (1,740,000 | ) | (153,292,909 | ) | ||||||||||||
|
|
|
|
|
|
|
| |||||||||||||
| (720,000 | ) | $ | (54,370,685 | ) | (360,000 | ) | $ | (24,124,346 | ) | |||||||||||
|
|
|
|
|
|
|
| |||||||||||||
The consideration for the purchase of Creation Units of a fund in the Trust generally consists of the in-kind deposit of a designated portfolio of securities and a specified amount of cash. Certain funds in the Trust may be offered in Creation Units solely or partially for cash in U.S. dollars. Investors purchasing and redeeming Creation Units may pay a purchase transaction fee and a redemption transaction fee directly to State Street Bank and Trust Company, the Trust’s administrator, to offset transfer and other transaction costs associated with the issuance and redemption of Creation Units, including Creation Units for cash. Investors transacting in Creation Units for cash may also pay an additional variable charge to compensate the relevant fund for certain transaction costs (i.e., stamp taxes, taxes on currency or other financial transactions, and brokerage costs) and market impact expenses relating to investing in portfolio securities. Such variable charges, if any, are included in shares sold in the table above.
From time to time, settlement of securities related to in-kind contributions or in-kind redemptions may be delayed. In such cases, securities related to in-kind transactions are reflected as a receivable or a payable in the Statements of Assets and Liabilities.
| 12. | FOREIGN WITHHOLDING TAX CLAIMS |
The Internal Revenue Service (“IRS”) has issued guidance to address U.S. income tax liabilities attributable to fund shareholders resulting from the recovery of foreign taxes withheld in prior calendar years. These withheld foreign taxes were passed through to shareholders in the form of foreign tax credits in the year the taxes were withheld. Assuming there are sufficient foreign taxes paid which the iShares Global Infrastructure ETF is able to pass through to shareholders as a foreign tax credit in the current year, the Fund will be able to offset the prior years’ withholding taxes recovered against the foreign taxes paid in the current year. Accordingly, no federal income tax liability is recorded by the Fund.
The iShares Global 100 ETF is seeking a closing agreement with the Internal Revenue Service (“IRS”) to address any prior years’ U.S. income tax liabilities attributable to Fund shareholders resulting from the recovery of foreign taxes. The closing agreement would result in the Fund paying a compliance fee to the IRS, on behalf of its shareholders, representing the estimated tax savings generated from foreign tax credits claimed by Fund shareholders on their tax returns in prior years. The Fund has accrued a liability for the estimated IRS compliance fee related to foreign withholding tax claims, which is disclosed in the Statement of Assets and Liabilities. The actual IRS compliance fee may differ from the estimate and that difference may be material.
| 13. | SUBSEQUENT EVENTS |
Management has evaluated the impact of all subsequent events on the Funds through the date the financial statements were available to be issued and has determined that there were no subsequent events requiring adjustment or additional disclosure in the financial statements.
| 40 | 2 0 2 3 I SHARES ANNUAL REPORT TO SHAREHOLDERS |
Report of Independent Registered Public Accounting Firm
To the Board of Trustees of
iShares Trust and Shareholders of each of the four funds listed in the table below
Opinions on the Financial Statements
We have audited the accompanying statements of assets and liabilities, including the schedules of investments, of each of the funds listed in the table below (four of the funds constituting iShares Trust, hereafter collectively referred to as the “Funds”) as of March 31, 2023, the related statements of operations and of changes in net assets for each of the periods indicated in the table below, including the related notes, and the financial highlights for each of the periods indicated therein (collectively referred to as the “financial statements”). In our opinion, the financial statements present fairly, in all material respects, the financial position of each of the Funds as of March 31, 2023, the results of each of their operations and the changes in each of their net assets for the periods indicated in the table below, and each of the financial highlights for each of the periods indicated therein, in conformity with accounting principles generally accepted in the United States of America.
iShares Environmental Infrastructure and Industrials ETF(1) iShares Global 100 ETF(2) iShares Global Infrastructure ETF(2) iShares Global Timber & Forestry ETF(2) |
| (1) | Statement of operations and statement of changes in net assets for the period November 1, 2022 (commencement of operations) to March 31, 2023. |
| (2) | Statements of operations for the year ended March 31, 2023 and statements of changes in net assets for each of the two years in the period ended March 31, 2023. |
Basis for Opinions
These financial statements are the responsibility of the Funds’ management. Our responsibility is to express an opinion on the Funds’ financial statements based on our audits. We are a public accounting firm registered with the Public Company Accounting Oversight Board (United States) (PCAOB) and are required to be independent with respect to the Funds in accordance with the U.S. federal securities laws and the applicable rules and regulations of the Securities and Exchange Commission and the PCAOB.
We conducted our audits of these financial statements in accordance with the standards of the PCAOB. Those standards require that we plan and perform the audit to obtain reasonable assurance about whether the financial statements are free of material misstatement, whether due to error or fraud.
Our audits included performing procedures to assess the risks of material misstatement of the financial statements, whether due to error or fraud, and performing procedures that respond to those risks. Such procedures included examining, on a test basis, evidence regarding the amounts and disclosures in the financial statements. Our audits also included evaluating the accounting principles used and significant estimates made by management, as well as evaluating the overall presentation of the financial statements. Our procedures included confirmation of securities owned as of March 31, 2023 by correspondence with the custodian, transfer agent and brokers; when replies were not received from brokers, we performed other auditing procedures. We believe that our audits provide a reasonable basis for our opinions.
/s/PricewaterhouseCoopers LLP
Philadelphia, Pennsylvania
May 25, 2023
We have served as the auditor of one or more BlackRock investment companies since 2000.
REPORT OF INDEPENDENT REGISTERED PUBLIC ACCOUNTING FIRM | 41 |
| Important Tax Information (unaudited) |
The following amounts, or maximum amounts allowable by law, are hereby designated as qualified dividend income for individuals for the fiscal year ended March 31, 2023:
| iShares ETF | Qualified Dividend Income | |||
Environmental Infrastructure and Industrials | $ | 26,765 | ||
Global 100 | 83,155,055 | |||
Global Infrastructure | 113,451,966 | |||
Global Timber & Forestry | 3,912,298 | |||
The following amount, or maximum amount allowable by law, are hereby designated as qualified business income for individuals for the fiscal year ended March 31, 2023:
| iShares ETF | Qualified Business Income | |||
Global 100 | $ | 319,732 | ||
The Funds intend to pass through to their shareholders the following amounts, or maximum amounts allowable by law, of foreign source income earned and foreign taxes paid for the fiscal year ended March 31, 2023:
| iShares ETF | Foreign Source Income Earned | Foreign Taxes Paid | ||||||
Environmental Infrastructure and Industrials | $ | 15,292 | $ | 183 | ||||
Global Infrastructure | 81,875,964 | 7,422,358 | ||||||
Global Timber & Forestry | 5,622,955 | 192,308 | ||||||
The following percentage, or maximum percentage allowable by law, of ordinary income distributions paid during the fiscal year ended March 31, 2023 qualified for the dividends-received deduction for corporate shareholders:
| iShares ETF | Dividends-Received Deduction | |||
Environmental Infrastructure and Industrials | 64.36 | % | ||
Global 100 | 60.68 | % | ||
Global Infrastructure | 37.45 | % | ||
| 42 | 2 0 2 3 I SHARES ANNUAL REPORT TO SHAREHOLDERS |
Board Review and Approval of Investment Advisory Contract
iShares Environmental Infrastructure and Industrials ETF (each the “Fund”)
Under Section 15(c) of the Investment Company Act of 1940 (the “1940 Act”), the Trust’s Board of Trustees (the “Board”), including a majority of Board Members who are not “interested persons” of the Trust (as that term is defined in the 1940 Act) (the “Independent Board Members”), is required to consider and approve the proposed Investment Advisory Agreement between the Trust and BFA (the “Advisory Agreement”) on behalf of the Fund. The Independent Board Members requested, and BFA provided, such information as the Independent Board Members, with advice from independent counsel, deemed reasonably necessary to evaluate the terms of the proposed Advisory Agreement. At a meeting held on September 21-22, 2022, the Board, including the Independent Board Members, approved the selection of BFA as investment adviser and approved the proposed Advisory Agreement for the Fund, based on a review of qualitative and quantitative information provided by BFA. The Board also considered information previously provided by BFA, BlackRock Institutional Trust Company, N.A. (“BTC”), and BlackRock, Inc. (“BlackRock”), as applicable, at prior Board meetings. The Independent Board Members were advised by their independent counsel throughout the process, including about the legal standards applicable to their review. In approving the Advisory Agreement for the Fund, the Board, including the Independent Board Members, considered various factors, including: (i) the expenses of the Fund; (ii) the nature, extent and quality of the services to be provided by BFA; (iii) the costs of services to be provided to the Fund and the availability of information related to profits to be realized by BFA and its affiliates; (iv) potential economies of scale; (v) the fees and services provided for other comparable funds/accounts managed by BFA and its affiliates; and (vi) other benefits to BFA and/or its affiliates. The material factors, no one of which was controlling, and conclusions that formed the basis for the Board, including the Independent Board Members, to approve the Advisory Agreement are discussed below.
Expenses of the Fund: The Board reviewed statistical information prepared by Broadridge Financial Solutions Inc. (“Broadridge”), an independent provider of investment company data, regarding the expense ratio components of the Fund in comparison with the same information for other ETFs, objectively selected by Broadridge as comprising the Fund’s applicable expense peer group pursuant to Broadridge’s proprietary ETF methodology (the “Peer Group”). The Board was provided with a detailed description of the proprietary ETF methodology used by Broadridge to determine the Fund’s Peer Group. The Board noted that due to the limitations in providing comparable funds in the Peer Group, the statistical information provided in Broadridge’s report may or may not provide meaningful direct comparisons to the Fund in all instances.
The Board also noted that the investment advisory fee rate and overall expenses (net of waivers and reimbursements) for the Fund were lower than the median of the investment advisory fee rates and overall expenses (net of waivers and reimbursements) of the funds in its Peer Group, excluding iShares funds.
Based on this review, the other factors considered at the meeting, and their general knowledge of ETF pricing, the Board concluded that the investment advisory fee rate and expense level of the Fund supported the Board’s approval of the Advisory Agreement.
Nature, Extent and Quality of Services to be Provided by BFA: The Board reviewed the scope of services to be provided by BFA under the Advisory Agreement. In reviewing the scope of these services, the Board considered BFA’s investment philosophy and experience, noting that BFA and its affiliates have committed significant resources over time and have made significant investments into the iShares business to support the iShares funds and their shareholders. The Board considered representations by BFA, BTC, and BlackRock that the scope and quality of services to be provided to the Fund would be similar to the scope and quality of services provided to other iShares funds. The Board also considered BFA’s compliance program and its compliance record with respect to other iShares funds. In that regard, the Board noted that BFA reports to the Board about portfolio management and compliance matters on a periodic basis in connection with regularly scheduled meetings of the Board, and on other occasions as necessary and appropriate, and has provided information and made relevant officers and other employees of BFA (and its affiliates) available as needed to provide further assistance with these matters. The Board also reviewed the background and experience of the persons who will be responsible for the day-to-day management of the Fund, as well as the resources that will be available to them in managing the Fund. The Board also considered detailed presentations regarding BFA’s investment performance, investment and risk management processes and strategies, which were provided throughout the year with respect to other iShares funds, and other matters related to BFA’s portfolio compliance program.
Based on review of this information, the Board concluded that the nature, extent and quality of services to be provided to the Fund under the Advisory Agreement supported the Board’s approval of the Advisory Agreement.
Costs of Services to be Provided to the Fund and Profits to be Realized by BFA and Affiliates: The Board did not consider the profitability of the Fund to BFA based on the fees payable under the Advisory Agreement or revenue to be received by BFA or its affiliates in connection with services to be provided to the Fund since the proposed relationship had not yet commenced. The Board noted that it expects to receive profitability information from BFA periodically following the Fund’s launch and will thus be in a position to evaluate whether any new or additional breakpoints or other adjustments in Fund fees would be appropriate.
Economies of Scale: The Board considered information that it had previously received regarding potential economies of scale, efficiencies and scale benefits shared with the iShares funds through relatively low fee rates established at inception, breakpoints, waivers, or other fee reductions, as well as through additional investment in the iShares business and the provision of improved or additional infrastructure and services to the iShares funds and their shareholders. The Board noted that the Advisory Agreement for the Fund did not provide for breakpoints in the Fund’s investment advisory fee rate as the assets of the Fund increase. However, the Board noted that it would continue to assess the appropriateness of adding breakpoints in the future.
This consideration of potential economies of scale and the sharing of related benefits, as well as the other factors considered at the meeting, supported the Board’s approval of the Advisory Agreement.
Fees and Services Provided for Other Comparable Funds/Accounts Managed by BFA and its Affiliates: The Board received and considered information regarding the investment advisory/management fee rates for other funds/accounts in the U.S. for which BFA (or its affiliates) provides investment advisory/management services, including open-end funds registered under the 1940 Act (including sub-advised funds), collective trust funds, and institutional separate accounts (collectively, the “Other Accounts”). The Board acknowledged BFA’s representation that the iShares funds are fundamentally different investment vehicles from the Other Accounts. The Board noted that BFA and its affiliates do not manage Other Accounts with substantially the same investment objective and strategy as the Fund and that track the same index
BOARD REVIEW AND APPROVAL OF INVESTMENT ADVISORY CONTRACT | 43 |
Board Review and Approval of Investment Advisory Contract (continued)
as the Fund. The Board further noted that BFA previously provided the Board with detailed information regarding how the Other Accounts (particularly institutional clients) generally differ from the iShares funds, including in terms of the different and generally more extensive services provided to the iShares funds, as well as other significant differences. In that regard, the Board considered that the pricing of services to institutional clients is typically based on a number of factors beyond the nature and extent of the specific services to be provided and often depends on the overall relationship between the client and its affiliates and the adviser and its affiliates. In addition, the Board considered the relative complexity and inherent risks and challenges of managing and providing other services to the Fund, as a publicly traded investment vehicle, as compared to the Other Accounts, particularly those that are institutional clients, in light of differing regulatory requirements and client-imposed mandates. The Board considered the “all-inclusive” nature of the Fund’s advisory fee structure, and the Fund’s expenses borne by BFA under this arrangement.
Other Benefits to BFA and/or its Affiliates: Except as noted below, the Board did not consider the “fallout” benefits or ancillary revenue to be received by BFA and/or its affiliates in connection with the services to be provided to the Fund by BFA since the proposed relationship had not yet commenced. However, the Board noted that BFA generally does not use soft dollars or consider the value of research or other services that may be provided to BFA (including its affiliates) in selecting brokers for portfolio transactions for the Fund. The Board considered the potential payment of advisory fees and/or administration fees to BFA (or its affiliates) in connection with any investments by the Fund in other funds for which BFA (or its affiliates) provides investment advisory services and/or administration services. The Board also noted the potential revenue to be received by BFA and/or its affiliates pursuant to an agreement that would permit a service provider to use certain portions of BlackRock’s technology platform to service accounts managed by BFA and/or its affiliates, including the iShares funds. The Board also considered the potential for revenue to BTC, the Fund’s securities lending agent, and its affiliates in the event of any loaning of portfolio securities of the Fund. The Board concluded that any such ancillary benefits would not be disadvantageous to the Fund and thus would not alter the Board’s conclusion with respect to the appropriateness of approving the Advisory Agreement.
Conclusion: Based on a review of the factors described above, as well as such other factors as deemed appropriate by the Board, the Board, including all of the Independent Board Members, determined that the Fund’s investment advisory fee rate under the Advisory Agreement does not constitute a fee that is so disproportionately large as to bear no reasonable relationship to the services to be rendered and that could not have been the product of arm’s-length bargaining, and concluded to approve the Advisory Agreement.
| 44 | 2 0 2 3 I SHARES ANNUAL REPORT TO SHAREHOLDERS |
Statement Regarding Liquidity Risk Management Program (unaudited)
In compliance with Rule 22e-4 under the Investment Company Act of 1940, as amended (the “Liquidity Rule”), iShares Trust (the “Trust”) has adopted and implemented a liquidity risk management program (the “Program”) for iShares Global 100 ETF, iShares Global Infrastructure ETF and iShares Global Timber & Forestry ETF (the “Funds” or “ETFs”), each a series of the Trust, which is reasonably designed to assess and manage each Fund’s liquidity risk.
The Board of Trustees (the “Board”) of the Trust, on behalf of the Funds, met on December 9, 2022 (the “Meeting”) to review the Program. The Board previously appointed BlackRock Fund Advisors (“BlackRock”), the investment adviser to the Funds, as the program administrator for each Fund’s Program. BlackRock also previously delegated oversight of the Program to the 40 Act Liquidity Risk Management Committee (the “Committee”). At the Meeting, the Committee, on behalf of BlackRock, provided the Board with a report that addressed the operation of the Program and assessed its adequacy and effectiveness of implementation, including the management of each Fund’s Highly Liquid Investment Minimum (“HLIM”) where applicable, and any material changes to the Program (the “Report”). The Report covered the period from October 1, 2021 through September 30, 2022 (the “Program Reporting Period”).
The Report described the Program’s liquidity classification methodology for categorizing each Fund’s investments (including derivative transactions) into one of four liquidity buckets. It also referenced the methodology used by BlackRock to establish each Fund’s HLIM and noted that the Committee reviews and ratifies the HLIM assigned to each Fund no less frequently than annually. The Report also discussed notable events affecting liquidity over the Program Reporting Period, including extended market holidays, the imposition of capital controls in certain non-U.S. countries, Russian sanctions and the closure of the Russian securities market.
The Report noted that the Program complied with the key factors for consideration under the Liquidity Rule for assessing, managing and periodically reviewing each Fund’s liquidity risk, as follows:
| a) | The Fund’s investment strategy and liquidity of portfolio investments during both normal and reasonably foreseeable stressed conditions. During the Program Reporting Period, the Committee reviewed whether each Fund’s strategy is appropriate for an open-end fund structure, with a focus on funds with more significant and consistent holdings of less liquid and illiquid assets. The Committee also factored a fund’s concentration in an issuer into the liquidity classification methodology by taking issuer position sizes into account. Derivative exposure was also considered in the calculation of a fund’s liquidity bucketing. Finally, a factor for consideration under the Liquidity Rule is a Fund’s use of borrowings for investment purposes. However, the Funds do not borrow for investment purposes. |
| b) | Short-term and long-term cash flow projections during both normal and reasonably foreseeable stressed conditions. During the Program Reporting Period, the Committee reviewed historical redemption activity and used this information as a component to establish each ETF’s reasonably anticipated trading size (“RATS”). The Committee may also take into consideration a fund’s shareholder ownership concentration (which, depending on product type and distribution channel, may or may not be available), a fund’s distribution channels, and the degree of certainty associated with a fund’s short-term and long-term cash flow projections. |
| c) | Holdings of cash and cash equivalents, as well as borrowing arrangements. The Committee considered that ETFs generally do not hold more than de minimis amounts of cash. The Committee also considered that ETFs generally do not engage in borrowing. |
| d) | The relationship between an ETF’s portfolio liquidity and the way in which, and the prices and spreads at which, ETF shares trade, including the efficiency of the arbitrage function and the level of active participation by market participants, including authorized participants. The Committee monitored the prevailing bid/ask spread and the ETF price premium (or discount) to NAV for all ETFs. However, there were no ETFs with persistent deviations of fund premium/discount or bid/ask spreads from long-term averages over the Program Reporting Period. |
| e) | The effect of the composition of baskets on the overall liquidity of an ETF’s portfolio. In reviewing the linkage between the composition of custom baskets accepted by an ETF and any significant change in the liquidity profile of such ETF, the Committee reviewed changes in the proportion of each ETF’s portfolio comprised of less liquid and illiquid holdings to determine if applicable thresholds were met requiring enhanced review. |
There were no material changes to the Program during the Program Reporting Period other than the enhancement of certain model components in the Program’s classification methodology. The Report provided to the Board stated that the Committee concluded that based on the operation of the functions, as described in the Report, the Program is operating as intended and is effective in implementing the requirements of the Liquidity Rule.
STATEMENT REGARDING LIQUIDITY RISK MANAGEMENT PROGRAM | 45 |
Supplemental Information (unaudited)
Section 19(a) Notices
The amounts and sources of distributions reported are estimates and are being provided pursuant to regulatory requirements and are not being provided for tax reporting purposes. The actual amounts and sources for tax reporting purposes will depend upon each Fund’s investment experience during the year and may be subject to changes based on tax regulations. Shareholders will receive a Form 1099-DIV each calendar year that will inform them how to report these distributions for federal income tax purposes.
March 31, 2023
Total Cumulative Distributions for the Fiscal Year | % Breakdown of the Total Cumulative Distributions for the Fiscal Year | |||||||||||||||||||||||||||||||
|
|
|
| |||||||||||||||||||||||||||||
| iShares ETF | Net Investment Income | Net Realized Capital Gains | Return of Capital | Total Per Share | Net Investment Income | Net Realized Capital Gains | Return of Capital | Total Per Share | ||||||||||||||||||||||||
Global Infrastructure | $ | 1.222854 | $ | — | $ | — | $ | 1.222854 | 100 | % | — | % | — | % | 100 | % | ||||||||||||||||
Global Timber & Forestry | 1.642848 | — | — | 1.642848 | 100 | — | — | 100 | ||||||||||||||||||||||||
Premium/Discount Information
Information on the Fund’s net asset value, market price, premiums and discounts, and bid-ask spreads can be found at iShares.com.
| 46 | 2 0 2 3 I SHARES ANNUAL REPORT TO SHAREHOLDERS |
Trustee and Officer Information (unaudited)
The Board of Trustees has responsibility for the overall management and operations of the Funds, including general supervision of the duties performed by BFA and other service providers. Each Trustee serves until he or she resigns, is removed, dies, retires or becomes incapacitated. Each officer shall hold office until his or her successor is elected and qualifies or until his or her death, resignation or removal. Trustees who are not “interested persons” (as defined in the 1940 Act) of the Trust are referred to as independent trustees (“Independent Trustees”).
The registered investment companies advised by BFA or its affiliates (the “BlackRock-advised Funds”) are organized into one complex of open-end equity, multi-asset, index and money market funds and ETFs (the “BlackRock Multi-Asset Complex”), one complex of closed-end funds and open-end non-index fixed-income funds (including ETFs) (the “BlackRock Fixed-Income Complex”) and one complex of ETFs (“Exchange-Traded Fund Complex”) (each, a “BlackRock Fund Complex”). Each Fund is included in the Exchange-Traded Fund Complex. Each Trustee also serves as a Director of iShares, Inc. and a Trustee of iShares U.S. ETF Trust and, as a result, oversees all of the funds within the Exchange-Traded Fund Complex, which consists of 380 funds as of March 31, 2023. With the exception of Robert S. Kapito, Salim Ramji and Charles Park, the address of each Trustee and officer is c/o BlackRock, Inc., 400 Howard Street, San Francisco, CA 94105. The address of Mr. Kapito, Mr. Ramji and Mr. Park is c/o BlackRock, Inc., 50 Hudson Yards, New York, NY 10001. The Board has designated John E. Kerrigan as its Independent Board Chair. Additional information about the Funds’ Trustees and officers may be found in the Funds’ combined Statement of Additional Information, which is available without charge, upon request, by calling toll-free 1-800-iShares (1-800-474-2737).
| Interested Trustees | ||||||
Name (Year of Birth) | Position(s) | Principal Occupation(s) During Past 5 Years | Other Directorships Held by Trustee | |||
Robert S. Kapito(a) (1957) | Trustee (since 2009). | President, BlackRock, Inc. (since 2006); Vice Chairman of BlackRock, Inc. and Head of BlackRock’s Portfolio Management Group (since its formation in 1998) and BlackRock, Inc.’s predecessor entities (since 1988); Trustee, University of Pennsylvania (since 2009); President of Board of Directors, Hope & Heroes Children’s Cancer Fund (since 2002). | Director of BlackRock, Inc. (since 2006); Director of iShares, Inc. (since 2009); Trustee of iShares U.S. ETF Trust (since 2011). | |||
| Salim Ramji(b) (1970) | Trustee (since 2019). | Senior Managing Director, BlackRock, Inc. (since 2014); Global Head of BlackRock’s ETF and Index Investments Business (since 2019); Head of BlackRock’s U.S. Wealth Advisory Business (2015-2019); Global Head of Corporate Strategy, BlackRock, Inc. (2014-2015); Senior Partner, McKinsey & Company (2010-2014). | Director of iShares, Inc. (since 2019); Trustee of iShares U.S. ETF Trust (since 2019). | |||
(a) Robert S. Kapito is deemed to be an “interested person” (as defined in the 1940 Act) of the Trust due to his affiliations with BlackRock, Inc. and its affiliates. (b) Salim Ramji is deemed to be an “interested person” (as defined in the 1940 Act) of the Trust due to his affiliations with BlackRock, Inc. and its affiliates. | ||||||
| Independent Trustees | ||||||
Name (Year of Birth) | Position(s) | Principal Occupation(s) During Past 5 Years | Other Directorships Held by Trustee | |||
John E. Kerrigan (1955) | Trustee (since 2005); Independent Board Chair (since 2022). | Chief Investment Officer, Santa Clara University (since 2002). | Director of iShares, Inc. (since 2005); Trustee of iShares U.S. ETF Trust (since 2011); Independent Board Chair of iShares, Inc. and iShares U.S. ETF Trust (since 2022). | |||
Jane D. Carlin (1956) | Trustee (since 2015); Risk Committee Chair (since 2016). | Consultant (since 2012); Member of the Audit Committee (2012-2018), Chair of the Nominating and Governance Committee (2017-2018) and Director of PHH Corporation (mortgage solutions) (2012-2018); Managing Director and Global Head of Financial Holding Company Governance & Assurance and the Global Head of Operational Risk Management of Morgan Stanley (2006-2012). | Director of iShares, Inc. (since 2015); Trustee of iShares U.S. ETF Trust (since 2015); Member of the Audit Committee (since 2016), Chair of the Audit Committee (since 2020) and Director of The Hanover Insurance Group, Inc. (since 2016). | |||
Richard L. Fagnani (1954) | Trustee (since 2017); Audit Committee Chair (since 2019). | Partner, KPMG LLP (2002-2016); Director of One Generation Away (since 2021). | Director of iShares, Inc. (since 2017); Trustee of iShares U.S. ETF Trust (since 2017). | |||
TRUSTEE AND OFFICER INFORMATION | 47 |
Trustee and Officer Information (unaudited) (continued)
| Independent Trustees (continued) | ||||||
Name (Year of Birth) | Position(s) | Principal Occupation(s) During Past 5 Years | Other Directorships Held by Trustee | |||
Cecilia H. Herbert (1949) | Trustee (since 2005); Nominating and Governance and Equity Plus Committee Chairs (since 2022). | Chair of the Finance Committee (since 2019) and Trustee and Member of the Finance, Audit and Quality Committees of Stanford Health Care (since 2016); Trustee of WNET, New York’s public media company (since 2011) and Member of the Audit Committee (since 2018), Investment Committee (since 2011) and Personnel Committee (since 2022); Chair (1994-2005) and Member (1992-2021) of the Investment Committee, Archdiocese of San Francisco; Trustee of Forward Funds (14 portfolios) (2009-2018); Trustee of Salient MF Trust (4 portfolios) (2015-2018); Director (1998-2013) and President (2007-2011) of the Board of Directors, Catholic Charities CYO; Trustee (2002-2011) and Chair of the Finance and Investment Committee (2006-2010) of the Thacher School; Director of the Senior Center of Jackson Hole (since 2020); Director of the Jackson Hole Center for the Arts (since 2021); Member of the Wyoming State Investment Funds Committee (since 2022). | Director of iShares, Inc. (since 2005); Trustee of iShares U.S. ETF Trust (since 2011). | |||
Drew E. Lawton (1959) | Trustee (since 2017); 15(c) Committee Chair (since 2017). | Senior Managing Director of New York Life Insurance Company (2010-2015). | Director of iShares, Inc. (since 2017); Trustee of iShares U.S. ETF Trust (since 2017); Director of Jackson Financial Inc. (since 2021). | |||
John E. Martinez (1961) | Trustee (since 2003); Securities Lending Committee Chair (since 2019). | Director of Real Estate Equity Exchange, Inc. (since 2005); Director of Cloudera Foundation (2017-2020); and Director of Reading Partners (2012-2016). | Director of iShares, Inc. (since 2003); Trustee of iShares U.S. ETF Trust (since 2011). | |||
Madhav V. Rajan (1964) | Trustee (since 2011); Fixed-Income Plus Committee Chair (since 2019). | Dean, and George Pratt Shultz Professor of Accounting, University of Chicago Booth School of Business (since 2017); Advisory Board Member (since 2016) and Director (since 2020) of C.M. Capital Corporation; Chair of the Board for the Center for Research in Security Prices, LLC (since 2020); Robert K. Jaedicke Professor of Accounting, Stanford University Graduate School of Business (2001-2017); Professor of Law (by courtesy), Stanford Law School (2005-2017); Senior Associate Dean for Academic Affairs and Head of MBA Program, Stanford University Graduate School of Business (2010-2016). | Director of iShares, Inc. (since 2011); Trustee of iShares U.S. ETF Trust (since 2011). | |||
| Officers | ||||||
Name (Year of Birth) | Position(s) | Principal Occupation(s) During Past 5 Years | ||||
| Dominik Rohé (1973) | President (since 2019). | Managing Director, BlackRock, Inc. (since 2005); Head of Americas ETF and Index Investments (since 2023); Head of Latin America (2019-2023). | ||||
Trent Walker (1974) | Treasurer and Chief Financial Officer (since 2020). | Managing Director, BlackRock, Inc. (since September 2019); Chief Financial Officer of iShares Delaware Trust Sponsor LLC, BlackRock Funds, BlackRock Funds II, BlackRock Funds IV, BlackRock Funds V and BlackRock Funds VI (since 2021); Executive Vice President of PIMCO (2016-2019); Senior Vice President of PIMCO (2008-2015); Treasurer (2013-2019) and Assistant Treasurer (2007-2017) of PIMCO Funds, PIMCO Variable Insurance Trust, PIMCO ETF Trust, PIMCO Equity Series, PIMCO Equity Series VIT, PIMCO Managed Accounts Trust, 2 PIMCO-sponsored interval funds and 21 PIMCO-sponsored closed-end funds. | ||||
Charles Park (1967) | Chief Compliance Officer (since 2006). | Chief Compliance Officer of BlackRock Advisors, LLC and the BlackRock-advised Funds in the BlackRock Multi-Asset Complex and the BlackRock Fixed-Income Complex (since 2014); Chief Compliance Officer of BFA (since 2006). | ||||
| Marisa Rolland (1980) | Secretary (since 2022). | Managing Director, BlackRock, Inc. (since 2023); Director, BlackRock, Inc. (2018-2022); Vice President, BlackRock, Inc. (2010-2017). | ||||
Rachel Aguirre (1982) | Executive Vice President (since 2022). | Managing Director, BlackRock, Inc. (since 2018); Director, BlackRock, Inc. (2009-2018); Head of U.S. iShares Product (since 2022); Head of EII U.S. Product Engineering (since 2021); Co-Head of EII’s Americas Portfolio Engineering (2020-2021); Head of Developed Markets Portfolio Engineering (2016-2019). | ||||
| 48 | 2 0 2 3 I SHARES ANNUAL REPORT TO SHAREHOLDERS |
Trustee and Officer Information (unaudited) (continued)
| Officers (continued) | ||||||
Name (Year of Birth) | Position(s) | Principal Occupation(s) During Past 5 Years | ||||
| Jennifer Hsui (1976) | Executive Vice President (since 2022). | Managing Director, BlackRock, Inc. (since 2009); Co-Head of Index Equity (since 2022). | ||||
| James Mauro (1970) | Executive Vice President (since 2022). | Managing Director, BlackRock, Inc. (since 2010); Head of Fixed Income Index Investments in the Americas and Head of San Francisco Core Portfolio Management (since 2020). | ||||
Effective June 15, 2022, Marisa Rolland replaced Deepa Damre Smith as Secretary.
Effective March 30, 2023, Dominik Rohé replaced Armando Senra as President.
TRUSTEE AND OFFICER INFORMATION | 49 |
Electronic Delivery
Shareholders can sign up for e-mail notifications announcing that the shareholder report or prospectus has been posted on the iShares website at iShares.com. Once you have enrolled, you will no longer receive prospectuses and shareholder reports in the mail.
To enroll in electronic delivery:
| • | Go to icsdelivery.com. |
| • | If your brokerage firm is not listed, electronic delivery may not be available. Please contact your broker-dealer or financial advisor. |
Householding
Householding is an option available to certain fund investors. Householding is a method of delivery, based on the preference of the individual investor, in which a single copy of certain shareholder documents and Rule 30e-3 notices can be delivered to investors who share the same address, even if their accounts are registered under different names. Please contact your broker-dealer if you are interested in enrolling in householding and receiving a single copy of prospectuses and other shareholder documents, or if you are currently enrolled in householding and wish to change your householding status.
Availability of Quarterly Schedule of Investments
The Funds file their complete schedule of portfolio holdings with the SEC for the first and third quarters of each fiscal year as an exhibit to their reports on Form N-PORT. The Funds’ Forms N-PORT are available on the SEC’s website at sec.gov. Additionally, each Fund makes its portfolio holdings for the first and third quarters of each fiscal year available at iShares.com/fundreports.
Availability of Proxy Voting Policies and Proxy Voting Records
A description of the policies and procedures that the iShares Funds use to determine how to vote proxies relating to portfolio securities and information about how the iShares Funds voted proxies relating to portfolio securities during the most recent twelve-month period ending June 30 is available without charge, upon request (1) by calling toll-free 1-800-474-2737; (2) on the iShares website at iShares.com; and (3) on the SEC website at sec.gov.
A description of the Trust’s policies and procedures with respect to the disclosure of the Fund’s portfolio securities is available in the Fund Prospectus. The Fund discloses its portfolio holdings daily and provides information regarding its top holdings in Fund fact sheets at iShares.com.
| 50 | 2 0 2 3 I SHARES ANNUAL REPORT TO SHAREHOLDERS |
Glossary of Terms Used in this Report
| Portfolio Abbreviation | ||
| ADR | American Depositary Receipt | |
| NVS | Non-Voting Shares | |
GLOSSARY OF TERMS USED IN THIS REPORT | 51 |
THIS PAGE INTENTIONALLY LEFT BLANK.
THIS PAGE INTENTIONALLY LEFT BLANK.
THIS PAGE INTENTIONALLY LEFT BLANK.
THIS PAGE INTENTIONALLY LEFT BLANK.
Want to know more?
iShares.com | 1-800-474-2737
This report is intended for the Funds’ shareholders. It may not be distributed to prospective investors unless it is preceded or accompanied by the current prospectus.
Investing involves risk, including possible loss of principal.
The iShares Funds are distributed by BlackRock Investments, LLC (together with its affiliates, “BlackRock”).
The iShares Funds are not sponsored, endorsed, issued, sold or promoted by FTSE International Limited, or S&P Dow Jones Indices LLC, nor do these companies make any representation regarding the advisability of investing in the iShares Funds. BlackRock is not affiliated with the companies listed above.
©2023 BlackRock, Inc. All rights reserved. iSHARES and BLACKROCK are registered trademarks of BlackRock, Inc. or its subsidiaries. All other marks are the property of their respective owners.
iS-AR-303-0323
|  |
| MARCH 31, 2023 |

| 2023 Annual Report
| |
iShares Trust
· iShares Global Comm Services ETF | IXP | NYSE Arca
· iShares Global Consumer Discretionary ETF | RXI | NYSE Arca
· iShares Global Consumer Staples ETF | KXI | NYSE Arca
· iShares Global Energy ETF | IXC | NYSE Arca
· iShares Global Financials ETF | IXG | NYSE Arca
· iShares Global Healthcare ETF | IXJ | NYSE Arca
· iShares Global Industrials ETF | EXI | NYSE Arca
· iShares Global Materials ETF | MXI | NYSE Arca
· iShares Global Tech ETF | IXN | NYSE Arca
· iShares Global Utilities ETF | JXI | NYSE Arca
Dear Shareholder,
Significant economic headwinds emerged during the 12-month reporting period ended March 31, 2023, as investors navigated changing economic conditions and volatile markets. The U.S. economy shrank in the first half of 2022 before returning to modest growth in the second half of the year, marking a shift to a more challenging post-reopening economic environment. Changes in consumer spending patterns and a tight labor market led to elevated inflation, which reached a 40-year high before beginning to moderate.
Equity prices fell as interest rates rose, particularly during the first half of the reporting period. Both large-and small-capitalization U.S. stocks declined, although equities began to recover in the second half of the period as inflation eased and economic growth resumed. Emerging market stocks and international equities from developed markets declined overall, pressured by rising interest rates and volatile commodities prices.
The 10-year U.S. Treasury yield rose during the reporting period, driving its price down, as investors reacted to fluctuating inflation data and attempted to anticipate its impact on future interest rate changes. The corporate bond market also faced inflationary headwinds, and higher interest rates led to rising borrowing costs for corporate issuers.
The U.S. Federal Reserve (the “Fed”), acknowledging that inflation has been more persistent than expected, raised interest rates eight times. Furthermore, the Fed wound down its bond-buying programs and accelerated the reduction of its balance sheet.
Restricted labor supply kept inflation elevated even as other inflation drivers, such as goods prices and energy costs, moderated. While economic growth slowed in the last year, we believe that taming inflation requires a more substantial decline that lowers demand to a level more in line with the economy’s productive capacity. Although the Fed has decelerated the pace of interest rate hikes, we believe that it still seems determined to get inflation back to target. With this in mind, we believe the possibility of a U.S. recession in the near-term is high, but the dimming economic outlook has not yet been fully reflected in current market prices. We believe investors should expect a period of higher volatility as markets adjust to the new economic reality and policymakers attempt to adapt to rapidly changing conditions. Turmoil in the banking sector late in the period highlighted the potential for the knock-on effects of substantially higher interest rates to disrupt markets with little warning.
While we favor an overweight to equities in the long term, we prefer an underweight stance on equities overall in the near term. Expectations for corporate earnings remain elevated, which seems inconsistent with the possibility of a recession. Nevertheless, we are overweight on emerging market stocks as we believe a weakening U.S. dollar provides a supportive backdrop. We also see long-term opportunities in credit, where we believe that valuations are appealing and higher yields provide attractive income, although we are neutral on credit in the near term, as we’re concerned about tightening credit and financial conditions. However, we believe there are still some strong opportunities for a six- to twelve-month horizon, particularly short-term U.S. Treasuries, global inflation-linked bonds, and emerging market bonds denominated in local currency.
Overall, our view is that investors need to think globally, position themselves to be prepared for a decarbonizing economy, and be nimble as market conditions change. We encourage you to talk with your financial advisor and visit iShares.com for further insight about investing in today’s markets.

Rob Kapito
President, BlackRock, Inc.

Rob Kapito
President, BlackRock, Inc.
| Total Returns as of March 31, 2023 | ||||||||
| 6-Month | 12-Month | |||||||
U.S. large cap equities | 15.62% | (7.73)% | ||||||
U.S. small cap equities | 9.14 | (11.61) | ||||||
International equities | 27.27 | (1.38) | ||||||
Emerging market equities | 14.04 | (10.70) | ||||||
3-month Treasury bills | 1.93 | 2.52 | ||||||
U.S. Treasury securities | 4.38 | (6.90) | ||||||
U.S. investment grade bonds | 4.89 | (4.78) | ||||||
Tax-exempt municipal bonds | 7.00 | 0.26 | ||||||
U.S. high yield bonds | 7.88 | (3.35) | ||||||
| Past performance is not an indication of future results. Index performance is shown for illustrative purposes only. You cannot invest directly in an index. |
| |||||||
| 2 | THIS PAGE IS NOT PART OF YOUR FUND REPORT |
| Page | ||||
| ||||
| 2 | ||||
Annual Report: | ||||
| 4 | ||||
| 5 | ||||
| 25 | ||||
| 25 | ||||
| 26 | ||||
Financial Statements | ||||
| 64 | ||||
| 67 | ||||
| 70 | ||||
| 75 | ||||
| 85 | ||||
| 96 | ||||
| 97 | ||||
| 98 | ||||
| 99 | ||||
| 101 | ||||
| 104 | ||||
| 105 | ||||
iShares Trust
Global Market Overview
Global equity markets declined during the 12 months ended March 31, 2023 (“reporting period”). The MSCI ACWI, a broad global equity index that includes both developed and emerging markets, returned -7.44% in U.S. dollar terms for the reporting period. In the first half of the reporting period, concerns about the state of the global economy in the face of high inflation and rapidly rising interest rates drove stocks sharply lower. However, stock prices recovered somewhat in the reporting period’s second half, as economic growth proved resilient despite its slower pace.
Inflation was a significant factor in equity markets, and while its impact varied by country, most major economies experienced substantial inflation during the reporting period. This drove a wave of monetary tightening by most of the world’s central banks, which sent interest rates and borrowing costs sharply higher. The U.S. Federal Reserve (“Fed”) raised interest rates eight times, driving an increase in the value of the U.S. dollar relative to most other currencies. Commodities prices were volatile, and as the reporting period began, disruptions in the wake of Russia’s invasion of Ukraine meant high prices for energy commodities and some foods. While oil, gas, and most other commodities declined as markets adjusted to the war’s disruption, elevated prices exacerbated inflationary pressure.
The U.S. economy recovered from a decline in the first half of 2022 to post modest growth in the third and fourth quarters of 2022. Consumers continued to power the economy with growing spending, despite higher prices for many consumer goods and services. The strong labor market supported spending as unemployment remained very low, at one point dropping to the lowest recorded level since 1969. Furthermore, the labor force participation rate—which measures the total proportion of employed persons of working age—rose, indicating that more people were being drawn into the labor force. Amid tightening labor supply, wages rose significantly, with the largest gains at the lower end of the wage spectrum.
In addition to its interest rate increases, the Fed also started to reduce the size of its balance sheet by reducing the store of U.S. Treasuries it had accumulated to stabilize markets in the early phases of the coronavirus pandemic. While the Fed indicated that more tightening could be needed to achieve its long-term inflation goal, it sounded a more cautious note about the potential for further interest rate increases near the end of the reporting period.
European stocks outpaced most other regions of the globe, advancing modestly for the reporting period despite slowing economic growth. European stocks benefited from a solid recovery following the early phases of the war in Ukraine. While the conflict disrupted critical natural gas supplies, new sources were secured and prices began to decline, while a warm winter helped moderate consumption. The European Central Bank (“ECB”) responded to the highest inflation since the introduction of the euro by raising interest rates six times.
While inflation was somewhat more moderate in the Asia-Pacific region, stocks there declined amid higher interest rates and disruption from coronavirus-related lockdowns in China. However, China relaxed its strict anti-coronavirus protocols in December 2022, boosting analysts’ expectations for future growth in the region. Emerging market stocks declined substantially, pressured by slowing economic growth and a stronger U.S. dollar. The Fed’s interest rate increases weighed on emerging market equities by making U.S. assets relatively more attractive.
| 4 | 2 0 2 3 I SHARES ANNUAL REPORT TO SHAREHOLDERS |
| Fund Summary as of March 31, 2023 | iShares® Global Comm Services ETF |
Investment Objective
The iShares Global Comm Services ETF (the “Fund”) seeks to track the investment results of an index composed of global equities in the communication services sector, as represented by the S&P Global 1200 Communication Services 4.5/22.5/45 Capped IndexTM (the “Index”). The Fund invests in a representative sample of securities included in the Index that collectively has an investment profile similar to the Index. Due to the use of representative sampling, the Fund may or may not hold all of the securities that are included in the Index.
Performance
| Average Annual Total Returns | Cumulative Total Returns | |||||||||||||||||||||||||||
|
| |||||||||||||||||||||||||||
| 1 Year | 5 Years | 10 Years | 1 Year | 5 Years | 10 Years | |||||||||||||||||||||||
Fund NAV | (12.16 | )% | 4.50 | % | 4.43% | (12.16 | )% | 24.62 | % | 54.24 | % | |||||||||||||||||
Fund Market | (12.27 | ) | 4.42 | 4.42 | (12.27 | ) | 24.14 | 54.06 | ||||||||||||||||||||
Index | (12.49 | ) | 4.71 | 4.44 | (12.49 | ) | 25.90 | 54.36 | ||||||||||||||||||||
GROWTH OF $10,000 INVESTMENT
(AT NET ASSET VALUE)
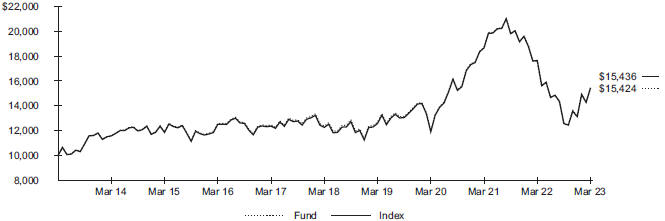
Index performance through January 30, 2013 is calculated using currency exchange (FX) rates corresponding to 5:15 P.M. ET. Index performance beginning on January 31, 2013 is calculated using FX rates corresponding to World Market Reuters 4:00 P.M. London.
Index performance through June 23, 2019 reflects the performance of the S&P Global 1200 Communication Services Sector IndexTM. Index performance beginning on June 24, 2019 reflects the performance of S&P Global 1200 Communication Services 4.5/22.5/45 Capped IndexTM.
Past performance is not an indication of future results. Performance results do not reflect the deduction of taxes that a shareholder would pay on fund distributions or on the redemption or sale of fund shares. See “About Fund Performance” for more information.
Expense Example
| Actual | Hypothetical 5% Return | |||||||||||||||||||||||||
|
|
|
| |||||||||||||||||||||||
| | Beginning Account Value (10/01/22) |
| | Ending Account Value (03/31/23) |
| | Expenses Paid During the Period |
(a) | | Beginning Account Value (10/01/22) |
| | Ending Account Value (03/31/23) |
| | Expenses Paid During the Period |
(a) | | Annualized Expense Ratio |
| ||||||
| $ 1,000.00 | $ 1,229.40 | $ 2.39 | $ 1,000.00 | $ 1,022.80 | $ 2.17 | 0.43 | % | |||||||||||||||||||
| (a) | Expenses are equal to the annualized expense ratio, multiplied by the average account value over the period, multiplied by 182/365 (to reflect the one-half year period shown). Other fees, such as brokerage commissions and other fees to financial intermediaries, may be paid which are not reflected in the tables and examples above. See “Disclosure of Expenses” for more information. |
FUND SUMMARY | 5 |
| Fund Summary as of March 31, 2023 (continued) | iShares® Global Comm Services ETF |
Portfolio Management Commentary
Global communication services stocks declined during the reporting period amid macroeconomic and inflation-related headwinds. Revenues for media and entertainment companies were challenged by a downturn in advertising spending and increased competition for subscribers as more companies pivoted away from legacy TV toward streaming. Additionally, stagnating subscriber growth in broadband services pressured companies in the cable and satellite industry.
U.S. communication services stocks, which represented 65% of the Index on average during the reporting period, detracted the most from the Index’s return. The media and entertainment industry led the decline. Rising inflation cut into revenues for companies focused on search and digital advertising, leading to hiring slowdowns, layoffs, and other methods of cost-cutting. Many U.S. and global businesses reduced their marketing budgets amid economic uncertainty, dampening prospects for U.S. companies that derive a substantial portion of their revenue from online advertisements. Some U.S. media and entertainment companies encountered stiff competition for subscribers from foreign-owned video and social media platforms, exacerbating the industry downturn. Similarly, costs associated with acquiring and maintaining subscribers on streaming platforms curbed the profits of an entertainment conglomerate. Inflation’s effect on consumer spending habits also weighed on the company’s performance, as its theme park revenues fell short of analyst expectations. Stocks of U.S. cable and satellite companies declined markedly during the reporting period. Market share gains by wireless telecommunications firms in broadband internet contributed to flat subscriber numbers for major cable providers.
South Korean interactive media and services companies detracted from the Index’s performance, as investor concerns over the planned acquisition of a U.S. e-commerce site weighed on a top online portal operator. In Japan, entertainment stocks weighed on performance as a manufacturer of gaming systems lowered its financial outlook based on weakening demand. On the upside, the Chinese interactive media and services industry contributed to the Index’s return, buoyed by an easing of China’s coronavirus pandemic-related restrictions.
Portfolio Information
INDUSTRY ALLOCATION
| Industry | | Percent of Total Investments | (a) | |
Interactive Media & Services | 47.6 | % | ||
Diversified Telecommunication Services | 19.4 | |||
Entertainment | 15.8 | |||
Media | 9.4 | |||
Wireless Telecommunication Services | 7.8 | |||
GEOGRAPHIC ALLOCATION
| Country/Geographic Region | | Percent of Total Investments | (a) | |
United States | 66.9 | % | ||
China | 10.4 | |||
Japan | 7.3 | |||
Canada | 2.7 | |||
Germany | 2.3 | |||
United Kingdom | 2.2 | |||
France | 1.4 | |||
Spain | 1.3 | |||
Australia | 1.1 | |||
South Korea | 1.1 | |||
Other (each representing less than 1%) | 3.3 | |||
| (a) | Excludes money market funds. |
| 6 | 2 0 2 3 I SHARES ANNUAL REPORT TO SHAREHOLDERS |
| Fund Summary as of March 31, 2023 | iShares® Global Consumer Discretionary ETF |
Investment Objective
The iShares Global Consumer Discretionary ETF (the “Fund”) seeks to track the investment results of an index composed of global equities in the consumer discretionary sector, as represented by the S&P Global 1200 Consumer Discretionary (Sector) Capped IndexTM (the “Index”). The Fund invests in a representative sample of securities included in the Index that collectively has an investment profile similar to the Index. Due to the use of representative sampling, the Fund may or may not hold all of the securities that are included in the Index.
Performance
| Average Annual Total Returns | Cumulative Total Returns | |||||||||||||||||||||||||||
|
| |||||||||||||||||||||||||||
| 1 Year | 5 Years | 10 Years | 1 Year | 5 Years | 10 Years | |||||||||||||||||||||||
Fund NAV | (6.12 | )% | 6.66 | % | 9.44% | (6.12 | )% | 38.02 | % | 146.45 | % | |||||||||||||||||
Fund Market | (6.27 | ) | 6.63 | 9.42 | (6.27 | ) | 37.83 | 146.09 | ||||||||||||||||||||
Index | (6.66 | ) | 6.77 | 9.46 | (6.66 | ) | 38.78 | 146.93 | ||||||||||||||||||||
GROWTH OF $10,000 INVESTMENT
(AT NET ASSET VALUE)
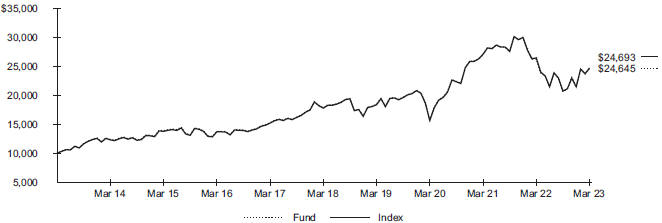
Index performance through January 30, 2013 is calculated using currency exchange (FX) rates corresponding to 5:15 P.M. ET. Index performance beginning on January 31, 2013 is calculated using FX rates corresponding to World Market Reuters 4:00 P.M. London.
Index performance through September 22, 2019 reflects the performance of the S&P Global 1200 Consumer Discretionary Sector IndexTM. Index performance beginning on September 23, 2019 reflects the performance of the S&P Global 1200 Consumer Discretionary (Sector) Capped IndexTM.
Past performance is not an indication of future results. Performance results do not reflect the deduction of taxes that a shareholder would pay on fund distributions or on the redemption or sale of fund shares. See “About Fund Performance” for more information.
Expense Example
| Actual | Hypothetical 5% Return | |||||||||||||||||||||||||
|
|
|
| |||||||||||||||||||||||
| | Beginning Account Value (10/01/22) |
| | Ending Account Value (03/31/23) |
| | Expenses Paid During the Period |
(a) | | Beginning Account Value (10/01/22) |
| | Ending Account Value (03/31/23) |
| | Expenses Paid During the Period |
(a) | | Annualized Expense Ratio |
| ||||||
| $ 1,000.00 | $ 1,192.00 | $ 2.30 | $ 1,000.00 | $ 1,022.80 | $ 2.12 | 0.42 | % | |||||||||||||||||||
| (a) | Expenses are equal to the annualized expense ratio, multiplied by the average account value over the period, multiplied by 182/365 (to reflect the one-half year period shown). Other fees, such as brokerage commissions and other fees to financial intermediaries, may be paid which are not reflected in the tables and examples above. See “Disclosure of Expenses” for more information. |
FUND SUMMARY | 7 |
| Fund Summary as of March 31, 2023 (continued) | iShares® Global Consumer Discretionary ETF |
Portfolio Management Commentary
Global consumer discretionary stocks declined for the reporting period, as supply chain disruptions diminished inventories and rising inflation led consumers to focus their spending more on essentials than on discretionary items. In the U.S., which represented approximately 59% of the Index on average, automobile manufacturers detracted the most from the Index’s performance, followed by the internet and direct marketing retail industry.
A substantial decline in new car sales during the reporting period weighed on the U.S. automobiles and components industry. In 2022, the annual total of new vehicle purchases in the U.S. dropped to its lowest level since 2011. Several factors slowed automobile production, including a global shortage of semiconductor chips, the continuing war in Ukraine, and COVID-19-related lockdowns in China that shut down factories. Against this backdrop, investors lost confidence in a leading maker of electric vehicles as signs emerged of weakening demand for its products in the U.S. and China. The internet and direct marketing retail industry in the U.S. also weighed on the Index’s performance. Sales declined for some large online retailers as U.S. consumers embraced shopping at brick-and-mortar stores. The markets also reacted negatively to projections of weak holiday sales coupled with historically high operating costs.
The Japanese automobiles and components industry ended the reporting period lower as inventory shortfalls translated into weak vehicle sales. Consumer durables equities in Japan also trailed, following the broader Japanese market lower in August 2022 amid investor concerns that interest rate raises by the Fed could depress economic activity. In China, stocks of e-commerce companies fell due to investor concerns about stricter government regulation in the wake of a consolidation of power by President Xi Jinping.
On the upside, the consumer durables industry in France and Switzerland supported the Index’s performance, benefiting from robust year-over-year growth in sales for luxury fashion retailers. Dutch internet and direct marketing retail stocks also contributed, as the food service businesses of an e-commerce conglomerate showed robust growth.
Portfolio Information
INDUSTRY ALLOCATION
| Industry | | Percent of Total Investments | (a) | |
Consumer Discretionary Distribution & Retail | 34.8 | % | ||
Automobiles & Components | 25.4 | |||
Consumer Services | 19.9 | |||
Consumer Durables & Apparel | 19.9 | |||
GEOGRAPHIC ALLOCATION
| Country/Geographic Region | | Percent of Total Investments | (a) | |
United States | 56.4 | % | ||
Japan | 11.6 | |||
France | 7.5 | |||
China | 7.3 | |||
Germany | 3.7 | |||
United Kingdom | 2.5 | |||
Switzerland | 1.8 | |||
Netherlands | 1.7 | |||
Italy | 1.6 | |||
Spain | 1.3 | |||
Canada | 1.2 | |||
Australia | 1.2 | |||
Other (each representing less than 1%) | 2.2 | |||
| (a) | Excludes money market funds. |
| 8 | 2 0 2 3 I SHARES ANNUAL REPORT TO SHAREHOLDERS |
| Fund Summary as of March 31, 2023 | iShares® Global Consumer Staples ETF |
Investment Objective
The iShares Global Consumer Staples ETF (the “Fund”) seeks to track the investment results of an index composed of global equities in the consumer staples sector, as represented by the S&P Global 1200 Consumer Staples (Sector) Capped IndexTM (the “Index”). The Fund invests in a representative sample of securities included in the Index that collectively has an investment profile similar to the Index. Due to the use of representative sampling, the Fund may or may not hold all of the securities that are included in the Index.
Performance
| Average Annual Total Returns | Cumulative Total Returns | |||||||||||||||||||||||||||
|
| |||||||||||||||||||||||||||
| 1 Year | 5 Years | 10 Years | 1 Year | 5 Years | 10 Years | |||||||||||||||||||||||
Fund NAV | 1.56 | % | 6.80 | % | 6.58% | 1.56 | % | 38.95 | % | 89.07 | % | |||||||||||||||||
Fund Market | 1.75 | 6.80 | 6.57 | 1.75 | 38.94 | 88.90 | ||||||||||||||||||||||
Index | 1.17 | 6.70 | 6.51 | 1.17 | 38.30 | 87.83 | ||||||||||||||||||||||
GROWTH OF $10,000 INVESTMENT
(AT NET ASSET VALUE)
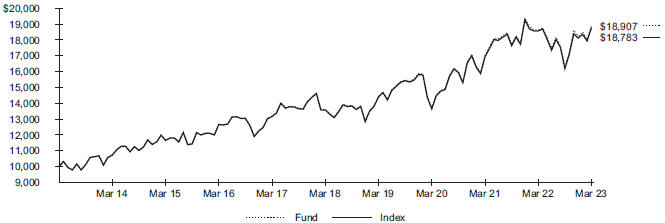
Index performance through January 30, 2013 is calculated using currency exchange (FX) rates corresponding to 5:15 P.M. ET. Index performance beginning on January 31, 2013 is calculated using FX rates corresponding to World Market Reuters 4:00 P.M. London.
Index performance through June 23, 2019 reflects the performance of the S&P Global 1200 Consumer Staples Sector IndexTM. Index performance beginning on June 24, 2019 reflects the performance of the S&P Global 1200 Consumer Staples (Sector) Capped IndexTM.
Past performance is not an indication of future results. Performance results do not reflect the deduction of taxes that a shareholder would pay on fund distributions or on the redemption or sale of fund shares. See “About Fund Performance” for more information.
Expense Example
| Actual | Hypothetical 5% Return | |||||||||||||||||||||||||
|
|
|
| |||||||||||||||||||||||
| | Beginning Account Value (10/01/22) |
| | Ending Account Value (03/31/23) |
| | Expenses Paid During the Period |
(a) | | Beginning Account Value (10/01/22) |
| | Ending Account Value (03/31/23) |
| | Expenses Paid During the Period |
(a) | | Annualized Expense Ratio |
| ||||||
| $ 1,000.00 | $ 1,163.90 | $ 2.27 | $ 1,000.00 | $ 1,022.80 | $ 2.12 | 0.42 | % | |||||||||||||||||||
| (a) | Expenses are equal to the annualized expense ratio, multiplied by the average account value over the period, multiplied by 182/365 (to reflect the one-half year period shown). Other fees, such as brokerage commissions and other fees to financial intermediaries, may be paid which are not reflected in the tables and examples above. See “Disclosure of Expenses” for more information. |
FUND SUMMARY | 9 |
| Fund Summary as of March 31, 2023 (continued) | iShares® Global Consumer Staples ETF |
Portfolio Management Commentary
Despite rising interest rates and concerns about an economic slowdown, global consumer staples stocks advanced slightly for the reporting period. Because consumer staples products are typically in demand regardless of the economic environment, consumer staples stocks are often less affected by negative economic trends. Nonetheless, in an environment of elevated inflation, consumers reduced their purchases of some goods and increasingly sought bargains and purchased off-brand products.
U.S. stocks contributed the most to the Index’s return, led by the soft drinks and non-alcoholic beverages industry. U.S. consumer spending grew notably amid low unemployment and rising wages. Sales and profits in the industry grew as grocery shoppers responded to high inflation by increasing purchases of packaged foods relative to fresh foods such as meat and produce. Consumers’ willingness to tolerate price increases for the convenience of pre-packaged foods allowed companies in the industry to offset higher costs of inputs and transportation. Consequently, the industry’s profit margins remained healthy despite the economic headwinds. Sales of energy drinks also grew, as new varieties with vitamins and alternative sweeteners boosted sales.
The French personal care products industry also contributed to the Index’s performance amid strong sales of cosmetics. Despite high inflation, many consumers viewed personal care products to be a small luxury for which they were willing to pay higher prices. Strong demand from North America and Europe helped offset declines in Asian sales due to China’s COVID-19 lockdowns. The stock of a Swedish company in the food, beverage, and tobacco industry also gained amid a move toward smokeless products before being acquired by a large multinational company.
On the downside, Swiss consumer staples stocks declined, particularly the packaged foods and meats industry. Sales of branded items declined as consumers reduced their purchases following price increases. Furthermore, higher prices were insufficient to cover the rise in input costs, pressuring profit margins. To support earnings, the industry eliminated some less profitable product lines in an effort to bolster profitability at the expense of overall revenue growth.
Portfolio Information
INDUSTRY ALLOCATION
| Industry | | Percent of Total Investments | (a) | |
Packaged Foods & Meats | 20.9 | % | ||
Household Products | 14.9 | |||
Consumer Staples Merchandise Retail | 14.1 | |||
Soft Drinks & Non-alcoholic Beverages | 12.6 | |||
Personal Care Products | 9.4 | |||
Tobacco | 8.8 | |||
Food Retail | 6.9 | |||
Distillers & Vintners | 5.1 | |||
Brewers | 4.3 | |||
Agricultural Products & Services | 1.4 | |||
Food Distributors | 1.0 | |||
Other (each representing less than 1%) | 0.6 | |||
GEOGRAPHIC ALLOCATION
| Country/Geographic Region | | Percent of Total Investments | (a) | |
United States | 58.0 | % | ||
United Kingdom | 11.6 | |||
Switzerland | 8.8 | |||
Japan | 5.4 | |||
France | 5.2 | |||
Canada | 2.0 | |||
Netherlands | 1.7 | |||
Belgium | 1.6 | |||
Australia | 1.5 | |||
Mexico | 1.1 | |||
Other (each representing less than 1%) | 3.1 | |||
| (a) | Excludes money market funds. |
| 10 | 2 0 2 3 I SHARES ANNUAL REPORT TO SHAREHOLDERS |
| Fund Summary as of March 31, 2023 | iShares® Global Energy ETF |
Investment Objective
The iShares Global Energy ETF (the “Fund”) seeks to track the investment results of an index composed of global equities in the energy sector, as represented by the S&P Global 1200 Energy Sector IndexTM (the “Index”). The Fund invests in a representative sample of securities included in the Index that collectively has an investment profile similar to the Index. Due to the use of representative sampling, the Fund may or may not hold all of the securities that are included in the Index.
On February 16, 2023, the Board approved a proposal to change the Fund’s index to S&P Global 1200 Energy 4.5/22.5/45 Capped Index. This change became effective on April 20, 2023.
Performance
| Average Annual Total Returns | Cumulative Total Returns | |||||||||||||||||||||||||||
|
| |||||||||||||||||||||||||||
| 1 Year | 5 Years | 10 Years | 1 Year | 5 Years | 10 Years | |||||||||||||||||||||||
Fund NAV | 9.39 | % | 7.06 | % | 3.33% | 9.39 | % | 40.63 | % | 38.75 | % | |||||||||||||||||
Fund Market | 9.43 | 7.05 | 3.33 | 9.43 | 40.60 | 38.80 | ||||||||||||||||||||||
Index | 8.45 | 6.52 | 3.01 | 8.45 | 37.15 | 34.55 | ||||||||||||||||||||||
GROWTH OF $10,000 INVESTMENT
(AT NET ASSET VALUE)
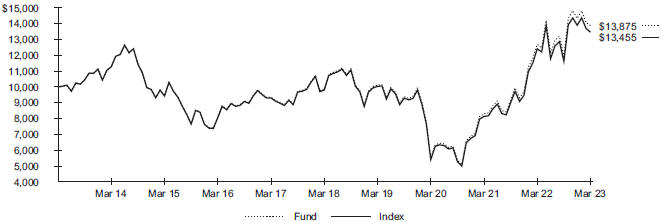
Index performance through January 30, 2013 is calculated using currency exchange (FX) rates corresponding to 5:15 P.M. ET. Index performance beginning on January 31, 2013 is calculated using FX rates corresponding to World Market Reuters 4:00 P.M. London.
Past performance is not an indication of future results. Performance results do not reflect the deduction of taxes that a shareholder would pay on fund distributions or on the redemption or sale of fund shares. See “About Fund Performance” for more information.
Expense Example
| Actual | Hypothetical 5% Return | |||||||||||||||||||||||||
|
|
|
| |||||||||||||||||||||||
| | Beginning Account Value (10/01/22) |
| | Ending Account Value (03/31/23) |
| | Expenses Paid During the Period |
(a) | | Beginning Account Value (10/01/22) |
| | Ending Account Value (03/31/23) |
| | Expenses Paid During the Period |
(a) | | Annualized Expense Ratio |
| ||||||
| $ 1,000.00 | $ 1,164.30 | $ 2.37 | $ 1,000.00 | $ 1,022.70 | $ 2.22 | 0.44 | % | |||||||||||||||||||
| (a) | Expenses are equal to the annualized expense ratio, multiplied by the average account value over the period, multiplied by 182/365 (to reflect the one-half year period shown). Other fees, such as brokerage commissions and other fees to financial intermediaries, may be paid which are not reflected in the tables and examples above. See “Disclosure of Expenses” for more information. |
| 11 |
| Fund Summary as of March 31, 2023 (continued) | iShares® Global Energy ETF |
Portfolio Management Commentary
Global energy stocks advanced during the reporting period as higher natural gas prices throughout 2022 offset declining oil prices. U.S. natural gas futures climbed to a 14-year high in August 2022 when Russia announced plans to shut down a natural gas pipeline to Europe, complicating efforts to refill supplies ahead of the winter. However, an unseasonably warm winter weakened demand for natural gas, sending prices for the fuel sharply lower during the first three months of 2023. U.S. supplies of natural gas uncharacteristically outstripped demand during the winter months. Meanwhile, oil prices retreated from highs reached in the months following Russia’s invasion of Ukraine as rising interest rates and high inflationary pressures weakened the outlook for global economic growth. COVID-19 related lockdowns in China, the world’s largest importer of oil, also weakened global demand. Dropping prices led the Organization of the Petroleum Exporting Countries (“OPEC”) and other allied countries to agree in October 2022 to cut supplies to stimulate a rebound in prices.
Oil, gas, and consumable fuels companies in the U.S. contributed the most to the Index’s stronger performance as stocks in the sector posted record profits. Some large oil companies also used excess cash to buy back their own stock and raise dividends.
British oil, gas, and consumable fuels companies also contributed to the Index’s performance as they, too, reported record profits, bought back their own stock, and increased dividend payments. Some companies scaled back plans to reduce production to reduce carbon emissions and instead announced plans to increase investments in the oil and gas industry.
Conversely, Canadian oil, gas, and consumable fuels companies detracted from the Index, particularly those that operate pipelines. A shortage of skilled workers, inflationary pressures, and contractor disputes added to escalating expenses for a planned pipeline from gas fields in British Columbia to a Pacific Ocean port. In addition, outages at U.S. refineries and a global glut of high sulfur fuel oil weakened demand for Western Canada Select crude oil.
Portfolio Information
INDUSTRY ALLOCATION
| Industry | | Percent of Total Investments | (a) | |
Integrated Oil & Gas | 56.2 | % | ||
Oil & Gas Exploration & Production | 20.8 | |||
Oil & Gas Storage & Transportation | 9.6 | |||
Oil & Gas Refining & Marketing | 7.8 | |||
Oil & Gas Equipment & Services | 5.2 | |||
Other (each representing less than 1%) | 0.4 | |||
GEOGRAPHIC ALLOCATION
| Country/Geographic Region | | Percent of Total Investments | (a) | |
United States | 60.9 | % | ||
United Kingdom | 12.2 | |||
Canada | 11.4 | |||
France | 5.3 | |||
Australia | 2.4 | |||
Italy | 1.6 | |||
Brazil | 1.6 | |||
Norway | 1.4 | |||
Other (each representing less than 1%) | 3.2 | |||
| (a) | Excludes money market funds. |
| 12 | 2 0 2 3 I SHARES ANNUAL REPORT TO SHAREHOLDERS |
| Fund Summary as of March 31, 2023 | iShares® Global Financials ETF |
Investment Objective
The iShares Global Financials ETF (the “Fund”) seeks to track the investment results of an index composed of global equities in the financials sector, as represented by the S&P Global 1200 Financials Sector IndexTM (the “Index”). The Fund invests in a representative sample of securities included in the Index that collectively has an investment profile similar to the Index. Due to the use of representative sampling, the Fund may or may not hold all of the securities that are included in the Index.
Performance
| Average Annual Total Returns | Cumulative Total Returns | |||||||||||||||||||||||||||
|
| |||||||||||||||||||||||||||
| 1 Year | 5 Years | 10 Years | 1 Year | 5 Years | 10 Years | |||||||||||||||||||||||
Fund NAV | (9.86 | )% | 2.85 | % | 6.35% | (9.86 | )% | 15.07 | % | 85.08 | % | |||||||||||||||||
Fund Market | (9.90 | ) | 2.74 | 6.30 | (9.90 | ) | 14.48 | 84.21 | ||||||||||||||||||||
Index | (10.35 | ) | 2.83 | 6.38 | (10.35 | ) | 14.98 | 85.62 | ||||||||||||||||||||
GROWTH OF $10,000 INVESTMENT
(AT NET ASSET VALUE)
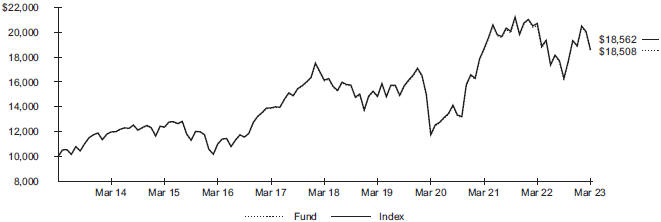
Index performance through January 30, 2013 is calculated using currency exchange (FX) rates corresponding to 5:15 P.M. ET. Index performance beginning on January 31, 2013 is calculated using FX rates corresponding to World Market Reuters 4:00 P.M. London.
Past performance is not an indication of future results. Performance results do not reflect the deduction of taxes that a shareholder would pay on fund distributions or on the redemption or sale of fund shares. See “About Fund Performance” for more information.
Expense Example
| Actual | Hypothetical 5% Return | |||||||||||||||||||||||||
|
|
|
| |||||||||||||||||||||||
| | Beginning Account Value (10/01/22) |
| | Ending Account Value (03/31/23) |
| | Expenses Paid During the Period |
(a) | | Beginning Account Value (10/01/22) |
| | Ending Account Value (03/31/23) |
| | Expenses Paid During the Period |
(a) | | Annualized Expense Ratio |
| ||||||
| $ 1,000.00 | $ 1,143.70 | $ 2.30 | $ 1,000.00 | $ 1,022.80 | $ 2.17 | 0.43 | % | |||||||||||||||||||
| (a) | Expenses are equal to the annualized expense ratio, multiplied by the average account value over the period, multiplied by 182/365 (to reflect the one-half year period shown). Other fees, such as brokerage commissions and other fees to financial intermediaries, may be paid which are not reflected in the tables and examples above. See “Disclosure of Expenses” for more information. |
FUND SUMMARY | 13 |
| Fund Summary as of March 31, 2023 (continued) | iShares® Global Financials ETF |
Portfolio Management Commentary
Global financials stocks declined for the reporting period. From a country perspective, U.S. stocks, which constituted approximately 52% of the Index on average during the reporting period, were the leading detractor from the Index’s return. The U.S. banks industry detracted the most from the Index’s performance. Near the end of the reporting period, bank stock prices dropped sharply lower following the failure of two regional U.S. banks in the largest collapse for the industry since 2008. The banks, which both had a high percentage of uninsured deposits, were unable to meet a surge in customer withdrawals. The government intervened to help depositors and provide liquidity in order to maintain the stability of the financial system. The disruption created by the failures led to increased scrutiny of the industry by investors. While banks often profit when interest rates are rising since they charge higher interest on loans, the inflationary environment during the reporting period curbed consumer spending on big-ticket purchases that often require financing from banks. Notably, new mortgage loans slowed, a consequence of higher interest rates and increasingly less affordable housing prices.
The U.S. financial services industry also negatively impacted the Index’s return. Stocks of large conglomerates that own diverse businesses dropped following a broad decline in the equities of their underlying companies, while revenues for bond rating firms in the financial exchanges and data industry dropped amid a slowdown in bond issuance. Also within financial services, investment banking and brokerage companies with large holdings of bonds with declining value weighed on performance. Investors became concerned about some financial services companies facing the same liquidity issues as the failed regional banks, though the companies in question insisted their cash positions were strong.
Bank stocks in Canada detracted from the Index’s performance, as economic uncertainty led Canadian banks to set aside a significant portion of capital to cover potential loan losses, which pressured earnings. Similarly, Australian banks were notable detractors as interest rate raises by the Reserve Bank of Australia weakened the housing market and the economic outlook.
Portfolio Information
INDUSTRY ALLOCATION
| Industry | | Percent of Total Investments | (a) | |
Banks | 38.8 | % | ||
Insurance | 20.9 | |||
Financial Services | 20.3 | |||
Capital Markets | 17.8 | |||
Consumer Finance | 2.2 | |||
GEOGRAPHIC ALLOCATION
| Country/Geographic Region | | Percent of Total Investments | (a) | |
United States | 54.6 | % | ||
Canada | 7.2 | |||
United Kingdom | 5.1 | |||
Australia | 4.4 | |||
Japan | 4.4 | |||
Switzerland | 3.0 | |||
Germany | 2.7 | |||
France | 2.4 | |||
China | 2.3 | |||
Hong Kong | 2.2 | |||
Sweden | 1.7 | |||
Italy | 1.6 | |||
Netherlands | 1.6 | |||
Spain | 1.5 | |||
Singapore | 1.5 | |||
Brazil | 1.0 | |||
Other (each representing less than 1%) | 2.8 | |||
| (a) | Excludes money market funds. |
| 14 | 2 0 2 3 I SHARES ANNUAL REPORT TO SHAREHOLDERS |
| Fund Summary as of March 31, 2023 | iShares® Global Healthcare ETF |
Investment Objective
The iShares Global Healthcare ETF (the “Fund”) seeks to track the investment results of an index composed of global equities in the healthcare sector, as represented by the S&P Global 1200 Health Care Sector IndexTM (the “Index”). The Fund invests in a representative sample of securities included in the Index that collectively has an investment profile similar to the Index. Due to the use of representative sampling, the Fund may or may not hold all of the securities that are included in the Index.
Performance
| Average Annual Total Returns | Cumulative Total Returns | |||||||||||||||||||||||||||
|
| |||||||||||||||||||||||||||
| 1 Year | 5 Years | 10 Years | 1 Year | 5 Years | 10 Years | |||||||||||||||||||||||
Fund NAV | (3.44 | )% | 10.07 | % | 10.34% | (3.44 | )% | 61.53 | % | 167.40 | % | |||||||||||||||||
Fund Market | (3.73 | ) | 10.00 | 10.31 | (3.73 | ) | 61.07 | 166.80 | ||||||||||||||||||||
Index | (3.73 | ) | 10.05 | 10.39 | (3.73 | ) | 61.39 | 168.72 | ||||||||||||||||||||
GROWTH OF $10,000 INVESTMENT
(AT NET ASSET VALUE)
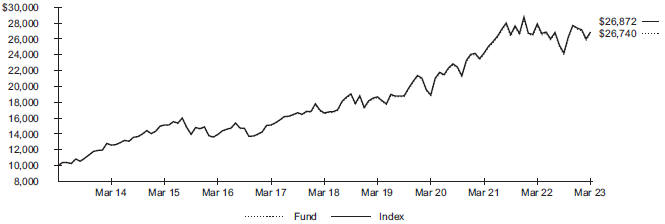
Index performance through January 30, 2013 is calculated using currency exchange (FX) rates corresponding to 5:15 P.M. ET. Index performance beginning on January 31, 2013 is calculated using FX rates corresponding to World Market Reuters 4:00 P.M. London.
Past performance is not an indication of future results. Performance results do not reflect the deduction of taxes that a shareholder would pay on fund distributions or on the redemption or sale of fund shares. See “About Fund Performance” for more information.
Expense Example
| Actual | Hypothetical 5% Return | |||||||||||||||||||||||||
|
|
|
| |||||||||||||||||||||||
| | Beginning Account Value (10/01/22) |
| | Ending Account Value (03/31/23) |
| | Expenses Paid During the Period |
(a) | | Beginning Account Value (10/01/22) |
| | Ending Account Value (03/31/23) |
| | Expenses Paid During the Period |
(a) | | Annualized Expense Ratio |
| ||||||
| $ 1,000.00 | $ 1,112.70 | $ 2.21 | $ 1,000.00 | $ 1,022.80 | $ 2.12 | 0.42 | % | |||||||||||||||||||
| (a) | Expenses are equal to the annualized expense ratio, multiplied by the average account value over the period, multiplied by 182/365 (to reflect the one-half year period shown). Other fees, such as brokerage commissions and other fees to financial intermediaries, may be paid which are not reflected in the tables and examples above. See “Disclosure of Expenses” for more information. |
FUND SUMMARY | 15 |
| Fund Summary as of March 31, 2023 (continued) | iShares® Global Healthcare ETF |
Portfolio Management Commentary
Global healthcare stocks declined slightly during the reporting period. Rising interest rates made the relatively small dividends on healthcare stocks unattractive when compared to investment in the bond markets. Merger and acquisition activity among biotechnology and pharmaceutical companies dropped in 2022 to the lowest levels in years amid heightened U.S. regulatory scrutiny to prevent monopolies in the sector. In this environment, the number of new biotechnology companies launching initial public offerings to raise capital also tightened after two record-setting years.
U.S. companies in the healthcare equipment and supplies industry detracted the most from the Index’s performance. Although demand for elective surgical procedures mostly rebounded from lows during the height of the COVID-19 pandemic, global supply chain pressures, compounded by geopolitical tensions, and rising fuel and energy costs weakened sales and earnings. Lockdowns in China related to the coronavirus pandemic, ongoing high inflation, and foreign exchange losses from the stronger U.S. dollar also pressured financial performance. In addition, a new federal law, the Inflation Reduction Act, gave the government more power to negotiate for lower prescription drug prices with pharmaceutical companies. The stock of a major drugstore chain in the healthcare services industry dropped after a federal healthcare agency downgraded its rating on a prescription drug plan, reducing payments from the government.
Swiss companies in the pharmaceuticals, biotechnology, and life sciences industry also detracted from the Index’s return. Demand for COVID-19 treatments and diagnostic testing kits declined as vaccines against the virus expanded. Russia’s invasion of Ukraine complicated clinical drug trials conducted by a Swiss pharmaceutical company, as a portion of the patients in the studies came from the two warring countries. Competitors’ biosimilar drugs, which have similar active properties as older, licensed drugs, also weakened sales.
Conversely, the pharmaceuticals industry in Denmark contributed to the Index’s performance. The industry benefited from soaring sales and profits from a new anti-obesity drug, outstripping projections. However, the high cost of the drug, lack of insurance coverage, and production delays limited sales growth.
Portfolio Information
INDUSTRY ALLOCATION
| Industry | | Percent of Total Investments | (a) | |
Pharmaceuticals | 41.3 | % | ||
Health Care Equipment & Supplies | 18.5 | |||
Health Care Providers & Services | 15.7 | |||
Biotechnology | 13.6 | |||
Life Sciences Tools & Services | 10.7 | |||
Health Care Technology | 0.2 | |||
GEOGRAPHIC ALLOCATION
| Country/Geographic Region | | Percent of Total Investments | (a) | |
United States | 70.7 | % | ||
Switzerland | 7.9 | |||
Japan | 4.7 | |||
Denmark | 4.4 | |||
United Kingdom | 4.3 | |||
France | 2.8 | |||
Germany | 2.1 | |||
Australia | 1.8 | |||
Other (each representing less than 1%) | 1.3 | |||
| (a) | Excludes money market funds. |
| 16 | 2 0 2 3 I SHARES ANNUAL REPORT TO SHAREHOLDERS |
| Fund Summary as of March 31, 2023 | iShares® Global Industrials ETF |
Investment Objective
The iShares Global Industrials ETF (the “Fund”) seeks to track the investment results of an index composed of global equities in the industrials sector, as represented by the S&P Global 1200 Industrials Sector IndexTM (the “Index”). The Fund invests in a representative sample of securities included in the Index that collectively has an investment profile similar to the Index. Due to the use of representative sampling, the Fund may or may not hold all of the securities that are included in the Index.
Performance
| Average Annual Total Returns | Cumulative Total Returns | |||||||||||||||||||||||||||
|
| |||||||||||||||||||||||||||
| 1 Year | 5 Years | 10 Years | 1 Year | 5 Years | 10 Years | |||||||||||||||||||||||
Fund NAV | 0.22 | % | 6.39 | % | 8.64% | 0.22 | % | 36.31 | % | 129.11 | % | |||||||||||||||||
Fund Market | (0.04 | ) | 6.32 | 8.61 | (0.04 | ) | 35.88 | 128.38 | ||||||||||||||||||||
Index | (0.38 | ) | 6.42 | 8.65 | (0.38 | ) | 36.51 | 129.31 | ||||||||||||||||||||
GROWTH OF $10,000 INVESTMENT
(AT NET ASSET VALUE)
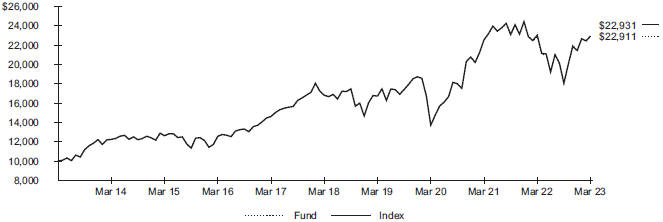
Index performance through January 30, 2013 is calculated using currency exchange (FX) rates corresponding to 5:15 P.M. ET. Index performance beginning on January 31, 2013 is calculated using FX rates corresponding to World Market Reuters 4:00 P.M. London.
Past performance is not an indication of future results. Performance results do not reflect the deduction of taxes that a shareholder would pay on fund distributions or on the redemption or sale of fund shares. See “About Fund Performance” for more information.
Expense Example
| Actual | Hypothetical 5% Return | |||||||||||||||||||||||||
|
|
|
| |||||||||||||||||||||||
| | Beginning Account Value (10/01/22) |
| | Ending Account Value (03/31/23) |
| | Expenses Paid During the Period |
(a) | | Beginning Account Value (10/01/22) |
| | Ending Account Value (03/31/23) |
| | Expenses Paid During the Period |
(a) | | Annualized Expense Ratio |
| ||||||
| $ 1,000.00 | $ 1,274.50 | $ 2.38 | $ 1,000.00 | $ 1,022.80 | $ 2.12 | 0.42 | % | |||||||||||||||||||
| (a) | Expenses are equal to the annualized expense ratio, multiplied by the average account value over the period, multiplied by 182/365 (to reflect the one-half year period shown). Other fees, such as brokerage commissions and other fees to financial intermediaries, may be paid which are not reflected in the tables and examples above. See “Disclosure of Expenses” for more information. |
FUND SUMMARY | 17 |
| Fund Summary as of March 31, 2023 (continued) | iShares® Global Industrials ETF |
Portfolio Management Commentary
Global industrials stocks declined slightly during the reporting period, as manufacturing activity slowed and investors expressed concern over the impacts of a prolonged slowing of economic growth, even as earnings for many companies in the sector improved. Supply-chain constraints led to parts shortages that slowed the delivery of goods. Rising costs of raw materials and fuel also weighed on the profitability of industrials companies.
Japanese industrials stocks, which comprised approximately 14% of the index on average during the reporting period, were the leading detractors from the Index’s performance. Growth among companies within Japan’s professional services industry weakened as a global economic slowdown weighed on demand for their services. Although headquartered in Japan, these companies operate as international conglomerates with business divisions across a wide range of consumer-centric services, including residential real estate, payments, travel booking, and employment websites. As such, these companies were exposed to declines in U.S. labor activity through their ownership of major online job search engines serving that market, which generate a significant portion of their revenue. U.S. job listings decreased sharply, putting a strain on operational margins. Being online businesses, these companies were also exposed to a persistent selloff affecting stocks of U.S. companies broadly focused on technology. Domestically, these Japanese conglomerates felt the impact of rising inflation on consumer and business spending. A weakened Japanese yen also increased the cost of imports, contributing to record trade deficits.
On the upside, the German capital goods industry was a notable contributor to the Index’s performance, as demand for industrial goods remained strong in the face of macroeconomic headwinds. Industrial conglomerates reported a record-high backlog of orders and an increase in revenues across multiple business units. These conglomerates continued expansion in newer areas of growth, while divesting less strategic businesses.
The French capital goods industry also contributed to performance, led by aerospace and defense companies. A sizable increase in French defense spending and growing demand for engine parts from airplane manufacturers lifted investor sentiment.
Portfolio Information
INDUSTRY ALLOCATION
| Industry | | Percent of Total Investments | (a) | |
Capital Goods | 67.2 | % | ||
Transportation | 18.6 | |||
Commercial & Professional Services | 14.2 | |||
GEOGRAPHIC ALLOCATION
| Country/Geographic Region | | Percent of Total Investments | (a) | |
United States | 53.4 | % | ||
Japan | 13.8 | |||
France | 7.4 | |||
United Kingdom | 4.7 | |||
Germany | 4.3 | |||
Canada | 3.7 | |||
Sweden | 3.4 | |||
Switzerland | 2.5 | |||
Denmark | 1.4 | |||
Australia | 1.0 | |||
Other (each representing less than 1%) | 4.4 | |||
| (a) | Excludes money market funds. |
| 18 | 2 0 2 3 I SHARES ANNUAL REPORT TO SHAREHOLDERS |
| Fund Summary as of March 31, 2023 | iShares® Global Materials ETF |
Investment Objective
The iShares Global Materials ETF (the “Fund”) seeks to track the investment results of an index composed of global equities in the materials sector, as represented by the S&P Global 1200 Materials Sector IndexTM (the “Index”). The Fund invests in a representative sample of securities included in the Index that collectively has an investment profile similar to the Index. Due to the use of representative sampling, the Fund may or may not hold all of the securities that are included in the Index.
Performance
| Average Annual Total Returns | Cumulative Total Returns | |||||||||||||||||||||||||||
|
| |||||||||||||||||||||||||||
| 1 Year | 5 Years | 10 Years | 1 Year | 5 Years | 10 Years | |||||||||||||||||||||||
Fund NAV | (6.77 | )% | 7.77 | % | 6.27% | (6.77 | )% | 45.38 | % | 83.76 | % | |||||||||||||||||
Fund Market | (6.89 | ) | 7.64 | 6.29 | (6.89 | ) | 44.47 | 83.98 | ||||||||||||||||||||
Index | (7.24 | ) | 7.87 | 6.39 | (7.24 | ) | 46.08 | 85.71 | ||||||||||||||||||||
GROWTH OF $10,000 INVESTMENT
(AT NET ASSET VALUE)
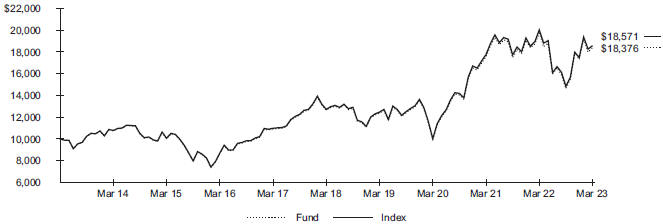
Index performance through January 30, 2013 is calculated using currency exchange (FX) rates corresponding to 5:15 P.M. ET. Index performance beginning on January 31, 2013 is calculated using FX rates corresponding to World Market Reuters 4:00 P.M. London.
Past performance is not an indication of future results. Performance results do not reflect the deduction of taxes that a shareholder would pay on fund distributions or on the redemption or sale of fund shares. See “About Fund Performance” for more information.
Expense Example
| Actual | Hypothetical 5% Return | |||||||||||||||||||||||||
|
|
|
| |||||||||||||||||||||||
| | Beginning Account Value (10/01/22) |
| | Ending Account Value (03/31/23) |
| | Expenses Paid During the Period |
(a) | | Beginning Account Value (10/01/22) |
| | Ending Account Value (03/31/23) |
| | Expenses Paid During the Period |
(a) | | Annualized Expense Ratio |
| ||||||
| $ 1,000.00 | $ 1,255.80 | $ 2.36 | $ 1,000.00 | $ 1,022.80 | $ 2.12 | 0.42 | % | |||||||||||||||||||
| (a) | Expenses are equal to the annualized expense ratio, multiplied by the average account value over the period, multiplied by 182/365 (to reflect the one-half year period shown). Other fees, such as brokerage commissions and other fees to financial intermediaries, may be paid which are not reflected in the tables and examples above. See “Disclosure of Expenses” for more information. |
FUND SUMMARY | 19 |
| Fund Summary as of March 31, 2023 (continued) | iShares® Global Materials ETF |
Portfolio Management Commentary
Global materials stocks declined during the reporting period. Rising interest rates and the slowing global economic outlook weakened metals prices from the high levels reached in the months after Russia’s invasion of Ukraine disrupted world markets. In addition, rising expenses for mining extraction and production pressured profit margins for mining companies, as the cost of labor, diesel and other energy, explosives, and raw materials increased. Extreme weather, leading to floods and droughts, disrupted mining operations and reduced output.
U.S. stocks detracted the most from the Index’s performance, led by the metals and mining industry. A sharp drop in gold prices sent the stock prices of U.S. gold mining companies lower. After starting the reporting period at historically high levels, with Russia’s invasion of Ukraine raising geopolitical uncertainty, gold prices trended lower amid rising interest rates and a stronger U.S. dollar. Although gold prices rallied higher beginning in November, high production costs weighed on the profit margins of gold mining companies. The stocks of copper mining companies also fell. Copper prices dropped sharply over the first four months of the reporting period as the global economic outlook worsened and COVID-19 related lockdowns in China weakened demand in the world’s largest market for the metal.
Stocks of British companies in the materials sector also detracted from the Index’s performance. British metals and mining companies warned that logistical bottlenecks, extreme weather, and lingering production issues related to the COVID-19 pandemic would likely weaken production of various metals for several years. The lower production expectations, combined with escalating production costs, weakened the earnings outlook for the industry.
Canadian companies in the metals and mining industry also detracted from the Index’s return. Gold mining companies struggled to raise production, even as gold prices rebounded late in the reporting period, as repairs and upgrades stalled operations. Meanwhile, slumping copper prices, combined with escalated costs and operational challenges, squeezed profit margins for copper mining companies.
Portfolio Information
INDUSTRY ALLOCATION
| Industry | | Percent of Total Investments | (a) | |
Chemicals | 47.9 | % | ||
Metals & Mining | 39.3 | |||
Construction Materials | 6.1 | |||
Containers & Packaging | 4.9 | |||
Paper & Forest Products | 1.8 | |||
GEOGRAPHIC ALLOCATION
| Country/Geographic Region | | Percent of Total Investments | (a) | |
United States | 37.2 | % | ||
Australia | 12.0 | |||
United Kingdom | 9.1 | |||
Canada | 7.7 | |||
Japan | 6.5 | |||
Switzerland | 4.7 | |||
France | 4.6 | |||
Germany | 3.3 | |||
Brazil | 2.7 | |||
South Korea | 2.0 | |||
Ireland | 1.9 | |||
Netherlands | 1.4 | |||
Taiwan | 1.1 | |||
Finland | 1.1 | |||
Other (each representing less than 1%) | 4.7 | |||
| (a) | Excludes money market funds. |
| 20 | 2 0 2 3 I SHARES ANNUAL REPORT TO SHAREHOLDERS |
| Fund Summary as of March 31, 2023 | iShares® Global Tech ETF |
Investment Objective
The iShares Global Tech ETF (the “Fund”) seeks to track the investment results of an index composed of global equities in the technology sector, as represented by the S&P Global 1200 Information Technology Sector IndexTM (the “Index”). The Fund invests in a representative sample of securities included in the Index that collectively has an investment profile similar to the Index. Due to the use of representative sampling, the Fund may or may not hold all of the securities that are included in the Index.
On February 16, 2023, the Board approved a proposal to change the Fund’s index to S&P Global 1200 Information Technology 4.5/22.5/45 Capped Index. This change became effective on April 20, 2023.
Performance
| Average Annual Total Returns | Cumulative Total Returns | |||||||||||||||||||||||||||
|
| |||||||||||||||||||||||||||
| 1 Year | 5 Years | 10 Years | 1 Year | 5 Years | 10 Years | |||||||||||||||||||||||
Fund NAV | (5.34 | )% | 16.62 | % | 17.80% | (5.34 | )% | 115.71 | % | 414.74 | % | |||||||||||||||||
Fund Market | (5.60 | ) | 16.54 | 17.79 | (5.60 | ) | 114.94 | 414.24 | ||||||||||||||||||||
Index | (5.49 | ) | 16.76 | 17.94 | (5.49 | ) | 117.05 | 420.75 | ||||||||||||||||||||
GROWTH OF $10,000 INVESTMENT
(AT NET ASSET VALUE)
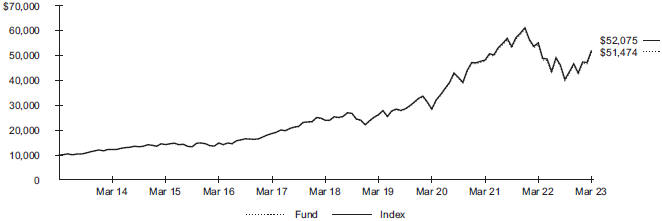
Index performance through January 30, 2013 is calculated using currency exchange (FX) rates corresponding to 5:15 P.M. ET. Index performance beginning on January 31, 2013 is calculated using FX rates corresponding to World Market Reuters 4:00 P.M. London.
Past performance is not an indication of future results. Performance results do not reflect the deduction of taxes that a shareholder would pay on fund distributions or on the redemption or sale of fund shares. See “About Fund Performance” for more information.
Expense Example
| Actual | Hypothetical 5% Return | |||||||||||||||||||||||||
|
|
|
| |||||||||||||||||||||||
| | Beginning Account Value (10/01/22) |
| | Ending Account Value (03/31/23) |
| | Expenses Paid During the Period |
(a) | | Beginning Account Value (10/01/22) |
| | Ending Account Value (03/31/23) |
| | Expenses Paid During the Period |
(a) | | Annualized Expense Ratio |
| ||||||
| $ 1,000.00 | $ 1,291.50 | $ 2.40 | $ 1,000.00 | $ 1,022.80 | $ 2.12 | 0.42 | % | |||||||||||||||||||
| (a) | Expenses are equal to the annualized expense ratio, multiplied by the average account value over the period, multiplied by 182/365 (to reflect the one-half year period shown). Other fees, such as brokerage commissions and other fees to financial intermediaries, may be paid which are not reflected in the tables and examples above. See “Disclosure of Expenses” for more information. |
FUND SUMMARY | 21 |
| Fund Summary as of March 31, 2023 (continued) | iShares® Global Tech ETF |
Portfolio Management Commentary
Global information technology stocks declined moderately during the reporting period, as the return to pre-pandemic life and looming recession concerns weighed on companies’ growth. The reopening of physical restaurants and stores encouraged consumers to spend less time and money online. Businesses that were avid buyers of computing equipment in the early days of the pandemic scaled back purchases, softening demand. Persistently high inflation, especially in the U.S., limited what households opted to spend on technology and e-commerce.
U.S. information technology stocks, which comprised approximately 82% of the Index on average during the reporting period, were the largest detractor from the Index’s return, led by the U.S. information technology services industry. Online payment providers experienced a slowdown in growth amid a decline in transaction volumes. Meanwhile, more established companies in the industry faced increasing competition for e-commerce payment activity from newer applications. Companies in the industry cut revenue forecasts, further dampening sentiment among investors who believed that this signaled difficulties in generating organic growth in an increasingly challenging economy.
The U.S. software and services industry also detracted notably from the Index’s return, as demand for both hardware and software diminished and global shipments of computers fell significantly. Schools, governments, and businesses exhausted their need for computing equipment to facilitate remote working and learning, while high inflation and recession fears curtailed corporate spending on cloud services and personal computers. Consumer interest in videogaming waned, dampening appetite for gaming computer cards and consoles. Currency fluctuations put further strain on revenues, as a strengthening U.S. dollar translated into reduced earnings from non-U.S. sales.
Companies in the Taiwanese semiconductor industry also weighed on performance. Global demand for chips slowed, while investors expressed concerns about the impact of new U.S. restrictions on technology exports to China on the industry.
Additionally, the South Korean technology hardware and equipment industry modestly detracted from the Index’s return. Memory chip producers faced an oversupply of inventory, fueling a decline in profitability.
Portfolio Information
INDUSTRY ALLOCATION
| Industry | | Percent of Total Investments | (a) | |
Software | 31.6 | % | ||
Semiconductors & Semiconductor Equipment | 28.6 | |||
Technology Hardware, Storage & Peripherals | 26.4 | |||
IT Services | 5.3 | |||
Electronic Equipment, Instruments & Components | 4.8 | |||
Communications Equipment | 3.3 | |||
GEOGRAPHIC ALLOCATION
| Country/Geographic Region | | Percent of Total Investments | (a) | |
United States | 81.3 | % | ||
Taiwan | 4.1 | |||
Japan | 3.7 | |||
South Korea | 3.2 | |||
Netherlands | 2.7 | |||
Germany | 1.8 | |||
Canada | 1.2 | |||
Other (each representing less than 1%) | 2.0 | |||
| (a) | Excludes money market funds. |
| 22 | 2 0 2 3 I SHARES ANNUAL REPORT TO SHAREHOLDERS |
| Fund Summary as of March 31, 2023 | iShares® Global Utilities ETF |
Investment Objective
The iShares Global Utilities ETF (the “Fund”) seeks to track the investment results of an index composed of global equities in the utilities sector, as represented by the S&P Global 1200 Utilities (Sector) Capped Index (the “Index”). The Fund invests in a representative sample of securities included in the Index that collectively has an investment profile similar to the Index. Due to the use of representative sampling, the Fund may or may not hold all of the securities that are included in the Index.
Performance
| Average Annual Total Returns | Cumulative Total Returns | |||||||||||||||||||||||||||
|
| |||||||||||||||||||||||||||
| 1 Year | 5 Years | 10 Years | 1 Year | 5 Years | 10 Years | |||||||||||||||||||||||
Fund NAV | (4.93 | )% | 7.67 | % | 7.12% | (4.93 | )% | 44.69 | % | 98.91 | % | |||||||||||||||||
Fund Market | (5.39 | ) | 7.59 | 7.12 | (5.39 | ) | 44.17 | 98.88 | ||||||||||||||||||||
Index | (5.64 | ) | 7.29 | 6.78 | (5.64 | ) | 42.14 | 92.67 | ||||||||||||||||||||
GROWTH OF $10,000 INVESTMENT
(AT NET ASSET VALUE)

Index performance through January 30, 2013 is calculated using currency exchange (FX) rates corresponding to 5:15 P.M. ET. Index performance beginning on January 31, 2013 is calculated using FX rates corresponding to World Market Reuters 4:00 P.M. London.
Past performance is not an indication of future results. Performance results do not reflect the deduction of taxes that a shareholder would pay on fund distributions or on the redemption or sale of fund shares. See “About Fund Performance” for more information.
Expense Example
| Actual | Hypothetical 5% Return | |||||||||||||||||||||||||
|
|
|
| |||||||||||||||||||||||
| | Beginning Account Value (10/01/22) |
| | Ending Account Value (03/31/23) |
| | Expenses Paid During the Period |
(a) | | Beginning Account Value (10/01/22) |
| | Ending Account Value (03/31/23) |
| | Expenses Paid During the Period |
(a) | | Annualized Expense Ratio |
| ||||||
| $ 1,000.00 | $ 1,122.40 | $ 2.38 | $ 1,000.00 | $ 1,022.70 | $ 2.27 | 0.45 | % | |||||||||||||||||||
| (a) | Expenses are equal to the annualized expense ratio, multiplied by the average account value over the period, multiplied by 182/365 (to reflect the one-half year period shown). Other fees, such as brokerage commissions and other fees to financial intermediaries, may be paid which are not reflected in the tables and examples above. See “Disclosure of Expenses” for more information. |
FUND SUMMARY | 23 |
| Fund Summary as of March 31, 2023 (continued) | iShares® Global Utilities ETF |
Portfolio Management Commentary
Global utilities stocks declined for the reporting period in an environment of rising interest rates and elevated inflation. Bond yields rose along with interest rates, making bonds a more attractive investment for yield-seeking investors relative to the regular dividends paid by most utilities companies. Higher interest rates also drove borrowing costs higher, which negatively impacted the highly indebted utilities sector.
U.S. utilities detracted the most from the Index’s performance as the Fed raised interest rates eight times, sending U.S. bond yields higher and weighing on the value of utilities stocks. Within the sector, multi-utilities were the largest source of weakness. Disappointing financial performance led a large company in the industry to conduct a strategic review of its finances. Increased costs of fuel, supply chain disruptions, and elevated inflation drove higher utility rates for customers and negatively impacted the industry’s finances. After regulators took an unfavorable stance regarding commitments for a planned investment in a wind project, a negotiated settlement removed a guaranteed energy performance threshold that required the company to pay the entirety of replacement costs for replacement energy generation. Electric utilities stocks also declined, as lower than expected revenues weighed on the industry. High levels of variable-rate debt also worked against profitability, as rising interest rates increased financing expenses.
Canadian utilities also detracted from the Index’s performance, as disappointing earnings and higher borrowing costs in the multi-utilities industry prompted concern from investors about the sustainability of dividend payments. The Danish electric utilities industry faced earnings pressure from higher interest rates and cost inflation, and the deteriorating outlook prompted a write-down of the value of a large wind project.
On the upside, Spanish and French utilities companies contributed modestly to the Index’s return. Investments in expanding capacity in North and South America helped the Spanish electric utilities industry to offset declining domestic earnings. In France, the multi-utilities industry benefited from higher natural gas prices early in the reporting period, boosting profitability and driving a planned dividend increase.
Portfolio Information
INDUSTRY ALLOCATION
| Industry | | Percent of Total Investments | (a) | |
Electric Utilities | 61.1 | % | ||
Multi-Utilities | 28.9 | |||
Gas Utilities | 3.9 | |||
Water Utilities | 3.1 | |||
Independent Power and Renewable Electricity Producers | 3.0 | |||
GEOGRAPHIC ALLOCATION
| Country/Geographic Region | | Percent of Total Investments | (a) | |
United States | 64.5 | % | ||
United Kingdom | 6.7 | |||
Spain | 6.4 | |||
Italy | 4.6 | |||
Canada | 4.1 | |||
Germany | 3.8 | |||
France | 3.3 | |||
Japan | 2.0 | |||
Australia | 1.1 | |||
Denmark | 1.1 | |||
Portugal | 1.0 | |||
Other (each representing less than 1%) | 1.4 | |||
| (a) | Excludes money market funds. |
| 24 | 2 0 2 3 I SHARES ANNUAL REPORT TO SHAREHOLDERS |
Past performance is not an indication of future results. Financial markets have experienced extreme volatility and trading in many instruments has been disrupted. These circumstances may continue for an extended period of time and may continue to affect adversely the value and liquidity of each Fund’s investments. As a result, current performance may be lower or higher than the performance data quoted. Performance data current to the most recent month-end is available at iShares.com. Performance results assume reinvestment of all dividends and capital gain distributions and do not reflect the deduction of taxes that a shareholder would pay on fund distributions or on the redemption or sale of fund shares. The investment return and principal value of shares will vary with changes in market conditions. Shares may be worth more or less than their original cost when they are redeemed or sold in the market. Performance for certain funds may reflect a waiver of a portion of investment advisory fees. Without such a waiver, performance would have been lower.
Net asset value or “NAV” is the value of one share of a fund as calculated in accordance with the standard formula for valuing mutual fund shares. Beginning August 10, 2020, the price used to calculate market return (“Market Price”) is the closing price. Prior to August 10, 2020, Market Price was determined using the midpoint between the highest bid and the lowest ask on the primary stock exchange on which shares of a fund are listed for trading, as of the time that such fund’s NAV is calculated. Market and NAV returns assume that dividends and capital gain distributions have been reinvested at Market Price and NAV, respectively.
An index is a statistical composite that tracks a specified financial market or sector. Unlike a fund, an index does not actually hold a portfolio of securities and therefore does not incur the expenses incurred by a fund. These expenses negatively impact fund performance. Also, market returns do not include brokerage commissions that may be payable on secondary market transactions. If brokerage commissions were included, market returns would be lower.
Shareholders of each Fund may incur the following charges: (1) transactional expenses, including brokerage commissions on purchases and sales of fund shares and (2) ongoing expenses, including management fees and other fund expenses. The expense examples shown (which are based on a hypothetical investment of $1,000 invested at the beginning of the period and held through the end of the period) are intended to assist shareholders both in calculating expenses based on an investment in each Fund and in comparing these expenses with similar costs of investing in other funds.
The expense examples provide information about actual account values and actual expenses. Annualized expense ratios reflect contractual and voluntary fee waivers, if any. In order to estimate the expenses a shareholder paid during the period covered by this report, shareholders can divide their account value by $1,000 and then multiply the result by the number under the heading entitled “Expenses Paid During the Period.”
The expense examples also provide information about hypothetical account values and hypothetical expenses based on a fund’s actual expense ratio and an assumed rate of return of 5% per year before expenses. In order to assist shareholders in comparing the ongoing expenses of investing in the Funds and other funds, compare the 5% hypothetical examples with the 5% hypothetical examples that appear in the shareholder reports of the other funds.
The expenses shown in the expense examples are intended to highlight shareholders’ ongoing costs only and do not reflect any transactional expenses, such as brokerage commissions and other fees paid on purchases and sales of fund shares. Therefore, the hypothetical examples are useful in comparing ongoing expenses only and will not help shareholders determine the relative total expenses of owning different funds. If these transactional expenses were included, shareholder expenses would have been higher.
ABOUT FUND PERFORMANCE / DISCLOSURE OF EXPENSES | 25 |
March 31, 2023 | iShares® Global Comm Services ETF (Percentages shown are based on Net Assets) |
| Security | Shares | Value | ||||||
Common Stocks | ||||||||
Australia — 1.1% | ||||||||
SEEK Ltd. | 24,696 | $ | 399,213 | |||||
Telstra Corp. Ltd. | 811,324 | 2,297,184 | ||||||
|
| |||||||
| 2,696,397 | ||||||||
| Canada — 2.7% | ||||||||
BCE Inc. | 64,032 | 2,868,292 | ||||||
Rogers Communications Inc., Class B, NVS | 24,605 | 1,140,405 | ||||||
Shaw Communications Inc., Class B, NVS | 31,483 | 942,044 | ||||||
TELUS Corp. | 100,169 | 1,988,557 | ||||||
|
| |||||||
| 6,939,298 | ||||||||
| China — 10.4% | ||||||||
Baidu Inc.(a) | 159,300 | 3,001,414 | ||||||
Kuaishou Technology(a)(b) | 137,600 | 1,058,050 | ||||||
NetEase Inc. | 128,600 | 2,270,159 | ||||||
Tencent Holdings Ltd. | 416,300 | 20,344,287 | ||||||
|
| |||||||
| 26,673,910 | ||||||||
| Finland — 0.3% | ||||||||
Elisa OYJ | 10,544 | 635,923 | ||||||
|
| |||||||
France — 1.3% | ||||||||
Orange SA | 132,594 | 1,575,240 | ||||||
Publicis Groupe SA | 16,607 | 1,296,339 | ||||||
Vivendi SE | 56,523 | 571,535 | ||||||
|
| |||||||
| 3,443,114 | ||||||||
| Germany —2.3% | ||||||||
Deutsche Telekom AG, Registered | 245,096 | 5,939,238 | ||||||
|
| |||||||
Italy —0.1% | ||||||||
Telecom Italia SpA/Milano(a) | 719,185 | 237,175 | ||||||
|
| |||||||
Japan — 7.3% | ||||||||
Dentsu Group Inc. | 15,800 | 556,923 | ||||||
KDDI Corp. | 110,000 | 3,392,152 | ||||||
Nexon Co. Ltd. | 31,700 | 756,957 | ||||||
Nintendo Co. Ltd. | 82,100 | 3,188,892 | ||||||
Nippon Telegraph & Telephone Corp. | 160,200 | 4,787,211 | ||||||
SoftBank Corp. | 195,000 | 2,251,040 | ||||||
SoftBank Group Corp. | 83,500 | 3,282,677 | ||||||
Z Holdings Corp. | 186,900 | 529,946 | ||||||
|
| |||||||
| 18,745,798 | ||||||||
| Mexico — 0.7% | ||||||||
America Movil SAB de CV | 1,387,459 | 1,457,525 | ||||||
Grupo Televisa SAB, CPO | 185,020 | 195,801 | ||||||
Sitios Latinoamerica SAB de CV(a) | 1,760 | 728 | ||||||
|
| |||||||
| 1,654,054 | ||||||||
| Netherlands — 0.8% | ||||||||
Koninklijke KPN NV | 223,921 | 791,240 | ||||||
Universal Music Group NV | 53,483 | 1,354,443 | ||||||
|
| |||||||
| 2,145,683 | ||||||||
| Norway —0.2% | ||||||||
Telenor ASA | 45,068 | 528,430 | ||||||
|
| |||||||
South Korea — 1.1% | ||||||||
Kakao Corp. | 21,895 | 1,036,921 | ||||||
NAVER Corp. | 10,481 | 1,642,278 | ||||||
|
| |||||||
| 2,679,199 | ||||||||
| Spain — 1.3% | ||||||||
Cellnex Telecom SA(b) | 41,664 | 1,620,214 | ||||||
| Security | Shares | Value | ||||||
| Spain (continued) | ||||||||
Telefonica SA | 405,523 | $ | 1,746,512 | |||||
|
| |||||||
| 3,366,726 | ||||||||
| Sweden — 0.4% | ||||||||
Embracer Group AB(a)(c) | 58,176 | 272,691 | ||||||
Tele2 AB, Class B | 39,108 | 389,245 | ||||||
Telia Co. AB | 171,337 | 435,069 | ||||||
|
| |||||||
| 1,097,005 | ||||||||
| Switzerland — 0.4% | ||||||||
Swisscom AG, Registered | 1,782 | 1,137,222 | ||||||
|
| |||||||
Taiwan — 0.4% | ||||||||
Chunghwa Telecom Co. Ltd. | 267,120 | 1,050,021 | ||||||
|
| |||||||
| United Kingdom — 2.2% | ||||||||
Auto Trader Group PLC(b) | 67,831 | 517,394 | ||||||
BT Group PLC | 489,876 | 882,427 | ||||||
Informa PLC | 99,380 | 851,831 | ||||||
Rightmove PLC | 61,060 | 425,016 | ||||||
Vodafone Group PLC | 1,881,811 | 2,075,820 | ||||||
WPP PLC | 75,477 | 896,735 | ||||||
|
| |||||||
| 5,649,223 | ||||||||
| United States — 66.7% | ||||||||
Activision Blizzard Inc. | 50,008 | 4,280,185 | ||||||
Alphabet Inc., Class A(a) | 305,932 | 31,734,326 | ||||||
Alphabet Inc., Class C, NVS(a) | 266,697 | 27,736,488 | ||||||
AT&T Inc. | 500,511 | 9,634,837 | ||||||
Charter Communications Inc., Class A(a) | 7,396 | 2,644,884 | ||||||
Comcast Corp., Class A | 295,378 | 11,197,780 | ||||||
DISH Network Corp., Class A(a) | 17,398 | 162,323 | ||||||
Electronic Arts Inc. | 18,290 | 2,203,030 | ||||||
Fox Corp., Class A, NVS | 20,846 | 709,806 | ||||||
Fox Corp., Class B | 9,626 | 301,390 | ||||||
Interpublic Group of Companies Inc. (The) | 27,278 | 1,015,833 | ||||||
Live Nation Entertainment Inc.(a) | 10,008 | 700,560 | ||||||
Match Group Inc.(a) | 19,609 | 752,789 | ||||||
Meta Platforms Inc, Class A(a) | 153,885 | 32,614,387 | ||||||
Netflix Inc.(a) | 31,271 | 10,803,505 | ||||||
News Corp., Class A, NVS | 26,704 | 461,178 | ||||||
News Corp., Class B | 8,311 | 144,861 | ||||||
Omnicom Group Inc. | 14,235 | 1,342,930 | ||||||
Paramount Global, Class B, NVS | 35,456 | 791,023 | ||||||
Take-Two Interactive Software Inc.(a) | 11,132 | 1,328,048 | ||||||
T-Mobile U.S. Inc.(a) | 41,590 | 6,023,896 | ||||||
Verizon Communications Inc. | 288,180 | 11,207,320 | ||||||
Walt Disney Co. (The)(a) | 108,916 | 10,905,759 | ||||||
Warner Bros. Discovery Inc.(a)(c) | 155,170 | 2,343,067 | ||||||
|
| |||||||
| 171,040,205 | ||||||||
|
| |||||||
Total Common Stocks — 99.7% | 255,658,621 | |||||||
|
| |||||||
Preferred Stocks | ||||||||
Italy — 0.0% | ||||||||
Telecom Italia SpA/Milano, Preference Shares, NVS(a) | 422,595 | 135,853 | ||||||
|
| |||||||
Total Preferred Stocks — 0.0% | 135,853 | |||||||
|
| |||||||
Total Long-Term Investments — 99.7% | 255,794,474 | |||||||
|
| |||||||
| 26 | 2 0 2 3 I SHARES ANNUAL REPORT TO SHAREHOLDERS |
Schedule of Investments (continued) March 31, 2023 | iShares® Global Comm Services ETF (Percentages shown are based on Net Assets) |
| Security | Shares | Value | ||||||
| ||||||||
Short-Term Securities | ||||||||
| Money Market Funds — 0.6% | ||||||||
BlackRock Cash Funds: Institutional, SL Agency Shares, 5.01%(d)(e)(f) | 1,023,737 | $ | 1,024,044 | |||||
BlackRock Cash Funds: Treasury, SL Agency Shares, 4.73%(d)(e) | 540,000 | 540,000 | ||||||
|
| |||||||
Total Short-Term Securities — 0.6% |
| 1,564,044 | ||||||
|
| |||||||
Total Investments — 100.3% |
| 257,358,518 | ||||||
Liabilities in Excess of Other Assets — (0.3)% |
| (818,353 | ) | |||||
|
| |||||||
Net Assets — 100.0% |
| $ | 256,540,165 | |||||
|
| |||||||
| (a) | Non-income producing security. |
| (b) | Security exempt from registration pursuant to Rule 144A under the Securities Act of 1933, as amended. These securities may be resold in transactions exempt from registration to qualified institutional investors. |
| (c) | All or a portion of this security is on loan. |
| (d) | Affiliate of the Fund. |
| (e) | Annualized 7-day yield as of period end. |
| (f) | All or a portion of this security was purchased with the cash collateral from loaned securities. |
Affiliates
Investments in issuers considered to be affiliate(s) of the Fund during the year ended March 31, 2023 for purposes of Section 2(a)(3) of the Investment Company Act of 1940, as amended, were as follows:
| ||||||||||||||||||||||||||||||||||||
| Affiliated Issuer | Value at 03/31/22 | Purchases at Cost | Proceeds from Sale | Net Realized Gain (Loss) | Change in Unrealized Appreciation (Depreciation) | Value at 03/31/23 | Shares Held at 03/31/23 | Income | Capital Gain Distributions from Underlying Funds | |||||||||||||||||||||||||||
| ||||||||||||||||||||||||||||||||||||
BlackRock Cash Funds: Institutional, SL Agency Shares | $ | — | $ | 1,023,535 | (a) | $ | — | $ | 699 | $ | (190 | ) | $ | 1,024,044 | 1,023,737 | $ | 10,328 | (b) | $ | — | ||||||||||||||||
BlackRock Cash Funds: Treasury, SL Agency Shares | 330,000 | 210,000 | (a) | — | — | — | 540,000 | 540,000 | 7,542 | — | ||||||||||||||||||||||||||
|
|
|
|
|
|
|
|
|
| |||||||||||||||||||||||||||
| $ | 699 | $ | (190 | ) | $ | 1,564,044 | $ | 17,870 | $ | — | ||||||||||||||||||||||||||
|
|
|
|
|
|
|
|
|
| |||||||||||||||||||||||||||
| (a) | Represents net amount purchased (sold). |
| (b) | All or a portion represents securities lending income earned from the reinvestment of cash collateral from loaned securities, net of fees and collateral investment expenses, and other payments to and from borrowers of securities. |
Derivative Financial Instruments Outstanding as of Period End
Futures Contracts
| ||||||||||||||||
| Description | Number of Contracts | Expiration Date | Notional Amount (000) | Value/ Unrealized Appreciation (Depreciation) | ||||||||||||
| ||||||||||||||||
Long Contracts | ||||||||||||||||
Mini TOPIX Index | 10 | 06/08/23 | $ | 152 | $ | 4,682 | ||||||||||
E-Mini S&P Communication Services Select Sector Index | 6 | 06/16/23 | 459 | 17,560 | ||||||||||||
Euro STOXX 50 Index | 2 | 06/16/23 | 92 | 3,522 | ||||||||||||
|
| |||||||||||||||
| $ | 25,764 | |||||||||||||||
|
| |||||||||||||||
SCHEDULE OF INVESTMENTS | 27 |
Schedule of Investments (continued) March 31, 2023 | iShares® Global Comm Services ETF |
Derivative Financial Instruments Categorized by Risk Exposure
As of period end, the fair values of derivative financial instruments located in the Statements of Assets and Liabilities were as follows:
| ||||||||||||||||||||||||||||
| Commodity Contracts | Credit Contracts | Equity Contracts | Foreign Currency Exchange Contracts | Interest Rate Contracts | Other Contracts | Total | ||||||||||||||||||||||
| ||||||||||||||||||||||||||||
Assets — Derivative Financial Instruments | ||||||||||||||||||||||||||||
Futures contracts | ||||||||||||||||||||||||||||
Unrealized appreciation on futures contracts(a) | $ | — | $ | — | $ | 25,764 | $ | — | $ | — | $ | — | $ | 25,764 | ||||||||||||||
|
|
|
|
|
|
|
|
|
|
|
|
|
| |||||||||||||||
| (a) | Net cumulative unrealized appreciation (depreciation) on futures contracts are reported in the Schedule of Investments. In the Statements of Assets and Liabilities, only current day’s variation margin is reported in receivables or payables and the net cumulative unrealized appreciation (depreciation) is included in accumulated earnings (loss). |
For the period ended March 31, 2023, the effect of derivative financial instruments in the Statements of Operations was as follows:
| ||||||||||||||||||||||||||||
| Commodity Contracts | Credit Contracts | Equity Contracts | Foreign Currency Exchange Contracts | Interest Rate Contracts | Other Contracts | Total | ||||||||||||||||||||||
| ||||||||||||||||||||||||||||
Net Realized Gain (Loss) from | ||||||||||||||||||||||||||||
Futures contracts | $ | — | $ | — | $ | (32,611 | ) | $ | — | $ | — | $ | — | $ | (32,611 | ) | ||||||||||||
|
|
|
|
|
|
|
|
|
|
|
|
|
| |||||||||||||||
Net Change in Unrealized Appreciation (Depreciation) on | ||||||||||||||||||||||||||||
Futures contracts | $ | — | $ | — | $ | 32,579 | $ | — | $ | — | $ | — | $ | 32,579 | ||||||||||||||
|
|
|
|
|
|
|
|
|
|
|
|
|
| |||||||||||||||
Average Quarterly Balances of Outstanding Derivative Financial Instruments
| ||||
Futures contracts | ||||
Average notional value of contracts — long | $ | 312,216 | ||
| ||||
For more information about the Fund’s investment risks regarding derivative financial instruments, refer to the Notes to Financial Statements.
Fair Value Hierarchy as of Period End
Various inputs are used in determining the fair value of financial instruments. For a description of the input levels and information about the Fund’s policy regarding valuation of financial instruments, refer to the Notes to Financial Statements.
The following table summarizes the Fund’s financial instruments categorized in the fair value hierarchy. The breakdown of the Fund’s financial instruments into major categories is disclosed in the Schedule of Investments above.
| ||||||||||||||||
| Level 1 | Level 2 | Level 3 | Total | |||||||||||||
| ||||||||||||||||
Assets | ||||||||||||||||
Investments | ||||||||||||||||
Long-Term Investments | ||||||||||||||||
Common Stocks | $ | 179,633,557 | $ | 76,025,064 | $ | — | $ | 255,658,621 | ||||||||
Preferred Stocks | — | 135,853 | — | 135,853 | ||||||||||||
Short-Term Securities | ||||||||||||||||
Money Market Funds | 1,564,044 | — | — | 1,564,044 | ||||||||||||
|
|
|
|
|
|
|
| |||||||||
| $ | 181,197,601 | $ | 76,160,917 | $ | — | $ | 257,358,518 | |||||||||
|
|
|
|
|
|
|
| |||||||||
Derivative Financial Instruments(a) | ||||||||||||||||
Assets | ||||||||||||||||
Equity Contracts | $ | 17,560 | $ | 8,204 | $ | — | $ | 25,764 | ||||||||
|
|
|
|
|
|
|
| |||||||||
| (a) | Derivative financial instruments are futures contracts. Futures contracts are valued at the unrealized appreciation (depreciation) on the instrument. |
See notes to financial statements.
| 28 | 2 0 2 3 I SHARES ANNUAL REPORT TO SHAREHOLDERS |
Schedule of Investments March 31, 2023 | iShares® Global Consumer Discretionary ETF (Percentages shown are based on Net Assets) |
| Security | Shares | Value | ||||||
Common Stocks | ||||||||
| Australia — 1.2% | ||||||||
Aristocrat Leisure Ltd. | 36,867 | $ | 921,768 | |||||
Lottery Corp. Ltd. (The) | 124,827 | 429,325 | ||||||
Wesfarmers Ltd. | 63,590 | 2,149,247 | ||||||
|
| |||||||
| 3,500,340 | ||||||||
| Brazil — 0.1% | ||||||||
Lojas Renner SA | 53,987 | 176,497 | ||||||
Magazine Luiza SA(a) | 155,896 | 101,809 | ||||||
|
| |||||||
| 278,306 | ||||||||
| Canada — 1.2% | ||||||||
Canadian Tire Corp. Ltd., Class A, NVS | 3,008 | 392,542 | ||||||
Dollarama Inc. | 15,954 | 953,463 | ||||||
Gildan Activewear Inc. | 10,143 | 336,974 | ||||||
Magna International Inc. | 14,955 | 801,030 | ||||||
Restaurant Brands International Inc. | 17,155 | 1,151,664 | ||||||
|
| |||||||
| 3,635,673 | ||||||||
| Chile — 0.0% | ||||||||
Falabella SA | 41,874 | 96,297 | ||||||
|
| |||||||
China — 7.2% | ||||||||
Alibaba Group Holding Ltd.(a) | 867,900 | 10,992,376 | ||||||
ANTA Sports Products Ltd. | 60,600 | 879,858 | ||||||
BYD Co. Ltd., Class H | 49,000 | 1,441,391 | ||||||
JD.com Inc., Class A | 134,800 | 2,943,519 | ||||||
Li Ning Co. Ltd. | 131,500 | 1,034,104 | ||||||
Meituan, Class B(a)(b) | 264,400 | 4,796,802 | ||||||
|
| |||||||
| 22,088,050 | ||||||||
| Denmark — 0.2% | ||||||||
GN Store Nord A/S(a) | 7,694 | 172,520 | ||||||
Pandora A/S | 5,355 | 514,017 | ||||||
|
| |||||||
| 686,537 | ||||||||
| France — 7.5% | ||||||||
Accor SA(a) | 9,536 | 310,026 | ||||||
Cie. Generale des Etablissements Michelin SCA | 40,048 | 1,224,198 | ||||||
Hermes International | 1,953 | 3,955,324 | ||||||
Kering SA | 4,036 | 2,633,198 | ||||||
LVMH Moet Hennessy Louis Vuitton SE | 14,650 | 13,447,357 | ||||||
Renault SA(a) | 11,609 | 473,138 | ||||||
Sodexo SA | 4,713 | 460,321 | ||||||
Valeo | 13,099 | 268,788 | ||||||
|
| |||||||
| 22,772,350 | ||||||||
| Germany —3.0% | ||||||||
adidas AG | 10,018 | 1,775,915 | ||||||
Bayerische Motoren Werke AG | 17,893 | 1,961,048 | ||||||
Continental AG | 6,057 | 453,847 | ||||||
Delivery Hero SE(a)(b) | 10,651 | 363,358 | ||||||
Mercedes-Benz Group AG | 43,774 | 3,366,341 | ||||||
Puma SE | 5,793 | 359,122 | ||||||
Volkswagen AG | 1,662 | 285,075 | ||||||
Zalando SE(a)(b) | 12,562 | 526,480 | ||||||
|
| |||||||
| 9,091,186 | ||||||||
| Ireland — 0.5% | ||||||||
Flutter Entertainment PLC, Class DI(a) | 8,592 | 1,563,497 | ||||||
|
| |||||||
Italy —1.6% | ||||||||
Ferrari NV | 7,176 | 1,944,578 | ||||||
Moncler SpA | 11,704 | 808,413 | ||||||
| Security | Shares | Value | ||||||
| Italy (continued) | ||||||||
Stellantis NV | 121,307 | $ | 2,206,122 | |||||
|
| |||||||
| 4,959,113 | ||||||||
| Japan — 11.6% | ||||||||
Aisin Corp. | 10,400 | 286,650 | ||||||
Bandai Namco Holdings Inc. | 37,500 | 808,468 | ||||||
Bridgestone Corp. | 34,400 | 1,397,421 | ||||||
Denso Corp. | 28,400 | 1,603,106 | ||||||
Fast Retailing Co. Ltd. | 10,500 | 2,298,581 | ||||||
Honda Motor Co. Ltd. | 95,843 | 2,535,159 | ||||||
Isuzu Motors Ltd. | 34,900 | 417,089 | ||||||
Nissan Motor Co. Ltd. | 132,400 | 501,079 | ||||||
Nitori Holdings Co. Ltd. | 4,900 | 591,733 | ||||||
Oriental Land Co. Ltd./Japan | 65,500 | 2,242,669 | ||||||
Pan Pacific International Holdings Corp. | 30,200 | 584,256 | ||||||
Panasonic Holdings Corp. | 130,700 | 1,169,387 | ||||||
Rakuten Group Inc. | 50,400 | 235,055 | ||||||
Sekisui House Ltd. | 38,600 | 786,716 | ||||||
Shimano Inc. | 4,700 | 814,913 | ||||||
Sony Group Corp. | 70,800 | 6,448,703 | ||||||
Subaru Corp. | 34,488 | 550,553 | ||||||
Sumitomo Electric Industries Ltd. | 44,400 | 570,403 | ||||||
Suzuki Motor Corp. | 27,400 | 997,837 | ||||||
Toyota Motor Corp. | 705,000 | 10,035,956 | ||||||
Yamaha Motor Co. Ltd. | 19,513 | 510,671 | ||||||
|
| |||||||
| 35,386,405 | ||||||||
Netherlands — 1.7% | ||||||||
Prosus NV | 65,293 | 5,112,703 | ||||||
|
| |||||||
South Korea — 0.7% | ||||||||
Hyundai Motor Co. | 7,908 | 1,125,091 | ||||||
Kia Corp. | 15,004 | 936,371 | ||||||
|
| |||||||
| 2,061,462 | ||||||||
| Spain — 1.3% | ||||||||
Amadeus IT Group SA(a) | 25,264 | 1,694,798 | ||||||
Industria de Diseno Textil SA | 62,924 | 2,113,944 | ||||||
|
| |||||||
| 3,808,742 | ||||||||
| Sweden — 0.7% | ||||||||
Electrolux AB, Class B | 13,063 | 158,773 | ||||||
Evolution AB(b) | 10,736 | 1,438,391 | ||||||
H & M Hennes & Mauritz AB, Class B | 40,139 | 573,889 | ||||||
|
| |||||||
| 2,171,053 | ||||||||
| Switzerland — 1.8% | ||||||||
Cie. Financiere Richemont SA, Class A, Registered | 29,258 | 4,691,697 | ||||||
Swatch Group AG (The), Bearer | 1,622 | 558,602 | ||||||
Swatch Group AG (The), Registered | 3,139 | 199,033 | ||||||
|
| |||||||
| 5,449,332 | ||||||||
| United Kingdom — 2.4% | ||||||||
Barratt Developments PLC | 56,915 | 327,533 | ||||||
Berkeley Group Holdings PLC | 6,358 | 329,395 | ||||||
Burberry Group PLC | 22,705 | 727,010 | ||||||
Compass Group PLC | 100,130 | 2,516,421 | ||||||
Entain PLC | 33,024 | 512,866 | ||||||
InterContinental Hotels Group PLC | 10,589 | 693,216 | ||||||
Kingfisher PLC | 109,846 | 355,078 | ||||||
Next PLC | 7,248 | 589,116 | ||||||
Pearson PLC | 40,093 | 419,570 | ||||||
Persimmon PLC | 17,412 | 270,368 | ||||||
Taylor Wimpey PLC | 204,708 | 301,160 | ||||||
SCHEDULE OF INVESTMENTS | 29 |
Schedule of Investments (continued) March 31, 2023 | iShares® Global Consumer Discretionary ETF (Percentages shown are based on Net Assets) |
| Security | Shares | Value | ||||||
| United Kingdom (continued) | ||||||||
Whitbread PLC | 11,305 | $ | 417,621 | |||||
|
| |||||||
| 7,459,354 | ||||||||
| United States — 56.2% | ||||||||
Advance Auto Parts Inc. | 3,383 | 411,407 | ||||||
Amazon.com Inc.(a) | 309,167 | 31,933,859 | ||||||
Aptiv PLC(a) | 15,194 | 1,704,615 | ||||||
AutoZone Inc.(a) | 1,052 | 2,585,974 | ||||||
Bath & Body Works Inc. | 12,810 | 468,590 | ||||||
Best Buy Co. Inc. | 11,077 | 866,997 | ||||||
Booking Holdings Inc.(a) | 2,178 | 5,776,949 | ||||||
BorgWarner Inc. | 13,129 | 644,765 | ||||||
Caesars Entertainment Inc.(a) | 12,032 | 587,282 | ||||||
CarMax Inc.(a)(c) | 8,862 | 569,649 | ||||||
Carnival Corp.(a)(c) | 56,202 | 570,450 | ||||||
Chipotle Mexican Grill Inc.(a) | 1,555 | 2,656,391 | ||||||
Darden Restaurants Inc. | 6,850 | 1,062,846 | ||||||
Domino’s Pizza Inc. | 2,005 | 661,389 | ||||||
DR Horton Inc. | 17,525 | 1,712,017 | ||||||
eBay Inc. | 30,432 | 1,350,268 | ||||||
Etsy Inc.(a)(c) | 7,047 | 784,542 | ||||||
Expedia Group Inc.(a) | 8,241 | 799,624 | ||||||
Ford Motor Co. | 219,581 | 2,766,721 | ||||||
Garmin Ltd. | 8,598 | 867,710 | ||||||
General Motors Co. | 78,170 | 2,867,276 | ||||||
Genuine Parts Co. | 7,905 | 1,322,586 | ||||||
Hasbro Inc. | 7,321 | 393,064 | ||||||
Hilton Worldwide Holdings Inc. | 14,942 | 2,104,880 | ||||||
Home Depot Inc. (The) | 44,827 | 13,229,344 | ||||||
Las Vegas Sands Corp.(a) | 18,429 | 1,058,746 | ||||||
Lennar Corp., Class A | 14,218 | 1,494,454 | ||||||
LKQ Corp. | 14,233 | 807,865 | ||||||
Lowe’s Companies Inc. | 33,912 | 6,781,383 | ||||||
Marriott International Inc./MD, Class A | 15,089 | 2,505,378 | ||||||
McDonald’s Corp. | 41,100 | 11,491,971 | ||||||
MGM Resorts International | 17,650 | 784,013 | ||||||
Mohawk Industries Inc.(a) | 2,993 | 299,958 | ||||||
Newell Brands Inc., NVS | 20,445 | 254,336 | ||||||
Nike Inc., Class B | 69,916 | 8,574,498 | ||||||
Norwegian Cruise Line Holdings Ltd.(a) | 23,829 | 320,500 | ||||||
NVR Inc.(a) | 170 | 947,272 | ||||||
O’Reilly Automotive Inc.(a) | 3,495 | 2,967,185 | ||||||
Pool Corp. | 2,207 | 755,765 | ||||||
PulteGroup Inc. | 12,652 | 737,359 | ||||||
Ralph Lauren Corp. | 2,343 | 273,358 | ||||||
Ross Stores Inc. | 19,312 | 2,049,583 | ||||||
Royal Caribbean Cruises Ltd.(a) | 12,324 | 804,757 | ||||||
Starbucks Corp. | 64,536 | 6,720,134 | ||||||
Tapestry Inc. | 13,139 | 566,422 | ||||||
Tesla Inc.(a) | 148,635 | 30,835,817 | ||||||
TJX Companies Inc. (The) | 64,923 | 5,087,366 | ||||||
| Security | Shares | Value | ||||||
| ||||||||
| United States (continued) | ||||||||
Tractor Supply Co. | 6,194 | $ | 1,455,838 | |||||
Ulta Beauty Inc.(a) | 2,852 | 1,556,251 | ||||||
VF Corp. | 18,557 | 425,141 | ||||||
Whirlpool Corp. | 3,056 | 403,453 | ||||||
Wynn Resorts Ltd.(a) | 5,782 | 647,064 | ||||||
Yum! Brands Inc. | 15,694 | 2,072,863 | ||||||
|
| |||||||
| 171,377,925 | ||||||||
|
| |||||||
Total Common Stocks — 98.9% | 301,498,325 | |||||||
|
| |||||||
Preferred Stocks | ||||||||
Germany —0.7% | ||||||||
Bayerische Motoren Werke AG, Preference Shares, NVS | 3,356 | 343,045 | ||||||
Porsche Automobil Holding SE, Preference Shares, NVS | 8,587 | 492,954 | ||||||
Volkswagen AG, Preference Shares, NVS | 10,292 | 1,404,572 | ||||||
|
| |||||||
| 2,240,571 | ||||||||
| South Korea — 0.1% | ||||||||
Hyundai Motor Co., Series 2, Preference Shares, NVS | 2,089 | 154,308 | ||||||
|
| |||||||
Total Preferred Stocks — 0.8% | 2,394,879 | |||||||
|
| |||||||
Total Long-Term Investments — 99.7% | 303,893,204 | |||||||
|
| |||||||
Short-Term Securities |
| |||||||
| Money Market Funds — 0.5% | ||||||||
BlackRock Cash Funds: Institutional, SL Agency Shares, 5.01%(d)(e)(f) | 1,455,152 | 1,455,589 | ||||||
BlackRock Cash Funds: Treasury, SL Agency Shares, 4.73%(d)(e) | 260,000 | 260,000 | ||||||
|
| |||||||
Total Short-Term Securities — 0.5% |
| 1,715,589 | ||||||
|
| |||||||
Total Investments — 100.2% |
| 305,608,793 | ||||||
Liabilities in Excess of Other Assets — (0.2)% |
| (692,143 | ) | |||||
|
| |||||||
Net Assets — 100.0% |
| $ | 304,916,650 | |||||
|
| |||||||
| (a) | Non-income producing security. |
| (b) | Security exempt from registration pursuant to Rule 144A under the Securities Act of 1933, as amended. These securities may be resold in transactions exempt from registration to qualified institutional investors. |
| (c) | All or a portion of this security is on loan. |
| (d) | Affiliate of the Fund. |
| (e) | Annualized 7-day yield as of period end. |
| (f) | All or a portion of this security was purchased with the cash collateral from loaned securities. |
| 30 | 2 0 2 3 I SHARES ANNUAL REPORT TO SHAREHOLDERS |
Schedule of Investments (continued) March 31, 2023 | iShares® Global Consumer Discretionary ETF |
Affiliates
Investments in issuers considered to be affiliate(s) of the Fund during the year ended March 31, 2023 for purposes of Section 2(a)(3) of the Investment Company Act of 1940, as amended, were as follows:
| ||||||||||||||||||||||||||||||||||||
| Affiliated Issuer | Value at 03/31/22 | Purchases at Cost | Proceeds from Sale | Net Realized Gain (Loss) | Change in Unrealized Appreciation (Depreciation) | Value at 03/31/23 | Shares Held at 03/31/23 | Income | Capital Gain Distributions from Underlying Funds | |||||||||||||||||||||||||||
| ||||||||||||||||||||||||||||||||||||
BlackRock Cash Funds: Institutional, SL Agency Shares | $ | 2,228,868 | $ | — | $ | (768,333 | )(a) | $ | (5,126 | ) | $ | 180 | $ | 1,455,589 | 1,455,152 | $ | 10,386 | (b) | $ | — | ||||||||||||||||
BlackRock Cash Funds: Treasury, SL Agency Shares | 370,000 | — | (110,000 | )(a) | — | — | 260,000 | 260,000 | 8,454 | — | ||||||||||||||||||||||||||
|
|
|
|
|
|
|
|
|
| |||||||||||||||||||||||||||
| $ | (5,126 | ) | $ | 180 | $ | 1,715,589 | $ | 18,840 | $ | — | ||||||||||||||||||||||||||
|
|
|
|
|
|
|
|
|
| |||||||||||||||||||||||||||
| (a) | Represents net amount purchased (sold). |
| (b) | All or a portion represents securities lending income earned from the reinvestment of cash collateral from loaned securities, net of fees and collateral investment expenses, and other payments to and from borrowers of securities. |
Derivative Financial Instruments Outstanding as of Period End
Futures Contracts
| ||||||||||||||||
| Description | Number of Contracts | Expiration Date | Notional (000) | Value/ Unrealized Appreciation (Depreciation) | ||||||||||||
| ||||||||||||||||
Long Contracts | ||||||||||||||||
TOPIX Index | 1 | 06/08/23 | $ | 152 | $ | 159 | ||||||||||
E-Mini Consumer Discretionary Index | 3 | 06/16/23 | 457 | 24,513 | ||||||||||||
Euro STOXX 50 Index | 7 | 06/16/23 | 324 | 10,895 | ||||||||||||
|
| |||||||||||||||
| $ | 35,567 | |||||||||||||||
|
| |||||||||||||||
Derivative Financial Instruments Categorized by Risk Exposure
As of period end, the fair values of derivative financial instruments located in the Statements of Assets and Liabilities were as follows:
| ||||||||||||||||||||||||||||
Commodity Contracts | Credit Contracts | Equity Contracts | Foreign Currency Exchange Contracts | Interest Rate Contracts | Other Contracts | Total | ||||||||||||||||||||||
| ||||||||||||||||||||||||||||
Assets — Derivative Financial Instruments | ||||||||||||||||||||||||||||
Futures contracts | ||||||||||||||||||||||||||||
Unrealized appreciation on futures contracts(a) | $ | — | $ | — | $ | 35,567 | $ | — | $ | — | $ | — | $ | 35,567 | ||||||||||||||
|
|
|
|
|
|
|
|
|
|
|
|
|
| |||||||||||||||
| (a) | Net cumulative unrealized appreciation (depreciation) on futures contracts are reported in the Schedule of Investments. In the Statements of Assets and Liabilities, only current day’s variation margin is reported in receivables or payables and the net cumulative unrealized appreciation (depreciation) is included in accumulated earnings (loss). |
For the period ended March 31, 2023, the effect of derivative financial instruments in the Statements of Operations was as follows:
| ||||||||||||||||||||||||||||
| Commodity Contracts | Credit Contracts | Equity Contracts | Foreign Currency Exchange Contracts | Interest Rate Contracts | Other Contracts | Total | ||||||||||||||||||||||
| ||||||||||||||||||||||||||||
Net Realized Gain (Loss) from | ||||||||||||||||||||||||||||
Futures contracts | $ | — | $ | — | $ | (129,191 | ) | $ | — | $ | — | $ | — | $ | (129,191 | ) | ||||||||||||
|
|
|
|
|
|
|
|
|
|
|
|
|
| |||||||||||||||
Net Change in Unrealized Appreciation (Depreciation) on | ||||||||||||||||||||||||||||
Futures contracts | $ | — | $ | — | $ | (38,191 | ) | $ | — | $ | — | $ | — | $ | (38,191 | ) | ||||||||||||
|
|
|
|
|
|
|
|
|
|
|
|
|
| |||||||||||||||
Average Quarterly Balances of Outstanding Derivative Financial Instruments
| ||||
Futures contracts | ||||
Average notional value of contracts — long | $ | 820,257 | ||
| ||||
For more information about the Fund’s investment risks regarding derivative financial instruments, refer to the Notes to Financial Statements.
SCHEDULE OF INVESTMENTS | 31 |
Schedule of Investments (continued) March 31, 2023 | iShares® Global Consumer Discretionary ETF |
Fair Value Hierarchy as of Period End
Various inputs are used in determining the fair value of financial instruments. For a description of the input levels and information about the Fund’s policy regarding valuation of financial instruments, refer to the Notes to Financial Statements.
The following table summarizes the Fund’s financial instruments categorized in the fair value hierarchy. The breakdown of the Fund’s financial instruments into major categories is disclosed in the Schedule of Investments above.
| ||||||||||||||||
| Level 1 | Level 2 | Level 3 | Total | |||||||||||||
| ||||||||||||||||
Assets | ||||||||||||||||
Investments | ||||||||||||||||
Long-Term Investments | ||||||||||||||||
Common Stocks | $ | 175,388,201 | $ | 126,110,124 | $ | — | $ | 301,498,325 | ||||||||
Preferred Stocks | — | 2,394,879 | — | 2,394,879 | ||||||||||||
Short-Term Securities | ||||||||||||||||
Money Market Funds | 1,715,589 | — | — | 1,715,589 | ||||||||||||
|
|
|
|
|
|
|
| |||||||||
| $ | 177,103,790 | $ | 128,505,003 | $ | — | $ | 305,608,793 | |||||||||
|
|
|
|
|
|
|
| |||||||||
Derivative Financial Instruments(a) | ||||||||||||||||
Assets | ||||||||||||||||
Equity Contracts | $ | 24,513 | $ | 11,054 | $ | — | $ | 35,567 | ||||||||
|
|
|
|
|
|
|
| |||||||||
| (a) | Derivative financial instruments are futures contracts. Futures contracts are valued at the unrealized appreciation (depreciation) on the instrument. |
See notes to financial statements.
| 32 | 2 0 2 3 I SHARES ANNUAL REPORT TO SHAREHOLDERS |
Schedule of Investments March 31, 2023 | iShares® Global Consumer Staples ETF (Percentages shown are based on Net Assets) |
| Security | Shares | Value | ||||||
Common Stocks | ||||||||
| Australia — 1.5% | ||||||||
Coles Group Ltd. | 504,546 | $ | 6,096,261 | |||||
Endeavour Group Ltd./Australia | 518,262 | 2,354,618 | ||||||
Treasury Wine Estates Ltd. | 274,850 | 2,412,852 | ||||||
Woolworths Group Ltd. | 463,177 | 11,775,210 | ||||||
|
| |||||||
| 22,638,941 | ||||||||
| Belgium — 1.6% | ||||||||
Anheuser-Busch InBev SA/NV | 375,941 | 25,060,165 | ||||||
|
| |||||||
| Brazil — 0.4% | ||||||||
Ambev SA, ADR | 1,657,110 | 4,673,050 | ||||||
Natura & Co. Holding SA | 321,252 | 836,652 | ||||||
|
| |||||||
| 5,509,702 | ||||||||
| Canada — 2.0% | ||||||||
Alimentation Couche-Tard Inc. | 291,070 | 14,634,263 | ||||||
George Weston Ltd. | 24,645 | 3,265,941 | ||||||
Loblaw Companies Ltd. | 57,988 | 5,284,781 | ||||||
Metro Inc. | 89,580 | 4,927,397 | ||||||
Saputo Inc. | 92,840 | 2,402,231 | ||||||
|
| |||||||
| 30,514,613 | ||||||||
| Chile — 0.1% | ||||||||
Cencosud SA | 513,472 | 992,204 | ||||||
|
| |||||||
| Denmark — 0.4% | ||||||||
Carlsberg AS, Class B | 37,473 | 5,814,568 | ||||||
|
| |||||||
| Finland — 0.1% | ||||||||
Kesko OYJ, Class B | 103,995 | 2,234,988 | ||||||
|
| |||||||
| France — 5.2% | ||||||||
Carrefour SA | 220,262 | 4,453,166 | ||||||
Danone SA | 241,886 | 15,051,019 | ||||||
L’Oreal SA | 95,604 | 42,719,943 | ||||||
Pernod Ricard SA | 77,519 | 17,552,694 | ||||||
|
| |||||||
| 79,776,822 | ||||||||
| Germany —0.6% | ||||||||
Beiersdorf AG | 36,933 | 4,804,515 | ||||||
HelloFresh SE(a) | 65,457 | 1,560,974 | ||||||
Henkel AG & Co. KGaA | 37,584 | 2,734,113 | ||||||
|
| |||||||
| 9,099,602 | ||||||||
| Ireland — 0.4% | ||||||||
Kerry Group PLC, Class A | 59,301 | 5,913,808 | ||||||
|
| |||||||
| Japan — 5.4% | ||||||||
Aeon Co. Ltd. | 331,417 | 6,429,754 | ||||||
Ajinomoto Co. Inc. | 202,600 | 7,048,018 | ||||||
Asahi Group Holdings Ltd. | 192,298 | 7,156,951 | ||||||
Japan Tobacco Inc. | 415,500 | 8,776,833 | ||||||
Kao Corp. | 176,900 | 6,885,879 | ||||||
Kikkoman Corp. | 73,300 | 3,742,221 | ||||||
Kirin Holdings Co. Ltd. | 316,396 | 5,005,629 | ||||||
MEIJI Holdings Co. Ltd. | 107,200 | 2,549,564 | ||||||
Nissin Foods Holdings Co. Ltd. | 30,300 | 2,770,625 | ||||||
Seven & i Holdings Co. Ltd. | 303,037 | 13,689,425 | ||||||
Shiseido Co. Ltd. | 152,300 | 7,140,318 | ||||||
Unicharm Corp. | 167,400 | 6,881,098 | ||||||
Yakult Honsha Co. Ltd. | 60,420 | 4,390,139 | ||||||
|
| |||||||
| 82,466,454 | ||||||||
| Mexico — 1.1% | ||||||||
Fomento Economico Mexicano SAB de CV | 699,397 | 6,667,947 | ||||||
| Security | Shares | Value | ||||||
| Mexico (continued) | ||||||||
Grupo Bimbo SAB de CV, Series A | 522,762 | $ | 2,630,636 | |||||
Wal-Mart de Mexico SAB de CV | 1,927,456 | 7,704,476 | ||||||
|
| |||||||
| 17,003,059 | ||||||||
| Netherlands — 1.7% | ||||||||
Heineken Holding NV | 41,668 | 3,822,960 | ||||||
Heineken NV | 89,913 | 9,661,220 | ||||||
Koninklijke Ahold Delhaize NV | 376,489 | 12,862,787 | ||||||
|
| |||||||
| 26,346,967 | ||||||||
| Norway —0.3% | ||||||||
Mowi ASA | 173,262 | 3,204,652 | ||||||
Orkla ASA | 285,975 | 2,028,281 | ||||||
|
| |||||||
| 5,232,933 | ||||||||
| Sweden — 0.4% | ||||||||
Essity AB, Class B | 229,483 | 6,554,927 | ||||||
|
| |||||||
| Switzerland — 8.7% | ||||||||
Barry Callebaut AG, Registered | 1,353 | 2,866,694 | ||||||
Chocoladefabriken Lindt & Spruengli AG, Participation Certificates, NVS | 389 | 4,594,339 | ||||||
Chocoladefabriken Lindt & Spruengli AG, Registered | 40 | 4,737,443 | ||||||
Nestle SA, Registered | 1,003,134 | 122,312,634 | ||||||
|
| |||||||
| 134,511,110 | ||||||||
| United Kingdom — 11.5% | ||||||||
Associated British Foods PLC | 135,723 | 3,257,064 | ||||||
British American Tobacco PLC | 849,670 | 29,784,645 | ||||||
Diageo PLC | 885,002 | 39,497,307 | ||||||
Haleon PLC | 1,933,882 | 7,682,214 | ||||||
Imperial Brands PLC | 365,377 | 8,402,081 | ||||||
J Sainsbury PLC | 669,636 | 2,304,340 | ||||||
Marks & Spencer Group PLC(a) | 748,135 | 1,543,389 | ||||||
Ocado Group PLC(a) | 276,767 | 1,832,584 | ||||||
Reckitt Benckiser Group PLC | 279,482 | 21,262,284 | ||||||
Tesco PLC | 2,819,555 | 9,243,712 | ||||||
Unilever PLC | 998,252 | 51,728,414 | ||||||
|
| |||||||
| 176,538,034 | ||||||||
| United States — 57.6% | ||||||||
Altria Group Inc. | 678,497 | 30,274,536 | ||||||
Archer-Daniels-Midland Co. | 207,556 | 16,533,911 | ||||||
Brown-Forman Corp., Class B | 69,638 | 4,475,634 | ||||||
Bunge Ltd. | 56,574 | 5,403,949 | ||||||
Campbell Soup Co. | 76,391 | 4,199,977 | ||||||
Church & Dwight Co. Inc. | 92,161 | 8,147,954 | ||||||
Clorox Co. (The) | 47,028 | 7,441,711 | ||||||
Coca-Cola Co. (The) | 1,093,096 | 67,804,745 | ||||||
Colgate-Palmolive Co. | 317,171 | 23,835,401 | ||||||
Conagra Brands Inc. | 179,823 | 6,754,152 | ||||||
Constellation Brands Inc., Class A | 61,540 | 13,901,271 | ||||||
Costco Wholesale Corp. | 135,025 | 67,089,872 | ||||||
Dollar General Corp. | 85,126 | 17,915,618 | ||||||
Dollar Tree Inc.(a) | 79,163 | 11,363,849 | ||||||
Estee Lauder Companies Inc. (The), Class A | 87,954 | 21,677,143 | ||||||
General Mills Inc. | 223,713 | 19,118,513 | ||||||
Hershey Co. (The) | 55,906 | 14,223,045 | ||||||
Hormel Foods Corp. | 110,263 | 4,397,288 | ||||||
JM Smucker Co. (The) | 40,595 | 6,388,435 | ||||||
Kellogg Co. | 97,459 | 6,525,855 | ||||||
Keurig Dr Pepper Inc. | 323,533 | 11,414,244 | ||||||
Kimberly-Clark Corp. | 128,030 | 17,184,187 | ||||||
Kraft Heinz Co. (The) | 303,154 | 11,722,965 | ||||||
SCHEDULE OF INVESTMENTS | 33 |
Schedule of Investments (continued) March 31, 2023 | iShares® Global Consumer Staples ETF (Percentages shown are based on Net Assets) |
| Security | Shares | Value | ||||||
| United States (continued) | ||||||||
Kroger Co. (The) | 246,780 | $ | 12,183,529 | |||||
Lamb Weston Holdings Inc. | 54,778 | 5,725,397 | ||||||
McCormick & Co. Inc./MD, NVS | 95,464 | 7,943,559 | ||||||
Molson Coors Beverage Co., Class B | 71,580 | 3,699,254 | ||||||
Mondelez International Inc., Class A | 518,127 | 36,123,814 | ||||||
Monster Beverage Corp.(a) | 290,035 | 15,664,790 | ||||||
PepsiCo Inc. | 502,384 | 91,584,603 | ||||||
Philip Morris International Inc. | 589,193 | 57,299,019 | ||||||
Procter & Gamble Co. (The) | 860,558 | 127,956,369 | ||||||
Sysco Corp. | 192,489 | 14,865,925 | ||||||
Target Corp. | 174,685 | 28,933,077 | ||||||
Tyson Foods Inc., Class A | 108,744 | 6,450,694 | ||||||
Walgreens Boots Alliance Inc. | 272,574 | 9,425,609 | ||||||
Walmart Inc. | 475,231 | 70,072,811 | ||||||
|
| |||||||
| 885,722,705 | ||||||||
|
| |||||||
Total Common Stocks — 99.0% |
| 1,521,931,602 | ||||||
|
| |||||||
Preferred Stocks | ||||||||
| Germany —0.4% | ||||||||
Henkel AG & Co. KGaA, Preference Shares, NVS | 67,833 | 5,306,842 | ||||||
|
| |||||||
Total Preferred Stocks — 0.4% |
| 5,306,842 | ||||||
|
| |||||||
Total Long-Term Investments — 99.4% |
| 1,527,238,444 | ||||||
|
| |||||||
| Security | Shares | Value | ||||||
Short-Term Securities | ||||||||
| Money Market Funds — 0.1% | ||||||||
BlackRock Cash Funds: Treasury, SL Agency Shares, 4.73%(b)(c) | 2,050,000 | $ | 2,050,000 | |||||
|
| |||||||
Total Short-Term Securities — 0.1% |
| 2,050,000 | ||||||
|
| |||||||
Total Investments — 99.5% |
| 1,529,288,444 | ||||||
Other Assets Less Liabilities — 0.5% | 7,390,662 | |||||||
|
| |||||||
Net Assets — 100.0% | $ | 1,536,679,106 | ||||||
|
| |||||||
| (a) | Non-income producing security. |
| (b) | Affiliate of the Fund. |
| (c) | Annualized 7-day yield as of period end. |
Affiliates
Investments in issuers considered to be affiliate(s) of the Fund during the year ended March 31, 2023 for purposes of Section 2(a)(3) of the Investment Company Act of 1940, as amended, were as follows:
| ||||||||||||||||||||||||||||||||||||
| Affiliated Issuer | Value at 03/31/22 | Purchases at Cost | Proceeds from Sale | Net Realized Gain (Loss) | Change in Unrealized Appreciation (Depreciation) | Value at 03/31/23 | Shares Held at 03/31/23 | Income | Capital Gain Distributions from Underlying Funds | |||||||||||||||||||||||||||
| ||||||||||||||||||||||||||||||||||||
BlackRock Cash Funds: Institutional, SL Agency Shares(a) | $ | 404,159 | $ | — | $ | (409,281 | )(b) | $ | 5,141 | $ | (19 | ) | $ | — | — | $ | 7,826 | (c) | $ | — | ||||||||||||||||
BlackRock Cash Funds: Treasury, SL Agency Shares | 1,390,000 | 660,000 | (b) | — | — | — | 2,050,000 | 2,050,000 | 46,735 | — | ||||||||||||||||||||||||||
|
|
|
|
|
|
|
|
|
| |||||||||||||||||||||||||||
| $ | 5,141 | $ | (19 | ) | $ | 2,050,000 | $ | 54,561 | $ | — | ||||||||||||||||||||||||||
|
|
|
|
|
|
|
|
|
| |||||||||||||||||||||||||||
| (a) | As of period end, the entity is no longer held. |
| (b) | Represents net amount purchased (sold). |
| (c) | All or a portion represents securities lending income earned from the reinvestment of cash collateral from loaned securities, net of fees and collateral investment expenses, and other payments to and from borrowers of securities. |
Derivative Financial Instruments Outstanding as of Period End
Futures Contracts
| ||||||||||||||||
| Description | Number of Contracts | Expiration Date | Notional Amount (000) | Value/ Unrealized Appreciation (Depreciation) | ||||||||||||
| ||||||||||||||||
Long Contracts | ||||||||||||||||
E-Mini Consumer Staples Index | 96 | 06/16/23 | $ | 7,274 | $ | 302,710 | ||||||||||
| 34 | 2 0 2 3 I SHARES ANNUAL REPORT TO SHAREHOLDERS |
Schedule of Investments (continued) March 31, 2023 | iShares® Global Consumer Staples ETF |
Futures Contracts (continued)
| ||||||||||||||||
| Description | Number of Contracts | Expiration Date | Notional Amount (000) | Value/ Unrealized Appreciation (Depreciation) | ||||||||||||
| ||||||||||||||||
Euro STOXX 50 Index | 7 | 06/16/23 | $ | 324 | $ | 8,911 | ||||||||||
FTSE 100 Index | 15 | 06/16/23 | 1,416 | 22,741 | ||||||||||||
|
| |||||||||||||||
| $ | 334,362 | |||||||||||||||
|
| |||||||||||||||
Derivative Financial Instruments Categorized by Risk Exposure
As of period end, the fair values of derivative financial instruments located in the Statements of Assets and Liabilities were as follows:
| ||||||||||||||||||||||||||||
Commodity Contracts | Credit Contracts | Equity Contracts | Foreign Currency Exchange Contracts | Interest Rate Contracts | Other Contracts | Total | ||||||||||||||||||||||
| ||||||||||||||||||||||||||||
Assets — Derivative Financial Instruments | ||||||||||||||||||||||||||||
Futures contracts | ||||||||||||||||||||||||||||
Unrealized appreciation on futures contracts(a) | $ | — | $ | — | $ | 334,362 | $ | — | $ | — | $ | — | $ | 334,362 | ||||||||||||||
|
|
|
|
|
|
|
|
|
|
|
|
|
| |||||||||||||||
| (a) | Net cumulative unrealized appreciation (depreciation) on futures contracts are reported in the Schedule of Investments. In the Statements of Assets and Liabilities, only current day’s variation margin is reported in receivables or payables and the net cumulative unrealized appreciation (depreciation) is included in accumulated earnings (loss). |
For the period ended March 31, 2023, the effect of derivative financial instruments in the Statements of Operations was as follows:
| ||||||||||||||||||||||||||||
Commodity Contracts | Credit Contracts | Equity Contracts | Foreign Currency Exchange Contracts | Interest Rate Contracts | Other Contracts | Total | ||||||||||||||||||||||
| ||||||||||||||||||||||||||||
Net Realized Gain (Loss) from | ||||||||||||||||||||||||||||
Futures contracts | $ | — | $ | — | $ | (1,432 | ) | $ | — | $ | — | $ | — | $ | (1,432 | ) | ||||||||||||
|
|
|
|
|
|
|
|
|
|
|
|
|
| |||||||||||||||
Net Change in Unrealized Appreciation (Depreciation) on | ||||||||||||||||||||||||||||
Futures contracts | $ | — | $ | — | $ | 108,887 | $ | — | $ | — | $ | — | $ | 108,887 | ||||||||||||||
|
|
|
|
|
|
|
|
|
|
|
|
|
| |||||||||||||||
Average Quarterly Balances of Outstanding Derivative Financial Instruments
| ||||
Futures contracts | ||||
Average notional value of contracts — long | $ | 6,763,108 | ||
| ||||
For more information about the Fund’s investment risks regarding derivative financial instruments, refer to the Notes to Financial Statements.
Fair Value Hierarchy as of Period End
Various inputs are used in determining the fair value of financial instruments. For a description of the input levels and information about the Fund’s policy regarding valuation of financial instruments, refer to the Notes to Financial Statements.
The following table summarizes the Fund’s financial instruments categorized in the fair value hierarchy. The breakdown of the Fund’s financial instruments into major categories is disclosed in the Schedule of Investments above.
| ||||||||||||||||
| Level 1 | Level 2 | Level 3 | Total | |||||||||||||
| ||||||||||||||||
Assets | ||||||||||||||||
Investments | ||||||||||||||||
Long-Term Investments | ||||||||||||||||
Common Stocks | $ | 939,742,283 | $ | 582,189,319 | $ | — | $ | 1,521,931,602 | ||||||||
Preferred Stocks | — | 5,306,842 | — | 5,306,842 | ||||||||||||
Short-Term Securities | ||||||||||||||||
Money Market Funds | 2,050,000 | — | — | 2,050,000 | ||||||||||||
|
|
|
|
|
|
|
| |||||||||
| $ | 941,792,283 | $ | 587,496,161 | $ | — | $ | 1,529,288,444 | |||||||||
|
|
|
|
|
|
|
| |||||||||
SCHEDULE OF INVESTMENTS | 35 |
Schedule of Investments (continued) March 31, 2023 | iShares® Global Consumer Staples ETF |
Fair Value Hierarchy as of Period End (continued)
| ||||||||||||||||
| Level 1 | Level 2 | Level 3 | Total | |||||||||||||
| ||||||||||||||||
Derivative Financial Instruments(a) | ||||||||||||||||
Assets | ||||||||||||||||
Equity Contracts | $ | 302,710 | $ | 31,652 | $ | — | $ | 334,362 | ||||||||
|
|
|
|
|
|
|
| |||||||||
| (a) | Derivative financial instruments are futures contracts. Futures contracts are valued at the unrealized appreciation (depreciation) on the instrument. |
See notes to financial statements.
| 36 | 2 0 2 3 I SHARES ANNUAL REPORT TO SHAREHOLDERS |
Schedule of Investments March 31, 2023 | iShares® Global Energy ETF (Percentages shown are based on Net Assets) |
| Security | Shares | Value | ||||||
Common Stocks | ||||||||
Australia — 2.4% | ||||||||
Ampol Ltd. | 164,074 | $ | 3,345,130 | |||||
Santos Ltd. | 2,281,466 | 10,500,214 | ||||||
Woodside Energy Group Ltd. | 1,307,528 | 29,210,368 | ||||||
|
| |||||||
| 43,055,712 | ||||||||
| Austria — 0.3% | ||||||||
OMV AG | 98,964 | 4,544,737 | ||||||
|
| |||||||
Brazil — 0.7% | ||||||||
Petroleo Brasileiro SA, ADR | 1,278,712 | 13,336,966 | ||||||
|
| |||||||
Canada — 11.3% | ||||||||
Cameco Corp. | 297,838 | 7,799,102 | ||||||
Canadian Natural Resources Ltd. | 762,531 | 42,197,332 | ||||||
Cenovus Energy Inc. | 952,359 | 16,616,075 | ||||||
Enbridge Inc. | 1,394,403 | 53,165,806 | ||||||
Imperial Oil Ltd. | 120,215 | 6,113,486 | ||||||
Pembina Pipeline Corp. | 379,808 | 12,303,362 | ||||||
Suncor Energy Inc. | 930,697 | 28,895,336 | ||||||
TC Energy Corp. | 700,932 | 27,264,517 | ||||||
Tourmaline Oil Corp. | 218,516 | 9,106,046 | ||||||
|
| |||||||
| 203,461,062 | ||||||||
| Chile — 0.1% | ||||||||
Empresas COPEC SA | 249,166 | 1,758,509 | ||||||
|
| |||||||
Colombia — 0.1% | ||||||||
Ecopetrol SA, ADR | 167,872 | 1,772,728 | ||||||
|
| |||||||
Finland — 0.8% | ||||||||
Neste OYJ | 296,089 | 14,627,944 | ||||||
|
| |||||||
France — 5.3% | ||||||||
Total Energies SE | 1,611,968 | 95,047,552 | ||||||
|
| |||||||
Italy —1.6% | ||||||||
Eni SpA | 1,721,593 | 24,009,962 | ||||||
Tenaris SA | 315,367 | 4,468,494 | ||||||
|
| |||||||
| 28,478,456 | ||||||||
| Japan — 0.9% | ||||||||
ENEOS Holdings Inc. | 2,225,120 | 7,806,856 | ||||||
Inpex Corp. | 727,800 | 7,701,959 | ||||||
|
| |||||||
| 15,508,815 | ||||||||
| Norway —1.4% | ||||||||
Aker BP ASA | 214,623 | 5,263,634 | ||||||
Equinor ASA | 721,667 | 20,515,835 | ||||||
|
| |||||||
| 25,779,469 | ||||||||
| Portugal — 0.2% | ||||||||
Galp Energia SGPS SA | 314,192 | 3,555,168 | ||||||
|
| |||||||
Spain ��� 0.8% | ||||||||
Repsol SA | 913,543 | 14,048,338 | ||||||
|
| |||||||
United Kingdom — 12.2% | ||||||||
BP PLC | 12,589,191 | 79,570,217 | ||||||
Shell PLC | 4,896,333 | 139,538,489 | ||||||
|
| |||||||
| 219,108,706 | ||||||||
| Security | Shares | Value | ||||||
United States — 60.6% | ||||||||
APA Corp. | 221,590 | $ | 7,990,535 | |||||
Baker Hughes Co. | 693,015 | 20,000,413 | ||||||
Chevron Corp. | 1,225,030 | 199,875,895 | ||||||
ConocoPhillips | 842,779 | 83,612,104 | ||||||
Coterra Energy Inc. | 544,015 | 13,350,128 | ||||||
Devon Energy Corp. | 450,154 | 22,782,294 | ||||||
Diamondback Energy Inc. | 126,786 | 17,137,664 | ||||||
EOG Resources Inc. | 404,490 | 46,366,689 | ||||||
EQT Corp. | 253,095 | 8,076,261 | ||||||
Exxon Mobil Corp. | 2,835,762 | 310,969,661 | ||||||
Halliburton Co. | 622,135 | 19,684,351 | ||||||
Hess Corp. | 191,076 | 25,286,998 | ||||||
Kinder Morgan Inc. | 1,361,641 | 23,842,334 | ||||||
Marathon Oil Corp. | 438,859 | 10,515,062 | ||||||
Marathon Petroleum Corp. | 312,636 | 42,152,712 | ||||||
Occidental Petroleum Corp. | 501,281 | 31,294,973 | ||||||
ONEOK Inc. | 307,868 | 19,561,933 | ||||||
Phillips 66 | 321,108 | 32,553,929 | ||||||
Pioneer Natural Resources Co. | 163,773 | 33,448,997 | ||||||
Schlumberger NV | 977,978 | 48,018,720 | ||||||
Targa Resources Corp. | 156,353 | 11,405,951 | ||||||
Valero Energy Corp. | 265,445 | 37,056,122 | ||||||
Williams Companies Inc. (The) | 838,187 | 25,028,264 | ||||||
|
| |||||||
| 1,090,011,990 | ||||||||
|
| |||||||
Total Common Stocks — 98.7% |
| 1,774,096,152 | ||||||
|
| |||||||
Preferred Stocks | ||||||||
Brazil — 0.8% | ||||||||
Petroleo Brasileiro SA, Preference Shares, ADR | 1,584,021 | 14,699,715 | ||||||
|
| |||||||
Total Preferred Stocks — 0.8% | 14,699,715 | |||||||
|
| |||||||
Total Long-Term Investments — 99.5% | 1,788,795,867 | |||||||
|
| |||||||
Short-Term Securities | ||||||||
Money Market Funds — 0.2% | ||||||||
BlackRock Cash Funds: Treasury, SL Agency Shares, 4.73%(a)(b) | 3,710,000 | 3,710,000 | ||||||
|
| |||||||
Total Short-Term Securities — 0.2% | 3,710,000 | |||||||
|
| |||||||
Total Investments — 99.7% | 1,792,505,867 | |||||||
Other Assets Less Liabilities — 0.3% | 6,270,272 | |||||||
|
| |||||||
Net Assets — 100.0% | $ | 1,798,776,139 | ||||||
|
| |||||||
| (a) | Affiliate of the Fund. |
| (b) | Annualized 7-day yield as of period end. |
SCHEDULE OF INVESTMENTS | 37 |
Schedule of Investments (continued) March 31, 2023 | iShares® Global Energy ETF |
Affiliates
Investments in issuers considered to be affiliate(s) of the Fund during the year ended March 31, 2023 for purposes of Section 2(a)(3) of the Investment Company Act of 1940, as amended, were as follows:
| ||||||||||||||||||||||||||||||||||||
| Affiliated Issuer | Value at 03/31/22 | Purchases at Cost | Proceeds from Sale | Net Realized Gain (Loss) | Change in Unrealized Appreciation (Depreciation) | Value at 03/31/23 | Shares Held at 03/31/23 | Income | Capital Gain Distributions from Underlying Funds | |||||||||||||||||||||||||||
| ||||||||||||||||||||||||||||||||||||
BlackRock Cash Funds: Institutional, SL Agency Shares(a) | $ | — | $ | 4,166 | (b) | $ | — | $ | (4,166 | ) | $ | — | $ | — | — | $ | 4,211 | (c) | $ | — | ||||||||||||||||
BlackRock Cash Funds: Treasury, SL Agency Shares | 3,430,000 | 280,000 | (b) | — | — | — | 3,710,000 | 3,710,000 | 98,055 | 3 | ||||||||||||||||||||||||||
|
|
|
|
|
|
|
|
|
| |||||||||||||||||||||||||||
| $ | (4,166 | ) | $ | — | $ | 3,710,000 | $ | 102,266 | $ | 3 | ||||||||||||||||||||||||||
|
|
|
|
|
|
|
|
|
| |||||||||||||||||||||||||||
| (a) | As of period end, the entity is no longer held. |
| (b) | Represents net amount purchased (sold). |
| (c) | All or a portion represents securities lending income earned from the reinvestment of cash collateral from loaned securities, net of fees and collateral investment expenses, and other payments to and from borrowers of securities. |
Derivative Financial Instruments Outstanding as of Period End
Futures Contracts
| ||||||||||||||||
| Description | Number of Contracts | Expiration Date | Notional Amount (000) | Value/ Unrealized Appreciation (Depreciation) | ||||||||||||
| ||||||||||||||||
Long Contracts | ||||||||||||||||
E-Mini Energy Select Sector Index | 98 | 06/16/23 | $ | 8,556 | $ | 165,243 | ||||||||||
FTSE 100 Index | 15 | 06/16/23 | 1,416 | 7,842 | ||||||||||||
|
| |||||||||||||||
| $ | 173,085 | |||||||||||||||
|
| |||||||||||||||
Derivative Financial Instruments Categorized by Risk Exposure
As of period end, the fair values of derivative financial instruments located in the Statements of Assets and Liabilities were as follows:
| ||||||||||||||||||||||||||||
Commodity Contracts | Credit Contracts | Equity Contracts | Foreign Currency Exchange Contracts | Interest Rate Contracts | Other Contracts | Total | ||||||||||||||||||||||
| ||||||||||||||||||||||||||||
Assets — Derivative Financial Instruments | ||||||||||||||||||||||||||||
Futures contracts | ||||||||||||||||||||||||||||
Unrealized appreciation on futures contracts(a) | $ | — | $ | — | $ | 173,085 | $ | — | $ | — | $ | — | $ | 173,085 | ||||||||||||||
|
|
|
|
|
|
|
|
|
|
|
|
|
| |||||||||||||||
| (a) | Net cumulative unrealized appreciation (depreciation) on futures contracts are reported in the Schedule of Investments. In the Statements of Assets and Liabilities, only current day’s variation margin is reported in receivables or payables and the net cumulative unrealized appreciation (depreciation) is included in accumulated earnings (loss). |
For the period ended March 31, 2023, the effect of derivative financial instruments in the Statements of Operations was as follows:
| ||||||||||||||||||||||||||||
Commodity Contracts | Credit Contracts | Equity Contracts | Foreign Currency Exchange Contracts | Interest Rate Contracts | Other Contracts | Total | ||||||||||||||||||||||
| ||||||||||||||||||||||||||||
Net Realized Gain (Loss) from | ||||||||||||||||||||||||||||
Futures contracts | $ | — | $ | — | $ | (2,539,479 | ) | $ | — | $ | — | $ | — | $ | (2,539,479 | ) | ||||||||||||
|
|
|
|
|
|
|
|
|
|
|
|
|
| |||||||||||||||
Net Change in Unrealized Appreciation (Depreciation) on | ||||||||||||||||||||||||||||
Futures contracts | $ | — | $ | — | $ | 107,699 | $ | — | $ | — | $ | — | $ | 107,699 | ||||||||||||||
|
|
|
|
|
|
|
|
|
|
|
|
|
| |||||||||||||||
Average Quarterly Balances of Outstanding Derivative Financial Instruments
| ||||
Futures contracts | ||||
Average notional value of contracts — long | $ | 8,875,282 | ||
| ||||
For more information about the Fund’s investment risks regarding derivative financial instruments, refer to the Notes to Financial Statements.
| 38 | 2 0 2 3 I SHARES ANNUAL REPORT TO SHAREHOLDERS |
Schedule of Investments (continued) March 31, 2023 | iShares® Global Energy ETF |
Fair Value Hierarchy as of Period End
Various inputs are used in determining the fair value of financial instruments. For a description of the input levels and information about the Fund’s policy regarding valuation of financial instruments, refer to the Notes to Financial Statements.
The following table summarizes the Fund’s financial instruments categorized in the fair value hierarchy. The breakdown of the Fund’s financial instruments into major categories is disclosed in the Schedule of Investments above.
| ||||||||||||||||
| Level 1 | Level 2 | Level 3 | Total | |||||||||||||
| ||||||||||||||||
Assets | ||||||||||||||||
Investments | ||||||||||||||||
Long-Term Investments | ||||||||||||||||
Common Stocks | $ | 1,310,341,255 | $ | 463,754,897 | $ | — | $ | 1,774,096,152 | ||||||||
Preferred Stocks | 14,699,715 | — | — | 14,699,715 | ||||||||||||
Short-Term Securities | ||||||||||||||||
Money Market Funds | 3,710,000 | — | — | 3,710,000 | ||||||||||||
|
|
|
|
|
|
|
| |||||||||
| $ | 1,328,750,970 | $ | 463,754,897 | $ | — | $ | 1,792,505,867 | |||||||||
|
|
|
|
|
|
|
| |||||||||
Derivative Financial Instruments(a) | ||||||||||||||||
Assets | ||||||||||||||||
Equity Contracts | $ | 165,243 | $ | 7,842 | $ | — | $ | 173,085 | ||||||||
|
|
|
|
|
|
|
| |||||||||
| (a) | Derivative financial instruments are futures contracts. Futures contracts are valued at the unrealized appreciation (depreciation) on the instrument. |
See notes to financial statements.
SCHEDULE OF INVESTMENTS | 39 |
Schedule of Investments March 31, 2023 | iShares® Global Financials ETF (Percentages shown are based on Net Assets) |
| Security | Shares | Value | ||||||
Common Stocks | ||||||||
| Australia — 4.4% | ||||||||
ASX Ltd. | 10,084 | $ | 440,375 | |||||
Australia & New Zealand Banking Group Ltd. | 156,198 | 2,407,029 | ||||||
Commonwealth Bank of Australia | 87,818 | 5,798,229 | ||||||
Insurance Australia Group Ltd. | 127,417 | 401,070 | ||||||
Macquarie Group Ltd. | 18,904 | 2,238,228 | ||||||
Medibank Pvt Ltd. | 143,222 | 323,205 | ||||||
National Australia Bank Ltd. | 163,345 | 3,043,664 | ||||||
QBE Insurance Group Ltd. | 77,223 | 756,053 | ||||||
Suncorp Group Ltd. | 65,744 | 534,178 | ||||||
Westpac Banking Corp. | 182,493 | 2,657,026 | ||||||
|
| |||||||
| 18,599,057 | ||||||||
| Austria — 0.1% | ||||||||
Erste Group Bank AG | 18,567 | 615,112 | ||||||
|
| |||||||
| Belgium — 0.5% | ||||||||
Ageas SA/NV | 9,283 | 401,567 | ||||||
Groupe Bruxelles Lambert NV | 5,265 | 449,315 | ||||||
KBC Group NV | 17,589 | 1,208,554 | ||||||
|
| |||||||
| 2,059,436 | ||||||||
| Brazil — 0.4% | ||||||||
B3 SA - Brasil, Bolsa, Balcao | 317,175 | 647,685 | ||||||
Banco do Brasil SA | 74,519 | 575,016 | ||||||
NU Holdings Ltd.(a) | 118,856 | 565,755 | ||||||
|
| |||||||
| 1,788,456 | ||||||||
| Canada — 7.2% | ||||||||
Bank of Montreal | 36,904 | 3,287,091 | ||||||
Bank of Nova Scotia (The) | 61,965 | 3,120,945 | ||||||
Brookfield Asset Management Ltd. | 18,661 | 611,264 | ||||||
Brookfield Corp. | 74,286 | 2,420,135 | ||||||
Canadian Imperial Bank of Commerce | 47,115 | 1,997,899 | ||||||
Intact Financial Corp. | 9,116 | 1,304,637 | ||||||
Manulife Financial Corp. | 96,643 | 1,773,397 | ||||||
National Bank of Canada | 17,550 | 1,255,315 | ||||||
Power Corp. of Canada | 29,293 | 748,635 | ||||||
Royal Bank of Canada | 71,894 | 6,875,545 | ||||||
Sun Life Financial Inc. | 30,504 | 1,425,100 | ||||||
Toronto-Dominion Bank (The) | 94,735 | 5,674,287 | ||||||
|
| |||||||
| 30,494,250 | ||||||||
| Chile — 0.1% | ||||||||
Banco de Chile | 2,258,864 | 219,382 | ||||||
Banco Santander Chile, ADR | 7,691 | 137,130 | ||||||
|
| |||||||
| 356,512 | ||||||||
| China — 2.3% | ||||||||
Bank of China Ltd., Class H | 4,017,000 | 1,539,984 | ||||||
China Construction Bank Corp., Class H | 5,110,720 | 3,307,632 | ||||||
China Merchants Bank Co. Ltd., Class H | 172,500 | 875,958 | ||||||
Industrial & Commercial Bank of China Ltd., Class H | 3,703,000 | 1,967,919 | ||||||
Ping An Insurance Group Co. of China Ltd., Class H | 320,500 | 2,073,383 | ||||||
|
| |||||||
| 9,764,876 | ||||||||
| Colombia — 0.0% | ||||||||
Bancolombia SA, ADR | 5,882 | 147,815 | ||||||
|
| |||||||
| Denmark — 0.3% | ||||||||
Danske Bank A/S(a) | 35,424 | 712,688 | ||||||
Tryg A/S | 18,729 | 409,520 | ||||||
|
| |||||||
| 1,122,208 | ||||||||
| Security | Shares | Value | ||||||
| Finland — 0.3% | ||||||||
Sampo OYJ, Class A | 24,974 | $ | 1,178,401 | |||||
|
| |||||||
France — 2.4% | ||||||||
AXA SA | 103,956 | 3,172,485 | ||||||
BNP Paribas SA | 59,055 | 3,526,618 | ||||||
Credit Agricole SA | 71,217 | 803,413 | ||||||
Edenred | 12,990 | 768,809 | ||||||
Euronext NV(b) | 5,182 | 396,811 | ||||||
Societe Generale SA | 39,102 | 881,021 | ||||||
Worldline SA/France(a)(b) | 13,038 | 554,096 | ||||||
|
| |||||||
| 10,103,253 | ||||||||
| Germany —2.7% | ||||||||
Allianz SE, Registered | 20,984 | 4,843,863 | ||||||
Commerzbank AG(a) | 54,721 | 576,116 | ||||||
Deutsche Bank AG, Registered | 107,493 | 1,093,118 | ||||||
Deutsche Boerse AG | 9,887 | 1,925,098 | ||||||
Hannover Rueck SE | 3,146 | 615,296 | ||||||
Muenchener Rueckversicherungs-Gesellschaft AG in Muenchen, Registered | 7,290 | 2,548,842 | ||||||
|
| |||||||
| 11,602,333 | ||||||||
| Hong Kong — 2.2% | ||||||||
AIA Group Ltd. | 608,600 | 6,382,604 | ||||||
Hong Kong Exchanges & Clearing Ltd. | 65,000 | 2,881,105 | ||||||
|
| |||||||
| 9,263,709 | ||||||||
| Ireland — 0.1% | ||||||||
Bank of Ireland Group PLC | 52,328 | 529,470 | ||||||
|
| |||||||
Italy —1.6% | ||||||||
Assicurazioni Generali SpA | 62,732 | 1,249,910 | ||||||
FinecoBank Banca Fineco SpA | 31,741 | 486,307 | ||||||
Intesa Sanpaolo SpA | 888,726 | 2,280,862 | ||||||
Mediobanca Banca di Credito Finanziario SpA | 33,127 | 332,891 | ||||||
Nexi SpA(a)(b) | 44,345 | 360,398 | ||||||
UniCredit SpA | 100,643 | 1,896,905 | ||||||
|
| |||||||
| 6,607,273 | ||||||||
| Japan — 4.3% | ||||||||
Dai-ichi Life Holdings Inc. | 53,400 | 981,678 | ||||||
Daiwa Securities Group Inc. | 78,100 | 366,650 | ||||||
Japan Exchange Group Inc. | 28,000 | 428,228 | ||||||
Japan Post Holdings Co. Ltd. | 126,000 | 1,022,612 | ||||||
Mitsubishi UFJ Financial Group Inc. | 634,000 | 4,063,096 | ||||||
Mizuho Financial Group Inc. | 132,110 | 1,871,677 | ||||||
MS&AD Insurance Group Holdings Inc. | 23,600 | 731,384 | ||||||
Nomura Holdings Inc. | 157,800 | 608,369 | ||||||
ORIX Corp. | 61,500 | 1,014,013 | ||||||
Resona Holdings Inc. | 123,700 | 596,746 | ||||||
Sompo Holdings Inc. | 18,500 | 733,064 | ||||||
Sumitomo Mitsui Financial Group Inc. | 71,900 | 2,877,263 | ||||||
Sumitomo Mitsui Trust Holdings Inc. | 19,427 | 667,433 | ||||||
T&D Holdings Inc. | 30,100 | 373,056 | ||||||
Tokio Marine Holdings Inc. | 106,300 | 2,045,737 | ||||||
|
| |||||||
| 18,381,006 | ||||||||
| Mexico — 0.3% | ||||||||
Grupo Financiero Banorte SAB de CV, Class O | 127,702 | 1,076,467 | ||||||
|
| |||||||
Netherlands — 1.5% | ||||||||
ABN AMRO Bank NV, CVA(b) | 21,526 | 341,347 | ||||||
Adyen NV(a)(b) | 1,601 | 2,551,078 | ||||||
Aegon NV | 73,507 | 315,577 | ||||||
EXOR NV, NVS(a) | 6,028 | 497,066 | ||||||
| 40 | 2 0 2 3 I SHARES ANNUAL REPORT TO SHAREHOLDERS |
Schedule of Investments (continued) March 31, 2023 | iShares® Global Financials ETF (Percentages shown are based on Net Assets) |
| Security | Shares | Value | ||||||
Netherlands (continued) | ||||||||
ING Groep NV | 193,800 | $ | 2,301,440 | |||||
NN Group NV | 15,355 | 557,539 | ||||||
|
| |||||||
| 6,564,047 | ||||||||
| Norway — 0.2% | ||||||||
DNB Bank ASA | 46,765 | 836,894 | ||||||
|
| |||||||
Peru — 0.1% | ||||||||
Credicorp Ltd. | 3,548 | 469,720 | ||||||
|
| |||||||
Singapore — 1.4% | ||||||||
DBS Group Holdings Ltd. | 95,600 | 2,376,782 | ||||||
Oversea-Chinese Banking Corp. Ltd. | 210,900 | 1,965,964 | ||||||
United Overseas Bank Ltd. | 81,200 | 1,821,238 | ||||||
|
| |||||||
| 6,163,984 | ||||||||
| South Korea — 0.3% | ||||||||
KB Financial Group Inc. | 19,998 | 730,371 | ||||||
Shinhan Financial Group Co. Ltd. | 26,460 | 718,794 | ||||||
|
| |||||||
| 1,449,165 | ||||||||
| Spain — 1.5% | ||||||||
Banco Bilbao Vizcaya Argentaria SA | 313,590 | 2,241,967 | ||||||
Banco Santander SA | 873,359 | 3,254,554 | ||||||
CaixaBank SA | 210,685 | 822,083 | ||||||
|
| |||||||
| 6,318,604 | ||||||||
| Sweden — 1.7% | ||||||||
EQTAB | 17,261 | 352,597 | ||||||
Industrivarden AB, Class A | 9,495 | 256,626 | ||||||
Industrivarden AB, Class C | 8,908 | 240,198 | ||||||
Investor AB, Class B | 94,751 | 1,887,495 | ||||||
Kinnevik AB, Class B(a) | 12,632 | 188,885 | ||||||
Nordea Bank Abp | 166,685 | 1,779,911 | ||||||
Skandinaviska Enskilda Banken AB, Class A | 88,526 | 977,173 | ||||||
Svenska Handelsbanken AB, Class A | 79,906 | 692,055 | ||||||
Swedbank AB, Class A | 47,696 | 784,342 | ||||||
|
| |||||||
| 7,159,282 | ||||||||
| Switzerland — 2.9% | ||||||||
Baloise Holding AG, Registered | 2,389 | 372,006 | ||||||
Credit Suisse Group AG, Registered(c) | 191,107 | 171,619 | ||||||
Julius Baer Group Ltd. | 11,126 | 760,000 | ||||||
Partners Group Holding AG | 1,171 | 1,102,757 | ||||||
Swiss Life Holding AG, Registered | 1,604 | 989,839 | ||||||
Swiss Re AG | 15,028 | 1,543,878 | ||||||
UBS Group AG, Registered | 183,293 | 3,878,624 | ||||||
Zurich Insurance Group AG | 7,798 | 3,736,791 | ||||||
|
| |||||||
| 12,555,514 | ||||||||
| Taiwan — 0.5% | ||||||||
Cathay Financial Holding Co. Ltd. | 496,521 | 683,634 | ||||||
CTBC Financial Holding Co. Ltd. | 1,024,000 | 737,413 | ||||||
Fubon Financial Holding Co. Ltd. | 410,000 | 763,053 | ||||||
|
| |||||||
| 2,184,100 | ||||||||
| United Kingdom — 5.0% | ||||||||
3i Group PLC | 50,622 | 1,055,138 | ||||||
abrdn PLC | 104,111 | 262,034 | ||||||
Admiral Group PLC | 14,341 | 360,116 | ||||||
Aviva PLC | 146,064 | 729,609 | ||||||
Barclays PLC | 784,357 | 1,411,767 | ||||||
Direct Line Insurance Group PLC | 68,171 | 115,806 | ||||||
Hargreaves Lansdown PLC | 18,261 | 180,902 | ||||||
HSBC Holdings PLC | 1,038,390 | 7,057,412 | ||||||
Intermediate Capital Group PLC | 15,301 | 230,953 | ||||||
| Security | Shares | Value | ||||||
United Kingdom (continued) | ||||||||
Legal & General Group PLC | 310,634 | $ | 918,732 | |||||
Lloyds Banking Group PLC | 3,498,204 | 2,056,759 | ||||||
London Stock Exchange Group PLC | 19,750 | 1,918,311 | ||||||
M&G PLC | 123,495 | 302,690 | ||||||
NatWest Group PLC, NVS | 263,091 | 858,472 | ||||||
Phoenix Group Holdings PLC | 44,228 | 298,823 | ||||||
Prudential PLC . | 149,844 | 2,051,608 | ||||||
Schroders PLC | 47,794 | 272,543 | ||||||
St. James’s Place PLC | 28,304 | 424,714 | ||||||
Standard Chartered PLC | 126,450 | 958,373 | ||||||
|
| |||||||
| 21,464,762 | ||||||||
| United States — 54.2% | ||||||||
Aflac Inc. | 29,130 | 1,879,468 | ||||||
Allstate Corp. (The) | 13,681 | 1,515,992 | ||||||
American Express Co. | 30,974 | 5,109,161 | ||||||
American International Group Inc. | 38,640 | 1,945,910 | ||||||
Ameriprise Financial Inc. | 5,426 | 1,663,069 | ||||||
Aon PLC, Class A | 10,641 | 3,355,001 | ||||||
Arch Capital Group Ltd.(a)(c) | 19,242 | 1,305,955 | ||||||
Arthur J Gallagher & Co. | 11,043 | 2,112,636 | ||||||
Assurant Inc. | 2,872 | 344,841 | ||||||
Bank of America Corp. | 362,392 | 10,364,411 | ||||||
Bank of New York Mellon Corp. (The) | 38,253 | 1,738,216 | ||||||
Berkshire Hathaway Inc., Class B(a) | 93,647 | 28,915,384 | ||||||
BlackRock Inc.(d) | 7,764 | 5,195,048 | ||||||
Brown & Brown Inc. | 12,231 | 702,304 | ||||||
Capital One Financial Corp. | 19,833 | 1,907,141 | ||||||
Cboe Global Markets Inc. | 5,534 | 742,884 | ||||||
Charles Schwab Corp. (The) | 79,338 | 4,155,725 | ||||||
Chubb Ltd. | 21,509 | 4,176,618 | ||||||
Cincinnati Financial Corp. | 8,183 | 917,151 | ||||||
Citigroup Inc. | 100,739 | 4,723,652 | ||||||
Citizens Financial Group Inc. | 25,615 | 777,928 | ||||||
CME Group Inc. | 18,708 | 3,582,956 | ||||||
Comerica Inc. | 6,818 | 296,038 | ||||||
Discover Financial Services | 13,902 | 1,374,074 | ||||||
Everest Re Group Ltd. | 2,048 | 733,225 | ||||||
FactSet Research Systems Inc. | 1,993 | 827,274 | ||||||
Fidelity National Information Services Inc. | 30,875 | 1,677,439 | ||||||
Fifth Third Bancorp | 35,550 | 947,052 | ||||||
First Republic Bank/CA(c) | 9,672 | 135,311 | ||||||
Fiserv Inc.(a) | 33,033 | 3,733,720 | ||||||
FleetCor Technologies Inc.(a) | 3,839 | 809,453 | ||||||
Franklin Resources Inc. | 14,843 | 399,870 | ||||||
Global Payments Inc. | 13,685 | 1,440,209 | ||||||
Globe Life Inc. | 4,709 | 518,084 | ||||||
Goldman Sachs Group Inc. (The) | 17,613 | 5,761,388 | ||||||
Hartford Financial Services Group Inc. (The) | 16,390 | 1,142,219 | ||||||
Huntington Bancshares Inc./OH | 75,045 | 840,504 | ||||||
Intercontinental Exchange Inc. | 29,067 | 3,031,397 | ||||||
Invesco Ltd. | 23,656 | 387,958 | ||||||
Jack Henry & Associates Inc. | 3,813 | 574,695 | ||||||
JPMorgan Chase & Co. | 152,409 | 19,860,417 | ||||||
KeyCorp | 48,547 | 607,809 | ||||||
Lincoln National Corp. | 8,010 | 179,985 | ||||||
Loews Corp. | 10,152 | 589,019 | ||||||
M&T Bank Corp. | 8,815 | 1,054,010 | ||||||
MarketAxess Holdings Inc. | 1,930 | 755,190 | ||||||
Marsh & McLennan Companies Inc. | 25,747 | 4,288,163 | ||||||
Mastercard Inc., Class A | 43,836 | 15,930,441 | ||||||
SCHEDULE OF INVESTMENTS | 41 |
Schedule of Investments (continued) March 31, 2023 | iShares® Global Financials ETF (Percentages shown are based on Net Assets) |
| Security | Shares | Value | ||||||
| United States (continued) | ||||||||
MetLife Inc. | 34,286 | $ | 1,986,531 | |||||
Moody’s Corp. | 8,205 | 2,510,894 | ||||||
Morgan Stanley | 67,949 | 5,965,922 | ||||||
MSCI Inc. | 4,142 | 2,318,236 | ||||||
Nasdaq Inc. | 17,634 | 964,051 | ||||||
Northern Trust Corp. | 10,841 | 955,417 | ||||||
PayPal Holdings Inc.(a) | 58,841 | 4,468,386 | ||||||
PNC Financial Services Group Inc. (The) | 20,864 | 2,651,814 | ||||||
Principal Financial Group Inc. | 11,832 | 879,354 | ||||||
Progressive Corp. (The) | 30,422 | 4,352,171 | ||||||
Prudential Financial Inc. | 19,149 | 1,584,388 | ||||||
Raymond James Financial Inc. | 10,092 | 941,281 | ||||||
Regions Financial Corp. | 48,588 | 901,793 | ||||||
S&P Global Inc. | 17,078 | 5,887,982 | ||||||
State Street Corp. | 18,161 | 1,374,606 | ||||||
Synchrony Financial | 22,742 | 661,337 | ||||||
T Rowe Price Group Inc. | 11,681 | 1,318,785 | ||||||
Travelers Companies Inc. (The) | 12,032 | 2,062,405 | ||||||
Truist Financial Corp. | 69,012 | 2,353,309 | ||||||
U.S. Bancorp. | 72,451 | 2,611,859 | ||||||
Visa Inc., Class A | 84,432 | 19,036,039 | ||||||
W R Berkley Corp. | 10,595 | 659,645 | ||||||
Wells Fargo & Co. | 197,724 | 7,390,923 | ||||||
Willis Towers Watson PLC | 5,555 | 1,290,871 | ||||||
Zions Bancorp. NA | 7,786 | 233,035 | ||||||
|
| |||||||
| 230,387,429 | ||||||||
|
| |||||||
Total Common Stocks — 98.5% |
| 419,243,135 | ||||||
|
| |||||||
Preferred Stocks | ||||||||
| Brazil — 0.6% | ||||||||
Banco Bradesco SA, Preference Shares, ADR | 276,663 | 724,857 | ||||||
| Security | Shares | Value | ||||||
| Brazil (continued) | ||||||||
Itau Unibanco Holding SA, Preference Shares, ADR | 252,011 | $ | 1,227,294 | |||||
Itausa SA, Preference Shares, NVS | 268,223 | 435,003 | ||||||
|
| |||||||
| 2,387,154 | ||||||||
|
| |||||||
Total Preferred Stocks — 0.6% |
| 2,387,154 | ||||||
|
| |||||||
Total Long-Term Investments — 99.1% |
| 421,630,289 | ||||||
|
| |||||||
Short-Term Securities | ||||||||
| Money Market Funds — 0.3% | ||||||||
BlackRock Cash Funds: Institutional, SL Agency Shares, 5.01%(d)(e)(f) | 778,071 | 778,304 | ||||||
BlackRock Cash Funds: Treasury, SL Agency Shares, 4.73%(d)(e) | 590,000 | 590,000 | ||||||
|
| |||||||
Total Short-Term Securities — 0.3% |
| 1,368,304 | ||||||
|
| |||||||
Total Investments — 99.4% |
| 422,998,593 | ||||||
Other Assets Less Liabilities — 0.6% | 2,376,136 | |||||||
|
| |||||||
Net Assets — 100.0% | $ | 425,374,729 | ||||||
|
| |||||||
| (a) | Non-income producing security. |
| (b) | Security exempt from registration pursuant to Rule 144A under the Securities Act of 1933, as amended. These securities may be resold in transactions exempt from registration to qualified institutional investors. |
| (c) | All or a portion of this security is on loan. |
| (d) | Affiliate of the Fund. |
| (e) | Annualized 7-day yield as of period end. |
| (f) | All or a portion of this security was purchased with the cash collateral from loaned securities. |
Affiliates
Investments in issuers considered to be affiliate(s) of the Fund during the year ended March 31, 2023 for purposes of Section 2(a)(3) of the Investment Company Act of 1940, as amended, were as follows:
| ||||||||||||||||||||||||||||||||||||
| Affiliated Issuer | Value at 03/31/22 | Purchases at Cost | Proceeds from Sale | Net Realized Gain (Loss) | Change in Unrealized Appreciation (Depreciation) | Value at 03/31/23 | Shares Held at 03/31/23 | Income | Capital Gain from Underlying Funds | |||||||||||||||||||||||||||
| ||||||||||||||||||||||||||||||||||||
BlackRock Cash Funds: Institutional, SL Agency Shares | $ | 20,641 | $ | 755,962 | (a) | $ | — | $ | 1,774 | $ | (73 | ) | $ | 778,304 | 778,071 | $ | 7,305 | (b) | $ | — | ||||||||||||||||
BlackRock Cash Funds: Treasury, SL Agency Shares | 2,000,000 | — | (1,410,000 | )(a) | — | — | 590,000 | 590,000 | 30,486 | 1 | ||||||||||||||||||||||||||
BlackRock Inc. | 15,373,572 | 2,142,349 | (10,475,534 | ) | (2,549,218 | ) | 703,879 | 5,195,048 | 7,764 | 266,059 | — | |||||||||||||||||||||||||
|
|
|
|
|
|
|
|
|
| |||||||||||||||||||||||||||
| $ | (2,547,444 | ) | $ | 703,806 | $ | 6,563,352 | $ | 303,850 | $ | 1 | ||||||||||||||||||||||||||
|
|
|
|
|
|
|
|
|
| |||||||||||||||||||||||||||
| (a) | Represents net amount purchased (sold). |
| (b) | All or a portion represents securities lending income earned from the reinvestment of cash collateral from loaned securities, net of fees and collateral investment expenses, and other payments to and from borrowers of securities. |
| 42 | 2 0 2 3 I SHARES ANNUAL REPORT TO SHAREHOLDERS |
Schedule of Investments (continued) March 31, 2023 | iShares® Global Financials ETF |
Derivative Financial Instruments Outstanding as of Period End
Futures Contracts
| ||||||||||||||||
| Description | Number of Contracts | Expiration Date | Notional Amount (000) | Value/ Unrealized Appreciation (Depreciation) | ||||||||||||
| ||||||||||||||||
Long Contracts | ||||||||||||||||
E-Mini Financial Select Sector Index | 26 | 06/16/23 | $ | 2,595 | $ | 1,929 | ||||||||||
Euro STOXX 50 Index | 12 | 06/16/23 | 556 | 22,841 | ||||||||||||
FTSE 100 Index | 5 | 06/16/23 | 472 | 976 | ||||||||||||
|
| |||||||||||||||
| $ | 25,746 | |||||||||||||||
|
| |||||||||||||||
Derivative Financial Instruments Categorized by Risk Exposure
As of period end, the fair values of derivative financial instruments located in the Statements of Assets and Liabilities were as follows:
| ||||||||||||||||||||||||||||
Commodity Contracts | Credit Contracts | Equity Contracts | Foreign Currency Exchange Contracts | Interest Rate Contracts | Other Contracts | Total | ||||||||||||||||||||||
| ||||||||||||||||||||||||||||
Assets — Derivative Financial Instruments | ||||||||||||||||||||||||||||
Futures contracts | ||||||||||||||||||||||||||||
Unrealized appreciation on futures contracts(a) | $ | — | $ | — | $ | 25,746 | $ | — | $ | — | $ | — | $ | 25,746 | ||||||||||||||
|
|
|
|
|
|
|
|
|
|
|
|
|
| |||||||||||||||
| (a) | Net cumulative unrealized appreciation (depreciation) on futures contracts are reported in the Schedule of Investments. In the Statements of Assets and Liabilities, only current day’s variation margin is reported in receivables or payables and the net cumulative unrealized appreciation (depreciation) is included in accumulated earnings (loss). |
For the period ended March 31, 2023, the effect of derivative financial instruments in the Statements of Operations was as follows:
| ||||||||||||||||||||||||||||
Commodity Contracts | Credit Contracts | Equity Contracts | Foreign Currency Exchange Contracts | Interest Rate Contracts | Other Contracts | Total | ||||||||||||||||||||||
| ||||||||||||||||||||||||||||
Net Realized Gain (Loss)from | ||||||||||||||||||||||||||||
Futures contracts | $ | — | $ | — | $ | (702,503 | ) | $ | — | $ | — | $ | — | $ | (702,503 | ) | ||||||||||||
|
|
|
|
|
|
|
|
|
|
|
|
|
| |||||||||||||||
Net Change in Unrealized Appreciation (Depreciation) on | ||||||||||||||||||||||||||||
Futures contracts | $ | — | $ | — | $ | 100,971 | $ | — | $ | — | $ | — | $ | 100,971 | ||||||||||||||
|
|
|
|
|
|
|
|
|
|
|
|
|
| |||||||||||||||
Average Quarterly Balances of Outstanding Derivative Financial Instruments
| ||||
Futures contracts | ||||
Average notional value of contracts — long | $ | 3,711,556 | ||
| ||||
For more information about the Fund’s investment risks regarding derivative financial instruments, refer to the Notes to Financial Statements.
Fair Value Hierarchy as of Period End
Various inputs are used in determining the fair value of financial instruments. For a description of the input levels and information about the Fund’s policy regarding valuation of financial instruments, refer to the Notes to Financial Statements.
The following table summarizes the Fund’s financial instruments categorized in the fair value hierarchy. The breakdown of the Fund’s financial instruments into major categories is disclosed in the Schedule of Investments above.
| ||||||||||||||||
| Level 1 | Level 2 | Level 3 | Total | |||||||||||||
| ||||||||||||||||
Assets | ||||||||||||||||
Investments | ||||||||||||||||
Long-Term Investments | ||||||||||||||||
Common Stocks | $ | 264,720,649 | $ | 154,522,486 | $ | — | $ | 419,243,135 | ||||||||
Preferred Stocks | 2,387,154 | — | — | 2,387,154 | ||||||||||||
Short-Term Securities | ||||||||||||||||
Money Market Funds | 1,368,304 | — | — | 1,368,304 | ||||||||||||
|
|
|
|
|
|
|
| |||||||||
| $ | 268,476,107 | $ | 154,522,486 | $ | — | $ | 422,998,593 | |||||||||
|
|
|
|
|
|
|
| |||||||||
SCHEDULE OF INVESTMENTS | 43 |
Schedule of Investments (continued) March 31, 2023 | iShares® Global Financials ETF |
Fair Value Hierarchy as of Period End (continued)
| ||||||||||||||||
| Level 1 | Level 2 | Level 3 | Total | |||||||||||||
| ||||||||||||||||
Derivative Financial Instruments(a) | ||||||||||||||||
Assets | ||||||||||||||||
Equity Contracts | $ | 1,929 | $ | 23,817 | $ | — | $ | 25,746 | ||||||||
|
|
|
|
|
|
|
| |||||||||
| (a) | Derivative financial instruments are futures contracts. Futures contracts are valued at the unrealized appreciation (depreciation) on the instrument. |
See notes to financial statements.
| 44 | 2 0 2 3 I SHARES ANNUAL REPORT TO SHAREHOLDERS |
Schedule of Investments March 31, 2023 | iShares® Global Healthcare ETF (Percentages shown are based on Net Assets) |
| Security | Shares | Value | ||||||
Common Stocks | ||||||||
Australia — 1.8% | ||||||||
Cochlear Ltd. | 38,390 | $ | 6,111,701 | |||||
CSL Ltd. | 284,298 | 55,060,110 | ||||||
Ramsay Health Care Ltd. | 109,989 | 4,914,654 | ||||||
Sonic Healthcare Ltd. | 281,874 | 6,607,958 | ||||||
|
| |||||||
| 72,694,423 | ||||||||
| Belgium — 0.5% | ||||||||
Argenx SE(a) | 32,744 | 12,159,661 | ||||||
UCB SA | 74,566 | 6,664,421 | ||||||
|
| |||||||
| 18,824,082 | ||||||||
| Brazil — 0.1% | ||||||||
Rede D’Or Sao Luiz SA(b) | 522,600 | 2,190,023 | ||||||
|
| |||||||
| China — 0.3% | ||||||||
Wuxi Biologics Cayman Inc.(a)(b) | 2,098,500 | 12,930,869 | ||||||
|
| |||||||
| Denmark — 4.3% | ||||||||
Coloplast A/S, Class B | 69,898 | 9,203,277 | ||||||
Genmab A/S(a) | 38,928 | 14,714,989 | ||||||
Novo Nordisk A/S, Class B | 965,142 | 153,285,067 | ||||||
|
| |||||||
| 177,203,333 | ||||||||
| France — 2.8% | ||||||||
EssilorLuxottica SA | 179,142 | 32,303,381 | ||||||
Eurofins Scientific SE(c) | 76,045 | 5,091,948 | ||||||
Sanofi | 676,917 | 73,431,087 | ||||||
Sartorius Stedim Biotech | 14,138 | 4,337,469 | ||||||
|
| |||||||
| 115,163,885 | ||||||||
| Germany —1.9% | ||||||||
Bayer AG, Registered | 578,224 | 36,937,876 | ||||||
Fresenius Medical Care AG & Co. KGaA | 116,354 | 4,938,556 | ||||||
Fresenius SE & Co. KGaA | 241,455 | 6,520,066 | ||||||
Merck KGaA | 76,428 | 14,248,838 | ||||||
QIAGEN NV(a) | 136,593 | 6,221,330 | ||||||
Siemens Healthineers AG(b) | 166,099 | 9,575,937 | ||||||
|
| |||||||
| 78,442,603 | ||||||||
| Japan — 4.7% | ||||||||
Astellas Pharma Inc. | 1,079,775 | 15,340,703 | ||||||
Chugai Pharmaceutical Co. Ltd. | 377,900 | 9,331,336 | ||||||
Daiichi Sankyo Co. Ltd. | 1,149,000 | 41,912,803 | ||||||
Eisai Co. Ltd. | 175,000 | 9,939,928 | ||||||
Hoya Corp. | 210,700 | 23,284,928 | ||||||
M3 Inc. | 250,600 | 6,307,363 | ||||||
Olympus Corp. | 757,500 | 13,303,782 | ||||||
Ono Pharmaceutical Co. Ltd. | 277,900 | 5,790,929 | ||||||
Otsuka Holdings Co. Ltd. | 328,800 | 10,439,272 | ||||||
Shionogi & Co. Ltd. | 165,600 | 7,469,470 | ||||||
Sysmex Corp. | 99,400 | 6,523,775 | ||||||
Takeda Pharmaceutical Co. Ltd. | 932,692 | 30,632,907 | ||||||
Terumo Corp. | 445,700 | 12,054,094 | ||||||
|
| |||||||
| 192,331,290 | ||||||||
| Netherlands — 0.2% | ||||||||
Koninklijke Philips NV | 521,819 | 9,584,185 | ||||||
|
| |||||||
| South Korea — 0.2% | ||||||||
Celltrion Inc. | 63,268 | 7,313,032 | ||||||
|
| |||||||
| Spain — 0.0% | ||||||||
Grifols SA(a) | 171,451 | 1,697,065 | ||||||
|
| |||||||
| Security | Shares | Value | ||||||
| Sweden — 0.1% | ||||||||
Getinge AB, Class B | 130,414 | $ | 3,180,574 | |||||
|
| |||||||
| Switzerland — 7.8% | ||||||||
Alcon Inc. | 295,203 | 20,955,719 | ||||||
Lonza Group AG, Registered | 43,877 | 26,413,928 | ||||||
Novartis AG, Registered | 1,416,307 | 130,043,210 | ||||||
Roche Holding AG, Bearer | 15,708 | 4,720,108 | ||||||
Roche Holding AG,NVS | 413,965 | 118,287,377 | ||||||
Sonova Holding AG, Registered | 30,258 | 8,925,763 | ||||||
Straumann Holding AG | 68,541 | 10,280,091 | ||||||
|
| |||||||
| 319,626,196 | ||||||||
| United Kingdom — 4.3% | ||||||||
AstraZeneca PLC | 912,982 | 126,497,554 | ||||||
GSK PLC | 2,358,291 | 41,669,381 | ||||||
Smith & Nephew PLC | 519,270 | 7,218,127 | ||||||
|
| |||||||
| 175,385,062 | ||||||||
| United States — 70.4% | ||||||||
Abbott Laboratories | 1,027,338 | 104,028,246 | ||||||
AbbVie Inc. | 1,042,014 | 166,065,771 | ||||||
Agilent Technologies Inc. | 174,116 | 24,087,207 | ||||||
Align Technology Inc.(a) | 42,634 | 14,245,725 | ||||||
AmerisourceBergen Corp. | 94,973 | 15,206,127 | ||||||
Amgen Inc. | 314,245 | 75,968,729 | ||||||
Baxter International Inc. | 297,365 | 12,061,124 | ||||||
Becton Dickinson and Co. | 167,246 | 41,400,075 | ||||||
Biogen Inc.(a) | 84,687 | 23,545,527 | ||||||
Bio-Rad Laboratories Inc., Class A(a) | 12,689 | 6,078,285 | ||||||
Bio-Techne Corp. | 91,924 | 6,819,842 | ||||||
Boston Scientific Corp.(a) | 843,936 | 42,222,118 | ||||||
Bristol-Myers Squibb Co. | 1,252,765 | 86,829,142 | ||||||
Cardinal Health Inc. | 154,131 | 11,636,890 | ||||||
Catalent Inc.(a) | 105,682 | 6,944,364 | ||||||
Centene Corp.(a) | 324,113 | 20,487,183 | ||||||
Charles River Laboratories International Inc.(a) | 29,994 | 6,053,389 | ||||||
Cigna Corp. | 175,771 | 44,914,764 | ||||||
Cooper Companies Inc. (The) | 29,053 | 10,847,228 | ||||||
CVS Health Corp. | 755,692 | 56,155,472 | ||||||
Danaher Corp. | 386,215 | 97,341,629 | ||||||
DaVita Inc.(a)(c) | 32,534 | 2,638,833 | ||||||
DENTSPLY SIRONA Inc. | 127,124 | 4,993,431 | ||||||
Dexcom Inc.(a)(c) | 227,402 | 26,419,564 | ||||||
Edwards Lifesciences Corp.(a) | 364,287 | 30,137,463 | ||||||
Elevance Health Inc. | 140,726 | 64,707,222 | ||||||
Eli Lilly & Co. | 464,686 | 159,582,466 | ||||||
GE Healthcare Inc., NVS(a) | 214,167 | 17,568,119 | ||||||
Gilead Sciences Inc. | 736,099 | 61,074,134 | ||||||
HCA Healthcare Inc. | 124,273 | 32,768,305 | ||||||
Henry Schein Inc.(a) | 79,544 | 6,486,018 | ||||||
Hologic Inc.(a) | 146,159 | 11,795,031 | ||||||
Humana Inc. | 74,303 | 36,071,134 | ||||||
IDEXX Laboratories Inc.(a) | 48,813 | 24,410,405 | ||||||
Illumina Inc.(a)(c) | 92,753 | 21,569,710 | ||||||
Incyte Corp.(a) | 109,317 | 7,900,340 | ||||||
Insulet Corp.(a)(c) | 40,761 | 13,001,129 | ||||||
Intuitive Surgical Inc.(a) | 207,399 | 52,984,223 | ||||||
IQVIA Holdings Inc.(a) | 109,540 | 21,786,411 | ||||||
Johnson & Johnson | 1,540,490 | 238,775,950 | ||||||
Laboratory Corp. of America Holdings | 51,998 | 11,929,381 | ||||||
McKesson Corp. | 80,589 | 28,693,713 | ||||||
Medtronic PLC | 782,801 | 63,109,417 | ||||||
SCHEDULE OF INVESTMENTS | 45 |
Schedule of Investments (continued) March 31, 2023 | iShares® Global Healthcare ETF (Percentages shown are based on Net Assets) |
| Security | Shares | Value | ||||||
| United States (continued) | ||||||||
Merck & Co. Inc. | 1,493,894 | $ | 158,935,383 | |||||
Mettler-Toledo International Inc.(a) | 13,062 | 19,987,603 | ||||||
Moderna Inc.(a) | 194,302 | 29,840,901 | ||||||
Molina Healthcare Inc.(a)(c) | 34,221 | 9,153,775 | ||||||
Organon & Co. | 150,036 | 3,528,847 | ||||||
PerkinElmer Inc. | 74,353 | 9,908,281 | ||||||
Pfizer Inc. | 3,307,437 | 134,943,430 | ||||||
Quest Diagnostics Inc. | 66,978 | 9,476,047 | ||||||
Regeneron Pharmaceuticals Inc.(a) | 63,270 | 51,987,061 | ||||||
ResMed Inc. | 86,593 | 18,963,001 | ||||||
STERIS PLC | 58,322 | 11,155,832 | ||||||
Stryker Corp. | 198,419 | 56,642,672 | ||||||
Teleflex Inc. | 27,686 | 7,013,141 | ||||||
Thermo Fisher Scientific Inc. | 231,087 | 133,191,614 | ||||||
UnitedHealth Group Inc. | 550,533 | 260,176,390 | ||||||
Universal Health Services Inc., Class B | 37,655 | 4,785,950 | ||||||
Vertex Pharmaceuticals Inc.(a) | 151,299 | 47,669,776 | ||||||
Viatris Inc. | 715,494 | 6,883,052 | ||||||
Waters Corp.(a)(c) | 34,955 | 10,823,117 | ||||||
West Pharmaceutical Services Inc. | 43,574 | 15,097,084 | ||||||
Zimmer Biomet Holdings Inc. | 123,420 | 15,945,864 | ||||||
Zoetis Inc. | 274,619 | 45,707,586 | ||||||
|
| |||||||
| 2,873,157,643 | ||||||||
|
| |||||||
Total Common Stocks — 99.4% |
| 4,059,724,265 | ||||||
|
| |||||||
Preferred Stocks | ||||||||
| Germany —0.2% | ||||||||
Sartorius AG, Preference Shares, NVS | 15,750 | 6,637,936 | ||||||
|
| |||||||
Total Preferred Stocks — 0.2% |
| 6,637,936 | ||||||
|
| |||||||
Total Long-Term Investments — 99.6% |
| 4,066,362,201 | ||||||
|
| |||||||
| Security | Shares | Value | ||||||
| ||||||||
Short-Term Securities | ||||||||
| Money Market Funds — 0.8% | ||||||||
BlackRock Cash Funds: Institutional, SL Agency Shares, 5.01%(d)(e)(f) | 28,977,756 | $ | 28,986,449 | |||||
BlackRock Cash Funds: Treasury, SL Agency Shares, 4.73%(d)(e) | 5,900,000 | 5,900,000 | ||||||
|
| |||||||
Total Short-Term Securities — 0.8% |
| 34,886,449 | ||||||
|
| |||||||
Total Investments — 100.4% |
| 4,101,248,650 | ||||||
Liabilities in Excess of Other Assets — (0.4)% |
| (17,992,773 | ) | |||||
|
| |||||||
Net Assets — 100.0% | $ | 4,083,255,877 | ||||||
|
| |||||||
| (a) | Non-income producing security. |
| (b) | Security exempt from registration pursuant to Rule 144A under the Securities Act of 1933, as amended. These securities may be resold in transactions exempt from registration to qualified institutional investors. |
| (c) | All or a portion of this security is on loan. |
| (d) | Affiliate of the Fund. |
| (e) | Annualized 7-day yield as of period end. |
| (f) | All or a portion of this security was purchased with the cash collateral from loaned securities. |
Affiliates
Investments in issuers considered to be affiliate(s) of the Fund during the year ended March 31, 2023 for purposes of Section 2(a)(3) of the Investment Company Act of 1940, as amended, were as follows:
| ||||||||||||||||||||||||||||||||||||
| Affiliated Issuer | Value at 03/31/22 | Purchases at Cost | Proceeds from Sale | Net Realized Gain (Loss) | Change in Unrealized Appreciation (Depreciation) | Value at 03/31/23 | Shares Held at 03/31/23 | Income | Capital Gain Distributions from Underlying Funds | |||||||||||||||||||||||||||
| ||||||||||||||||||||||||||||||||||||
BlackRock Cash Funds: Institutional, SL Agency Shares | $ | 6,065,148 | $ | 22,912,502 | (a) | $ | — | $ | 4,655 | $ | 4,144 | $ | 28,986,449 | 28,977,756 | $ | 48,440 | (b) | $ | — | |||||||||||||||||
BlackRock Cash Funds: Treasury, SL Agency Shares | 4,860,000 | 1,040,000 | (a) | — | — | — | 5,900,000 | 5,900,000 | 129,215 | 4 | ||||||||||||||||||||||||||
|
|
|
|
|
|
|
|
|
| |||||||||||||||||||||||||||
| $ | 4,655 | $ | 4,144 | $ | 34,886,449 | $ | 177,655 | $ | 4 | |||||||||||||||||||||||||||
|
|
|
|
|
|
|
|
|
| |||||||||||||||||||||||||||
| (a) | Represents net amount purchased (sold). |
| (b) | All or a portion represents securities lending income earned from the reinvestment of cash collateral from loaned securities, net of fees and collateral investment expenses, and other payments to and from borrowers of securities. |
| 46 | 2 0 2 3 I SHARES ANNUAL REPORT TO SHAREHOLDERS |
Schedule of Investments (continued) March 31, 2023 | iShares® Global Healthcare ETF |
Derivative Financial Instruments Outstanding as of Period End
Futures Contracts
| ||||||||||||||||
| Description | Number of Contracts | Expiration Date | Notional Amount (000) | Value/ Unrealized Appreciation (Depreciation) | ||||||||||||
| ||||||||||||||||
Long Contracts | ||||||||||||||||
E-Mini Health Care Sector Index | 124 | 06/16/23 | $ | 16,357 | $ | 481,447 | ||||||||||
|
| |||||||||||||||
Derivative Financial Instruments Categorized by Risk Exposure
As of period end, the fair values of derivative financial instruments located in the Statements of Assets and Liabilities were as follows:
| ||||||||||||||||||||||||||||
Commodity Contracts | Credit Contracts | Equity Contracts | Foreign Currency Exchange Contracts | Interest Rate Contracts | Other Contracts | Total | ||||||||||||||||||||||
| ||||||||||||||||||||||||||||
Assets — Derivative Financial Instruments | ||||||||||||||||||||||||||||
Futures contracts | ||||||||||||||||||||||||||||
Unrealized appreciation on futures contracts(a) | $ | — | $ | — | $ | 481,447 | $ | — | $ | — | $ | — | $ | 481,447 | ||||||||||||||
|
|
|
|
|
|
|
|
|
|
|
|
|
| |||||||||||||||
| (a) | Net cumulative unrealized appreciation (depreciation) on futures contracts are reported in the Schedule of Investments. In the Statements of Assets and Liabilities, only current day’s variation margin is reported in receivables or payables and the net cumulative unrealized appreciation (depreciation) is included in accumulated earnings (loss). |
For the period ended March 31, 2023, the effect of derivative financial instruments in the Statements of Operations was as follows:
| ||||||||||||||||||||||||||||
Commodity Contracts | Credit Contracts | Equity Contracts | Foreign Currency Exchange Contracts | Interest Rate Contracts | Other Contracts | Total | ||||||||||||||||||||||
| ||||||||||||||||||||||||||||
Net Realized Gain (Loss) from | ||||||||||||||||||||||||||||
Futures contracts | $ | — | $ | — | $ | (1,915,886 | ) | $ | — | $ | — | $ | — | $ | (1,915,886 | ) | ||||||||||||
|
|
|
|
|
|
|
|
|
|
|
|
|
| |||||||||||||||
Net Change in Unrealized Appreciation (Depreciation) on | ||||||||||||||||||||||||||||
Futures contracts | $ | — | $ | — | $ | (34,093 | ) | $ | — | $ | — | $ | — | $ | (34,093 | ) | ||||||||||||
|
|
|
|
|
|
|
|
|
|
|
|
|
| |||||||||||||||
Average Quarterly Balances of Outstanding Derivative Financial Instruments
| ||||
Futures contracts | ||||
Average notional value of contracts — long | $ | 12,829,375 | ||
| ||||
For more information about the Fund’s investment risks regarding derivative financial instruments, refer to the Notes to Financial Statements.
Fair Value Hierarchy as of Period End
Various inputs are used in determining the fair value of financial instruments. For a description of the input levels and information about the Fund’s policy regarding valuation of financial instruments, refer to the Notes to Financial Statements.
The following table summarizes the Fund’s financial instruments categorized in the fair value hierarchy. The breakdown of the Fund’s financial instruments into major categories is disclosed in the Schedule of Investments above.
| ||||||||||||||||
| Level 1 | Level 2 | Level 3 | Total | |||||||||||||
| ||||||||||||||||
Assets | ||||||||||||||||
Investments | ||||||||||||||||
Long-Term Investments | ||||||||||||||||
Common Stocks | $ | 2,875,347,666 | $ | 1,184,376,599 | $ | — | $ | 4,059,724,265 | ||||||||
Preferred Stocks | — | 6,637,936 | — | 6,637,936 | ||||||||||||
Short-Term Securities | ||||||||||||||||
Money Market Funds | 34,886,449 | — | — | 34,886,449 | ||||||||||||
|
|
|
|
|
|
|
| |||||||||
| $ | 2,910,234,115 | $ | 1,191,014,535 | $ | — | $ | 4,101,248,650 | |||||||||
|
|
|
|
|
|
|
| |||||||||
SCHEDULE OF INVESTMENTS | 47 |
Schedule of Investments (continued) March 31, 2023 | iShares® Global Healthcare ETF |
Fair Value Hierarchy as of Period End (continued)
| ||||||||||||||||
| Level 1 | Level 2 | Level 3 | Total | |||||||||||||
| ||||||||||||||||
Derivative Financial Instruments(a) | ||||||||||||||||
Assets | ||||||||||||||||
Equity Contracts | $ | 481,447 | $ | — | $ | — | $ | 481,447 | ||||||||
|
|
|
|
|
|
|
| |||||||||
| (a) | Derivative financial instruments are futures contracts. Futures contracts are valued at the unrealized appreciation (depreciation) on the instrument. |
See notes to financial statements.
| 48 | 2 0 2 3 I SHARES ANNUAL REPORT TO SHAREHOLDERS |
Schedule of Investments March 31, 2023 | iShares® Global Industrials ETF (Percentages shown are based on Net Assets) |
| Security | Shares | Value | ||||||
Common Stocks |
| |||||||
Australia — 1.0% |
| |||||||
Brambles Ltd. | 83,494 | $ | 752,803 | |||||
Computershare Ltd. | 34,483 | 500,872 | ||||||
Qantas Airways Ltd.(a) | 109,231 | 487,547 | ||||||
Transurban Group | 184,875 | 1,765,257 | ||||||
|
| |||||||
| 3,506,479 | ||||||||
| Brazil — 0.4% | ||||||||
CCR SA | 66,848 | 168,820 | ||||||
Localiza Rent a Car SA | 46,178 | 486,520 | ||||||
WEG SA | 88,323 | 706,626 | ||||||
|
| |||||||
| 1,361,966 | ||||||||
| Canada — 3.7% | ||||||||
CAE Inc.(a) | 19,111 | 432,136 | ||||||
Canadian National Railway Co. | 36,507 | 4,307,637 | ||||||
Canadian Pacific Railway Ltd. | 55,921 | 4,306,103 | ||||||
Thomson Reuters Corp. | 9,515 | 1,237,971 | ||||||
Waste Connections Inc. | 15,463 | 2,152,120 | ||||||
|
| |||||||
| 12,435,967 | ||||||||
| Denmark — 1.4% | ||||||||
AP Moller - Maersk A/S, Class A | 182 | 322,876 | ||||||
AP Moller - Maersk A/S, Class B, NVS | 333 | 605,297 | ||||||
DSV A/S | 10,797 | 2,093,510 | ||||||
Vestas Wind Systems A/S | 60,714 | 1,769,474 | ||||||
|
| |||||||
| 4,791,157 | ||||||||
| Finland — 0.6% | ||||||||
Kone OYJ, Class B | 24,249 | 1,264,683 | ||||||
Metso Outotec OYJ | 42,067 | 459,345 | ||||||
Wartsila OYJ Abp | 29,007 | 273,747 | ||||||
|
| |||||||
| 1,997,775 | ||||||||
| France — 7.4% | ||||||||
Airbus SE | 36,963 | 4,937,054 | ||||||
Alstom SA | 18,548 | 504,993 | ||||||
Bouygues SA | 12,385 | 417,697 | ||||||
Bureau Veritas SA | 17,405 | 500,089 | ||||||
Cie. de Saint-Gobain | 31,009 | 1,762,662 | ||||||
Eiffage SA | 4,662 | 504,503 | ||||||
Getlink SE | 24,139 | 397,560 | ||||||
Legrand SA | 16,043 | 1,465,886 | ||||||
Safran SA | 21,063 | 3,118,095 | ||||||
Schneider Electric SE | 34,336 | 5,738,362 | ||||||
Teleperformance | 3,555 | 859,009 | ||||||
Thales SA | 6,417 | 948,732 | ||||||
Vinci SA | 31,892 | 3,656,173 | ||||||
|
| |||||||
| 24,810,815 | ||||||||
| Germany —4.3% | ||||||||
Brenntag SE | 9,289 | 699,055 | ||||||
Daimler Truck Holding AG(a) | 31,171 | 1,051,990 | ||||||
Deutsche Post AG, Registered | 59,594 | 2,791,123 | ||||||
GEA Group AG | 9,998 | 456,084 | ||||||
MTU Aero Engines AG | 3,215 | 804,521 | ||||||
Rheinmetall AG | 2,620 | 776,175 | ||||||
Siemens AG, Registered | 44,971 | 7,285,477 | ||||||
Siemens Energy AG(a) | 24,028 | 529,853 | ||||||
|
| |||||||
| 14,394,278 | ||||||||
| Hong Kong — 0.6% | ||||||||
CK Hutchison Holdings Ltd. | 161,520 | 999,268 | ||||||
| Security | Shares | Value | ||||||
Hong Kong (continued) | ||||||||
Techtronic Industries Co. Ltd. | 111,500 | $ | 1,208,114 | |||||
|
| |||||||
| 2,207,382 | ||||||||
| Ireland — 0.4% | ||||||||
Kingspan Group PLC | 9,281 | 635,983 | ||||||
Ryanair Holdings PLC, ADR(a)(b) | 6,057 | 571,115 | ||||||
|
| |||||||
| 1,207,098 | ||||||||
| Italy — 0.5% | ||||||||
CNH Industrial NV | 59,883 | 916,280 | ||||||
Prysmian SpA | 16,121 | 676,932 | ||||||
|
| |||||||
| 1,593,212 | ||||||||
| Japan — 13.8% | ||||||||
AGC Inc. | 13,700 | 510,749 | ||||||
ANA Holdings Inc.(a) | 29,500 | 641,180 | ||||||
Central Japan Railway Co. | 12,400 | 1,479,563 | ||||||
Dai Nippon Printing Co. Ltd. | 16,400 | 459,175 | ||||||
Daifuku Co. Ltd. | 23,400 | 434,472 | ||||||
Daikin Industries Ltd. | 17,700 | 3,175,496 | ||||||
East Japan Railway Co. | 22,900 | 1,267,322 | ||||||
FANUC Corp. | 58,500 | 2,112,563 | ||||||
Hankyu Hanshin Holdings Inc. | 14,600 | 432,919 | ||||||
Hitachi Ltd. | 56,500 | 3,105,279 | ||||||
ITOCHU Corp. | 88,600 | 2,885,387 | ||||||
Japan Airlines Co. Ltd. | 26,400 | 514,750 | ||||||
Kajima Corp. | 28,700 | 346,335 | ||||||
Kintetsu Group Holdings Co. Ltd. | 11,500 | 370,460 | ||||||
Komatsu Ltd. | 58,700 | 1,457,235 | ||||||
Kubota Corp. | 68,100 | 1,032,486 | ||||||
Makita Corp. | 16,900 | 420,892 | ||||||
Marubeni Corp. | 103,400 | 1,406,210 | ||||||
Mitsubishi Corp. | 88,600 | 3,183,970 | ||||||
Mitsubishi Electric Corp. | 129,300 | 1,545,152 | ||||||
Mitsubishi Heavy Industries Ltd. | 20,400 | 751,556 | ||||||
Mitsui & Co. Ltd. | 95,800 | 2,986,071 | ||||||
Nidec Corp. | 32,000 | 1,665,311 | ||||||
Nippon Yusen KK | 30,700 | 717,101 | ||||||
Obayashi Corp. | 43,900 | 335,942 | ||||||
Odakyu Electric Railway Co. Ltd. | 20,800 | 270,614 | ||||||
Recruit Holdings Co. Ltd. | 102,000 | 2,805,921 | ||||||
Secom Co. Ltd. | 12,900 | 794,997 | ||||||
SG Holdings Co. Ltd. | 29,500 | 437,431 | ||||||
SMC Corp. | 3,800 | 2,014,442 | ||||||
Sumitomo Corp. | 75,400 | 1,335,737 | ||||||
Taisei Corp. | 12,100 | 374,360 | ||||||
Tokyu Corp. | 37,600 | 500,536 | ||||||
Toppan Inc. | 21,100 | 425,214 | ||||||
Toshiba Corp. | 26,100 | 876,427 | ||||||
TOTO Ltd. | 9,600 | 321,636 | ||||||
Toyota Industries Corp. | 12,300 | 685,246 | ||||||
Toyota Tsusho Corp. | 14,300 | 609,713 | ||||||
West Japan Railway Co. | 14,800 | 609,635 | ||||||
Yamato Holdings Co. Ltd. | 20,200 | 346,739 | ||||||
Yaskawa Electric Corp. | 16,100 | 706,145 | ||||||
|
| |||||||
| 46,352,369 | ||||||||
| Netherlands — 0.9% | ||||||||
IMCD NV | 3,455 | 564,947 | ||||||
Randstad NV | 7,511 | 445,888 | ||||||
Wolters Kluwer NV | 15,483 | 1,954,519 | ||||||
|
| |||||||
| 2,965,354 | ||||||||
SCHEDULE OF INVESTMENTS | 49 |
Schedule of Investments (continued) March 31, 2023 | iShares® Global Industrials ETF (Percentages shown are based on Net Assets) |
| Security | Shares | Value | ||||||
South Korea — 0.3% | ||||||||
LG Energy Solution(a) | 2,575 | $ | 1,160,173 | |||||
|
| |||||||
Spain — 0.6% | ||||||||
ACS Actividades de Construccion y Servicios SA | 13,327 | 424,461 | ||||||
Aena SME SA(a)(c) | 4,421 | 714,912 | ||||||
Ferrovial SA | 29,739 | 875,736 | ||||||
|
| |||||||
| 2,015,109 | ||||||||
| Sweden — 3.4% | ||||||||
Alfa Laval AB | 17,843 | 637,122 | ||||||
Assa Abloy AB, Class B | 59,626 | 1,428,190 | ||||||
Atlas Copco AB, Class A | 153,414 | 1,943,501 | ||||||
Atlas Copco AB, Class B | 93,842 | 1,079,440 | ||||||
Epiroc AB, Class A | 37,641 | 747,174 | ||||||
Epiroc AB, Class B | 23,812 | 406,005 | ||||||
Nibe Industrier AB, Class B | 92,185 | 1,050,828 | ||||||
Sandvik AB | 65,611 | 1,392,645 | ||||||
Skanska AB, Class B | 24,274 | 371,797 | ||||||
SKF AB, Class B | 22,537 | 443,909 | ||||||
Volvo AB, Class B | 95,501 | 1,967,955 | ||||||
|
| |||||||
| 11,468,566 | ||||||||
| Switzerland — 2.5% | ||||||||
ABB Ltd., Registered | 102,767 | 3,535,339 | ||||||
Adecco Group AG, Registered | 10,127 | 368,876 | ||||||
Geberit AG, Registered | 2,158 | 1,205,129 | ||||||
Kuehne + Nagel International AG, Registered | 3,414 | 1,016,809 | ||||||
Schindler Holding AG, Participation Certificates, NVS | 2,449 | 542,644 | ||||||
Schindler Holding AG, Registered | 1,251 | 264,735 | ||||||
SGS SA, Registered | 365 | 805,098 | ||||||
VAT Group AG(c) | 1,615 | 583,473 | ||||||
|
| |||||||
| 8,322,103 | ||||||||
| United Kingdom — 4.6% | ||||||||
Ashtead Group PLC | 27,014 | 1,658,791 | ||||||
BAE Systems PLC | 183,672 | 2,221,719 | ||||||
Bunzl PLC | 20,302 | 766,859 | ||||||
DCC PLC | 6,013 | 350,505 | ||||||
Experian PLC | 58,290 | 1,919,356 | ||||||
IMI PLC | 16,988 | 321,562 | ||||||
Intertek Group PLC | 9,636 | 482,616 | ||||||
Melrose Industries PLC | 246,957 | 508,621 | ||||||
RELX PLC | 119,184 | 3,860,000 | ||||||
Rentokil Initial PLC | 151,508 | 1,107,302 | ||||||
Rolls-Royce Holdings PLC(a) | 503,069 | 926,583 | ||||||
Smiths Group PLC | 21,226 | 450,177 | ||||||
Spirax-Sarco Engineering PLC | 4,388 | 644,258 | ||||||
Weir Group PLC (The) | 15,442 | 354,262 | ||||||
|
| |||||||
| 15,572,611 | ||||||||
| United States — 53.1% | ||||||||
3M Co. | 33,098 | 3,478,931 | ||||||
AO Smith Corp. | 7,628 | 527,476 | ||||||
Alaska Air Group Inc.(a) | 7,714 | 323,679 | ||||||
Allegion PLC | 5,282 | 563,748 | ||||||
American Airlines Group Inc.(a) | 38,656 | 570,176 | ||||||
AMETEK Inc. | 13,807 | 2,006,571 | ||||||
Automatic Data Processing Inc. | 24,912 | 5,546,159 | ||||||
Boeing Co. (The)(a) | 33,809 | 7,182,046 | ||||||
Broadridge Financial Solutions Inc. | 7,078 | 1,037,422 | ||||||
Carrier Global Corp. | 50,152 | 2,294,454 | ||||||
Caterpillar Inc. | 31,288 | 7,159,946 | ||||||
CH Robinson Worldwide Inc. | 7,079 | 703,440 | ||||||
| Security | Shares | Value | ||||||
United States (continued) |
| |||||||
Cintas Corp. | 5,193 | $ | 2,402,697 | |||||
Copart Inc.(a) | 25,774 | 1,938,463 | ||||||
CoStar Group Inc.(a) | 24,451 | 1,683,451 | ||||||
CSX Corp. | 126,399 | 3,784,386 | ||||||
Cummins Inc. | 8,496 | 2,029,524 | ||||||
Deere & Co. | 16,258 | 6,712,603 | ||||||
Delta Air Lines Inc.(a) | 38,552 | 1,346,236 | ||||||
Dover Corp. | 8,400 | 1,276,296 | ||||||
Eaton Corp. PLC | 23,910 | 4,096,739 | ||||||
Emerson Electric Co. | 34,353 | 2,993,520 | ||||||
Equifax Inc. | 7,366 | 1,494,119 | ||||||
Expeditors International of Washington Inc. | 9,568 | 1,053,628 | ||||||
Fastenal Co. | 34,320 | 1,851,221 | ||||||
FedEx Corp. | 13,962 | 3,190,177 | ||||||
Fortive Corp. | 21,218 | 1,446,431 | ||||||
Generac Holdings Inc.(a) | 3,865 | 417,459 | ||||||
General Dynamics Corp. | 13,530 | 3,087,681 | ||||||
General Electric Co. | 65,490 | 6,260,844 | ||||||
Honeywell International Inc. | 40,171 | 7,677,482 | ||||||
Howmet Aerospace Inc. | 22,137 | 937,945 | ||||||
Huntington Ingalls Industries Inc. | 2,427 | 502,438 | ||||||
IDEX Corp. | 4,536 | 1,047,952 | ||||||
Illinois Tool Works Inc. | 16,692 | 4,063,667 | ||||||
Ingersoll Rand Inc.(b) | 24,346 | 1,416,450 | ||||||
Jacobs Solutions Inc., NVS | 7,618 | 895,191 | ||||||
JB Hunt Transport Services Inc. | 4,991 | 875,721 | ||||||
Johnson Controls International PLC | 41,317 | 2,488,110 | ||||||
L3Harris Technologies Inc. | 11,447 | 2,246,359 | ||||||
Leidos Holdings Inc. | 8,218 | 756,549 | ||||||
Lockheed Martin Corp. | 13,661 | 6,457,965 | ||||||
Masco Corp. | 13,540 | 673,209 | ||||||
Nordson Corp. | 3,233 | 718,567 | ||||||
Norfolk Southern Corp. | 13,695 | 2,903,340 | ||||||
Northrop Grumman Corp. | 8,651 | 3,994,340 | ||||||
Old Dominion Freight Line Inc.(b) | 5,447 | 1,856,555 | ||||||
Otis Worldwide Corp. | 24,944 | 2,105,274 | ||||||
PACCAR Inc. | 31,385 | 2,297,382 | ||||||
Parker-Hannifin Corp. | 7,713 | 2,592,416 | ||||||
Paychex Inc. | 19,289 | 2,210,326 | ||||||
Pentair PLC | 9,891 | 546,676 | ||||||
Quanta Services Inc. | 8,593 | 1,431,938 | ||||||
Raytheon Technologies Corp. | 88,075 | 8,625,185 | ||||||
Republic Services Inc. | 12,349 | 1,669,832 | ||||||
Robert Half International Inc. | 6,463 | 520,724 | ||||||
Rockwell Automation Inc. | 6,903 | 2,025,685 | ||||||
Rollins Inc. | 13,870 | 520,541 | ||||||
Snap-on Inc. | 3,193 | 788,320 | ||||||
Southwest Airlines Co. | 35,730 | 1,162,654 | ||||||
Stanley Black & Decker Inc. | 8,896 | 716,840 | ||||||
Textron Inc. | 12,553 | 886,618 | ||||||
Trane Technologies PLC | 13,773 | 2,533,957 | ||||||
TransDigm Group Inc. | 3,120 | 2,299,596 | ||||||
Union Pacific Corp. | 36,787 | 7,403,752 | ||||||
United Airlines Holdings Inc.(a) | 19,655 | 869,734 | ||||||
United Parcel Service Inc., Class B | 43,879 | 8,512,087 | ||||||
United Rentals Inc . | 4,171 | 1,650,715 | ||||||
Verisk Analytics Inc. | 9,403 | 1,804,060 | ||||||
Waste Management Inc. | 22,331 | 3,643,749 | ||||||
Westinghouse Air Brake Technologies Corp. | 10,935 | 1,105,091 | ||||||
WW Grainger Inc. | 2,705 | 1,863,231 | ||||||
| 50 | 2 0 2 3 I SHARES ANNUAL REPORT TO SHAREHOLDERS |
Schedule of Investments (continued) March 31, 2023 | iShares® Global Industrials ETF (Percentages shown are based on Net Assets) |
| Security | Shares | Value | ||||||
United States (continued) |
| |||||||
Xylem Inc./NY | 10,838 | $ | 1,134,739 | |||||
|
| |||||||
| 178,892,485 | ||||||||
|
| |||||||
Total Common Stocks — 99.5% |
| 335,054,899 | ||||||
|
| |||||||
Rights | ||||||||
Brazil — 0.0% | ||||||||
Localiza Rent a Car SA, Rights, | 206 | 534 | ||||||
|
| |||||||
Total Rights — 0.0% |
| 534 | ||||||
|
| |||||||
Total Long-Term Investments — 99.5% |
| 335,055,433 | ||||||
|
| |||||||
Short-Term Securities | ||||||||
| Money Market Funds — 1.2% | ||||||||
BlackRock Cash Funds: Institutional, SL Agency Shares, 5.01%(d)(e)(f) | 3,817,891 | 3,819,037 | ||||||
| Security | Shares | Value | ||||||
| ||||||||
| Money Market Funds (continued) | ||||||||
BlackRock Cash Funds: Treasury, SL Agency Shares, 4.73%(d)(e) | 310,000 | $ | 310,000 | |||||
|
| |||||||
Total Short-Term Securities — 1.2% |
| 4,129,037 | ||||||
|
| |||||||
Total Investments — 100.7% |
| 339,184,470 | ||||||
Liabilities in Excess of Other Assets — (0.7)% |
| (2,226,290 | ) | |||||
|
| |||||||
Net Assets — 100.0% |
| $ | 336,958,180 | |||||
|
| |||||||
| (a) | Non-income producing security. |
| (b) | All or a portion of this security is on loan. |
| (c) | Security exempt from registration pursuant to Rule 144A under the Securities Act of 1933, as amended. These securities may be resold in transactions exempt from registration to qualified institutional investors. |
| (d) | Affiliate of the Fund. |
| (e) | Annualized 7-day yield as of period end. |
| (f) | All or a portion of this security was purchased with the cash collateral from loaned securities. |
Affiliates
Investments in issuers considered to be affiliate(s) of the Fund during the year ended March 31, 2023 for purposes of Section 2(a)(3) of the Investment Company Act of 1940, as amended, were as follows:
| ||||||||||||||||||||||||||||||||||||
| Affiliated Issuer | Value at 03/31/22 | Purchases at Cost | Proceeds from Sale | Net Realized Gain (Loss) | Change in Unrealized Appreciation (Depreciation) | Value at 03/31/23 | Shares Held at | Income | Capital Gain Distributions from Underlying Funds | |||||||||||||||||||||||||||
| ||||||||||||||||||||||||||||||||||||
BlackRock Cash Funds: Institutional, SL Agency Shares | $ | 2,815,249 | $ | 999,776 | (a) | $ | — | $ | 5,125 | $ | (1,113 | ) | $ | 3,819,037 | 3,817,891 | $ | 13,687 | (b) | $ | — | ||||||||||||||||
BlackRock Cash Funds: Treasury, SL Agency Shares | 310,000 | 0 | (a) | — | — | — | 310,000 | 310,000 | 14,424 | — | ||||||||||||||||||||||||||
|
|
|
|
|
|
|
|
|
| |||||||||||||||||||||||||||
| $ | 5,125 | $ | (1,113 | ) | $ | 4,129,037 | $ | 28,111 | $ | — | ||||||||||||||||||||||||||
|
|
|
|
|
|
|
|
|
| |||||||||||||||||||||||||||
| (a) | Represents net amount purchased (sold). |
| (b) | All or a portion represents securities lending income earned from the reinvestment of cash collateral from loaned securities, net of fees and collateral investment expenses, and other payments to and from borrowers of securities. |
Derivative Financial Instruments Outstanding as of Period End Futures Contracts
| ||||||||||||||||
| Description | Number of Contracts | Expiration Date | Notional Amount (000) | Value/ Unrealized Appreciation (Depreciation) | ||||||||||||
| ||||||||||||||||
Long Contracts | ||||||||||||||||
TOPIX Index | 1 | 06/08/23 | $ | 152 | $ | 5,457 | ||||||||||
Euro STOXX 50 Index | 11 | 06/16/23 | 509 | 14,395 | ||||||||||||
XAI Industrial Index | 11 | 06/16/23 | 1,131 | 20,662 | ||||||||||||
|
| |||||||||||||||
| $ | 40,514 | |||||||||||||||
|
| |||||||||||||||
SCHEDULE OF INVESTMENTS | 51 |
Schedule of Investments (continued) March 31, 2023 | iShares® Global Industrials ETF |
Derivative Financial Instruments Categorized by Risk Exposure
As of period end, the fair values of derivative financial instruments located in the Statements of Assets and Liabilities were as follows:
| ||||||||||||||||||||||||||||
Commodity Contracts | Credit Contracts | Equity Contracts | Foreign Currency Exchange Contracts | Interest Rate Contracts | Other Contracts | Total | ||||||||||||||||||||||
| ||||||||||||||||||||||||||||
Assets — Derivative Financial Instruments | ||||||||||||||||||||||||||||
Futures contracts | ||||||||||||||||||||||||||||
Unrealized appreciation on futures contracts(a) | $ | — | $ | — | $ | 40,514 | $ | — | $ | — | $ | — | $ | 40,514 | ||||||||||||||
|
|
|
|
|
|
|
|
|
|
|
|
|
| |||||||||||||||
| (a) | Net cumulative unrealized appreciation (depreciation) on futures contracts are reported in the Schedule of Investments. In the Statements of Assets and Liabilities, only current day’s variation margin is reported in receivables or payables and the net cumulative unrealized appreciation (depreciation) is included in accumulated earnings (loss). |
For the period ended March 31, 2023, the effect of derivative financial instruments in the Statements of Operations was as follows:
| ||||||||||||||||||||||||||||
Commodity Contracts | Credit Contracts | Equity Contracts | Foreign Currency Exchange Contracts | Interest Rate Contracts | Other Contracts | Total | ||||||||||||||||||||||
| ||||||||||||||||||||||||||||
Net Realized Gain (Loss) from | ||||||||||||||||||||||||||||
Futures contracts | $ | — | $ | — | $ | (30,818 | ) | $ | — | $ | — | $ | — | $ | (30,818 | ) | ||||||||||||
|
|
|
|
|
|
|
|
|
|
|
|
|
| |||||||||||||||
Net Change in Unrealized Appreciation (Depreciation) on | ||||||||||||||||||||||||||||
Futures contracts | $ | — | $ | — | $ | 19,090 | $ | — | $ | — | $ | — | $ | 19,090 | ||||||||||||||
|
|
|
|
|
|
|
|
|
|
|
|
|
| |||||||||||||||
Average Quarterly Balances of Outstanding Derivative Financial Instruments
| ||||
Futures contracts | ||||
Average notional value of contracts — long | $ | 1,464,863 | ||
| ||||
For more information about the Fund’s investment risks regarding derivative financial instruments, refer to the Notes to Financial Statements.
Fair Value Hierarchy as of Period End
Various inputs are used in determining the fair value of financial instruments. For a description of the input levels and information about the Fund’s policy regarding valuation of financial instruments, refer to the Notes to Financial Statements.
The following table summarizes the Fund’s financial instruments categorized in the fair value hierarchy. The breakdown of the Fund’s financial instruments into major categories is disclosed in the Schedule of Investments above.
| ||||||||||||||||
| Level 1 | Level 2 | Level 3 | Total | |||||||||||||
| ||||||||||||||||
Assets | ||||||||||||||||
Investments | ||||||||||||||||
Long-Term Investments | ||||||||||||||||
Common Stocks | $ | 193,261,533 | $ | 141,793,366 | $ | — | $ | 335,054,899 | ||||||||
Rights | 534 | — | — | 534 | ||||||||||||
Short-Term Securities | ||||||||||||||||
Money Market Funds | 4,129,037 | — | — | 4,129,037 | ||||||||||||
|
|
|
|
|
|
|
| |||||||||
| $ | 197,391,104 | $ | 141,793,366 | $ | — | $ | 339,184,470 | |||||||||
|
|
|
|
|
|
|
| |||||||||
Derivative Financial Instruments(a) | ||||||||||||||||
Assets | ||||||||||||||||
Equity Contracts | $ | 20,662 | $ | 19,852 | $ | — | $ | 40,514 | ||||||||
|
|
|
|
|
|
|
| |||||||||
| (a) | Derivative financial instruments are futures contracts. Futures contracts are valued at the unrealized appreciation (depreciation) on the instrument. |
See notes to financial statements.
| 52 | 2 0 2 3 I SHARES ANNUAL REPORT TO SHAREHOLDERS |
Schedule of Investments March 31, 2023 | iShares® Global Materials ETF (Percentages shown are based on Net Assets) |
| Security | Shares | Value | ||||||
Common Stocks | ||||||||
| Australia — 11.9% | ||||||||
BHP Group Ltd. | 723,783 | $ | 22,881,624 | |||||
BlueScope Steel Ltd. | 66,484 | 899,885 | ||||||
Fortescue Metals Group Ltd. | 242,002 | 3,637,668 | ||||||
James Hardie Industries PLC | 63,738 | 1,371,881 | ||||||
Mineral Resources Ltd. | 23,949 | 1,294,609 | ||||||
Newcrest Mining Ltd. | 127,973 | 2,284,368 | ||||||
Northern Star Resources Ltd. | 165,011 | 1,353,116 | ||||||
OZ Minerals Ltd. | 48,100 | 905,854 | ||||||
Pilbara Minerals Ltd. | 372,978 | 992,271 | ||||||
Rio Tinto Ltd. | 53,014 | 4,259,662 | ||||||
South32 Ltd. | 650,772 | 1,907,236 | ||||||
|
| |||||||
| 41,788,174 | ||||||||
| Belgium — 0.6% | ||||||||
Solvay SA | 10,368 | 1,185,749 | ||||||
Umicore SA | 29,506 | 1,000,880 | ||||||
|
| |||||||
| 2,186,629 | ||||||||
| Brazil — 2.5% | ||||||||
Vale SA, ADR | 553,058 | 8,727,255 | ||||||
|
| |||||||
| Canada — 7.6% | ||||||||
Agnico Eagle Mines Ltd. | 65,107 | 3,319,180 | ||||||
Barrick Gold Corp. | 251,477 | 4,668,559 | ||||||
CCL Industries Inc., Class B, NVS | 20,822 | 1,034,398 | ||||||
First Quantum Minerals Ltd. | 79,833 | 1,835,302 | ||||||
Franco-Nevada Corp. | 27,313 | 3,983,878 | ||||||
Kinross Gold Corp. | 179,803 | 846,132 | ||||||
Nutrien Ltd. | 74,322 | 5,488,775 | ||||||
Teck Resources Ltd., Class B | 64,184 | 2,343,678 | ||||||
Wheaton Precious Metals Corp. | 64,609 | 3,111,654 | ||||||
|
| |||||||
| 26,631,556 | ||||||||
| Chile — 0.5% | ||||||||
Empresas CMPC SA | 158,815 | 265,407 | ||||||
Sociedad Quimica y Minera de Chile SA, ADR(a) | 20,329 | 1,647,869 | ||||||
|
| |||||||
| 1,913,276 | ||||||||
| Denmark — 0.8% | ||||||||
Chr Hansen Holding A/S | 14,734 | 1,120,821 | ||||||
Novozymes A/S, Class B | 29,925 | 1,532,254 | ||||||
|
| |||||||
| 2,653,075 | ||||||||
| Finland — 1.0% | ||||||||
Stora Enso OYJ, Class R | 86,633 | 1,127,085 | ||||||
UPM-Kymmene OYJ | 76,364 | 2,564,911 | ||||||
|
| |||||||
| 3,691,996 | ||||||||
| France — 4.5% | ||||||||
Air Liquide SA | 74,790 | 12,518,992 | ||||||
ArcelorMittal SA | 81,636 | 2,473,267 | ||||||
Arkema SA | 9,252 | 913,513 | ||||||
|
| |||||||
| 15,905,772 | ||||||||
| Germany —3.3% | ||||||||
BASF SE | 131,228 | 6,889,293 | ||||||
Covestro AG(b) | 27,648 | 1,144,995 | ||||||
HeidelbergCement AG | 20,639 | 1,507,001 | ||||||
Symrise AG | 19,027 | 2,070,592 | ||||||
|
| |||||||
| 11,611,881 | ||||||||
| Ireland — 1.9% | ||||||||
CRH PLC | 106,343 | 5,372,478 | ||||||
Smurfit Kappa Group PLC | 36,890 | 1,338,003 | ||||||
|
| |||||||
| 6,710,481 | ||||||||
| Security | Shares | Value | ||||||
| Japan — 6.5% | ||||||||
Asahi Kasei Corp. | 198,200 | $ | 1,388,215 | |||||
JFE Holdings Inc. | 82,200 | 1,043,318 | ||||||
Mitsubishi Chemical Group Corp. | 204,200 | 1,214,474 | ||||||
Nippon Paint Holdings Co. Ltd. | 153,300 | 1,441,494 | ||||||
Nippon Steel Corp. | 135,729 | 3,200,692 | ||||||
Nitto Denko Corp. | 21,300 | 1,378,563 | ||||||
Shin-Etsu Chemical Co. Ltd . | 289,200 | 9,387,728 | ||||||
Sumitomo Chemical Co. Ltd. | 235,800 | 793,933 | ||||||
Sumitomo Metal Mining Co. Ltd. | 38,900 | 1,488,466 | ||||||
Toray Industries Inc. | 234,200 | 1,339,794 | ||||||
|
| |||||||
| 22,676,677 | ||||||||
| Mexico — 0.9% | ||||||||
Cemex SAB de CV, NVS(c) | 2,164,170 | 1,187,771 | ||||||
Grupo Mexico SAB de CV, Series B | 445,382 | 2,109,015 | ||||||
|
| |||||||
| 3,296,786 | ||||||||
| Netherlands — 1.4% | ||||||||
Akzo Nobel NV | 24,849 | 1,943,555 | ||||||
Koninklijke DSM NV | 24,991 | 2,957,542 | ||||||
|
| |||||||
| 4,901,097 | ||||||||
| Norway —0.7% | ||||||||
Norsk Hydro ASA | 195,623 | 1,460,017 | ||||||
Yara International ASA | 23,223 | 1,009,285 | ||||||
|
| |||||||
| 2,469,302 | ||||||||
| Peru — 0.3% | ||||||||
Southern Copper Corp. | 12,051 | 918,889 | ||||||
|
| |||||||
| South Korea — 1.9% | ||||||||
LG Chem Ltd. | 6,756 | 3,710,352 | ||||||
POSCO Holdings Inc. | 10,508 | 2,972,935 | ||||||
|
| |||||||
| 6,683,287 | ||||||||
| Sweden — 0.8% | ||||||||
Boliden AB | 39,155 | 1,538,173 | ||||||
Svenska Cellulosa AB SCA, Class B | 85,699 | 1,128,701 | ||||||
|
| |||||||
| 2,666,874 | ||||||||
| Switzerland — 4.7% | ||||||||
Givaudan SA, Registered | 1,136 | 3,697,439 | ||||||
Holcim AG | 80,969 | 5,221,796 | ||||||
SIG Group AG(c) | 49,831 | 1,283,805 | ||||||
Sika AG, Registered | 21,978 | 6,164,728 | ||||||
|
| |||||||
| 16,367,768 | ||||||||
| Taiwan — 1.1% | ||||||||
Formosa Plastics Corp. | 620,720 | 1,873,957 | ||||||
Nan Ya Plastics Corp. | 801,940 | 2,042,792 | ||||||
|
| |||||||
| 3,916,749 | ||||||||
| United Kingdom — 9.0% | ||||||||
Anglo American PLC | 191,108 | 6,356,537 | ||||||
Antofagasta PLC | 48,957 | 958,943 | ||||||
Croda International PLC | 20,399 | 1,639,538 | ||||||
DS Smith PLC | 197,592 | 769,289 | ||||||
Glencore PLC | 1,730,091 | 9,955,316 | ||||||
Johnson Matthey PLC | 28,596 | 701,069 | ||||||
Mondi PLC | 69,447 | 1,102,610 | ||||||
Rio Tinto PLC | 151,580 | 10,288,931 | ||||||
|
| |||||||
| 31,772,233 | ||||||||
| United States — 36.9% | ||||||||
Air Products and Chemicals Inc. | 31,698 | 9,103,983 | ||||||
Albemarle Corp. | 16,755 | 3,703,525 | ||||||
Amcor PLC | 211,802 | 2,410,307 | ||||||
SCHEDULE OF INVESTMENTS | 53 |
Schedule of Investments (continued) March 31, 2023 | iShares® Global Materials ETF (Percentages shown are based on Net Assets) |
| Security | Shares | Value | ||||||
| United States (continued) | ||||||||
Avery Dennison Corp. | 11,555 | $ | 2,067,536 | |||||
Ball Corp. | 44,840 | 2,471,132 | ||||||
Celanese Corp. | 14,278 | 1,554,731 | ||||||
CF Industries Holdings Inc. | 28,096 | 2,036,679 | ||||||
Corteva Inc. | 101,924 | 6,147,036 | ||||||
Dow Inc. | 100,710 | 5,520,922 | ||||||
DuPont de Nemours Inc. | 65,479 | 4,699,428 | ||||||
Eastman Chemical Co. | 17,011 | 1,434,708 | ||||||
Ecolab Inc. | 35,396 | 5,859,100 | ||||||
FMC Corp. | 18,009 | 2,199,439 | ||||||
Freeport-McMoRan Inc. | 204,038 | 8,347,195 | ||||||
International Flavors & Fragrances Inc. | 36,486 | 3,355,253 | ||||||
International Paper Co. | 50,828 | 1,832,858 | ||||||
Linde PLC | 70,371 | 25,012,668 | ||||||
LyondellBasell Industries NV, Class A | 36,194 | 3,398,255 | ||||||
Martin Marietta Materials Inc. | 8,848 | 3,141,571 | ||||||
Mosaic Co. (The) | 48,680 | 2,233,438 | ||||||
Newmont Corp. | 113,406 | 5,559,162 | ||||||
Nucor Corp. | 36,148 | 5,583,782 | ||||||
Packaging Corp. of America | 13,216 | 1,834,777 | ||||||
PPG Industries Inc. | 33,599 | 4,488,154 | ||||||
Sealed Air Corp. | 20,590 | 945,287 | ||||||
Sherwin-Williams Co. (The) | 33,668 | 7,567,556 | ||||||
Steel Dynamics Inc. | 23,860 | 2,697,612 | ||||||
Vulcan Materials Co. | 19,021 | 3,263,243 | ||||||
Westrock Co. | 36,321 | 1,106,701 | ||||||
|
| |||||||
| 129,576,038 | ||||||||
|
| |||||||
Total Common Stocks — 98.8% | 347,065,795 | |||||||
|
| |||||||
Preferred Stocks | ||||||||
| Brazil — 0.2% | ||||||||
Gerdau SA, Preference Shares, ADR | 155,629 | 767,249 | ||||||
|
| |||||||
| Security | Shares | Value | ||||||
| ||||||||
| South Korea — 0.1% | ||||||||
LG Chem Ltd., Preference Shares, NVS | 1,075 | $ | 257,575 | |||||
|
| |||||||
Total Preferred Stocks — 0.3% |
| 1,024,824 | ||||||
|
| |||||||
Total Long-Term Investments — 99.1% |
| 348,090,619 | ||||||
|
| |||||||
Short-Term Securities | ||||||||
| Money Market Funds — 0.6% | ||||||||
BlackRock Cash Funds: Institutional, SL Agency Shares, 5.01%(d)(e)(f) | 1,650,564 | 1,651,059 | ||||||
BlackRock Cash Funds: Treasury, SL Agency Shares, 4.73%(d)(e) | 530,000 | 530,000 | ||||||
|
| |||||||
Total Short-Term Securities — 0.6% | 2,181,059 | |||||||
|
| |||||||
Total Investments — 99.7% |
| 350,271,678 | ||||||
Other Assets Less Liabilities — 0.3% | 898,506 | |||||||
|
| |||||||
Net Assets — 100.0% | $ | 351,170,184 | ||||||
|
| |||||||
| (a) | All or a portion of this security is on loan. |
| (b) | Security exempt from registration pursuant to Rule 144A under the Securities Act of 1933, as amended. These securities may be resold in transactions exempt from registration to qualified institutional investors. |
| (c) | Non-income producing security. |
| (d) | Affiliate of the Fund. |
| (e) | Annualized 7-day yield as of period end. |
| (f) | All or a portion of this security was purchased with the cash collateral from loaned securities. |
Affiliates
Investments in issuers considered to be affiliate(s) of the Fund during the year ended March 31, 2023 for purposes of Section 2(a)(3) of the Investment Company Act of 1940, as amended, were as follows:
| ||||||||||||||||||||||||||||||||||||
| Affiliated Issuer | Value at 03/31/22 | Purchases at Cost | Proceeds from Sale | Net Realized Gain (Loss) | Change in Unrealized Appreciation (Depreciation) | Value at 03/31/23 | Shares Held at 03/31/23 | Income | Capital Gain Distributions from Underlying Funds | |||||||||||||||||||||||||||
| ||||||||||||||||||||||||||||||||||||
BlackRock Cash Funds: Institutional, SL Agency Shares | $ | — | $ | 1,649,780 | (a) | $ | — | $ | 1,739 | $ | (460 | ) | $ | 1,651,059 | 1,650,564 | $ | 3,946 | (b) | $ | — | ||||||||||||||||
BlackRock Cash Funds: Treasury, SL Agency Shares | 2,490,000 | — | (1,960,000 | )(a) | — | — | 530,000 | 530,000 | 9,115 | — | ||||||||||||||||||||||||||
|
|
|
|
|
|
|
|
|
| |||||||||||||||||||||||||||
| $ | 1,739 | $ | (460 | ) | $ | 2,181,059 | $ | 13,061 | $ | — | ||||||||||||||||||||||||||
|
|
|
|
|
|
|
|
|
| |||||||||||||||||||||||||||
| (a) | Represents net amount purchased (sold). |
| (b) | All or a portion represents securities lending income earned from the reinvestment of cash collateral from loaned securities, net of fees and collateral investment expenses, and other payments to and from borrowers of securities. |
| 54 | 2 0 2 3 I SHARES ANNUAL REPORT TO SHAREHOLDERS |
Schedule of Investments (continued) March 31, 2023 | iShares® Global Materials ETF |
Derivative Financial Instruments Outstanding as of Period End
Futures Contracts
| ||||||||||||||||
| Description | Number of Contracts | Expiration Date | Notional (000) | Value/ Unrealized Appreciation (Depreciation) | ||||||||||||
| ||||||||||||||||
Long Contracts | ||||||||||||||||
S&P/TSX 60 Index | 6 | 06/15/23 | $ | 1,074 | $ | 19,584 | ||||||||||
FTSE 100 Index | 6 | 06/16/23 | 566 | 5,990 | ||||||||||||
MSCI Emerging Markets Index | 11 | 06/16/23 | 547 | 12,886 | ||||||||||||
S&P 500 E-Mini Index | 4 | 06/16/23 | 828 | 39,277 | ||||||||||||
|
| |||||||||||||||
| $ | 77,737 | |||||||||||||||
|
| |||||||||||||||
Derivative Financial Instruments Categorized by Risk Exposure
As of period end, the fair values of derivative financial instruments located in the Statements of Assets and Liabilities were as follows:
| ||||||||||||||||||||||||||||
Commodity Contracts | Credit Contracts | Equity Contracts | Foreign Currency Exchange Contracts | Interest Rate Contracts | Other Contracts | Total | ||||||||||||||||||||||
| ||||||||||||||||||||||||||||
Assets — Derivative Financial Instruments | ||||||||||||||||||||||||||||
Futures contracts | ||||||||||||||||||||||||||||
Unrealized appreciation on futures contracts(a) | $ | — | $ | — | $ | 77,737 | $ | — | $ | — | $ | — | $ | 77,737 | ||||||||||||||
|
|
|
|
|
|
|
|
|
|
|
|
|
| |||||||||||||||
| (a) | Net cumulative unrealized appreciation (depreciation) on futures contracts are reported in the Schedule of Investments. In the Statements of Assets and Liabilities, only current day’s variation margin is reported in receivables or payables and the net cumulative unrealized appreciation (depreciation) is included in accumulated earnings (loss). |
For the period ended March 31, 2023, the effect of derivative financial instruments in the Statements of Operations was as follows:
| ||||||||||||||||||||||||||||
Commodity Contracts | Credit Contracts | Equity Contracts | Foreign Currency Exchange | Interest Rate Contracts | Other Contracts | Total | ||||||||||||||||||||||
| ||||||||||||||||||||||||||||
Net Realized Gain (Loss) from | ||||||||||||||||||||||||||||
Futures contracts | $ | — | $ | — | $ | (345,394 | ) | $ | — | $ | — | $ | — | $ | (345,394 | ) | ||||||||||||
|
|
|
|
|
|
|
|
|
|
|
|
|
| |||||||||||||||
Net Change in Unrealized Appreciation (Depreciation) on | ||||||||||||||||||||||||||||
Futures contracts | $ | — | $ | — | $ | (180,977 | ) | $ | — | $ | — | $ | — | $ | (180,977 | ) | ||||||||||||
|
|
|
|
|
|
|
|
|
|
|
|
|
| |||||||||||||||
Average Quarterly Balances of Outstanding Derivative Financial Instruments
| ||||
Futures contracts | ||||
Average notional value of contracts — long | $ | 1,809,115 | ||
| ||||
For more information about the Fund’s investment risks regarding derivative financial instruments, refer to the Notes to Financial Statements.
Fair Value Hierarchy as of Period End
Various inputs are used in determining the fair value of financial instruments. For a description of the input levels and information about the Fund’s policy regarding valuation of financial instruments, refer to the Notes to Financial Statements.
The following table summarizes the Fund’s financial instruments categorized in the fair value hierarchy. The breakdown of the Fund’s financial instruments into major categories is disclosed in the Schedule of Investments above.
| ||||||||||||||||
| Level 1 | Level 2 | Level 3 | Total | |||||||||||||
| ||||||||||||||||
Assets | ||||||||||||||||
Investments | ||||||||||||||||
Long-Term Investments | ||||||||||||||||
Common Stocks | $ | 171,063,800 | $ | 176,001,995 | $ | — | $ | 347,065,795 | ||||||||
Preferred Stocks | 767,249 | 257,575 | — | 1,024,824 | ||||||||||||
Short-Term Securities | ||||||||||||||||
Money Market Funds | 2,181,059 | — | — | 2,181,059 | ||||||||||||
|
|
|
|
|
|
|
| |||||||||
| $ | 174,012,108 | $ | 176,259,570 | $ | — | $ | 350,271,678 | |||||||||
|
|
|
|
|
|
|
| |||||||||
SCHEDULE OF INVESTMENTS | 55 |
Schedule of Investments (continued) March 31, 2023 | iShares® Global Materials ETF |
Fair Value Hierarchy as of Period End (continued)
| ||||||||||||||||
| Level 1 | Level 2 | Level 3 | Total | |||||||||||||
| ||||||||||||||||
Derivative Financial Instruments(a) | ||||||||||||||||
Assets | ||||||||||||||||
Equity Contracts | $ | 71,747 | $ | 5,990 | $ | — | $ | 77,737 | ||||||||
|
|
|
|
|
|
|
| |||||||||
| (a) | Derivative financial instruments are futures contracts. Futures contracts are valued at the unrealized appreciation (depreciation) on the instrument. |
See notes to financial statements.
| 56 | 2 0 2 3 I SHARES ANNUAL REPORT TO SHAREHOLDERS |
March 31, 2023 | iShares® Global Tech ETF (Percentages shown are based on Net Assets) |
| Security | Shares | Value | ||||||
Common Stocks | ||||||||
Australia — 0.1% | ||||||||
Xero Ltd.(a) | 40,276 | $ | 2,442,796 | |||||
|
| |||||||
Canada — 1.1% | ||||||||
CGI Inc.(a) | 61,046 | 5,883,272 | ||||||
Constellation Software Inc./Canada | 5,682 | 10,682,539 | ||||||
Open Text Corp. | 77,987 | 3,008,111 | ||||||
Shopify Inc., Class A(a) | 344,776 | 16,530,880 | ||||||
|
| |||||||
| 36,104,802 | ||||||||
| China — 0.2% | ||||||||
Xiaomi Corp., Class B(a)(b) | 4,169,800 | 6,417,113 | ||||||
|
| |||||||
Finland — 0.2% | ||||||||
Nokia OYJ | 1,520,894 | 7,465,893 | ||||||
|
| |||||||
France — 0.5% | ||||||||
Capgemini SE | 45,546 | 8,464,058 | ||||||
Dassault Systemes SE | 199,880 | 8,245,256 | ||||||
|
| |||||||
| 16,709,314 | ||||||||
| Germany — 1.7% | ||||||||
Infineon Technologies AG | 376,559 | 15,463,459 | ||||||
SAP SE | 314,370 | 39,695,645 | ||||||
|
| |||||||
| 55,159,104 | ||||||||
| Japan — 3.7% | ||||||||
Advantest Corp. | 52,400 | 4,857,811 | ||||||
Canon Inc. | 299,900 | 6,678,730 | ||||||
FUJIFILM Holdings Corp. | 115,600 | 5,868,196 | ||||||
Fujitsu Ltd. | 51,700 | 6,986,235 | ||||||
Keyence Corp. | 57,140 | 28,004,790 | ||||||
Kyocera Corp. | 100,100 | 5,221,810 | ||||||
Lasertec Corp. | 22,300 | 3,962,248 | ||||||
Murata Manufacturing Co. Ltd. | 185,100 | 11,280,962 | ||||||
NEC Corp. | 78,600 | 3,034,366 | ||||||
Nomura Research Institute Ltd. | 128,700 | 3,009,997 | ||||||
NTT Data Corp. | 186,000 | 2,445,257 | ||||||
Obic Co. Ltd. | 18,900 | 2,993,636 | ||||||
Omron Corp. | 59,400 | 3,476,497 | ||||||
Renesas Electronics Corp.(a) | 406,500 | 5,886,446 | ||||||
Ricoh Co. Ltd. | 175,700 | 1,317,949 | ||||||
Rohm Co. Ltd. | 25,200 | 2,100,331 | ||||||
TDK Corp. | 112,000 | 4,020,366 | ||||||
Tokyo Electron Ltd. | 135,000 | 16,492,414 | ||||||
|
| |||||||
| 117,638,041 | ||||||||
| Netherlands — 2.7% | ||||||||
ASM International NV | 13,375 | 5,428,922 | ||||||
ASML Holding NV | 115,912 | 78,987,996 | ||||||
|
| |||||||
| 84,416,918 | ||||||||
| Singapore — 0.3% | ||||||||
STMicroelectronics NV , New | 189,190 | 10,074,837 | ||||||
|
| |||||||
South Korea — 2.9% | ||||||||
Samsung Electronics Co. Ltd. | 1,476,158 | 72,997,426 | ||||||
Samsung SDI Co. Ltd. | 15,862 | 9,010,229 | ||||||
SK Hynix Inc. | 155,338 | 10,630,543 | ||||||
|
| |||||||
| 92,638,198 | ||||||||
| Sweden — 0.4% | ||||||||
Hexagon AB, Class B | 613,628 | 7,062,494 | ||||||
Telefonaktiebolaget LM Ericsson, Class B | 885,917 | 5,193,088 | ||||||
|
| |||||||
| 12,255,582 | ||||||||
| Security | Shares | Value | ||||||
| Switzerland — 0.1% | ||||||||
Logitech International SA, Registered | 49,914 | $ | 2,913,307 | |||||
Temenos AG, Registered | 19,440 | 1,352,753 | ||||||
|
| |||||||
| 4,266,060 | ||||||||
| Taiwan — 4.1% | ||||||||
Delta Electronics Inc. | 554,000 | 5,496,586 | ||||||
Hon Hai Precision Industry Co. Ltd. | 3,476,378 | 11,899,623 | ||||||
MediaTek Inc. | 456,000 | 11,822,309 | ||||||
Taiwan Semiconductor Manufacturing Co. Ltd. | 5,441,600 | 95,361,895 | ||||||
United Microelectronics Corp. | 3,352,000 | 5,865,770 | ||||||
|
| |||||||
| 130,446,183 | ||||||||
| United Kingdom — 0.2% | ||||||||
Halma PLC | 109,469 | 3,022,054 | ||||||
Sage Group PLC (The) | 317,409 | 3,045,992 | ||||||
|
| |||||||
| 6,068,046 | ||||||||
| United States — 81.1% | ||||||||
Accenture PLC, Class A | 181,065 | 51,750,188 | ||||||
Adobe Inc.(a) | 131,628 | 50,725,482 | ||||||
Advanced Micro Devices Inc.(a) | 463,593 | 45,436,750 | ||||||
Akamai Technologies Inc.(a) | 45,340 | 3,550,122 | ||||||
Amphenol Corp., Class A | 170,164 | 13,905,802 | ||||||
Analog Devices Inc. | 145,614 | 28,717,993 | ||||||
Ansys Inc.(a) | 24,799 | 8,253,107 | ||||||
Apple Inc. | 4,276,257 | 705,154,779 | ||||||
Applied Materials Inc. | 242,284 | 29,759,744 | ||||||
Arista Networks Inc.(a) | 71,370 | 11,980,168 | ||||||
Autodesk Inc.(a) | 62,216 | 12,950,883 | ||||||
Broadcom Inc. | 120,152 | 77,082,314 | ||||||
Cadence Design Systems Inc.(a) | 78,616 | 16,516,435 | ||||||
CDW Corp./DE | 39,039 | 7,608,311 | ||||||
Ceridian HCM Holding Inc.(a)(c) | 44,363 | 3,248,259 | ||||||
Cisco Systems Inc. | 1,181,183 | 61,746,341 | ||||||
Cognizant Technology Solutions Corp., Class A | 145,054 | 8,838,140 | ||||||
Corning Inc. | 219,498 | 7,743,889 | ||||||
DXC Technology Co.(a) | 64,936 | 1,659,764 | ||||||
Enphase Energy Inc.(a) | 39,193 | 8,241,504 | ||||||
EPAM Systems Inc.(a) | 16,584 | 4,958,616 | ||||||
F5 Inc.(a) | 17,335 | 2,525,536 | ||||||
Fair Isaac Corp.(a) | 7,253 | 5,096,611 | ||||||
First Solar Inc.(a) | 28,587 | 6,217,673 | ||||||
Fortinet Inc.(a) | 186,971 | 12,426,093 | ||||||
Gartner Inc.(a) | 22,786 | 7,422,995 | ||||||
Gen Digital, Inc. | 164,019 | 2,814,566 | ||||||
Hewlett Packard Enterprise Co. | 369,609 | 5,887,871 | ||||||
HP Inc. | 245,679 | 7,210,679 | ||||||
Intel Corp. | 1,189,492 | 38,860,704 | ||||||
International Business Machines Corp. | 259,900 | 34,070,291 | ||||||
Intuit Inc. | 80,764 | 36,007,014 | ||||||
Juniper Networks Inc. | 93,412 | 3,215,241 | ||||||
Keysight Technologies Inc.(a) | 50,780 | 8,199,954 | ||||||
KLA Corp. | 39,672 | 15,835,872 | ||||||
Lam Research Corp. | 38,713 | 20,522,536 | ||||||
Microchip Technology Inc. | 157,956 | 13,233,554 | ||||||
Micron Technology Inc. | 312,868 | 18,878,455 | ||||||
Microsoft Corp. | 2,140,281 | 617,043,012 | ||||||
Monolithic Power Systems Inc. | 12,904 | 6,458,968 | ||||||
Motorola Solutions Inc. | 48,212 | 13,794,900 | ||||||
NetApp Inc. | 62,160 | 3,968,916 | ||||||
Nvidia Corp. | 707,312 | 196,470,054 | ||||||
NXP Semiconductors NV | 74,720 | 13,933,412 | ||||||
SCHEDULE OF INVESTMENTS | 57 |
Schedule of Investments (continued) March 31, 2023 | iShares® Global Tech ETF (Percentages shown are based on Net Assets) |
| Security | Shares | Value | ||||||
United States (continued) |
| |||||||
ON Semiconductor Corp.(a) | 124,556 | $ | 10,253,450 | |||||
Oracle Corp. | 441,887 | 41,060,140 | ||||||
Paycom Software Inc.(a) | 13,903 | 4,226,651 | ||||||
PTC Inc.(a) | 30,691 | 3,935,507 | ||||||
Qorvo Inc.(a) | 28,802 | 2,925,419 | ||||||
Qualcomm Inc. | 320,590 | 40,900,872 | ||||||
Roper Technologies Inc. | 30,580 | 13,476,300 | ||||||
Salesforce Inc.(a) | 287,524 | 57,441,545 | ||||||
Seagate Technology Holdings PLC | 55,371 | 3,661,131 | ||||||
ServiceNow Inc.(a) | 58,307 | 27,096,429 | ||||||
Skyworks Solutions Inc. | 45,840 | 5,408,203 | ||||||
SolarEdge Technologies Inc.(a)(c) | 16,116 | 4,898,458 | ||||||
Synopsys Inc.(a) | 43,680 | 16,871,400 | ||||||
TE Connectivity Ltd. | 90,448 | 11,862,255 | ||||||
Teledyne Technologies Inc.(a) | 13,515 | 6,046,070 | ||||||
Teradyne Inc. | 44,911 | 4,828,382 | ||||||
Texas Instruments Inc. | 260,556 | 48,466,022 | ||||||
Trimble Inc.(a) | 71,113 | 3,727,744 | ||||||
Tyler Technologies Inc.(a) | 12,007 | 4,258,163 | ||||||
VeriSign Inc.(a) | 26,415 | 5,582,282 | ||||||
Western Digital Corp.(a) | 92,075 | 3,468,465 | ||||||
Zebra Technologies Corp., Class A(a) | 14,887 | 4,734,066 | ||||||
|
| |||||||
| 2,575,052,452 | ||||||||
|
| |||||||
Total Common Stocks — 99.3% |
| 3,157,155,339 | ||||||
|
| |||||||
Preferred Stocks | ||||||||
South Korea — 0.3% | ||||||||
Samsung Electronics Co. Ltd., Preference Shares, NVS | 237,277 | 9,874,187 | ||||||
|
| |||||||
Total Preferred Stocks — 0.3% |
| 9,874,187 | ||||||
|
| |||||||
Total Long-Term Investments — 99.6% | 3,167,029,526 | |||||||
|
| |||||||
| Security | Shares | Value | ||||||
| ||||||||
Short-Term Securities |
| |||||||
Money Market Funds — 0.4% | ||||||||
BlackRock Cash Funds: Institutional, SL Agency Shares, 5.01%(d)(e)(f) | 6,261,991 | $ | 6,263,870 | |||||
BlackRock Cash Funds: Treasury, SL Agency Shares, 4.73%(d)(e) | 5,680,000 | 5,680,000 | ||||||
|
| |||||||
Total Short-Term Securities — 0.4% |
| 11,943,870 | ||||||
|
| |||||||
Total Investments — 100.0% |
| 3,178,973,396 | ||||||
Liabilities in Excess of Other Assets — (0.0)% |
| (1,357,225 | ) | |||||
|
| |||||||
Net Assets — 100.0% |
| $ | 3,177,616,171 | |||||
|
| |||||||
| (a) | Non-income producing security. |
| (b) | Security exempt from registration pursuant to Rule 144A under the Securities Act of 1933, as amended. These securities may be resold in transactions exempt from registration to qualified institutional investors. |
| (c) | All or a portion of this security is on loan. |
| (d) | Affiliate of the Fund. |
| (e) | Annualized 7-day yield as of period end. |
| (f) | All or a portion of this security was purchased with the cash collateral from loaned securities. |
Affiliates
Investments in issuers considered to be affiliate(s) of the Fund during the year ended March 31, 2023 for purposes of Section 2(a)(3) of the Investment Company Act of 1940, as amended, were as follows:
| ||||||||||||||||||||||||||||||||||||
| Affiliated Issuer | Value at 03/31/22 | Purchases at Cost | Proceeds from Sale | Net Realized Gain (Loss) | Change in Unrealized Appreciation (Depreciation) | Value at 03/31/23 | Shares Held at | Income | Capital Gain Distributions from Underlying Funds | |||||||||||||||||||||||||||
| ||||||||||||||||||||||||||||||||||||
BlackRock Cash Funds: Institutional, SL Agency Shares | $ | 1,105,132 | $ | 5,186,781 | (a) | $ | — | $ | (25,672 | ) | $ | (2,371 | ) | $ | 6,263,870 | 6,261,991 | $ | 58,039 | (b) | $ | — | |||||||||||||||
BlackRock Cash Funds: Treasury, SL Agency Shares | 3,810,000 | 1,870,000 | (a) | — | — | — | 5,680,000 | 5,680,000 | 107,632 | 3 | ||||||||||||||||||||||||||
|
|
|
|
|
|
|
|
|
| |||||||||||||||||||||||||||
| $ | (25,672 | ) | $ | (2,371 | ) | $ | 11,943,870 | $ | 165,671 | $ | 3 | |||||||||||||||||||||||||
|
|
|
|
|
|
|
|
|
| |||||||||||||||||||||||||||
| (a) | Represents net amount purchased (sold). |
| (b) | All or a portion represents securities lending income earned from the reinvestment of cash collateral from loaned securities, net of fees and collateral investment expenses, and other payments to and from borrowers of securities. |
| 58 | 2 0 2 3 I SHARES ANNUAL REPORT TO SHAREHOLDERS |
Schedule of Investments (continued) March 31, 2023 | iShares® Global Tech ETF |
Derivative Financial Instruments Outstanding as of Period End
Futures Contracts
| ||||||||||||||||
| Description | Number of Contracts | Expiration Date | Notional Amount (000) | Value/ Unrealized Appreciation (Depreciation) | ||||||||||||
| ||||||||||||||||
Long Contracts | ||||||||||||||||
E-Mini Technology Select Sector Index | 65 | 06/16/23 | $ | 9,983 | $ | 490,863 | ||||||||||
|
| |||||||||||||||
Derivative Financial Instruments Categorized by Risk Exposure
As of period end, the fair values of derivative financial instruments located in the Statements of Assets and Liabilities were as follows:
| ||||||||||||||||||||||||||||
Commodity Contracts | Credit Contracts | Equity Contracts | Foreign Currency Exchange Contracts | Interest Rate Contracts | Other Contracts | Total | ||||||||||||||||||||||
| ||||||||||||||||||||||||||||
Assets — Derivative Financial Instruments | ||||||||||||||||||||||||||||
Futures contracts | ||||||||||||||||||||||||||||
Unrealized appreciation on futures contracts(a) | $ | — | $ | — | $ | 490,863 | $ | — | $ | — | $ | — | $ | 490,863 | ||||||||||||||
|
|
|
|
|
|
|
|
|
|
|
|
|
| |||||||||||||||
| (a) | Net cumulative unrealized appreciation (depreciation) on futures contracts are reported in the Schedule of Investments. In the Statements of Assets and Liabilities, only current day’s variation margin is reported in receivables or payables and the net cumulative unrealized appreciation (depreciation) is included in accumulated earnings (loss). |
For the period ended March 31, 2023, the effect of derivative financial instruments in the Statements of Operations was as follows:
| ||||||||||||||||||||||||||||
| Commodity Contracts | Credit Contracts | Equity Contracts | Foreign Currency Exchange Contracts | Interest Rate Contracts | Other Contracts | Total | ||||||||||||||||||||||
| ||||||||||||||||||||||||||||
Net Realized Gain (Loss)from | ||||||||||||||||||||||||||||
Futures contracts | $ | — | $ | — | $ | (250,992 | ) | $ | — | $ | — | $ | — | $ | (250,992 | ) | ||||||||||||
|
|
|
|
|
|
|
|
|
|
|
|
|
| |||||||||||||||
Net Change in Unrealized Appreciation (Depreciation) on | ||||||||||||||||||||||||||||
Futures contracts | $ | — | $ | — | $ | (156,780 | ) | $ | — | $ | — | $ | — | $ | (156,780 | ) | ||||||||||||
|
|
|
|
|
|
|
|
|
|
|
|
|
| |||||||||||||||
Average Quarterly Balances of Outstanding Derivative Financial Instruments
Futures contracts | ||||
Average notional value of contracts — long | $ | 8,864,778 | ||
For more information about the Fund’s investment risks regarding derivative financial instruments, refer to the Notes to Financial Statements.
Fair Value Hierarchy as of Period End
Various inputs are used in determining the fair value of financial instruments. For a description of the input levels and information about the Fund’s policy regarding valuation of financial instruments, refer to the Notes to Financial Statements.
The following table summarizes the Fund’s financial instruments categorized in the fair value hierarchy. The breakdown of the Fund’s financial instruments into major categories is disclosed in the Schedule of Investments above.
| ||||||||||||||||
| Level 1 | Level 2 | Level 3 | Total | |||||||||||||
| ||||||||||||||||
Assets | ||||||||||||||||
Investments | ||||||||||||||||
Long-Term Investments | ||||||||||||||||
Common Stocks | $ | 2,611,157,254 | $ | 545,998,085 | $ | — | $ | 3,157,155,339 | ||||||||
Preferred Stocks | — | 9,874,187 | — | 9,874,187 | ||||||||||||
Short-Term Securities | ||||||||||||||||
Money Market Funds | 11,943,870 | — | — | 11,943,870 | ||||||||||||
|
|
|
|
|
|
|
| |||||||||
| $ | 2,623,101,124 | $ | 555,872,272 | $ | — | $ | 3,178,973,396 | |||||||||
|
|
|
|
|
|
|
| |||||||||
SCHEDULE OF INVESTMENTS | 59 |
Schedule of Investments (continued) March 31, 2023 | iShares® Global Tech ETF |
Fair Value Hierarchy as of Period End (continued)
| ||||||||||||||||
| Level 1 | Level 2 | Level 3 | Total | |||||||||||||
| ||||||||||||||||
Derivative Financial Instruments(a) | ||||||||||||||||
Assets | ||||||||||||||||
Equity Contracts | $ | 490,863 | $ | — | $ | — | $ | 490,863 | ||||||||
|
|
|
|
|
|
|
| |||||||||
| (a) | Derivative financial instruments are futures contracts. Futures contracts are valued at the unrealized appreciation (depreciation) on the instrument. |
See notes to financial statements.
| 60 | 2 0 2 3 I SHARES ANNUAL REPORT TO SHAREHOLDERS |
Schedule of Investments March 31, 2023 | iShares® Global Utilities ETF (Percentages shown are based on Net Assets) |
| Security | Shares | Value | ||||||
Common Stocks |
| |||||||
| Australia — 1.1% | ||||||||
APA Group | 104,918 | $ | 712,730 | |||||
Origin Energy Ltd. | 153,361 | 854,081 | ||||||
|
| |||||||
| 1,566,811 | ||||||||
| Austria — 0.2% | ||||||||
Verbund AG | 2,904 | 252,598 | ||||||
|
| |||||||
| Brazil — 0.5% | ||||||||
Centrais Eletricas Brasileiras SA | 113,925 | 748,044 | ||||||
|
| |||||||
| Canada — 4.0% | ||||||||
Algonquin Power & Utilities Corp. | 61,115 | 512,796 | ||||||
Brookfield Infrastructure Partners LP(a) | 40,971 | 1,384,495 | ||||||
Emera Inc. | 24,075 | 989,008 | ||||||
Fortis Inc. | 42,826 | 1,820,462 | ||||||
Hydro One Ltd.(b) | 28,390 | 808,322 | ||||||
|
| |||||||
| 5,515,083 | ||||||||
| Chile — 0.2% | ||||||||
Enel Americas SA | 1,766,896 | 232,729 | ||||||
|
| |||||||
| Colombia — 0.1% | ||||||||
Interconexion Electrica SA ESP | 39,555 | 128,679 | ||||||
|
| |||||||
| Denmark — 1.1% | ||||||||
Orsted AS(b) | 16,908 | 1,441,710 | ||||||
|
| |||||||
| Finland — 0.4% | ||||||||
Fortum OYJ | 39,142 | 599,598 | ||||||
|
| |||||||
| France — 3.3% | ||||||||
Engie SA | 165,138 | 2,613,257 | ||||||
Veolia Environnement SA | 59,985 | 1,850,968 | ||||||
|
| |||||||
| 4,464,225 | ||||||||
| Germany — 3.7% | ||||||||
E.ON SE | 200,340 | 2,499,185 | ||||||
RWE AG | 60,333 | 2,596,029 | ||||||
|
| |||||||
| 5,095,214 | ||||||||
| Italy — 4.6% | ||||||||
Enel SpA | 689,363 | 4,204,388 | ||||||
Snam SpA | 183,423 | 972,515 | ||||||
Terna - Rete Elettrica Nazionale | 125,204 | 1,027,598 | ||||||
|
| |||||||
| 6,204,501 | ||||||||
| Japan — 2.0% | ||||||||
Chubu Electric Power Co. Inc. | 67,500 | 712,085 | ||||||
Kansai Electric Power Co. Inc. (The) | 73,600 | 716,785 | ||||||
Osaka Gas Co. Ltd. | 37,100 | 609,471 | ||||||
Tokyo Gas Co. Ltd. | 36,000 | 676,556 | ||||||
|
| |||||||
| 2,714,897 | ||||||||
| Portugal — 1.0% | ||||||||
EDP - Energias de Portugal SA | 261,255 | 1,423,556 | ||||||
|
| |||||||
| Spain — 6.4% | ||||||||
Enagas SA | 22,773 | 437,599 | ||||||
Endesa SA | 28,224 | 613,020 | ||||||
Iberdrola SA | 516,821 | 6,438,451 | ||||||
Naturgy Energy Group SA | 16,373 | 492,885 | ||||||
Red Electrica Corp. SA | 39,338 | 692,203 | ||||||
|
| |||||||
| 8,674,158 | ||||||||
| United Kingdom — 6.7% | ||||||||
Centrica PLC | 537,601 | 704,060 | ||||||
| Security | Shares | Value | ||||||
| United Kingdom (continued) | ||||||||
National Grid PLC | 345,836 | $ | 4,678,123 | |||||
Severn Trent PLC | 22,521 | 800,012 | ||||||
SSE PLC | 93,578 | 2,088,084 | ||||||
United Utilities Group PLC | 61,019 | 798,583 | ||||||
|
| |||||||
| 9,068,862 | ||||||||
| United States — 64.3% | ||||||||
AES Corp. (The) | 59,465 | 1,431,917 | ||||||
Alliant Energy Corp. | 22,348 | 1,193,383 | ||||||
Ameren Corp. | 23,078 | 1,993,709 | ||||||
American Electric Power Co. Inc. | 45,847 | 4,171,619 | ||||||
American Water Works Co. Inc. | 17,217 | 2,522,118 | ||||||
Atmos Energy Corp. | 12,791 | 1,437,197 | ||||||
CenterPoint Energy Inc. | 56,045 | 1,651,086 | ||||||
CMS Energy Corp. | 25,966 | 1,593,793 | ||||||
Consolidated Edison Inc. | 31,661 | 3,029,008 | ||||||
Constellation Energy Corp. | 29,182 | 2,290,787 | ||||||
Dominion Energy Inc. | 74,344 | 4,156,573 | ||||||
DTE Energy Co. | 17,298 | 1,894,823 | ||||||
Duke Energy Corp. | 68,650 | 6,622,666 | ||||||
Edison International | 34,075 | 2,405,354 | ||||||
Entergy Corp. | 18,167 | 1,957,313 | ||||||
Evergy Inc. | 20,523 | 1,254,366 | ||||||
Eversource Energy | 31,078 | 2,432,164 | ||||||
Exelon Corp. | 88,660 | 3,713,967 | ||||||
FirstEnergy Corp. | 48,488 | 1,942,429 | ||||||
NextEra Energy Inc. | 174,814 | 13,474,663 | ||||||
NiSource Inc. | 36,145 | 1,010,614 | ||||||
NRG Energy Inc. | 20,610 | 706,717 | ||||||
PG&E Corp.(a) | 143,661 | 2,322,998 | ||||||
Pinnacle West Capital Corp. | 10,123 | 802,147 | ||||||
PPL Corp. | 65,747 | 1,827,109 | ||||||
Public Service Enterprise Group Inc. | 44,516 | 2,780,024 | ||||||
Sempra Energy | 28,045 | 4,239,282 | ||||||
Southern Co. (The) | 97,062 | 6,753,574 | ||||||
WEC Energy Group Inc. | 28,143 | 2,667,675 | ||||||
Xcel Energy Inc. | 48,825 | 3,292,758 | ||||||
|
| |||||||
| 87,571,833 | ||||||||
|
| |||||||
Total Long-Term Investments — 99.6% |
| 135,702,498 | ||||||
|
| |||||||
Short-Term Securities | ||||||||
Money Market Funds — 0.1% | ||||||||
BlackRock Cash Funds: Treasury, SL Agency Shares, 4.73%(c)(d) | 110,000 | 110,000 | ||||||
|
| |||||||
Total Short-Term Securities — 0.1% |
| 110,000 | ||||||
|
| |||||||
Total Investments — 99.7% |
| 135,812,498 | ||||||
Other Assets Less Liabilities — 0.3% |
| 343,886 | ||||||
|
| |||||||
Net Assets — 100.0% |
| $ | 136,156,384 | |||||
|
| |||||||
| (a) | Non-income producing security. |
| (b) | Security exempt from registration pursuant to Rule 144A under the Securities Act of 1933, as amended. These securities may be resold in transactions exempt from registration to qualified institutional investors. |
| (c) | Affiliate of the Fund. |
| (d) | Annualized 7-day yield as of period end. |
SCHEDULE OF INVESTMENTS | 61 |
Schedule of Investments (continued) March 31, 2023 | iShares® Global Utilities ETF |
Affiliates
Investments in issuers considered to be affiliate(s) of the Fund during the year ended March 31, 2023 for purposes of Section 2(a)(3) of the Investment Company Act of 1940, as amended, were as follows:
| ||||||||||||||||||||||||||||||||||||
| Affiliated Issuer | Value at 03/31/22 | Purchases at Cost | Proceeds from Sale | Net Realized Gain (Loss) | Change in Unrealized Appreciation (Depreciation) | Value at 03/31/23 | Shares Held at 03/31/23 | Income | Capital Gain Distributions from Underlying Funds | |||||||||||||||||||||||||||
| ||||||||||||||||||||||||||||||||||||
BlackRock Cash Funds: Institutional, SL Agency Shares(a) | $ | 20,246 | $ | — | $(20,161 | )(b) | $ | (82 | ) | $ | (3 | ) | $ | — | — | $ | 1,549 | (c) | $ | — | ||||||||||||||||
BlackRock Cash Funds: Treasury, SL Agency Shares | 190,000 | — | (80,000 | )(b) | — | — | 110,000 | 110,000 | 6,556 | — | ||||||||||||||||||||||||||
|
|
|
|
|
|
|
|
|
| |||||||||||||||||||||||||||
| $ | (82 | ) | $ | (3 | ) | $ | 110,000 | $ | 8,105 | $ | — | |||||||||||||||||||||||||
|
|
|
|
|
|
|
|
|
| |||||||||||||||||||||||||||
| (a) | As of period end, the entity is no longer held. |
| (b) | Represents net amount purchased (sold). |
| (c) | All or a portion represents securities lending income earned from the reinvestment of cash collateral from loaned securities, net of fees and collateral investment expenses, and other payments to and from borrowers of securities. |
Derivative Financial Instruments Outstanding as of Period End
Futures Contracts
| ||||||||||||||||
| Description | Number of Contracts | Expiration Date | Notional Amount (000) | Value/ Unrealized Appreciation (Depreciation) | ||||||||||||
| ||||||||||||||||
Long Contracts | ||||||||||||||||
E-Mini Utilities Select Sector Index | 5 | 06/16/23 | $ | 344 | $ | 16,596 | ||||||||||
|
| |||||||||||||||
Derivative Financial Instruments Categorized by Risk Exposure
As of period end, the fair values of derivative financial instruments located in the Statements of Assets and Liabilities were as follows:
| ||||||||||||||||||||||||||||
Commodity Contracts | Credit Contracts | Equity Contracts | Foreign Currency Exchange Contracts | Interest Rate Contracts | Other Contracts | Total | ||||||||||||||||||||||
| ||||||||||||||||||||||||||||
Assets — Derivative Financial Instruments | ||||||||||||||||||||||||||||
Futures contracts | ||||||||||||||||||||||||||||
Unrealized appreciation on futures contracts(a) | $ | — | $ | — | $ | 16,596 | $ | — | $ | — | $ | — | $ | 16,596 | ||||||||||||||
|
|
|
|
|
|
|
|
|
|
|
|
|
| |||||||||||||||
| (a) | Net cumulative unrealized appreciation (depreciation) on futures contracts are reported in the Schedule of Investments. In the Statements of Assets and Liabilities, only current day’s variation margin is reported in receivables or payables and the net cumulative unrealized appreciation (depreciation) is included in accumulated earnings (loss). |
For the period ended March 31, 2023, the effect of derivative financial instruments in the Statements of Operations was as follows:
| ||||||||||||||||||||||||||||
Commodity Contracts | Credit Contracts | Equity Contracts | Foreign Currency Exchange Contracts | Interest Rate Contracts | Other Contracts | Total | ||||||||||||||||||||||
| ||||||||||||||||||||||||||||
Net Realized Gain (Loss)from | ||||||||||||||||||||||||||||
Futures contracts | $ | — | $ | — | $ | (45,062 | ) | $ | — | $ | — | $ | — | $ | (45,062 | ) | ||||||||||||
|
|
|
|
|
|
|
|
|
|
|
|
|
| |||||||||||||||
Net Change in Unrealized Appreciation (Depreciation) on | ||||||||||||||||||||||||||||
Futures contracts | $ | — | $ | — | $ | (6,500 | ) | $ | — | $ | — | $ | — | $ | (6,500 | ) | ||||||||||||
|
|
|
|
|
|
|
|
|
|
|
|
|
| |||||||||||||||
Average Quarterly Balances of Outstanding Derivative Financial Instruments
Futures contracts | ||||
Average notional value of contracts — long | $ | 480,984 | ||
For more information about the Fund’s investment risks regarding derivative financial instruments, refer to the Notes to Financial Statements.
| 62 | 2 0 2 3 I SHARES ANNUAL REPORT TO SHAREHOLDERS |
Schedule of Investments (continued) March 31, 2023 | iShares® Global Utilities ETF |
Fair Value Hierarchy as of Period End
Various inputs are used in determining the fair value of financial instruments. For a description of the input levels and information about the Fund’s policy regarding valuation of financial instruments, refer to the Notes to Financial Statements.
The following table summarizes the Fund’s financial instruments categorized in the fair value hierarchy. The breakdown of the Fund’s financial instruments into major categories is disclosed in the Schedule of Investments above.
| ||||||||||||||||
| Level 1 | Level 2 | Level 3 | Total | |||||||||||||
| ||||||||||||||||
Assets | ||||||||||||||||
Investments | ||||||||||||||||
Long-Term Investments | ||||||||||||||||
Common Stocks | $ | 94,196,368 | $ | 41,506,130 | $ | — | $ | 135,702,498 | ||||||||
Short-Term Securities | ||||||||||||||||
Money Market Funds | 110,000 | — | — | 110,000 | ||||||||||||
|
|
|
|
|
|
|
| |||||||||
| $ | 94,306,368 | $ | 41,506,130 | $ | — | $ | 135,812,498 | |||||||||
|
|
|
|
|
|
|
| |||||||||
Derivative Financial Instruments(a) | ||||||||||||||||
Assets | ||||||||||||||||
Equity Contracts | $ | 16,596 | $ | — | $ | — | $ | 16,596 | ||||||||
|
|
|
|
|
|
|
| |||||||||
| (a) | Derivative financial instruments are futures contracts. Futures contracts are valued at the unrealized appreciation (depreciation) on the instrument. |
See notes to financial statements.
SCHEDULE OF INVESTMENTS | 63 |
Statements of Assets and Liabilities
March 31, 2023
iShares Global Comm Services ETF | iShares Global Consumer Discretionary ETF | iShares Global Consumer Staples ETF | iShares Global Energy ETF | |||||||||||||||||
| ||||||||||||||||||||
ASSETS | ||||||||||||||||||||
Investments, at value — unaffiliated(a)(b) | $ | 255,794,474 | $ | 303,893,204 | $ | 1,527,238,444 | $ | 1,788,795,867 | ||||||||||||
Investments, at value — affiliated(c) | 1,564,044 | 1,715,589 | 2,050,000 | 3,710,000 | ||||||||||||||||
Cash | 7,751 | 4,319 | 9,492 | 53,389 | ||||||||||||||||
Cash pledged for futures contracts | 37,000 | 34,000 | 335,000 | 777,000 | ||||||||||||||||
Foreign currency collateral pledged for futures contracts(d) | 11,644 | 22,202 | 108,530 | 81,417 | ||||||||||||||||
Foreign currency, at value(e) | 252,919 | 233,428 | 2,342,700 | 2,325,815 | ||||||||||||||||
Receivables: | ||||||||||||||||||||
Securities lending income — affiliated | 1,431 | 458 | 287 | — | ||||||||||||||||
Capital shares sold | — | — | 135,483 | 2,996,048 | ||||||||||||||||
Dividends — unaffiliated | 407,700 | 457,071 | 4,226,247 | 5,315,317 | ||||||||||||||||
Dividends — affiliated | 1,399 | 1,077 | 6,778 | 12,155 | ||||||||||||||||
Tax reclaims | 23,224 | 94,659 | 681,651 | 585,163 | ||||||||||||||||
Variation margin on futures contracts | 11,656 | 15,317 | 66,887 | 57,545 | ||||||||||||||||
|
|
|
|
|
|
|
| |||||||||||||
Total assets | 258,113,242 | 306,471,324 | 1,537,201,499 | 1,804,709,716 | ||||||||||||||||
|
|
|
|
|
|
|
| |||||||||||||
LIABILITIES | �� | |||||||||||||||||||
Collateral on securities loaned, at value | 1,022,813 | 1,455,704 | — | — | ||||||||||||||||
Payables: | ||||||||||||||||||||
Investments purchased | — | — | 7,384 | 3,394,312 | ||||||||||||||||
Investment advisory fees | 87,814 | 97,249 | 511,762 | 647,119 | ||||||||||||||||
IRS compliance fee for foreign withholding tax claims | 441,672 | — | — | 1,676,406 | ||||||||||||||||
Professional fees | 20,778 | 1,721 | 3,247 | 215,740 | ||||||||||||||||
|
|
|
|
|
|
|
| |||||||||||||
Total liabilities | 1,573,077 | 1,554,674 | 522,393 | 5,933,577 | ||||||||||||||||
|
|
|
|
|
|
|
| |||||||||||||
NET ASSETS | $ | 256,540,165 | $ | 304,916,650 | $ | 1,536,679,106 | $ | 1,798,776,139 | ||||||||||||
|
|
|
|
|
|
|
| |||||||||||||
NET ASSETS CONSIST OF | ||||||||||||||||||||
Paid-in capital | $ | 406,425,930 | $ | 385,197,521 | $ | 1,520,738,907 | $ | 1,922,173,090 | ||||||||||||
Accumulated earnings (loss) | (149,885,765 | ) | (80,280,871 | ) | 15,940,199 | (123,396,951 | ) | |||||||||||||
|
|
|
|
|
|
|
| |||||||||||||
NET ASSETS | $ | 256,540,165 | $ | 304,916,650 | $ | 1,536,679,106 | $ | 1,798,776,139 | ||||||||||||
|
|
|
|
|
|
|
| |||||||||||||
NET ASSET VALUE | ||||||||||||||||||||
Shares outstanding | 4,000,000 | 2,100,000 | 24,850,000 | 47,700,000 | ||||||||||||||||
|
|
|
|
|
|
|
| |||||||||||||
Net asset value | $ | 64.14 | $ | 145.20 | $ | 61.84 | $ | 37.71 | ||||||||||||
|
|
|
|
|
|
|
| |||||||||||||
Shares authorized | Unlimited | Unlimited | Unlimited | Unlimited | ||||||||||||||||
|
|
|
|
|
|
|
| |||||||||||||
Par value | None | None | None | None | ||||||||||||||||
|
|
|
|
|
|
|
| |||||||||||||
(a) Investments, at cost — unaffiliated | $ | 285,260,100 | $ | 343,231,888 | $ | 1,469,367,971 | $ | 1,686,466,344 | ||||||||||||
(b) Securities loaned, at value | $ | 1,012,464 | $ | 1,464,396 | $ | — | $ | — | ||||||||||||
(c) Investments, at cost — affiliated | $ | 1,564,234 | $ | 1,715,409 | $ | 2,050,000 | $ | 3,710,000 | ||||||||||||
(d) Foreign currency collateral pledged, at cost | $ | 11,735 | $ | 21,864 | $ | 108,576 | $ | 81,015 | ||||||||||||
(e) Foreign currency, at cost | $ | 253,500 | $ | 233,044 | $ | 2,341,508 | $ | 2,329,511 | ||||||||||||
See notes to financial statements.
| 64 | 2 0 2 3 I SHARES ANNUAL REPORT TO SHAREHOLDERS |
Statements of Assets and Liabilities (continued)
March 31, 2023
iShares Global Financials ETF | iShares Global Healthcare ETF | iShares Global Industrials ETF | iShares Global Materials ETF | |||||||||||||
| ||||||||||||||||
ASSETS | ||||||||||||||||
Investments, at value — unaffiliated(a)(b) | $ | 416,435,241 | $ | 4,066,362,201 | $ | 335,055,433 | $ | 348,090,619 | ||||||||
Investments, at value — affiliated(c) | 6,563,352 | 34,886,449 | 4,129,037 | 2,181,059 | ||||||||||||
Cash | 28,647 | — | 18,623 | 84,625 | ||||||||||||
Cash pledged for futures contracts | 229,000 | 752,000 | 67,000 | 78,000 | ||||||||||||
Foreign currency collateral pledged for futures contracts(d) | 92,467 | — | 48,231 | 109,276 | ||||||||||||
Foreign currency, at value(e) | 985,115 | 2,876,163 | 642,382 | 556,769 | ||||||||||||
Receivables: | ||||||||||||||||
Investments sold | 375,695 | 82,033 | 109 | — | ||||||||||||
Securities lending income — affiliated | 1,414 | 6,850 | 309 | 349 | ||||||||||||
Capital shares sold | — | — | — | 64,059 | ||||||||||||
Dividends — unaffiliated | 1,413,988 | 4,633,970 | 668,180 | 2,111,602 | ||||||||||||
Dividends — affiliated | 2,118 | 22,979 | 1,625 | 1,047 | ||||||||||||
Tax reclaims | 911,069 | 4,323,039 | 243,697 | 317,538 | ||||||||||||
Variation margin on futures contracts | 37,453 | 173,637 | 22,211 | 24,475 | ||||||||||||
Other assets | 213,591 | — | — | — | ||||||||||||
|
|
|
|
|
|
|
| |||||||||
Total assets | 427,289,150 | 4,114,119,321 | 340,896,837 | 353,619,418 | ||||||||||||
|
|
|
|
|
|
|
| |||||||||
LIABILITIES | ||||||||||||||||
Bank overdraft | — | 50 | — | — | ||||||||||||
Collateral on securities loaned, at value | 778,688 | 28,980,663 | 3,815,515 | 1,651,530 | ||||||||||||
Payables: | ||||||||||||||||
Investments purchased | — | — | — | 678,111 | ||||||||||||
Capital shares redeemed | 910,775 | 495,395 | — | — | ||||||||||||
Investment advisory fees | 172,606 | 1,387,336 | 117,437 | 117,941 | ||||||||||||
IRS compliance fee for foreign withholding tax claims | 18,699 | — | — | — | ||||||||||||
Professional fees | 33,653 | — | 5,705 | 1,652 | ||||||||||||
|
|
|
|
|
|
|
| |||||||||
Total liabilities | 1,914,421 | 30,863,444 | 3,938,657 | 2,449,234 | ||||||||||||
|
|
|
|
|
|
|
| |||||||||
NET ASSETS | $ | 425,374,729 | $ | 4,083,255,877 | $ | 336,958,180 | $ | 351,170,184 | ||||||||
|
|
|
|
|
|
|
| |||||||||
NET ASSETS CONSIST OF | ||||||||||||||||
Paid-in capital | $ | 633,068,223 | $ | 3,691,597,033 | $ | 384,113,912 | $ | 495,419,807 | ||||||||
Accumulated earnings (loss) | (207,693,494 | ) | 391,658,844 | (47,155,732 | ) | (144,249,623 | ) | |||||||||
|
|
|
|
|
|
|
| |||||||||
NET ASSETS | $ | 425,374,729 | $ | 4,083,255,877 | $ | 336,958,180 | $ | 351,170,184 | ||||||||
|
|
|
|
|
|
|
| |||||||||
NET ASSET VALUE | ||||||||||||||||
Shares outstanding | 6,150,000 | 48,950,000 | 2,950,000 | 4,200,000 | ||||||||||||
|
|
|
|
|
|
|
| |||||||||
Net asset value | $ | 69.17 | $ | 83.42 | $ | 114.22 | $ | 83.61 | ||||||||
|
|
|
|
|
|
|
| |||||||||
Shares authorized | Unlimited | Unlimited | Unlimited | Unlimited | ||||||||||||
|
|
|
|
|
|
|
| |||||||||
Par value | None | None | None | None | ||||||||||||
|
|
|
|
|
|
|
| |||||||||
(a) Investments, at cost — unaffiliated | $ | 481,590,842 | $ | 3,585,613,905 | $ | 350,943,349 | $ | 392,509,224 | ||||||||
(b) Securities loaned, at value | $ | 763,121 | $ | 28,551,194 | $ | 3,805,426 | $ | 1,611,959 | ||||||||
(c) Investments, at cost — affiliated | $ | 8,217,458 | $ | 34,881,094 | $ | 4,129,689 | $ | 2,181,519 | ||||||||
(d) Foreign currency collateral pledged, at cost | $ | 91,998 | $ | — | $ | 48,316 | $ | 110,797 | ||||||||
(e) Foreign currency, at cost | $ | 982,739 | $ | 2,880,123 | $ | 638,864 | $ | 553,639 | ||||||||
See notes to financial statements.
FINANCIAL STATEMENTS | 65 |
Statements of Assets and Liabilities (continued)
March 31, 2023
iShares Global Tech ETF | iShares Global Utilities ETF | |||||||
| ||||||||
ASSETS | ||||||||
Investments, at value — unaffiliated(a)(b) | $ | 3,167,029,526 | $ | 135,702,498 | ||||
Investments, at value — affiliated(c) | 11,943,870 | 110,000 | ||||||
Cash | 3,932 | 7,373 | ||||||
Cash pledged for futures contracts | 624,000 | 23,000 | ||||||
Foreign currency, at value(d) | 2,594,253 | 206,627 | ||||||
Receivables: | ||||||||
Investments sold | 22,467 | — | ||||||
Securities lending income — affiliated | 2,107 | — | ||||||
Dividends — unaffiliated | 2,511,230 | 170,532 | ||||||
Dividends — affiliated | 19,002 | 693 | ||||||
Tax reclaims | 33,548 | 44,755 | ||||||
Variation margin on futures contracts | 142,964 | 3,944 | ||||||
Other assets | 10,270 | — | ||||||
|
|
|
| |||||
Total assets | 3,184,937,169 | 136,269,422 | ||||||
|
|
|
| |||||
LIABILITIES | ||||||||
Collateral on securities loaned, at value | 6,268,915 | — | ||||||
Payables: | ||||||||
Investment advisory fees | 1,047,784 | 46,896 | ||||||
IRS compliance fee for foreign withholding tax claims | — | 49,287 | ||||||
Professional fees | 4,299 | 16,855 | ||||||
|
|
|
| |||||
Total liabilities | 7,320,998 | 113,038 | ||||||
|
|
|
| |||||
NET ASSETS | $ | 3,177,616,171 | $ | 136,156,384 | ||||
|
|
|
| |||||
NET ASSETS CONSIST OF | ||||||||
Paid-in capital | $ | 2,666,027,959 | $ | 200,986,144 | ||||
Accumulated earnings (loss) | 511,588,212 | (64,829,760 | ) | |||||
|
|
|
| |||||
NET ASSETS | $ | 3,177,616,171 | $ | 136,156,384 | ||||
|
|
|
| |||||
NET ASSET VALUE | ||||||||
Shares outstanding | 58,450,000 | 2,250,000 | ||||||
|
|
|
| |||||
Net asset value | $ | 54.36 | $ | 60.51 | ||||
|
|
|
| |||||
Shares authorized | Unlimited | Unlimited | ||||||
|
|
|
| |||||
Par value | None | None | ||||||
|
|
|
| |||||
(a) Investments, at cost — unaffiliated | $ | 2,537,591,159 | $ | 153,128,276 | ||||
(b) Securities loaned, at value | $ | 6,326,154 | $ | — | ||||
(c) Investments, at cost — affiliated | $ | 11,945,627 | $ | 110,000 | ||||
(d) Foreign currency, at cost | $ | 2,586,558 | $ | 205,609 | ||||
See notes to financial statements.
| 66 | 2 0 2 3 I SHARES ANNUAL REPORT TO SHAREHOLDERS |
Year Ended March 31, 2023
iShares Global Comm Services ETF | iShares Global Consumer Discretionary ETF | iShares Global Consumer Staples ETF | iShares Global Energy ETF | |||||||||||||
| ||||||||||||||||
INVESTMENT INCOME | ||||||||||||||||
Dividends — unaffiliated | $ | 3,902,537 | $ | 4,998,933 | $ | 33,679,400 | $ | 115,052,288 | ||||||||
Dividends — affiliated | 7,542 | 8,454 | 46,735 | 98,055 | ||||||||||||
Interest — unaffiliated | 536 | 797 | 2,867 | 15,189 | ||||||||||||
Securities lending income — affiliated — net | 10,328 | 10,386 | 7,826 | 4,211 | ||||||||||||
Other income — unaffiliated | 27,956 | 43 | 162 | 1,098,592 | ||||||||||||
Foreign taxes withheld | (189,172 | ) | (349,975 | ) | (1,201,968 | ) | (3,801,282 | ) | ||||||||
Foreign withholding tax claims | 151,764 | 17,032 | 77,242 | 4,432,467 | ||||||||||||
IRS compliance fee for foreign withholding tax claims | (109,622 | ) | — | — | (1,676,405 | ) | ||||||||||
|
|
|
|
|
|
|
| |||||||||
Total investment income | 3,801,869 | 4,685,670 | 32,612,264 | 115,223,115 | ||||||||||||
|
|
|
|
|
|
|
| |||||||||
EXPENSES | ||||||||||||||||
Investment advisory | 980,382 | 1,225,538 | 5,199,328 | 8,707,110 | ||||||||||||
Professional | 17,956 | 1,707 | 7,740 | 553,153 | ||||||||||||
Commitment costs | 290 | 295 | 387 | 2,958 | ||||||||||||
|
|
|
|
|
|
|
| |||||||||
Total expenses | 998,628 | 1,227,540 | 5,207,455 | 9,263,221 | ||||||||||||
|
|
|
|
|
|
|
| |||||||||
Net investment income | 2,803,241 | 3,458,130 | 27,404,809 | 105,959,894 | ||||||||||||
|
|
|
|
|
|
|
| |||||||||
REALIZED AND UNREALIZED GAIN (LOSS) | ||||||||||||||||
Net realized gain (loss) from: | ||||||||||||||||
Investments — unaffiliated | (14,034,351 | ) | (16,770,182 | ) | (27,757,207 | ) | (32,127,684 | ) | ||||||||
Investments — affiliated | 699 | (5,126 | ) | 5,141 | (4,166 | ) | ||||||||||
Capital gain distributions from underlying funds — affiliated | — | — | — | 3 | ||||||||||||
Foreign currency transactions | (49,315 | ) | (53,030 | ) | (7,241 | ) | (574,377 | ) | ||||||||
Futures contracts | (32,611 | ) | (129,191 | ) | (1,432 | ) | (2,539,479 | ) | ||||||||
In-kind redemptions — unaffiliated(a) | 4,741,618 | 3,720,641 | 23,949,120 | 254,055,244 | ||||||||||||
|
|
|
|
|
|
|
| |||||||||
| (9,373,960 | ) | (13,236,888 | ) | (3,811,619 | ) | 218,809,541 | ||||||||||
|
|
|
|
|
|
|
| |||||||||
Net change in unrealized appreciation (depreciation) on: | ||||||||||||||||
Investments — unaffiliated | (21,145,993 | ) | (18,013,283 | ) | 13,423,793 | (138,011,702 | ) | |||||||||
Investments — affiliated | (190 | ) | 180 | (19 | ) | — | ||||||||||
Foreign currency translations | (7,272 | ) | 1,030 | 17,980 | 19,226 | |||||||||||
Futures contracts | 32,579 | (38,191 | ) | 108,887 | 107,699 | |||||||||||
|
|
|
|
|
|
|
| |||||||||
| (21,120,876 | ) | (18,050,264 | ) | 13,550,641 | (137,884,777 | ) | ||||||||||
|
|
|
|
|
|
|
| |||||||||
Net realized and unrealized gain (loss) | (30,494,836 | ) | (31,287,152 | ) | 9,739,022 | 80,924,764 | ||||||||||
|
|
|
|
|
|
|
| |||||||||
NET INCREASE (DECREASE) IN NET ASSETS RESULTING FROM OPERATIONS | $ | (27,691,595 | ) | $ | (27,829,022 | ) | $ | 37,143,831 | $ | 186,884,658 | ||||||
|
|
|
|
|
|
|
| |||||||||
| (a) | See Note 2 of the Notes to Financial Statements. |
See notes to financial statements.
FINANCIAL STATEMENTS | 67 |
Statements of Operations (continued)
Year Ended March 31, 2023
iShares Global Financials ETF | iShares Global Healthcare ETF | iShares Global Industrials ETF | iShares Global Materials ETF | |||||||||||||
| ||||||||||||||||
INVESTMENT INCOME | ||||||||||||||||
Dividends — unaffiliated | $ | 27,434,959 | $ | 69,738,396 | $ | 7,013,129 | $ | 15,554,753 | ||||||||
Dividends — affiliated | 296,545 | 129,215 | 14,424 | 9,115 | ||||||||||||
Interest — unaffiliated | 3,866 | 7,456 | — | 678 | ||||||||||||
Securities lending income — affiliated — net | 7,305 | 48,440 | 13,687 | 3,946 | ||||||||||||
Other income — unaffiliated | 8,605 | 123,258 | 140 | 41 | ||||||||||||
Foreign taxes withheld | (1,965,994 | ) | (3,446,043 | ) | (455,653 | ) | (890,431 | ) | ||||||||
Foreign withholding tax claims | 322,697 | 563,076 | 56,776 | 16,444 | ||||||||||||
IRS compliance fee for foreign withholding tax claims | (18,699 | ) | — | — | — | |||||||||||
|
|
|
|
|
|
|
| |||||||||
Total investment income | 26,089,284 | 67,163,798 | 6,642,503 | 14,694,546 | ||||||||||||
|
|
|
|
|
|
|
| |||||||||
EXPENSES | ||||||||||||||||
Investment advisory | 3,041,905 | 15,772,425 | 1,304,241 | 1,673,604 | ||||||||||||
Professional | 38,942 | 68,643 | 11,504 | 1,649 | ||||||||||||
Commitment costs | 3,356 | — | 76 | 1,899 | ||||||||||||
|
|
|
|
|
|
|
| |||||||||
Total expenses | 3,084,203 | 15,841,068 | 1,315,821 | 1,677,152 | ||||||||||||
|
|
|
|
|
|
|
| |||||||||
Net investment income | 23,005,081 | 51,322,730 | 5,326,682 | 13,017,394 | ||||||||||||
|
|
|
|
|
|
|
| |||||||||
REALIZED AND UNREALIZED GAIN (LOSS) | ||||||||||||||||
Net realized gain (loss) from: | ||||||||||||||||
Investments — unaffiliated | (46,517,892 | ) | (24,391,173 | ) | (8,315,458 | ) | (8,150,568 | ) | ||||||||
Investments — affiliated | (401,351 | ) | 4,655 | 5,125 | 1,739 | |||||||||||
Capital gain distributions from underlying funds — affiliated | 1 | 4 | — | — | ||||||||||||
Foreign currency transactions | (322,681 | ) | (189,249 | ) | (73,936 | ) | (329,332 | ) | ||||||||
Futures contracts | (702,503 | ) | (1,915,886 | ) | (30,818 | ) | (345,394 | ) | ||||||||
In-kind redemptions — unaffiliated(a) | (62,250,390 | ) | 265,262,419 | (216,046 | ) | (3,918,100 | ) | |||||||||
In-kind redemptions — affiliated(a) | (2,146,093 | ) | — | — | — | |||||||||||
Litigation proceeds(b) | 186,962 | — | — | — | ||||||||||||
|
|
|
|
|
|
|
| |||||||||
| (112,153,947 | ) | 238,770,770 | (8,631,133 | ) | (12,741,655 | ) | ||||||||||
|
|
|
|
|
|
|
| |||||||||
Net change in unrealized appreciation (depreciation) on: | ||||||||||||||||
Investments — unaffiliated | (22,837,390 | ) | (403,185,054 | ) | (3,825,766 | ) | (79,623,521 | ) | ||||||||
Investments — affiliated | 703,806 | 4,144 | (1,113 | ) | (460 | ) | ||||||||||
Foreign currency translations | (1,346 | ) | 56,618 | (230 | ) | (1,929 | ) | |||||||||
Futures contracts | 100,971 | (34,093 | ) | 19,090 | (180,977 | ) | ||||||||||
|
|
|
|
|
|
|
| |||||||||
| (22,033,959 | ) | (403,158,385 | ) | (3,808,019 | ) | (79,806,887 | ) | |||||||||
|
|
|
|
|
|
|
| |||||||||
Net realized and unrealized loss | (134,187,906 | ) | (164,387,615 | ) | (12,439,152 | ) | (92,548,542 | ) | ||||||||
|
|
|
|
|
|
|
| |||||||||
NET DECREASE IN NET ASSETS RESULTING FROM OPERATIONS | $ | (111,182,825 | ) | $ | (113,064,885 | ) | $ | (7,112,470 | ) | $ | (79,531,148 | ) | ||||
|
|
|
|
|
|
|
| |||||||||
| (a) | See Note 2 of the Notes to Financial Statements. |
| (b) | Represents proceeds received from settlement of class action litigation where the Fund was able to recover a portion of investment losses previously realized. |
See notes to financial statements.
| 68 | 2 0 2 3 I SHARES ANNUAL REPORT TO SHAREHOLDERS |
Statements of Operations (continued)
Year Ended March 31, 2023
iShares Global Tech ETF | iShares Global Utilities ETF | |||||||
| ||||||||
INVESTMENT INCOME | ||||||||
Dividends — unaffiliated | $ | 40,139,701 | $ | 5,367,484 | ||||
Dividends — affiliated | 107,632 | 6,556 | ||||||
Interest — unaffiliated | 13,174 | 424 | ||||||
Securities lending income — affiliated — net | 58,039 | 1,549 | ||||||
Non-cash dividends — unaffiliated | — | 309,307 | ||||||
Other income — unaffiliated | 124 | 48,419 | ||||||
Foreign taxes withheld | (1,838,446 | ) | (241,650 | ) | ||||
Foreign withholding tax claims | 42,855 | 198,724 | ||||||
IRS compliance fee for foreign withholding tax claims | — | (1,018 | ) | |||||
|
|
|
| |||||
Total investment income | 38,523,079 | 5,689,795 | ||||||
|
|
|
| |||||
EXPENSES | ||||||||
Investment advisory | 13,489,508 | 673,985 | ||||||
Commitment costs | 16,846 | 54 | ||||||
Professional | 4,148 | 24,864 | ||||||
|
|
|
| |||||
Total expenses | 13,510,502 | 698,903 | ||||||
|
|
|
| |||||
Net investment income | 25,012,577 | 4,990,892 | ||||||
|
|
|
| |||||
REALIZED AND UNREALIZED GAIN (LOSS) | ||||||||
Net realized gain (loss) from: | ||||||||
Investments — unaffiliated | (63,110,253 | ) | (4,982,072 | ) | ||||
Investments — affiliated | (25,672 | ) | (82 | ) | ||||
Capital gain distributions from underlying funds — affiliated | 3 | — | ||||||
Foreign currency transactions | (498,023 | ) | (24,291 | ) | ||||
Futures contracts | (250,992 | ) | (45,062 | ) | ||||
In-kind redemptions — unaffiliated(a) | 546,542,119 | 1,531,166 | ||||||
|
|
|
| |||||
| 482,657,182 | (3,520,341 | ) | ||||||
|
|
|
| |||||
Net change in unrealized appreciation (depreciation) on: | ||||||||
Investments — unaffiliated | (987,930,976 | ) | (15,196,322 | ) | ||||
Investments — affiliated | (2,371 | ) | (3 | ) | ||||
Foreign currency translations | 21,362 | (13 | ) | |||||
Futures contracts | (156,780 | ) | (6,500 | ) | ||||
|
|
|
| |||||
| (988,068,765 | ) | (15,202,838 | ) | |||||
|
|
|
| |||||
Net realized and unrealized loss | (505,411,583 | ) | (18,723,179 | ) | ||||
|
|
|
| |||||
NET DECREASE IN NET ASSETS RESULTING FROM OPERATIONS | $ | (480,399,006 | ) | $ | (13,732,287 | ) | ||
|
|
|
| |||||
| (a) | See Note 2 of the Notes to Financial Statements. |
See notes to financial statements.
FINANCIAL STATEMENTS | 69 |
Statements of Changes in Net Assets
iShares Global Comm Services ETF | iShares Global Consumer Discretionary ETF | |||||||||||||||||||
|
|
|
| |||||||||||||||||
Year Ended 03/31/23 | Year Ended 03/31/22 | Year Ended 03/31/23 | Year Ended 03/31/22 | |||||||||||||||||
| ||||||||||||||||||||
INCREASE (DECREASE) IN NET ASSETS | ||||||||||||||||||||
OPERATIONS | ||||||||||||||||||||
Net investment income | $ | 2,803,241 | $ | 2,759,004 | $ | 3,458,130 | $ | 2,686,489 | ||||||||||||
Net realized gain (loss) | (9,373,960 | ) | 59,321,532 | (13,236,888 | ) | 70,684,647 | ||||||||||||||
Net change in unrealized appreciation (depreciation) | (21,120,876 | ) | (79,134,138 | ) | (18,050,264 | ) | (98,094,515 | ) | ||||||||||||
|
|
|
|
|
|
|
| |||||||||||||
Net decrease in net assets resulting from operations | (27,691,595 | ) | (17,053,602 | ) | (27,829,022 | ) | (24,723,379 | ) | ||||||||||||
|
|
|
|
|
|
|
| |||||||||||||
DISTRIBUTIONS TO SHAREHOLDERS(a) | ||||||||||||||||||||
Decrease in net assets resulting from distributions to shareholders | (2,680,016 | ) | (5,514,816 | ) | (3,272,046 | ) | (4,140,498 | ) | ||||||||||||
|
|
|
|
|
|
|
| |||||||||||||
CAPITAL SHARE TRANSACTIONS | ||||||||||||||||||||
Net increase (decrease) in net assets derived from capital share transactions | 46,641,829 | (57,541,140 | ) | (22,847,245 | ) | (43,016,116 | ) | |||||||||||||
|
|
|
|
|
|
|
| |||||||||||||
NET ASSETS | ||||||||||||||||||||
Total increase (decrease) in net assets | 16,270,218 | (80,109,558 | ) | (53,948,313 | ) | (71,879,993 | ) | |||||||||||||
Beginning of year | 240,269,947 | 320,379,505 | 358,864,963 | 430,744,956 | ||||||||||||||||
|
|
|
|
|
|
|
| |||||||||||||
End of year | $ | 256,540,165 | $ | 240,269,947 | $ | 304,916,650 | $ | 358,864,963 | ||||||||||||
|
|
|
|
|
|
|
| |||||||||||||
| (a) | Distributions for annual periods determined in accordance with U.S. federal income tax regulations. |
See notes to financial statements.
| 70 | 2 0 2 3 I SHARES ANNUAL REPORT TO SHAREHOLDERS |
Statements of Changes in Net Assets (continued)
iShares Global Consumer Staples ETF | iShares Global Energy ETF | |||||||||||||||||||
|
|
|
| |||||||||||||||||
| Year Ended 03/31/23 | Year Ended 03/31/22 | Year Ended 03/31/23 | Year Ended 03/31/22 | |||||||||||||||||
| ||||||||||||||||||||
INCREASE (DECREASE) IN NET ASSETS | ||||||||||||||||||||
OPERATIONS | ||||||||||||||||||||
Net investment income | $ | 27,404,809 | $ | 16,123,906 | $ | 105,959,894 | $ | 70,477,381 | ||||||||||||
Net realized gain (loss) | (3,811,619 | ) | 23,776,879 | 218,809,541 | 113,122,772 | |||||||||||||||
Net change in unrealized appreciation (depreciation) | 13,550,641 | 6,967,202 | (137,884,777 | ) | 516,085,873 | |||||||||||||||
|
|
|
|
|
|
|
| |||||||||||||
Net increase in net assets resulting from operations | 37,143,831 | 46,867,987 | 186,884,658 | 699,686,026 | ||||||||||||||||
|
|
|
|
|
|
|
| |||||||||||||
DISTRIBUTIONS TO SHAREHOLDERS(a) | ||||||||||||||||||||
Decrease in net assets resulting from distributions to shareholders | (24,794,345 | ) | (15,010,694 | ) | (103,333,626 | ) | (64,194,482 | ) | ||||||||||||
|
|
|
|
|
|
|
| |||||||||||||
CAPITAL SHARE TRANSACTIONS | ||||||||||||||||||||
Net increase (decrease) in net assets derived from capital share transactions | 502,554,697 | 464,010,197 | (565,617,612 | ) | 337,330,459 | |||||||||||||||
|
|
|
|
|
|
|
| |||||||||||||
NET ASSETS | ||||||||||||||||||||
Total increase (decrease) in net assets | 514,904,183 | 495,867,490 | (482,066,580 | ) | 972,822,003 | |||||||||||||||
Beginning of year | 1,021,774,923 | 525,907,433 | 2,280,842,719 | 1,308,020,716 | ||||||||||||||||
|
|
|
|
|
|
|
| |||||||||||||
End of year | $ | 1,536,679,106 | $ | 1,021,774,923 | $ | 1,798,776,139 | $ | 2,280,842,719 | ||||||||||||
|
|
|
|
|
|
|
| |||||||||||||
| (a) | Distributions for annual periods determined in accordance with U.S. federal income tax regulations. |
See notes to financial statements.
FINANCIAL STATEMENTS | 71 |
Statements of Changes in Net Assets (continued)
iShares Global Financials ETF | iShares Global Healthcare ETF | |||||||||||||||||||
|
|
|
| |||||||||||||||||
| Year Ended 03/31/23 | Year Ended 03/31/22 | Year Ended 03/31/23 | Year Ended 03/31/22 | |||||||||||||||||
| ||||||||||||||||||||
INCREASE (DECREASE) IN NET ASSETS | ||||||||||||||||||||
OPERATIONS | ||||||||||||||||||||
Net investment income | $ | 23,005,081 | $ | 51,081,838 | $ | 51,322,730 | $ | 41,847,005 | ||||||||||||
Net realized gain (loss) | (112,153,947 | ) | 76,434,346 | 238,770,770 | 75,337,909 | |||||||||||||||
Net change in unrealized appreciation (depreciation) | (22,033,959 | ) | (57,062,400 | ) | (403,158,385 | ) | 301,309,666 | |||||||||||||
|
|
|
|
|
|
|
| |||||||||||||
Net increase (decrease) in net assets resulting from operations | (111,182,825 | ) | 70,453,784 | (113,064,885 | ) | 418,494,580 | ||||||||||||||
|
|
|
|
|
|
|
| |||||||||||||
DISTRIBUTIONS TO SHAREHOLDERS(a) | ||||||||||||||||||||
Decrease in net assets resulting from distributions to shareholders | (27,379,101 | ) | (47,722,673 | ) | (46,042,619 | ) | (39,505,134 | ) | ||||||||||||
|
|
|
|
|
|
|
| |||||||||||||
CAPITAL SHARE TRANSACTIONS | ||||||||||||||||||||
Net increase (decrease) in net assets derived from capital share transactions | (598,208,666 | ) | 666,670,761 | 750,358,066 | 407,814,541 | |||||||||||||||
|
|
|
|
|
|
|
| |||||||||||||
NET ASSETS | ||||||||||||||||||||
Total increase (decrease) in net assets | (736,770,592 | ) | 689,401,872 | 591,250,562 | 786,803,987 | |||||||||||||||
Beginning of year | 1,162,145,321 | 472,743,449 | 3,492,005,315 | 2,705,201,328 | ||||||||||||||||
|
|
|
|
|
|
|
| |||||||||||||
End of year | $ | 425,374,729 | $ | 1,162,145,321 | $ | 4,083,255,877 | $ | 3,492,005,315 | ||||||||||||
|
|
|
|
|
|
|
| |||||||||||||
| (a) | Distributions for annual periods determined in accordance with U.S. federal income tax regulations. |
See notes to financial statements.
| 72 | 2 0 2 3 I SHARES ANNUAL REPORT TO SHAREHOLDERS |
Statements of Changes in Net Assets (continued)
iShares Global Industrials ETF | iShares Global Materials ETF | |||||||||||||||||||
|
|
|
| |||||||||||||||||
| Year Ended 03/31/23 | Year Ended 03/31/22 | Year Ended 03/31/23 | Year Ended 03/31/22 | |||||||||||||||||
| ||||||||||||||||||||
INCREASE (DECREASE) IN NET ASSETS | ||||||||||||||||||||
OPERATIONS | ||||||||||||||||||||
Net investment income | $ | 5,326,682 | $ | 5,417,472 | $ | 13,017,394 | $ | 26,924,199 | ||||||||||||
Net realized gain (loss) | (8,631,133 | ) | 15,679,431 | (12,741,655 | ) | 92,748,979 | ||||||||||||||
Net change in unrealized appreciation (depreciation) | (3,808,019 | ) | (14,934,079 | ) | (79,806,887 | ) | (43,739,735 | ) | ||||||||||||
|
|
|
|
|
|
|
| |||||||||||||
Net increase (decrease) in net assets resulting from operations | (7,112,470 | ) | 6,162,824 | (79,531,148 | ) | 75,933,443 | ||||||||||||||
|
|
|
|
|
|
|
| |||||||||||||
DISTRIBUTIONS TO SHAREHOLDERS(a) | ||||||||||||||||||||
Decrease in net assets resulting from distributions to shareholders | (5,234,413 | ) | (6,438,398 | ) | (22,752,409 | ) | (25,613,809 | ) | ||||||||||||
|
|
|
|
|
|
|
| |||||||||||||
CAPITAL SHARE TRANSACTIONS | ||||||||||||||||||||
Net decrease in net assets derived from capital share transactions | (27,176,051 | ) | (45,709,099 | ) | (273,573,823 | ) | (46,291,020 | ) | ||||||||||||
|
|
|
|
|
|
|
| |||||||||||||
NET ASSETS | ||||||||||||||||||||
Total increase (decrease) in net assets | (39,522,934 | ) | (45,984,673 | ) | (375,857,380 | ) | 4,028,614 | |||||||||||||
Beginning of year | 376,481,114 | 422,465,787 | 727,027,564 | 722,998,950 | ||||||||||||||||
|
|
|
|
|
|
|
| |||||||||||||
End of year | $ | 336,958,180 | $ | 376,481,114 | $ | 351,170,184 | $ | 727,027,564 | ||||||||||||
|
|
|
|
|
|
|
| |||||||||||||
| (a) | Distributions for annual periods determined in accordance with U.S. federal income tax regulations. |
See notes to financial statements.
FINANCIAL STATEMENTS | 73 |
Statements of Changes in Net Assets (continued)
iShares Global Tech ETF | iShares Global Utilities ETF | |||||||||||||||||||
|
|
|
| |||||||||||||||||
Year Ended 03/31/23 | Year Ended 03/31/22 | Year Ended 03/31/23 | Year Ended 03/31/22 | |||||||||||||||||
| ||||||||||||||||||||
INCREASE (DECREASE) IN NET ASSETS | ||||||||||||||||||||
OPERATIONS | ||||||||||||||||||||
Net investment income | $ | 25,012,577 | $ | 26,880,272 | $ | 4,990,892 | $ | 4,609,122 | ||||||||||||
Net realized gain (loss) | 482,657,182 | 1,095,104,060 | (3,520,341 | ) | (1,772,830 | ) | ||||||||||||||
Net change in unrealized appreciation (depreciation) | (988,068,765 | ) | (517,913,046 | ) | (15,202,838 | ) | 13,096,496 | |||||||||||||
|
|
|
|
|
|
|
| |||||||||||||
Net increase (decrease) in net assets resulting from operations | (480,399,006 | ) | 604,071,286 | (13,732,287 | ) | 15,932,788 | ||||||||||||||
|
|
|
|
|
|
|
| |||||||||||||
DISTRIBUTIONS TO SHAREHOLDERS(a) | ||||||||||||||||||||
Decrease in net assets resulting from distributions to shareholders | (23,649,568 | ) | (32,243,037 | ) | (5,088,399 | ) | (4,448,043 | ) | ||||||||||||
|
|
|
|
|
|
|
| |||||||||||||
CAPITAL SHARE TRANSACTIONS | ||||||||||||||||||||
Net increase (decrease) in net assets derived from capital share transactions | (1,320,298,332 | ) | (616,406,539 | ) | (25,424,599 | ) | 17,649,357 | |||||||||||||
|
|
|
|
|
|
|
| |||||||||||||
NET ASSETS | ||||||||||||||||||||
Total increase (decrease) in net assets | (1,824,346,906 | ) | (44,578,290 | ) | (44,245,285 | ) | 29,134,102 | |||||||||||||
Beginning of year | 5,001,963,077 | 5,046,541,367 | 180,401,669 | 151,267,567 | ||||||||||||||||
|
|
|
|
|
|
|
| |||||||||||||
End of year | $ | 3,177,616,171 | $ | 5,001,963,077 | $ | 136,156,384 | $ | 180,401,669 | ||||||||||||
|
|
|
|
|
|
|
| |||||||||||||
| (a) | Distributions for annual periods determined in accordance with U.S. federal income tax regulations. |
See notes to financial statements.
| 74 | 2 0 2 3 I SHARES ANNUAL REPORT TO SHAREHOLDERS |
(For a share outstanding throughout each period)
| iShares Global Comm Services ETF | ||||||||||||||||||||||||||||||||||||||||
|
| |||||||||||||||||||||||||||||||||||||||
Year Ended 03/31/23 | Year Ended 03/31/22 | Year Ended 03/31/21 | Year Ended 03/31/20 | Year Ended 03/31/19 | ||||||||||||||||||||||||||||||||||||
| ||||||||||||||||||||||||||||||||||||||||
Net asset value, beginning of year | $ | 73.93 | $ | 80.09 | $ | 51.81 | $ | 56.22 | $ | 57.19 | ||||||||||||||||||||||||||||||
|
|
|
|
|
|
|
|
|
| |||||||||||||||||||||||||||||||
Net investment income(a) | 0.71 | (b) | 0.74 | (b) | 0.66 | 0.78 | 1.82 | |||||||||||||||||||||||||||||||||
Net realized and unrealized gain (loss)(c) | (9.72 | ) | (5.42 | ) | 28.33 | (3.85 | ) | (0.62 | ) | |||||||||||||||||||||||||||||||
|
|
|
|
|
|
|
|
|
| |||||||||||||||||||||||||||||||
Net increase (decrease)from investment operations | (9.01 | ) | (4.68 | ) | 28.99 | (3.07 | ) | 1.20 | ||||||||||||||||||||||||||||||||
|
|
|
|
|
|
|
|
|
| |||||||||||||||||||||||||||||||
Distributions from net investment income(d) | (0.78 | ) | (1.48 | ) | (0.71 | ) | (1.34 | ) | (2.17 | ) | ||||||||||||||||||||||||||||||
|
|
|
|
|
|
|
|
|
| |||||||||||||||||||||||||||||||
Net asset value, end of year | $ | 64.14 | $ | 73.93 | $ | 80.09 | $ | 51.81 | $ | 56.22 | ||||||||||||||||||||||||||||||
|
|
|
|
|
|
|
|
|
| |||||||||||||||||||||||||||||||
Total Return(e) | ||||||||||||||||||||||||||||||||||||||||
Based on net asset value | (12.16 | )%(b) | (6.03 | )%(b) | 56.20 | % | (5.70 | )% | 2.37 | % | ||||||||||||||||||||||||||||||
|
|
|
|
|
|
|
|
|
| |||||||||||||||||||||||||||||||
Ratios to Average Net Assets(f) | ||||||||||||||||||||||||||||||||||||||||
Total expenses | 0.42 | % | 0.43 | % | 0.43 | % | 0.46 | % | 0.46 | % | ||||||||||||||||||||||||||||||
|
|
|
|
|
|
|
|
|
| |||||||||||||||||||||||||||||||
Total expenses excluding professional fees for foreign withholding tax claims | 0.41 | % | 0.41 | % | N/A | N/A | N/A | |||||||||||||||||||||||||||||||||
|
|
|
|
|
|
|
|
|
| |||||||||||||||||||||||||||||||
Net investment income | 1.18 | %(b) | 0.89 | %(b) | 0.96 | % | 1.34 | % | 3.28 | % | ||||||||||||||||||||||||||||||
|
|
|
|
|
|
|
|
|
| |||||||||||||||||||||||||||||||
Supplemental Data | ||||||||||||||||||||||||||||||||||||||||
Net assets, end of year (000) | $ | 256,540 | $ | 240,270 | $ | 320,380 | $ | 225,363 | $ | 236,105 | ||||||||||||||||||||||||||||||
|
|
|
|
|
|
|
|
|
| |||||||||||||||||||||||||||||||
Portfolio turnover rate(g) | 14 | % | 18 | % | 13 | % | 24 | % | 79 | % | ||||||||||||||||||||||||||||||
|
|
|
|
|
|
|
|
|
| |||||||||||||||||||||||||||||||
| (a) | Based on average shares outstanding. |
| (b) | Reflects the positive effect of foreign withholding tax claims, net of the associated professional fees, which resulted in the following increases for the year ended March 31, 2023 and March 31, 2022 respectively: |
• Net investment income per share by $0.03 and $0.10.
• Total return by 0.05% and 0.15%.
• Ratio of net investment income to average net assets by 0.06% and 0.12%.
| (c) | The amounts reported for a share outstanding may not accord with the change in aggregate gains and losses in securities for the fiscal period due to the timing of capital share transactions in relation to the fluctuating market values of the Fund’s underlying securities. |
| (d) | Distributions for annual periods determined in accordance with U.S. federal income tax regulations. |
| (e) | Where applicable, assumes the reinvestment of distributions. |
| (f) | Excludes fees and expenses incurred indirectly as a result of investments in underlying funds. |
| (g) | Portfolio turnover rate excludes in-kind transactions. |
See notes to financial statements.
FINANCIAL HIGHLIGHTS | 75 |
Financial Highlights (continued)
(For a share outstanding throughout each period)
| iShares Global Consumer Discretionary ETF | ||||||||||||||||||||||||||||||
| ||||||||||||||||||||||||||||||
| Year Ended 03/31/23 | Year Ended 03/31/22 | Year Ended 03/31/21 | Year Ended 03/31/20 | Year Ended 03/31/19 | ||||||||||||||||||||||||||
| ||||||||||||||||||||||||||||||
Net asset value, beginning of year | $ | 156.03 | $ | 162.55 | $ | 95.12 | $ | 113.27 | $ | 111.45 | ||||||||||||||||||||
|
|
|
|
|
|
|
|
|
| |||||||||||||||||||||
Net investment income(a) | 1.58 | (b) | 1.02 | (b) | 1.06 | 1.75 | 1.70 | |||||||||||||||||||||||
Net realized and unrealized gain (loss)(c) | (11.15 | ) | (5.95 | ) | 67.38 | (18.03 | ) | 1.87 | ||||||||||||||||||||||
|
|
|
|
|
|
|
|
|
| |||||||||||||||||||||
Net increase (decrease) from investment operations | (9.57 | ) | (4.93 | ) | 68.44 | (16.28 | ) | 3.57 | ||||||||||||||||||||||
|
|
|
|
|
|
|
|
|
| |||||||||||||||||||||
Distributions from net investment income(d) | (1.26 | ) | (1.59 | ) | (1.01 | ) | (1.87 | ) | (1.75 | ) | ||||||||||||||||||||
|
|
|
|
|
|
|
|
|
| |||||||||||||||||||||
Net asset value, end of year | $ | 145.20 | $ | 156.03 | $ | 162.55 | $ | 95.12 | $ | 113.27 | ||||||||||||||||||||
|
|
|
|
|
|
|
|
|
| |||||||||||||||||||||
Total Return(e) | ||||||||||||||||||||||||||||||
Based on net asset value | (6.12 | )%(b) | (3.13 | )%(b) | 72.21 | % | (14.71 | )%(f) | 3.32 | % | ||||||||||||||||||||
|
|
|
|
|
|
|
|
|
| |||||||||||||||||||||
Ratios to Average Net Assets(g) | ||||||||||||||||||||||||||||||
Total expenses | 0.41 | % | 0.40 | % | 0.43 | % | 0.46 | % | 0.46 | % | ||||||||||||||||||||
|
|
|
|
|
|
|
|
|
| |||||||||||||||||||||
Total expenses excluding professional fees for foreign withholding tax claims | 0.41 | % | 0.40 | % | N/A | N/A | N/A | |||||||||||||||||||||||
|
|
|
|
|
|
|
|
|
| |||||||||||||||||||||
Net investment income | 1.17 | %(b) | 0.60 | %(b) | 0.75 | % | 1.47 | % | 1.51 | % | ||||||||||||||||||||
|
|
|
|
|
|
|
|
|
| |||||||||||||||||||||
Supplemental Data | ||||||||||||||||||||||||||||||
Net assets, end of year (000) | $ | 304,917 | $ | 358,865 | $ | 430,745 | $ | 156,949 | $ | 203,889 | ||||||||||||||||||||
|
|
|
|
|
|
|
|
|
| |||||||||||||||||||||
Portfolio turnover rate(h) | 17 | % | 12 | % | 34 | % | 17 | % | 30 | % | ||||||||||||||||||||
|
|
|
|
|
|
|
|
|
| |||||||||||||||||||||
| (a) | Based on average shares outstanding. |
| (b) | Reflects the positive effect of foreign withholding tax claims, net of the associated professional fees, which resulted in the following increases for the year ended March 31, 2023 and March 31, 2022 respectively: |
• Net investment income per share by $0.01 and $0.03.
• Total return by 0.00% and 0.02%.
• Ratio of net investment income to average net assets by 0.01% and 0.02%.
| (c) | The amounts reported for a share outstanding may not accord with the change in aggregate gains and losses in securities for the fiscal period due to the timing of capital share transactions in relation to the fluctuating market values of the Fund’s underlying securities. |
| (d) | Distributions for annual periods determined in accordance with U.S. federal income tax regulations. |
| (e) | Where applicable, assumes the reinvestment of distributions. |
| (f)�� | Includes payment received from an affiliate, which had no impact on the Fund’s total return. |
| (g) | Excludes fees and expenses incurred indirectly as a result of investments in underlying funds. |
| (h) | Portfolio turnover rate excludes in-kind transactions. |
See notes to financial statements.
| 76 | 2 0 2 3 I SHARES ANNUAL REPORT TO SHAREHOLDERS |
Financial Highlights (continued)
(For a share outstanding throughout each period)
| iShares Global Consumer Staples ETF | ||||||||||||||||||||||||||||||
| ||||||||||||||||||||||||||||||
| Year Ended | Year Ended |
| Year Ended |
| Year Ended |
| Year Ended |
| ||||||||||||||||||||||
| 03/31/23 | 03/31/22 | 03/31/21 | 03/31/20 | 03/31/19 | (a) | |||||||||||||||||||||||||
| ||||||||||||||||||||||||||||||
Net asset value, beginning of year | $ | 62.11 | $ | 58.11 | $ | 47.96 | $ | 51.67 | $ | 50.14 | ||||||||||||||||||||
|
|
|
|
|
|
|
|
|
| |||||||||||||||||||||
Net investment income(b) | 1.29 | (c) | 1.37 | 1.34 | 1.18 | 1.20 | ||||||||||||||||||||||||
Net realized and unrealized gain (loss)(d) | (0.38 | ) | 4.09 | 10.17 | (3.69 | ) | 1.70 | |||||||||||||||||||||||
|
|
|
|
|
|
|
|
|
| |||||||||||||||||||||
Net increase (decrease) from investment operations | 0.91 | 5.46 | 11.51 | (2.51 | ) | 2.90 | ||||||||||||||||||||||||
|
|
|
|
|
|
|
|
|
| |||||||||||||||||||||
Distributions from net investment income(e) | (1.18 | ) | (1.46 | ) | (1.36 | ) | (1.20 | ) | (1.37 | ) | ||||||||||||||||||||
|
|
|
|
|
|
|
|
|
| |||||||||||||||||||||
Net asset value, end of year | $ | 61.84 | $ | 62.11 | $ | 58.11 | $ | 47.96 | $ | 51.67 | ||||||||||||||||||||
|
|
|
|
|
|
|
|
|
| |||||||||||||||||||||
Total Return(f) | ||||||||||||||||||||||||||||||
Based on net asset value | 1.56 | %(c) | 9.42 | % | 24.21 | % | (5.10 | )% | 6.07 | % | ||||||||||||||||||||
|
|
|
|
|
|
|
|
|
| |||||||||||||||||||||
Ratios to Average Net Assets(g) | ||||||||||||||||||||||||||||||
Total expenses | 0.41 | % | 0.40 | % | 0.43 | % | 0.46 | % | 0.46 | % | ||||||||||||||||||||
|
|
|
|
|
|
|
|
|
| |||||||||||||||||||||
Total expenses excluding professional fees for foreign withholding tax claims | 0.41 | % | N/A | N/A | N/A | N/A | ||||||||||||||||||||||||
|
|
|
|
|
|
|
|
|
| |||||||||||||||||||||
Net investment income | 2.18 | %(c) | 2.22 | % | 2.46 | % | 2.21 | % | 2.43 | % | ||||||||||||||||||||
|
|
|
|
|
|
|
|
|
| |||||||||||||||||||||
Supplemental Data | ||||||||||||||||||||||||||||||
Net assets, end of year (000) | $ | 1,536,679 | $ | 1,021,775 | $ | 525,907 | $ | 683,380 | $ | 738,832 | ||||||||||||||||||||
|
|
|
|
|
|
|
|
|
| |||||||||||||||||||||
Portfolio turnover rate(h) | 13 | % | 8 | % | 7 | % | 7 | % | 7 | % | ||||||||||||||||||||
|
|
|
|
|
|
|
|
|
| |||||||||||||||||||||
| (a) | Per share amounts reflect a two-for-one stock split effective after the close of trading on May 1, 2018. |
| (b) | Based on average shares outstanding. |
| (c) | Reflects the positive effect of foreign withholding tax claims, net of the associated professional fees, which resulted in the following increases for the year ended March 31, 2023: |
• Net investment income per share by $0.00.
• Total return by 0.01%.
• Ratio of net investment income to average net assets by 0.01%.
| (d) | The amounts reported for a share outstanding may not accord with the change in aggregate gains and losses in securities for the fiscal period due to the timing of capital share transactions in relation to the fluctuating market values of the Fund’s underlying securities. |
| (e) | Distributions for annual periods determined in accordance with U.S. federal income tax regulations. |
| (f) | Where applicable, assumes the reinvestment of distributions. |
| (g) | Excludes fees and expenses incurred indirectly as a result of investments in underlying funds. |
| (h) | Portfolio turnover rate excludes in-kind transactions. |
See notes to financial statements.
FINANCIAL HIGHLIGHTS | 77 |
Financial Highlights (continued)
(For a share outstanding throughout each period)
| iShares Global Energy ETF | ||||||||||||||||||||
|
| |||||||||||||||||||
| Year Ended 03/31/23 | Year Ended 03/31/22 | Year Ended 03/31/21 | Year Ended 03/31/20 | Year Ended 03/31/19 | ||||||||||||||||
| ||||||||||||||||||||
Net asset value, beginning of year | $ | 36.12 | $ | 24.63 | $ | 17.06 | $ | 33.70 | $ | 33.91 | ||||||||||
|
|
|
|
|
|
|
|
|
| |||||||||||
Net investment income(a) | 1.89 | (b) | 1.22 | 0.94 | 1.13 | 1.11 | ||||||||||||||
Net realized and unrealized gain (loss)(c) | 1.56 | 11.37 | 7.62 | (15.61 | ) | (0.29 | ) | |||||||||||||
|
|
|
|
|
|
|
|
|
| |||||||||||
Net increase (decrease) from investment operations | 3.45 | 12.59 | 8.56 | (14.48 | ) | 0.82 | ||||||||||||||
|
|
|
|
|
|
|
|
|
| |||||||||||
Distributions from net investment income(d) | (1.86 | ) | (1.10 | ) | (0.99 | ) | (2.16 | ) | (1.03 | ) | ||||||||||
|
|
|
|
|
|
|
|
|
| |||||||||||
Net asset value, end of year | $ | 37.71 | $ | 36.12 | $ | 24.63 | $ | 17.06 | $ | 33.70 | ||||||||||
|
|
|
|
|
|
|
|
|
| |||||||||||
Total Return(e) | ||||||||||||||||||||
Based on net asset value | 9.39 | %(b) | 52.61 | % | 51.36 | % | (45.73 | )% | 2.56 | % | ||||||||||
|
|
|
|
|
|
|
|
|
| |||||||||||
Ratios to Average Net Assets(f) | ||||||||||||||||||||
Total expenses | 0.44 | % | 0.40 | % | 0.43 | % | 0.46 | % | 0.46 | % | ||||||||||
|
|
|
|
|
|
|
|
|
| |||||||||||
Total expenses excluding professional fees for foreign withholding tax claims | 0.41 | % | N/A | N/A | N/A | N/A | ||||||||||||||
|
|
|
|
|
|
|
|
|
| |||||||||||
Net investment income | 5.03 | %(b) | 4.33 | % | 4.65 | % | 3.78 | % | 3.17 | % | ||||||||||
|
|
|
|
|
|
|
|
|
| |||||||||||
Supplemental Data | ||||||||||||||||||||
Net assets, end of year (000) | $ | 1,798,776 | $ | 2,280,843 | $ | 1,308,021 | $ | 616,818 | $ | 1,031,245 | ||||||||||
|
|
|
|
|
|
|
|
|
| |||||||||||
Portfolio turnover rate(g) | 10 | % | 6 | % | 5 | % | 7 | % | 6 | % | ||||||||||
|
|
|
|
|
|
|
|
|
| |||||||||||
| (a) | Based on average shares outstanding. |
| (b) | Reflects the positive effect of foreign withholding tax claims, net of the associated professional fees, which resulted in the following increases for the year ended March 31, 2023: |
• Net investment income per share by $0.07.
• Total return by 0.24%.
• Ratio of net investment income to average net assets by 0.18%.
| (c) | The amounts reported for a share outstanding may not accord with the change in aggregate gains and losses in securities for the fiscal period due to the timing of capital share transactions in relation to the fluctuating market values of the Fund’s underlying securities. |
| (d) | Distributions for annual periods determined in accordance with U.S. federal income tax regulations. |
| (e) | Where applicable, assumes the reinvestment of distributions. |
| (f) | Excludes fees and expenses incurred indirectly as a result of investments in underlying funds. |
| (g) | Portfolio turnover rate excludes in-kind transactions. |
See notes to financial statements.
| 78 | 2 0 2 3 I SHARES ANNUAL REPORT TO SHAREHOLDERS |
Financial Highlights (continued)
(For a share outstanding throughout each period)
| iShares Global Financials ETF | ||||||||||||||||||||||||||||||
| ||||||||||||||||||||||||||||||
| Year Ended 03/31/23 | Year Ended 03/31/22 | Year Ended 03/31/21 | Year Ended 03/31/20 | Year Ended 03/31/19 | ||||||||||||||||||||||||||
| ||||||||||||||||||||||||||||||
Net asset value, beginning of year | $ | 79.60 | $ | 73.29 | $ | 47.23 | $ | 61.61 | $ | 68.93 | ||||||||||||||||||||
|
|
|
|
|
|
|
|
|
| |||||||||||||||||||||
Net investment income(a) | 2.19 | (b) | 1.65 | (b) | 1.36 | 1.71 | 1.84 | |||||||||||||||||||||||
Net realized and unrealized gain (loss)(c) | (10.01 | ) | 6.01 | 26.09 | (14.12 | ) | (7.38 | ) | ||||||||||||||||||||||
|
|
|
|
|
|
|
|
|
| |||||||||||||||||||||
Net increase (decrease) from investment operations | (7.82 | ) | 7.66 | 27.45 | (12.41 | ) | (5.54 | ) | ||||||||||||||||||||||
|
|
|
|
|
|
|
|
|
| |||||||||||||||||||||
Distributions from net investment income(d) | (2.61 | ) | (1.35 | ) | (1.39 | ) | (1.97 | ) | (1.78 | ) | ||||||||||||||||||||
|
|
|
|
|
|
|
|
|
| |||||||||||||||||||||
Net asset value, end of year | $ | 69.17 | $ | 79.60 | $ | 73.29 | $ | 47.23 | $ | 61.61 | ||||||||||||||||||||
|
|
|
|
|
|
|
|
|
| |||||||||||||||||||||
Total Return(e) | ||||||||||||||||||||||||||||||
Based on net asset value | (9.86 | )%(b)(f) | 10.48 | %(b) | 58.99 | % | (20.99 | )%(g) | (8.02 | )% | ||||||||||||||||||||
|
|
|
|
|
|
|
|
|
| |||||||||||||||||||||
Ratios to Average Net Assets(h) | ||||||||||||||||||||||||||||||
Total expenses | 0.42 | % | 0.40 | % | 0.43 | % | 0.46 | % | 0.46 | % | ||||||||||||||||||||
|
|
|
|
|
|
|
|
|
| |||||||||||||||||||||
Total expenses excluding professional fees for foreign withholding tax claims | 0.41 | % | 0.40 | % | 0.43 | % | N/A | 0.46 | % | |||||||||||||||||||||
|
|
|
|
|
|
|
|
|
| |||||||||||||||||||||
Net investment income | 3.12 | %(b) | 2.07 | %(b) | 2.28 | % | 2.66 | % | 2.84 | % | ||||||||||||||||||||
|
|
|
|
|
|
|
|
|
| |||||||||||||||||||||
Supplemental Data | ||||||||||||||||||||||||||||||
Net assets, end of year (000) | $ | 425,375 | $ | 1,162,145 | $ | 472,743 | $ | 203,073 | $ | 341,918 | ||||||||||||||||||||
|
|
|
|
|
|
|
|
|
| |||||||||||||||||||||
Portfolio turnover rate(i) | 13 | % | 12 | % | 4 | % | 7 | % | 7 | % | ||||||||||||||||||||
|
|
|
|
|
|
|
|
|
| |||||||||||||||||||||
| (a) | Based on average shares outstanding. |
| (b) | Reflects the positive effect of foreign withholding tax claims, net of the associated professional fees, which resulted in the following increases for the year ended March 31, 2023 and March 31, 2022 respectively: |
• Net investment income per share by $0.03 and $0.01.
• Total return by 0.06% and 0.02%.
• Ratio of net investment income to average net assets by 0.04% and 0.01%.
| (c) | The amounts reported for a share outstanding may not accord with the change in aggregate gains and losses in securities for the fiscal period due to the timing of capital share transactions in relation to the fluctuating market values of the Fund’s underlying securities. |
| (d) | Distributions for annual periods determined in accordance with U.S. federal income tax regulations. |
| (e) | Where applicable, assumes the reinvestment of distributions. |
| (f) | Includes proceeds received from a class action litigation, which impacted the Fund’s total return. Not including these proceeds, the Fund’s total return would have been (9.92)% for the year ended March 31, 2023. |
| (g) | Includes payment received from an affiliate, which had no impact on the Fund’s total return. |
| (h) | Excludes fees and expenses incurred indirectly as a result of investments in underlying funds. |
| (i) | Portfolio turnover rate excludes in-kind transactions. |
See notes to financial statements.
FINANCIAL HIGHLIGHTS | 79 |
Financial Highlights (continued)
(For a share outstanding throughout each period)
| iShares Global Healthcare ETF | ||||||||||||||||||||||
|
| |||||||||||||||||||||
| | Year Ended 03/31/23 | | | Year Ended 03/31/22 | | | Year Ended 03/31/21 | | Year Ended 03/31/20 |
| | Year Ended 03/31/19 | (a) | |||||||||
| ||||||||||||||||||||||
Net asset value, beginning of year | $ | 87.41 | $ | 76.96 | $ | 60.95 | $ | 61.13 | $ | 55.61 | ||||||||||||
|
|
|
|
|
|
|
|
|
| |||||||||||||
Net investment income(b) | 1.11 | (c) | 1.07 | 1.02 | 0.96 | 0.92 | ||||||||||||||||
Net realized and unrealized gain (loss)(d) | (4.11 | ) | 10.39 | 15.96 | (0.16 | ) | 5.80 | |||||||||||||||
|
|
|
|
|
|
|
|
|
| |||||||||||||
Net increase (decrease) from investment operations | (3.00 | ) | 11.46 | 16.98 | 0.80 | 6.72 | ||||||||||||||||
|
|
|
|
|
|
|
|
|
| |||||||||||||
Distributions from net investment income(e) | (0.99 | ) | (1.01 | ) | (0.97 | ) | (0.98 | ) | (1.20 | ) | ||||||||||||
|
|
|
|
|
|
|
|
|
| |||||||||||||
Net asset value, end of year | $ | 83.42 | $ | 87.41 | $ | 76.96 | $ | 60.95 | $ | 61.13 | ||||||||||||
|
|
|
|
|
|
|
|
|
| |||||||||||||
Total Return(f) | ||||||||||||||||||||||
Based on net asset value | (3.44 | )%(c) | 14.94 | % | 28.03 | % | 1.23 | % | 12.29 | % | ||||||||||||
|
|
|
|
|
|
|
|
|
| |||||||||||||
Ratios to Average Net Assets(g) | ||||||||||||||||||||||
Total expenses | 0.42 | % | 0.40 | % | 0.43 | % | 0.46 | % | 0.46 | % | ||||||||||||
|
|
|
|
|
|
|
|
|
| |||||||||||||
Total expenses excluding professional fees for foreign withholding tax claims | 0.41 | % | N/A | N/A | N/A | N/A | ||||||||||||||||
|
|
|
|
|
|
|
|
|
| |||||||||||||
Net investment income | 1.34 | %(c) | 1.27 | % | 1.41 | % | 1.52 | % | 1.55 | % | ||||||||||||
|
|
|
|
|
|
|
|
|
| |||||||||||||
Supplemental Data | ||||||||||||||||||||||
Net assets, end of year (000) | $ | 4,083,256 | $ | 3,492,005 | $ | 2,705,201 | $ | 1,947,392 | $ | 2,121,287 | ||||||||||||
|
|
|
|
|
|
|
|
|
| |||||||||||||
Portfolio turnover rate(h) | 3 | % | 4 | % | 5 | % | 5 | % | 8 | % | ||||||||||||
|
|
|
|
|
|
|
|
|
| |||||||||||||
| (a) | Per share amounts reflect a two-for-one stock split effective after the close of trading on May 1, 2018. |
| (b) | Based on average shares outstanding. |
| (c) | Reflects the positive effect of foreign withholding tax claims, net of the associated professional fees, which resulted in the following increases for the year ended March 31, 2023: |
• Net investment income per share by $0.01.
• Total return by 0.01%.
• Ratio of net investment income to average net assets by 0.01%.
| (d) | The amounts reported for a share outstanding may not accord with the change in aggregate gains and losses in securities for the fiscal period due to the timing of capital share transactions in relation to the fluctuating market values of the Fund’s underlying securities. |
| (e) | Distributions for annual periods determined in accordance with U.S. federal income tax regulations. |
| (f) | Where applicable, assumes the reinvestment of distributions. |
| (g) | Excludes fees and expenses incurred indirectly as a result of investments in underlying funds. |
| (h) | Portfolio turnover rate excludes in-kind transactions. |
See notes to financial statements.
| 80 | 2 0 2 3 I SHARES ANNUAL REPORT TO SHAREHOLDERS |
Financial Highlights (continued)
(For a share outstanding throughout each period)
| iShares Global Industrials ETF | ||||||||||||||||||||
|
| |||||||||||||||||||
| Year Ended 03/31/23 | Year Ended 03/31/22 | Year Ended 03/31/21 | Year Ended 03/31/20 | Year Ended 03/31/19 | ||||||||||||||||
| ||||||||||||||||||||
Net asset value, beginning of year | $ | 115.84 | $ | 115.74 | $ | 71.50 | $ | 88.88 | $ | 91.22 | ||||||||||
|
|
|
|
|
|
|
|
|
| |||||||||||
Net investment income(a) | 1.77 | (b) | 1.53 | (b) | 1.32 | 1.61 | 1.65 | |||||||||||||
Net realized and unrealized gain (loss)(c) | (1.65 | ) | 0.32 | 44.27 | (17.32 | ) | (2.27 | ) | ||||||||||||
|
|
|
|
|
|
|
|
|
| |||||||||||
Net increase (decrease) from investment operations | 0.12 | 1.85 | 45.59 | (15.71 | ) | (0.62 | ) | |||||||||||||
|
|
|
|
|
|
|
|
|
| |||||||||||
Distributions from net investment income(d) | (1.74 | ) | (1.75 | ) | (1.35 | ) | (1.67 | ) | (1.72 | ) | ||||||||||
|
|
|
|
|
|
|
|
|
| |||||||||||
Net asset value, end of year | $ | 114.22 | $ | 115.84 | $ | 115.74 | $ | 71.50 | $ | 88.88 | ||||||||||
|
|
|
|
|
|
|
|
|
| |||||||||||
Total Return(e) | ||||||||||||||||||||
Based on net asset value | 0.22 | %(b) | 1.54 | %(b) | 64.27 | % | (18.08 | )% | (0.59 | )% | ||||||||||
|
|
|
|
|
|
|
|
|
| |||||||||||
Ratios to Average Net Assets(f) | ||||||||||||||||||||
Total expenses | 0.42 | % | 0.41 | % | 0.43 | % | 0.46 | % | 0.46 | % | ||||||||||
|
|
|
|
|
|
|
|
|
| |||||||||||
Total expenses excluding professional fees for foreign withholding tax claims | 0.41 | % | 0.40 | % | 0.43 | % | N/A | N/A | ||||||||||||
|
|
|
|
|
|
|
|
|
| |||||||||||
Net investment income | 1.69 | %(b) | 1.27 | %(b) | 1.34 | % | 1.75 | % | 1.87 | % | ||||||||||
|
|
|
|
|
|
|
|
|
| |||||||||||
Supplemental Data | ||||||||||||||||||||
Net assets, end of year (000) | $ | 336,958 | $ | 376,481 | $ | 422,466 | $ | 146,580 | $ | 217,744 | ||||||||||
|
|
|
|
|
|
|
|
|
| |||||||||||
Portfolio turnover rate(g) | 9 | % | 7 | % | 8 | % | 5 | % | 5 | % | ||||||||||
|
|
|
|
|
|
|
|
|
| |||||||||||
| (a) | Based on average shares outstanding. |
| (b) | Reflects the positive effect of foreign withholding tax claims, net of the associated professional fees, which resulted in the following increases for the year ended March 31, 2023 and March 31, 2022 respectively: |
• Net investment income per share by $0.02 and $0.05.
• Total return by 0.01% and 0.05%.
• Ratio of net investment income to average net assets by 0.01% and 0.04%.
| (c) | The amounts reported for a share outstanding may not accord with the change in aggregate gains and losses in securities for the fiscal period due to the timing of capital share transactions in relation to the fluctuating market values of the Fund’s underlying securities. |
| (d) | Distributions for annual periods determined in accordance with U.S. federal income tax regulations. |
| (e) | Where applicable, assumes the reinvestment of distributions. |
| (f) | Excludes fees and expenses incurred indirectly as a result of investments in underlying funds. |
| (g) | Portfolio turnover rate excludes in-kind transactions. |
See notes to financial statements.
FINANCIAL HIGHLIGHTS | 81 |
Financial Highlights (continued)
(For a share outstanding throughout each period)
| iShares Global Materials ETF | ||||||||||||||||||||||||||||||
| ||||||||||||||||||||||||||||||
| Year Ended 03/31/23 | Year Ended 03/31/22 | Year Ended 03/31/21 | Year Ended 03/31/20 | Year Ended 03/31/19 | ||||||||||||||||||||||||||
| ||||||||||||||||||||||||||||||
Net asset value, beginning of year | $ | 93.81 | $ | 86.59 | $ | 49.67 | $ | 64.22 | $ | 67.34 | ||||||||||||||||||||
|
|
|
|
|
|
|
|
|
| |||||||||||||||||||||
Net investment income(a) | 2.60 | (b) | 3.16 | (b) | 2.07 | 1.54 | 1.91 | |||||||||||||||||||||||
Net realized and unrealized gain (loss)(c) | (9.00 | ) | 7.23 | 35.84 | (13.63 | ) | (3.44 | ) | ||||||||||||||||||||||
|
|
|
|
|
|
|
|
|
| |||||||||||||||||||||
Net increase (decrease) from investment operations | (6.40 | ) | 10.39 | 37.91 | (12.09 | ) | (1.53 | ) | ||||||||||||||||||||||
|
|
|
|
|
|
|
|
|
| |||||||||||||||||||||
Distributions from net investment income(d) | (3.80 | ) | (3.17 | ) | (0.99 | ) | (2.46 | ) | (1.59 | ) | ||||||||||||||||||||
|
|
|
|
|
|
|
|
|
| |||||||||||||||||||||
Net asset value, end of year | $ | 83.61 | $ | 93.81 | $ | 86.59 | $ | 49.67 | $ | 64.22 | ||||||||||||||||||||
|
|
|
|
|
|
|
|
|
| |||||||||||||||||||||
Total Return(e) | ||||||||||||||||||||||||||||||
Based on net asset value | (6.77 | )%(b) | 12.19 | %(b) | 76.78 | % | (19.66 | )% | (2.14 | )% | ||||||||||||||||||||
|
|
|
|
|
|
|
|
|
| |||||||||||||||||||||
Ratios to Average Net Assets(f) | ||||||||||||||||||||||||||||||
Total expenses | 0.41 | % | 0.40 | % | 0.43 | % | 0.45 | % | 0.46 | % | ||||||||||||||||||||
|
|
|
|
|
|
|
|
|
| |||||||||||||||||||||
Total expenses excluding professional fees for foreign withholding tax claims | 0.41 | % | 0.40 | % | N/A | N/A | 0.46 | % | ||||||||||||||||||||||
|
|
|
|
|
|
|
|
|
| |||||||||||||||||||||
Net investment income | 3.20 | %(b) | 3.48 | %(b) | 2.76 | % | 2.43 | % | 2.91 | % | ||||||||||||||||||||
|
|
|
|
|
|
|
|
|
| |||||||||||||||||||||
Supplemental Data | ||||||||||||||||||||||||||||||
Net assets, end of year (000) | $ | 351,170 | $ | 727,028 | $ | 722,999 | $ | 129,132 | $ | 208,704 | ||||||||||||||||||||
|
|
|
|
|
|
|
|
|
| |||||||||||||||||||||
Portfolio turnover rate(g) | 9 | % | 6 | % | 4 | % | 12 | % | 11 | % | ||||||||||||||||||||
|
|
|
|
|
|
|
|
|
| |||||||||||||||||||||
| (a) | Based on average shares outstanding. |
| (b) | Reflects the positive effect of foreign withholding tax claims, net of the associated professional fees, which resulted in the following increases for the year ended March 31, 2023 and March 31, 2022 respectively: |
• Net investment income per share by $0.00 and $0.01.
• Total return by 0.01% and (0.01)%
• Ratio of net investment income to average net assets by 0.00% and 0.01%.
| (c) | The amounts reported for a share outstanding may not accord with the change in aggregate gains and losses in securities for the fiscal period due to the timing of capital share transactions in relation to the fluctuating market values of the Fund’s underlying securities. |
| (d) | Distributions for annual periods determined in accordance with U.S. federal income tax regulations. |
| (e) | Where applicable, assumes the reinvestment of distributions. |
| (f) | Excludes fees and expenses incurred indirectly as a result of investments in underlying funds. |
| (g) | Portfolio turnover rate excludes in-kind transactions. |
See notes to financial statements.
| 82 | 2 0 2 3 I SHARES ANNUAL REPORT TO SHAREHOLDERS |
Financial Highlights (continued)
(For a share outstanding throughout each period)
| iShares Global Tech ETF | ||||||||||||||||||||
|
| |||||||||||||||||||
| | Year Ended 03/31/23 | | | Year Ended 03/31/22 | (a) | | Year Ended 03/31/21 | (a) | | Year Ended 03/31/20 | (a) | | Year Ended 03/31/19 | (a) | ||||||
| ||||||||||||||||||||
Net asset value, beginning of year | $ | 57.86 | $ | 51.13 | $ | 30.49 | $ | 28.48 | $ | 26.31 | ||||||||||
|
|
|
|
|
|
|
|
|
| |||||||||||
Net investment income(b) | 0.37 | (c) | 0.29 | (c) | 0.33 | 0.38 | 0.30 | |||||||||||||
Net realized and unrealized gain (loss)(d) | (3.51 | ) | 6.81 | 20.62 | 2.00 | 2.10 | ||||||||||||||
|
|
|
|
|
|
|
|
|
| |||||||||||
Net increase (decrease) from investment operations | (3.14 | ) | 7.10 | 20.95 | 2.38 | 2.40 | ||||||||||||||
|
|
|
|
|
|
|
|
|
| |||||||||||
Distributions from net investment income(e) | (0.36 | ) | (0.37 | ) | (0.31 | ) | (0.37 | ) | (0.23 | ) | ||||||||||
|
|
|
|
|
|
|
|
|
| |||||||||||
Net asset value, end of year | $ | 54.36 | $ | 57.86 | $ | 51.13 | $ | 30.49 | $ | 28.48 | ||||||||||
|
|
|
|
|
|
|
|
|
| |||||||||||
Total Return(f) | ||||||||||||||||||||
Based on net asset value | (5.34 | )%(c) | 13.89 | %(c) | 68.97 | % | 8.33 | % | 9.19 | % | ||||||||||
|
|
|
|
|
|
|
|
|
| |||||||||||
Ratios to Average Net Assets(g) | ||||||||||||||||||||
Total expenses | 0.41 | % | 0.40 | % | 0.43 | % | 0.46 | % | 0.46 | % | ||||||||||
|
|
|
|
|
|
|
|
|
| |||||||||||
Total expenses excluding professional fees for foreign withholding tax claims | 0.41 | % | 0.40 | % | 0.43 | % | N/A | 0.46 | % | |||||||||||
|
|
|
|
|
|
|
|
|
| |||||||||||
Net investment income | 0.77 | %(c) | 0.50 | %(c) | 0.75 | % | 1.21 | % | 1.09 | % | ||||||||||
|
|
|
|
|
|
|
|
|
| |||||||||||
Supplemental Data | ||||||||||||||||||||
Net assets, end of year (000) | $ | 3,177,616 | $ | 5,001,963 | $ | 5,046,541 | $ | 2,752,872 | $ | 2,819,178 | ||||||||||
|
|
|
|
|
|
|
|
|
| |||||||||||
Portfolio turnover rate(h) | 12 | % | 7 | % | 4 | % | 7 | % | 17 | % | ||||||||||
|
|
|
|
|
|
|
|
|
| |||||||||||
| (a) | Per share amounts reflect a six-for-one stock split effective after the close of trading on July 16, 2021. |
| (b) | Based on average shares outstanding. |
| (c) | Reflects the positive effect of foreign withholding tax claims, net of the associated professional fees, which resulted in the following increases for the year ended March 31, 2023 and March 31, 2022 respectively: |
• Net investment income per share by $0.00 and $0.00.
• Total return by 0.01% and 0.01%.
• Ratio of net investment income to average net assets by 0.00% and 0.00%.
| (d) | The amounts reported for a share outstanding may not accord with the change in aggregate gains and losses in securities for the fiscal period due to the timing of capital share transactions in relation to the fluctuating market values of the Fund’s underlying securities. |
| (e) | Distributions for annual periods determined in accordance with U.S. federal income tax regulations. |
| (f) | Where applicable, assumes the reinvestment of distributions. |
| (g) | Excludes fees and expenses incurred indirectly as a result of investments in underlying funds. |
| (h) | Portfolio turnover rate excludes in-kind transactions. |
See notes to financial statements.
FINANCIAL HIGHLIGHTS | 83 |
Financial Highlights (continued)
(For a share outstanding throughout each period)
| iShares Global Utilities ETF | ||||||||||||||||||||||||||||||
| ||||||||||||||||||||||||||||||
| Year Ended 03/31/23 | Year Ended 03/31/22 | Year Ended 03/31/21 | Year Ended 03/31/20 | Year Ended 03/31/19 | ||||||||||||||||||||||||||
| ||||||||||||||||||||||||||||||
Net asset value, beginning of year | $ | 65.60 | $ | 60.51 | $ | 50.71 | $ | 54.08 | $ | 48.78 | ||||||||||||||||||||
|
|
|
|
|
|
|
|
|
| |||||||||||||||||||||
Net investment income(a) | 1.86 | (b) | 1.81 | 1.71 | 1.62 | 1.78 | ||||||||||||||||||||||||
Net realized and unrealized gain (loss)(c) | (5.06 | ) | 5.08 | 9.68 | (2.98 | ) | 5.07 | |||||||||||||||||||||||
|
|
|
|
|
|
|
|
|
| |||||||||||||||||||||
Net increase (decrease) from investment operations | (3.20 | ) | 6.89 | 11.39 | (1.36 | ) | 6.85 | |||||||||||||||||||||||
|
|
|
|
|
|
|
|
|
| |||||||||||||||||||||
Distributions from net investment income(d) | (1.89 | ) | (1.80 | ) | (1.59 | ) | (2.01 | ) | (1.55 | ) | ||||||||||||||||||||
|
|
|
|
|
|
|
|
|
| |||||||||||||||||||||
Net asset value, end of year | $ | 60.51 | $ | 65.60 | $ | 60.51 | $ | 50.71 | $ | 54.08 | ||||||||||||||||||||
|
|
|
|
|
|
|
|
|
| |||||||||||||||||||||
Total Return(e) | ||||||||||||||||||||||||||||||
Based on net asset value | (4.93 | )%(b) | 11.59 | % | 22.70 | % | (2.84 | )% | 14.40 | % | ||||||||||||||||||||
|
|
|
|
|
|
|
|
|
| |||||||||||||||||||||
Ratios to Average Net Assets(f) | ||||||||||||||||||||||||||||||
Total expenses | 0.43 | % | 0.42 | % | 0.43 | % | 0.46 | % | 0.46 | % | ||||||||||||||||||||
|
|
|
|
|
|
|
|
|
| |||||||||||||||||||||
Total expenses excluding professional fees for foreign withholding tax claims | 0.41 | % | N/A | N/A | N/A | 0.46 | % | |||||||||||||||||||||||
|
|
|
|
|
|
|
|
|
| |||||||||||||||||||||
Net investment income | 3.06 | %(b) | 2.91 | % | 3.03 | % | 2.87 | % | 3.53 | % | ||||||||||||||||||||
|
|
|
|
|
|
|
|
|
| |||||||||||||||||||||
Supplemental Data | ||||||||||||||||||||||||||||||
Net assets, end of year (000) | $ | 136,156 | $ | 180,402 | $ | 151,268 | $ | 152,123 | $ | 208,222 | ||||||||||||||||||||
|
|
|
|
|
|
|
|
|
| |||||||||||||||||||||
Portfolio turnover rate(g) | 9 | % | 9 | % | 7 | % | 6 | % | 8 | % | ||||||||||||||||||||
|
|
|
|
|
|
|
|
|
| |||||||||||||||||||||
| (a) | Based on average shares outstanding. |
| (b) | Reflects the positive effect of foreign withholding tax claims, net of the associated professional fees, which resulted in the following increases for the year ended March 31, 2023: |
• Net investment income per share by $0.06.
• Total return by 0.12%.
• Ratio of net investment income to average net assets by 0.11%.
| (c) | The amounts reported for a share outstanding may not accord with the change in aggregate gains and losses in securities for the fiscal period due to the timing of capital share transactions in relation to the fluctuating market values of the Fund’s underlying securities. |
| (d) | Distributions for annual periods determined in accordance with U.S. federal income tax regulations. |
| (e) | Where applicable, assumes the reinvestment of distributions. |
| (f) | Excludes fees and expenses incurred indirectly as a result of investments in underlying funds. |
| (g) | Portfolio turnover rate excludes in-kind transactions. |
See notes to financial statements.
| 84 | 2 0 2 3 I SHARES ANNUAL REPORT TO SHAREHOLDERS |
| 1. | ORGANIZATION |
iShares Trust (the “Trust”) is registered under the Investment Company Act of 1940, as amended (the “1940 Act”), as an open-end management investment company. The Trust is organized as a Delaware statutory trust and is authorized to have multiple series or portfolios.
These financial statements relate only to the following funds (each, a “Fund” and collectively, the “Funds”):
| iShares ETF | Diversification Classification | |
Global Comm Services | Non-diversified | |
Global Consumer Discretionary | Diversified | |
Global Consumer Staples | Diversified | |
Global Energy | Non-diversified | |
Global Financials | Diversified | |
Global Healthcare | Diversified | |
Global Industrials | Diversified | |
Global Materials | Diversified | |
Global Tech | Non-diversified | |
Global Utilities | Diversified | |
| 2. | SIGNIFICANT ACCOUNTING POLICIES |
The financial statements are prepared in conformity with accounting principles generally accepted in the United States of America (“U.S. GAAP”), which may require management to make estimates and assumptions that affect the reported amounts of assets and liabilities in the financial statements, disclosure of contingent assets and liabilities at the date of the financial statements and the reported amounts of increases and decreases in net assets from operations during the reporting period. Actual results could differ from those estimates. Each Fund is considered an investment company under U.S. GAAP and follows the accounting and reporting guidance applicable to investment companies. Below is a summary of significant accounting policies:
Investment Transactions and Income Recognition: For financial reporting purposes, investment transactions are recorded on the dates the transactions are executed. Realized gains and losses on investment transactions are determined using the specific identification method. Dividend income and capital gain distributions, if any, are recorded on the ex-dividend date. Non-cash dividends, if any, are recorded on the ex-dividend date at fair value. Dividends from foreign securities where the ex-dividend date may have passed are subsequently recorded when the Funds are informed of the ex-dividend date. Under the applicable foreign tax laws, a withholding tax at various rates may be imposed on capital gains, dividends and interest. Upon notification from issuers or as estimated by management, a portion of the dividend income received from a real estate investment trust may be redesignated as a reduction of cost of the related investment and/or realized gain.
Foreign Currency Translation: Each Fund’s books and records are maintained in U.S. dollars. Securities and other assets and liabilities denominated in foreign currencies are translated into U.S. dollars using prevailing market rates as quoted by one or more data service providers. Purchases and sales of investments are recorded at the rates of exchange prevailing on the respective dates of such transactions. Generally, when the U.S. dollar rises in value against a foreign currency, the investments denominated in that currency will lose value; the opposite effect occurs if the U.S. dollar falls in relative value.
Each Fund does not isolate the effect of fluctuations in foreign exchange rates from the effect of fluctuations in the market prices of investments for financial reporting purposes. Accordingly, the effects of changes in exchange rates on investments are not segregated in the Statements of Operations from the effects of changes in market prices of those investments, but are included as a component of net realized and unrealized gain (loss) from investments. Each Fund reports realized currency gains (losses) on foreign currency related transactions as components of net realized gain (loss) for financial reporting purposes, whereas such components are generally treated as ordinary income for U.S. federal income tax purposes.
Foreign Taxes: The Funds may be subject to foreign taxes (a portion of which may be reclaimable) on income, stock dividends, capital gains on investments, or certain foreign currency transactions. All foreign taxes are recorded in accordance with the applicable foreign tax regulations and rates that exist in the foreign jurisdictions in which each Fund invests. These foreign taxes, if any, are paid by each Fund and are reflected in its Statements of Operations as follows: foreign taxes withheld at source are presented as a reduction of income, foreign taxes on securities lending income are presented as a reduction of securities lending income, foreign taxes on stock dividends are presented as “Other foreign taxes”, and foreign taxes on capital gains from sales of investments and foreign taxes on foreign currency transactions are included in their respective net realized gain (loss) categories. Foreign taxes payable or deferred as of March 31, 2023, if any, are disclosed in the Statements of Assets and Liabilities.
The Funds file withholding tax reclaims in certain jurisdictions to recover a portion of amounts previously withheld. The Funds may record a reclaim receivable based on collectability, which includes factors such as the jurisdiction’s applicable laws, payment history and market convention. The Statements of Operations includes tax reclaims recorded as well as professional and other fees, if any, associated with recovery of foreign withholding taxes.
Collateralization: If required by an exchange or counterparty agreement, the Funds may be required to deliver/deposit cash and/or securities to/with an exchange, or broker-dealer or custodian as collateral for certain investments.
In-kind Redemptions: For financial reporting purposes, in-kind redemptions are treated as sales of securities resulting in realized capital gains or losses to the Funds. Because such gains or losses are not taxable to the Funds and are not distributed to existing Fund shareholders, the gains or losses are reclassified from accumulated net realized gain (loss) to paid-in capital at the end of the Funds’ tax year. These reclassifications have no effect on net assets or net asset value (“NAV”) per share.
NOTES TO FINANCIAL STATEMENTS | 85 |
Notes to Financial Statements (continued)
Distributions: Dividends and distributions paid by each Fund are recorded on the ex-dividend dates. Distributions are determined on a tax basis and may differ from net investment income and net realized capital gains for financial reporting purposes. Dividends and distributions are paid in U.S. dollars and cannot be automatically reinvested in additional shares of the Funds. The character and timing of distributions are determined in accordance with U.S. federal income tax regulations, which may differ from U.S. GAAP.
Indemnifications: In the normal course of business, each Fund enters into contracts that contain a variety of representations that provide general indemnification. The Funds’ maximum exposure under these arrangements is unknown because it involves future potential claims against the Funds, which cannot be predicted with any certainty.
| 3. | INVESTMENT VALUATION AND FAIR VALUE MEASUREMENTS |
Investment Valuation Policies: Each Fund’s investments are valued at fair value (also referred to as “market value” within the financial statements) each day that the Fund’s listing exchange is open and, for financial reporting purposes, as of the report date. U.S. GAAP defines fair value as the price a fund would receive to sell an asset or pay to transfer a liability in an orderly transaction between market participants at the measurement date. The Board of Trustees of the Trust (the “Board”) of each Fund has approved the designation of BlackRock Fund Advisors (“BFA”), the Funds’ investment adviser, as the valuation designee for each Fund. Each Fund determines the fair values of its financial instruments using various independent dealers or pricing services under BFA’s policies. If a security’s market price is not readily available or does not otherwise accurately represent the fair value of the security, the security will be valued in accordance with BFA’s policies and procedures as reflecting fair value. BFA has formed a committee (the “Valuation Committee”) to develop pricing policies and procedures and to oversee the pricing function for all financial instruments, with assistance from other BlackRock pricing committees.
Fair Value Inputs and Methodologies: The following methods and inputs are used to establish the fair value of each Fund’s assets and liabilities:
| • | Equity investments traded on a recognized securities exchange are valued at that day’s official closing price, as applicable, on the exchange where the stock is primarily traded. Equity investments traded on a recognized exchange for which there were no sales on that day are valued at the last traded price. |
| • | Investments in open-end U.S. mutual funds (including money market funds) are valued at that day’s published NAV. |
| • | Futures contracts are valued based on that day’s last reported settlement or trade price on the exchange where the contract is traded. |
Generally, trading in foreign instruments is substantially completed each day at various times prior to the close of trading on the New York Stock Exchange (“NYSE”).Each business day, the Funds use current market factors supplied by independent pricing services to value certain foreign instruments (“Systematic Fair Value Price”).The Systematic Fair Value Price is designed to value such foreign securities at fair value as of the close of trading on the NYSE, which follows the close of the local markets.
If events (e.g., market volatility, company announcement or a natural disaster) occur that are expected to materially affect the value of such investment, or in the event that application of these methods of valuation results in a price for an investment that is deemed not to be representative of the market value of such investment, or if a price is not available, the investment will be valued by the Valuation Committee, in accordance with BFA’s policies and procedures as reflecting fair value (“Fair Valued Investments”).The fair valuation approaches that may be used by the Valuation Committee include market approach, income approach and cost approach. Valuation techniques such as discounted cash flow, use of market comparables and matrix pricing are types of valuation approaches and are typically used in determining fair value. When determining the price for Fair Valued Investments, the Valuation Committee seeks to determine the price that each Fund might reasonably expect to receive or pay from the current sale or purchase of that asset or liability in an arm’s-length transaction. Fair value determinations shall be based upon all available factors that the Valuation Committee deems relevant and consistent with the principles of fair value measurement.
Fair value pricing could result in a difference between the prices used to calculate a fund’s NAV and the prices used by the fund’s underlying index, which in turn could result in a difference between the fund’s performance and the performance of the fund’s underlying index.
Fair Value Hierarchy: Various inputs are used in determining the fair value of financial instruments. These inputs to valuation techniques are categorized into a fair value hierarchy consisting of three broad levels for financial reporting purposes as follows:
| • | Level 1 – Unadjusted price quotations in active markets/exchanges for identical assets or liabilities that each Fund has the ability to access; |
| • | Level 2 – Other observable inputs (including, but not limited to, quoted prices for similar assets or liabilities in markets that are active, quoted prices for identical or similar assets or liabilities in markets that are not active, inputs other than quoted prices that are observable for the assets or liabilities (such as interest rates, yield curves, volatilities, prepayment speeds, loss severities, credit risks and default rates) or other market-corroborated inputs); and |
| • | Level 3 – Unobservable inputs based on the best information available in the circumstances, to the extent observable inputs are not available, (including the Valuation Committee’s assumptions used in determining the fair value of financial instruments). |
The hierarchy gives the highest priority to unadjusted quoted prices in active markets for identical assets or liabilities (Level 1 measurements) and the lowest priority to unobservable inputs (Level 3 measurements). Accordingly, the degree of judgment exercised in determining fair value is greatest for instruments categorized in Level 3. The inputs used to measure fair value may fall into different levels of the fair value hierarchy. In such cases, for disclosure purposes, the fair value hierarchy classification is determined based on the lowest level input that is significant to the fair value measurement in its entirety. Investments classified within Level 3 have significant unobservable inputs used by the Valuation Committee in determining the price for Fair Valued Investments. Level 3 investments include equity or debt issued by privately held companies or funds that may not have a secondary market and/or may have a limited number of investors. The categorization of a value determined for financial instruments is based on the pricing transparency of the financial instruments and is not necessarily an indication of the risks associated with investing in those securities.
| 86 | 2 0 2 3 I SHARES ANNUAL REPORT TO SHAREHOLDERS |
Notes to Financial Statements (continued)
| 4. | SECURITIES AND OTHER INVESTMENTS |
Securities Lending: Each Fund may lend its securities to approved borrowers, such as brokers, dealers and other financial institutions. The borrower pledges and maintains with the Fund collateral consisting of cash, an irrevocable letter of credit issued by an approved bank, or securities issued or guaranteed by the U.S. government. The initial collateral received by each Fund is required to have a value of at least 102% of the current market value of the loaned securities for securities traded on U.S. exchanges and a value of at least 105% for all other securities. The collateral is maintained thereafter at a value equal to at least 100% of the current value of the securities on loan. The market value of the loaned securities is determined at the close of each business day of the Fund and any additional required collateral is delivered to the Fund or excess collateral is returned by the Fund, on the next business day. During the term of the loan, each Fund is entitled to all distributions made on or in respect of the loaned securities but does not receive interest income on securities received as collateral. Loans of securities are terminable at any time and the borrower, after notice, is required to return borrowed securities within the standard time period for settlement of securities transactions.
As of period end, any securities on loan were collateralized by cash and/or U.S. Government obligations. Cash collateral invested in money market funds managed by BFA, or its affiliates is disclosed in the Schedule of Investments. Any non-cash collateral received cannot be sold, re-invested or pledged by the Fund, except in the event of borrower default. The securities on loan, if any, are also disclosed in each Fund’s Schedule of Investments. The market value of any securities on loan and the value of any related cash collateral are disclosed in the Statements of Assets and Liabilities.
Securities lending transactions are entered into by the Funds under Master Securities Lending Agreements (each, an “MSLA”) which provide the right, in the event of default (including bankruptcy or insolvency) for the non-defaulting party to liquidate the collateral and calculate a net exposure to the defaulting party or request additional collateral. In the event that a borrower defaults, the Funds, as lender, would offset the market value of the collateral received against the market value of the securities loaned. When the value of the collateral is greater than that of the market value of the securities loaned, the lender is left with a net amount payable to the defaulting party. However, bankruptcy or insolvency laws of a particular jurisdiction may impose restrictions on or prohibitions against such a right of offset in the event of an MSLA counterparty’s bankruptcy or insolvency. Under the MSLA, absent an event of default, the borrower can resell or re-pledge the loaned securities, and the Funds can reinvest cash collateral received in connection with loaned securities. Upon an event of default, the parties’ obligations to return the securities or collateral to the other party are extinguished, and the parties can resell or re-pledge the loaned securities or the collateral received in connection with the loaned securities in order to satisfy the defaulting party’s net payment obligation for all transactions under the MSLA. The defaulting party remains liable for any deficiency.
As of period end, the following table is a summary of the securities on loan by counterparty which are subject to offset under an MSLA:
| ||||||||||||||||
| iShares ETF and Counterparty | | Securities Loaned at Value |
| | Cash Collateral Received | (a) | | Non-Cash Collateral Received, at Fair Value | (a) | Net Amount | ||||||
| ||||||||||||||||
Global Comm Services | ||||||||||||||||
BofA Securities, Inc. | $ | 13,800 | $ | (13,800 | ) | $ | — | $ | — | |||||||
Goldman Sachs &Co. LLC | 10,593 | (10,593 | ) | — | — | |||||||||||
J.P. Morgan Securities LLC | 13,940 | (13,940 | ) | — | — | |||||||||||
Morgan Stanley | 974,131 | (974,131 | ) | — | — | |||||||||||
|
|
|
|
|
|
|
| |||||||||
| $ | 1,012,464 | $ | (1,012,464 | ) | $ | — | $ | — | ||||||||
|
|
|
|
|
|
|
| |||||||||
Global Consumer Discretionary | ||||||||||||||||
Citigroup Global Markets Inc. | $ | 481,264 | $ | (466,777 | ) | $ | — | $ | 14,487 | (b) | ||||||
Nomura Securities International, Inc. | 123,830 | (123,830 | ) | — | — | |||||||||||
TD Prime Services LLC | 69,229 | (67,307 | ) | — | 1,922 | (b) | ||||||||||
UBS AG | 790,073 | (787,315 | ) | — | 2,758 | (b) | ||||||||||
|
|
|
|
|
|
|
| |||||||||
| $ | 1,464,396 | $ | (1,445,229 | ) | $ | — | $ | 19,167 | ||||||||
|
|
|
|
|
|
|
| |||||||||
Global Financials | ||||||||||||||||
BofA Securities, Inc. | $ | 10,218 | $ | (10,218 | ) | $ | — | $ | — | |||||||
Citigroup Global Markets Inc. | 557,959 | (557,959 | ) | — | — | |||||||||||
J.P. Morgan Securities LLC | 60,990 | (60,990 | ) | — | — | |||||||||||
UBS AG | 133,954 | (133,954 | ) | — | — | |||||||||||
|
|
|
|
|
|
|
| |||||||||
| $ | 763,121 | $ | (763,121 | ) | $ | — | $ | — | ||||||||
|
|
|
|
|
|
|
| |||||||||
Global Healthcare | ||||||||||||||||
BofA Securities, Inc. | $ | 936,215 | $ | (936,215 | ) | $ | — | $ | — | |||||||
Citigroup Global Markets, Inc. | 16,638,303 | (16,638,303 | ) | — | — | |||||||||||
J.P. Morgan Securities LLC | 6,854,059 | (6,854,059 | ) | — | — | |||||||||||
Morgan Stanley & Co. LLC | 3,878,639 | (3,878,639 | ) | — | — | |||||||||||
Virtu Americas LLC | 243,978 | (243,978 | ) | — | — | |||||||||||
|
|
|
|
|
|
|
| |||||||||
| $ | 28,551,194 | $ | (28,551,194 | ) | $ | — | $ | — | ||||||||
|
|
|
|
|
|
|
| |||||||||
NOTES TO FINANCIAL STATEMENTS | 87 |
Notes to Financial Statements (continued)
| ||||||||||||||||
| iShares ETF and Counterparty | | Securities Loaned at Value |
| | Cash Collateral Received | (a) | | Non-Cash Collateral Received, at Fair Value | (a) | Net Amount | ||||||
| ||||||||||||||||
Global Industrials | ||||||||||||||||
BNP Paribas Prime Brokerage International Ltd. | $ | 264,012 | $ | (264,012 | ) | $ | — | $ | — | |||||||
J.P. Morgan Securities LLC | 1,439,970 | (1,439,970 | ) | — | — | |||||||||||
Morgan Stanley | 1,837,809 | (1,837,676 | ) | — | 133 | (b) | ||||||||||
UBS Securities LLC | 56,197 | (56,197 | ) | — | — | |||||||||||
Wells Fargo Bank N.A. | 207,438 | (207,438 | ) | — | — | |||||||||||
|
|
|
|
|
|
|
| |||||||||
| $ | 3,805,426 | $ | (3,805,293 | ) | $ | — | $ | 133 | ||||||||
|
|
|
|
|
|
|
| |||||||||
Global Materials | ||||||||||||||||
Citigroup Global Markets Inc. | $ | 1,611,959 | $ | (1,611,959 | ) | $ | — | $ | — | |||||||
|
|
|
|
|
|
|
| |||||||||
Global Tech | ||||||||||||||||
Goldman Sachs & Co. LLC | $ | 3,725,819 | $ | (3,710,104 | ) | $ | — | $ | 15,715 | (b) | ||||||
Morgan Stanley | 2,600,335 | (2,553,766 | ) | — | 46,569 | (b) | ||||||||||
|
|
|
|
|
|
|
| |||||||||
| $ | 6,326,154 | $ | (6,263,870 | ) | $ | — | $ | 62,284 | ||||||||
|
|
|
|
|
|
|
| |||||||||
| (a) | Collateral received, if any, in excess of the market value of securities on loan is not presented in this table. The total cash collateral received by each Fund is disclosed in the Fund’s Statements of Assets and Liabilities. |
| (b) | The market value of the loaned securities is determined as of March 31, 2023. Additional collateral is delivered to the Fund on the next business day in accordance with the MSLA. The net amount would be subject to the borrower default indemnity in the event of default by a counterparty. |
The risks of securities lending include the risk that the borrower may not provide additional collateral when required or may not return the securities when due. To mitigate these risks, each Fund benefits from a borrower default indemnity provided by BlackRock, Inc. (“BlackRock”). BlackRock’s indemnity allows for full replacement of the securities loaned to the extent the collateral received does not cover the value of the securities loaned in the event of borrower default. Each Fund could incur a loss if the value of an investment purchased with cash collateral falls below the market value of the loaned securities or if the value of an investment purchased with cash collateral falls below the value of the original cash collateral received. Such losses are borne entirely by each Fund.
| 5. | DERIVATIVE FINANCIAL INSTRUMENTS |
Futures Contracts: Futures contracts are purchased or sold to gain exposure to, or manage exposure to, changes in interest rates (interest rate risk) and changes in the value of equity securities (equity risk) or foreign currencies (foreign currency exchange rate risk).
Futures contracts are exchange-traded agreements between the Funds and a counterparty to buy or sell a specific quantity of an underlying instrument at a specified price and on a specified date. Depending on the terms of a contract, it is settled either through physical delivery of the underlying instrument on the settlement date or by payment of a cash amount on the settlement date. Upon entering into a futures contract, the Funds are required to deposit initial margin with the broker in the form of cash or securities in an amount that varies depending on a contract’s size and risk profile. The initial margin deposit must then be maintained at an established level over the life of the contract. Amounts pledged, which are considered restricted, are included in cash pledged for futures contracts in the Statements of Assets and Liabilities.
Securities deposited as initial margin are designated in the Schedule of Investments and cash deposited, if any, are shown as cash pledged for futures contracts in the Statements of Assets and Liabilities. Pursuant to the contract, the Funds agree to receive from or pay to the broker an amount of cash equal to the daily fluctuation in market value of the contract (“variation margin”). Variation margin is recorded as unrealized appreciation (depreciation) and, if any, shown as variation margin receivable (or payable) on futures contracts in the Statements of Assets and Liabilities. When the contract is closed, a realized gain or loss is recorded in the Statements of Operations equal to the difference between the notional amount of the contract at the time it was opened and the notional amount at the time it was closed. The use of futures contracts involves the risk of an imperfect correlation in the movements in the price of futures contracts and interest rates, foreign currency exchange rates or underlying assets.
| 6. | INVESTMENT ADVISORY AGREEMENT AND OTHER TRANSACTIONS WITH AFFILIATES |
Investment Advisory Fees: Pursuant to an Investment Advisory Agreement with the Trust, BFA manages the investment of each Fund’s assets. BFA is a California corporation indirectly owned by BlackRock. Under the Investment Advisory Agreement, BFA is responsible for substantially all expenses of the Funds, except (i) interest and taxes; (ii) brokerage commissions and other expenses connected with the execution of portfolio transactions; (iii) distribution fees; (iv) the advisory fee payable to BFA; and (v) litigation expenses and any extraordinary expenses (in each case as determined by a majority of the independent trustees).
| 88 | 2 0 2 3 I SHARES ANNUAL REPORT TO SHAREHOLDERS |
Notes to Financial Statements (continued)
For its investment advisory services to each Fund, BFA is entitled to an annual investment advisory fee, accrued daily and paid monthly by the Funds, based on each Fund’s allocable portion of the aggregate of the average daily net assets of the Fund and certain other iShares funds as follows:
| Aggregate Average Daily Net Assets | Investment Advisory Fees | |||
First $10 billion | 0.4800% | |||
Over $10 billion, up to and including $20 billion | 0.4300 | |||
Over $20 billion, up to and including $30 billion | 0.3800 | |||
Over $30 billion, up to and including $40 billion | 0.3420 | |||
Over $40 billion | 0.3078 | |||
Distributor: BlackRock Investments, LLC, an affiliate of BFA, is the distributor for each Fund. Pursuant to the distribution agreement, BFA is responsible for any fees or expenses for distribution services provided to the Funds.
Securities Lending: The U.S. Securities and Exchange Commission (the “SEC”) has issued an exemptive order which permits BlackRock Institutional Trust Company, N.A. (“BTC”), an affiliate of BFA, to serve as securities lending agent for the Funds, subject to applicable conditions. As securities lending agent, BTC bears all operational costs directly related to securities lending, including any custodial costs. Each Fund is responsible for fees in connection with the investment of cash collateral received for securities on loan (the “collateral investment fees”). The cash collateral is invested in a money market fund, BlackRock Cash Funds: Institutional or BlackRock Cash Funds: Treasury, managed by BFA, or its affiliates. However, BTC has agreed to reduce the amount of securities lending income it receives in order to effectively limit the collateral investment fees each Fund bears to an annual rate of 0.04%. The SL Agency Shares of such money market fund will not be subject to a sales load, distribution fee or service fee. The money market fund in which the cash collateral has been invested may, under certain circumstances, impose a liquidity fee of up to 2% of the value redeemed or temporarily restrict redemptions for up to 10 business days during a 90 day period, in the event that the money market fund’s weekly liquid assets fall below certain thresholds.
Securities lending income is equal to the total of income earned from the reinvestment of cash collateral, net of fees and other payments to and from borrowers of securities, and less the collateral investment fees. Each Fund retains a portion of securities lending income and remits the remaining portion to BTC as compensation for its services as securities lending agent.
Pursuant to the current securities lending agreement, each of iShares Global Healthcare ETF and iShares Global Tech ETF (the “Group 1 Funds”), retains 81% of securities lending income (which excludes collateral investment fees) and the amount retained can never be less than 70% of the total of securities lending income plus the collateral investment fees.
Pursuant to the current securities lending agreement, each of iShares Global Comm Services ETF, iShares Global Consumer Discretionary ETF, iShares Global Consumer Staples ETF, iShares Global Energy ETF, iShares Global Financials ETF, iShares Global Industrials ETF, iShares Global Materials ETF and iShares Global Utilities ETF (the “Group 2 Funds”), retains 82% of securities lending income (which excludes collateral investment fees) and the amount retained can never be less than 70% of the total of securities lending income plus the collateral investment fees.
In addition, commencing the business day following the date that the aggregate securities lending income plus the collateral investment fees generated across all 1940 Act iShares exchange-traded funds (the “iShares ETF Complex”) in a given calendar year exceeds a specified threshold: (1) each Group 1 Fund, pursuant to the securities lending agreement, will retain for the remainder of that calendar year 81% of securities lending income (which excludes collateral investment fees), and the amount retained can never be less than 70% of the total of securities lending income plus the collateral investment fees, and (2) each Group 2 Fund will retain for the remainder of that calendar year 85% of securities lending income (which excludes collateral investment fees), and the amount retained can never be less than 70% of the total of securities lending income plus the collateral investment fees.
The share of securities lending income earned by each Fund is shown as securities lending income – affiliated – net in its Statements of Operations. For the year ended March 31, 2023, the Funds paid BTC the following amounts for securities lending agent services:
| iShares ETF | Amounts | |||
Global Comm Services | $ | 3,103 | ||
Global Consumer Discretionary | 4,017 | |||
Global Consumer Staples | 2,630 | |||
Global Energy | 1,459 | |||
Global Financials | 2,211 | |||
Global Healthcare | 18,294 | |||
Global Industrials | 4,438 | |||
Global Materials | 1,447 | |||
Global Tech | 23,528 | |||
Global Utilities | 402 | |||
Officers and Trustees: Certain officers and/or trustees of the Trust are officers and/or trustees of BlackRock or its affiliates.
NOTES TO FINANCIAL STATEMENTS | 89 |
Notes to Financial Statements (continued)
Other Transactions: Cross trading is the buying or selling of portfolio securities between funds to which BFA (or an affiliate) serves as investment adviser. At its regularly scheduled quarterly meetings, the Board reviews such transactions as of the most recent calendar quarter for compliance with the requirements and restrictions set forth by Rule 17a-7.
For the year ended March 31, 2023, transactions executed by the Funds pursuant to Rule 17a-7 under the 1940 Act were as follows:
| iShares ETF | Purchases | Sales | Net Realized Gain (Loss) | |||||||||
Global Comm Services | $ | 9,635,480 | $ | 7,713,786 | $ | (4,889,566) | ||||||
Global Consumer Discretionary | 21,053,573 | 22,101,806 | (6,882,298) | |||||||||
Global Consumer Staples | 56,729,191 | 52,510,037 | (7,946,863) | |||||||||
Global Energy | 39,702,884 | 19,999,537 | (3,100,559) | |||||||||
Global Financials | 58,888,933 | 21,508,660 | (7,361,695) | |||||||||
Global Healthcare | 37,288,686 | 16,537,438 | (4,397,647) | |||||||||
Global Industrials | 12,313,240 | 7,786,297 | (1,665,196) | |||||||||
Global Materials | 2,705,856 | 1,888,509 | (353,981) | |||||||||
Global Tech | 136,398,411 | 92,127,955 | (15,910,045) | |||||||||
Global Utilities | 1,742,638 | 2,673,424 | (268,040) | |||||||||
Each Fund may invest its positive cash balances in certain money market funds managed by BFA or an affiliate. The income earned on these temporary cash investments is shown as dividends – affiliated in the Statements of Operations.
A fund, in order to improve its portfolio liquidity and its ability to track its underlying index, may invest in shares of other iShares funds that invest in securities in the fund’s underlying index.
| 7. | PURCHASES AND SALES |
For the year ended March 31, 2023, purchases and sales of investments, excluding short-term securities and in-kind transactions, were as follows:
| iShares ETF | Purchases | Sales | ||||||
Global Comm Services | $ | 62,342,905 | $ | 34,070,596 | ||||
Global Consumer Discretionary | 69,198,508 | 52,005,291 | ||||||
Global Consumer Staples | 200,458,773 | 168,413,717 | ||||||
Global Energy | 221,729,681 | 200,907,977 | ||||||
Global Financials | 94,731,662 | 126,660,891 | ||||||
Global Healthcare | 172,949,792 | 118,330,697 | ||||||
Global Industrials | 29,164,601 | 30,413,435 | ||||||
Global Materials | 35,257,104 | 45,598,934 | ||||||
Global Tech | 380,467,509 | 505,345,193 | ||||||
Global Utilities | 15,160,957 | 15,602,331 | ||||||
For the year ended March 31, 2023, in-kind transactions were as follows:
| iShares ETF | In-kind Purchases | In-kind Sales | ||||||
Global Comm Services | $ | 252,707,040 | $ | 233,615,935 | ||||
Global Consumer Discretionary | 233,215,003 | 272,950,242 | ||||||
Global Consumer Staples | 570,444,867 | 101,258,337 | ||||||
Global Energy | 335,965,915 | 922,713,757 | ||||||
Global Financials | 91,246,118 | 659,285,219 | ||||||
Global Healthcare | 1,287,014,220 | 590,715,231 | ||||||
Global Industrials | 92,097,600 | 118,323,889 | ||||||
Global Materials | 60,859,404 | 326,732,320 | ||||||
Global Tech | 150,284,430 | 1,345,218,499 | ||||||
Global Utilities | 31,805,563 | 56,894,342 | ||||||
| 8. | INCOME TAX INFORMATION |
Each Fund is treated as an entity separate from the Trust’s other funds for federal income tax purposes. It is each Fund’s policy to comply with the requirements of the Internal Revenue Code of 1986, as amended, applicable to regulated investment companies, and to distribute substantially all of its taxable income to its shareholders. Therefore, no U.S. federal income tax provision is required.
| 90 | 2 0 2 3 I SHARES ANNUAL REPORT TO SHAREHOLDERS |
Notes to Financial Statements (continued)
Management has analyzed tax laws and regulations and their application to the Funds as of March 31, 2023, inclusive of the open tax return years, and does not believe that there are any uncertain tax positions that require recognition of a tax liability in the Funds’ financial statements.
U.S. GAAP requires that certain components of net assets be adjusted to reflect permanent differences between financial and tax reporting. These reclassifications have no effect on net assets or NAV per share. As of March 31, 2023, permanent differences attributable to realized gains (losses) from in-kind redemptions were reclassified to the following accounts:
| iShares ETF | Paid-in Capital | Accumulated Earnings (Loss) | ||||||
Global Comm Services | $ | 3,897,809 | $ | (3,897,809 | ) | |||
Global Consumer Discretionary | 2,506,102 | (2,506,102 | ) | |||||
Global Consumer Staples | 23,909,655 | (23,909,655 | ) | |||||
Global Energy | 238,834,101 | (238,834,101 | ) | |||||
Global Financials | (67,299,383 | ) | 67,299,383 | |||||
Global Healthcare | 263,096,123 | (263,096,123 | ) | |||||
Global Industrials | (1,837,266 | ) | 1,837,266 | |||||
Global Materials | (10,685,562 | ) | 10,685,562 | |||||
Global Tech | 544,535,867 | (544,535,867 | ) | |||||
Global Utilities | 380,667 | (380,667 | ) | |||||
The tax character of distributions paid was as follows:
| ||||||||||
| iShares ETF | Year Ended 03/31/23 | Year Ended 03/31/22 | ||||||||
| ||||||||||
Global Comm Services | ||||||||||
Ordinary income | $ | 2,680,016 | $ | 5,514,816 | ||||||
|
|
|
| |||||||
Global Consumer Discretionary | ||||||||||
Ordinary income | $ | 3,272,046 | $ | 4,140,498 | ||||||
|
|
|
| |||||||
Global Consumer Staples | ||||||||||
Ordinary income | $ | 24,794,345 | $ | 15,010,694 | ||||||
|
|
|
| |||||||
Global Energy | ||||||||||
Ordinary income | $ | 103,333,626 | $ | 64,194,482 | ||||||
|
|
|
| |||||||
Global Financials | ||||||||||
Ordinary income | $ | 27,379,101 | $ | 47,722,673 | ||||||
|
|
|
| |||||||
Global Healthcare | ||||||||||
Ordinary income | $ | 46,042,619 | $ | 39,505,134 | ||||||
|
|
|
| |||||||
Global Industrials | ||||||||||
Ordinary income | $ | 5,234,413 | $ | 6,438,398 | ||||||
|
|
|
| |||||||
Global Materials | ||||||||||
Ordinary income | $ | 22,752,409 | $ | 25,613,809 | ||||||
|
|
|
| |||||||
Global Tech | ||||||||||
Ordinary income | $ | 23,649,568 | $ | 32,243,037 | ||||||
|
|
|
| |||||||
Global Utilities | ||||||||||
Ordinary income | $ | 5,088,399 | $ | 4,448,043 | ||||||
|
|
|
| |||||||
As of March 31, 2023, the tax components of accumulated net earnings (losses) were as follows:
| iShares ETF | | Undistributed Ordinary Income |
| | Non-expiring Capital Loss | | | Net Unrealized Gains (Losses) | (b) | Total | ||||||
Global Comm Services | $ | 1,365,043 | $ | (117,568,119 | ) | $ | (33,682,689 | ) | $ | (149,885,765 | ) | |||||
Global Consumer Discretionary | 806,005 | (37,746,038 | ) | (43,340,838 | ) | (80,280,871 | ) | |||||||||
Global Consumer Staples | 7,089,189 | (44,421,053 | ) | 53,272,063 | 15,940,199 | |||||||||||
Global Energy | 17,883,069 | (222,017,490 | ) | 80,737,470 | (123,396,951 | ) | ||||||||||
Global Financials | 2,951,220 | (141,359,570 | ) | (69,285,144 | ) | (207,693,494 | ) | |||||||||
Global Healthcare | 19,971,237 | (86,791,650 | ) | 458,479,257 | 391,658,844 | |||||||||||
Global Industrials | 2,754,797 | (32,099,046 | ) | (17,811,483 | ) | (47,155,732 | ) | |||||||||
Global Materials | 3,007,939 | (96,368,567 | ) | (50,888,995 | ) | (144,249,623 | ) | |||||||||
Global Tech | 5,666,366 | (116,952,012 | ) | 622,873,858 | 511,588,212 | |||||||||||
Global Utilities | 841,472 | (46,525,570 | ) | (19,145,662 | ) | (64,829,760 | ) | |||||||||
NOTES TO FINANCIAL STATEMENTS | 91 |
Notes to Financial Statements (continued)
| (a) | Amounts available to offset future realized capital gains. |
| (b) | The difference between book-basis and tax-basis unrealized gains (losses) was attributable primarily to the tax deferral of losses on wash sales, the realization for tax purposes of unrealized gains (losses) on certain futures contracts, the timing and recognition of partnership income, the characterization of corporate actions and the realization for tax purposes of unrealized gains on investments in passive foreign investment companies. |
A fund may own shares in certain foreign investment entities, referred to, under U.S. tax law, as “passive foreign investment companies.” Such fund may elect to mark-to-market annually the shares of each passive foreign investment company and would be required to distribute to shareholders any such marked-to-market gains.
As of March 31, 2023, gross unrealized appreciation and depreciation based on cost of investments (including short positions and derivatives, if any) for U.S. federal income tax purposes were as follows:
| iShares ETF | Tax Cost | Gross Unrealized Appreciation | Gross Unrealized Depreciation | Net Unrealized Appreciation (Depreciation) | ||||||||||||
Global Comm Services | $ | 291,046,107 | $ | 6,137,545 | $ | (39,820,452 | ) | $ | (33,682,907 | ) | ||||||
Global Consumer Discretionary | 348,946,477 | 13,183,219 | (56,520,744 | ) | (43,337,525 | ) | ||||||||||
Global Consumer Staples | 1,476,032,546 | 109,253,235 | (55,997,337 | ) | 53,255,898 | |||||||||||
Global Energy | 1,711,767,217 | 202,087,793 | (121,349,143 | ) | 80,738,650 | |||||||||||
Global Financials | 492,260,581 | 12,768,548 | (82,030,536 | ) | (69,261,988 | ) | ||||||||||
Global Healthcare | 3,642,815,858 | 663,603,606 | (205,170,814 | ) | 458,432,792 | |||||||||||
Global Industrials | 356,999,134 | 21,532,199 | (39,341,406 | ) | (17,809,207 | ) | ||||||||||
Global Materials | 401,178,557 | 16,613,775 | (67,500,962 | ) | (50,887,187 | ) | ||||||||||
Global Tech | 2,556,098,314 | 746,765,285 | (123,890,203 | ) | 622,875,082 | |||||||||||
Global Utilities | 154,956,396 | 4,262,418 | (23,406,316 | ) | (19,143,898 | ) | ||||||||||
| 9. | LINE OF CREDIT |
The iShares Global Comm Services ETF, iShares Global Consumer Discretionary ETF, iShares Global Consumer Staples ETF, iShares Global Energy ETF, iShares Global Financials ETF, iShares Global Industrials ETF, iShares Global Materials ETF, iShares Global Tech ETF and iShares Global Utilities ETF, along with certain other iShares funds (“Participating Funds”), are parties to a $800 million credit agreement (“Syndicated Credit Agreement”) with a group of lenders, which expires on August 11, 2023. The line of credit may be used for temporary or emergency purposes, including redemptions, settlement of trades and rebalancing of portfolio holdings in certain target markets. The Funds may borrow up to the aggregate commitment amount subject to asset coverage and other limitations as specified in the Syndicated Credit Agreement. The Syndicated Credit Agreement has the following terms: a commitment fee of 0.15% per annum on the unused portion of the credit agreement and interest at a rate equal to the higher of (a) Daily Simple Secured Overnight Financing Rate (“SOFR”) plus 0.10% and 1.00% per annum or (b) the U.S. Federal Funds rate plus 1.00% per annum on amounts borrowed. The commitment fee is generally allocated to each Participating Fund based on the lesser of a Participating Fund’s relative exposure to certain target markets or a Participating Fund’s maximum borrowing amount as set forth by the terms of the Syndicated Credit Agreement.
During the year ended March 31, 2023, the Funds did not borrow under the Syndicated Credit Agreement.
| 10. | PRINCIPAL RISKS |
In the normal course of business, each Fund invests in securities or other instruments and may enter into certain transactions, and such activities subject the Fund to various risks, including, among others, fluctuations in the market (market risk) or failure of an issuer to meet all of its obligations. The value of securities or other instruments may also be affected by various factors, including, without limitation: (i) the general economy; (ii) the overall market as well as local, regional or global political and/or social instability; (iii) regulation, taxation or international tax treaties between various countries; or (iv) currency, interest rate or price fluctuations. Local, regional or global events such as war, acts of terrorism, the spread of infectious illness or other public health issues, recessions, or other events could have a significant impact on the Funds and their investments. Each Fund’s prospectus provides details of the risks to which the Fund is subject.
BFA uses a “passive” or index approach to try to achieve each Fund’s investment objective following the securities included in its underlying index during upturns as well as downturns. BFA does not take steps to reduce market exposure or to lessen the effects of a declining market. Divergence from the underlying index and the composition of the portfolio is monitored by BFA.
The Funds may be exposed to additional risks when reinvesting cash collateral in money market funds that do not seek to maintain a stable NAV per share of $1.00, which may be subject to redemption gates or liquidity fees under certain circumstances.
Infectious Illness Risk: An outbreak of an infectious illness, such as the COVID-19 pandemic, may adversely impact the economies of many nations and the global economy, and may impact individual issuers and capital markets in ways that cannot be foreseen. An infectious illness outbreak may result in, among other things, closed international borders, prolonged quarantines, supply chain disruptions, market volatility or disruptions and other significant economic, social and political impacts.
Valuation Risk: The market values of equities, such as common stocks and preferred securities or equity related investments, such as futures and options, may decline due to general market conditions which are not specifically related to a particular company. They may also decline due to factors which affect a particular industry or industries. A fund may invest in illiquid investments. An illiquid investment is any investment that a fund reasonably expects cannot be sold or disposed of in current market
| 92 | 2 0 2 3 I SHARES ANNUAL REPORT TO SHAREHOLDERS |
Notes to Financial Statements (continued)
conditions in seven calendar days or less without the sale or disposition significantly changing the market value of the investment. A fund may experience difficulty in selling illiquid investments in a timely manner at the price that it believes the investments are worth. Prices may fluctuate widely over short or extended periods in response to company, market or economic news. Markets also tend to move in cycles, with periods of rising and falling prices. This volatility may cause a fund’s NAV to experience significant increases or decreases over short periods of time. If there is a general decline in the securities and other markets, the NAV of a fund may lose value, regardless of the individual results of the securities and other instruments in which a fund invests.
The price each Fund could receive upon the sale of any particular portfolio investment may differ from each Fund’s valuation of the investment, particularly for securities that trade in thin or volatile markets or that are valued using a fair valuation technique or a price provided by an independent pricing service. Changes to significant unobservable inputs and assumptions (i.e., publicly traded company multiples, growth rate, time to exit) due to the lack of observable inputs.
Counterparty Credit Risk: The Funds may be exposed to counterparty credit risk, or the risk that an entity may fail to or be unable to perform on its commitments related to unsettled or open transactions, including making timely interest and/or principal payments or otherwise honoring its obligations. The Funds manage counterparty credit risk by entering into transactions only with counterparties that BFA believes have the financial resources to honor their obligations and by monitoring the financial stability of those counterparties. Financial assets, which potentially expose the Funds to market, issuer and counterparty credit risks, consist principally of financial instruments and receivables due from counterparties. The extent of the Funds’ exposure to market, issuer and counterparty credit risks with respect to these financial assets is approximately their value recorded in the Statements of Assets and Liabilities, less any collateral held by the Funds.
A derivative contract may suffer a mark-to-market loss if the value of the contract decreases due to an unfavorable change in the market rates or values of the underlying instrument. Losses can also occur if the counterparty does not perform under the contract.
With exchange-traded futures, there is less counterparty credit risk to the Funds since the exchange or clearinghouse, as counterparty to such instruments, guarantees against a possible default. The clearinghouse stands between the buyer and the seller of the contract; therefore, credit risk is limited to failure of the clearinghouse. While offset rights may exist under applicable law, a fund does not have a contractual right of offset against a clearing broker or clearinghouse in the event of a default (including the bankruptcy or insolvency). Additionally, credit risk exists in exchange-traded futures with respect to initial and variation margin that is held in a clearing broker’s customer accounts. While clearing brokers are required to segregate customer margin from their own assets, in the event that a clearing broker becomes insolvent or goes into bankruptcy and at that time there is a shortfall in the aggregate amount of margin held by the clearing broker for all its clients, typically the shortfall would be allocated on a pro rata basis across all the clearing broker’s customers, potentially resulting in losses to the Funds.
Concentration Risk: A diversified portfolio, where this is appropriate and consistent with a fund’s objectives, minimizes the risk that a price change of a particular investment will have a material impact on the NAV of a fund. The investment concentrations within each Fund’s portfolio are disclosed in its Schedule of Investments.
Certain Funds invest a significant portion of their assets in securities of issuers located in Europe or with significant exposure to European issuers or countries. The European financial markets have recently experienced volatility and adverse trends due to concerns about economic downturns in, or rising government debt levels of, several European countries as well as acts of war in the region. These events may spread to other countries in Europe and may affect the value and liquidity of certain of the Funds’ investments.
Responses to the financial problems by European governments, central banks and others, including austerity measures and reforms, may not work, may result in social unrest and may limit future growth and economic recovery or have other unintended consequences. Further defaults or restructurings by governments and others of their debt could have additional adverse effects on economies, financial markets and asset valuations around the world. The United Kingdom has withdrawn from the European Union, and one or more other countries may withdraw from the European Union and/or abandon the Euro, the common currency of the European Union. These events and actions have adversely affected, and may in the future adversely affect the value and exchange rate of the Euro and may continue to significantly affect the economies of every country in Europe, including countries that do not use the Euro and non-European Union member states. The impact of these actions, especially if they occur in a disorderly fashion, is not clear but could be significant and far reaching. In addition, Russia launched a large-scale invasion of Ukraine on February 24, 2022. The extent and duration of the military action, resulting sanctions and resulting future market disruptions in the region are impossible to predict, but have been, and may continue to be significant and have a severe adverse effect on the region, including significant negative impacts on the economy and the markets for certain securities and commodities, such as oil and natural gas, as well as other sectors.
Certain Funds invest a significant portion of their assets in securities within a single or limited number of market sectors. When a fund concentrates its investments in this manner, it assumes the risk that economic, regulatory, political and social conditions affecting such sectors may have a significant impact on the fund and could affect the income from, or the value or liquidity of, the fund’s portfolio.
Significant Shareholder Redemption Risk: Certain shareholders may own or manage a substantial amount of fund shares and/or hold their fund investments for a limited period of time. Large redemptions of fund shares by these shareholders may force a fund to sell portfolio securities, which may negatively impact the fund’s NAV, increase the fund’s brokerage costs, and/or accelerate the realization of taxable income/gains and cause the fund to make additional taxable distributions to shareholders.
| 11. | CAPITAL SHARE TRANSACTIONS |
Capital shares are issued and redeemed by each Fund only in aggregations of a specified number of shares or multiples thereof (“Creation Units”) at NAV. Except when aggregated in Creation Units, shares of each Fund are not redeemable.
NOTES TO FINANCIAL STATEMENTS | 93 |
Notes to Financial Statements (continued)
Transactions in capital shares were as follows:
| ||||||||||||||||||||
Year Ended 03/31/23 | Year Ended 03/31/22 | |||||||||||||||||||
|
|
|
| |||||||||||||||||
| iShares ETF | Shares | Amount | Shares | Amount | ||||||||||||||||
| ||||||||||||||||||||
Global Comm Services | ||||||||||||||||||||
Shares sold | 5,000,000 | $ | 285,678,262 | 2,400,000 | $ | 180,066,363 | ||||||||||||||
Shares redeemed | (4,250,000 | ) | (239,036,433 | ) | (3,150,000 | ) | (237,607,503 | ) | ||||||||||||
|
|
|
|
|
|
|
| |||||||||||||
| 750,000 | $ | 46,641,829 | (750,000 | ) | $ | (57,541,140 | ) | |||||||||||||
|
|
|
|
|
|
|
| |||||||||||||
Global Consumer Discretionary | ||||||||||||||||||||
Shares sold | 1,950,000 | $ | 257,608,569 | 1,350,000 | $ | 226,608,040 | ||||||||||||||
Shares redeemed | (2,150,000 | ) | (280,455,814 | ) | (1,700,000 | ) | (269,624,156 | ) | ||||||||||||
|
|
|
|
|
|
|
| |||||||||||||
| (200,000 | ) | $ | (22,847,245 | ) | (350,000 | ) | $ | (43,016,116 | ) | |||||||||||
|
|
|
|
|
|
|
| |||||||||||||
Global Consumer Staples | ||||||||||||||||||||
Shares sold | 10,150,000 | $ | 606,139,893 | 9,150,000 | $ | 571,394,685 | ||||||||||||||
Shares redeemed | (1,750,000 | ) | (103,585,196 | ) | (1,750,000 | ) | (107,384,488 | ) | ||||||||||||
|
|
|
|
|
|
|
| |||||||||||||
| 8,400,000 | $ | 502,554,697 | 7,400,000 | $ | 464,010,197 | |||||||||||||||
|
|
|
|
|
|
|
| |||||||||||||
Global Energy | ||||||||||||||||||||
Shares sold | 10,350,000 | $ | 380,017,898 | 46,650,000 | $ | 1,309,027,739 | ||||||||||||||
Shares redeemed | (25,800,000 | ) | (945,635,510 | ) | (36,600,000 | ) | (971,697,280 | ) | ||||||||||||
|
|
|
|
|
|
|
| |||||||||||||
| (15,450,000 | ) | $ | (565,617,612 | ) | 10,050,000 | $ | 337,330,459 | |||||||||||||
|
|
|
|
|
|
|
| |||||||||||||
Global Financials | ||||||||||||||||||||
Shares sold | 1,500,000 | $ | 109,276,663 | 42,650,000 | $ | 3,390,727,688 | ||||||||||||||
Shares redeemed | (9,950,000 | ) | (707,485,329 | ) | (34,500,000 | ) | (2,724,056,927 | ) | ||||||||||||
|
|
|
|
|
|
|
| |||||||||||||
| (8,450,000 | ) | $ | (598,208,666 | ) | 8,150,000 | $ | 666,670,761 | |||||||||||||
|
|
|
|
|
|
|
| |||||||||||||
Global Healthcare | ||||||||||||||||||||
Shares sold | 16,250,000 | $ | 1,349,795,290 | 6,950,000 | $ | 589,227,954 | ||||||||||||||
Shares redeemed | (7,250,000 | ) | (599,437,224 | ) | (2,150,000 | ) | (181,413,413 | ) | ||||||||||||
|
|
|
|
|
|
|
| |||||||||||||
| 9,000,000 | $ | 750,358,066 | 4,800,000 | $ | 407,814,541 | |||||||||||||||
|
|
|
|
|
|
|
| |||||||||||||
Global Industrials | ||||||||||||||||||||
Shares sold | 900,000 | $ | 96,114,001 | 800,000 | $ | 96,528,258 | ||||||||||||||
Shares redeemed | (1,200,000 | ) | (123,290,052 | ) | (1,200,000 | ) | (142,237,357 | ) | ||||||||||||
|
|
|
|
|
|
|
| |||||||||||||
| (300,000 | ) | $ | (27,176,051 | ) | (400,000 | ) | $ | (45,709,099 | ) | |||||||||||
|
|
|
|
|
|
|
| |||||||||||||
Global Materials | ||||||||||||||||||||
Shares sold | 800,000 | $ | 67,400,271 | 3,650,000 | $ | 336,899,964 | ||||||||||||||
Shares redeemed | (4,350,000 | ) | (340,974,094 | ) | (4,250,000 | ) | (383,190,984 | ) | ||||||||||||
|
|
|
|
|
|
|
| |||||||||||||
| (3,550,000 | ) | $ | (273,573,823 | ) | (600,000 | ) | $ | (46,291,020 | ) | |||||||||||
|
|
|
|
|
|
|
| |||||||||||||
Global Tech | ||||||||||||||||||||
Shares sold | 3,700,000 | $ | 189,510,660 | 27,900,000 | (a) | $ | 1,627,576,238 | |||||||||||||
Shares redeemed | (31,700,000 | ) | (1,509,808,992 | ) | (40,150,000 | )(a) | (2,243,982,777 | ) | ||||||||||||
|
|
|
|
|
|
|
| |||||||||||||
| (28,000,000 | ) | $ | (1,320,298,332 | ) | (12,250,000 | ) | $ | (616,406,539 | ) | |||||||||||
|
|
|
|
|
|
|
| |||||||||||||
Global Utilities | ||||||||||||||||||||
Shares sold | 500,000 | $ | 32,654,633 | 1,050,000 | $ | 66,190,402 | ||||||||||||||
Shares redeemed | (1,000,000 | ) | (58,079,232 | ) | (800,000 | ) | (48,541,045 | ) | ||||||||||||
|
|
|
|
|
|
|
| |||||||||||||
| (500,000 | ) | $ | (25,424,599 | ) | 250,000 | $ | 17,649,357 | |||||||||||||
|
|
|
|
|
|
|
| |||||||||||||
| (a) | Share transactions reflect a six-for-one stock split effective after the close of trading on July 16, 2021. |
The consideration for the purchase of Creation Units of a fund in the Trust generally consists of the in-kind deposit of a designated portfolio of securities and a specified amount of cash. Certain funds in the Trust may be offered in Creation Units solely or partially for cash in U.S. dollars. Investors purchasing and redeeming Creation Units may pay a purchase transaction fee and a redemption transaction fee directly to State Street Bank and Trust Company, the Trust’s administrator, to offset transfer and other transaction costs associated with the issuance and redemption of Creation Units, including Creation Units for cash. Investors transacting in Creation Units for cash may also pay an additional variable charge to compensate the relevant fund for certain transaction costs (i.e., stamp taxes, taxes on currency or other financial transactions, and brokerage costs) and market impact expenses relating to investing in portfolio securities. Such variable charges, if any, are included in shares sold in the table above.
From time to time, settlement of securities related to in-kind contributions or in-kind redemptions may be delayed. In such cases, securities related to in-kind transactions are reflected as a receivable or a payable in the Statements of Assets and Liabilities.
| 94 | 2 0 2 3 I SHARES ANNUAL REPORT TO SHAREHOLDERS |
Notes to Financial Statements (continued)
| 12. | FOREIGN WITHHOLDING TAX CLAIMS |
The iShares Global Comm Services ETF, iShares Global Consumer Discretionary ETF, iShares Global Consumer Staples ETF, iShares Global Financials ETF, iShares Global Industrials ETF, iShares Global Materials ETF, and iShares Global Tech ETF, and have filed claims to recover taxes withheld by Sweden on dividend income based upon certain provisions in the Treaty on the Functioning of the European Union. The Funds have recorded a receivable for all recoverable taxes withheld by Sweden based upon determinations made by Swedish tax authorities. Professional and other fees associated with the filing of tax claims in Sweden that result in the recovery of foreign withholding taxes have been approved by the Board as appropriate expenses of the Funds. The Funds continue to evaluate developments in Sweden, for potential impacts to the receivables and associated professional fees payable. Swedish tax claims receivable and related liabilities are disclosed in the Statements of Assets and Liabilities. Collection of this receivable, and any subsequent payment of associated liabilities, depends upon determinations made by Swedish tax authorities.
The iShares Global Comm Services ETF, iShares Global Energy ETF and iShares Global Financials ETF are seeking, or are expected to seek, a closing agreement with the Internal Revenue Service (“IRS”) to address any prior years’ U.S. income tax liabilities attributable to Fund shareholders resulting from the recovery of foreign taxes. The closing agreement would result in the Funds paying a compliance fee to the IRS, on behalf of its shareholders, representing the estimated tax savings generated from foreign tax credits claimed by Fund shareholders on their tax returns in prior years. The Funds have accrued a liability for the estimated IRS compliance fee related to foreign withholding tax claims, which is disclosed in the Statements of Assets and Liabilities. The actual IRS compliance fee may differ from the estimate and that difference may be material.
| 13. | SUBSEQUENT EVENTS |
Management’s evaluation of the impact of all subsequent events on the Funds’ financial statements was completed through the date the financial statements were available to be issued and the following items were noted:
On February 16, 2023, the Board approved a proposal to change iShares Global Energy ETF’s index to S&P Global 1200 Energy 4.5/22.5/45 Capped Index and iShares Global Tech ETF’s index to S&P Global 1200 Information Technology 4.5/22.5/45 Capped Index. These changes became effective on April 20, 2023.
NOTES TO FINANCIAL STATEMENTS | 95 |
Report of Independent Registered Public Accounting Firm
To the Board of Trustees of
iShares Trust and Shareholders of each of the ten funds listed in the table below
Opinions on the Financial Statements
We have audited the accompanying statements of assets and liabilities, including the schedules of investments, of each of the funds listed in the table below (ten of the funds constituting iShares Trust, hereafter collectively referred to as the “Funds”) as of March 31, 2023, the related statements of operations for the year ended March 31, 2023, the statements of changes in net assets for each of the two years in the period ended March 31, 2023, including the related notes, and the financial highlights for each of the five years in the period ended March 31, 2023 (collectively referred to as the “financial statements”). In our opinion, the financial statements present fairly, in all material respects, the financial position of each of the Funds as of March 31, 2023, the results of each of their operations for the year then ended, the changes in each of their net assets for each of the two years in the period ended March 31, 2023 and each of the financial highlights for each of the five years in the period ended March 31, 2023 in conformity with accounting principles generally accepted in the United States of America.
iShares Global Comm Services ETF
iShares Global Consumer Discretionary ETF
iShares Global Consumer Staples ETF
iShares Global Energy ETF
iShares Global Financials ETF
iShares Global Healthcare ETF
iShares Global Industrials ETF
iShares Global Materials ETF
iShares Global Tech ETF
iShares Global Utilities ETF
|
Basis for Opinions
These financial statements are the responsibility of the Funds’ management. Our responsibility is to express an opinion on the Funds’ financial statements based on our audits. We are a public accounting firm registered with the Public Company Accounting Oversight Board (United States) (PCAOB) and are required to be independent with respect to the Funds in accordance with the U.S. federal securities laws and the applicable rules and regulations of the Securities and Exchange Commission and the PCAOB.
We conducted our audits of these financial statements in accordance with the standards of the PCAOB. Those standards require that we plan and perform the audit to obtain reasonable assurance about whether the financial statements are free of material misstatement, whether due to error or fraud.
Our audits included performing procedures to assess the risks of material misstatement of the financial statements, whether due to error or fraud, and performing procedures that respond to those risks. Such procedures included examining, on a test basis, evidence regarding the amounts and disclosures in the financial statements. Our audits also included evaluating the accounting principles used and significant estimates made by management, as well as evaluating the overall presentation of the financial statements. Our procedures included confirmation of securities owned as of March 31, 2023 by correspondence with the custodian, transfer agent and brokers; when replies were not received from brokers, we performed other auditing procedures. We believe that our audits provide a reasonable basis for our opinions.
/s/PricewaterhouseCoopers LLP
Philadelphia, Pennsylvania
May 25, 2023
We have served as the auditor of one or more BlackRock investment companies since 2000.
| 96 | 2 0 2 3 I SHARES ANNUAL REPORT TO SHAREHOLDERS |
| Important Tax Information (unaudited) |
The following amounts, or maximum amounts allowable by law, are hereby designated as qualified dividend income for individuals for the fiscal year ended March 31, 2023:
| iShares ETF | Qualified Dividend Income | |||
Global Comm Services | $ | 3,646,006 | ||
Global Consumer Discretionary | 4,762,718 | |||
Global Consumer Staples | 33,520,935 | |||
Global Energy | 114,647,347 | |||
Global Financials | 25,482,646 | |||
Global Healthcare | 69,649,748 | |||
Global Industrials | 6,719,677 | |||
Global Materials | 19,755,397 | |||
Global Tech | 35,677,092 | |||
Global Utilities | 5,446,821 | |||
The Funds intend to pass through to their shareholders the following amounts, or maximum amounts allowable by law, of foreign source income earned and foreign taxes paid for the fiscal year ended March 31, 2023:
| iShares ETF | Foreign Source Income Earned | Foreign Taxes Paid | ||||||
Global Materials | $ | 18,015,848 | $ | 928,454 | ||||
The following percentage, or maximum percentage allowable by law, of ordinary income distributions paid during the fiscal year ended March 31, 2023 qualified for the dividends-received deduction for corporate shareholders:
| iShares ETF | Dividends-Received Deduction | |
Global Comm Services | 44.22% | |
Global Consumer Discretionary | 57.72% | |
Global Consumer Staples | 69.91% | |
Global Energy | 46.34% | |
Global Financials | 33.90% | |
Global Healthcare | 83.79% | |
Global Industrials | 49.12% | |
Global Materials | 13.30% | |
Global Tech | 100.00% | |
Global Utilities | 60.36% | |
IMPORTANT TAX INFORMATION | 97 |
Statement Regarding Liquidity Risk Management Program (unaudited)
In compliance with Rule 22e-4 under the Investment Company Act of 1940, as amended (the “Liquidity Rule”),iShares Trust (the “Trust”) has adopted and implemented a liquidity risk management program (the “Program”)for iShares Global Comm Services ETF, iShares Global Consumer Discretionary ETF, iShares Global Consumer Staples ETF, iShares Global Energy ETF, iShares Global Financials ETF, iShares Global Healthcare ETF, iShares Global Industrials ETF, iShares Global Materials ETF, iShares Global Tech ETF and iShares Global Utilities ETF (the “Funds” or “ETFs”), each a series of the Trust, which is reasonably designed to assess and manage each Fund’s liquidity risk.
The Board of Trustees (the “Board”) of the Trust, on behalf of the Funds, met on December 9, 2022 (the “Meeting”) to review the Program. The Board previously appointed BlackRock Fund Advisors (“BlackRock”), the investment adviser to the Funds, as the program administrator for each Fund’s Program. BlackRock also previously delegated oversight of the Program to the 40 Act Liquidity Risk Management Committee (the “Committee”). At the Meeting, the Committee, on behalf of BlackRock, provided the Board with a report that addressed the operation of the Program and assessed its adequacy and effectiveness of implementation, including the management of each Fund’s Highly Liquid Investment Minimum (“HLIM”) where applicable, and any material changes to the Program (the “Report”). The Report covered the period from October 1, 2021 through September 30, 2022 (the “Program Reporting Period”).
The Report described the Program’s liquidity classification methodology for categorizing each Fund’s investments (including derivative transactions) into one of four liquidity buckets. It also referenced the methodology used by BlackRock to establish each Fund’s HLIM and noted that the Committee reviews and ratifies the HLIM assigned to each Fund no less frequently than annually. The Report also discussed notable events affecting liquidity over the Program Reporting Period, including extended market holidays, the imposition of capital controls in certain non-U.S. countries, Russian sanctions and the closure of the Russian securities market.
The Report noted that the Program complied with the key factors for consideration under the Liquidity Rule for assessing, managing and periodically reviewing each Fund’s liquidity risk, as follows:
| a) | The Fund’s investment strategy and liquidity of portfolio investments during both normal and reasonably foreseeable stressed conditions. During the Program Reporting Period, the Committee reviewed whether each Fund’s strategy is appropriate for an open-end fund structure, with a focus on funds with more significant and consistent holdings of less liquid and illiquid assets. The Committee also factored a fund’s concentration in an issuer into the liquidity classification methodology by taking issuer position sizes into account. Derivative exposure was also considered in the calculation of a fund’s liquidity bucketing. Finally, a factor for consideration under the Liquidity Rule is a Fund’s use of borrowings for investment purposes. However, the Funds do not borrow for investment purposes. |
| b) | Short-term and long-term cash flow projections during both normal and reasonably foreseeable stressed conditions. During the Program Reporting Period, the Committee reviewed historical redemption activity and used this information as a component to establish each ETF’s reasonably anticipated trading size (“RATS”). The Committee may also take into consideration a fund’s shareholder ownership concentration (which, depending on product type and distribution channel, may or may not be available), a fund’s distribution channels, and the degree of certainty associated with a fund’s short-term and long-term cash flow projections. |
| c) | Holdings of cash and cash equivalents, as well as borrowing arrangements. The Committee considered that ETFs generally do not hold more than de minimis amounts of cash. The Committee also considered that ETFs generally do not engage in borrowing. |
| d) | The relationship between an ETF’s portfolio liquidity and the way in which, and the prices and spreads at which, ETF shares trade, including the efficiency of the arbitrage function and the level of active participation by market participants, including authorized participants. The Committee monitored the prevailing bid/ask spread and the ETF price premium (or discount) to NAV for all ETFs. However, there were no ETFs with persistent deviations of fund premium/discount or bid/ask spreads from long-term averages over the Program Reporting Period. |
| e) | The effect of the composition of baskets on the overall liquidity of an ETF’s portfolio. In reviewing the linkage between the composition of custom baskets accepted by an ETF and any significant change in the liquidity profile of such ETF, the Committee reviewed changes in the proportion of each ETF’s portfolio comprised of less liquid and illiquid holdings to determine if applicable thresholds were met requiring enhanced review. |
There were no material changes to the Program during the Program Reporting Period other than the enhancement of certain model components in the Program’s classification methodology. The Report provided to the Board stated that the Committee concluded that based on the operation of the functions, as described in the Report, the Program is operating as intended and is effective in implementing the requirements of the Liquidity Rule.
| 98 | 2 0 2 3 I SHARES ANNUAL REPORT TO SHAREHOLDERS |
Supplemental Information (unaudited)
Section 19(a) Notices
The amounts and sources of distributions reported are estimates and are being provided pursuant to regulatory requirements and are not being provided for tax reporting purposes. The actual amounts and sources for tax reporting purposes will depend upon each Fund’s investment experience during the year and may be subject to changes based on tax regulations. Shareholders will receive a Form 1099-DIV each calendar year that will inform them how to report these distributions for federal income tax purposes.
March 31, 2023
Total Cumulative Distributions for the Fiscal Year | % Breakdown of the Total Cumulative Distributions for the Fiscal Year | |||||||||||||||||||||||||||||||||||
|
|
|
| |||||||||||||||||||||||||||||||||
| iShares ETF | Net Investment Income | Net Realized Capital Gains | Return of Capital | Total Per Share | Net Investment Income | Net Realized Capital Gains | Return of Capital | Total Per Share | ||||||||||||||||||||||||||||
Global Comm Services(a) | $ | 0.733838 | $ | — | $ | 0.046403 | $ | 0.780241 | 94 | % | — | % | 6 | % | 100 | % | ||||||||||||||||||||
Global Consumer Discretionary | 1.259193 | — | — | 1.259193 | 100 | — | — | 100 | ||||||||||||||||||||||||||||
Global Energy | 1.856963 | — | — | 1.856963 | 100 | — | — | 100 | ||||||||||||||||||||||||||||
Global Financials | 2.605246 | — | — | 2.605246 | 100 | — | — | 100 | ||||||||||||||||||||||||||||
Global Healthcare(a) | 0.959372 | — | 0.030866 | 0.990238 | 97 | — | 3 | 100 | ||||||||||||||||||||||||||||
Global Tech | 0.362285 | — | — | 0.362285 | 100 | — | — | 100 | ||||||||||||||||||||||||||||
Global Utilities | 1.886287 | — | — | 1.886287 | 100 | — | — | 100 | ||||||||||||||||||||||||||||
| (a) | The Fund estimates that it has distributed more than its net investment income and net realized capital gains; therefore, a portion of the distribution may be a return of capital. A return of capital may occur, for example, when some or all of the shareholder’s investment in the Fund is returned to the shareholder. A return of capital does not necessarily reflect the Fund’s investment performance and should not be confused with “yield” or “income”. When distributions exceed total return performance, the difference will incrementally reduce the Fund’s net asset value per share. |
Premium/Discount Information
Information on the Fund’s net asset value, market price, premiums and discounts, and bid-ask spreads can be found at iShares.com.
Regulation under the Alternative Investment Fund Managers Directive
The Alternative Investment Fund Managers Directive, and its United Kingdom (“UK”) equivalent, (“AIFMD”) impose detailed and prescriptive obligations on fund managers established in the European Union (the “EU”) and the UK. These do not currently apply to managers established outside of the EU or UK, such as BFA (the “Company”). Rather, the Company is only required to comply with certain disclosure, reporting and transparency obligations of AIFMD because it has registered the iShares Global Consumer Staples ETF and iShares Global Energy ETF (the “Funds”) to be marketed to investors in the EU and/or UK.
Report on Remuneration
The Company is required under AIFMD to make quantitative disclosures of remuneration. These disclosures are made in line with BlackRock’s interpretation of currently available regulatory guidance on quantitative remuneration disclosures. As market or regulatory practice develops BlackRock may consider it appropriate to make changes to the way in which quantitative remuneration disclosures are calculated. Where such changes are made, this may result in disclosures in relation to a fund not being comparable to the disclosures made in the prior year, or in relation to other BlackRock fund disclosures in that same year.
Disclosures are provided in relation to (a) the staff of the Company; (b) staff who are senior management; and (c) staff who have the ability to materially affect the risk profile of the Funds.
All individuals included in the aggregated figures disclosed are rewarded in line with BlackRock’s remuneration policy for their responsibilities across the relevant BlackRock business area. As all individuals have a number of areas of responsibilities, only the portion of remuneration for those individuals’ services attributable to the Funds is included in the aggregate figures disclosed.
BlackRock has a clear and well-defined pay-for-performance philosophy, and compensation programs which support that philosophy.
BlackRock operates a total compensation model for remuneration which includes a base salary, which is contractual, and a discretionary bonus scheme. Although all employees are eligible to receive a discretionary bonus, there is no contractual obligation to make a discretionary bonus award to any employees. For senior management and staff who have the ability to materially affect the risk profile of the Funds, a significant percentage of variable remuneration is deferred over time. All employees are subject to a clawback policy.
Remuneration decisions for employees are made once annually in January following the end of the performance year, based on BlackRock’s full-year financial results and other non-financial goals and objectives. Alongside financial performance, individual total compensation is also based on strategic and operating results and other considerations such as management and leadership capabilities. No set formulas are established and no fixed benchmarks are used in determining annual incentive awards.
SUPPLEMENTAL INFORMATION | 99 |
Supplemental Information (unaudited) (continued)
Annual incentive awards are paid from a bonus pool which is reviewed throughout the year by BlackRock’s independent compensation committee, taking into account both actual and projected financial information together with information provided by the Enterprise Risk and Regulatory Compliance departments in relation to any activities, incidents or events that warrant consideration in making compensation decisions. Individuals are not involved in setting their own remuneration.
Each of the control functions (Enterprise Risk, Legal & Compliance, and Internal Audit) each have their own organizational structures which are independent of the business units and therefore staff members in control functions are remunerated independently of the businesses they oversee. Functional bonus pools for those control functions are determined with reference to the performance of each individual function and the remuneration of the senior members of control functions is directly overseen by BlackRock’s independent remuneration committee.
Members of staff and senior management of the Company typically provide both AIFMD and non-AIFMD related services in respect of multiple funds, clients and functions of the Company and across the broader BlackRock group. Conversely, members of staff and senior management of the broader BlackRock group may provide both AIFMD and non-AIFMD related services in respect of multiple funds, clients and functions of the broader BlackRock group and of the Company. Therefore, the figures disclosed are a sum of individuals’ portion of remuneration attributable to the Company according to an objective apportionment methodology which acknowledges the multiple-service nature of the Company and the broader BlackRock group. Accordingly, the figures are not representative of any individual’s actual remuneration or their remuneration structure.
The amount of the total remuneration awarded to the Company’s staff in respect of the Company’s financial year ending December 31, 2022 was USD 4,121 million. This figure is comprised of fixed remuneration of USD 685 million and variable remuneration of USD 3,436 million. There was a total of 8 beneficiaries of the remuneration described above.
The amount of the aggregate remuneration awarded by the Company in respect of the Company’s financial year ending December 31, 2022, to its senior management was USD 2,958 million, and to other members of its staff whose actions potentially have a material impact on the risk profile of the Company or its funds was USD 970 million. These figures relate to the entire Company and not to the Funds.
Disclosures Under the EU Sustainable Finance Disclosure Regulation
The iShares Global Consumer Staples ETF and iShares Global Energy ETF (the “Funds”) are registered under the Alternative Investment Fund Managers Directive to be marketed to European Union (“EU”) investors, as noted above. As a result, certain disclosures are required under the EU Sustainable Finance Disclosure Regulation (“SFDR”).
Each Fund has not been categorized under the SFDR as an “Article 8” or “Article 9” product. In addition, each Fund’s investment strategy does not take into account the criteria for environmentally sustainable economic activities under the EU sustainable investment taxonomy regulation or principal adverse impacts (“PAIs”) on sustainability factors under the SFDR. PAIs are identified under the SFDR as the material impacts of investment decisions on sustainability factors relating to environmental, social and employee matters, respect for human rights, and anti-corruption and anti-bribery matters.
| 100 | 2 0 2 3 I SHARES ANNUAL REPORT TO SHAREHOLDERS |
Trustee and Officer Information (unaudited)
The Board of Trustees has responsibility for the overall management and operations of the Funds, including general supervision of the duties performed by BFA and other service providers. Each Trustee serves until he or she resigns, is removed, dies, retires or becomes incapacitated. Each officer shall hold office until his or her successor is elected and qualifies or until his or her death, resignation or removal. Trustees who are not “interested persons” (as defined in the 1940 Act) of the Trust are referred to as independent trustees (“Independent Trustees”).
The registered investment companies advised by BFA or its affiliates (the “BlackRock-advised Funds”) are organized into one complex of open-end equity, multi-asset, index and money market funds and ETFs (the “BlackRock Multi-Asset Complex”), one complex of closed-end funds and open-end non-index fixed-income funds (including ETFs)(the “BlackRock Fixed-Income Complex”) and one complex of ETFs (“Exchange-Traded Fund Complex”)(each, a “BlackRock Fund Complex”).Each Fund is included in the Exchange-Traded Fund Complex. Each Trustee also serves as a Director of iShares, Inc. and a Trustee of iShares U.S. ETF Trust and, as a result, oversees all of the funds within the Exchange-Traded Fund Complex, which consists of 380 funds as of March 31, 2023. With the exception of Robert S. Kapito, Salim Ramji and Charles Park, the address of each Trustee and officer is c/o BlackRock, Inc., 400 Howard Street, San Francisco, CA 94105. The address of Mr. Kapito, Mr. Ramji and Mr. Park is c/o BlackRock, Inc., 50 Hudson Yards, New York, NY 10001. The Board has designated John E. Kerrigan as its Independent Board Chair. Additional information about the Funds’ Trustees and officers may be found in the Funds’ combined Statement of Additional Information, which is available without charge, upon request, by calling toll-free 1-800-iShares (1-800-474-2737).
| Interested Trustees | ||||||
Name (Year of Birth) | Position(s) | Principal Occupation(s) During Past 5 Years | Other Directorships Held by Trustee | |||
Robert S. Kapito(a) (1957) | Trustee (since 2009). | President, BlackRock, Inc. (since 2006);Vice Chairman of BlackRock, Inc. and Head of BlackRock’s Portfolio Management Group (since its formation in 1998) and BlackRock, Inc.’s predecessor entities (since 1988); Trustee, University of Pennsylvania (since 2009); President of Board of Directors, Hope & Heroes Children’s Cancer Fund (since 2002). | Director of BlackRock, Inc. (since 2006); Director of iShares, Inc. (since 2009); Trustee of iShares U.S. ETF Trust (since 2011). | |||
Salim Ramji(b) (1970) | Trustee (since 2019). | Senior Managing Director, BlackRock, Inc. (since 2014); Global Head of BlackRock’s ETF and Index Investments Business (since 2019); Head of BlackRock’s U.S. Wealth Advisory Business (2015-2019); Global Head of Corporate Strategy, BlackRock, Inc. (2014-2015); Senior Partner, McKinsey & Company (2010-2014). | Director of iShares, Inc. (since 2019); Trustee of iShares U.S. ETF Trust (since 2019). | |||
| (a) | Robert S. Kapito is deemed to be an “interested person” (as defined in the 1940 Act) of the Trust due to his affiliations with BlackRock, Inc. and its affiliates. |
| (b) | Salim Ramji is deemed to be an “interested person” (as defined in the 1940 Act) of the Trust due to his affiliations with BlackRock, Inc. and its affiliates. |
| Independent Trustees | ||||||
Name (Year of Birth) | Position(s) | Principal Occupation(s) During Past 5 Years | Other Directorships Held by Trustee | |||
John E. Kerrigan (1955) | Trustee (since 2005); Independent Board Chair (since 2022). | Chief Investment Officer, Santa Clara University (since 2002). | Director of iShares, Inc. (since 2005); Trustee of iShares U.S. ETF Trust (since 2011); Independent Board Chair of iShares, Inc. and iShares U.S. ETF Trust (since 2022). | |||
Jane D. Carlin (1956) | Trustee (since 2015); Risk Committee Chair (since 2016). | Consultant (since 2012); Member of the Audit Committee (2012-2018), Chair of the Nominating and Governance Committee (2017-2018) and Director of PHH Corporation (mortgage solutions) (2012-2018); Managing Director and Global Head of Financial Holding Company Governance & Assurance and the Global Head of Operational Risk Management of Morgan Stanley (2006-2012). | Director of iShares, Inc. (since 2015); Trustee of iShares U.S. ETF Trust (since 2015); Member of the Audit Committee (since 2016), Chair of the Audit Committee (since 2020) and Director of The Hanover Insurance Group, Inc. (since 2016). | |||
Richard L. Fagnani (1954) | Trustee (since 2017); Audit Committee Chair (since 2019). | Partner, KPMG LLP (2002-2016); Director of One Generation Away (since 2021). | Director of iShares, Inc. (since 2017); Trustee of iShares U.S. ETF Trust (since 2017). | |||
TRUSTEE AND OFFICER INFORMATION | 101 |
Trustee and Officer Information (unaudited) (continued)
| Independent Trustees (continued) | ||||||
Name (Year of Birth) | Position(s) | Principal Occupation(s) During Past 5 Years | Other Directorships Held by Trustee | |||
Cecilia H. Herbert (1949) | Trustee (since 2005); Nominating and Governance and Equity Plus Committee Chairs (since 2022). | Chair of the Finance Committee (since 2019) and Trustee and Member of the Finance, Audit and Quality Committees of Stanford Health Care (since 2016); Trustee of WNET, New York’s public media company (since 2011) and Member of the Audit Committee (since 2018), Investment Committee (since 2011) and Personnel Committee (since 2022); Chair (1994-2005) and Member (1992-2021) of the Investment Committee, Archdiocese of San Francisco; Trustee of Forward Funds (14 portfolios) (2009-2018); Trustee of Salient MF Trust (4 portfolios) (2015-2018); Director (1998-2013) and President (2007-2011) of the Board of Directors, Catholic Charities CYO; Trustee (2002-2011) and Chair of the Finance and Investment Committee (2006-2010) of the Thacher School; Director of the Senior Center of Jackson Hole (since 2020); Director of the Jackson Hole Center for the Arts (since 2021); Member of the Wyoming State Investment Funds Committee (since 2022). | Director of iShares, Inc. (since 2005); Trustee of iShares U.S. ETF Trust (since 2011). | |||
Drew E. Lawton (1959) | Trustee (since 2017); 15(c) Committee Chair (since 2017). | Senior Managing Director of New York Life Insurance Company (2010-2015). | Director of iShares, Inc. (since 2017); Trustee of iShares U.S. ETF Trust (since 2017); Director of Jackson Financial Inc. (since 2021). | |||
John E. Martinez (1961) | Trustee (since 2003); Securities Lending Committee Chair (since 2019). | Director of Real Estate Equity Exchange, Inc. (since 2005); Director of Cloudera Foundation (2017-2020); and Director of Reading Partners (2012-2016). | Director of iShares, Inc. (since 2003); Trustee of iShares U.S. ETF Trust (since 2011). | |||
Madhav V. Rajan (1964) | Trustee (since 2011); Fixed-Income Plus Committee Chair (since 2019). | Dean, and George Pratt Shultz Professor of Accounting, University of Chicago Booth School of Business (since 2017); Advisory Board Member (since 2016) and Director (since 2020) of C.M. Capital Corporation; Chair of the Board for the Center for Research in Security Prices, LLC (since 2020); Robert K. Jaedicke Professor of Accounting, Stanford University Graduate School of Business (2001-2017); Professor of Law (by courtesy), Stanford Law School (2005-2017); Senior Associate Dean for Academic Affairs and Head of MBA Program, Stanford University Graduate School of Business (2010-2016). | Director of iShares, Inc. (since 2011); Trustee of iShares U.S. ETF Trust (since 2011). | |||
| Officers | ||||||
Name (Year of Birth) | Position(s) | Principal Occupation(s) During Past 5 Years | ||||
Dominik Rohé (1973) | President (since 2019). | Managing Director, BlackRock, Inc. (since 2005); Head of Americas ETF and Index Investments (since 2023); Head of Latin America (2019-2023). | ||||
Trent Walker (1974) | Treasurer and Chief Financial Officer (since 2020). | Managing Director, BlackRock, Inc. (since September 2019); Chief Financial Officer of iShares Delaware Trust Sponsor LLC, BlackRock Funds, BlackRock Funds II, BlackRock Funds IV, BlackRock Funds V and BlackRock Funds VI (since 2021); Executive Vice President of PIMCO (2016-2019); Senior Vice President of PIMCO (2008-2015); Treasurer (2013-2019) and Assistant Treasurer (2007-2017) of PIMCO Funds, PIMCO Variable Insurance Trust, PIMCO ETF Trust, PIMCO Equity Series, PIMCO Equity Series VIT, PIMCO Managed Accounts Trust, 2 PIMCO-sponsored interval funds and 21 PIMCO-sponsored closed-end funds. | ||||
Charles Park (1967) | Chief Compliance Officer (since 2006). | Chief Compliance Officer of BlackRock Advisors, LLC and the BlackRock-advised Funds in the BlackRock Multi-Asset Complex and the BlackRock Fixed-Income Complex (since 2014); Chief Compliance Officer of BFA (since 2006). | ||||
Marisa Rolland (1980) | Secretary (since 2022). | Managing Director, BlackRock, Inc. (since 2023); Director, BlackRock, Inc. (2018-2022); Vice President, BlackRock, Inc. (2010-2017). | ||||
Rachel Aguirre (1982) | Executive Vice President (since 2022). | Managing Director, BlackRock, Inc. (since 2018); Director, BlackRock, Inc. (2009-2018); Head of U.S. iShares Product (since 2022); Head of EII U.S. Product Engineering (since 2021); Co-Head of EII’s Americas Portfolio Engineering (2020-2021); Head of Developed Markets Portfolio Engineering (2016-2019). | ||||
| 102 | 2 0 2 3 I SHARES ANNUAL REPORT TO SHAREHOLDERS |
Trustee and Officer Information (unaudited) (continued)
| Officers (continued) | ||||||
Name (Year of Birth) | Position(s) | Principal Occupation(s) During Past 5 Years | ||||
Jennifer Hsui (1976) | Executive Vice President (since 2022). | Managing Director, BlackRock, Inc. (since 2009); Co-Head of Index Equity (since 2022). | ||||
James Mauro (1970) | Executive Vice President (since 2022). | Managing Director, BlackRock, Inc. (since 2010); Head of Fixed Income Index Investments in the Americas and Head of San Francisco Core Portfolio Management (since 2020). | ||||
Effective June 15, 2022, Marisa Rolland replaced Deepa Damre Smith as Secretary.
Effective March 30, 2023, Dominik Rohé replaced Armando Senra as President.
TRUSTEE AND OFFICER INFORMATION | 103 |
Electronic Delivery
Shareholders can sign up for e-mail notifications announcing that the shareholder report or prospectus has been posted on the iShares website at iShares.com. Once you have enrolled, you will no longer receive prospectuses and shareholder reports in the mail.
To enroll in electronic delivery:
| • | Go to icsdelivery.com. |
| • | If your brokerage firm is not listed, electronic delivery may not be available. Please contact your broker-dealer or financial advisor. |
Householding
Householding is an option available to certain fund investors. Householding is a method of delivery, based on the preference of the individual investor, in which a single copy of certain shareholder documents and Rule 30e-3 notices can be delivered to investors who share the same address, even if their accounts are registered under different names. Please contact your broker-dealer if you are interested in enrolling in householding and receiving a single copy of prospectuses and other shareholder documents, or if you are currently enrolled in householding and wish to change your householding status.
Availability of Quarterly Schedule of Investments
The Funds file their complete schedule of portfolio holdings with the SEC for the first and third quarters of each fiscal year as an exhibit to their reports on Form N-PORT. The Funds’ Forms N-PORT are available on the SEC’s website at sec.gov. Additionally, each Fund makes its portfolio holdings for the first and third quarters of each fiscal year available at iShares.com/fundreports.
Availability of Proxy Voting Policies and Proxy Voting Records
A description of the policies and procedures that the iShares Funds use to determine how to vote proxies relating to portfolio securities and information about how the iShares Funds voted proxies relating to portfolio securities during the most recent twelve-month period ending June 30 is available without charge, upon request (1) by calling toll-free 1-800-474-2737; (2) on the iShares website at iShares.com; and (3) on the SEC website at sec.gov.
A description of the Trust’s policies and procedures with respect to the disclosure of the Fund’s portfolio securities is available in the Fund Prospectus. The Fund discloses its portfolio holdings daily and provides information regarding its top holdings in Fund fact sheets at iShares.com.
| 104 | 2 0 2 3 I SHARES ANNUAL REPORT TO SHAREHOLDERS |
Glossary of Terms Used in this Report
| Portfolio Abbreviation | ||
| ADR | American Depositary Receipt | |
| CPO | Certificates of Participation (Ordinary) | |
| NVS | Non-Voting Shares | |
GLOSSARY OF TERMS USED IN THIS REPORT | 105 |
THIS PAGE INTENTIONALLY LEFT BLANK.
THIS PAGE INTENTIONALLY LEFT BLANK.
Want to know more?
iShares.com | 1-800-474-2737
This report is intended for the Funds’ shareholders. It may not be distributed to prospective investors unless it is preceded or accompanied by the current prospectus.
Investing involves risk, including possible loss of principal.
The iShares Funds are distributed by BlackRock Investments, LLC (together with its affiliates, “BlackRock”).
The iShares Funds are not sponsored, endorsed, issued, sold or promoted by S&P Dow Jones Indices LLC, nor does this company make any representation regarding the advisability of investing in the iShares Funds. BlackRock is not affiliated with the company listed above.
©2023 BlackRock, Inc. All rights reserved. iSHARES and BLACKROCK are registered trademarks of BlackRock, Inc. or its subsidiaries. All other marks are the property of their respective owners.
iS-AR-300-0323
|  |
| MARCH 31, 2023 |

|
2023 Annual Report
| |
iShares Trust
· iShares Asia 50 ETF | AIA | NASDAQ
· iShares Blockchain and Tech ETF | IBLC | NYSE Arca
· iShares Emerging Markets Infrastructure ETF | EMIF | NASDAQ
· iShares Europe ETF | IEV | NYSE Arca
· iShares Future Metaverse Tech and Communications ETF | IVRS | NYSE Arca
· iShares India 50 ETF | INDY | NASDAQ
· iShares International Developed Property ETF | WPS | NYSE Arca
· iShares International Developed Small Cap Value Factor ETF | ISVL | Cboe BZX
· iShares International Dividend Growth ETF | IGRO | Cboe BZX
· iShares Latin America 40 ETF | ILF | NYSE Arca
Dear Shareholder,
Significant economic headwinds emerged during the 12-month reporting period ended March 31, 2023, as investors navigated changing economic conditions and volatile markets. The U.S. economy shrank in the first half of 2022 before returning to modest growth in the second half of the year, marking a shift to a more challenging post-reopening economic environment. Changes in consumer spending patterns and a tight labor market led to elevated inflation, which reached a 40-year high before beginning to moderate.
Equity prices fell as interest rates rose, particularly during the first half of the reporting period. Both large-and small-capitalization U.S. stocks declined, although equities began to recover in the second half of the period as inflation eased and economic growth resumed. Emerging market stocks and international equities from developed markets declined overall, pressured by rising interest rates and volatile commodities prices.
The 10-year U.S. Treasury yield rose during the reporting period, driving its price down, as investors reacted to fluctuating inflation data and attempted to anticipate its impact on future interest rate changes. The corporate bond market also faced inflationary headwinds, and higher interest rates led to rising borrowing costs for corporate issuers.
The U.S. Federal Reserve (the “Fed”), acknowledging that inflation has been more persistent than expected, raised interest rates eight times. Furthermore, the Fed wound down its bond-buying programs and accelerated the reduction of its balance sheet.
Restricted labor supply kept inflation elevated even as other inflation drivers, such as goods prices and energy costs, moderated. While economic growth slowed in the last year, we believe that taming inflation requires a more substantial decline that lowers demand to a level more in line with the economy’s productive capacity. Although the Fed has decelerated the pace of interest rate hikes, we believe that it still seems determined to get inflation back to target. With this in mind, we believe the possibility of a U.S. recession in the near-term is high, but the dimming economic outlook has not yet been fully reflected in current market prices. We believe investors should expect a period of higher volatility as markets adjust to the new economic reality and policymakers attempt to adapt to rapidly changing conditions. Turmoil in the banking sector late in the period highlighted the potential for the knock-on effects of substantially higher interest rates to disrupt markets with little warning.
While we favor an overweight to equities in the long term, we prefer an underweight stance on equities overall in the near term. Expectations for corporate earnings remain elevated, which seems inconsistent with the possibility of a recession. Nevertheless, we are overweight on emerging market stocks as we believe a weakening U.S. dollar provides a supportive backdrop. We also see long-term opportunities in credit, where we believe that valuations are appealing and higher yields provide attractive income, although we are neutral on credit in the near term, as we’re concerned about tightening credit and financial conditions. However, we believe there are still some strong opportunities for a six- to twelve-month horizon, particularly short-term U.S. Treasuries, global inflation-linked bonds, and emerging market bonds denominated in local currency.
Overall, our view is that investors need to think globally, position themselves to be prepared for a decarbonizing economy, and be nimble as market conditions change. We encourage you to talk with your financial advisor and visit iShares.com for further insight about investing in today’s markets.

Rob Kapito
President, BlackRock, Inc.

Rob Kapito
President, BlackRock, Inc.
| Total Returns as of March 31, 2023 | ||||||
| 6-Month | 12-Month | |||||
U.S. large cap equities | 15.62% | (7.73)% | ||||
U.S. small cap equities | 9.14 | (11.61) | ||||
International equities | 27.27 | (1.38) | ||||
Emerging market equities | 14.04 | (10.70) | ||||
3-month Treasury bills | 1.93 | 2.52 | ||||
U.S. Treasury securities | 4.38 | (6.90) | ||||
U.S. investment grade bonds | 4.89 | (4.78) | ||||
Tax-exempt municipal bonds | 7.00 | 0.26 | ||||
U.S. high yield bonds | 7.88 | (3.35) | ||||
| Past performance is not an indication of future results. Index performance is shown for illustrative purposes only. You cannot invest directly in an index. | ||||||
| 2 | THIS PAGE IS NOT PART OF YOUR FUND REPORT |
| Page | ||||
| ||||
| 2 | ||||
Annual Report: | ||||
| 4 | ||||
| 5 | ||||
| 25 | ||||
| 25 | ||||
| 26 | ||||
Financial Statements | ||||
| 68 | ||||
| 71 | ||||
| 74 | ||||
| 79 | ||||
| 89 | ||||
| 103 | ||||
| 104 | ||||
| 105 | ||||
| 107 | ||||
| 108 | ||||
| 110 | ||||
| 113 | ||||
| 114 | ||||
iShares Trust
Global Market Overview
Global equity markets declined during the 12 months ended March 31, 2023 (“reporting period”). The MSCI ACWI, a broad global equity index that includes both developed and emerging markets, returned -7.44% in U.S. dollar terms for the reporting period. In the first half of the reporting period, concerns about the state of the global economy in the face of high inflation and rapidly rising interest rates drove stocks sharply lower. However, stock prices recovered somewhat in the reporting period’s second half, as economic growth proved resilient despite its slower pace.
Inflation was a significant factor in equity markets, and while its impact varied by country, most major economies experienced substantial inflation during the reporting period. This drove a wave of monetary tightening by most of the world’s central banks, which sent interest rates and borrowing costs sharply higher. The U.S. Federal Reserve (“Fed”) raised interest rates eight times, driving an increase in the value of the U.S. dollar relative to most other currencies. Commodities prices were volatile, and as the reporting period began, disruptions in the wake of Russia’s invasion of Ukraine meant high prices for energy commodities and some foods. While oil, gas, and most other commodities declined as markets adjusted to the war’s disruption, elevated prices exacerbated inflationary pressure.
The U.S. economy recovered from a decline in the first half of 2022 to post modest growth in the third and fourth quarters of 2022. Consumers continued to power the economy with growing spending, despite higher prices for many consumer goods and services. The strong labor market supported spending as unemployment remained very low, at one point dropping to the lowest recorded level since 1969. Furthermore, the labor force participation rate—which measures the total proportion of employed persons of working age—rose, indicating that more people were being drawn into the labor force. Amid tightening labor supply, wages rose significantly, with the largest gains at the lower end of the wage spectrum.
In addition to its interest rate increases, the Fed also started to reduce the size of its balance sheet by reducing the store of U.S. Treasuries it had accumulated to stabilize markets in the early phases of the coronavirus pandemic. While the Fed indicated that more tightening could be needed to achieve its long-term inflation goal, it sounded a more cautious note about the potential for further interest rate increases near the end of the reporting period.
European stocks outpaced most other regions of the globe, advancing modestly for the reporting period despite slowing economic growth. European stocks benefited from a solid recovery following the early phases of the war in Ukraine. While the conflict disrupted critical natural gas supplies, new sources were secured and prices began to decline, while a warm winter helped moderate consumption. The European Central Bank (“ECB”) responded to the highest inflation since the introduction of the euro by raising interest rates six times.
While inflation was somewhat more moderate in the Asia-Pacific region, stocks there declined amid higher interest rates and disruption from coronavirus-related lockdowns in China. However, China relaxed its strict anti-coronavirus protocols in December 2022, boosting analysts’ expectations for future growth in the region. Emerging market stocks declined substantially, pressured by slowing economic growth and a stronger U.S. dollar. The Fed’s interest rate increases weighed on emerging market equities by making U.S. assets relatively more attractive.
| 4 | 2 0 2 3 I SHARES ANNUAL REPORT TO SHAREHOLDERS |
| Fund Summary as of March 31, 2023 | iShares® Asia 50 ETF |
Investment Objective
The iShares Asia 50 ETF (the “Fund”) seeks to track the investment results of an index composed of 50 of the largest Asian equities, as represented by the S&P Asia 50TM (the “Index”). The Fund invests in a representative sample of securities included in the Index that collectively has an investment profile similar to the Index. Due to the use of representative sampling, the Fund may or may not hold all of the securities that are included in the Index.
Performance
| Average Annual Total Returns | Cumulative Total Returns | |||||||||||||||||||||||||||
|
| |||||||||||||||||||||||||||
| 1 Year | 5 Years | 10 Years | 1 Year | 5 Years | 10 Years | |||||||||||||||||||||||
Fund NAV | (7.77 | )% | 0.33 | % | 5.12% | (7.77 | )% | 1.66 | % | 64.70 | % | |||||||||||||||||
Fund Market | (7.62 | ) | 0.02 | 5.09 | (7.62 | ) | 0.08 | 64.26 | ||||||||||||||||||||
Index | (8.86 | ) | 0.96 | 5.73 | (8.86 | ) | 4.90 | 74.57 | ||||||||||||||||||||
GROWTH OF $10,000 INVESTMENT
(AT NET ASSET VALUE)
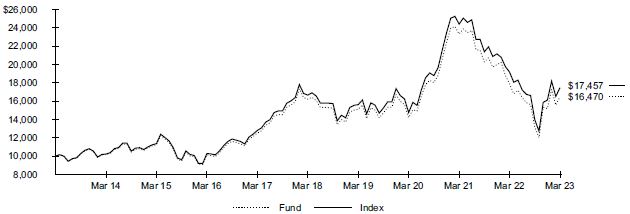
Past performance is not an indication of future results. Performance results do not reflect the deduction of taxes that a shareholder would pay on fund distributions or on the redemption or sale of fund shares. See “About Fund Performance” for more information.
Expense Example
| Actual | Hypothetical 5% Return | |||||||||||||||||||||||||
|
|
|
| |||||||||||||||||||||||
| | Beginning Account Value | | | Ending Account Value | | | Expenses Paid During the Period |
(a) | | Beginning Account Value (10/01/22) |
| | Ending Account Value (03/31/23) |
| | Expenses Paid During the Period |
(a) | | Annualized Expense Ratio | | ||||||
| $ 1,000.00 | $ 1,251.40 | $ 2.81 | $ 1,000.00 | $ 1,022.40 | $ 2.52 | 0.50 | % | |||||||||||||||||||
| (a) | Expenses are equal to the annualized expense ratio, multiplied by the average account value over the period, multiplied by 182/365 (to reflect the one-half year period shown). Other fees, such as brokerage commissions and other fees to financial intermediaries, may be paid which are not reflected in the tables and examples above. See “Disclosure of Expenses” for more information. |
FUND SUMMARY | 5 |
| Fund Summary as of March 31, 2023 (continued) | iShares® Asia 50 ETF |
Portfolio Management Commentary
Large-capitalization stocks in Asia declined significantly for the reporting period, pressured by higher interest rates. South Korean stocks detracted the most from the Index’s return in an environment of stalling economic growth. The South Korean economy slowed in the first half of the reporting period before contracting in the fourth quarter of 2022 amid normalizing consumer spending patterns and declining exports. Inflation was elevated, although it remained lower than in many other developed economies and decelerated by the end of the reporting period. In response to inflation, the Bank of Korea raised interest rates multiple times, pressuring stocks. The South Korean won also declined relative to the U.S. dollar, reducing the value of South Korean equities in U.S. dollar terms.
The South Korean information technology sector was the largest source of weakness, led by the technology hardware, storage, and peripherals industry. A sharp decline in demand for smartphones worked against the industry, driving a significant decline in earnings. Softer pricing for memory chips also dented the industry’s profitability. Stocks in the communication services sector also declined, as the interactive media and services industry faced slower growth in advertising revenue.
Taiwanese stocks also detracted from the Index’s performance. Taiwan’s economy contracted on an annual basis in the fourth quarter of 2022, stifled by declining exports. The economy of China, Taiwan’s largest trading partner, was slowed by strict lockdowns to prevent the spread of COVID-19, disrupting many Taiwanese businesses. The Taiwanese information technology sector declined the most, primarily the semiconductors and semiconductor equipment industry. As supply chains and spending patterns recovered from the coronavirus pandemic, global demand for semiconductors cooled significantly, pressuring the outlook for the industry. New U.S. restrictions on certain technology sales to China disrupted investment plans in the industry.
Chinese stocks also declined, driven by the internet and direct marketing retail industry in the consumer discretionary sector. Profitability in the industry was constrained by government restrictions and heightened competition among e-retailers.
Portfolio Information
SECTOR ALLOCATION
| Sector | | Percent of Total Investments | (a) | |
Information Technology | 33.9 | % | ||
Financials | 22.4 | |||
Communication Services | 17.8 | |||
Consumer Discretionary | 17.6 | |||
Materials | 3.1 | |||
Industrials | 2.3 | |||
Real Estate | 1.5 | |||
Health Care | 1.4 | |||
GEOGRAPHIC ALLOCATION
| Country/Geographic Region | | Percent of Total Investments | (a) | |
China | 41.1 | % | ||
South Korea | 22.1 | |||
Taiwan | 21.9 | |||
Hong Kong | 10.1 | |||
Singapore | 4.8 | |||
| (a) | Excludes money market funds. |
| 6 | 2 0 2 3 I SHARES ANNUAL REPORT TO SHAREHOLDERS |
| Fund Summary as of March 31, 2023 | iShares® Blockchain and Tech ETF |
Investment Objective
The iShares Blockchain and Tech ETF (the “Fund”) seeks to track the investment results of an index composed of U.S. and non-U.S. companies that are involved in the development, innovation, and utilization of blockchain and crypto technologies; as represented by the NYSE FactSet Global Blockchain Technologies Index (the “Index”). The Fund invests in a representative sample of securities included in the Index that collectively has an investment profile similar to the Index. Due to the use of representative sampling, the Fund may or may not hold all of the securities that are included in the Index.
Performance
| Cumulative Total Returns | ||||
Since Inception | ||||
Fund NAV | (35.71 | )% | ||
Fund Market | (35.53 | ) | ||
Index | (36.20 | ) | ||
GROWTH OF $10,000 INVESTMENT
(SINCE INCEPTION AT NET ASSETVALUE)
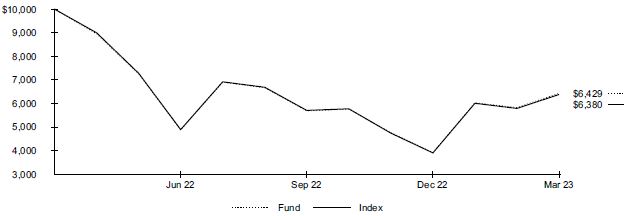
The inception date of the Fund was April 25, 2022. The first day of secondary market trading was April 27, 2022.
Past performance is not an indication of future results. Performance results do not reflect the deduction of taxes that a shareholder would pay on fund distributions or on the redemption or sale of fund shares. See “About Fund Performance” for more information.
Expense Example
| Actual | Hypothetical 5% Return | |||||||||||||||||||||||||
|
|
|
| |||||||||||||||||||||||
| | Beginning Account Value (10/01/22) |
| | Ending Account Value (03/31/23) |
| | Expenses Paid During the Period |
(a) | | Beginning Account Value (10/01/22) |
| | Ending Account Value (03/31/23) |
| | Expenses Paid During the Period |
(a) | | Annualized Expense Ratio |
| ||||||
| $ 1,000.00 | $ 1,130.80 | $ 2.50 | $ 1,000.00 | $ 1,022.60 | $ 2.37 | 0.47 | % | |||||||||||||||||||
| (a) | Expenses are equal to the annualized expense ratio, multiplied by the average account value over the period, multiplied by 182/365 (to reflect the one-half year period shown). Other fees, such as brokerage commissions and other fees to financial intermediaries, may be paid which are not reflected in the tables and examples above. See “Disclosure of Expenses” for more information. |
FUND SUMMARY | 7 |
| Fund Summary as of March 31, 2023 (continued) | iShares® Blockchain and Tech ETF |
Portfolio Management Commentary
The blockchain industry contracted significantly in 2022, in contrast to the exponential growth of preceding years. In particular, investor confidence in cryptocurrencies and digital assets —which underpin the model of decentralized finance that blockchain technology supports —dissipated amid a series of high-profile business failures. The collapse of an algorithmically powered stablecoin, an asset intended to maintain a 1:1 peg with the U.S. dollar, created significant ripple effects across the industry, leading to the demise of a major hedge fund and multiple lenders. The revelation of large-scale fraud within a major U.S. cryptocurrency exchange further weakened confidence, sending asset prices sharply lower.
At the same time, the sharp rise in interest rates offered investors of digital assets the opportunity to earn higher yields on other securities deemed less volatile, such as U.S. Treasuries. As gold prices climbed and cryptocurrencies dropped amid high inflation, investors were increasingly skeptical of bitcoin’s appeal over the precious metal as a store of value. This sentiment, along with ongoing volatility in the cryptocurrency markets, fueled an exodus of assets away from decentralized finance.
Profitability among bitcoin miners, or companies that devote extensive computing power to solving mathematical equations to generate cryptocurrencies, fell substantially as operating costs climbed and the market value of the assets fell. Cryptocurrency exchanges reported a sizable reduction in trading activity, which substantially decreased revenues and profits. Venture capital funding for blockchain and cryptocurrency projects also slowed. U.S. regulators took enforcement actions against multiple cryptocurrency businesses. Citing a lack of regulatory clarity and increased scrutiny, a handful of cryptocurrency companies closed U.S. business units.
Signs of a recovery emerged later in the reporting period, as digital asset and blockchain technology stocks climbed from their lowest prices, and investors returned. Blockchain technology continued to help businesses achieve tangible operational benefits beyond their current infrastructures. Technology conglomerates also announced efforts to broaden blockchain usage among enterprises and governments. The E.U. advanced measures to create a clear and comprehensive set of operating guidelines for cryptocurrency companies in the region.
Portfolio Information
SECTOR ALLOCATION
| Sector | | Percent of Total Investments | (a) | |
Information Technology | 58.9 | % | ||
Financials | 34.4 | |||
Industrials | 3.9 | |||
Communication Services | 1.4 | |||
Consumer Discretionary | 1.4 | |||
TEN LARGEST HOLDINGS
| Security | | Percent of Total Investments | (a) | |
Riot Blockchain Inc. | 17.0 | % | ||
Coinbase Global Inc., Class A | 11.3 | |||
Block Inc. New | 9.2 | |||
Marathon Digital Holdings Inc. | 5.5 | |||
Hut 8 Mining Corp. | 4.8 | |||
Cleanspark Inc. | 4.4 | |||
Advanced Micro Devices Inc. | 4.3 | |||
Nvidia Corp. | 4.2 | |||
Wolters Kluwer NV | 3.9 | |||
International Business Machines Corp. | 3.6 | |||
| (a) | Excludes money market funds. |
| 8 | 2 0 2 3 I SHARES ANNUAL REPORT TO SHAREHOLDERS |
| Fund Summary as of March 31, 2023 | iShares® Emerging Markets Infrastructure ETF |
Investment Objective
The iShares Emerging Markets Infrastructure ETF (the “Fund”) seeks to track the investment results of an index composed of 30 of the largest equities in the emerging markets infrastructure industry, as represented by the S&P Emerging Markets Infrastructure IndexTM (the “Index”). The Fund invests in a representative sample of securities included in the Index that collectively has an investment profile similar to the Index. Due to the use of representative sampling, the Fund may or may not hold all of the securities that are included in the Index.
Performance
| Average Annual Total Returns | Cumulative Total Returns | |||||||||||||||||||||||||||
|
| |||||||||||||||||||||||||||
| 1 Year | 5 Years | 10 Years | 1 Year | 5 Years | 10 Years | |||||||||||||||||||||||
Fund NAV | (3.11 | )% | (4.92 | )% | (2.21)% | (3.11 | )% | (22.28 | )% | (20.05 | )% | |||||||||||||||||
Fund Market | (4.32 | ) | (5.25 | ) | (2.32) | (4.32 | ) | (23.65 | ) | (20.95 | ) | |||||||||||||||||
Index | (2.76 | ) | (4.48 | ) | (1.64) | (2.76 | ) | (20.49 | ) | (15.28 | ) | |||||||||||||||||
GROWTH OF $10,000 INVESTMENT
(AT NET ASSET VALUE)
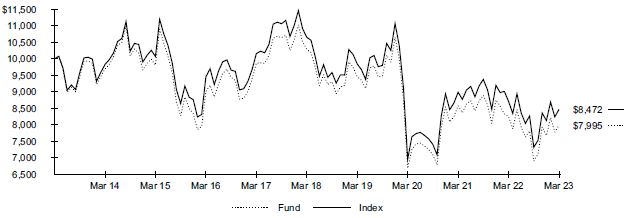
Past performance is not an indication of future results. Performance results do not reflect the deduction of taxes that a shareholder would pay on fund distributions or on the redemption or sale of fund shares. See “About Fund Performance” for more information.
Expense Example
| Actual | Hypothetical 5% Return | |||||||||||||||||||||||||
|
|
|
| |||||||||||||||||||||||
| | Beginning Account Value (10/01/22) |
| | Ending Account Value (03/31/23) |
| | Expenses Paid During the Period |
(a) | | Beginning Account Value (10/01/22) |
| | Ending Account Value (03/31/23) |
| | Expenses Paid During the Period |
(a) | | Annualized Expense Ratio | | ||||||
| $ 1,000.00 | $ 1,157.20 | $ 3.23 | $ 1,000.00 | $ 1,021.90 | $ 3.02 | 0.60 | % | |||||||||||||||||||
| (a) | Expenses are equal to the annualized expense ratio, multiplied by the average account value over the period, multiplied by 182/365 (to reflect the one-half year period shown). Other fees, such as brokerage commissions and other fees to financial intermediaries, may be paid which are not reflected in the tables and examples above. See “Disclosure of Expenses” for more information. |
FUND SUMMARY | 9 |
| Fund Summary as of March 31, 2023 (continued) | iShares® Emerging Markets Infrastructure ETF |
Portfolio Management Commentary
Infrastructure stocks in emerging markets declined for the reporting period amid volatility due to slowing economic growth, high global inflation, and concerns about the impact of rising interest rates. During the reporting period, rising energy prices in the wake of Russia’s invasion of Ukraine, as well as turmoil in the global banking system, were headwinds for emerging market infrastructure stocks. A slowdown in global inflation and China’s shift away from COVID-19 pandemic restrictions generally helped the Index’s performance later in the reporting period.
Utilities stocks in China detracted the most from the Index’s return. The country’s reopening from pandemic restrictions, along with government subsidies to renewable energy firms, were tailwinds for the sector. However, large renewable electricity stocks declined amid weak demand and relatively high industry-wide debt as many firms awaited overdue green energy subsidies promised by the central government. In addition, higher coal prices reduced profitability for companies distributing power generated from coal-fired plants.
Stocks in Brazil also detracted from the Index’s return. Electric utilities stocks fell as a change in the country’s presidential administration cast doubt on the industry’s recent privatization. Oil and gas storage and transportation stocks also declined, reflecting a surge in oil prices early in the reporting period and high debt levels that clouded credit rating outlooks.
Conversely, stocks of airport services firms in Mexico contributed to the Index’s return. North American companies, responding to supply-chain difficulties that surfaced during the pandemic, returned more of their production base closer to home. The country’s increased travel tied to that environment benefited the industry’s stocks. Overall, air travel in Mexico finally returned to pre-pandemic levels. Passenger traffic rose 5% in the first 11 months of 2022 compared with the same time frame in 2019. The increase, in part, reflected fewer U.S. border restrictions with Mexico beginning in late 2021 and a large influx of international workers.
Portfolio Information
SECTOR ALLOCATION
| Sector | | Percent of Total Investments | (a) | |
Utilities | 40.0 | % | ||
Industrials | 40.0 | |||
Energy | 20.0 | |||
GEOGRAPHIC ALLOCATION
| Country/Geographic Region | | Percent of Total Investments | (a) | |
China | 39.7 | % | ||
Brazil | 20.2 | |||
Mexico | 17.7 | |||
Thailand | 9.8 | |||
United Arab Emirates | 4.8 | |||
Qatar | 4.5 | |||
South Korea | 3.3 | |||
Russia | 0.0 | |||
| (a) | Excludes money market funds. |
| 10 | 2 0 2 3 I SHARES ANNUAL REPORT TO SHAREHOLDERS |
| Fund Summary as of March 31, 2023 | iShares® Europe ETF |
Investment Objective
The iShares Europe ETF (the “Fund”) seeks to track the investment results of an index composed of European equities, as represented by the S&P Europe 350TM (the “Index”). The Fund invests in a representative sample of securities included in the Index that collectively has an investment profile similar to the Index. Due to the use of representative sampling, the Fund may or may not hold all of the securities that are included in the Index.
Performance
| Average Annual Total Returns | Cumulative Total Returns | |||||||||||||||||||||||||||
|
| |||||||||||||||||||||||||||
| 1 Year | 5 Years | 10 Years | 1 Year | 5 Years | 10 Years | |||||||||||||||||||||||
Fund NAV | 2.87 | % | 4.41 | % | 5.28% | 2.87 | % | 24.07 | % | 67.34 | % | |||||||||||||||||
Fund Market | 2.60 | 4.32 | 5.27 | 2.60 | 23.54 | 67.07 | ||||||||||||||||||||||
Index | 1.58 | 4.58 | 5.55 | 1.58 | 25.10 | 71.68 | ||||||||||||||||||||||
GROWTH OF $10,000 INVESTMENT
(AT NET ASSET VALUE)
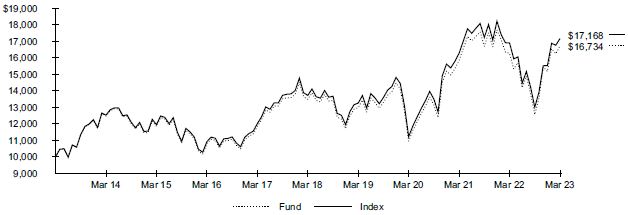
Index performance through January 30, 2013 is calculated using currency exchange (FX) rates corresponding to 5:15 P.M. ET. Index performance beginning on January 31, 2013 is calculated using FX rates corresponding to World Market Reuters 4:00 P.M. London.
Past performance is not an indication of future results. Performance results do not reflect the deduction of taxes that a shareholder would pay on fund distributions or on the redemption or sale of fund shares. See “About Fund Performance” for more information.
Expense Example
| Actual | Hypothetical 5% Return | |||||||||||||||||||||||||
|
|
|
| |||||||||||||||||||||||
| | Beginning Account Value (10/01/22) |
| | Ending Account Value (03/31/23) |
| | Expenses Paid During the Period | (a) | | Beginning Account Value (10/01/22) |
| | Ending Account Value (03/31/23) | | | Expenses Paid During the Period | (a) | | Annualized Expense Ratio | | ||||||
| $ 1,000.00 | $ 1,332.20 | $ 3.78 | $ 1,000.00 | $ 1,021.70 | $ 3.28 | 0.65 | % | |||||||||||||||||||
| (a) | Expenses are equal to the annualized expense ratio, multiplied by the average account value over the period, multiplied by 182/365 (to reflect the one-half year period shown). Other fees, such as brokerage commissions and other fees to financial intermediaries, may be paid which are not reflected in the tables and examples above. See “Disclosure of Expenses” for more information. |
FUND SUMMARY | 11 |
| Fund Summary as of March 31, 2023 (continued) | iShares® Europe ETF |
Portfolio Management Commentary
European stocks rose modestly during the reporting period as companies navigated an array of economic and business challenges, including stubbornly high inflation, the ongoing war in Ukraine, COVID-19 lockdowns in China, and a Swiss banking crisis. French stocks contributed the most to the Index’s return as surging consumer demand for luxury goods benefited companies in the consumer discretionary sector. Textile and apparel makers added new jobs and increased shareholder dividends. Sales at the world’s largest luxury group topped pre-pandemic levels as affluent Americans, buoyed by the strong U.S. dollar, returned to spending on international travel and luxury goods such as jewelry and luggage. Demand from U.S. and European consumers also drove sales of beauty products and helped offset rising input costs and the impact of China’s slowdown. A strong recovery in oil demand and the ongoing restriction on supply stemming from Russia’s war in Ukraine aided profits of French energy companies.
Danish stocks also contributed to the Index’s return, with pharmaceuticals companies leading returns. Demand for a new medicine for obesity outstripped supply in the U.S. and delayed its entry into many European markets. Sales of the drug increased operating profits of the drug’s developer and boosted the stock’s price.
On the downside, pharmaceuticals stocks in Switzerland were the largest detractors from the Index’s return, as the receding pandemic reduced demand for COVID-19 products. The failure of a highly anticipated Alzheimer’s drug to slow the onset of the disease in clinical trials disappointed investors, sending stock prices lower. Bank stocks were also notable detractors from the Index’s return after the near-collapse of a prominent Swiss bank shook investor confidence, leading to a government-structured deal with a rival lender. Swiss consumer staples stocks also detracted from the Index’s return as packaged foods companies reported lower sales volumes despite moves to offset higher raw material costs by increasing the prices of consumer goods.
Portfolio Information
SECTOR ALLOCATION
| Sector | | Percent of Total Investments | (a) | |
Financials | 17.1 | % | ||
Health Care | 15.4 | |||
Industrials | 14.8 | |||
Consumer Staples | 12.9 | |||
Consumer Discretionary | 11.7 | |||
Materials | 7.1 | |||
Information Technology | 6.8 | |||
Energy | 5.9 | |||
Utilities | 4.2 | |||
Communication Services | 3.5 | |||
Real Estate | 0.6 | |||
GEOGRAPHIC ALLOCATION
| Country/Geographic Region | | Percent of Total Investments | (a) | |
United Kingdom | 23.4 | % | ||
France | 18.4 | |||
Switzerland | 15.5 | |||
Germany | 12.8 | |||
Netherlands | 7.2 | |||
Sweden | 4.7 | |||
Denmark | 4.7 | |||
Spain | 3.9 | |||
Italy | 3.6 | |||
Belgium | 1.5 | |||
Finland | 1.5 | |||
Ireland | 1.2 | |||
Other (each representing less than 1%) | 1.6 | |||
| (a) | Excludes money market funds. |
| 12 | 2 0 2 3 I SHARES ANNUAL REPORT TO SHAREHOLDERS |
| Fund Summary as of March 31, 2023 | iShares® Future Metaverse Tech and Communications ETF |
Investment Objective
The iShares Future Metaverse Tech and Communications ETF (the “Fund”) seeks to track the investment results of an index composed of U.S. and non-U.S. companies that provide products and services that are expected to contribute to the metaverse in areas including virtual platforms, social media, gaming, 3D software, digital assets, and virtual and augmented reality, as represented by the Morningstar Global Metaverse & Virtual Interaction Select Index (the “Index”). The Fund invests in a representative sample of securities included in the Index that collectively has an investment profile similar to the Index. Due to the use of representative sampling, the Fund may or may not hold all of the securities that are included in the Index.
Performance
| Cumulative Total Returns | ||
Since Inception | ||
Fund NAV | 4.82% | |
Fund Market | 4.62 | |
Index | 4.78 | |
For the fiscal period ended March 31, 2023, the Fund did not have six months of performance and therefore line graphs are not presented.
The inception date of the Fund was February 14, 2023. The first day of secondary market trading was February 16, 2023.
Past performance is not an indication of future results. Performance results do not reflect the deduction of taxes that a shareholder would pay on fund distributions or on the redemption or sale of fund shares. See “About Fund Performance” for more information.
Expense Example
| Actual | Hypothetical 5% Return | |||||||||||||||||||||||||
|
|
|
| |||||||||||||||||||||||
| | Beginning Account Value (02/14/23) | (a) | | Ending Account Value (03/31/23) | | | Expenses Paid During the Period | (b) | | Beginning Account Value (10/01/22) | | | Ending Account Value (03/31/23) | | | Expenses Paid During the Period | (b) | | Annualized Expense Ratio | | ||||||
| $ 1,000.00 | $ 1,048.20 | $ 0.59 | $ 1,000.00 | $ 1,022.60 | $ 2.37 | 0.47 | % | |||||||||||||||||||
| (a) | Commencement of operations. |
| (b) | Expenses are equal to the annualized expense ratio, multiplied by the average account value over the period, multiplied by 45/365 for actual expenses and 182/365 for hypothetical expenses (to reflect the six month period shown). Other fees, such as brokerage commissions and other fees to financial intermediaries, may be paid which are not reflected in the tables and examples above. See “Disclosure of Expenses” for more information. |
Portfolio Information
INDUSTRY ALLOCATION
| Industry | | Percent of Total Investments | (a) | |
Software | 29.8 | % | ||
Entertainment | 28.2 | |||
Semiconductors & Semiconductor Equipment | 15.5 | |||
Interactive Media & Services | 13.4 | |||
Technology Hardware, Storage & Peripherals | 7.4 | |||
Household Durables | 5.1 | |||
Other (each representing less than 1%) | 0.6 | |||
TEN LARGEST HOLDINGS
| Security | | Percent of Total Investments | (a) | |
Apple Inc. | 6.2 | % | ||
Nvidia Corp. | 5.3 | |||
Meta Platforms Inc, Class A | 5.2 | |||
Tencent Holdings Ltd. | 4.8 | |||
Ansys Inc. | 4.7 | |||
ROBLOX Corp., Class A | 4.6 | |||
Activision Blizzard Inc. | 4.6 | |||
Zoom Video Communications Inc., Class A | 4.6 | |||
Electronic Arts Inc. | 4.5 | |||
NetEase Inc. | 4.5 | |||
| (a) | Excludes money market funds. |
FUND SUMMARY | 13 |
| Fund Summary as of March 31, 2023 | iShares® India 50 ETF |
Investment Objective
The iShares India 50 ETF (the “Fund”) seeks to track the investment results of an index composed of 50 of the largest Indian equities, as represented by the Nifty 50 Index (the “Index”) and determined by the Index provider, NSE Indices Ltd. The Fund invests in a representative sample of securities included in the Index that collectively has an investment profile similar to the Index. Due to the use of representative sampling, the Fund may or may not hold all of the securities that are included in the Index.
Performance
| Average Annual Total Returns | Cumulative Total Returns | |||||||||||||||||||||||||||
|
| |||||||||||||||||||||||||||
| 1 Year | 5 Years | 10 Years | 1 Year | 5 Years | 10 Years | |||||||||||||||||||||||
Fund NAV | (7.59 | )%(a) | 5.87 | % | 7.16% | (7.59 | )%(a) | 32.99 | % | 99.69 | % | |||||||||||||||||
Fund Market | (7.75 | ) | 5.52 | 7.06 | (7.75 | ) | 30.85 | 97.80 | ||||||||||||||||||||
Index | (7.25 | ) | 7.66 | 8.61 | (7.25 | ) | 44.62 | 128.33 | ||||||||||||||||||||
| (a) | The NAV total return presented in the table for the one-year period differs from the same period return disclosed in the financial highlights. The total return in the financial highlights is calculated in the same manner but differs due to certain adjustments made for financial reporting purposes in accordance with U.S. generally accepted accounting principles. |
GROWTH OF $10,000 INVESTMENT
(AT NET ASSET VALUE)
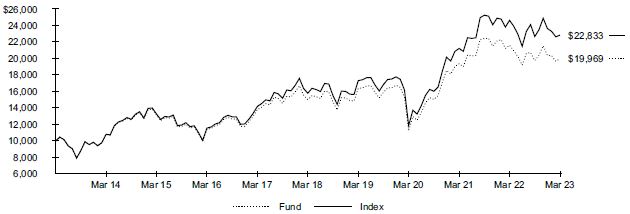
Past performance is not an indication of future results. Performance results do not reflect the deduction of taxes that a shareholder would pay on fund distributions or on the redemption or sale of fund shares. See “About Fund Performance” for more information.
Expense Example
| Actual | Hypothetical 5% Return | |||||||||||||||||||||||||
|
|
|
| |||||||||||||||||||||||
| | Beginning Account Value (10/01/22) | | | Ending Account Value (03/31/23) | | | Expenses Paid During the Period | (a) | | Beginning Account Value (10/01/22) | | | Ending Account Value (03/31/23) | | | Expenses Paid During the Period | (a) | | Annualized Expense Ratio | | ||||||
| $ 1,000.00 | $ 1,011.00 | $ 4.46 | $ 1,000.00 | $ 1,020.50 | $ 4.48 | 0.89 | % | |||||||||||||||||||
| (a) | Expenses are equal to the annualized expense ratio, multiplied by the average account value over the period, multiplied by 182/365 (to reflect the one-half year period shown). Other fees, such as brokerage commissions and other fees to financial intermediaries, may be paid which are not reflected in the tables and examples above. See “Disclosure of Expenses” for more information. |
| 14 | 2 0 2 3 I SHARES ANNUAL REPORT TO SHAREHOLDERS |
| Fund Summary as of March 31, 2023 (continued) | iShares® India 50 ETF |
Portfolio Management Commentary
Large-capitalization Indian stocks declined for the reporting period amid slowing economic growth and rising interest rates. While India’s economy continued to recover from the effects of the coronavirus pandemic, the rate of growth slowed on an annual basis in the second half of 2022 as the effect of pent-up consumer demand faded and manufacturing growth stalled. Rising interest rates also weighed on the economy, and the Reserve Bank of India increased its headline interest rate multiple times during the reporting period. While inflation was substantial, it was not significantly higher than India’s historical average and showed signs of easing as the reporting period continued. The Indian rupee declined notably relative to the U.S. dollar, reducing the value of equities held in U.S. dollar terms.
Higher oil and gas prices following Russia’s invasion of Ukraine initially had a negative impact on India, which is a large net-importer of energy commodities. However, India benefited from falling prices thereafter and was able to negotiate discounts on Russian oil that were below standard market prices. India’s exports grew, particularly exports of services, which helped to offset weaker growth in goods exports.
The Indian labor market was tepid, as unemployment remained high even as the economy continued to grow. The labor force participation rate stayed relatively low, indicating that many Indians, particularly young workers, stopped looking for work entirely. Nonetheless, consumer spending rose as economic activity continued to return to normal, sustaining the country’s economic growth.
A high-profile report from a U.S.-based finance firm accusing a large Indian conglomerate of fraud and market manipulation negatively impacted India’s stock market. The report led to intensified investor scrutiny of Indian companies associated with the conglomerate, driving a decline in Indian equities overall. However, the conglomerate vigorously contested the accusations, and an investigation by the Securities and Exchange Board of India had not released any findings by the end of the reporting period. The government’s business-friendly financial reforms helped attract investors to Indian markets.
Portfolio Information
SECTOR ALLOCATION
| Sector | | Percent of Total Investments | (a) | |
Financials | 37.7 | % | ||
Information Technology | 14.1 | |||
Energy | 12.1 | |||
Consumer Staples | 9.6 | |||
Materials | 6.8 | |||
Consumer Discretionary | 6.7 | |||
Industrials | 4.7 | |||
Health Care | 3.8 | |||
Communication Services | 2.4 | |||
Utilities | 2.1 | |||
TEN LARGEST HOLDINGS
| Security | | Percent of Total Investments | (a) | |
Reliance Industries Ltd. | 10.3 | % | ||
HDFC Bank Ltd. | 9.3 | |||
ICICI Bank Ltd. | 8.0 | |||
Infosys Ltd. | 6.7 | |||
Housing Development Finance Corp. Ltd. | 6.2 | |||
ITC Ltd. | 4.4 | |||
Tata Consultancy Services Ltd. | 4.3 | |||
Larsen & Toubro Ltd. | 3.4 | |||
Kotak Mahindra Bank Ltd. | 3.3 | |||
Axis Bank Ltd. | 3.1 | |||
| (a) | Excludes money market funds. |
FUND SUMMARY | 15 |
| Fund Summary as of March 31, 2023 | iShares® International Developed Property ETF |
Investment Objective
The iShares International Developed Property ETF (the “Fund”) seeks to track the investment results of an index composed of real estate equities in developed non-U.S. markets, as represented by the S&P Developed ex-U.S. Property IndexTM (the “Index”). The Fund invests in a representative sample of securities included in the Index that collectively has an investment profile similar to the Index. Due to the use of representative sampling, the Fund may or may not hold all of the securities that are included in the Index.
Performance
| Average Annual Total Returns | Cumulative Total Returns | |||||||||||||||||||||||||||
|
| |||||||||||||||||||||||||||
| 1 Year | 5 Years | 10 Years | 1 Year | 5 Years | 10 Years | |||||||||||||||||||||||
Fund NAV | (22.49 | )% | (3.27 | )% | 0.69% | (22.49 | )% | (15.33 | )% | 7.13 | % | |||||||||||||||||
Fund Market | (22.48 | ) | (3.40 | ) | 0.63 | (22.48 | ) | (15.88 | ) | 6.52 | ||||||||||||||||||
Index | (23.28 | ) | (3.25 | ) | 0.71 | (23.28 | ) | (15.23 | ) | 7.38 | ||||||||||||||||||
GROWTH OF $10,000 INVESTMENT
(AT NET ASSET VALUE)
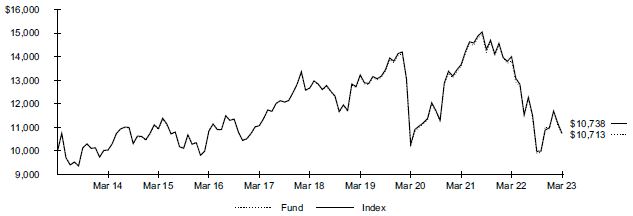
Past performance is not an indication of future results. Performance results do not reflect the deduction of taxes that a shareholder would pay on fund distributions or on the redemption or sale of fund shares. See “About Fund Performance” for more information.
Expense Example
| Actual | Hypothetical 5% Return | |||||||||||||||||||||||||
|
|
|
| |||||||||||||||||||||||
| | Beginning Account Value (10/01/22) | | | Ending Account Value (03/31/23) | | | Expenses Paid During the Period | (a) | | Beginning Account Value (10/01/22) | | | Ending Account Value (03/31/23) | | | Expenses Paid During the Period | (a) | | Annualized Expense Ratio | | ||||||
| $ 1,000.00 | $ 1,081.70 | $ 2.54 | $ 1,000.00 | $ 1,022.50 | $ 2.47 | 0.49 | % | |||||||||||||||||||
| (a) | Expenses are equal to the annualized expense ratio, multiplied by the average account value over the period, multiplied by 182/365 (to reflect the one-half year period shown). Other fees, such as brokerage commissions and other fees to financial intermediaries, may be paid which are not reflected in the tables and examples above. See “Disclosure of Expenses” for more information. |
| 16 | 2 0 2 3 I SHARES ANNUAL REPORT TO SHAREHOLDERS |
| Fund Summary as of March 31, 2023 (continued) | iShares® International Developed Property ETF |
Portfolio Management Commentary
International developed property stocks declined significantly during the reporting period amid a slowing global economy, elevated inflation, and sharply higher interest rates. German stocks were the largest detractors from the Index’s performance, led by equity real estate investment trusts (“REITs”). Rising interest rates drove a downturn in the real estate market in Germany, as property financing and mortgages became more expensive. Transactions in the German commercial real estate market declined significantly amid pricing uncertainty and the economic impact of Russia’s invasion of Ukraine.
German real estate operating companies were negatively affected by government action against a prominent company in the industry. German authorities raided the offices of the company and prosecutors alleged that illegal kickbacks were made in the awarding of contracts to subcontractors. While the investigation was still ongoing at the end of the reporting period, the high-profile accusations drove a significant decline in the industry.
The U.K. diversified REIT industry was another notable source of detraction from the Index’s return. Interest rates rose rapidly in the U.K. and the Bank of England was one of the first major central banks to raise interest rates. Consequently, borrowing costs rose significantly for firms investing in the U.K. property market, weighing on profitability. The deteriorating economic outlook and high interest rates led to a devaluation of some properties in the industry, while elevated inflation drove operating costs sharply higher.
Despite facing a different macroeconomic backdrop, Japanese diversified REITs also declined. Inflation was lower in Japan than in most other major economies, and the Bank of Japan (“BOJ”) held interest rates steady, keeping its key short-term interest rate in negative territory. Nonetheless, investor concerns about pressure on the BOJ to increase interest rates and modify its yield curve control policy weighed on the industry.
Diversified REITs in Australia were another source of weakness, declining amid a downturn in the real estate market. Higher interest rates and economic uncertainty negatively impacted the tenants of some warehouses and industrial properties, which in turn pressured REITs that own these properties.
FUND SUMMARY | 17 |
| Fund Summary as of March 31, 2023 (continued) | iShares® International Developed Property ETF |
Portfolio Information
INDUSTRY ALLOCATION
| Industry | | Percent of Total Investments | (a) | |
Real Estate Operating Companies | 19.3 | % | ||
Diversified Real Estate Activities | 17.9 | |||
Retail REITs | 14.3 | |||
Industrial REITs | 14.1 | |||
Diversified REITs | 12.1 | |||
Office REITs | 8.8 | |||
Real Estate Development | 4.2 | |||
Multi-Family Residential REITs | 4.0 | |||
Health Care REITs | 2.0 | |||
Hotel & Resort REITs | 1.5 | |||
Self Storage REITs | 1.0 | |||
Other (each representing less than 1%) | 0.8 | |||
GEOGRAPHIC ALLOCATION
| Country/Geographic Region | | Percent of Total Investments | (a) | |
Japan | 29.0 | % | ||
Hong Kong | 13.3 | |||
Australia | 12.8 | |||
United Kingdom | 9.6 | |||
Singapore | 9.0 | |||
Sweden | 4.0 | |||
Canada | 3.7 | |||
Germany | 3.7 | |||
France | 3.5 | |||
Switzerland | 2.5 | |||
Belgium | 2.5 | |||
Israel | 2.2 | |||
Other (each representing less than 1%) | 4.2 | |||
| (a) | Excludes money market funds. |
| 18 | 2 0 2 3 I SHARES ANNUAL REPORT TO SHAREHOLDERS |
| Fund Summary as of March 31, 2023 | iShares® International Developed Small Cap Value Factor ETF |
Investment Objective
The iShares International Developed Small Cap Value Factor ETF (the “Fund”) seeks to track the investment results of an index composed of international developed market small-capitalization stocks, excluding the U.S. and Korea, with prominent value characteristics, as represented by the FTSE Developed ex US ex Korea Small Cap Focused Value Index (the “Index”). The Fund invests in a representative sample of securities included in the Index that collectively has an investment profile similar to the Index. Due to the use of representative sampling, the Fund may or may not hold all of the securities that are included in the Index.
Performance
| Average Annual Total Returns | Cumulative Total Returns | |||||||||||||||||
| 1 Year | Since Inception | 1 Year | Since Inception | |||||||||||||||
Fund NAV | (4.56 | )% | (1.33)% | (4.56 | )% | (2.67 | )% | |||||||||||
Fund Market | (4.09 | ) | (1.10) | (4.09 | ) | (2.22 | ) | |||||||||||
Index | (5.37 | ) | (1.23) | (5.37 | ) | (2.46 | ) | |||||||||||
GROWTH OF $10,000 INVESTMENT
(SINCE INCEPTION AT NET ASSETVALUE)
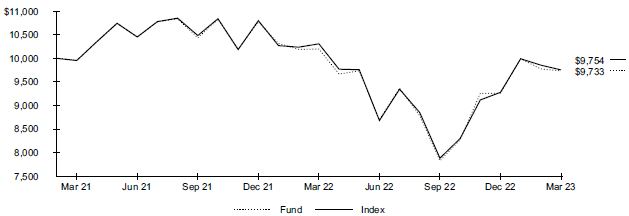
The inception date of the Fund was March 23, 2021. The first day of secondary market trading was March 25, 2021.
Past performance is not an indication of future results. Performance results do not reflect the deduction of taxes that a shareholder would pay on fund distributions or on the redemption or sale of fund shares. See “About Fund Performance” for more information.
Expense Example
| Actual | Hypothetical 5% Return | |||||||||||||||||||||||||
|
|
|
| |||||||||||||||||||||||
| | Beginning Account Value (10/01/22) | | | Ending Account Value (03/31/23) | | | Expenses Paid During the Period | (a) | | Beginning Account Value (10/01/22) | | | Ending Account Value (03/31/23) | | | Expenses Paid During the Period | (a) | | Annualized Expense Ratio | | ||||||
| $ 1,000.00 | $ 1,243.30 | $ 1.68 | $ 1,000.00 | $ 1,023.40 | $ 1.51 | 0.30 | % | |||||||||||||||||||
| (a) | Expenses are equal to the annualized expense ratio, multiplied by the average account value over the period, multiplied by 182/365 (to reflect the one-half year period shown). Other fees, such as brokerage commissions and other fees to financial intermediaries, may be paid which are not reflected in the tables and examples above. See “Disclosure of Expenses” for more information. |
FUND SUMMARY | 19 |
| Fund Summary as of March 31, 2023 (continued) | iShares® International Developed Small Cap Value Factor ETF |
Portfolio Management Commentary
International developed market small-capitalization stocks with prominent value characteristics declined for the reporting period amid a slowing global economy, elevated inflation, and high interest rates. U.K. stocks were the largest detractors from the Index’s performance, led by diversified real estate investment trusts (“REITs”). As interest rates edged higher, borrowing costs for firms investing in the U.K. rose significantly, squeezing profit margins and shrinking budgets. The deteriorating outlook and changing post-pandemic consumer shopping habits lowered rental income and decreased demand for warehouse properties. A sharp rise in yields also prompted property investors to cycle away from REITs in favor of government bonds.
Diversified REITs in Australia detracted from the Index’s performance amid a broader downturn in the real estate market. Higher interest rates and economic uncertainty negatively impacted the tenants of some commercial and industrial properties, which in turn pressured the REITs that own these properties. Companies involved in residential communities reported lower earnings and fewer deal closings due to labor shortages, construction delays, and rising inflation.
Canadian REIT stocks also detracted from the Index’s return as real estate stocks traded sharply lower following multiple interest rate hikes by the Bank of Canada. Commercial real estate companies reported delays in new lease agreements as clients weighed recession fears. Financials companies also detracted from the Index’s return amid high inflation and a challenging capital markets environment.
Conversely, Japanese stocks were significant contributors to the Index’s return. Steel makers raised prices to offset increased production costs and expanded into more profitable business lines, benefiting industrials stocks. Consumer discretionary companies gained as Japan reopened to foreigners and retail sales increased, particularly in the luxury watch market. Lastly, rising bank fees and higher interest rates proved profitable for Italian banks, driving contribution from Italian financials.
The Index’s selection process is designed to maximize exposure to small-capitalization stocks with prominent value characteristics, with screens to eliminate stocks with low liquidity, high volatility, high debt, negative sentiment, and negative momentum. Reflecting those constraints, the Index outperformed the broader market, as represented by the FTSE Developed ex US ex Korea Small Cap Focused Value Index. The value factor tends to perform relatively well during economic environments with high inflation and rising interest rates due in part to value’s lower-interest rate sensitivity and shorter-dated cash flows. Stock selection in the U.K., Japan, and Germany also contributed.
Portfolio Information
SECTOR ALLOCATION
| Sector | | Percent of Total Investments | (a) | |
Industrials | 23.9 | % | ||
Financials | 16.6 | |||
Materials | 14.4 | |||
Real Estate | 14.1 | |||
Consumer Discretionary | 9.1 | |||
Consumer Staples | 4.9 | |||
Energy | 4.2 | |||
Information Technology | 4.1 | |||
Health Care | 3.8 | |||
Utilities | 2.8 | |||
Communication Services | 2.1 | |||
GEOGRAPHIC ALLOCATION
| Country/Geographic Region | | Percent of Total Investments | (a) | |
Japan | 19.0 | % | ||
United Kingdom | 18.4 | |||
Canada | 17.0 | |||
Australia | 8.9 | |||
Switzerland | 8.8 | |||
Sweden | 5.6 | |||
Germany | 3.3 | |||
France | 2.9 | |||
Finland | 2.9 | |||
Belgium | 2.2 | |||
Austria | 2.2 | |||
Denmark | 2.2 | |||
Norway | 1.6 | |||
Singapore | 1.5 | |||
Italy | 1.1 | |||
New Zealand | 1.0 | |||
Other (each representing less than 1%) | 1.4 | |||
| (a) | Excludes money market funds. |
| 20 | 2 0 2 3 I SHARES ANNUAL REPORT TO SHAREHOLDERS |
| Fund Summary as of March 31, 2023 | iShares® International Dividend Growth ETF |
Investment Objective
The iShares International Dividend Growth ETF (the “Fund”) seeks to track the investment results of an index composed of international equities with a history of consistently growing dividends, as represented by the Morningstar® Global ex-US Dividend Growth IndexSM (the “Index”). The Fund invests in a representative sample of securities included in the Index that collectively has an investment profile similar to the Index. Due to the use of representative sampling, the Fund may or may not hold all of the securities that are included in the Index.
Performance
| Average Annual Total Returns | Cumulative Total Returns | |||||||||||||||||||||||||||
|
| |||||||||||||||||||||||||||
| 1 Year | 5 Years | Since Inception | 1 Year | 5 Years | Since Inception | |||||||||||||||||||||||
Fund NAV | (4.60 | )% | 4.17 | % | 6.01% | (4.60 | )% | 22.69 | % | 49.36 | % | |||||||||||||||||
Fund Market | (4.61 | ) | 4.01 | 6.04 | (4.61 | ) | 21.73 | 49.63 | ||||||||||||||||||||
Index | (5.46 | ) | 4.08 | 5.95 | (5.46 | ) | 22.12 | 48.76 | ||||||||||||||||||||
GROWTH OF $10,000 INVESTMENT
(SINCE INCEPTION AT NET ASSET VALUE)
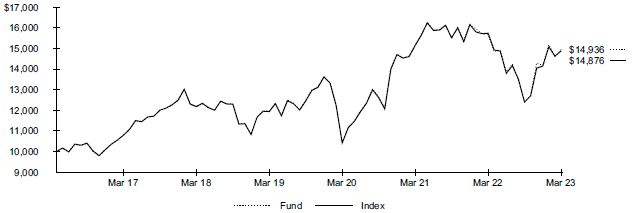
The inception date of the Fund was May 17, 2016. The first day of secondary market trading was May 19, 2016.
Past performance is not an indication of future results. Performance results do not reflect the deduction of taxes that a shareholder would pay on fund distributions or on the redemption or sale of fund shares. See “About Fund Performance” for more information.
Expense Example
| Actual | Hypothetical 5% Return | |||||||||||||||||||||||||
|
|
|
| |||||||||||||||||||||||
| | Beginning Account Value (10/01/22) | | | Ending Account Value (03/31/23) | | | Expenses Paid During the Period | (a) | | Beginning Account Value (10/01/22) | | | Ending Account Value (03/31/23) | | | Expenses Paid During the Period | (a) | | Annualized Expense Ratio | | ||||||
| $ 1,000.00 | $ 1,207.20 | $ 0.83 | $ 1,000.00 | $ 1,024.20 | $ 0.76 | 0.15 | % | |||||||||||||||||||
| (a) | Expenses are equal to the annualized expense ratio, multiplied by the average account value over the period, multiplied by 182/365 (to reflect the one-half year period shown). Other fees, such as brokerage commissions and other fees to financial intermediaries, may be paid which are not reflected in the tables and examples above. See “Disclosure of Expenses” for more information. |
FUND SUMMARY | 21 |
| Fund Summary as of March 31, 2023 (continued) | iShares® International Dividend Growth ETF |
Portfolio Management Commentary
Dividend stocks outside the U.S. declined amid rapidly rising interest rates and a weakening global economy. As central banks around the world raised interest rates, bond yields rose significantly. Dividend-bearing stocks are typically negatively impacted by higher yields, since higher income from bonds makes those investments relatively more attractive to income-seeking investors. Nonetheless, some investors viewed dividend-paying stocks as being more resilient in an economic downturn.
Canadian stocks led the decline, as bank stocks in the financials sector faced significant headwinds. Canada’s economic growth slowed during the reporting period, and the worsening economy drove an increase in provisions for loan losses at banks. A substantial payment to settle claims surrounding a large bank’s involvement with a fraudulent investment scheme also weighed on the banking industry. However, improved net interest margins amid rising interest rates helped the industry offset some of the negative impacts to income.
Swiss stocks also detracted from the Index’s performance, most notably in the healthcare sector. Pharmaceuticals companies faced declining demand for COVID-19 treatments and diagnostic testing kits as vaccinations against the virus expanded. Increased competition from several biosimilar cancer treatment drugs, which have similar active properties as older licensed drugs, also weakened sales.
In China, weakness in the financials sector detracted from performance, particularly in the banking industry. Investors’ concerns about exposure of banks to troubled Chinese property developers pressured the industry.
On the upside, Danish stocks contributed to the Index’s return, buoyed by the pharmaceuticals industry in the healthcare sector. The industry benefited from soaring sales and profits from a new anti-obesity drug, outstripping projections. However, the high costs of the drug, lack of insurance coverage, and production delays limited sales growth.
Spanish and French high-dividend stocks also gained. In Spain, the utilities sector benefited from its foreign operations, as strong profits from North and South America helped to offset a decline domestically. In France, the successful trial of a drug to treat pulmonary disease supported the pharmaceuticals industry in the healthcare sector.
Portfolio Information
| SECTOR ALLOCATION |
| |||
| Sector | | Percent of Total Investments | (a) | |
Financials | 25.7 | % | ||
Health Care | 15.9 | |||
Consumer Staples | 12.7 | |||
Industrials | 12.5 | |||
Utilities | 8.8 | |||
Materials | 7.0 | |||
Information Technology | 6.7 | |||
Communication Services | 3.1 | |||
Consumer Discretionary | 2.8 | |||
Energy | 2.8 | |||
Real Estate | 2.0 | |||
| GEOGRAPHIC ALLOCATION |
| |||
| Country/Geographic Region | | Percent of Total Investments | (a) | |
Canada | 19.5 | % | ||
Japan | 19.0 | |||
Switzerland | 12.2 | |||
United Kingdom | 11.9 | |||
China | 6.1 | |||
Germany | 5.9 | |||
France | 4.4 | |||
Denmark | 3.6 | |||
Spain | 2.7 | |||
Hong Kong | 2.5 | |||
India | 2.1 | |||
Australia | 2.1 | |||
Ireland | 1.2 | |||
Netherlands | 1.1 | |||
Other (each representing less than 1%) | 5.7 | |||
| (a) | Excludes money market funds. |
| 22 | 2 0 2 3 I SHARES ANNUAL REPORT TO SHAREHOLDERS |
| Fund Summary as of March 31, 2023 | iShares® Latin America 40 ETF |
Investment Objective
The iShares Latin America 40 ETF (the “Fund”) seeks to track the investment results of an index composed of 40 of the largest Latin American equities, as represented by the S&P Latin America 40TM (the “Index”). The Fund invests in a representative sample of securities included in the Index that collectively has an investment profile similar to the Index. Due to the use of representative sampling, the Fund may or may not hold all of the securities that are included in the Index.
Performance
| Average Annual Total Returns | Cumulative Total Returns | |||||||||||||||||||||||||||
|
| |||||||||||||||||||||||||||
| 1 Year | 5 Years | 10 Years | 1 Year | 5 Years | 10 Years | |||||||||||||||||||||||
Fund NAV | (11.29 | )% | (3.15 | )% | (1.97)% | (11.29 | )% | (14.80 | )% | (18.07 | )% | |||||||||||||||||
Fund Market | (11.43 | ) | (3.31 | ) | (1.97) | (11.43 | ) | (15.49 | ) | (18.07 | ) | |||||||||||||||||
Index | (10.76 | ) | (2.85 | ) | (1.60) | (10.76 | ) | (13.46 | ) | (14.87 | ) | |||||||||||||||||
GROWTH OF $10,000 INVESTMENT
(AT NET ASSET VALUE)
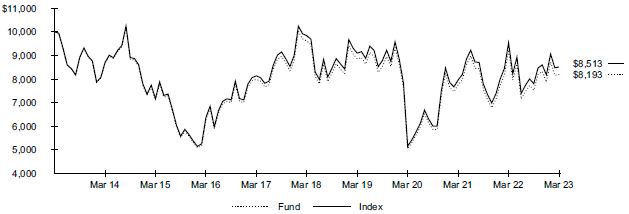
Index performance through January 30, 2013 is calculated using currency exchange (FX) rates corresponding to 5:15 P.M. ET. Index performance beginning on January 31, 2013 is calculated using FX rates corresponding to World Market Reuters 4:00 P.M. London.
Past performance is not an indication of future results. Performance results do not reflect the deduction of taxes that a shareholder would pay on fund distributions or on the redemption or sale of fund shares. See “About Fund Performance” for more information.
Expense Example
| Actual | Hypothetical 5% Return | |||||||||||||||||||||||||
|
|
|
| |||||||||||||||||||||||
| | Beginning Account Value (10/01/22) | | | Ending Account Value (03/31/23) | | | Expenses Paid During the Period | (a) | | Beginning Account Value (10/01/22) | | | Ending Account Value (03/31/23) | | | Expenses Paid During the Period | (a) | | Annualized Expense Ratio | | ||||||
| $ 1,000.00 | $ 1,088.20 | $ 2.50 | $ 1,000.00 | $ 1,022.50 | $ 2.42 | 0.48 | % | |||||||||||||||||||
| (a) | Expenses are equal to the annualized expense ratio, multiplied by the average account value over the period, multiplied by 182/365 (to reflect the one-half year period shown). Other fees, such as brokerage commissions and other fees to financial intermediaries, may be paid which are not reflected in the tables and examples above. See “Disclosure of Expenses” for more information. |
FUND SUMMARY | 23 |
| Fund Summary as of March 31, 2023 (continued) | iShares® Latin America 40 ETF |
Portfolio Management Commentary
Large-capitalization Latin American stocks declined significantly for the reporting period amid high inflation and tighter monetary policy. Brazil was the largest detractor from the Index’s return, as economic growth in the country faltered. Rising borrowing costs weakened the Brazilian economy, which slowed before finally contracting in the fourth quarter of 2022. The central bank of Brazil raised interest rates multiple times in response to elevated inflation and prices fell substantially over the course of the reporting period. The Brazilian real declined relative to the U.S. dollar amid tightening U.S. monetary policy and fiscal concerns in Brazil, reducing the value of Brazilian stocks in U.S. dollar terms.
The Brazilian financials sector was a significant source of weakness, particularly the banking industry. The worsening economic environment in Brazil weakened bank profits, as consumers’ reduced purchasing power drove an increase in expenses from delinquent loans expected to go unpaid. Rising operating costs also dented earnings in the banking industry. Brazil’s materials sector also detracted, as the metals and mining industry faced volatile prices for iron ore and fines for safety practices related to a dam collapse. Furthermore, high rainfall and equipment maintenance needs led to a reduction in iron ore production late in 2022. The consumer staples sector also declined, as an oversupply of poultry and high costs weighed on profitability in the packaged foods and meats industry.
Colombian stocks also detracted from the Index’s performance in an environment of tepid economic growth. Equities in Colombia faced headwinds following a presidential election and a new administration perceived by some investors as less business friendly. The financials sector declined the most, as inflation rose during the reporting period, pressuring bank customers’ purchasing power and ability to repay loans.
On the upside, Mexican stocks contributed slightly to the Index’s performance. Despite slow economic growth, unemployment dropped to the lowest rate in 20 years, and inflation began to decelerate. The Mexican banking industry benefited from an influx of new customers relocating factories closer to the U.S.
Portfolio Information
| SECTOR ALLOCATION |
| |||
| Sector | | Percent of Total Investments | (a) | |
Financials | 29.3 | % | ||
Materials | 26.7 | |||
Consumer Staples | 15.1 | |||
Energy | 11.2 | |||
Communication Services | 5.7 | |||
Industrials | 5.5 | |||
Utilities | 3.0 | |||
Consumer Discretionary | 1.6 | |||
Real Estate | 1.0 | |||
Health Care | 0.9 | |||
| GEOGRAPHIC ALLOCATION |
| |||
| Country/Geographic Region | | Percent of Total Investments | (a) | |
Brazil | 59.0 | % | ||
Mexico | 28.3 | |||
Chile | 7.2 | |||
Peru | 3.8 | |||
Colombia | 1.7 | |||
| (a) | Excludes money market funds. |
| 24 | 2 0 2 3 I SHARES ANNUAL REPORT TO SHAREHOLDERS |
Past performance is not an indication of future results. Financial markets have experienced extreme volatility and trading in many instruments has been disrupted. These circumstances may continue for an extended period of time and may continue to affect adversely the value and liquidity of each Fund’s investments. As a result, current performance may be lower or higher than the performance data quoted. Performance data current to the most recent month-end is available at iShares.com. Performance results assume reinvestment of all dividends and capital gain distributions and do not reflect the deduction of taxes that a shareholder would pay on fund distributions or on the redemption or sale of fund shares. The investment return and principal value of shares will vary with changes in market conditions. Shares may be worth more or less than their original cost when they are redeemed or sold in the market. Performance for certain funds may reflect a waiver of a portion of investment advisory fees. Without such a waiver, performance would have been lower.
Net asset value or “NAV” is the value of one share of a fund as calculated in accordance with the standard formula for valuing mutual fund shares. Beginning August 10, 2020, the price used to calculate market return (“Market Price”) is the closing price. Prior to August 10, 2020, Market Price was determined using the midpoint between the highest bid and the lowest ask on the primary stock exchange on which shares of a fund are listed for trading, as of the time that such fund’s NAV is calculated. Since shares of a fund may not trade in the secondary market until after the fund’s inception, for the period from inception to the first day of secondary market trading in shares of the fund, the NAV of the fund is used as a proxy for the Market Price to calculate market returns. Market and NAV returns assume that dividends and capital gain distributions have been reinvested at Market Price and NAV, respectively.
An index is a statistical composite that tracks a specified financial market or sector. Unlike a fund, an index does not actually hold a portfolio of securities and therefore does not incur the expenses incurred by a fund. These expenses negatively impact fund performance. Also, market returns do not include brokerage commissions that may be payable on secondary market transactions. If brokerage commissions were included, market returns would be lower.
Shareholders of each Fund may incur the following charges: (1) transactional expenses, including brokerage commissions on purchases and sales of fund shares and (2) ongoing expenses, including management fees and other fund expenses. The expense examples shown (which are based on a hypothetical investment of $1,000 invested at the beginning of the period and held through the end of the period) are intended to assist shareholders both in calculating expenses based on an investment in each Fund and in comparing these expenses with similar costs of investing in other funds.
The expense examples provide information about actual account values and actual expenses. Annualized expense ratios reflect contractual and voluntary fee waivers, if any. In order to estimate the expenses a shareholder paid during the period covered by this report, shareholders can divide their account value by $1,000 and then multiply the result by the number under the heading entitled “Expenses Paid During the Period.”
The expense examples also provide information about hypothetical account values and hypothetical expenses based on a fund’s actual expense ratio and an assumed rate of return of 5% per year before expenses. In order to assist shareholders in comparing the ongoing expenses of investing in the Funds and other funds, compare the 5% hypothetical examples with the 5% hypothetical examples that appear in the shareholder reports of the other funds.
The expenses shown in the expense examples are intended to highlight shareholders’ ongoing costs only and do not reflect any transactional expenses, such as brokerage commissions and other fees paid on purchases and sales of fund shares. Therefore, the hypothetical examples are useful in comparing ongoing expenses only and will not help shareholders determine the relative total expenses of owning different funds. If these transactional expenses were included, shareholder expenses would have been higher.
ABOUT FUND PERFORMANCE / DISCLOSURE OF EXPENSES | 25 |
March 31, 2023 | iShares® Asia 50 ETF (Percentages shown are based on Net Assets) |
| Security | Shares | Value | ||||||
Common Stocks | ||||||||
| China — 40.9% | ||||||||
Alibaba Group Holding Ltd.(a) | 10,500,000 | $ | 132,987,613 | |||||
ANTA Sports Products Ltd. | 733,600 | 10,651,218 | ||||||
Baidu Inc.(a) | 1,540,100 | 29,017,438 | ||||||
Bank of China Ltd., Class H | 52,862,000 | 20,265,535 | ||||||
BYD Co. Ltd., Class H | 589,500 | 17,340,821 | ||||||
China Construction Bank Corp., Class H | 66,988,960 | 43,354,911 | ||||||
China Merchants Bank Co. Ltd., Class H | 2,243,500 | 11,392,531 | ||||||
Industrial & Commercial Bank of China Ltd., Class H | 48,395,115 | 25,719,058 | ||||||
JD.com Inc., Class A | 1,633,500 | 35,669,421 | ||||||
Kuaishou Technology(a)(b) | 1,319,600 | 10,146,820 | ||||||
Li Ning Co. Ltd. | 1,593,000 | 12,527,205 | ||||||
Meituan, Class B(a)(b) | 3,197,580 | 58,011,181 | ||||||
NetEase Inc. | 1,244,000 | 21,960,168 | ||||||
Ping An Insurance Group Co. of China Ltd., Class H | 4,203,500 | 27,193,334 | ||||||
Tencent Holdings Ltd. | 4,088,400 | 199,797,222 | ||||||
Wuxi Biologics Cayman Inc.(a)(b) | 2,419,500 | 14,908,857 | ||||||
Xiaomi Corp., Class B(a)(b) | 9,803,000 | 15,086,326 | ||||||
|
| |||||||
| 686,029,659 | ||||||||
| Hong Kong — 10.1% | ||||||||
AIA Group Ltd. | 7,939,600 | 83,265,405 | ||||||
CK Hutchison Holdings Ltd. | 1,825,148 | 11,291,547 | ||||||
Hong Kong Exchanges & Clearing Ltd. | 795,300 | 35,251,430 | ||||||
Link REIT | 1,725,460 | 11,095,106 | ||||||
Sun Hung Kai Properties Ltd. | 1,025,500 | 14,366,841 | ||||||
Techtronic Industries Co. Ltd. | 1,247,000 | 13,511,376 | ||||||
|
| |||||||
| 168,781,705 | ||||||||
| Singapore — 4.8% | ||||||||
DBS Group Holdings Ltd. | 1,241,900 | 30,875,790 | ||||||
Oversea-Chinese Banking Corp. Ltd. | 2,748,374 | 25,619,742 | ||||||
United Overseas Bank Ltd. | 1,047,200 | 23,487,690 | ||||||
|
| |||||||
| 79,983,222 | ||||||||
| South Korea — 20.4% | ||||||||
Celltrion Inc. | 73,060 | 8,444,871 | ||||||
Hyundai Motor Co. | 95,728 | 13,619,467 | ||||||
Kakao Corp. | 212,251 | 10,051,953 | ||||||
KB Financial Group Inc. | 260,683 | 9,520,713 | ||||||
Kia Corp. | 182,945 | 11,417,240 | ||||||
LG Chem Ltd. | 32,157 | 17,660,417 | ||||||
LG Energy Solution(a) | 28,546 | 12,861,478 | ||||||
NAVER Corp. | 101,405 | 15,889,244 | ||||||
POSCO Holdings Inc. | 50,030 | 14,154,545 | ||||||
Samsung Electronics Co. Ltd. | 3,485,719 | 172,372,139 | ||||||
Samsung SDI Co. Ltd. | 37,423 | 21,257,711 | ||||||
Shinhan Financial Group Co. Ltd. | 345,068 | 9,373,881 | ||||||
SK Hynix Inc. | 366,508 | 25,081,944 | ||||||
|
| |||||||
| 341,705,603 | ||||||||
| Security | Shares | Value | ||||||
| Taiwan — 21.8% | ||||||||
Cathay Financial Holding Co. Ltd. | 6,465,235 | $ | 8,901,640 | |||||
Chunghwa Telecom Co. Ltd. | 2,580,551 | 10,143,876 | ||||||
CTBC Financial Holding Co. Ltd. | 13,292,359 | 9,572,231 | ||||||
Delta Electronics Inc. | 1,305,000 | 12,947,735 | ||||||
Formosa Plastics Corp. | 2,951,071 | 8,909,300 | ||||||
Fubon Financial Holding Co. Ltd. | 5,364,600 | 9,984,084 | ||||||
Hon Hai Precision Industry Co. Ltd. | 8,180,052 | 28,000,273 | ||||||
MediaTek Inc. | 1,085,112 | 28,132,739 | ||||||
Nan Ya Plastics Corp. | 3,846,510 | 9,798,262 | ||||||
Taiwan Semiconductor Manufacturing Co. Ltd. | 12,852,343 | 225,232,246 | ||||||
United Microelectronics Corp. | 7,884,000 | 13,796,460 | ||||||
|
| |||||||
| 365,418,846 | ||||||||
|
| |||||||
Total Common Stocks — 98.0% | 1,641,919,035 | |||||||
|
| |||||||
Preferred Stocks | ||||||||
| South Korea — 1.6% | ||||||||
Hyundai Motor Co., Series 2, Preference Shares, NVS | 24,550 | 1,813,440 | ||||||
LG Chem Ltd., Preference Shares, NVS | 5,173 | 1,239,478 | ||||||
Samsung Electronics Co. Ltd., Preference Shares, NVS. | 559,778 | 23,294,938 | ||||||
|
| |||||||
| 26,347,856 | ||||||||
|
| |||||||
Total Preferred Stocks — 1.6% | 26,347,856 | |||||||
|
| |||||||
Total Long-Term Investments — 99.6% | 1,668,266,891 | |||||||
|
| |||||||
Short-Term Securities | ||||||||
| Money Market Funds — 0.0% | ||||||||
BlackRock Cash Funds: Treasury, SL Agency Shares, 4.73%(c)(d) | 700,000 | 700,000 | ||||||
|
| |||||||
Total Short-Term Securities — 0.0% | 700,000 | |||||||
|
| |||||||
Total Investments — 99.6% | 1,668,966,891 | |||||||
Other Assets Less Liabilities — 0.4% | 6,557,662 | |||||||
|
| |||||||
Net Assets — 100.0% | $ | 1,675,524,553 | ||||||
|
| |||||||
| (a) | Non-income producing security. |
| (b) | Security exempt from registration pursuant to Rule 144A under the Securities Act of 1933, as amended. These securities may be resold in transactions exempt from registration to qualified institutional investors. |
| (c) | Affiliate of the Fund. |
| (d) | Annualized 7-day yield as of period end. |
| 26 | 2 0 2 3 I SHARES ANNUAL REPORT TO SHAREHOLDERS |
Schedule of Investments (continued) March 31, 2023 | iShares® Asia 50 ETF |
Affiliates
Investments in issuers considered to be affiliate(s) of the Fund during the year ended March 31, 2023 for purposes of Section 2(a)(3) of the Investment Company Act of 1940, as amended, were as follows:
| ||||||||||||||||||||||||||||||||||||
| Affiliated Issuer | Value at 03/31/22 | Purchases at Cost | Proceeds from Sale | Net Realized Gain (Loss) | Change in Unrealized Appreciation (Depreciation) | Value at 03/31/23 | Shares Held at 03/31/23 | Income | Capital Gain | |||||||||||||||||||||||||||
| ||||||||||||||||||||||||||||||||||||
BlackRock Cash Funds: Institutional, SL Agency Shares(a) | $ | — | $ | 3,438 | (b) | $ | — | $ | (3,438 | ) | $ | — | $ | — | — | $ | 10,844 | (c) | $ | — | ||||||||||||||||
BlackRock Cash Funds: Treasury, SL Agency Shares | — | 700,000 | (b) | — | — | — | 700,000 | 700,000 | 33,046 | — | ||||||||||||||||||||||||||
|
|
|
|
|
|
|
|
|
| |||||||||||||||||||||||||||
| $ | (3,438 | ) | $ | — | $ | 700,000 | $ | 43,890 | $ | — | ||||||||||||||||||||||||||
|
|
|
|
|
|
|
|
|
| |||||||||||||||||||||||||||
| (a) | As of period end, the entity is no longer held. |
| (b) | Represents net amount purchased (sold). |
| (c) | All or a portion represents securities lending income earned from the reinvestment of cash collateral from loaned securities, net of fees and collateral investment expenses, and other payments to and from borrowers of securities. |
Derivative Financial Instruments Outstanding as of Period End
Futures Contracts
| ||||||||||||||||
| Description | Number of Contracts | Expiration Date | Notional Amount (000) | Value/ Unrealized Appreciation (Depreciation) | ||||||||||||
| ||||||||||||||||
Long Contracts | ||||||||||||||||
FTSE Taiwan Index | 35 | 04/27/23 | $ | 1,948 | $ | 2,223 | ||||||||||
MSCI China Index | 130 | 06/16/23 | 3,293 | 127,253 | ||||||||||||
MSCI Emerging Markets Index | 30 | 06/16/23 | 1,493 | 47,090 | ||||||||||||
|
| |||||||||||||||
| $ | 176,566 | |||||||||||||||
|
| |||||||||||||||
Derivative Financial Instruments Categorized by Risk Exposure
As of period end, the fair values of derivative financial instruments located in the Statements of Assets and Liabilities were as follows:
| ||||||||||||||||||||||||||||
| Commodity Contracts | Credit Contracts | Equity Contracts | Foreign Currency Exchange Contracts | Interest Rate Contracts | Other Contracts | Total | ||||||||||||||||||||||
| ||||||||||||||||||||||||||||
Assets — Derivative Financial Instruments | ||||||||||||||||||||||||||||
Futures contracts | ||||||||||||||||||||||||||||
Unrealized appreciation on futures contracts(a) | $ | — | $ | — | $ | 176,566 | $ | — | $ | — | $ | — | $ | 176,566 | ||||||||||||||
|
|
|
|
|
|
|
|
|
|
|
|
|
| |||||||||||||||
| (a) | Net cumulative unrealized appreciation (depreciation) on futures contracts are reported in the Schedule of Investments. In the Statements of Assets and Liabilities, only current day’s variation margin is reported in receivables or payables and the net cumulative unrealized appreciation (depreciation) is included in accumulated earnings (loss). |
For the period ended March 31, 2023, the effect of derivative financial instruments in the Statements of Operations was as follows:
| ||||||||||||||||||||||||||||
| Commodity Contracts | Credit Contracts | Equity Contracts | Foreign Currency Exchange Contracts | Interest Rate Contracts | Other Contracts | Total | ||||||||||||||||||||||
| ||||||||||||||||||||||||||||
Net Realized Gain (Loss) from | ||||||||||||||||||||||||||||
Futures contracts | $ | — | $ | — | $ | (556,346 | ) | $ | — | $ | — | $ | — | $ | (556,346 | ) | ||||||||||||
|
|
|
|
|
|
|
|
|
|
|
|
|
| |||||||||||||||
Net Change in Unrealized Appreciation (Depreciation) on | ||||||||||||||||||||||||||||
Futures contracts | $ | — | $ | — | $ | (63,530 | ) | $ | — | $ | — | $ | — | $ | (63,530 | ) | ||||||||||||
|
|
|
|
|
|
|
|
|
|
|
|
|
| |||||||||||||||
SCHEDULE OF INVESTMENTS | 27 |
Schedule of Investments (continued) March 31, 2023 | iShares® Asia 50 ETF |
Average Quarterly Balances of Outstanding Derivative Financial Instruments
Futures contracts | ||||
Average notional value of contracts — long | $ | 6,913,361 | ||
For more information about the Fund’s investment risks regarding derivative financial instruments, refer to the Notes to Financial Statements.
Fair Value Hierarchy as of Period End
Various inputs are used in determining the fair value of financial instruments. For a description of the input levels and information about the Fund’s policy regarding valuation of financial instruments, refer to the Notes to Financial Statements.
The following table summarizes the Fund’s financial instruments categorized in the fair value hierarchy. The breakdown of the Fund’s financial instruments into major categories is disclosed in the Schedule of Investments above.
| ||||||||||||||||
| Level 1 | Level 2 | Level 3 | Total | |||||||||||||
| ||||||||||||||||
Assets | ||||||||||||||||
Investments | ||||||||||||||||
Long-Term Investments | ||||||||||||||||
Common Stocks | $ | — | $ | 1,641,919,035 | $ | — | $ | 1,641,919,035 | ||||||||
Preferred Stocks | — | 26,347,856 | — | 26,347,856 | ||||||||||||
Short-Term Securities | ||||||||||||||||
Money Market Funds | 700,000 | — | — | 700,000 | ||||||||||||
|
|
|
|
|
|
|
| |||||||||
| $ | 700,000 | $ | 1,668,266,891 | $ | — | $ | 1,668,966,891 | |||||||||
|
|
|
|
|
|
|
| |||||||||
Derivative Financial Instruments(a) | ||||||||||||||||
Assets | ||||||||||||||||
Equity Contracts | $ | 47,090 | $ | 129,476 | $ | — | $ | 176,566 | ||||||||
|
|
|
|
|
|
|
| |||||||||
| (a) | Derivative financial instruments are futures contracts. Futures contracts are valued at the unrealized appreciation (depreciation) on the instrument. |
See notes to financial statements.
| 28 | 2 0 2 3 I SHARES ANNUAL REPORT TO SHAREHOLDERS |
Schedule of Investments March 31, 2023 | iShares® Blockchain and Tech ETF (Percentages shown are based on Net Assets) |
| Security | Shares | Value | ||||||
| ||||||||
Common Stocks | ||||||||
| Capital Markets — 18.0% | ||||||||
Allfunds Group PLC | 5,971 | $ | 39,570 | |||||
Bakkt Holdings Inc.(a)(b) | 102,362 | 176,063 | ||||||
Coinbase Global Inc., Class A(a)(b) | 10,877 | 734,959 | ||||||
Galaxy Digital Holdings Ltd.(a) | 24,446 | 93,334 | ||||||
Robinhood Markets Inc., Class A(a) | 6,257 | 60,756 | ||||||
SBI Holdings Inc. | 3,500 | 69,509 | ||||||
Voyager Digital Ltd.(a) | 57,043 | 1,426 | ||||||
|
| |||||||
| 1,175,617 | ||||||||
| Financial Services — 12.9% | ||||||||
Block Inc. New(a) | 8,675 | 595,539 | ||||||
Lakala Payment Co. Ltd., Class A(a) | 6,200 | 16,956 | ||||||
PayPal Holdings Inc.(a) | 3,066 | 232,832 | ||||||
|
| |||||||
| 845,327 | ||||||||
| Insurance — 3.3% | ||||||||
Ping An Insurance Group Co. of China Ltd., Class A | 32,100 | 212,614 | ||||||
|
| |||||||
| Interactive Media & Services — 1.4% | ||||||||
Z Holdings Corp. | 32,900 | 93,286 | ||||||
|
| |||||||
| IT Services — 7.2% | ||||||||
Digital Garage Inc. | 500 | 16,517 | ||||||
DXC Technology Co.(a) | 3,280 | 83,837 | ||||||
GMO internet group Inc. | 900 | 17,542 | ||||||
International Business Machines Corp. | 1,804 | 236,486 | ||||||
NTT Data Corp. | 8,600 | 113,060 | ||||||
|
| |||||||
| 467,442 | ||||||||
| Broadline Retail — 1.4% | ||||||||
GoTo Gojek Tokopedia Tbk PT(a) | 12,556,000 | 91,408 | ||||||
|
| |||||||
| Professional Services — 3.8% | ||||||||
Wolters Kluwer NV | 1,993 | 251,589 | ||||||
|
| |||||||
| Semiconductors & Semiconductor Equipment — 9.7% | ||||||||
Advanced Micro Devices Inc.(a) | 2,869 | 281,191 | ||||||
Ambarella Inc.(a) | 530 | 41,032 | ||||||
Amlogic Shanghai Co. Ltd.(a) | 3,101 | 37,921 | ||||||
Nvidia Corp. | 979 | 271,937 | ||||||
|
| |||||||
| 632,081 | ||||||||
| Security | Shares | Value | ||||||
| ||||||||
Software — 38.8% | ||||||||
Applied Blockchain Inc., NVS(a) | 22,747 | $ | 50,953 | |||||
Bit Digital Inc.(a)(b) | 53,215 | 81,951 | ||||||
Bitfarms Ltd/Canada(a)(b) | 122,295 | 118,626 | ||||||
Cleanspark Inc.(a) | 103,187 | 286,860 | ||||||
Hive Blockchain Technologies Ltd.(a)(b) | 35,373 | 116,377 | ||||||
Hut 8 Mining Corp.(a)(b) | 168,672 | 312,043 | ||||||
Iris Energy Ltd.(a) | 20,449 | 62,574 | ||||||
Marathon Digital Holdings Inc.(a)(b) | 41,243 | 359,639 | ||||||
Riot Blockchain Inc.(a)(b) | 110,674 | 1,105,633 | ||||||
Shenzhen Kingdom Sci-Tech Co. Ltd., Class A | 8,800 | 18,037 | ||||||
YGSOFT Inc. | 15,400 | 21,022 | ||||||
|
| |||||||
| 2,533,715 | ||||||||
| Technology Hardware, Storage & Peripherals — 3.0% | ||||||||
Canaan Inc., ADR(a)(b) | 62,001 | 167,403 | ||||||
GRG Banking Equipment Co. Ltd., Class A | 15,100 | 26,933 | ||||||
|
| |||||||
| 194,336 | ||||||||
|
| |||||||
Total Long-Term Investments — 99.5% | 6,497,415 | |||||||
|
| |||||||
Short-Term Securities | ||||||||
| Money Market Funds — 34.9% | ||||||||
BlackRock Cash Funds: Institutional, SL Agency Shares, 5.01%(c)(d)(e) | 2,274,156 | 2,274,838 | ||||||
|
| |||||||
Total Short-Term Securities — 34.9% | 2,274,838 | |||||||
|
| |||||||
Total Investments — 134.4% | 8,772,253 | |||||||
|
| |||||||
Liabilities in Excess of Other Assets — (34.4)% |
| (2,242,868 | ) | |||||
|
| |||||||
Net Assets — 100.0% | $ | 6,529,385 | ||||||
|
| |||||||
| (a) | Non-income producing security. |
| (b) | All or a portion of this security is on loan. |
| (c) | Affiliate of the Fund. |
| (d) | Annualized 7-day yield as of period end. |
| (e) | All or a portion of this security was purchased with the cash collateral from loaned securities. |
Affiliates
Investments in issuers considered to be affiliate(s) of the Fund during the period ended March 31, 2023 for purposes of Section 2(a)(3) of the Investment Company Act of 1940, as amended, were as follows:
| ||||||||||||||||||||||||||||||||||||
| Affiliated Issuer | | Value at 04/25/22 | (a) | | Purchases at Cost | | | Proceeds from Sale | | | Net Realized Gain (Loss) | | | Change in Unrealized Appreciation (Depreciation) | | | Value at 03/31/23 | | | Shares Held at | | Income | | Capital Gain Distributions |
| |||||||||||
| ||||||||||||||||||||||||||||||||||||
BlackRock Cash Funds: Institutional, SL Agency Shares | $ | — | $ | 2,274,571 | (b) | $ | — | $ | 136 | $ | 131 | $ | 2,274,838 | 2,274,156 | $ | 86,813 | (c) | $ | — | |||||||||||||||||
BlackRock Cash Funds: Treasury, SL Agency Shares(d) | — | 0 | (b) | — | — | — | — | — | 206 | — | ||||||||||||||||||||||||||
|
|
|
|
|
|
|
|
|
| |||||||||||||||||||||||||||
| $ | 136 | $ | 131 | $ | 2,274,838 | $ | 87,019 | $ | — | |||||||||||||||||||||||||||
|
|
|
|
|
|
|
|
|
| |||||||||||||||||||||||||||
| (a) | Commencement of operations. |
| (b) | Represents net amount purchased (sold). |
SCHEDULE OF INVESTMENTS | 29 |
Schedule of Investments (continued) March 31, 2023 | iShares® Blockchain and Tech ETF |
| (c) | All or a portion represents securities lending income earned from the reinvestment of cash collateral from loaned securities, net of fees and collateral investment expenses, and other payments to and from borrowers of securities. |
| (d) | As of period end, the entity is no longer held. |
Derivative Financial Instruments Outstanding as of Period End
Futures Contracts
| ||||||||||||||||
| Description | Number of Contracts | Expiration Date | Notional Amount (000) | Value/ Unrealized Appreciation (Depreciation) | ||||||||||||
| ||||||||||||||||
Long Contracts | ||||||||||||||||
Micro E-Mini Russell 2000 Index | 2 | 06/16/23 | $ | 18 | $ | 750 | ||||||||||
|
| |||||||||||||||
Derivative Financial Instruments Categorized by Risk Exposure
As of period end, the fair values of derivative financial instruments located in the Statements of Assets and Liabilities were as follows:
| ||||||||||||||||||||||||||||
| Commodity Contracts | Credit Contracts | Equity Contracts | Foreign Currency Exchange Contracts | Interest Rate Contracts | Other Contracts | Total | ||||||||||||||||||||||
| ||||||||||||||||||||||||||||
Assets — Derivative Financial Instruments | ||||||||||||||||||||||||||||
Futures contracts | ||||||||||||||||||||||||||||
Unrealized appreciation on futures contracts(a) | $ | — | $ | — | $ | 750 | $ | — | $ | — | $ | — | $ | 750 | ||||||||||||||
|
|
|
|
|
|
|
|
|
|
|
|
|
| |||||||||||||||
| (a) | Net cumulative unrealized appreciation (depreciation) on futures contracts are reported in the Schedule of Investments. In the Statements of Assets and Liabilities, only current day’s variation margin is reported in receivables or payables and the net cumulative unrealized appreciation (depreciation) is included in accumulated earnings (loss). |
For the period ended March 31, 2023, the effect of derivative financial instruments in the Statements of Operations was as follows:
| ||||||||||||||||||||||||||||
| Commodity Contracts | Credit Contracts | Equity Contracts | Foreign Currency Exchange Contracts | Interest Rate Contracts | Other Contracts | Total | ||||||||||||||||||||||
| ||||||||||||||||||||||||||||
Net Realized Gain (Loss) from | ||||||||||||||||||||||||||||
Futures contracts | $ | — | $ | — | $ | (1,154 | ) | $ | — | $ | — | $ | — | $ | (1,154 | ) | ||||||||||||
|
|
|
|
|
|
|
|
|
|
|
|
|
| |||||||||||||||
Net Change in Unrealized Appreciation (Depreciation) on | ||||||||||||||||||||||||||||
Futures contracts | $ | — | $ | — | $ | 750 | $ | — | $ | — | $ | — | $ | 750 | ||||||||||||||
|
|
|
|
|
|
|
|
|
|
|
|
|
| |||||||||||||||
Average Quarterly Balances of Outstanding Derivative Financial Instruments
| ||||
Futures contracts | ||||
Average notional value of contracts — long | $ | 6,747 | ||
| ||||
For more information about the Fund’s investment risks regarding derivative financial instruments, refer to the Notes to Financial Statements.
Fair Value Hierarchy as of Period End
Various inputs are used in determining the fair value of financial instruments. For a description of the input levels and information about the Fund’s policy regarding valuation of financial instruments, refer to the Notes to Financial Statements.
The following table summarizes the Fund’s financial instruments categorized in the fair value hierarchy. The breakdown of the Fund’s financial instruments into major categories is disclosed in the Schedule of Investments above.
| ||||||||||||||||
| Level 1 | Level 2 | Level 3 | Total | |||||||||||||
| ||||||||||||||||
Assets | ||||||||||||||||
Investments | ||||||||||||||||
Long-Term Investments | ||||||||||||||||
Common Stocks | $ | 5,470,025 | $ | 1,027,390 | $ | — | $ | 6,497,415 | ||||||||
| 30 | 2 0 2 3 I SHARES ANNUAL REPORT TO SHAREHOLDERS |
Schedule of Investments (continued) March 31, 2023 | iShares® Blockchain and Tech ETF |
Fair Value Hierarchy as of Period End (continued)
| ||||||||||||||||
| Level 1 | Level 2 | Level 3 | Total | |||||||||||||
| ||||||||||||||||
Short-Term Securities | ||||||||||||||||
Money Market Funds | $ | 2,274,838 | $ | — | $ | — | $ | 2,274,838 | ||||||||
|
|
|
|
|
|
|
| |||||||||
| $ | 7,744,863 | $ | 1,027,390 | $ | — | $ | 8,772,253 | |||||||||
|
|
|
|
|
|
|
| |||||||||
Derivative Financial Instruments(a) | ||||||||||||||||
Assets | ||||||||||||||||
Equity Contracts | $ | 750 | $ | — | $ | — | $ | 750 | ||||||||
|
|
|
|
|
|
|
| |||||||||
| (a) | Derivative financial instruments are futures contracts. Futures contracts are valued at the unrealized appreciation (depreciation) on the instrument. |
See notes to financial statements.
SCHEDULE OF INVESTMENTS | 31 |
Schedule of Investments March 31, 2023 | iShares® Emerging Markets Infrastructure ETF (Percentages shown are based on Net Assets) |
| Security | Shares | Value | ||||||
Common Stocks | ||||||||
| Brazil — 17.2% | ||||||||
CCR SA | 279,027 | $ | 704,662 | |||||
Centrais Eletricas Brasileiras SA, ADR | 258,634 | 1,714,744 | ||||||
Cia. de Saneamento Basico do Estado de Sao Paulo, ADR | 69,417 | 694,864 | ||||||
Ultrapar Participacoes SA, ADR | 287,621 | 785,205 | ||||||
|
| |||||||
| 3,899,475 | ||||||||
| China — 39.6% | ||||||||
Beijing Capital International Airport Co. Ltd., Class H(a) | 420,000 | 309,325 | ||||||
CGN Power Co. Ltd., Class H(b) | 2,268,000 | 542,992 | ||||||
China Gas Holdings Ltd. | 605,600 | 852,645 | ||||||
China Longyuan Power Group Corp. Ltd., Class H | 674,000 | 768,908 | ||||||
China Merchants Port Holdings Co. Ltd. | 342,000 | 525,035 | ||||||
China Oilfield Services Ltd., Class H | 718,000 | 738,100 | ||||||
China Power International Development Ltd. | 1,008,000 | 401,389 | ||||||
China Resources Gas Group Ltd. | 183,500 | 674,988 | ||||||
China Resources Power Holdings Co. Ltd. | 364,000 | 776,629 | ||||||
China Suntien Green Energy Corp. Ltd., Class H | 735,000 | 321,498 | ||||||
COSCO SHIPPING Energy Transportation Co. Ltd., Class H(a)(c) | 514,000 | 531,502 | ||||||
COSCO SHIPPING Ports Ltd. | 424,000 | 283,519 | ||||||
Guangdong Investment Ltd. | 570,000 | 583,095 | ||||||
Jiangsu Expressway Co. Ltd., Class H | 310,000 | 288,291 | ||||||
Kunlun Energy Co. Ltd. | 814,000 | 635,513 | ||||||
Shenzhen Expressway Co. Ltd., Class H | 148,000 | 131,490 | ||||||
Shenzhen International Holdings Ltd. | 346,999 | 307,029 | ||||||
Zhejiang Expressway Co. Ltd., Class H | 346,000 | 275,278 | ||||||
|
| |||||||
| 8,947,226 | ||||||||
| Mexico — 17.6% | ||||||||
Grupo Aeroportuario del Centro Norte SAB de CV, ADR | 8,533 | 763,789 | ||||||
Grupo Aeroportuario del Pacifico SAB de CV, ADR | 9,081 | 1,771,794 | ||||||
Grupo Aeroportuario del Sureste SAB de CV, ADR | 4,721 | 1,446,845 | ||||||
|
| |||||||
| 3,982,428 | ||||||||
| Qatar — 4.5% | ||||||||
Qatar Gas Transport Co. Ltd. | 1,076,310 | 1,016,503 | ||||||
|
| |||||||
| South Korea — 3.3% | ||||||||
Korea Electric Power Corp., ADR(a)(c) | 104,315 | 723,946 | ||||||
SK Gas Ltd. | 254 | 23,224 | ||||||
|
| |||||||
| 747,170 | ||||||||
| Thailand — 9.8% | ||||||||
Airports of Thailand PCL, NVDR(a) | 1,062,900 | 2,208,828 | ||||||
|
| |||||||
| Security | Shares | Value | ||||||
| ||||||||
| United Arab Emirates — 4.8% | ||||||||
ADNOC Drilling Co. PJSC | 1,015,219 | $ | 1,091,930 | |||||
|
| |||||||
Total Common Stocks — 96.8% | 21,893,560 | |||||||
|
| |||||||
Preferred Stocks | ||||||||
| Brazil — 3.0% | ||||||||
Cia. Energetica de Minas Gerais, Preference Shares, ADR | 297,674 | 666,790 | ||||||
|
| |||||||
| Russia — 0.0% | ||||||||
Transneft PJSC, Preference Shares, NVS(d) | 640 | — | ||||||
|
| |||||||
Total Preferred Stocks — 3.0% |
| 666,790 | ||||||
|
| |||||||
Total Long-Term Investments — 99.8% |
| 22,560,350 | ||||||
|
| |||||||
Short-Term Securities | ||||||||
| Money Market Funds — 4.4% | ||||||||
BlackRock Cash Funds: Institutional, SL Agency Shares, 5.01%(e)(f)(g) | 950,719 | 951,005 | ||||||
BlackRock Cash Funds: Treasury, SL Agency Shares, 4.73%(e)(f) | 40,000 | 40,000 | ||||||
|
| |||||||
Total Short-Term Securities — 4.4% | 991,005 | |||||||
|
| |||||||
Total Investments — 104.2% | 23,551,355 | |||||||
Liabilities in Excess of Other Assets — (4.2)% |
| (938,471 | ) | |||||
|
| |||||||
Net Assets — 100.0% | $ | 22,612,884 | ||||||
|
| |||||||
| (a) | Non-income producing security. |
| (b) | Security exempt from registration pursuant to Rule 144A under the Securities Act of 1933, as amended. These securities may be resold in transactions exempt from registration to qualified institutional investors. |
| (c) | All or a portion of this security is on loan. |
| (d) | Security is valued using significant unobservable inputs and is classified as Level 3 in the fair value hierarchy. |
| (e) | Affiliate of the Fund. |
| (f) | Annualized 7-day yield as of period end. |
| (g) | All or a portion of this security was purchased with the cash collateral from loaned securities. |
| 32 | 2 0 2 3 I SHARES ANNUAL REPORT TO SHAREHOLDERS |
Schedule of Investments (continued) March 31, 2023 | iShares® Emerging Markets Infrastructure ETF |
Affiliates
Investments in issuers considered to be affiliate(s) of the Fund during the year ended March 31, 2023 for purposes of Section 2(a)(3) of the Investment Company Act of 1940, as amended, were as follows:
| ||||||||||||||||||||||||||||||||||||
| Affiliated Issuer | Value at 03/31/22 | Purchases at Cost | Proceeds from Sale | Net Realized Gain (Loss) | Change in Unrealized Appreciation (Depreciation) | Value at 03/31/23 | Shares Held at 03/31/23 | Income | Capital Gain Distributions from Underlying Funds | |||||||||||||||||||||||||||
| ||||||||||||||||||||||||||||||||||||
BlackRock Cash Funds: Institutional, SL Agency Shares | $ | 1,224,889 | $ | — | $ | (274,225 | )(a) | $ | (205 | ) | $ | 546 | $ | 951,005 | 950,719 | $ | 15,180 | (b) | $ | — | ||||||||||||||||
BlackRock Cash Funds: Treasury, SL Agency Shares | 30,000 | 10,000 | (a) | — | — | — | 40,000 | 40,000 | 824 | — | ||||||||||||||||||||||||||
|
|
|
|
|
|
|
|
|
| |||||||||||||||||||||||||||
| $ | (205 | ) | $ | 546 | $ | 991,005 | $ | 16,004 | $ | — | ||||||||||||||||||||||||||
|
|
|
|
|
|
|
|
|
| |||||||||||||||||||||||||||
| (a) | Represents net amount purchased (sold). |
| (b) | All or a portion represents securities lending income earned from the reinvestment of cash collateral from loaned securities, net of fees and collateral investment expenses, and other payments to and from borrowers of securities. |
Derivative Financial Instruments Outstanding as of Period End
Futures Contracts
| ||||||||||||||||
| Description | Number of Contracts | Expiration Date | Notional Amount (000) | Value/ Unrealized Appreciation (Depreciation) | ||||||||||||
| ||||||||||||||||
Long Contracts | ||||||||||||||||
MSCI Emerging Markets Index | 1 | 06/16/23 | $ | 50 | $ | 1,985 | ||||||||||
|
| |||||||||||||||
Derivative Financial Instruments Categorized by Risk Exposure
As of period end, the fair values of derivative financial instruments located in the Statements of Assets and Liabilities were as follows:
| ||||||||||||||||||||||||||||
| Commodity Contracts | Credit Contracts | Equity Contracts | Foreign Currency Exchange Contracts | Interest Rate Contracts | Other Contracts | Total | ||||||||||||||||||||||
| ||||||||||||||||||||||||||||
Assets — Derivative Financial Instruments | ||||||||||||||||||||||||||||
Futures contracts | ||||||||||||||||||||||||||||
Unrealized appreciation on futures contracts(a) | $ | — | $ | — | $ | 1,985 | $ | — | $ | — | $ | — | $ | 1,985 | ||||||||||||||
|
|
|
|
|
|
|
|
|
|
|
|
|
| |||||||||||||||
| (a) | Net cumulative unrealized appreciation (depreciation) on futures contracts are reported in the Schedule of Investments. In the Statements of Assets and Liabilities, only current day’s variation margin is reported in receivables or payables and the net cumulative unrealized appreciation (depreciation) is included in accumulated earnings (loss). |
For the period ended March 31, 2023, the effect of derivative financial instruments in the Statements of Operations was as follows:
| ||||||||||||||||||||||||||||
Commodity Contracts | Credit Contracts | Equity Contracts | Foreign Currency Exchange Contracts | Interest Rate Contracts | Other Contracts | Total | ||||||||||||||||||||||
| ||||||||||||||||||||||||||||
Net Realized Gain (Loss) from | ||||||||||||||||||||||||||||
Futures contracts | $ | — | $ | — | $ | (15,567 | ) | $ | — | $ | — | $ | — | $ | (15,567 | ) | ||||||||||||
|
|
|
|
|
|
|
|
|
|
|
|
|
| |||||||||||||||
Net Change in Unrealized Appreciation (Depreciation) on | ||||||||||||||||||||||||||||
Futures contracts | $ | — | $ | — | $ | (1,832 | ) | $ | — | $ | — | $ | — | $ | (1,832 | ) | ||||||||||||
|
|
|
|
|
|
|
|
|
|
|
|
|
| |||||||||||||||
Average Quarterly Balances of Outstanding Derivative Financial Instruments
| ||||
Futures contracts | ||||
Average notional value of contracts — long | $ | 121,426 | ||
| ||||
For more information about the Fund’s investment risks regarding derivative financial instruments, refer to the Notes to Financial Statements.
SCHEDULE OF INVESTMENTS | 33 |
Schedule of Investments (continued) March 31, 2023 | iShares® Emerging Markets Infrastructure ETF |
Fair Value Hierarchy as of Period End
Various inputs are used in determining the fair value of financial instruments. For a description of the input levels and information about the Fund’s policy regarding valuation of financial instruments, refer to the Notes to Financial Statements.
The following table summarizes the Fund’s financial instruments categorized in the fair value hierarchy. The breakdown of the Fund’s financial instruments into major categories is disclosed in the Schedule of Investments above.
| ||||||||||||||||
| Level 1 | Level 2 | Level 3 | Total | |||||||||||||
| ||||||||||||||||
Assets | ||||||||||||||||
Investments | ||||||||||||||||
Long-Term Investments | ||||||||||||||||
Common Stocks | $ | 9,697,779 | $ | 12,195,781 | $ | — | $ | 21,893,560 | ||||||||
Preferred Stocks | 666,790 | — | — | 666,790 | ||||||||||||
Short-Term Securities | ||||||||||||||||
Money Market Funds | 991,005 | — | — | 991,005 | ||||||||||||
|
|
|
|
|
|
|
| |||||||||
| $ | 11,355,574 | $ | 12,195,781 | $ | — | $ | 23,551,355 | |||||||||
|
|
|
|
|
|
|
| |||||||||
Derivative Financial Instruments(a) | ||||||||||||||||
Assets | ||||||||||||||||
Equity Contracts | $ | 1,985 | $ | — | $ | — | $ | 1,985 | ||||||||
|
|
|
|
|
|
|
| |||||||||
| (a) | Derivative financial instruments are futures contracts. Futures contracts are valued at the unrealized appreciation (depreciation) on the instrument. |
See notes to financial statements.
| 34 | 2 0 2 3 I SHARES ANNUAL REPORT TO SHAREHOLDERS |
Schedule of Investments March 31, 2023 | iShares® Europe ETF (Percentages shown are based on Net Assets) |
| Security | Shares | Value | ||||||
Common Stocks | ||||||||
Austria — 0.2% | ||||||||
Erste Group Bank AG | 64,807 | $ | 2,147,013 | |||||
OMV AG | 25,778 | 1,183,806 | ||||||
Verbund AG | 5,695 | 495,367 | ||||||
|
| |||||||
| 3,826,186 | ||||||||
| Belgium — 1.5% | ||||||||
Ageas SA/NV | 32,323 | 1,398,238 | ||||||
Anheuser-Busch InBev SA/NV | 181,030 | 12,067,430 | ||||||
Argenx SE(a) | 10,095 | 3,748,833 | ||||||
Groupe Bruxelles Lambert NV | 18,127 | 1,546,959 | ||||||
KBC Group NV | 61,767 | 4,244,058 | ||||||
Solvay SA | 13,711 | 1,568,075 | ||||||
UCB SA | 22,736 | 2,032,055 | ||||||
Umicore SA | 37,759 | 1,280,832 | ||||||
|
| |||||||
| 27,886,480 | ||||||||
| Denmark — 4.6% | ||||||||
AP Moller - Maersk A/S, Class A | 625 | 1,108,778 | ||||||
AP Moller - Maersk A/S, Class B, NVS | 1,032 | 1,875,876 | ||||||
Carlsberg AS, Class B | 17,780 | 2,758,867 | ||||||
Chr Hansen Holding A/S | 18,883 | 1,436,437 | ||||||
Coloplast A/S, Class B | 21,675 | 2,853,887 | ||||||
Danske Bank A/S(a) | 123,782 | 2,490,344 | ||||||
DSV A/S | 32,863 | 6,372,051 | ||||||
Genmab A/S(a) | 11,931 | 4,509,981 | ||||||
GN Store Nord A/S(a) | 24,533 | 550,096 | ||||||
Novo Nordisk A/S, Class B | 299,747 | 47,606,196 | ||||||
Novozymes A/S, Class B | 38,149 | 1,953,349 | ||||||
Orsted AS(b) | 34,770 | 2,964,766 | ||||||
Pandora A/S | 17,533 | 1,682,960 | ||||||
Tryg A/S | 65,891 | 1,440,744 | ||||||
Vestas Wind Systems A/S | 183,871 | 5,358,812 | ||||||
|
| |||||||
| 84,963,144 | ||||||||
| Finland — 1.5% | ||||||||
Elisa OYJ | 27,490 | 1,657,960 | ||||||
Fortum OYJ | 79,480 | 1,217,516 | ||||||
Kesko OYJ, Class B | 52,088 | 1,119,439 | ||||||
Kone OYJ, Class B | 72,232 | 3,767,189 | ||||||
Metso Outotec OYJ | 128,064 | 1,398,379 | ||||||
Neste OYJ | 78,857 | 3,895,841 | ||||||
Nokia OYJ | 982,745 | 4,824,182 | ||||||
Sampo OYJ, Class A | 89,988 | 4,246,095 | ||||||
Stora Enso OYJ, Class R | 113,331 | 1,474,422 | ||||||
UPM-Kymmene OYJ | 97,441 | 3,272,845 | ||||||
Wartsila OYJ Abp | 87,830 | 828,875 | ||||||
|
| |||||||
| 27,702,743 | ||||||||
| France — 18.3% | ||||||||
Accor SA(a) | 32,370 | 1,052,383 | ||||||
Air Liquide SA | 95,826 | 16,040,178 | ||||||
Airbus SE | 112,181 | 14,983,731 | ||||||
Alstom SA | 56,450 | 1,536,924 | ||||||
ArcelorMittal SA | 105,362 | 3,192,077 | ||||||
Arkema SA | 12,110 | 1,195,703 | ||||||
AXA SA | 365,814 | 11,163,755 | ||||||
BNP Paribas SA | 206,832 | 12,351,495 | ||||||
Bouygues SA | 38,166 | 1,287,189 | ||||||
Bureau Veritas SA | 53,642 | 1,541,267 | ||||||
Capgemini SE | 28,604 | 5,315,635 | ||||||
Carrefour SA | 108,565 | 2,194,922 | ||||||
| Security | Shares | Value | ||||||
France (continued) | ||||||||
Cie. de Saint-Gobain | 93,854 | $ | 5,334,996 | |||||
Cie. Generale des Etablissements Michelin SCA | 129,472 | 3,957,735 | ||||||
Credit Agricole SA | 248,274 | 2,800,828 | ||||||
Danone SA | 115,670 | 7,197,404 | ||||||
Dassault Systemes SE | 126,330 | 5,211,243 | ||||||
Edenred | 45,558 | 2,696,337 | ||||||
Eiffage SA | 14,411 | 1,559,500 | ||||||
Engie SA | 338,159 | 5,351,261 | ||||||
EssilorLuxottica SA | 55,539 | 10,014,946 | ||||||
Eurofins Scientific SE | 24,206 | 1,620,826 | ||||||
Euronext NV(b) | 17,807 | 1,363,568 | ||||||
Gecina SA | 10,159 | 1,054,509 | ||||||
Getlink SE | 73,310 | 1,207,388 | ||||||
Hermes International | 6,406 | 12,973,788 | ||||||
Kering SA | 13,179 | 8,598,343 | ||||||
Legrand SA | 48,723 | 4,451,933 | ||||||
L’Oreal SA | 46,123 | 20,609,723 | ||||||
LVMH Moet Hennessy Louis Vuitton SE | 47,762 | 43,841,136 | ||||||
Orange SA | 345,190 | 4,100,917 | ||||||
Pernod Ricard SA | 37,100 | 8,400,585 | ||||||
Publicis Groupe SA | 42,726 | 3,335,183 | ||||||
Renault SA(a) | 38,009 | 1,549,101 | ||||||
Safran SA | 63,787 | 9,442,810 | ||||||
Sanofi | 210,748 | 22,861,672 | ||||||
Sartorius Stedim Biotech | 4,407 | 1,352,046 | ||||||
Schneider Electric SE | 104,537 | 17,470,618 | ||||||
Societe Generale SA | 144,098 | 3,246,722 | ||||||
Sodexo SA | 15,022 | 1,467,207 | ||||||
Teleperformance | 10,879 | 2,628,738 | ||||||
Thales SA | 19,419 | 2,871,035 | ||||||
TotalEnergies SE | 427,847 | 25,227,430 | ||||||
Unibail-Rodamco-Westfield(a) | 19,006 | 1,022,637 | ||||||
Valeo | 40,838 | 837,986 | ||||||
Veolia Environnement SA | 122,953 | 3,793,982 | ||||||
Vinci SA | 97,454 | 11,172,353 | ||||||
Vivendi SE | 145,408 | 1,470,300 | ||||||
Worldline SA/France(a)(b) | 46,823 | 1,989,908 | ||||||
|
| |||||||
| 335,941,953 | ||||||||
| Germany — 12.1% | ||||||||
adidas AG | 32,683 | 5,793,796 | ||||||
Allianz SE, Registered | 74,691 | 17,241,375 | ||||||
Aroundtown SA(c) | 174,323 | 249,202 | ||||||
BASF SE | 167,758 | 8,807,069 | ||||||
Bayer AG, Registered | 179,569 | 11,471,156 | ||||||
Bayerische Motoren Werke AG | 58,079 | 6,365,377 | ||||||
Beiersdorf AG | 17,897 | 2,328,173 | ||||||
Brenntag SE | 28,106 | 2,115,150 | ||||||
Commerzbank AG(a) | 192,813 | 2,029,981 | ||||||
Continental AG | 19,347 | 1,449,659 | ||||||
Covestro AG(b) | 34,605 | 1,433,107 | ||||||
Daimler Truck Holding AG(a) | 93,176 | 3,144,598 | ||||||
Delivery Hero SE(a)(b) | 36,112 | 1,231,957 | ||||||
Deutsche Bank AG, Registered | 378,122 | 3,845,197 | ||||||
Deutsche Boerse AG | 34,593 | 6,735,604 | ||||||
Deutsche Post AG, Registered | 180,624 | 8,459,640 | ||||||
Deutsche Telekom AG, Registered | 638,724 | 15,477,748 | ||||||
E.ON SE | 410,821 | 5,124,876 | ||||||
Fresenius Medical Care AG & Co. KGaA | 36,203 | 1,536,608 | ||||||
Fresenius SE & Co. KGaA | 74,551 | 2,013,118 | ||||||
GEA Group AG | 30,095 | 1,372,860 | ||||||
SCHEDULE OF INVESTMENTS | 35 |
Schedule of Investments (continued) March 31, 2023 | iShares® Europe ETF (Percentages shown are based on Net Assets) |
| Security | Shares | Value | ||||||
| Germany (continued) | ||||||||
Hannover Rueck SE | 10,848 | $ | 2,121,656 | |||||
HeidelbergCement AG | 26,408 | 1,928,237 | ||||||
HelloFresh SE(a) | 31,214 | 744,370 | ||||||
Henkel AG & Co. KGaA | 17,544 | 1,276,269 | ||||||
Infineon Technologies AG | 238,914 | 9,811,044 | ||||||
LEG Immobilien SE | 13,506 | 742,236 | ||||||
Mercedes-Benz Group AG | 142,637 | 10,969,178 | ||||||
Merck KGaA | 23,593 | 4,398,556 | ||||||
MTU Aero Engines AG | 9,893 | 2,475,622 | ||||||
Muenchener Rueckversicherungs-Gesellschaft AG in Muenchen, Registered | 25,627 | 8,960,108 | ||||||
Puma SE | 18,550 | 1,149,959 | ||||||
QIAGEN NV(a) | 42,514 | 1,936,363 | ||||||
Rheinmetall AG | 7,928 | 2,348,670 | ||||||
RWE AG | 123,173 | 5,299,931 | ||||||
SAP SE | 199,683 | 25,214,064 | ||||||
Siemens AG, Registered | 136,906 | 22,179,305 | ||||||
Siemens Energy AG(a) | 74,531 | 1,643,518 | ||||||
Siemens Healthineers AG(b) | 50,503 | 2,911,598 | ||||||
Symrise AG | 23,929 | 2,604,047 | ||||||
Volkswagen AG | 5,321 | 912,685 | ||||||
Vonovia SE | 145,649 | 2,743,271 | ||||||
Zalando SE(a)(b) | 41,702 | 1,747,753 | ||||||
|
| |||||||
| 222,344,691 | ||||||||
| Ireland — 1.2% | ||||||||
Bank of Ireland Group PLC | 181,718 | 1,838,677 | ||||||
CRH PLC | 139,739 | 7,059,653 | ||||||
Flutter Entertainment PLC, Class DI(a) | 27,945 | 5,085,188 | ||||||
Kerry Group PLC, Class A | 27,719 | 2,764,285 | ||||||
Kingspan Group PLC | 28,044 | 1,921,723 | ||||||
Ryanair Holdings PLC, ADR(a)(c) | 18,116 | 1,708,158 | ||||||
Smurfit Kappa Group PLC | 48,659 | 1,764,865 | ||||||
|
| |||||||
| 22,142,549 | ||||||||
| Italy — 3.6% | ||||||||
Assicurazioni Generali SpA | 218,737 | 4,358,246 | ||||||
CNH Industrial NV | 182,906 | 2,798,675 | ||||||
Enel SpA | 1,402,250 | 8,552,248 | ||||||
Eni SpA | 457,509 | 6,380,587 | ||||||
Ferrari NV | 23,304 | 6,315,002 | ||||||
FinecoBank Banca Fineco SpA | 112,146 | 1,718,200 | ||||||
Intesa Sanpaolo SpA | 3,178,590 | 8,157,663 | ||||||
Mediobanca Banca di Credito Finanziario SpA | 119,470 | 1,200,545 | ||||||
Moncler SpA | 38,097 | 2,631,416 | ||||||
Nexi SpA(a)(b) | 153,177 | 1,244,891 | ||||||
Prysmian SpA | 49,145 | 2,063,634 | ||||||
Snam SpA | 367,044 | 1,946,080 | ||||||
Stellantis NV | 393,967 | 7,164,791 | ||||||
Telecom Italia SpA/Milano(a) | 1,964,435 | 647,838 | ||||||
Tenaris SA | 83,155 | 1,178,239 | ||||||
Terna - Rete Elettrica Nazionale | 255,669 | 2,098,374 | ||||||
UniCredit SpA | 354,420 | 6,680,057 | ||||||
|
| |||||||
| 65,136,486 | ||||||||
| Netherlands — 7.1% | ||||||||
ABN AMRO Bank NV, CVA(b) | 75,343 | 1,194,748 | ||||||
Adyen NV(a)(b) | 5,678 | 9,047,483 | ||||||
Aegon NV | 252,744 | 1,085,070 | ||||||
Akzo Nobel NV | 33,424 | 2,614,245 | ||||||
ASM International NV | 8,343 | 3,386,430 | ||||||
ASML Holding NV | 74,129 | 50,515,056 | ||||||
| Security | Shares | Value | ||||||
Netherlands (continued) | ||||||||
EXOR NV, NVS(a) | 21,585 | $ | 1,779,889 | |||||
Heineken Holding NV | 19,912 | 1,826,888 | ||||||
Heineken NV | 42,863 | 4,605,662 | ||||||
IMCD NV | 10,622 | 1,736,864 | ||||||
ING Groep NV | 689,568 | 8,188,851 | ||||||
Koninklijke Ahold Delhaize NV | 181,994 | 6,217,845 | ||||||
Koninklijke DSM NV | 31,933 | 3,779,089 | ||||||
Koninklijke KPN NV | 585,255 | 2,068,038 | ||||||
Koninklijke Philips NV | 164,275 | 3,017,219 | ||||||
NN Group NV | 57,362 | 2,082,808 | ||||||
Prosus NV | 211,611 | 16,569,988 | ||||||
Randstad NV | 22,933 | 1,361,410 | ||||||
Universal Music Group NV | 138,671 | 3,511,807 | ||||||
Wolters Kluwer NV | 47,034 | 5,937,405 | ||||||
|
| |||||||
| 130,526,795 | ||||||||
| Norway — 0.9% | ||||||||
Aker BP ASA | 55,535 | 1,361,997 | ||||||
DNB Bank ASA | 163,170 | 2,920,048 | ||||||
Equinor ASA | 190,796 | 5,424,024 | ||||||
Mowi ASA | 83,508 | 1,544,563 | ||||||
Norsk Hydro ASA | 250,755 | 1,871,490 | ||||||
Orkla ASA | 141,760 | 1,005,434 | ||||||
Telenor ASA | 115,568 | 1,355,054 | ||||||
Yara International ASA | 30,399 | 1,321,158 | ||||||
|
| |||||||
| 16,803,768 | ||||||||
| Portugal — 0.2% | ||||||||
EDP - Energias de Portugal SA | 563,289 | 3,069,313 | ||||||
Galp Energia SGPS SA | 82,488 | 933,374 | ||||||
|
| |||||||
| 4,002,687 | ||||||||
| Singapore — 0.4% | ||||||||
STMicroelectronics NV , New | 119,703 | 6,374,482 | ||||||
|
| |||||||
| Spain — 3.9% | ||||||||
ACS Actividades de Construccion y Servicios SA | 41,276 | 1,314,629 | ||||||
Aena SME SA(a)(b) | 13,363 | 2,160,908 | ||||||
Amadeus IT Group SA(a) | 82,274 | 5,519,229 | ||||||
Banco Bilbao Vizcaya Argentaria SA | 1,097,935 | 7,849,531 | ||||||
Banco Santander SA | 3,044,111 | 11,343,817 | ||||||
CaixaBank SA | 779,532 | 3,041,696 | ||||||
Cellnex Telecom SA(b) | 108,605 | 4,223,391 | ||||||
Enagas SA | 40,348 | 775,315 | ||||||
Endesa SA | 58,071 | 1,261,290 | ||||||
Ferrovial SA | 92,513 | 2,724,265 | ||||||
Grifols SA(a) | 54,312 | 537,594 | ||||||
Iberdrola SA | 1,073,008 | 13,367,317 | ||||||
Industria de Diseno Textil SA | 204,171 | 6,859,164 | ||||||
Naturgy Energy Group SA | 35,572 | 1,070,842 | ||||||
Red Electrica Corp. SA | 72,128 | 1,269,186 | ||||||
Repsol SA | 242,622 | 3,731,007 | ||||||
Telefonica SA | 1,051,529 | 4,528,738 | ||||||
|
| |||||||
| 71,577,919 | ||||||||
| Sweden — 4.7% | ||||||||
Alfa Laval AB | 54,932 | 1,961,462 | ||||||
Assa Abloy AB, Class B | 181,263 | 4,341,697 | ||||||
Atlas Copco AB, Class A | 463,005 | 5,865,507 | ||||||
Atlas Copco AB, Class B | 286,155 | 3,291,566 | ||||||
Boliden AB | 49,685 | 1,951,835 | ||||||
Electrolux AB, Class B(c) | 44,040 | 535,280 | ||||||
Embracer Group AB(a)(c) | 147,287 | 690,385 | ||||||
| 36 | 2 0 2 3 I SHARES ANNUAL REPORT TO SHAREHOLDERS |
Schedule of Investments (continued) March 31, 2023 | iShares® Europe ETF (Percentages shown are based on Net Assets) |
| Security | Shares | Value | ||||||
Sweden (continued) | ||||||||
Epiroc AB, Class A | 115,049 | $ | 2,283,724 | |||||
Epiroc AB, Class B | 71,238 | 1,214,640 | ||||||
EQT AB | 60,412 | 1,234,059 | ||||||
Essity AB, Class B | 111,165 | 3,175,305 | ||||||
Evolution AB(b) | 35,231 | 4,720,191 | ||||||
Getinge AB, Class B | 39,054 | 952,460 | ||||||
H & M Hennes & Mauritz AB, Class B(c) | 133,524 | 1,909,064 | ||||||
Hexagon AB, Class B | 387,433 | 4,459,124 | ||||||
Industrivarden AB, Class A | 32,830 | 887,314 | ||||||
Industrivarden AB, Class C | 30,617 | 825,567 | ||||||
Investor AB, Class B | 331,604 | 6,605,745 | ||||||
Kinnevik AB, Class B(a) | 42,449 | 634,735 | ||||||
Nibe Industrier AB, Class B | 275,730 | 3,143,080 | ||||||
Nordea Bank Abp | 604,153 | 6,451,321 | ||||||
Sandvik AB | 197,657 | 4,195,426 | ||||||
Skandinaviska Enskilda Banken AB, Class A | 306,005 | 3,377,763 | ||||||
Skanska AB, Class B | 72,354 | 1,108,223 | ||||||
SKF AB, Class B | 68,630 | 1,351,798 | ||||||
Svenska Cellulosa AB SCA, Class B | 111,058 | 1,462,693 | ||||||
Svenska Handelsbanken AB, Class A | 278,640 | 2,413,261 | ||||||
Swedbank AB, Class A | 169,322 | 2,784,435 | ||||||
Tele2 AB, Class B | 99,501 | 990,340 | ||||||
Telefonaktiebolaget LM Ericsson, Class B | 564,687 | 3,310,095 | ||||||
Telia Co. AB | 443,963 | 1,127,338 | ||||||
Volvo AB, Class B | 289,047 | 5,956,287 | ||||||
|
| |||||||
| 85,211,720 | ||||||||
| Switzerland — 15.4% | ||||||||
ABB Ltd., Registered | 312,113 | 10,737,156 | ||||||
Adecco Group AG, Registered | 30,614 | 1,115,116 | ||||||
Alcon Inc. | 91,677 | 6,507,920 | ||||||
Baloise Holding AG, Registered | 8,190 | 1,275,316 | ||||||
Barry Callebaut AG, Registered | 722 | 1,529,751 | ||||||
Chocoladefabriken Lindt & Spruengli AG, Participation Certificates, NVS | 211 | 2,492,045 | ||||||
Chocoladefabriken Lindt & Spruengli AG, Registered | 20 | 2,368,722 | ||||||
Cie. Financiere Richemont SA, Class A, Registered | 95,540 | 15,320,417 | ||||||
Credit Suisse Group AG, Registered(c) | 694,896 | 624,033 | ||||||
Geberit AG, Registered | 6,608 | 3,690,218 | ||||||
Givaudan SA, Registered | 1,469 | 4,781,283 | ||||||
Holcim AG | 103,544 | 6,677,687 | ||||||
Julius Baer Group Ltd. | 39,159 | 2,674,890 | ||||||
Kuehne + Nagel International AG, Registered | 10,212 | 3,041,491 | ||||||
Logitech International SA, Registered | 30,974 | 1,807,845 | ||||||
Lonza Group AG, Registered | 13,657 | 8,221,506 | ||||||
Nestle SA, Registered | 503,217 | 61,357,502 | ||||||
Novartis AG, Registered | 439,877 | 40,388,854 | ||||||
Partners Group Holding AG | 4,159 | 3,916,623 | ||||||
Roche Holding AG, Bearer | 4,916 | 1,477,212 | ||||||
Roche Holding AG, NVS | 128,586 | 36,742,480 | ||||||
Schindler Holding AG, Participation Certificates, NVS | 7,549 | 1,672,691 | ||||||
Schindler Holding AG, Registered | 3,963 | 838,644 | ||||||
SGS SA, Registered | 1,148 | 2,532,199 | ||||||
SIG Group AG(a) | 63,520 | 1,636,477 | ||||||
Sika AG, Registered | 27,823 | 7,804,224 | ||||||
Sonova Holding AG, Registered | 9,493 | 2,800,326 | ||||||
Straumann Holding AG | 21,578 | 3,236,367 | ||||||
Swatch Group AG (The), Bearer | 5,232 | 1,801,852 | ||||||
Swatch Group AG (The), Registered | 9,845 | 624,237 | ||||||
Swiss Life Holding AG, Registered | 5,701 | 3,518,124 | ||||||
Swiss Prime Site AG, Registered | 13,932 | 1,158,552 | ||||||
| Security | Shares | Value | ||||||
Switzerland (continued) | ||||||||
Swiss Re AG | 52,707 | $ | 5,414,771 | |||||
Swisscom AG, Registered | 4,695 | 2,996,216 | ||||||
Temenos AG, Registered | 11,872 | 826,126 | ||||||
UBS Group AG, Registered | 641,748 | 13,579,894 | ||||||
VAT Group AG(b) | 5,087 | 1,837,850 | ||||||
Zurich Insurance Group AG | 27,393 | 13,126,688 | ||||||
|
| |||||||
| 282,153,305 | ||||||||
| United Kingdom — 23.3% | ||||||||
3i Group PLC | 179,872 | 3,749,158 | ||||||
abrdn PLC | 416,818 | 1,049,076 | ||||||
Admiral Group PLC | 51,737 | 1,299,163 | ||||||
Anglo American PLC | 243,684 | 8,105,293 | ||||||
Antofagasta PLC | 62,898 | 1,232,013 | ||||||
Ashtead Group PLC | 81,754 | 5,020,092 | ||||||
Associated British Foods PLC | 65,209 | 1,564,878 | ||||||
AstraZeneca PLC | 283,543 | 39,286,093 | ||||||
Auto Trader Group PLC(b) | 173,540 | 1,323,709 | ||||||
Aviva PLC | 510,454 | 2,549,786 | ||||||
BAE Systems PLC | 559,496 | 6,767,732 | ||||||
Barclays PLC | 2,742,571 | 4,936,365 | ||||||
Barratt Developments PLC | 183,435 | 1,055,628 | ||||||
Berkeley Group Holdings PLC | 20,498 | 1,061,959 | ||||||
BP PLC | 3,400,048 | 21,490,067 | ||||||
British American Tobacco PLC | 407,030 | 14,268,180 | ||||||
British Land Co. PLC (The) | 171,132 | 820,863 | ||||||
BT Group PLC | 1,303,597 | 2,348,204 | ||||||
Bunzl PLC(c) | 61,027 | 2,305,146 | ||||||
Burberry Group PLC | 72,513 | 2,321,852 | ||||||
Centrica PLC | 1,153,423 | 1,510,561 | ||||||
Compass Group PLC | 323,490 | 8,129,801 | ||||||
Croda International PLC | 25,916 | 2,082,959 | ||||||
DCC PLC | 18,618 | 1,085,266 | ||||||
Diageo PLC | 426,642 | 19,040,872 | ||||||
Direct Line Insurance Group PLC | 252,174 | 428,384 | ||||||
DS Smith PLC | 249,690 | 972,123 | ||||||
Entain PLC | 105,045 | 1,631,360 | ||||||
Experian PLC | 176,033 | 5,796,362 | ||||||
Glencore PLC | 2,204,309 | 12,684,068 | ||||||
GSK PLC | 729,639 | 12,892,220 | ||||||
Haleon PLC | 926,556 | 3,680,680 | ||||||
Halma PLC | 70,147 | 1,936,511 | ||||||
Hargreaves Lansdown PLC | 63,759 | 631,626 | ||||||
HSBC Holdings PLC | 3,645,503 | 24,776,641 | ||||||
IMI PLC | 52,958 | 1,002,431 | ||||||
Imperial Brands PLC | 175,808 | 4,042,819 | ||||||
Informa PLC | 274,916 | 2,356,430 | ||||||
InterContinental Hotels Group PLC | 34,551 | 2,261,903 | ||||||
Intermediate Capital Group PLC | 52,507 | 792,539 | ||||||
Intertek Group PLC | 29,490 | 1,476,997 | ||||||
J Sainsbury PLC | 310,001 | 1,066,770 | ||||||
Johnson Matthey PLC | 35,826 | 878,322 | ||||||
Kingfisher PLC(c) | 373,044 | 1,205,866 | ||||||
Land Securities Group PLC | 138,467 | 1,062,948 | ||||||
Legal & General Group PLC | 1,088,897 | 3,220,526 | ||||||
Lloyds Banking Group PLC | 12,248,185 | 7,201,284 | ||||||
London Stock Exchange Group PLC | 69,418 | 6,742,547 | ||||||
M&G PLC | 472,360 | 1,157,769 | ||||||
Marks & Spencer Group PLC(a) | 357,343 | 737,192 | ||||||
Melrose Industries PLC | 761,279 | 1,567,894 | ||||||
Mondi PLC | 88,353 | 1,402,781 | ||||||
SCHEDULE OF INVESTMENTS | 37 |
Schedule of Investments (continued) March 31, 2023 | iShares® Europe ETF (Percentages shown are based on Net Assets) |
| Security | Shares | Value | ||||||
| United Kingdom (continued) | ||||||||
National Grid PLC | 707,948 | $ | 9,576,411 | |||||
NatWest Group PLC, NVS | 927,782 | 3,027,375 | ||||||
Next PLC | 23,469 | 1,907,555 | ||||||
Ocado Group PLC(a) | 128,835 | 853,068 | ||||||
Pearson PLC | 141,696 | 1,482,837 | ||||||
Persimmon PLC | 57,069 | 886,151 | ||||||
Phoenix Group Holdings PLC | 151,607 | 1,024,321 | ||||||
Prudential PLC | 511,754 | 7,006,744 | ||||||
Reckitt Benckiser Group PLC | 134,281 | 10,215,759 | ||||||
RELX PLC | 361,462 | 11,706,632 | ||||||
Rentokil Initial PLC | 450,972 | 3,295,947 | ||||||
Rightmove PLC | 156,341 | 1,088,233 | ||||||
Rio Tinto PLC | 194,287 | 13,187,792 | ||||||
Rolls-Royce Holdings PLC(a) | 1,514,369 | 2,789,257 | ||||||
Sage Group PLC (The) | 202,479 | 1,943,075 | ||||||
Schroders PLC | 167,304 | 954,043 | ||||||
Segro PLC | 224,342 | 2,137,035 | ||||||
Severn Trent PLC | 46,475 | 1,650,928 | ||||||
Shell PLC | 1,301,063 | 37,078,435 | ||||||
Smith & Nephew PLC | 159,483 | 2,216,898 | ||||||
Smiths Group PLC | 66,678 | 1,414,158 | ||||||
Spirax-Sarco Engineering PLC | 13,184 | 1,935,711 | ||||||
SSE PLC | 191,729 | 4,278,209 | ||||||
St. James’s Place PLC | 101,320 | 1,520,353 | ||||||
Standard Chartered PLC | 443,927 | 3,364,550 | ||||||
Taylor Wimpey PLC | 661,893 | 973,758 | ||||||
Tesco PLC | 1,363,948 | 4,471,607 | ||||||
Unilever PLC | 481,112 | 24,930,740 | ||||||
United Utilities Group PLC | 124,677 | 1,631,704 | ||||||
Vodafone Group PLC | 4,866,020 | 5,367,691 | ||||||
Weir Group PLC (The) | 47,692 | 1,094,123 | ||||||
Whitbread PLC | 36,144 | 1,335,205 | ||||||
WPP PLC | 195,749 | 2,325,676 | ||||||
|
| |||||||
| 426,683,690 | ||||||||
|
| |||||||
Total Common Stocks — 98.9% | 1,813,278,598 | |||||||
|
| |||||||
Preferred Stocks | ||||||||
| Germany — 0.7% | ||||||||
Bayerische Motoren Werke AG, Preference Shares, NVS | 11,424 | 1,167,742 | ||||||
| Security | Shares | Value | ||||||
| Germany (continued) | ||||||||
Henkel AG & Co. KGaA, Preference Shares, NVS | 32,633 | $ | 2,553,008 | |||||
Porsche Automobil Holding SE, Preference Shares, NVS | 27,811 | 1,596,546 | ||||||
Sartorius AG, Preference Shares, NVS | 4,837 | 2,038,584 | ||||||
Volkswagen AG, Preference Shares, NVS | 33,415 | 4,560,221 | ||||||
|
| |||||||
| 11,916,101 | ||||||||
| Italy — 0.0% | ||||||||
Telecom Italia SpA/Milano, Preference Shares, NVS(a) | 1,187,149 | 381,637 | ||||||
|
| |||||||
Total Preferred Stocks — 0.7% | 12,297,738 | |||||||
|
| |||||||
Total Long-Term Investments — 99.6% | 1,825,576,336 | |||||||
|
| |||||||
Short-Term Securities | ||||||||
| Money Market Funds — 0.3% | ||||||||
BlackRock Cash Funds: Institutional, SL Agency Shares, 5.01%(d)(e)(f) | 3,783,531 | 3,784,666 | ||||||
BlackRock Cash Funds: Treasury, SL Agency Shares, 4.73%(d)(e) | 2,050,000 | 2,050,000 | ||||||
|
| |||||||
Total Short-Term Securities — 0.3% | 5,834,666 | |||||||
|
| |||||||
Total Investments — 99.9% | 1,831,411,002 | |||||||
Other Assets Less Liabilities — 0.1% | 1,522,393 | |||||||
|
| |||||||
Net Assets — 100.0% | $ | 1,832,933,395 | ||||||
|
| |||||||
| (a) | Non-income producing security. |
| (b) | Security exempt from registration pursuant to Rule 144A under the Securities Act of 1933, as amended. These securities may be resold in transactions exempt from registration to qualified institutional investors. |
| (c) | All or a portion of this security is on loan. |
| (d) | Affiliate of the Fund. |
| (e) | Annualized 7-day yield as of period end. |
| (f) | All or a portion of this security was purchased with the cash collateral from loaned securities. |
| 38 | 2 0 2 3 I SHARES ANNUAL REPORT TO SHAREHOLDERS |
Schedule of Investments (continued) March 31, 2023 | iShares® Europe ETF |
Affiliates
Investments in issuers considered to be affiliate(s) of the Fund during the year ended March 31, 2023 for purposes of Section 2(a)(3) of the Investment Company Act of 1940, as amended, were as follows:
| ||||||||||||||||||||||||||||||||||||
| Affiliated Issuer | Value at 03/31/22 | Purchases at Cost | Proceeds from Sale | Net Realized Gain (Loss) | Change in Unrealized Appreciation (Depreciation) | Value at 03/31/23 | Shares Held at 03/31/23 | Income | Capital Gain Distributions from Underlying Funds | |||||||||||||||||||||||||||
| ||||||||||||||||||||||||||||||||||||
BlackRock Cash Funds: Institutional, SL Agency Shares | $ | 2,533,435 | $ | 1,235,973 | (a) | $ | — | $ | 13,404 | $ | 1,854 | $ | 3,784,666 | 3,783,531 | $ | 69,366 | (b) | $ | — | |||||||||||||||||
BlackRock Cash Funds: Treasury, SL Agency Shares | 2,630,000 | — | (580,000 | )(a) | — | — | 2,050,000 | 2,050,000 | 71,568 | 3 | ||||||||||||||||||||||||||
|
|
|
|
|
|
|
|
|
| |||||||||||||||||||||||||||
| $ | 13,404 | $ | 1,854 | $ | 5,834,666 | $ | 140,934 | $ | 3 | |||||||||||||||||||||||||||
|
|
|
|
|
|
|
|
|
| |||||||||||||||||||||||||||
| (a) | Represents net amount purchased (sold). |
| (b) | All or a portion represents securities lending income earned from the reinvestment of cash collateral from loaned securities, net of fees and collateral investment expenses, and other payments to and from borrowers of securities. |
Derivative Financial Instruments Outstanding as of Period End
Futures Contracts
| ||||||||||||||||
| Description | Number of Contracts | Expiration Date | Notional Amount (000) | Value/ Unrealized Appreciation (Depreciation) | ||||||||||||
| ||||||||||||||||
Long Contracts | ||||||||||||||||
Euro STOXX 50 Index | 96 | 06/16/23 | $ | 4,444 | $ | 159,113 | ||||||||||
FTSE 100 Index | 27 | 06/16/23 | 2,549 | 37,776 | ||||||||||||
|
| |||||||||||||||
| $ | 196,889 | |||||||||||||||
|
| |||||||||||||||
Derivative Financial Instruments Categorized by Risk Exposure
As of period end, the fair values of derivative financial instruments located in the Statements of Assets and Liabilities were as follows:
| ||||||||||||||||||||||||||||
Commodity Contracts | Credit Contracts | Equity Contracts | Foreign Currency Exchange Contracts | Interest Rate Contracts | Other Contracts | Total | ||||||||||||||||||||||
| ||||||||||||||||||||||||||||
Assets — Derivative Financial Instruments | ||||||||||||||||||||||||||||
Futures contracts | ||||||||||||||||||||||||||||
Unrealized appreciation on futures contracts(a) | $ | — | $ | — | $ | 196,889 | $ | — | $ | — | $ | — | $ | 196,889 | ||||||||||||||
|
|
|
|
|
|
|
|
|
|
|
|
|
| |||||||||||||||
| (a) | Net cumulative unrealized appreciation (depreciation) on futures contracts are reported in the Schedule of Investments. In the Statements of Assets and Liabilities, only current day’s variation margin is reported in receivables or payables and the net cumulative unrealized appreciation (depreciation) is included in accumulated earnings (loss). |
For the period ended March 31, 2023, the effect of derivative financial instruments in the Statements of Operations was as follows:
| ||||||||||||||||||||||||||||
Commodity Contracts | Credit Contracts | Equity Contracts | Foreign Currency Exchange Contracts | Interest Rate Contracts | Other Contracts | Total | ||||||||||||||||||||||
| ||||||||||||||||||||||||||||
Net Realized Gain (Loss) from | ||||||||||||||||||||||||||||
Futures contracts | $ | — | $ | — | $ | 61,134 | $ | — | $ | — | $ | — | $ | 61,134 | ||||||||||||||
|
|
|
|
|
|
|
|
|
|
|
|
|
| |||||||||||||||
Net Change in Unrealized Appreciation (Depreciation) on | ||||||||||||||||||||||||||||
Futures contracts | $ | — | $ | — | $ | 32,693 | $ | — | $ | — | $ | — | $ | 32,693 | ||||||||||||||
|
|
|
|
|
|
|
|
|
|
|
|
|
| |||||||||||||||
SCHEDULE OF INVESTMENTS | 39 |
Schedule of Investments (continued) March 31, 2023 | iShares® Europe ETF |
Average Quarterly Balances of Outstanding Derivative Financial Instruments
Futures contracts | ||||
Average notional value of contracts — long | $ | 4,587,437 |
For more information about the Fund’s investment risks regarding derivative financial instruments, refer to the Notes to Financial Statements.
Fair Value Hierarchy as of Period End
Various inputs are used in determining the fair value of financial instruments. For a description of the input levels and information about the Fund’s policy regarding valuation of financial instruments, refer to the Notes to Financial Statements.
The following table summarizes the Fund’s financial instruments categorized in the fair value hierarchy. The breakdown of the Fund’s financial instruments into major categories is disclosed in the Schedule of Investments above.
| ||||||||||||||||
| Level 1 | Level 2 | Level 3 | Total | |||||||||||||
| ||||||||||||||||
Assets | ||||||||||||||||
Investments | ||||||||||||||||
Long-Term Investments | ||||||||||||||||
Common Stocks | $ | 1,708,158 | $ | 1,811,570,440 | $ | — | $ | 1,813,278,598 | ||||||||
Preferred Stocks | — | 12,297,738 | — | 12,297,738 | ||||||||||||
Short-Term Securities | ||||||||||||||||
Money Market Funds | 5,834,666 | — | — | 5,834,666 | ||||||||||||
|
|
|
|
|
|
|
| |||||||||
| $ | 7,542,824 | $ | 1,823,868,178 | $ | — | $ | 1,831,411,002 | |||||||||
|
|
|
|
|
|
|
| |||||||||
Derivative Financial Instruments(a) | ||||||||||||||||
Assets | ||||||||||||||||
Equity Contracts | $ | — | $ | 196,889 | $ | — | $ | 196,889 | ||||||||
|
|
|
|
|
|
|
| |||||||||
| (a) | Derivative financial instruments are futures contracts. Futures contracts are valued at the unrealized appreciation (depreciation) on the instrument. |
See notes to financial statements.
| 40 | 2 0 2 3 I SHARES ANNUAL REPORT TO SHAREHOLDERS |
Schedule of Investments March 31, 2023 | iShares® Future Metaverse Tech and Communications ETF (Percentages shown are based on Net Assets) |
| Security | Shares | Value | ||||||
| ||||||||
Common Stocks |
| |||||||
| Communications Equipment — 0.2% | ||||||||
Arista Networks Inc.(a) | 56 | $ | 9,400 | |||||
|
| |||||||
| Electronic Equipment, Instruments & Components — 0.1% | ||||||||
TDK Corp. | 100 | 3,590 | ||||||
|
| |||||||
| Entertainment — 28.1% | ||||||||
Activision Blizzard Inc. | 2,844 | 243,418 | ||||||
Electronic Arts Inc. | 2,013 | 242,466 | ||||||
Kakao Games Corp.(a) | 872 | 28,261 | ||||||
NetEase Inc. | 13,600 | 240,079 | ||||||
Nintendo Co. Ltd. | 6,000 | 233,049 | ||||||
ROBLOX Corp., Class A(a) | 5,452 | 245,231 | ||||||
Take-Two Interactive Software Inc.(a) | 1,940 | 231,442 | ||||||
Ubisoft Entertainment SA(a) | 1,504 | 40,086 | ||||||
|
| |||||||
| 1,504,032 | ||||||||
| Household Durables — 5.1% | ||||||||
Garmin Ltd. | 376 | 37,946 | ||||||
Sony Group Corp. | 2,600 | 236,817 | ||||||
|
| |||||||
| 274,763 | ||||||||
| Interactive Media & Services — 13.4% | ||||||||
Alphabet Inc., Class A(a) | 1,432 | 148,541 | ||||||
Bumble Inc., Class A(a) | 75 | 1,466 | ||||||
JOYY Inc., ADR | 8 | 250 | ||||||
Match Group Inc.(a) | 136 | 5,221 | ||||||
Meta Platforms Inc, Class A(a) | 1,300 | 275,522 | ||||||
Snap Inc., Class A, NVS(a) | 2,276 | 25,514 | ||||||
Tencent Holdings Ltd. | 5,300 | 259,007 | ||||||
|
| |||||||
| 715,521 | ||||||||
| IT Services — 0.3% | ||||||||
Shopify Inc., Class A(a) | 312 | 14,959 | ||||||
|
| |||||||
| Security | Shares | Value | ||||||
| ||||||||
| Semiconductors & Semiconductor Equipment — 15.5% | ||||||||
Advanced Micro Devices Inc.(a) | 381 | $ | 37,342 | |||||
Intel Corp. | 988 | 32,278 | ||||||
Micron Technology Inc. | 2,736 | 165,090 | ||||||
Nvidia Corp. | 1,020 | 283,326 | ||||||
Qualcomm Inc. | 1,697 | 216,503 | ||||||
SK Hynix Inc. | 1,372 | 93,893 | ||||||
|
| |||||||
| 828,432 | ||||||||
| Software — 29.7% | ||||||||
Adobe Inc.(a) | 110 | 42,391 | ||||||
Ansys Inc.(a) | 748 | 248,934 | ||||||
Aspen Technology Inc.(a) | 9 | 2,060 | ||||||
Autodesk Inc.(a) | 1,111 | 231,266 | ||||||
Dassault Systemes SE | 5,800 | 239,256 | ||||||
Microsoft Corp. | 608 | 175,286 | ||||||
PTC Inc.(a) | 1,833 | 235,045 | ||||||
Salesforce Inc.(a) | 224 | 44,751 | ||||||
Unity Software Inc.(a) | 3,952 | 128,203 | ||||||
Zoom Video Communications Inc., Class A(a) | 3,295 | 243,303 | ||||||
|
| |||||||
| 1,590,495 | ||||||||
| Technology Hardware, Storage & Peripherals — 7.4% | ||||||||
Apple Inc. | 2,016 | 332,438 | ||||||
Samsung Electronics Co. Ltd. | 1,292 | 63,891 | ||||||
|
| |||||||
| 396,329 | ||||||||
Total Investments — 99.8% |
| 5,337,521 | ||||||
Other Assets Less Liabilities — 0.2% |
| 12,900 | ||||||
|
| |||||||
Net Assets — 100.0% | $ | 5,350,421 | ||||||
|
| |||||||
| (a) | Non-income producing security |
Affiliates
Investments in issuers considered to be affiliate(s) of the Fund during the period ended March 31, 2023 for purposes of Section 2(a)(3) of the Investment Company Act of 1940, as amended, were as follows:
| ||||||||||||||||||||||||||||||||||||
| Affiliated Issuer | | Value at 02/14/23 | (a) | | Purchases at Cost |
| | Proceeds from Sale |
| | Net Realized Gain (Loss) | | | Change in Unrealized Appreciation (Depreciation) |
| | Value at 03/31/23 |
| | Shares Held at 03/31/23 |
| Income | | Capital Gain Distributions from Underlying Funds |
| |||||||||||
| ||||||||||||||||||||||||||||||||||||
BlackRock Cash Funds: Treasury, SL Agency Shares(b) | $ | — | $ | 0 | (c) | $ | — | $ | — | $ | — | $ | — | — | $ | 6 | $ | — | ||||||||||||||||||
|
|
|
|
|
|
|
|
|
| |||||||||||||||||||||||||||
| (a) | Commencement of operations. |
| (b) | As of period end, the entity is no longer held. |
| (c) | Represents net amount purchased (sold). |
SCHEDULE OF INVESTMENTS | 41 |
Schedule of Investments (continued) March 31, 2023 | iShares® Future Metaverse Tech and Communications ETF |
Fair Value Hierarchy as of Period End
Various inputs are used in determining the fair value of financial instruments. For a description of the input levels and information about the Fund’s policy regarding valuation of financial instruments, refer to the Notes to Financial Statements.
The following table summarizes the Fund’s financial instruments categorized in the fair value hierarchy. The breakdown of the Fund’s financial instruments into major categories is disclosed in the Schedule of Investments above.
| ||||||||||||||||
| Level 1 | Level 2 | Level 3 | Total | |||||||||||||
| ||||||||||||||||
Assets | ||||||||||||||||
Investments | ||||||||||||||||
Long-Term Investments | ||||||||||||||||
Common Stocks | $ | 3,899,592 | $ | 1,437,929 | $ | — | $ | 5,337,521 | ||||||||
|
|
|
|
|
|
|
| |||||||||
See notes to financial statements.
| 42 | 2 0 2 3 I SHARES ANNUAL REPORT TO SHAREHOLDERS |
Schedule of Investments March 31, 2023 | iShares® India 50 ETF (Percentages shown are based on Net Assets) |
| Security | Shares | Value | ||||||
| ||||||||
Common Stocks | ||||||||
| Automobiles — 5.3% | ||||||||
Bajaj Auto Ltd. | 69,837 | $ | 3,303,610 | |||||
Eicher Motors Ltd. | 86,049 | 3,091,860 | ||||||
Hero MotoCorp Ltd. | 80,362 | 2,301,005 | ||||||
Mahindra & Mahindra Ltd. | 556,356 | 7,862,103 | ||||||
Maruti Suzuki India Ltd. | 82,592 | 8,352,410 | ||||||
Tata Motors Ltd.(a) | 1,107,684 | 5,706,908 | ||||||
|
| |||||||
| 30,617,896 | ||||||||
| Banks — 27.4% | ||||||||
Axis Bank Ltd. | 1,701,441 | 17,825,599 | ||||||
HDFC Bank Ltd. | 2,739,087 | 53,874,651 | ||||||
ICICI Bank Ltd. | 4,338,451 | 46,362,612 | ||||||
IndusInd Bank Ltd. | 402,716 | 5,253,417 | ||||||
Kotak Mahindra Bank Ltd. | 913,452 | 19,307,506 | ||||||
State Bank of India | 2,384,637 | 15,243,883 | ||||||
|
| |||||||
| 157,867,668 | ||||||||
| Chemicals — 2.1% | ||||||||
Asian Paints Ltd. | 280,137 | 9,438,285 | ||||||
UPL Ltd. | 330,031 | 2,887,457 | ||||||
|
| |||||||
| 12,325,742 | ||||||||
| Construction & Engineering — 3.4% | ||||||||
Larsen & Toubro Ltd. | 751,059 | 19,825,179 | ||||||
|
| |||||||
| Construction Materials — 2.0% | ||||||||
Grasim Industries Ltd. | 231,448 | 4,606,955 | ||||||
UltraTech Cement Ltd. | 71,754 | 6,667,633 | ||||||
|
| |||||||
| 11,274,588 | ||||||||
| Consumer Finance — 2.0% | ||||||||
Bajaj Finance Ltd. | 165,531 | 11,357,855 | ||||||
|
| |||||||
| Financial Services — 7.2% | ||||||||
Bajaj Finserv Ltd. | 334,719 | 5,178,882 | ||||||
Housing Development Finance Corp. Ltd. | 1,125,812 | 36,102,592 | ||||||
|
| |||||||
| 41,281,474 | ||||||||
| Electric Utilities — 1.0% | ||||||||
Power Grid Corp. of India Ltd. | 2,123,895 | 5,847,253 | ||||||
|
| |||||||
| Food Products — 2.1% | ||||||||
Britannia Industries Ltd. | 73,168 | 3,856,709 | ||||||
Nestle India Ltd. | 22,167 | 5,322,458 | ||||||
Tata Consumer Products Ltd. | 372,681 | 3,220,554 | ||||||
|
| |||||||
| 12,399,721 | ||||||||
| Health Care Providers & Services — 0.6% | ||||||||
Apollo Hospitals Enterprise Ltd. | 62,982 | 3,312,267 | ||||||
|
| |||||||
| Independent Power and Renewable Electricity Producers — 1.1% | ||||||||
NTPC Ltd. | 2,952,453 | 6,303,318 | ||||||
|
| |||||||
| Insurance — 1.3% | ||||||||
HDFC Life Insurance Co. Ltd.(b) | 614,373 | 3,736,113 | ||||||
SBI Life Insurance Co. Ltd.(b) | 279,871 | 3,754,703 | ||||||
|
| |||||||
| 7,490,816 | ||||||||
| Security | Shares | Value | ||||||
| ||||||||
| IT Services — 14.2% | ||||||||
HCL Technologies Ltd. | 657,636 | $ | 8,730,499 | |||||
Infosys Ltd. | 2,216,973 | 38,759,634 | ||||||
Tata Consultancy Services Ltd. | 636,636 | 24,954,744 | ||||||
Tech Mahindra Ltd. | 387,409 | 5,222,526 | ||||||
Wipro Ltd. | 917,429 | 4,093,004 | ||||||
|
| |||||||
| 81,760,407 | ||||||||
| Life Sciences Tools & Services — 0.5% | ||||||||
Divi’s Laboratories Ltd. | 78,644 | 2,707,990 | ||||||
|
| |||||||
| Metals & Mining — 2.7% | ||||||||
Hindalco Industries Ltd. | 901,090 | 4,467,713 | ||||||
JSW Steel Ltd. | 585,795 | 4,918,720 | ||||||
Tata Steel Ltd. | 5,012,266 | 6,403,022 | ||||||
|
| |||||||
| 15,789,455 | ||||||||
| Oil, Gas & Consumable Fuels — 12.1% | ||||||||
Bharat Petroleum Corp. Ltd. | 603,421 | 2,532,903 | ||||||
Coal India Ltd. | 1,292,762 | 3,369,968 | ||||||
Oil & Natural Gas Corp. Ltd. | 2,405,139 | 4,432,499 | ||||||
Reliance Industries Ltd. | 2,102,005 | 59,769,607 | ||||||
|
| |||||||
| 70,104,977 | ||||||||
| Personal Care Products — 3.0% | ||||||||
Hindustan Unilever Ltd. | 554,805 | 17,326,158 | ||||||
|
| |||||||
| Pharmaceuticals — 2.8% | ||||||||
Cipla Ltd. | 333,281 | 3,657,973 | ||||||
Dr. Reddy’s Laboratories Ltd. | 75,337 | 4,248,146 | ||||||
Sun Pharmaceutical Industries Ltd. | 670,916 | 8,039,097 | ||||||
|
| |||||||
| 15,945,216 | ||||||||
| Textiles, Apparel & Luxury Goods — 1.4% | ||||||||
Titan Co. Ltd. | 259,281 | 7,963,617 | ||||||
|
| |||||||
| Tobacco — 4.4% | ||||||||
ITC Ltd. | 5,479,717 | 25,638,962 | ||||||
|
| |||||||
| Trading Companies & Distributors — 0.6% | ||||||||
Adani Enterprises Ltd. | 166,267 | 3,557,876 | ||||||
|
| |||||||
| Transportation Infrastructure — 0.6% | ||||||||
Adani Ports & Special Economic Zone Ltd. | 457,289 | 3,531,763 | ||||||
|
| |||||||
| Wireless Telecommunication Services — 2.4% | ||||||||
Bharti Airtel Ltd. | 1,524,307 | 13,900,924 | ||||||
|
| |||||||
Total Investments — 100.2% |
| 578,131,122 | ||||||
Liabilities in Excess of Other Assets — (0.2)% |
| (1,359,162 | ) | |||||
|
| |||||||
Net Assets — 100.0% | $ | 576,771,960 | ||||||
|
| |||||||
| (a) | Non-income producing security. |
| (b) | Security exempt from registration pursuant to Rule 144A under the Securities Act of 1933, as amended. These securities may be resold in transactions exempt from registration to qualified institutional investors. |
SCHEDULE OF INVESTMENTS | 43 |
Schedule of Investments (continued) March 31, 2023 | iShares® India 50 ETF |
Affiliates
Investments in issuers considered to be affiliate(s) of the Fund during the year ended March 31, 2023 for purposes of Section 2(a)(3) of the Investment Company Act of 1940, as amended, were as follows:
| ||||||||||||||||||||||||||||||||||||
| Affiliated Issuer | Value at 03/31/22 | Purchases at Cost | Proceeds from Sale | Net Realized Gain (Loss) | Change in Unrealized Appreciation (Depreciation) | Value at 03/31/23 | Shares Held at 03/31/23 | Income | Capital Gain Distributions from Underlying Funds | |||||||||||||||||||||||||||
| ||||||||||||||||||||||||||||||||||||
BlackRock Cash Funds: Treasury, SL Agency Shares(a) | $ | 20,390,000 | $ | — | $ | (20,390,000 | )(b) | $ | — | $ | — | $ | — | — | $ | 229,967 | $ | 18 | ||||||||||||||||||
|
|
|
|
|
|
|
|
|
| |||||||||||||||||||||||||||
| (a) | As of period end, the entity is no longer held. |
| (b) | Represents net amount purchased (sold). |
Derivative Financial Instruments Outstanding as of Period End
Futures Contracts
| ||||||||||||||||
| Description | Number of Contracts | Expiration Date | Notional Amount (000) | Value/ Unrealized Appreciation (Depreciation) | ||||||||||||
| ||||||||||||||||
Futures | ||||||||||||||||
SGX Nifty Index | 28 | 04/27/23 | $ | 978 | $ | 22,829 | ||||||||||
|
| |||||||||||||||
Derivative Financial Instruments Categorized by Risk Exposure
As of period end, the fair values of derivative financial instruments located in the Statements of Assets and Liabilities were as follows:
| ||||||||||||||||||||||||||||
Commodity Contracts | Credit Contracts | Equity Contracts | Foreign Currency Exchange Contracts | Interest Rate Contracts | Other Contracts | Total | ||||||||||||||||||||||
| ||||||||||||||||||||||||||||
Assets — Derivative Financial Instruments | ||||||||||||||||||||||||||||
Futures contracts | ||||||||||||||||||||||||||||
Unrealized appreciation on futures contracts(a) | $ | — | $ | — | $ | 22,829 | $ | — | $ | — | $ | — | $ | 22,829 | ||||||||||||||
|
|
|
|
|
|
|
|
|
|
|
|
|
| |||||||||||||||
| (a) | Net cumulative unrealized appreciation (depreciation) on futures contracts are reported in the Schedule of Investments. In the Statements of Assets and Liabilities, only current day’s variation margin is reported in receivables or payables and the net cumulative unrealized appreciation (depreciation) is included in accumulated earnings (loss). |
For the period ended March 31, 2023, the effect of derivative financial instruments in the Statements of Operations was as follows:
| ||||||||||||||||||||||||||||
Commodity Contracts | Credit Contracts | Equity Contracts | Foreign Currency Exchange Contracts | Interest Rate Contracts | Other Contracts | Total | ||||||||||||||||||||||
| ||||||||||||||||||||||||||||
Net Realized Gain (Loss) from | ||||||||||||||||||||||||||||
Futures contracts | $ | — | $ | — | $ | (294,979 | ) | $ | — | $ | — | $ | — | $ | (294,979 | ) | ||||||||||||
|
|
|
|
|
|
|
|
|
|
|
|
|
| |||||||||||||||
Net Change in Unrealized Appreciation (Depreciation) on | ||||||||||||||||||||||||||||
Futures contracts | $ | — | $ | — | $ | 21,880 | $ | — | $ | — | $ | — | $ | 21,880 | ||||||||||||||
|
|
|
|
|
|
|
|
|
|
|
|
|
| |||||||||||||||
Average Quarterly Balances of Outstanding Derivative Financial Instruments
Futures contracts | ||||
Average notional value of contracts — long | $ | 1,526,404 | ||
For more information about the Fund’s investment risks regarding derivative financial instruments, refer to the Notes to Financial Statements.
| 44 | 2 0 2 3 I SHARES ANNUAL REPORT TO SHAREHOLDERS |
Schedule of Investments (continued) March 31, 2023 | iShares® India 50 ETF |
Fair Value Hierarchy as of Period End
Various inputs are used in determining the fair value of financial instruments. For a description of the input levels and information about the Fund’s policy regarding valuation of financial instruments, refer to the Notes to Financial Statements.
The following table summarizes the Fund’s financial instruments categorized in the fair value hierarchy. The breakdown of the Fund’s financial instruments into major categories is disclosed in the Schedule of Investments above.
| ||||||||||||||||
| Level 1 | Level 2 | Level 3 | Total | |||||||||||||
| ||||||||||||||||
Assets | ||||||||||||||||
Investments | ||||||||||||||||
Long-Term Investments | ||||||||||||||||
Common Stocks | $ | — | $ | 578,131,122 | $ | — | $ | 578,131,122 | ||||||||
|
|
|
|
|
|
|
| |||||||||
Derivative Financial Instruments(a) | ||||||||||||||||
Assets | ||||||||||||||||
Equity Contracts | $ | — | $ | 22,829 | $ | — | $ | 22,829 | ||||||||
|
|
|
|
|
|
|
| |||||||||
| (a) | Derivative financial instruments are futures contracts. Futures contracts are valued at the unrealized appreciation (depreciation) on the instrument. |
See notes to financial statements.
SCHEDULE OF INVESTMENTS | 45 |
Schedule of Investments March 31, 2023 | iShares® International Developed Property ETF (Percentages shown are based on Net Assets) |
| Security | Shares | Value | ||||||
Common Stocks | ||||||||
| Australia — 12.7% | ||||||||
Abacus Property Group | 25,844 | $ | 45,177 | |||||
Arena REIT | 22,071 | 53,851 | ||||||
BWP Trust | 30,549 | 77,491 | ||||||
Cedar Woods Properties Ltd. | 3,893 | 11,554 | ||||||
Centuria Capital Group | 43,651 | 44,486 | ||||||
Centuria Industrial REIT | 33,959 | 68,604 | ||||||
Centuria Office REIT | 27,358 | 26,264 | ||||||
Charter Hall Group | 29,789 | 221,291 | ||||||
Charter Hall Long Wale REIT | 40,989 | 115,299 | ||||||
Charter Hall Retail REIT | 32,555 | 82,384 | ||||||
Charter Hall Social Infrastructure REIT | 21,387 | 42,872 | ||||||
Cromwell Property Group | 89,960 | 33,497 | ||||||
Dexus | 67,867 | 343,124 | ||||||
Dexus Industria REIT | 12,791 | 22,757 | ||||||
GDI Property Group Partnership | 30,972 | 14,958 | ||||||
Goodman Group | 107,908 | 1,369,335 | ||||||
GPT Group (The) | 120,912 | 345,537 | ||||||
Growthpoint Properties Australia Ltd. | 18,044 | 36,990 | ||||||
HealthCo REIT | 16,418 | 14,706 | ||||||
HealthCo REIT, NVS | 8,641 | 7,740 | ||||||
Home Consortium Ltd. | 12,160 | 29,512 | ||||||
HomeCo Daily Needs REIT | 97,561 | 75,986 | ||||||
Hotel Property Investments Ltd. | 12,156 | 27,706 | ||||||
Ingenia Communities Group | 22,878 | 58,163 | ||||||
Lendlease Corp. Ltd. | 43,666 | 212,506 | ||||||
Lifestyle Communities Ltd. | 6,136 | 65,748 | ||||||
Mirvac Group | 249,014 | 348,774 | ||||||
National Storage REIT | 75,968 | 128,667 | ||||||
RAM Essential Services Property Ltd. | 23,023 | 11,183 | ||||||
Region RE Ltd. | 72,441 | 114,408 | ||||||
Rural Funds Group | 24,264 | 32,481 | ||||||
Scentre Group | 326,983 | 605,273 | ||||||
Stockland | 150,588 | 403,243 | ||||||
Vicinity Ltd. | 244,433 | 319,681 | ||||||
Waypoint REIT Ltd. | 42,297 | 73,637 | ||||||
|
| |||||||
| 5,484,885 | ||||||||
| Austria — 0.3% | ||||||||
CA Immobilien Anlagen AG(a) | 2,884 | 77,486 | ||||||
IMMOFINANZ AG(a) | 2,012 | 28,270 | ||||||
S IMMO AG | 554 | 7,979 | ||||||
|
| |||||||
| 113,735 | ||||||||
| Belgium — 2.5% | ||||||||
Aedifica SA | 2,510 | 202,216 | ||||||
Care Property Invest NV | 2,320 | 32,043 | ||||||
Cofinimmo SA | 1,925 | 170,597 | ||||||
Immobel SA(b) | 264 | 13,738 | ||||||
Intervest Offices & Warehouses NV | 1,657 | 31,448 | ||||||
Montea NV | 851 | 69,086 | ||||||
Retail Estates NV | 726 | 51,225 | ||||||
Shurgard Self Storage Ltd. | 1,568 | 74,992 | ||||||
VGP NV | 825 | 73,545 | ||||||
Warehouses De Pauw CVA | 9,770 | 290,522 | ||||||
Xior Student Housing NV | 1,459 | 49,229 | ||||||
|
| |||||||
| 1,058,641 | ||||||||
| Canada — 3.7% | ||||||||
Allied Properties REIT | 3,916 | 70,584 | ||||||
Artis REIT | 3,638 | 20,485 | ||||||
Automotive Properties Real Estate Investment Trust | 1,200 | 10,246 | ||||||
| Security | Shares | Value | ||||||
| Canada (continued) | ||||||||
Boardwalk REIT | 1,400 | $ | 57,119 | |||||
BSR Real Estate Investment Trust | 1,152 | 15,343 | ||||||
BTB Real Estate Investment Trust | 2,304 | 6,103 | ||||||
Canadian Apartment Properties REIT | 5,275 | 185,044 | ||||||
Choice Properties REIT | 10,135 | 108,886 | ||||||
Crombie REIT | 3,249 | 36,637 | ||||||
CT REIT | 3,351 | 39,746 | ||||||
Dream Industrial REIT(b) | 7,851 | 85,394 | ||||||
Dream Office REIT | 1,357 | 14,599 | ||||||
DREAM Unlimited Corp., Class A | 1,418 | 24,835 | ||||||
European Residential Real Estate Investment Trust | 2,784 | 6,695 | ||||||
First Capital Real Estate Investment Trust | 6,611 | 76,945 | ||||||
Granite REIT | 1,985 | 122,919 | ||||||
H&R Real Estate Investment Trust | 8,226 | 76,691 | ||||||
Inovalis Real Estate Investment Trust(b) | 1,018 | 2,968 | ||||||
InterRent REIT | 4,398 | 43,573 | ||||||
Killam Apartment REIT | 3,603 | 45,747 | ||||||
Minto Apartment Real Estate Investment Trust(c) | 1,158 | 12,647 | ||||||
Morguard Corp. | 278 | 21,339 | ||||||
Morguard North American Residential REIT | 1,246 | 16,042 | ||||||
Nexus Industrial REIT | 2,080 | 15,005 | ||||||
NorthWest Healthcare Properties REIT | 7,319 | 45,869 | ||||||
Prinmaris REIT | 3,040 | 30,389 | ||||||
PRO Real Estate Investment Trust | 1,822 | 8,008 | ||||||
RioCan REIT | 9,362 | 141,244 | ||||||
Slate Grocery REIT | 1,799 | 18,196 | ||||||
Slate Office REIT(b) | 2,437 | 6,383 | ||||||
SmartCentres Real Estate Investment Trust | 4,466 | 87,800 | ||||||
Tricon Residential Inc. | 17,300 | 134,150 | ||||||
True North Commercial Real Estate Investment Trust | 2,960 | 7,600 | ||||||
|
| |||||||
| 1,595,231 | ||||||||
| China — 0.6% | ||||||||
Gemdale Properties & Investment Corp. Ltd. | 356,000 | 24,417 | ||||||
Greenland Hong Kong Holdings Ltd. | 48,000 | 4,212 | ||||||
Wharf Holdings Ltd. (The) | 77,000 | 176,170 | ||||||
Yuexiu REIT | 140,000 | 35,618 | ||||||
|
| |||||||
| 240,417 | ||||||||
| Finland — 0.4% | ||||||||
Citycon OYJ | 5,152 | 35,214 | ||||||
Kojamo OYJ | 11,205 | 131,868 | ||||||
|
| |||||||
| 167,082 | ||||||||
| France — 3.4% | ||||||||
Altarea SCA | 296 | 36,422 | ||||||
Carmila SA | 3,620 | 54,287 | ||||||
Covivio | 2,917 | 169,682 | ||||||
Gecina SA | 3,436 | 356,658 | ||||||
ICADE | 2,012 | 94,737 | ||||||
Klepierre SA | 12,318 | 279,276 | ||||||
Mercialys SA | 4,848 | 49,531 | ||||||
Nexity SA | 3,186 | 80,005 | ||||||
Unibail-Rodamco-Westfield(a) | 6,743 | 362,814 | ||||||
|
| |||||||
| 1,483,412 | ||||||||
| Germany — 3.7% | ||||||||
ADLER Group SA(a)(b)(c) | 4,190 | 4,108 | ||||||
alstria office REIT-AG | 561 | 3,702 | ||||||
Aroundtown SA(b) | 58,076 | 83,022 | ||||||
Deutsche EuroShop AG | 775 | 16,187 | ||||||
Deutsche Wohnen SE | 3,259 | 64,071 | ||||||
DIC Asset AG | 2,363 | 20,314 | ||||||
| 46 | 2 0 2 3 I SHARES ANNUAL REPORT TO SHAREHOLDERS |
Schedule of Investments (continued) March 31, 2023 | iShares® International Developed Property ETF (Percentages shown are based on Net Assets) |
| Security | Shares | Value | ||||||
| Germany (continued) | ||||||||
Grand City Properties SA | 4,882 | $ | 34,722 | |||||
Hamborner REIT AG | 4,496 | 35,666 | ||||||
Instone Real Estate Group SE(c) | 2,922 | 24,765 | ||||||
LEG Immobilien SE | 4,660 | 256,095 | ||||||
TAG Immobilien AG | 11,067 | 76,614 | ||||||
Vib Vermoegen AG | 699 | 13,191 | ||||||
Vonovia SE | 50,215 | 945,790 | ||||||
|
| |||||||
| 1,578,247 | ||||||||
| Hong Kong — 13.2% | ||||||||
Champion REIT | 122,000 | 52,483 | ||||||
CK Asset Holdings Ltd. | 122,500 | 742,677 | ||||||
Far East Consortium International Ltd. | 80,700 | 19,840 | ||||||
Fortune REIT | 93,000 | 77,036 | ||||||
Hang Lung Group Ltd. | 44,000 | 77,685 | ||||||
Hang Lung Properties Ltd. | 116,000 | 217,060 | ||||||
Henderson Land Development Co. Ltd. | 83,044 | 287,315 | ||||||
Hongkong Land Holdings Ltd.(b) | 67,500 | 296,964 | ||||||
Hysan Development Co. Ltd. | 38,000 | 108,025 | ||||||
K Wah International Holdings Ltd. | 86,000 | 30,566 | ||||||
Kerry Properties Ltd. | 36,500 | 93,221 | ||||||
Link REIT | 159,279 | 1,024,201 | ||||||
New World Development Co. Ltd. | 87,000 | 233,212 | ||||||
Prosperity REIT | 80,000 | 20,389 | ||||||
Shun Tak Holdings Ltd.(a) | 136,000 | 24,967 | ||||||
Sino Land Co. Ltd. | 214,000 | 289,397 | ||||||
Sun Hung Kai Properties Ltd. | 95,000 | 1,330,912 | ||||||
Sunlight REIT | 64,000 | 26,097 | ||||||
Swire Properties Ltd. | 66,000 | 169,864 | ||||||
Wharf Real Estate Investment Co. Ltd. | 98,000 | 564,222 | ||||||
Zensun Enterprises Ltd.(a) | 35,000 | 4,107 | ||||||
|
| |||||||
| 5,690,240 | ||||||||
| Ireland — 0.1% | ||||||||
Irish Residential Properties REIT PLC | 27,251 | 27,463 | ||||||
|
| |||||||
| Israel — 2.2% | ||||||||
AFI Properties Ltd.(a) | 336 | 8,859 | ||||||
Africa Israel Residences Ltd. | 391 | 15,414 | ||||||
Airport City Ltd.(a) | 4,068 | 53,851 | ||||||
Alony Hetz Properties & Investments Ltd. | 9,681 | 76,040 | ||||||
Amot Investments Ltd. | 13,612 | 69,074 | ||||||
Ashtrom Group Ltd. | 1 | 11 | ||||||
Aura Investments Ltd.(b) | 7,914 | 10,689 | ||||||
Azrieli Group Ltd. | 2,291 | 131,637 | ||||||
Big Shopping Centers Ltd.(a) | 746 | 61,882 | ||||||
Blue Square Real Estate Ltd. | 352 | 19,193 | ||||||
Electra Real Estate Ltd. | 1,429 | 12,743 | ||||||
G City Ltd. | 5,052 | 16,785 | ||||||
Gav-Yam Lands Corp. Ltd. | 1,757 | 12,881 | ||||||
IES Holdings Ltd. | 176 | 11,779 | ||||||
Israel Canada T.R Ltd. | 8,391 | 15,351 | ||||||
Israel Land Development - Urban Renewal Ltd. | 1,148 | 9,505 | ||||||
Isras Investment Co. Ltd. | 99 | 16,319 | ||||||
Mega Or Holdings Ltd. | 1,395 | 30,038 | ||||||
Mehadrin Ltd.(a) | 1 | 27 | ||||||
Melisron Ltd. | 1,427 | 89,692 | ||||||
Menivim- The New REIT Ltd. | 43,449 | 19,444 | ||||||
Mivne Real Estate KD Ltd. | 37,701 | 104,334 | ||||||
Norstar Holdings Inc.(a) | 1,982 | 5,005 | ||||||
Prashkovsky Investments and Construction Ltd.(b) | 476 | 10,289 | ||||||
Property & Building Corp. Ltd.(a) | 176 | 8,367 | ||||||
| Security | Shares | Value | ||||||
| Israel (continued) | ||||||||
Reit 1 Ltd. | 12,152 | $ | 53,239 | |||||
Sella Capital Real Estate Ltd. | 13,520 | 27,336 | ||||||
Summit Real Estate Holdings Ltd. | 2,166 | 23,966 | ||||||
YH Dimri Construction & Development Ltd. | 433 | 24,701 | ||||||
|
| |||||||
| 938,451 | ||||||||
| Italy — 0.0% | ||||||||
Immobiliare Grande Distribuzione SIIQ SpA | 3,584 | 10,992 | ||||||
|
| |||||||
| Japan — 28.8% | ||||||||
Activia Properties Inc. | 46 | 131,241 | ||||||
Advance Logistics Investment Corp. | 40 | 39,894 | ||||||
Advance Residence Investment Corp. | 87 | 207,719 | ||||||
Aeon Mall Co. Ltd. | 5,980 | 78,490 | ||||||
AEON REIT Investment Corp. | 111 | 121,341 | ||||||
Arealink Co. Ltd. | 500 | 8,879 | ||||||
Comforia Residential REIT Inc. | 42 | 99,920 | ||||||
CRE Inc./Japan | 1,000 | 9,718 | ||||||
CRE Logistics REIT Inc. | 36 | 45,926 | ||||||
Daito Trust Construction Co. Ltd. | 4,400 | 438,371 | ||||||
Daiwa House Industry Co. Ltd. | 42,000 | 989,573 | ||||||
Daiwa House REIT Investment Corp. | 134 | 274,567 | ||||||
Daiwa Office Investment Corp. | 18 | 82,333 | ||||||
Daiwa Securities Living Investments Corp. | 142 | 116,632 | ||||||
Dear Life Co. Ltd. | 1,600 | 8,075 | ||||||
ESCON Japan Reit Investment Corp. | 21 | 17,196 | ||||||
Frontier Real Estate Investment Corp. | 33 | 118,240 | ||||||
Fukuoka REIT Corp. | 45 | 54,998 | ||||||
Global One Real Estate Investment Corp. | 65 | 51,249 | ||||||
GLP J-Reit | 297 | 321,035 | ||||||
Goldcrest Co. Ltd. | 900 | 11,628 | ||||||
Hankyu Hanshin REIT Inc. | 44 | 46,038 | ||||||
Health Care & Medical Investment Corp. | 23 | 28,420 | ||||||
Heiwa Real Estate Co. Ltd. | 2,000 | 57,241 | ||||||
Heiwa Real Estate REIT Inc. | 62 | 71,329 | ||||||
Hoshino Resorts REIT Inc. | 16 | 83,266 | ||||||
Hulic Co. Ltd. | 37,600 | 309,270 | ||||||
Hulic Reit Inc. | 81 | 91,433 | ||||||
Ichigo Hotel REIT Investment Corp. | 17 | 13,284 | ||||||
Ichigo Inc. | 15,200 | 31,863 | ||||||
Ichigo Office REIT Investment Corp. | 96 | 70,061 | ||||||
Industrial & Infrastructure Fund Investment Corp. | 131 | 142,577 | ||||||
Invincible Investment Corp. | 382 | 160,785 | ||||||
Japan Excellent Inc. | 80 | 72,397 | ||||||
Japan Hotel REIT Investment Corp. | 280 | 158,803 | ||||||
Japan Logistics Fund Inc. | 59 | 131,096 | ||||||
Japan Metropolitan Fund Invest | 439 | 320,581 | ||||||
Japan Prime Realty Investment Corp. | 63 | 165,966 | ||||||
Japan Property Management Center Co. Ltd. | 900 | 7,179 | ||||||
Japan Real Estate Investment Corp. | 87 | 346,716 | ||||||
JINUSHI Co Ltd. | 700 | 10,129 | ||||||
JSB Co. Ltd. | 400 | 13,746 | ||||||
Katitas Co. Ltd. | 3,200 | 62,628 | ||||||
Keihanshin Building Co. Ltd. | 2,700 | 24,425 | ||||||
Kenedix Office Investment Corp. | 53 | 122,595 | ||||||
Kenedix Residential Next Investment Corp. | 68 | 105,087 | ||||||
Kenedix Retail REIT Corp. | 38 | 67,333 | ||||||
LaSalle Logiport REIT | 112 | 129,970 | ||||||
Leopalace21 Corp.(a) | 11,200 | 30,253 | ||||||
Marimo Regional Revitalization REIT Inc. | 14 | 13,398 | ||||||
Mirai Corp. | 112 | 38,072 | ||||||
SCHEDULE OF INVESTMENTS | 47 |
Schedule of Investments (continued) March 31, 2023 | iShares® International Developed Property ETF (Percentages shown are based on Net Assets) |
| Security | Shares | Value | ||||||
| Japan (continued) | ||||||||
Mitsubishi Estate Co. Ltd. | 79,200 | $ | 942,057 | |||||
Mitsubishi Estate Logistics REIT Investment Corp. | 32 | 94,288 | ||||||
Mitsui Fudosan Co. Ltd. | 60,056 | 1,128,118 | ||||||
Mitsui Fudosan Logistics Park Inc. | 35 | 122,801 | ||||||
Mori Hills REIT Investment Corp. | 102 | 113,590 | ||||||
Mori Trust Sogo REIT Inc. | 158 | 81,621 | ||||||
Nippon Accommodations Fund Inc. | 32 | 144,165 | ||||||
Nippon Building Fund Inc. | 107 | 445,392 | ||||||
Nippon Prologis REIT Inc. | 173 | 366,249 | ||||||
NIPPON REIT Investment Corp. | 28 | 67,648 | ||||||
Nisshin Fudosan Co. | 1,800 | 6,187 | ||||||
Nomura Real Estate Holdings Inc. | 7,300 | 161,648 | ||||||
Nomura Real Estate Master Fund Inc. | 297 | 332,814 | ||||||
NTT UD REIT Investment Corp. | 87 | 88,522 | ||||||
One REIT Inc. | 17 | 29,589 | ||||||
Ooedo Onsen Reit Investment Corp. | 16 | 7,708 | ||||||
Orix JREIT Inc. | 175 | 221,888 | ||||||
SAMTY Co. Ltd. | 2,600 | 43,240 | ||||||
Samty Residential Investment Corp. | 46 | 38,742 | ||||||
Sankei Real Estate Inc. | 29 | 18,050 | ||||||
Sekisui House Reit Inc. | 274 | 148,662 | ||||||
SOSiLA Logistics REIT Inc. | 46 | 45,121 | ||||||
SRE Holdings Corp.(a) | 600 | 15,396 | ||||||
Star Asia Investment Corp. | 121 | 50,033 | ||||||
Star Mica Holdings Co. Ltd. | 1,600 | 8,430 | ||||||
Starts Corp. Inc. | 2,100 | 40,429 | ||||||
Starts Proceed Investment Corp. | 16 | 27,476 | ||||||
Sumitomo Realty & Development Co. Ltd. | 30,000 | 677,444 | ||||||
Sun Frontier Fudousan Co. Ltd. | 1,800 | 17,429 | ||||||
Takara Leben Co. Ltd. | 5,200 | 14,811 | ||||||
Takara Leben Real Estate Investment Corp. | 41 | 27,722 | ||||||
TKP Corp.(a) | 1,000 | 21,680 | ||||||
TOC Co. Ltd. | 3,200 | 15,393 | ||||||
Tokaido REIT Inc. | 14 | 12,382 | ||||||
Tokyo Tatemono Co. Ltd. | 13,100 | 159,941 | ||||||
Tokyu Fudosan Holdings Corp. | 38,200 | 183,473 | ||||||
Tokyu REIT Inc. | 59 | 80,549 | ||||||
Tosei Corp. | 1,700 | 18,929 | ||||||
Tosei Reit Investment Corp. | 20 | 20,047 | ||||||
United Urban Investment Corp. | 196 | 211,471 | ||||||
XYMAX REIT Investment Corp. | 16 | 13,313 | ||||||
|
| |||||||
| 12,417,414 | ||||||||
| Netherlands — 0.5% | ||||||||
Argo Properties NV(a)(b) | 764 | 9,589 | ||||||
Brack Capital Properties NV(a) | 1 | 92 | ||||||
CTP NV(c) | 4,777 | 61,643 | ||||||
Eurocommercial Properties NV | 2,689 | 61,281 | ||||||
NSI NV | 1,164 | 29,287 | ||||||
Vastned Retail NV | 1,108 | 25,546 | ||||||
Wereldhave NV | 2,489 | 38,404 | ||||||
|
| |||||||
| 225,842 | ||||||||
| New Zealand — 0.7% | ||||||||
Argosy Property Ltd. | 52,588 | 36,574 | ||||||
Goodman Property Trust | 67,030 | 89,866 | ||||||
Kiwi Property Group Ltd. | 98,832 | 56,277 | ||||||
Precinct Properties New Zealand Ltd. | 84,920 | 67,555 | ||||||
Stride Property Group | 34,025 | 27,871 | ||||||
Vital Healthcare Property Trust | 30,154 | 44,080 | ||||||
|
| |||||||
| 322,223 | ||||||||
| Security | Shares | Value | ||||||
| Norway — 0.2% | ||||||||
Entra ASA(c) | 7,668 | $ | 74,200 | |||||
|
| |||||||
| Singapore — 8.9% | ||||||||
AIMS APAC REIT(b) | 33,485 | 33,262 | ||||||
CapitaLand Ascendas REIT | 211,892 | 456,884 | ||||||
CapitaLand Ascott Trust(b) | 129,560 | 97,013 | ||||||
CapitaLand China Trust | 73,926 | 62,275 | ||||||
Capitaland India Trust | 47,100 | 38,653 | ||||||
CapitaLand Integrated Commercial Trust | 317,110 | 472,947 | ||||||
Capitaland Investment Ltd/Singapore | 154,800 | 429,495 | ||||||
CDL Hospitality Trusts | 53,962 | 48,361 | ||||||
City Developments Ltd. | 32,000 | 177,566 | ||||||
Cromwell European Real Estate Investment Trust | 22,720 | 37,206 | ||||||
Daiwa House Logistics Trust(b) | 35,000 | 14,861 | ||||||
Digital Core REIT Management Pte Ltd. | 21,300 | 9,511 | ||||||
Eagle Hospitality Trust(a)(d) | 53,200 | — | ||||||
EC World Real Estate Investment Trust(b) | 16,900 | 4,064 | ||||||
ESR-LOGOS REIT | 353,136 | 86,374 | ||||||
Far East Hospitality Trust | 66,100 | 29,115 | ||||||
First REIT | 71,500 | 13,949 | ||||||
Frasers Centrepoint Trust | 68,206 | 117,611 | ||||||
Frasers Logistics & Commercial Trust | 181,972 | 179,610 | ||||||
Hong Fok Corp. Ltd.(b) | 25,900 | 19,912 | ||||||
Keppel DC REIT | 83,203 | 129,020 | ||||||
Keppel Pacific Oak US REIT | 47,300 | 17,974 | ||||||
Keppel REIT | 124,800 | 83,097 | ||||||
Lendlease Global Commercial REIT | 119,692 | 61,275 | ||||||
Manulife US Real Estate Investment Trust | 110,750 | 23,867 | ||||||
Mapletree Industrial Trust | 126,332 | 225,554 | ||||||
Mapletree Logistics Trust(b) | 203,711 | 262,780 | ||||||
Mapletree Pan Asia Commercial Trust | 144,812 | 196,338 | ||||||
OUE Commercial Real Estate Investment Trust | 152,700 | 36,190 | ||||||
Parkway Life REIT | 24,600 | 73,827 | ||||||
Prime U.S. REIT | 40,000 | 12,820 | ||||||
Sasseur Real Estate Investment Trust | 35,500 | 19,872 | ||||||
SPH REIT | 67,200 | 47,729 | ||||||
Starhill Global REIT | 90,400 | 35,391 | ||||||
Suntec REIT | 143,000 | 153,883 | ||||||
UOL Group Ltd. | 29,300 | 152,984 | ||||||
|
| |||||||
| 3,861,270 | ||||||||
| South Korea — 0.5% | ||||||||
D&D Platform REIT Co. Ltd., NVS | 3,616 | 9,843 | ||||||
Dongwon Development Co. Ltd. | 2,402 | 6,131 | ||||||
E KOCREF CR-REIT Co. Ltd. | 1,476 | 5,633 | ||||||
ESR Kendall Square REIT Co. Ltd. | 10,069 | 30,172 | ||||||
IGIS Value Plus REIT Co. Ltd. | 2,059 | 7,043 | ||||||
JR REIT XXVII | 9,327 | 31,667 | ||||||
Koramco Energy Plus Reit | 2,665 | 10,258 | ||||||
Korea REIT & Trust Co. Ltd. | 7,841 | 7,982 | ||||||
LOTTE Reit Co. Ltd. | 7,415 | 21,036 | ||||||
Mirae Asset Maps Asia Pacific Real Estate 1 Investment | 5,800 | 18,431 | ||||||
NH All-One REIT Co. Ltd. | 2,659 | 7,128 | ||||||
Shinhan Alpha REIT Co. Ltd. | 3,744 | 15,817 | ||||||
Shinhan Seobu T&D REIT Co. Ltd. | 1,788 | 5,137 | ||||||
SK D&D Co. Ltd. | 527 | 7,795 | ||||||
SK REITs Co. Ltd. | 4,881 | 18,745 | ||||||
|
| |||||||
| 202,818 | ||||||||
| Spain — 0.8% | ||||||||
Aedas Homes SA(c) | 826 | 11,663 | ||||||
Inmobiliaria Colonial Socimi SA | 18,688 | 118,438 | ||||||
| 48 | 2 0 2 3 I SHARES ANNUAL REPORT TO SHAREHOLDERS |
Schedule of Investments (continued) March 31, 2023 | iShares® International Developed Property ETF (Percentages shown are based on Net Assets) |
| Security | Shares | Value | ||||||
| ||||||||
| Spain (continued) | ||||||||
Lar Espana Real Estate Socimi SA | 3,510 | $ | 18,747 | |||||
Merlin Properties Socimi SA | 20,980 | 183,564 | ||||||
Metrovacesa SA(b)(c) | 1,242 | 9,698 | ||||||
|
| |||||||
| 342,110 | ||||||||
| Sweden — 4.0% | ||||||||
Akelius Residential Property AB, Class D(b) | 13,047 | 26,120 | ||||||
Atrium Ljungberg AB, Class B | 3,257 | 53,205 | ||||||
Castellum AB(b) | 18,076 | 210,292 | ||||||
Catena AB | 2,086 | 77,634 | ||||||
Cibus Nordic Real Estate AB | 2,864 | 29,929 | ||||||
Corem Property Group AB | 281 | 4,381 | ||||||
Corem Property Group AB, Class B | 34,161 | 23,862 | ||||||
Dios Fastigheter AB | 5,743 | 38,177 | ||||||
Fabege AB | 16,839 | 129,156 | ||||||
Fastighets AB Balder, Class B(a) | 41,047 | 168,645 | ||||||
Heba Fastighets AB | 4,132 | 11,366 | ||||||
Hufvudstaden AB, Class A | 7,401 | 100,388 | ||||||
K-Fast Holding AB(a) | 3,846 | 7,583 | ||||||
Klarabo Sverige AB(a) | 5,136 | 6,933 | ||||||
Logistea AB(a) | 3,903 | 4,828 | ||||||
Neobo Fastigheter AB(a)(b) | 7,034 | 8,458 | ||||||
NP3 Fastigheter AB | 1,792 | 32,333 | ||||||
Nyfosa AB | 9,744 | 67,824 | ||||||
Pandox AB(a) | 5,574 | 69,545 | ||||||
Platzer Fastigheter Holding AB, Class B | 4,104 | 31,847 | ||||||
Sagax AB, Class B | 11,796 | 271,902 | ||||||
Sagax AB, Class D | 6,739 | 17,013 | ||||||
Samhallsbyggnadsbolaget i Norden AB(b) | 67,186 | 91,860 | ||||||
Samhallsbyggnadsbolaget i Norden AB, Class D(b) | 9,147 | 14,200 | ||||||
Wallenstam AB, Class B | 26,423 | 100,004 | ||||||
Wihlborgs Fastigheter AB | 16,828 | 128,952 | ||||||
|
| |||||||
| 1,726,437 | ||||||||
| Switzerland — 2.5% | ||||||||
Allreal Holding AG, Registered | 976 | 164,720 | ||||||
Intershop Holding AG | 77 | 56,018 | ||||||
Mobimo Holding AG, Registered | 458 | 119,426 | ||||||
Peach Property Group AG(b) | 659 | 8,818 | ||||||
PSP Swiss Property AG, Registered | 2,883 | 328,083 | ||||||
Swiss Prime Site AG, Registered | 4,835 | 402,067 | ||||||
|
| |||||||
| 1,079,132 | ||||||||
| United Kingdom — 9.5% | ||||||||
Abrdn Property Income Trust | 26,322 | 17,502 | ||||||
AEW UK REIT PLC | 10,708 | 12,216 | ||||||
Assura PLC | 187,586 | 113,065 | ||||||
Balanced Commercial Property Trust Ltd. | 49,991 | 50,815 | ||||||
Big Yellow Group PLC | 11,008 | 158,687 | ||||||
British Land Co. PLC (The) | 59,235 | 284,130 | ||||||
Capital & Counties Properties PLC | 114,726 | 162,330 | ||||||
Civitas Social Housing PLC | 39,924 | 26,455 | ||||||
CLS Holdings PLC | 11,952 | 19,816 | ||||||
Custodian Reit PLC | 27,246 | 29,981 | ||||||
Derwent London PLC | 7,122 | 207,288 | ||||||
Ediston Property Investment Co. PLC | 13,308 | 10,080 | ||||||
Empiric Student Property PLC | 37,864 | 42,178 | ||||||
Grainger PLC | 46,564 | 133,838 | ||||||
Great Portland Estates PLC | 15,963 | 99,838 | ||||||
Hammerson PLC | 250,648 | 80,589 | ||||||
Helical PLC | 6,641 | 24,577 | ||||||
Home Reit PLC(d) | 52,824 | 22,880 | ||||||
| Security | Shares | Value | ||||||
| ||||||||
| United Kingdom (continued) | ||||||||
Impact Healthcare Reit PLC | 25,359 | $ | 28,843 | |||||
Land Securities Group PLC | 47,420 | 364,022 | ||||||
LondonMetric Property PLC | 61,611 | 134,208 | ||||||
LXI REIT PLC | 108,159 | 131,658 | ||||||
NewRiver REIT PLC | 18,767 | 18,266 | ||||||
Phoenix Spree Deutschland Ltd. | 6,534 | 14,952 | ||||||
Picton Property Income Ltd. (The) | 35,036 | 29,988 | ||||||
Primary Health Properties PLC | 84,625 | 105,980 | ||||||
PRS REIT PLC (The) | 34,496 | 34,426 | ||||||
Regional REIT Ltd.(c) | 27,207 | 18,191 | ||||||
Safestore Holdings PLC | 13,697 | 160,770 | ||||||
Schroder REIT Ltd. | 34,160 | 18,466 | ||||||
Segro PLC | 76,164 | 725,522 | ||||||
Sirius Real Estate Ltd. | 75,069 | 71,028 | ||||||
Supermarket Income Reit PLC | 78,054 | 83,572 | ||||||
Triple Point Social Housing REIT PLC(c) | 23,769 | 12,520 | ||||||
Tritax Big Box REIT PLC | 117,666 | 203,607 | ||||||
UK Commercial Property REIT Ltd. | 54,826 | 34,915 | ||||||
UNITE Group PLC (The) | 25,162 | 298,100 | ||||||
Urban Logistics REIT PLC | 29,721 | 46,930 | ||||||
Warehouse REIT PLC | 26,754 | 33,730 | ||||||
Workspace Group PLC | 8,824 | 47,547 | ||||||
|
| |||||||
| 4,113,506 | ||||||||
|
| |||||||
Total Common Stocks — 99.2% |
| 42,753,748 | ||||||
|
| |||||||
Rights | ||||||||
| Austria — 0.0% | ||||||||
Buwog AG(d) | 463 | — | ||||||
|
| |||||||
| South Korea — 0.0% | ||||||||
Shinhan Alpha REIT Co. Ltd., | 686 | — | ||||||
|
| |||||||
Total Rights — 0.0% |
| — | ||||||
|
| |||||||
Total Long-Term Investments — 99.2% |
| 42,753,748 | ||||||
|
| |||||||
Short-Term Securities | ||||||||
| Money Market Funds — 2.1% | ||||||||
BlackRock Cash Funds: Institutional, SL Agency Shares, 5.01%(e)(f)(g) | 912,181 | 912,455 | ||||||
BlackRock Cash Funds: Treasury, SL Agency Shares, 4.73%(e)(f) | 10,000 | 10,000 | ||||||
|
| |||||||
Total Short-Term Securities — 2.1% |
| 922,455 | ||||||
|
| |||||||
Total Investments — 101.3% |
| 43,676,203 | ||||||
Liabilities in Excess of Other Assets — (1.3)% | (552,802 | ) | ||||||
|
| |||||||
Net Assets — 100.0% | $ | 43,123,401 | ||||||
|
| |||||||
| (a) | Non-income producing security. |
| (b) | All or a portion of this security is on loan. |
| (c) | Security exempt from registration pursuant to Rule 144A under the Securities Act of 1933, as amended. These securities may be resold in transactions exempt from registration to qualified institutional investors. |
SCHEDULE OF INVESTMENTS | 49 |
Schedule of Investments (continued) March 31, 2023 | iShares® International Developed Property ETF |
| (d) | Security is valued using significant unobservable inputs and is classified as Level 3 in the fair value hierarchy. |
| (e) | Affiliate of the Fund. |
| (f) | Annualized 7-day yield as of period end. |
| (g) | All or a portion of this security was purchased with the cash collateral from loaned securities. |
Affiliates
Investments in issuers considered to be affiliate(s) of the Fund during the year ended March 31, 2023 for purposes of Section 2(a)(3) of the Investment Company Act of 1940, as amended, were as follows:
| ||||||||||||||||||||||||||||||||||||
| Affiliated Issuer | Value at 03/31/22 | Purchases at Cost | Proceeds from Sale | Net Realized Gain (Loss) | Change in Unrealized Appreciation (Depreciation) | Value at 03/31/23 | Shares Held at 03/31/23 | Income | Capital Gain Distributions from Underlying Funds | |||||||||||||||||||||||||||
| ||||||||||||||||||||||||||||||||||||
BlackRock Cash Funds: Institutional, SL Agency Shares | $ | 458,807 | $ | 453,369 | (a) | $ | — | $ | 125 | $ | 154 | $ | 912,455 | 912,181 | $ | 23,438 | (b) | $ | — | |||||||||||||||||
BlackRock Cash Funds: Treasury, SL Agency Shares | 30,000 | — | (20,000 | )(a) | — | — | 10,000 | 10,000 | 401 | — | ||||||||||||||||||||||||||
|
|
|
|
|
|
|
|
|
| |||||||||||||||||||||||||||
| $ | 125 | $ | 154 | $ | 922,455 | $ | 23,839 | $ | — | |||||||||||||||||||||||||||
|
|
|
|
|
|
|
|
|
| |||||||||||||||||||||||||||
| (a) | Represents net amount purchased (sold). |
| (b) | All or a portion represents securities lending income earned from the reinvestment of cash collateral from loaned securities, net of fees and collateral investment expenses, and other payments to and from borrowers of securities. |
Derivative Financial Instruments Outstanding as of Period End
Futures Contracts
| ||||||||||||||||
| Description | Number of Contracts | Expiration Date | Notional Amount (000) | Value/ Unrealized Appreciation (Depreciation) | ||||||||||||
| ||||||||||||||||
Long Contracts | ||||||||||||||||
Mini TOPIX Index | 12 | 06/08/23 | $ | 182 | $ | 898 | ||||||||||
Dow Jones U.S. Real Estate Index | 6 | 06/16/23 | 199 | 6,367 | ||||||||||||
|
| |||||||||||||||
| $ | 7,265 | |||||||||||||||
|
| |||||||||||||||
Derivative Financial Instruments Categorized by Risk Exposure
As of period end, the fair values of derivative financial instruments located in the Statements of Assets and Liabilities were as follows:
| ||||||||||||||||||||||||||||
Commodity Contracts | Credit Contracts | Equity Contracts | Foreign Currency Exchange Contracts | Interest Rate Contracts | Other Contracts | Total | ||||||||||||||||||||||
| ||||||||||||||||||||||||||||
Assets — Derivative Financial Instruments | ||||||||||||||||||||||||||||
Futures contracts | ||||||||||||||||||||||||||||
Unrealized appreciation on futures contracts(a) | $ | — | $ | — | $ | 7,265 | $ | — | $ | — | $ | — | $ | 7,265 | ||||||||||||||
|
|
|
|
|
|
|
|
|
|
|
|
|
| |||||||||||||||
| (a) | Net cumulative unrealized appreciation (depreciation) on futures contracts are reported in the Schedule of Investments. In the Statements of Assets and Liabilities, only current day’s variation margin is reported in receivables or payables and the net cumulative unrealized appreciation (depreciation) is included in accumulated earnings (loss). |
| 50 | 2 0 2 3 I SHARES ANNUAL REPORT TO SHAREHOLDERS |
Schedule of Investments (continued) March 31, 2023 | iShares® International Developed Property ETF |
For the period ended March 31, 2023, the effect of derivative financial instruments in the Statements of Operations was as follows:
| ||||||||||||||||||||||||||||
Commodity Contracts | Credit Contracts | Equity Contracts | Foreign Currency Exchange Contracts | Interest Rate Contracts | Other Contracts | Total | ||||||||||||||||||||||
| ||||||||||||||||||||||||||||
Net Realized Gain (Loss) from | ||||||||||||||||||||||||||||
Futures contracts | $ | — | $ | — | $ | (21,721 | ) | $ | — | $ | — | $ | — | $ | (21,721 | ) | ||||||||||||
|
|
|
|
|
|
|
|
|
|
|
|
|
| |||||||||||||||
Net Change in Unrealized Appreciation (Depreciation) on | ||||||||||||||||||||||||||||
Futures contracts | $ | — | $ | — | $ | (7,904 | ) | $ | — | $ | — | $ | — | $ | (7,904 | ) | ||||||||||||
|
|
|
|
|
|
|
|
|
|
|
|
|
| |||||||||||||||
Average Quarterly Balances of Outstanding Derivative Financial Instruments
Futures contracts | ||||
Average notional value of contracts — long | $ | 364,542 | ||
For more information about the Fund’s investment risks regarding derivative financial instruments, refer to the Notes to Financial Statements.
Fair Value Hierarchy as of Period End
Various inputs are used in determining the fair value of financial instruments. For a description of the input levels and information about the Fund’s policy regarding valuation of financial instruments, refer to the Notes to Financial Statements.
The following table summarizes the Fund’s financial instruments categorized in the fair value hierarchy. The breakdown of the Fund’s financial instruments into major categories is disclosed in the Schedule of Investments above.
| ||||||||||||||||
| Level 1 | Level 2 | Level 3 | Total | |||||||||||||
| ||||||||||||||||
Assets | ||||||||||||||||
Investments | ||||||||||||||||
Long-Term Investments | ||||||||||||||||
Common Stocks | $ | 3,179,453 | $ | 39,551,415 | $ | 22,880 | $ | 42,753,748 | ||||||||
Rights | — | — | — | — | ||||||||||||
Short-Term Securities | ||||||||||||||||
Money Market Funds | 922,455 | — | — | 922,455 | ||||||||||||
|
|
|
|
|
|
|
| |||||||||
| $ | 4,101,908 | $ | 39,551,415 | $ | 22,880 | $ | 43,676,203 | |||||||||
|
|
|
|
|
|
|
| |||||||||
Derivative Financial Instruments(a) | ||||||||||||||||
Assets | ||||||||||||||||
Equity Contracts | $ | 6,367 | $ | 898 | $ | — | $ | 7,265 | ||||||||
|
|
|
|
|
|
|
| |||||||||
| (a) | Derivative financial instruments are futures contracts. Futures contracts are valued at the unrealized appreciation (depreciation) on the instrument. |
See notes to financial statements.
SCHEDULE OF INVESTMENTS | 51 |
Schedule of Investments March 31, 2023 | iShares® International Developed Small Cap Value Factor ETF (Percentages shown are based on Net Assets) |
| Security | Shares | Value | ||||||
Common Stocks | ||||||||
| Australia — 8.8% | ||||||||
Abacus Property Group | 150,990 | $ | 263,943 | |||||
Arena REIT | 101,977 | 248,816 | ||||||
AUB Group Ltd. | 22,200 | 381,494 | ||||||
Austal Ltd. | 101,031 | 116,758 | ||||||
Bapcor Ltd. | 107,550 | 461,904 | ||||||
Bega Cheese Ltd. | 95,000 | 230,859 | ||||||
Bravura Solutions Ltd. | 89,201 | 23,898 | ||||||
Brickworks Ltd. | 18,795 | 285,598 | ||||||
BWP Trust | 152,240 | 386,176 | ||||||
Cedar Woods Properties Ltd. | 19,600 | 58,171 | ||||||
Centuria Capital Group | 221,150 | 225,382 | ||||||
Centuria Industrial REIT | 166,404 | 336,172 | ||||||
Centuria Office REIT | 153,121 | 146,996 | ||||||
Charter Hall Long Wale REIT | 171,203 | 481,580 | ||||||
Charter Hall Retail REIT | 152,547 | 386,035 | ||||||
Charter Hall Social Infrastructure REIT | 105,843 | 212,171 | ||||||
Credit Corp. Group Ltd. | 18,200 | 208,061 | ||||||
Dexus Industria REIT | 68,187 | 121,314 | ||||||
Elders Ltd. | 48,900 | 282,877 | ||||||
Emeco Holdings Ltd. | 177,961 | 87,170 | ||||||
Gold Road Resources Ltd. | 271,850 | 308,433 | ||||||
GrainCorp Ltd., Class A | 73,050 | 339,003 | ||||||
Growthpoint Properties Australia Ltd. | 88,962 | 182,372 | ||||||
GUD Holdings Ltd. | 38,600 | 255,001 | ||||||
Healius Ltd. | 184,212 | 391,163 | ||||||
Ingenia Communities Group | 116,347 | 295,791 | ||||||
InvoCare Ltd. | 45,800 | 363,378 | ||||||
IPH Ltd. | 49,650 | 247,600 | ||||||
Kelsian Group Ltd. | 46,215 | 181,900 | ||||||
Link Administration Holdings Ltd. | 160,654 | 228,098 | ||||||
McMillan Shakespeare Ltd. | 16,578 | 160,057 | ||||||
Monadelphous Group Ltd. | 28,100 | 236,697 | ||||||
National Storage REIT | 363,200 | 615,154 | ||||||
Nine Entertainment Co. Holdings Ltd. | 463,450 | 616,320 | ||||||
Perseus Mining Ltd. | 386,150 | 612,945 | ||||||
Premier Investments Ltd. | 25,750 | 453,162 | ||||||
Reliance Worldwide Corp. Ltd. | 250,485 | 623,045 | ||||||
Rural Funds Group | 115,700 | 154,883 | ||||||
Sandfire Resources Ltd.(a)(b) | 130,300 | 553,082 | ||||||
Select Harvests Ltd. | 39,250 | 108,839 | ||||||
Service Stream Ltd. | 183,840 | 79,548 | ||||||
SmartGroup Corp. Ltd. | 28,000 | 120,586 | ||||||
Super Retail Group Ltd. | 51,800 | 438,078 | ||||||
Superloop Ltd.(a) | 135,050 | 50,682 | ||||||
United Malt Grp Ltd. | 85,400 | 272,944 | ||||||
Viva Energy Group Ltd.(c) | 270,550 | 549,989 | ||||||
Waypoint REIT Ltd. | 232,050 | 403,987 | ||||||
Westgold Resources Ltd.(a) | 99,350 | 86,719 | ||||||
|
| |||||||
| 13,874,831 | ||||||||
| Austria — 2.1% | ||||||||
CA Immobilien Anlagen AG(a) | 13,078 | 351,377 | ||||||
EVN AG(b) | 11,613 | 257,911 | ||||||
Mayr Melnhof Karton AG(b) | 2,681 | 445,607 | ||||||
Oesterreichische Post AG(b) | 10,550 | 390,562 | ||||||
Porr AG | 4,582 | 67,084 | ||||||
Schoeller-Bleckmann Oilfield Equipment AG | 3,550 | 228,805 | ||||||
UNIQA Insurance Group AG | 35,105 | 295,792 | ||||||
Vienna Insurance Group AG Wiener Versicherung Gruppe | 12,050 | 324,055 | ||||||
| Security | Shares | Value | ||||||
| Austria (continued) | ||||||||
Wienerberger AG | 35,800 | $ | 1,036,448 | |||||
|
| |||||||
| 3,397,641 | ||||||||
| Belgium — 2.2% | ||||||||
Aedifica SA | 11,550 | 930,515 | ||||||
Bekaert SA | 11,162 | 504,152 | ||||||
Deme Group NV(a) | 2,259 | 289,416 | ||||||
Gimv NV | 6,150 | 297,176 | ||||||
KBC Ancora | 11,322 | 521,698 | ||||||
Montea NV | 3,900 | 316,613 | ||||||
Shurgard Self Storage Ltd. | 7,700 | 368,264 | ||||||
Tessenderlo Group SA(a) | 8,050 | 251,582 | ||||||
|
| |||||||
| 3,479,416 | ||||||||
| Canada — 16.9% | ||||||||
Allied Properties REIT | 39,962 | 720,292 | ||||||
AltaGas Ltd. | 88,350 | 1,472,827 | ||||||
ARC Resources Ltd. | 207,500 | 2,353,663 | ||||||
Canadian Apartment Properties REIT | 55,097 | 1,932,778 | ||||||
Canadian Western Bank | 27,250 | 499,230 | ||||||
Capital Power Corp. | 36,550 | 1,126,113 | ||||||
Celestica Inc.(a) | 33,150 | 427,528 | ||||||
Choice Properties REIT | 81,400 | 874,531 | ||||||
Finning International Inc. | 50,989 | 1,271,047 | ||||||
Granite REIT | 19,586 | 1,212,839 | ||||||
Home Capital Group Inc. | 16,005 | 489,091 | ||||||
iA Financial Corp. Inc. | 34,100 | 2,161,307 | ||||||
Laurentian Bank of Canada | 13,800 | 324,808 | ||||||
Linamar Corp. | 14,400 | 692,883 | ||||||
Maple Leaf Foods Inc. | 24,006 | 464,489 | ||||||
Mullen Group Ltd. | 29,100 | 318,022 | ||||||
North West Co. Inc. (The) | 14,950 | 418,025 | ||||||
Onex Corp. | 24,100 | 1,126,628 | ||||||
Parex Resources Inc. | 39,850 | 741,272 | ||||||
PrairieSky Royalty Ltd. | 63,700 | 1,008,642 | ||||||
Russel Metals Inc. | 19,850 | 504,218 | ||||||
SSR Mining Inc. | 66,850 | 1,011,035 | ||||||
Stella-Jones Inc. | 20,706 | 793,462 | ||||||
Torex Gold Resources Inc.(a) | 27,250 | 453,461 | ||||||
Transcontinental Inc., Class A | 22,755 | 236,221 | ||||||
West Fraser Timber Co. Ltd. | 31,350 | 2,236,138 | ||||||
Yamana Gold Inc. | 305,000 | 1,778,320 | ||||||
|
| |||||||
| 26,648,870 | ||||||||
| Denmark — 2.1% | ||||||||
FLSmidth & Co. A/S | 17,850 | 683,823 | ||||||
Scandinavian Tobacco Group A/S, Class A(c) | 19,250 | 383,243 | ||||||
Schouw & Co. A/S | 4,102 | 343,637 | ||||||
Spar Nord Bank A/S | 25,900 | 409,090 | ||||||
Sydbank AS | 18,900 | 849,769 | ||||||
Topdanmark AS | 13,450 | 719,027 | ||||||
|
| |||||||
| 3,388,589 | ||||||||
| Finland — 2.8% | ||||||||
Cargotec OYJ, Class B | 15,445 | 751,873 | ||||||
Kemira OYJ | 28,103 | 495,118 | ||||||
Konecranes OYJ | 23,050 | 772,957 | ||||||
Metsa Board OYJ, Class B | 54,428 | 438,663 | ||||||
Outokumpu OYJ | 106,550 | 580,393 | ||||||
Terveystalo OYJ(b)(c) | 24,050 | 183,241 | ||||||
TietoEVRY OYJ | 29,800 | 936,159 | ||||||
Uponor OYJ | 17,070 | 315,982 | ||||||
| 4,474,386 | ||||||||
| 52 | 2 0 2 3 I SHARES ANNUAL REPORT TO SHAREHOLDERS |
Schedule of Investments (continued) March 31, 2023 | iShares® International Developed Small Cap Value Factor ETF (Percentages shown are based on Net Assets) |
| Security | Shares | Value | ||||||
| France — 2.9% | ||||||||
APERAM SA | 15,037 | $ | 560,939 | |||||
Beneteau SA | 11,450 | 191,339 | ||||||
Carmila SA | 12,978 | 194,623 | ||||||
Coface SA(a) | 32,966 | 466,964 | ||||||
Derichebourg SA | 29,250 | 171,792 | ||||||
Fnac Darty SA | 5,550 | 204,913 | ||||||
IPSOS | 12,195 | 755,871 | ||||||
Jacquet Metal Service SA | 3,500 | 68,053 | ||||||
Mersen SA | 4,750 | 211,216 | ||||||
Metropole Television SA | 20,550 | 333,310 | ||||||
Nexity SA | 13,443 | 337,574 | ||||||
Quadient SA | 10,750 | 196,361 | ||||||
Rothschild & Co. | 8,859 | 447,233 | ||||||
Television Francaise 1 | 33,800 | 298,576 | ||||||
Vicat SA | 4,751 | 142,571 | ||||||
|
| |||||||
| 4,581,335 | ||||||||
| Germany — 3.2% | ||||||||
Aurubis AG | 11,166 | 1,034,448 | ||||||
Bilfinger SE | 8,550 | 362,585 | ||||||
CropEnergies AG | 6,250 | 76,858 | ||||||
Deutsche EuroShop AG | 3,180 | 66,420 | ||||||
Deutz AG | 38,450 | 249,506 | ||||||
Freenet AG | 39,850 | 1,035,481 | ||||||
Hamburger Hafen und Logistik AG | 8,100 | 100,064 | ||||||
Hornbach Holding AG & Co. KGaA | 2,700 | 216,097 | ||||||
Instone Real Estate Group SE(c) | 14,812 | 125,534 | ||||||
Krones AG | 4,650 | 550,016 | ||||||
Salzgitter AG | 12,200 | 483,226 | ||||||
Suedzucker AG | 24,855 | 417,574 | ||||||
Takkt AG | 10,550 | 166,516 | ||||||
Wacker Neuson SE | 7,650 | 160,180 | ||||||
|
| |||||||
| 5,044,505 | ||||||||
| Hong Kong — 0.1% | ||||||||
VSTECS Holdings Ltd. | 200,000 | 117,258 | ||||||
|
| |||||||
| Israel — 0.4% | ||||||||
Clal Insurance Enterprises Holdings Ltd.(a) | 15,050 | 204,729 | ||||||
Menora Mivtachim Holdings Ltd. | 7,150 | 145,576 | ||||||
Migdal Insurance & Financial Holdings Ltd.(a) | 100,950 | 107,897 | ||||||
Oil Refineries Ltd. | 482,350 | 132,026 | ||||||
|
| |||||||
| 590,228 | ||||||||
| Italy — 1.1% | ||||||||
Banca IFIS SpA | 8,302 | 125,591 | ||||||
BFF Bank SpA(c) | 58,700 | 582,431 | ||||||
Credito Emiliano SpA | 24,453 | 180,803 | ||||||
Unipol Gruppo SpA | 153,700 | 789,039 | ||||||
|
| |||||||
| 1,677,864 | ||||||||
| Japan — 18.8% | ||||||||
ADEKA Corp. | 30,000 | 513,668 | ||||||
Aichi Steel Corp. | 5,000 | 88,520 | ||||||
Aida Engineering Ltd. | 20,000 | 123,720 | ||||||
Aiphone Co. Ltd. | 5,000 | 77,053 | ||||||
Aisan Industry Co. Ltd. | 10,000 | 68,093 | ||||||
Alconix Corp. | 5,000 | 51,500 | ||||||
Alpen Co. Ltd. | 5,000 | 75,329 | ||||||
Anest Iwata Corp. | 10,000 | 75,888 | ||||||
AOKI Holdings Inc. | 10,000 | 64,455 | ||||||
Arata Corp. | 5,000 | 153,304 | ||||||
Asahi Co. Ltd. | 5,000 | 51,133 | ||||||
| Security | Shares | Value | ||||||
| Japan (continued) | ||||||||
Asahi Diamond Industrial Co. Ltd. | 15,000 | $ | 106,284 | |||||
ASAHI YUKIZAI Corp. | 5,000 | 119,864 | ||||||
Autobacs Seven Co. Ltd. | 20,000 | 218,089 | ||||||
Awa Bank Ltd. (The) | 10,000 | 147,446 | ||||||
BML Inc. | 5,000 | 116,724 | ||||||
Bunka Shutter Co. Ltd. | 15,000 | 125,431 | ||||||
Canon Electronics Inc. | 5,000 | 69,856 | ||||||
Cawachi Ltd. | 5,000 | 86,359 | ||||||
Central Glass Co. Ltd. | 15,000 | 332,995 | ||||||
Chubu Shiryo Co. Ltd. | 10,000 | 78,902 | ||||||
Chudenko Corp. | 10,000 | 161,165 | ||||||
Chugoku Marine Paints Ltd. | 15,000 | 124,197 | ||||||
Citizen Watch Co. Ltd. | 80,000 | 470,696 | ||||||
Daihen Corp. | 5,000 | 168,057 | ||||||
Daiichi Jitsugyo Co. Ltd. | 5,000 | 210,254 | ||||||
Daiken Corp. | 5,000 | 86,148 | ||||||
Dainichiseika Color & Chemicals Manufacturing Co. Ltd. | 5,000 | 67,412 | ||||||
DCM Holdings Co. Ltd. | 30,000 | 261,425 | ||||||
Digital Holdings Inc. | 5,000 | 43,371 | ||||||
Doshisha Co. Ltd. | 5,000 | 73,201 | ||||||
Duskin Co. Ltd. | 15,000 | 361,059 | ||||||
DyDo Group Holdings Inc. | 2,400 | 88,245 | ||||||
EDION Corp.(b) | 25,000 | 241,758 | ||||||
Eizo Corp. | 5,000 | 154,774 | ||||||
Exedy Corp. | 10,000 | 136,834 | ||||||
Fuji Co. Ltd./Ehime | 5,000 | 65,293 | ||||||
Fuji Seal International Inc. | 15,000 | 171,470 | ||||||
Fujibo Holdings Inc. | 5,000 | 124,929 | ||||||
Fukuda Corp. | 1,500 | 52,671 | ||||||
Furuno Electric Co. Ltd. | 5,000 | 36,922 | ||||||
Futaba Industrial Co. Ltd. | 20,000 | 64,452 | ||||||
Glory Ltd. | 15,000 | 328,352 | ||||||
Goldcrest Co. Ltd. | 5,000 | 64,602 | ||||||
Gunze Ltd. | 5,000 | 169,371 | ||||||
H2O Retailing Corp. | 25,000 | 281,241 | ||||||
Hakuto Co. Ltd. | 3,200 | 119,231 | ||||||
Heiwado Co. Ltd. | 10,000 | 153,687 | ||||||
Hibiya Engineering Ltd. | 5,000 | 81,647 | ||||||
Hodogaya Chemical Co. Ltd. | 1,600 | 36,490 | ||||||
Hokuetsu Corp. | 45,000 | 301,845 | ||||||
Hokuto Corp. | 5,000 | 69,956 | ||||||
Hosiden Corp. | 15,000 | 182,707 | ||||||
Hosokawa Micron Corp. | 5,000 | 109,638 | ||||||
Inabata & Co. Ltd. | 15,000 | 305,036 | ||||||
Ines Corp. | 5,000 | 51,886 | ||||||
I-PEX Inc. | 5,000 | 53,223 | ||||||
Iseki & Co. Ltd. | 5,000 | 45,048 | ||||||
Ishihara Sangyo Kaisha Ltd. | 10,000 | 84,532 | ||||||
Itochu Enex Co. Ltd. | 15,000 | 127,898 | ||||||
Japan Wool Textile Co. Ltd. (The) | 20,000 | 149,148 | ||||||
Joshin Denki Co. Ltd. | 5,000 | 73,837 | ||||||
Joyful Honda Co. Ltd. | 20,000 | 259,011 | ||||||
JVCKenwood Corp. | 45,000 | 129,782 | ||||||
Kaga Electronics Co. Ltd. | 5,000 | 189,879 | ||||||
Kanamoto Co. Ltd. | 10,000 | 164,763 | ||||||
Kanematsu Corp. | 25,000 | 310,469 | ||||||
Kanto Denka Kogyo Co. Ltd. | 15,000 | 117,342 | ||||||
Katakura Industries Co. Ltd. | 5,000 | 70,133 | ||||||
Kato Sangyo Co. Ltd. | 5,000 | 132,740 | ||||||
Kissei Pharmaceutical Co. Ltd. | 10,000 | 199,669 | ||||||
SCHEDULE OF INVESTMENTS | 53 |
Schedule of Investments (continued) March 31, 2023 | iShares® International Developed Small Cap Value Factor ETF (Percentages shown are based on Net Assets) |
| Security | Shares | Value | ||||||
| Japan (continued) | ||||||||
Kitz Corp. | 20,000 | $ | 140,632 | |||||
Kiyo Bank Ltd. (The) | 20,000 | 224,654 | ||||||
Koa Corp. | 10,000 | 139,674 | ||||||
Kohnan Shoji Co. Ltd. | 10,000 | 245,227 | ||||||
Kojima Co. Ltd. | 10,000 | 42,325 | ||||||
Komeri Co. Ltd. | 10,000 | 206,558 | ||||||
Komori Corp. | 15,000 | 112,550 | ||||||
Kumagai Gumi Co. Ltd. | 10,000 | 200,745 | ||||||
Kureha Corp. | 5,000 | 320,348 | ||||||
KYB Corp. | 5,000 | 152,062 | ||||||
Kyoei Steel Ltd. | 5,000 | 60,856 | ||||||
Kyokuto Kaihatsu Kogyo Co. Ltd. | 10,000 | 122,224 | ||||||
LEC Inc. | 5,000 | 30,427 | ||||||
Life Corp. | 5,000 | 97,609 | ||||||
Macnica Holdings Inc. | 15,000 | 427,268 | ||||||
Makino Milling Machine Co. Ltd. | 5,000 | 183,752 | ||||||
Marudai Food Co. Ltd. | 5,000 | 54,865 | ||||||
Marusan Securities Co. Ltd. | 20,000 | 64,523 | ||||||
Matsuda Sangyo Co. Ltd. | 5,000 | 85,924 | ||||||
Maxell Ltd. | 15,000 | 174,573 | ||||||
Meidensha Corp. | 15,000 | 218,318 | ||||||
Meisei Industrial Co. Ltd. | 15,000 | 87,731 | ||||||
Melco Holdings Inc. | 1,600 | 39,538 | ||||||
Mimasu Semiconductor Industry Co. Ltd. | 5,000 | 111,712 | ||||||
MIRAIT ONE corp | 25,000 | 311,348 | ||||||
Mitsubishi Pencil Co. Ltd. | 15,000 | 184,599 | ||||||
Mitsuboshi Belting Ltd. | 5,000 | 148,795 | ||||||
Mizuno Corp. | 5,000 | 117,458 | ||||||
Nachi-Fujikoshi Corp. | 5,000 | 149,542 | ||||||
Neturen Co. Ltd. | 5,000 | 26,281 | ||||||
Nichiha Corp. | 10,000 | 204,544 | ||||||
Nichireki Co. Ltd. | 5,000 | 56,241 | ||||||
Nihon Chouzai Co. Ltd. | 5,000 | 43,697 | ||||||
Nihon Parkerizing Co. Ltd. | 30,000 | 225,503 | ||||||
Nikkon Holdings Co. Ltd. | 15,000 | 281,098 | ||||||
Nippn Corp., New | 15,000 | 187,800 | ||||||
Nippon Coke & Engineering Co. Ltd.(a) | 45,000 | 29,585 | ||||||
Nippon Denko Co. Ltd. | 30,000 | 81,149 | ||||||
Nippon Koei Co. Ltd. | 5,000 | 127,487 | ||||||
Nippon Light Metal Holdings Co. Ltd. | 20,000 | 221,122 | ||||||
Nippon Soda Co. Ltd. | 7,600 | 265,179 | ||||||
Nippon Suisan Kaisha Ltd. | 85,000 | 348,480 | ||||||
Nippon Thompson Co. Ltd. | 20,000 | 88,153 | ||||||
Nishimatsu Construction Co. Ltd. | 10,000 | 258,543 | ||||||
Nishimatsuya Chain Co. Ltd. | 15,000 | 185,156 | ||||||
Nishio Rent All Co. Ltd. | 5,000 | 117,451 | ||||||
Nissha Co. Ltd. | 10,000 | 141,082 | ||||||
Nisshinbo Holdings Inc. | 45,000 | 344,727 | ||||||
Nitta Corp. | 5,000 | 110,866 | ||||||
Nittetsu Mining Co. Ltd. | 5,000 | 135,440 | ||||||
Nitto Kogyo Corp. | 10,000 | 199,656 | ||||||
Nojima Corp. | 20,000 | 211,479 | ||||||
Noritake Co. Ltd./Nagoya Japan | 5,000 | 173,559 | ||||||
Noritz Corp. | 10,000 | 131,422 | ||||||
Obara Group Inc. | 5,000 | 149,552 | ||||||
Okamura Corp. | 25,000 | 258,174 | ||||||
Oki Electric Industry Co. Ltd. | 25,000 | 135,837 | ||||||
Okumura Corp. | 10,000 | 236,363 | ||||||
Onoken Co. Ltd. | 5,000 | 56,129 | ||||||
Osaka Soda Co. Ltd. | 5,000 | 164,785 | ||||||
| Security | Shares | Value | ||||||
| Japan (continued) | ||||||||
Osaka Steel Co. Ltd. | 5,000 | $ | 49,980 | |||||
Osaki Electric Co. Ltd. | 15,000 | 60,354 | ||||||
Oyo Corp. | 5,000 | 84,064 | ||||||
Pacific Industrial Co. Ltd. | 15,000 | 131,145 | ||||||
Pack Corp. (The) | 5,000 | 111,808 | ||||||
Piolax Inc. | 5,000 | 72,967 | ||||||
Press Kogyo Co. Ltd. | 30,000 | 112,971 | ||||||
Pressance Corp. | 5,000 | 67,507 | ||||||
Prima Meat Packers Ltd. | 10,000 | 166,156 | ||||||
Procrea Holdings Inc. | 5,000 | 79,476 | ||||||
Qol Holdings Co. Ltd. | 5,000 | 43,888 | ||||||
Restar Holdings Corp. | 10,000 | 163,707 | ||||||
Ryobi Ltd. | 10,000 | 116,672 | ||||||
S Foods Inc. | 5,000 | 107,656 | ||||||
Sakai Chemical Industry Co. Ltd. | 5,000 | 66,952 | ||||||
Sanki Engineering Co. Ltd. | 15,000 | 165,903 | ||||||
Sanyo Chemical Industries Ltd. | 5,000 | 161,437 | ||||||
Sanyo Special Steel Co. Ltd. | 5,000 | 92,928 | ||||||
Seiko Group Corp. | 8,100 | 177,565 | ||||||
Shinmaywa Industries Ltd. | 20,000 | 178,484 | ||||||
Shizuoka Gas Co. Ltd. | 20,000 | 173,761 | ||||||
Siix Corp. | 10,000 | 106,966 | ||||||
Sinfonia Technology Co. Ltd. | 10,000 | 119,514 | ||||||
SKY Perfect JSAT Holdings Inc. | 40,000 | 156,230 | ||||||
Sodick Co. Ltd. | 15,000 | 86,319 | ||||||
Star Micronics Co. Ltd. | 10,000 | 136,458 | ||||||
Starts Corp. Inc. | 10,000 | 192,518 | ||||||
Starzen Co. Ltd. | 5,000 | 82,122 | ||||||
Stella Chemifa Corp. | 2,500 | 49,975 | ||||||
Sumitomo Osaka Cement Co. Ltd. | 10,000 | 281,779 | ||||||
Sumitomo Seika Chemicals Co. Ltd. | 2,600 | 85,011 | ||||||
Sumitomo Warehouse Co. Ltd. (The) | 15,000 | 246,804 | ||||||
Sun Frontier Fudousan Co. Ltd. | 10,000 | 96,828 | ||||||
Suruga Bank Ltd. | 60,000 | 210,294 | ||||||
SWCC Showa Holdings Co. Ltd. | 5,000 | 71,834 | ||||||
Tadano Ltd. | 35,000 | 276,652 | ||||||
Takamatsu Construction Group Co. Ltd. | 5,000 | 76,600 | ||||||
Takaoka Toko Co. Ltd. | 5,000 | 88,986 | ||||||
Takara Standard Co. Ltd. | 15,000 | 166,519 | ||||||
Takasago Thermal Engineering Co. Ltd. | 20,000 | 318,918 | ||||||
Tamron Co. Ltd. | 5,000 | 119,162 | ||||||
Tatsuta Electric Wire and Cable Co. Ltd. | 5,000 | 26,837 | ||||||
T-Gaia Corp. | 5,000 | 63,031 | ||||||
Toa Corp./Tokyo | 5,000 | 100,204 | ||||||
Toagosei Co. Ltd. | 40,000 | 373,029 | ||||||
Toho Holdings Co. Ltd. | 15,000 | 266,183 | ||||||
TOKAI Holdings Corp. | 40,000 | 263,571 | ||||||
Tokyu Construction Co. Ltd. | 20,000 | 102,027 | ||||||
Tomy Co. Ltd. | 30,000 | 335,865 | ||||||
Topre Corp. | 15,000 | 139,475 | ||||||
Towa Pharmaceutical Co. Ltd. | 10,000 | 143,203 | ||||||
Toyo Construction Co. Ltd. | 25,000 | 172,891 | ||||||
Toyo Ink SC Holdings Co. Ltd. | 10,000 | 155,433 | ||||||
Toyo Tanso Co. Ltd. | 5,000 | 155,613 | ||||||
Toyobo Co. Ltd. | 30,000 | 235,898 | ||||||
Tsubakimoto Chain Co. | 10,000 | 243,496 | ||||||
Tsurumi Manufacturing Co. Ltd. | 5,000 | 78,434 | ||||||
Uchida Yoko Co. Ltd. | 2,500 | 92,961 | ||||||
United Super Markets Holdings Inc. | 20,000 | 168,123 | ||||||
V Technology Co. Ltd. | 2,500 | 53,131 | ||||||
| 54 | 2 0 2 3 I SHARES ANNUAL REPORT TO SHAREHOLDERS |
Schedule of Investments (continued) March 31, 2023 | iShares® International Developed Small Cap Value Factor ETF (Percentages shown are based on Net Assets) |
| Security | Shares | Value | ||||||
| Japan (continued) | ||||||||
VT Holdings Co. Ltd. | 30,000 | $ | 114,964 | |||||
Wacoal Holdings Corp. | 20,000 | 375,905 | ||||||
Warabeya Nichiyo Holdings Co. Ltd. | 5,000 | 68,364 | ||||||
Xebio Holdings Co. Ltd. | 5,000 | 39,642 | ||||||
Yamazen Corp. | 20,000 | 153,899 | ||||||
Yellow Hat Ltd. | 10,000 | 137,684 | ||||||
Yokogawa Bridge Holdings Corp. | 10,000 | 163,605 | ||||||
Yondoshi Holdings Inc. | 5,000 | 67,452 | ||||||
Yuasa Trading Co. Ltd. | 5,000 | 143,189 | ||||||
|
| |||||||
| 29,713,465 | ||||||||
| Netherlands — 0.6% | ||||||||
Flow Trades Ltd., NVS | 8,295 | 240,371 | ||||||
Fugro NV(a) | 32,350 | 411,047 | ||||||
Koninklijke BAM Groep NV(a) | 78,511 | 187,121 | ||||||
NSI NV | 5,541 | 139,414 | ||||||
|
| |||||||
| 977,953 | ||||||||
| New Zealand — 1.0% | ||||||||
Argosy Property Ltd. | 265,881 | 184,915 | ||||||
Goodman Property Trust | 340,486 | 456,486 | ||||||
Kathmandu Holdings Ltd. | 196,300 | 135,107 | ||||||
Precinct Properties New Zealand Ltd. | 419,227 | 333,500 | ||||||
Stride Property Group | 134,450 | 110,134 | ||||||
Summerset Group Holdings Ltd. | 73,250 | 403,767 | ||||||
|
| |||||||
| 1,623,909 | ||||||||
| Norway — 1.6% | ||||||||
Austevoll Seafood ASA | 28,850 | 258,552 | ||||||
Elkem ASA(c) | 85,000 | 288,850 | ||||||
Entra ASA(c) | 20,550 | 198,852 | ||||||
SpareBank 1 SMN | 42,700 | 504,439 | ||||||
Subsea 7 SA | 75,050 | 890,891 | ||||||
Veidekke ASA | 36,068 | 382,815 | ||||||
|
| |||||||
| 2,524,399 | ||||||||
| Poland — 0.3% | ||||||||
Grupa Azoty SA(a) | 14,700 | 122,455 | ||||||
PGE Polska Grupa Energetyczna SA(a) | 232,200 | 338,157 | ||||||
|
| |||||||
| 460,612 | ||||||||
| Singapore — 1.5% | ||||||||
CapitaLand China Trust(b) | 360,000 | 303,261 | ||||||
Cromwell European Real Estate Investment Trust | 100,120 | 163,956 | ||||||
First Resources Ltd. | 165,000 | 195,813 | ||||||
Frasers Centrepoint Trust | 340,000 | 586,277 | ||||||
Keppel Pacific Oak US REIT | 255,000 | 96,900 | ||||||
Parkway Life REIT | 120,000 | 360,130 | ||||||
Prime U.S. REIT | 205,000 | 65,701 | ||||||
Raffles Medical Group Ltd. | 300,000 | 336,368 | ||||||
SPH REIT | 225,240 | 159,977 | ||||||
Starhill Global REIT | 425,000 | 166,382 | ||||||
|
| |||||||
| 2,434,765 | ||||||||
| Sweden — 5.6% | ||||||||
AFRY AB | 31,200 | 562,217 | ||||||
Arjo AB, Class B | 70,958 | 277,806 | ||||||
Atrium Ljungberg AB, Class B | 14,200 | 231,965 | ||||||
Betsson AB | 38,200 | 363,526 | ||||||
Bilia AB, Class A | 24,057 | 297,132 | ||||||
Billerud AB | 59,621 | 612,795 | ||||||
Bravida Holding AB(c) | 64,150 | 725,648 | ||||||
Bure Equity AB | 17,400 | 415,819 | ||||||
Clas Ohlson AB, Class B | 12,692 | 94,298 | ||||||
| Security | Shares | Value | ||||||
| Sweden (continued) | ||||||||
Cloetta AB, Class B | 67,600 | $ | 142,557 | |||||
Fabege AB | 81,973 | 628,739 | ||||||
Granges AB | 33,400 | 318,637 | ||||||
Hexpol AB | 78,800 | 976,092 | ||||||
Hufvudstaden AB, Class A | 34,050 | 461,857 | ||||||
Lindab International AB | 21,750 | 333,300 | ||||||
Loomis AB | 24,000 | 822,257 | ||||||
MEKO AB | 13,300 | 158,185 | ||||||
Munters Group AB(c) | 33,753 | 311,775 | ||||||
NCC AB, Class B | 30,200 | 267,864 | ||||||
Nolato AB, Class B | 55,850 | 283,675 | ||||||
Peab AB, Class B | 63,158 | 316,343 | ||||||
Ratos AB, Class B | 63,250 | 193,267 | ||||||
|
| |||||||
| 8,795,754 | ||||||||
| Switzerland — 8.7% | ||||||||
ALSO Holding AG, Registered | 850 | 173,034 | ||||||
Arbonia AG | 13,924 | 167,702 | ||||||
Bell Food Group AG, Registered | 593 | 181,891 | ||||||
Bossard Holding AG, Class A, Registered | 823 | 208,007 | ||||||
Bucher Industries AG, Registered | 2,077 | 971,436 | ||||||
Burckhardt Compression Holding AG | 1,000 | 621,783 | ||||||
Bystronic AG, Registered | 400 | 288,610 | ||||||
Cembra Money Bank AG | 9,335 | 734,678 | ||||||
Comet Holding AG, Registered | 2,350 | 653,659 | ||||||
COSMO Pharmaceuticals NV | 2,981 | 185,060 | ||||||
Daetwyler Holding AG, Bearer | 2,335 | 482,269 | ||||||
dormakaba Holding AG | 955 | 408,580 | ||||||
Forbo Holding AG, Registered | 321 | 463,909 | ||||||
Galenica AG(c) | 15,352 | 1,298,745 | ||||||
Huber + Suhner AG, Registered | 5,597 | 480,629 | ||||||
Interroll Holding AG, Registered | 154 | 553,384 | ||||||
Kardex Holding AG, Registered | 1,850 | 402,466 | ||||||
Komax Holding AG, Registered | 1,138 | 319,481 | ||||||
Landis+Gyr Group AG(b) | 7,802 | 600,500 | ||||||
Rieter Holding AG, Registered | 950 | 99,480 | ||||||
SFS Group AG | 5,350 | 694,398 | ||||||
Siegfried Holding AG, Registered | 1,300 | 956,467 | ||||||
St. Galler Kantonalbank AG, Class A, Registered | 890 | 479,036 | ||||||
Swissquote Group Holding SA, Registered | 2,750 | 537,108 | ||||||
u-blox Holding AG | 2,124 | 296,843 | ||||||
Valiant Holding AG, Registered | 4,950 | 532,154 | ||||||
Vontobel Holding AG, Registered | 8,750 | 567,824 | ||||||
Ypsomed Holding AG, Registered | 1,000 | 210,658 | ||||||
Zehnder Group AG, Registered | 3,130 | 255,844 | ||||||
|
| |||||||
| 13,825,635 | ||||||||
| United Kingdom — 18.2% | ||||||||
AG Barr PLC | 24,904 | 154,659 | ||||||
Balanced Commercial Property Trust Ltd | 161,600 | 164,264 | ||||||
Balfour Beatty PLC | 202,150 | 928,662 | ||||||
Bank of Georgia Group PLC | 12,000 | 407,557 | ||||||
Big Yellow Group PLC | 53,600 | 772,675 | ||||||
Bodycote PLC | 59,150 | 475,898 | ||||||
Capricorn Energy PLC(a) | 157,000 | 452,226 | ||||||
Chemring Group PLC | 89,367 | 308,468 | ||||||
Close Brothers Group PLC | 47,500 | 529,743 | ||||||
Coats Group PLC | 456,550 | 415,078 | ||||||
Cranswick PLC | 16,600 | 617,901 | ||||||
Crest Nicholson Holdings PLC | 79,300 | 213,716 | ||||||
Currys PLC | 320,700 | 233,659 | ||||||
SCHEDULE OF INVESTMENTS | 55 |
Schedule of Investments (continued) March 31, 2023 | iShares® International Developed Small Cap Value Factor ETF (Percentages shown are based on Net Assets) |
| Security | Shares | Value | ||||||
| ||||||||
| United Kingdom (continued) | ||||||||
Drax Group PLC | 126,500 | $ | 950,180 | |||||
Elementis PLC(a) | 182,450 | 268,059 | ||||||
Essentra PLC | 95,300 | 228,115 | ||||||
Frasers Group PLC(a) | 57,694 | 553,372 | ||||||
Grafton Group PLC | 69,325 | 759,293 | ||||||
Great Portland Estates PLC | 80,350 | 502,537 | ||||||
Greencore Group PLC(a) | 166,750 | 167,133 | ||||||
Halfords Group PLC | 63,127 | 136,123 | ||||||
Ibstock PLC(c) | 122,219 | 260,077 | ||||||
IG Group Holdings PLC | 115,232 | 994,391 | ||||||
Inchcape PLC | 122,300 | 1,172,333 | ||||||
Investec PLC | 211,200 | 1,172,052 | ||||||
IP Group PLC | 311,250 | 212,521 | ||||||
Jupiter Fund Management PLC | 138,261 | 231,850 | ||||||
Just Group PLC | 329,250 | 348,691 | ||||||
Lancashire Holdings Ltd. | 77,200 | 526,844 | ||||||
LondonMetric Property PLC | 278,800 | 607,314 | ||||||
Man Group PLC/Jersey | 434,300 | 1,265,212 | ||||||
Mediclinic International PLC | 124,597 | 764,518 | ||||||
Morgan Advanced Materials PLC | 88,900 | 312,297 | ||||||
Morgan Sindall Group PLC | 12,800 | 267,664 | ||||||
Ninety One PLC | 131,700 | 300,322 | ||||||
OSB Group PLC | 120,000 | 717,827 | ||||||
Paragon Banking Group PLC | 79,400 | 509,328 | ||||||
Pets at Home Group PLC | 150,750 | 686,211 | ||||||
Picton Property Income Ltd. (The) | 168,445 | 144,173 | ||||||
Plus500 Ltd. | 31,100 | 649,135 | ||||||
Premier Foods PLC | 225,034 | 337,183 | ||||||
QinetiQ Group PLC | 178,254 | 716,124 | ||||||
Redde Northgate PLC | 78,600 | 335,000 | ||||||
Redrow PLC | 72,480 | 428,728 | ||||||
RHI Magnesita NV | 8,950 | 247,950 | ||||||
Safestore Holdings PLC | 65,059 | 763,639 | ||||||
Savills PLC | 41,900 | 511,287 | ||||||
Serco Group PLC | 380,650 | 720,320 | ||||||
Sirius Real Estate Ltd | 303,550 | 287,210 | ||||||
TBC Bank Group PLC | 11,250 | 310,867 | ||||||
TP ICAP Group PLC | 250,900 | 557,428 | ||||||
Tritax Big Box REIT PLC | 592,900 | 1,025,942 | ||||||
UK Commercial Property REIT Ltd. | 234,983 | 149,646 | ||||||
| Security | Shares | Value | ||||||
| ||||||||
| United Kingdom (continued) | ||||||||
Vesuvius PLC | 67,282 | $ | 343,497 | |||||
Virgin Money UK PLC | 395,300 | 714,421 | ||||||
Vistry Group PLC | 70,150 | 678,785 | ||||||
Workspace Group PLC | 42,500 | 229,005 | ||||||
|
| |||||||
| 28,739,110 | ||||||||
|
| |||||||
Total Common Stocks — 98.9% |
| 156,370,525 | ||||||
|
| |||||||
Preferred Stocks | ||||||||
| Germany — 0.1% | ||||||||
Draegerwerk AG & Co. KGaA, Preference Shares, NVS | 2,769 | 127,347 | ||||||
|
| |||||||
Total Preferred Stocks — 0.1% |
| 127,347 | ||||||
|
| |||||||
Total Long-Term Investments — 99.0% |
| 156,497,872 | ||||||
|
| |||||||
Short-Term Securities | ||||||||
| Money Market Funds — 1.4% | ||||||||
BlackRock Cash Funds: Institutional, SL Agency Shares, 5.01%(d)(e)(f) | 2,137,128 | 2,137,769 | ||||||
|
| |||||||
Total Short-Term Securities — 1.4% |
| 2,137,769 | ||||||
�� |
| |||||||
Total Investments — 100.4% |
| 158,635,641 | ||||||
Liabilities in Excess of Other Assets — (0.4)% |
| (634,875 | ) | |||||
|
| |||||||
Net Assets — 100.0% | $ | 158,000,766 | ||||||
|
| |||||||
| (a) | Non-income producing security. |
| (b) | All or a portion of this security is on loan. |
| (c) | Security exempt from registration pursuant to Rule 144A under the Securities Act of 1933, as amended. These securities may be resold in transactions exempt from registration to qualified institutional investors. |
| (d) | Affiliate of the Fund. |
| (e) | Annualized 7-day yield as of period end. |
| (f) | All or a portion of this security was purchased with the cash collateral from loaned securities. |
| 56 | 2 0 2 3 I SHARES ANNUAL REPORT TO SHAREHOLDERS |
Schedule of Investments (continued) March 31, 2023 | iShares® International Developed Small Cap Value Factor ETF |
Affiliates
Investments in issuers considered to be affiliate(s) of the Fund during the year ended March 31, 2023 for purposes of Section 2(a)(3) of the Investment Company Act of 1940, as amended, were as follows:
| ||||||||||||||||||||||||||||||||||||
| Affiliated Issuer | Value at 03/31/22 | Purchases at Cost | Proceeds from Sale | Net Realized Gain (Loss) | Change in Unrealized Appreciation (Depreciation) | Value at 03/31/23 | Shares Held at 03/31/23 | Income | Capital Gain Distributions from Underlying Funds | |||||||||||||||||||||||||||
| ||||||||||||||||||||||||||||||||||||
BlackRock Cash Funds: Institutional, SL Agency Shares | $ | 17,607 | $ | 2,119,430 | (a) | $ | — | $ | 449 | $ | 283 | $ | 2,137,769 | 2,137,128 | $ | 26,954 | (b) | $ | — | |||||||||||||||||
BlackRock Cash Funds: Treasury, SL Agency Shares(c) | 40,000 | — | (40,000 | )(a) | — | — | — | — | 1,883 | — | ||||||||||||||||||||||||||
|
|
|
|
|
|
|
|
|
| |||||||||||||||||||||||||||
| $ | 449 | $ | 283 | $ | 2,137,769 | $ | 28,837 | $ | — | |||||||||||||||||||||||||||
|
|
|
|
|
|
|
|
|
| |||||||||||||||||||||||||||
| (a) | Represents net amount purchased (sold). |
| (b) | All or a portion represents securities lending income earned from the reinvestment of cash collateral from loaned securities, net of fees and collateral investment expenses, and other payments to and from borrowers of securities. |
| (c) | As of period end, the entity is no longer held. |
Derivative Financial Instruments Outstanding as of Period End
Futures Contracts
| ||||||||||||||||
| Description | Number of Contracts | Expiration Date | Notional Amount (000) | Value/ Unrealized Appreciation (Depreciation) | ||||||||||||
| ||||||||||||||||
Long Contracts | ||||||||||||||||
Mini TOPIX Index | 40 | 06/08/23 | $ | 607 | $ | (375 | ) | |||||||||
Mini S&P/TSX 60 Index | 7 | 06/15/23 | 313 | 5,569 | ||||||||||||
FTSE 250 Index | 12 | 06/16/23 | 561 | 4,377 | ||||||||||||
|
| |||||||||||||||
| $ | 9,571 | |||||||||||||||
|
| |||||||||||||||
Derivative Financial Instruments Categorized by Risk Exposure
As of period end, the fair values of derivative financial instruments located in the Statements of Assets and Liabilities were as follows:
| ||||||||||||||||||||||||||||
| Commodity Contracts | Credit Contracts | Equity Contracts | Foreign Currency Exchange Contracts | Interest Rate Contracts | Other Contracts | Total | ||||||||||||||||||||||
| ||||||||||||||||||||||||||||
Assets — Derivative Financial Instruments | ||||||||||||||||||||||||||||
Futures contracts | ||||||||||||||||||||||||||||
Unrealized appreciation on futures contracts(a) | $ | — | $ | — | $ | 9,946 | $ | — | $ | — | $ | — | $ | 9,946 | ||||||||||||||
|
|
|
|
|
|
|
|
|
|
|
|
|
| |||||||||||||||
Liabilities — Derivative Financial Instruments | ||||||||||||||||||||||||||||
Futures contracts | ||||||||||||||||||||||||||||
Unrealized depreciation on futures contracts(a) | $ | — | $ | — | $ | 375 | $ | — | $ | — | $ | — | $ | 375 | ||||||||||||||
|
|
|
|
|
|
|
|
|
|
|
|
|
| |||||||||||||||
| (a) | Net cumulative unrealized appreciation (depreciation) on futures contracts are reported in the Schedule of Investments. In the Statements of Assets and Liabilities, only current day’s variation margin is reported in receivables or payables and the net cumulative unrealized appreciation (depreciation) is included in accumulated earnings (loss). |
SCHEDULE OF INVESTMENTS | 57 |
Schedule of Investments (continued) March 31, 2023 | iShares® International Developed Small Cap Value Factor ETF |
For the period ended March 31, 2023, the effect of derivative financial instruments in the Statements of Operations was as follows:
| ||||||||||||||||||||||||||||
| Commodity Contracts | Credit Contracts | Equity Contracts | Foreign Currency Exchange Contracts | Interest Rate Contracts | Other Contracts | Total | ||||||||||||||||||||||
| ||||||||||||||||||||||||||||
Net Realized Gain (Loss) from | ||||||||||||||||||||||||||||
Futures contracts | $ | — | $ | — | $ | 76,788 | $ | — | $ | — | $ | — | $ | 76,788 | ||||||||||||||
|
|
|
|
|
|
|
|
|
|
|
|
|
| |||||||||||||||
Net Change in Unrealized Appreciation (Depreciation) on | ||||||||||||||||||||||||||||
Futures contracts | $ | — | $ | — | $ | (249 | ) | $ | — | $ | — | $ | — | $ | (249 | ) | ||||||||||||
|
|
|
|
|
|
|
|
|
|
|
|
|
| |||||||||||||||
Average Quarterly Balances of Outstanding Derivative Financial Instruments
Futures contracts | ||||
Average notional value of contracts — long | $ | 1,094,387 | ||
For more information about the Fund’s investment risks regarding derivative financial instruments, refer to the Notes to Financial Statements.
Fair Value Hierarchy as of Period End
Various inputs are used in determining the fair value of financial instruments. For a description of the input levels and information about the Fund’s policy regarding valuation of financial instruments, refer to the Notes to Financial Statements.
The following table summarizes the Fund’s financial instruments categorized in the fair value hierarchy. The breakdown of the Fund’s financial instruments into major categories is disclosed in the Schedule of Investments above.
| ||||||||||||||||
| Level 1 | Level 2 | Level 3 | Total | |||||||||||||
| ||||||||||||||||
Assets | ||||||||||||||||
Investments | ||||||||||||||||
Long-Term Investments | ||||||||||||||||
Common Stocks | $ | 36,977,624 | $ | 119,392,901 | $ | — | $ | 156,370,525 | ||||||||
Preferred Stocks | — | 127,347 | — | 127,347 | ||||||||||||
Short-Term Securities | ||||||||||||||||
Money Market Funds | 2,137,769 | — | — | 2,137,769 | ||||||||||||
|
|
|
|
|
|
|
| |||||||||
| $ | 39,115,393 | $ | 119,520,248 | $ | — | $ | 158,635,641 | |||||||||
|
|
|
|
|
|
|
| |||||||||
Derivative Financial Instruments(a) | ||||||||||||||||
Assets | ||||||||||||||||
Equity Contracts | $ | 5,569 | $ | 4,377 | $ | — | $ | 9,946 | ||||||||
Liabilities | ||||||||||||||||
Equity Contracts | — | (375 | ) | — | (375 | ) | ||||||||||
|
|
|
|
|
|
|
| |||||||||
| $ | 5,569 | $ | 4,002 | $ | — | 9,571 | ||||||||||
|
|
|
|
|
|
|
| |||||||||
| (a) | Derivative financial instruments are futures contracts. Futures contracts are valued at the unrealized appreciation (depreciation) on the instrument. |
See notes to financial statements.
| 58 | 2 0 2 3 I SHARES ANNUAL REPORT TO SHAREHOLDERS |
Schedule of Investments March 31, 2023 | iShares® International Dividend Growth ETF (Percentages shown are based on Net Assets) |
| Security | Shares | Value | ||||||
| ||||||||
Common Stocks | ||||||||
| Australia — 2.1% | ||||||||
Altium Ltd. | 7,683 | $ | 197,390 | |||||
AUB Group Ltd. | 10,638 | 182,808 | ||||||
Bapcor Ltd. | 52,993 | 227,594 | ||||||
Brickworks Ltd. | 12,411 | 188,591 | ||||||
carsales.com Ltd. | 40,188 | 600,611 | ||||||
Cleanaway Waste Management Ltd. | 210,790 | 337,306 | ||||||
Collins Foods Ltd. | 17,927 | 100,180 | ||||||
Computershare Ltd. | 67,571 | 981,482 | ||||||
CSL Ltd. | 25,807 | 4,998,052 | ||||||
Elders Ltd. | 48,068 | 278,064 | ||||||
IPH Ltd. | 35,460 | 176,836 | ||||||
Nick Scali Ltd. | 26,595 | 167,340 | ||||||
Northern Star Resources Ltd. | 117,215 | 961,181 | ||||||
Pro Medicus Ltd. | 1,773 | 76,469 | ||||||
PSC Insurance Group Ltd. | 25,216 | 80,964 | ||||||
Sonic Healthcare Ltd. | 71,905 | 1,685,665 | ||||||
Steadfast Group Ltd. | 119,579 | 469,650 | ||||||
Technology One Ltd. | 19,700 | 193,589 | ||||||
Washington H Soul Pattinson & Co. Ltd. | 30,338 | 614,853 | ||||||
|
| |||||||
| 12,518,625 | ||||||||
| Belgium — 0.2% | ||||||||
Elia Group SA/NV | 2,758 | 364,211 | ||||||
UCB SA | 10,047 | 897,962 | ||||||
|
| |||||||
| 1,262,173 | ||||||||
| Brazil — 0.2% | ||||||||
Localiza Rent a Car SA | 84,907 | 894,560 | ||||||
|
| |||||||
| Canada — 19.4% | ||||||||
Alimentation Couche-Tard Inc. | 26,792 | 1,347,034 | ||||||
Altius Minerals Corp. | 3,349 | 56,969 | ||||||
Atco Ltd., Class I, NVS | 14,863 | 476,408 | ||||||
Badger Infrastructure Solutions Ltd. | 4,334 | 104,798 | ||||||
Barrick Gold Corp. | 284,862 | 5,288,337 | ||||||
Brookfield Asset Management Ltd. | 16,745 | 548,503 | ||||||
Brookfield Corp. | 111,305 | 3,626,163 | ||||||
Canadian Imperial Bank of Commerce | 230,293 | 9,765,514 | ||||||
Canadian National Railway Co. | 52,008 | 6,136,675 | ||||||
Canadian Natural Resources Ltd. | 204,486 | 11,315,951 | ||||||
Canadian Tire Corp. Ltd., Class A, NVS | 9,259 | 1,208,294 | ||||||
Canadian Western Bank | 21,670 | 397,003 | ||||||
Capital Power Corp. | 30,141 | 928,651 | ||||||
Cargojet Inc.(a) | 985 | 80,236 | ||||||
CCL Industries Inc., Class B, NVS | 9,850 | 489,330 | ||||||
Cogeco Communications Inc. | 3,940 | 191,913 | ||||||
Dollarama Inc. | 4,334 | 259,014 | ||||||
Empire Co. Ltd., Class A, NVS | 13,790 | 369,672 | ||||||
Enghouse Systems Ltd. | 4,137 | 117,085 | ||||||
EQB Inc. | 2,561 | 110,475 | ||||||
Finning International Inc. | 20,291 | 505,811 | ||||||
FirstService Corp. | 1,308 | 184,301 | ||||||
Fortis Inc. | 92,590 | 3,935,846 | ||||||
Franco-Nevada Corp. | 8,471 | 1,235,581 | ||||||
George Weston Ltd. | 4,334 | 574,339 | ||||||
Great-West Lifeco Inc. | 68,359 | 1,811,779 | ||||||
Hydro One Ltd.(b) | 45,310 | 1,290,069 | ||||||
iA Financial Corp. Inc. | 14,972 | 948,947 | ||||||
Imperial Oil Ltd. | 16,745 | 851,560 | ||||||
Intact Financial Corp. | 16,942 | 2,424,655 | ||||||
| Security | Shares | Value | ||||||
| ||||||||
| Canada (continued) | ||||||||
Jamieson Wellness Inc.(b) | 4,531 | $ | 112,278 | |||||
Loblaw Companies Ltd. | 9,653 | 879,734 | ||||||
Magna International Inc. | 39,991 | 2,142,026 | ||||||
Manulife Financial Corp. | 448,053 | 8,221,764 | ||||||
Maple Leaf Foods Inc. | 11,229 | 217,269 | ||||||
Metro Inc. | 17,730 | 975,248 | ||||||
North West Co. Inc. (The) | 9,062 | 253,387 | ||||||
Open Text Corp. | 32,702 | 1,261,380 | ||||||
Parkland Corp. | 29,156 | 698,967 | ||||||
Power Corp. of Canada | 141,052 | 3,604,836 | ||||||
Premium Brands Holdings Corp. | 5,516 | 408,098 | ||||||
Quebecor Inc., Class B | 27,383 | 676,926 | ||||||
Ritchie Bros Auctioneers Inc. | 8,865 | 498,775 | ||||||
Royal Bank of Canada | 149,475 | 14,294,964 | ||||||
Saputo Inc. | 23,443 | 606,587 | ||||||
Stantec Inc. | 4,728 | 276,403 | ||||||
Stella-Jones Inc. | 3,743 | 143,433 | ||||||
Sun Life Financial Inc. | 117,018 | 5,466,901 | ||||||
TFI International Inc. | 3,546 | 423,132 | ||||||
TMX Group Ltd. | 6,501 | 656,594 | ||||||
Toromont Industries Ltd. | 5,319 | 436,579 | ||||||
Toronto-Dominion Bank (The) | 230,293 | 13,793,724 | ||||||
Waste Connections Inc. | 8,274 | 1,151,565 | ||||||
Wheaton Precious Metals Corp. | 31,914 | 1,537,020 | ||||||
|
| |||||||
| 115,318,503 | ||||||||
| China — 6.1% | ||||||||
Bank of China Ltd., Class A | 2,068,500 | 1,017,026 | ||||||
Bosideng International Holdings Ltd. | 788,000 | 439,714 | ||||||
China Coal Energy Co. Ltd. | 78,800 | 90,517 | ||||||
China Coal Energy Co. Ltd., Class H | 591,000 | 448,500 | ||||||
China Construction Bank Corp., Class A | 236,400 | 204,337 | ||||||
China Foods Ltd. | 394,000 | 146,903 | ||||||
China Medical System Holdings Ltd. | 394,000 | 621,641 | ||||||
China Merchants Bank Co. Ltd., Class A | 354,600 | 1,765,656 | ||||||
China Merchants Bank Co. Ltd., Class H | 689,500 | 3,501,293 | ||||||
China National Nuclear Power Co. Ltd., Class A | 197,000 | 183,356 | ||||||
China Railway Group Ltd., Class A | 275,800 | 275,975 | ||||||
China Railway Group Ltd., Class H | 788,000 | 480,867 | ||||||
China Resources Gas Group Ltd. | 197,000 | 724,646 | ||||||
China Suntien Green Energy Corp. Ltd., Class H | 591,000 | 258,510 | ||||||
China Water Affairs Group Ltd. | 92,000 | 75,119 | ||||||
Citic Pacific Special Steel Group Co. Ltd. | 78,800 | 203,833 | ||||||
CSPC Pharmaceutical Group Ltd. | 1,064,000 | 1,043,057 | ||||||
ENN Energy Holdings Ltd. | 78,800 | 1,079,006 | ||||||
Greentown China Holdings Ltd. | 115,500 | 149,488 | ||||||
Haier Smart Home Co. Ltd., Class H | 236,400 | 740,233 | ||||||
Harbin Boshi Automation Co. Ltd. | 16,400 | 39,031 | ||||||
Hengli Petrochemical Co. Ltd., Class A | 157,600 | 371,784 | ||||||
Huaxia Bank Co. Ltd., Class A | 363,800 | 285,070 | ||||||
Industrial & Commercial Bank of China Ltd., Class A | 2,659,500 | 1,726,511 | ||||||
Industrial Bank Co. Ltd., Class A | 492,500 | 1,212,081 | ||||||
Inspur Electronic Information Industry Co. Ltd., Class A | 16,400 | 83,970 | ||||||
Jiangsu King’s Luck Brewery JSC Ltd., Class A | 19,700 | 185,854 | ||||||
Kweichow Moutai Co. Ltd., Class A | 5,200 | 1,373,390 | ||||||
Lao Feng Xiang Co. Ltd. | 19,700 | 154,840 | ||||||
Luzhou Laojiao Co. Ltd., Class A | 6,000 | 221,543 | ||||||
Metallurgical Corp. of China Ltd., Class A | 177,300 | 100,595 | ||||||
Midea Group Co. Ltd., Class A | 82,000 | 641,518 | ||||||
Ping An Insurance Group Co. of China Ltd., Class A | 177,300 | 1,174,342 | ||||||
Ping An Insurance Group Co. of China Ltd., Class H | 1,674,500 | 10,832,696 | ||||||
SCHEDULE OF INVESTMENTS | 59 |
Schedule of Investments (continued) March 31, 2023 | iShares® International Dividend Growth ETF (Percentages shown are based on Net Assets) |
| Security | Shares | Value | ||||||
| ||||||||
| China (continued) | ||||||||
Postal Savings Bank of China Co. Ltd., Class H(b) | 2,167,000 | $ | 1,285,153 | |||||
Shanghai Baosight Software Co. Ltd., Class A | 90 | 763 | ||||||
Shanghai Tunnel Engineering Co. Ltd., Class A | 118,200 | 98,036 | ||||||
Shanghai Yuyuan Tourist Mart Group Co. Ltd., Class A | 93,600 | 110,674 | ||||||
Sinoma Science & Technology Co. Ltd., Class A | 16,400 | 57,648 | ||||||
Tsingtao Brewery Co. Ltd., Class H | 38,000 | 415,348 | ||||||
Wuliangye Yibin Co. Ltd., Class A | 25,600 | 731,274 | ||||||
Xiamen Xiangyu Co. Ltd. | 35,700 | 55,857 | ||||||
Yankuang Energy Group Co. Ltd., Class A | 59,100 | 306,165 | ||||||
Yuexiu Property Co. Ltd. | 394,000 | 595,735 | ||||||
Zhengzhou Coal Mining Machinery Group Co. Ltd. | 19,700 | 40,371 | ||||||
Zhengzhou Coal Mining Machinery Group Co. Ltd., Class H | 78,800 | 79,391 | ||||||
Zhongsheng Group Holdings Ltd. | 98,500 | 485,347 | ||||||
|
| |||||||
| 36,114,664 | ||||||||
| Colombia — 0.1% | ||||||||
Grupo Argos SA | 70,920 | 138,429 | ||||||
Grupo Nutresa SA | 7,486 | 80,374 | ||||||
Interconexion Electrica SA ESP | 102,834 | 334,536 | ||||||
|
| |||||||
| 553,339 | ||||||||
| Denmark — 3.6% | ||||||||
Carlsberg AS, Class B | 11,426 | 1,772,937 | ||||||
Coloplast A/S, Class B | 14,775 | 1,945,383 | ||||||
DSV A/S | 3,940 | 763,956 | ||||||
Novo Nordisk A/S, Class B | 90,423 | 14,361,094 | ||||||
Orsted AS(b) | 19,503 | 1,662,981 | ||||||
Royal Unibrew A/S | 5,713 | 498,010 | ||||||
Scandinavian Tobacco Group A/S, Class A(b) | 17,139 | 341,216 | ||||||
|
| |||||||
| 21,345,577 | ||||||||
| Finland — 0.6% | ||||||||
Huhtamaki OYJ | 11,426 | 424,472 | ||||||
Kesko OYJ, Class A | 23,825 | 515,946 | ||||||
Kesko OYJ, Class B | 67,374 | 1,447,955 | ||||||
Olvi OYJ, Class A | 3,152 | 102,208 | ||||||
Uponor OYJ | 10,638 | 196,920 | ||||||
Valmet OYJ | 31,914 | 1,036,049 | ||||||
|
| |||||||
| 3,723,550 | ||||||||
| France — 4.3% | ||||||||
Equasens | 591 | 45,944 | ||||||
Sanofi | 154,842 | 16,797,061 | ||||||
Schneider Electric SE | 52,993 | 8,856,390 | ||||||
Thermador Groupe | 985 | 104,837 | ||||||
|
| |||||||
| 25,804,232 | ||||||||
| Germany — 5.8% | ||||||||
Adesso SE | 197 | 31,538 | ||||||
Atoss Software AG | 394 | 71,245 | ||||||
Bechtle AG | 5,516 | 264,147 | ||||||
Brenntag SE | 15,366 | 1,156,386 | ||||||
Deutsche Boerse AG | 18,321 | 3,567,283 | ||||||
E.ON SE | 527,763 | 6,583,694 | ||||||
Eckert & Ziegler Strahlen- und Medizintechnik AG | 985 | 44,522 | ||||||
Encavis AG | 9,850 | 169,210 | ||||||
Fresenius Medical Care AG & Co. KGaA | 36,642 | 1,555,242 | ||||||
Fresenius SE & Co. KGaA | 76,042 | 2,053,380 | ||||||
FUCHS PETROLUB SE | 5,910 | 202,280 | ||||||
LANXESS AG | 10,441 | 429,574 | ||||||
Nemetschek SE | 2,364 | 163,189 | ||||||
SAP SE | 94,166 | 11,890,384 | ||||||
STRATEC SE | 394 | 26,860 | ||||||
Symrise AG | 6,698 | 728,903 | ||||||
| Security | Shares | Value | ||||||
| ||||||||
| Germany (continued) | ||||||||
Vonovia SE | 291,363 | $ | 5,487,766 | |||||
|
| |||||||
| 34,425,603 | ||||||||
| Hong Kong — 2.5% | ||||||||
AIA Group Ltd. | 1,024,400 | 10,743,247 | ||||||
CK Infrastructure Holdings Ltd. | 197,000 | 1,071,852 | ||||||
Kerry Logistics Network Ltd. | 98,500 | 153,026 | ||||||
Swire Properties Ltd. | 236,400 | 608,423 | ||||||
Techtronic Industries Co. Ltd. | 197,000 | 2,134,516 | ||||||
VSTECS Holdings Ltd. | 394,000 | 230,999 | ||||||
|
| |||||||
| 14,942,063 | ||||||||
| India — 2.1% | ||||||||
Aegis Logistics Ltd. | 16,351 | 75,533 | ||||||
Asian Paints Ltd. | 14,184 | 477,883 | ||||||
Astral Ltd. | 978 | 15,951 | ||||||
Balaji Amines Ltd. | 197 | 4,671 | ||||||
Berger Paints India Ltd. | 3,743 | 26,545 | ||||||
Bharat Electronics Ltd. | 285,847 | 340,210 | ||||||
CRISIL Ltd. | 1,773 | 69,514 | ||||||
Grindwell Norton Ltd. | 1,576 | 36,093 | ||||||
Indraprastha Gas Ltd. | 33,096 | 172,974 | ||||||
Infosys Ltd. | 386,514 | 6,757,476 | ||||||
ITC Ltd. | 459,207 | 2,148,576 | ||||||
KEI Industries Ltd. | 985 | 20,426 | ||||||
Larsen & Toubro Infotech Ltd.(b) | 2,385 | 138,884 | ||||||
Mphasis Ltd. | 8,820 | 193,897 | ||||||
Persistent Systems Ltd. | 1,576 | 88,900 | ||||||
Pidilite Industries Ltd. | 3,152 | 90,416 | ||||||
Radico Khaitan Ltd. | 743 | 10,823 | ||||||
Reliance Industries Ltd. | 42,158 | 1,198,745 | ||||||
Reliance Industries Ltd., GDR(b) | 5,769 | 325,480 | ||||||
Schaeffler India Ltd. | 1,182 | 41,326 | ||||||
Tata Elxsi Ltd. | 1,182 | 86,067 | ||||||
TTK Prestige Ltd. | 1,322 | 11,271 | ||||||
UltraTech Cement Ltd. | 2,664 | 247,548 | ||||||
Vinati Organics Ltd. | 164 | 3,614 | ||||||
ZF Commercial Vehicle Control Systems India Ltd. | 199 | 25,200 | ||||||
|
| |||||||
| 12,608,023 | ||||||||
| Indonesia — 0.5% | ||||||||
Bank Central Asia Tbk PT | 5,003,800 | 2,927,444 | ||||||
Bank Pembangunan Daerah Jawa Timur Tbk PT | 847,100 | 41,561 | ||||||
|
| |||||||
| 2,969,005 | ||||||||
| Ireland — 1.2% | ||||||||
CRH PLC | 91,408 | 4,617,957 | ||||||
Kerry Group PLC, Class A | 7,880 | 785,835 | ||||||
Smurfit Kappa Group PLC | 45,704 | 1,657,688 | ||||||
|
| |||||||
| 7,061,480 | ||||||||
| Italy — 0.9% | ||||||||
A2A SpA | 516,731 | 824,605 | ||||||
ACEA SpA | 12,608 | 172,394 | ||||||
Buzzi Unicem SpA | 8,668 | 210,385 | ||||||
DiaSorin SpA | 985 | 103,801 | ||||||
Interpump Group SpA | 2,758 | 154,664 | ||||||
Iren SpA | 158,979 | 304,921 | ||||||
Italgas SpA | 124,504 | 759,391 | ||||||
Recordati Industria Chimica e Farmaceutica SpA | 13,987 | 591,641 | ||||||
Reply SpA | 985 | 123,689 | ||||||
Terna - Rete Elettrica Nazionale | 282,892 | 2,321,804 | ||||||
|
| |||||||
| 5,567,295 | ||||||||
| 60 | 2 0 2 3 I SHARES ANNUAL REPORT TO SHAREHOLDERS |
Schedule of Investments (continued) March 31, 2023 | iShares® International Dividend Growth ETF (Percentages shown are based on Net Assets) |
| Security | Shares | Value | ||||||
| ||||||||
| Japan — 18.9% | ||||||||
Aeon Mall Co. Ltd. | 19,700 | $ | 258,572 | |||||
AGC Inc. | 42,800 | 1,595,624 | ||||||
Aica Kogyo Co. Ltd. | 19,700 | 452,693 | ||||||
Air Water Inc. | 39,800 | 500,136 | ||||||
Alfresa Holdings Corp. | 39,400 | 504,822 | ||||||
Astellas Pharma Inc. | 256,100 | 3,638,493 | ||||||
Chiba Bank Ltd. (The) | 98,500 | 635,745 | ||||||
COMSYS Holdings Corp. | 19,700 | 363,843 | ||||||
DCM Holdings Co. Ltd. | 39,400 | 343,338 | ||||||
Denka Co. Ltd. | 19,700 | 407,688 | ||||||
Elecom Co. Ltd. | 19,700 | 187,370 | ||||||
EXEO Group Inc. | 19,700 | 356,586 | ||||||
FUJIFILM Holdings Corp. | 29,400 | 1,492,431 | ||||||
Fujitec Co. Ltd. | 19,700 | 489,995 | ||||||
Hisamitsu Pharmaceutical Co. Inc. | 19,700 | 563,453 | ||||||
Hulic Co. Ltd. | 118,200 | 972,225 | ||||||
Itochu Techno-Solutions Corp. | 19,700 | 485,407 | ||||||
Kandenko Co. Ltd. | 19,700 | 139,166 | ||||||
Kao Corp. | 78,800 | 3,067,311 | ||||||
KDDI Corp. | 256,100 | 7,897,547 | ||||||
Kobayashi Pharmaceutical Co. Ltd. | 500 | 30,580 | ||||||
Kokuyo Co. Ltd. | 19,700 | 279,696 | ||||||
Kubota Corp. | 118,200 | 1,792,069 | ||||||
Kurita Water Industries Ltd. | 2,600 | 119,098 | ||||||
Kyowa Kirin Co. Ltd. | 19,700 | 430,081 | ||||||
Lasertec Corp. | 700 | 124,375 | ||||||
M3 Inc. | 19,700 | 495,830 | ||||||
MCJ Co. Ltd. | 19,700 | 138,691 | ||||||
Medipal Holdings Corp. | 19,700 | 268,480 | ||||||
Mitsubishi Corp. | 216,700 | 7,787,429 | ||||||
Mitsubishi UFJ Financial Group Inc. | 1,930,600 | 12,372,574 | ||||||
MonotaRO Co. Ltd. | 19,700 | 248,134 | ||||||
Morinaga & Co. Ltd./Japan | 1,500 | 42,484 | ||||||
Murata Manufacturing Co. Ltd. | 59,100 | 3,601,863 | ||||||
NEC Networks & System Integration Corp. | 19,700 | 240,651 | ||||||
Nichias Corp. | 19,700 | 397,036 | ||||||
Nippon Gas Co. Ltd. | 19,700 | 285,895 | ||||||
Nippon Sanso Holdings Corp. | 19,900 | 359,525 | ||||||
Nippon Telegraph & Telephone Corp. | 180,800 | 5,402,795 | ||||||
Nissan Chemical Corp. | 19,700 | 894,715 | ||||||
Nisshin Seifun Group Inc. | 39,400 | 461,094 | ||||||
Nitori Holdings Co. Ltd. | 2,800 | 338,133 | ||||||
Nitto Denko Corp. | 21,100 | 1,365,619 | ||||||
Nomura Real Estate Holdings Inc. | 20,700 | 458,373 | ||||||
Nomura Research Institute Ltd. | 40,800 | 954,218 | ||||||
NSD Co. Ltd. | 19,700 | 355,349 | ||||||
NTT Data Corp. | 39,400 | 517,974 | ||||||
Obic Co. Ltd. | 2,100 | 332,626 | ||||||
Open House Group Co. Ltd. | 4,500 | 168,750 | ||||||
PALTAC Corp. | 200 | 7,599 | ||||||
Pan Pacific International Holdings Corp. | 19,700 | 381,121 | ||||||
Raito Kogyo Co. Ltd. | 19,700 | 290,060 | ||||||
Sangetsu Corp. | 19,700 | 332,306 | ||||||
SBI Holdings Inc. | 74,400 | 1,477,571 | ||||||
SCSK Corp. | 19,900 | 291,374 | ||||||
Sekisui House Ltd. | 128,000 | 2,608,798 | ||||||
Seven & i Holdings Co. Ltd. | 59,100 | 2,669,790 | ||||||
Shin-Etsu Chemical Co. Ltd. | 239,000 | 7,758,184 | ||||||
Shionogi & Co. Ltd. | 21,100 | 951,726 | ||||||
Ship Healthcare Holdings Inc. | 200 | 3,684 | ||||||
| Security | Shares | Value | ||||||
| ||||||||
| Japan (continued) | ||||||||
Sohgo Security Services Co. Ltd. | 4,200 | $ | 113,119 | |||||
Sompo Holdings Inc. | 67,200 | 2,662,807 | ||||||
Sony Group Corp. | 39,400 | 3,588,685 | ||||||
Sumitomo Mitsui Financial Group Inc. | 236,400 | 9,460,153 | ||||||
Sumitomo Realty & Development Co. Ltd. | 39,400 | 889,709 | ||||||
Sundrug Co. Ltd. | 19,700 | 540,471 | ||||||
TDK Corp. | 39,400 | 1,414,307 | ||||||
TechnoPro Holdings Inc. | 19,700 | 546,399 | ||||||
Terumo Corp. | 39,400 | 1,065,585 | ||||||
TIS Inc. | 19,700 | 520,979 | ||||||
Tokio Marine Holdings Inc. | 328,500 | 6,321,963 | ||||||
Tokyo Tatemono Co. Ltd. | 39,400 | 481,043 | ||||||
Unicharm Corp. | 20,700 | 850,888 | ||||||
USS Co. Ltd. | 39,400 | 683,573 | ||||||
Valor Holdings Co. Ltd. | 19,900 | 289,690 | ||||||
Yakult Honsha Co. Ltd. | 8,200 | 595,815 | ||||||
Yamaguchi Financial Group Inc. | 39,400 | 241,408 | ||||||
Yamato Holdings Co. Ltd. | 39,800 | 683,178 | ||||||
|
| |||||||
| 112,338,567 | ||||||||
| Malaysia — 0.0% | ||||||||
Allianz Malaysia Bhd | 19,900 | 62,004 | ||||||
|
| |||||||
| Mexico — 0.7% | ||||||||
America Movil SAB de CV(a) | 2,150,100 | 2,258,679 | ||||||
Arca Continental SAB de CV | 78,800 | 715,585 | ||||||
Bolsa Mexicana de Valores SAB de CV | 137,900 | 295,467 | ||||||
Grupo Bimbo SAB de CV, Series A | 98,500 | 495,670 | ||||||
Grupo Comercial Chedraui SA de CV | 19,700 | 113,149 | ||||||
Orbia Advance Corp. SAB de CV | 256,100 | 556,826 | ||||||
|
| |||||||
| 4,435,376 | ||||||||
| Netherlands — 1.1% | ||||||||
IMCD NV | 3,349 | 547,614 | ||||||
NN Group NV | 100,076 | 3,633,749 | ||||||
Wolters Kluwer NV | 18,912 | 2,387,384 | ||||||
|
| |||||||
| 6,568,747 | ||||||||
| New Zealand — 0.2% | ||||||||
EBOS Group Ltd. | 17,730 | 516,652 | ||||||
Mainfreight Ltd. | 10,047 | 440,865 | ||||||
Summerset Group Holdings Ltd. | 31,717 | 174,830 | ||||||
|
| |||||||
| 1,132,347 | ||||||||
| Norway — 0.1% | ||||||||
Borregaard ASA | 7,683 | 128,495 | ||||||
Medistim ASA | 1,379 | 39,514 | ||||||
TOMRA Systems ASA | 12,411 | 209,527 | ||||||
|
| |||||||
| 377,536 | ||||||||
| Philippines — 0.1% | ||||||||
International Container Terminal Services Inc. | 116,230 | 456,364 | ||||||
|
| |||||||
| Poland — 0.0% | ||||||||
Neuca SA | 197 | 27,977 | ||||||
|
| |||||||
| Portugal — 0.0% | ||||||||
Sonae SGPS SA | 188,529 | 205,728 | ||||||
|
| |||||||
| Saudi Arabia — 0.1% | ||||||||
Mouwasat Medical Services Co. | 3,349 | 210,322 | ||||||
United Electronics Co. | 10,943 | 226,987 | ||||||
|
| |||||||
| 437,309 | ||||||||
| South Africa — 0.0% | ||||||||
PSG Konsult Ltd. | 203,501 | 138,067 | ||||||
|
| |||||||
SCHEDULE OF INVESTMENTS | 61 |
Schedule of Investments (continued) March 31, 2023 | iShares® International Dividend Growth ETF (Percentages shown are based on Net Assets) |
| Security | Shares | Value | ||||||
| ||||||||
| South Korea — 0.7% | ||||||||
AfreecaTV Co. Ltd. | 591 | $ | 38,843 | |||||
Cheil Worldwide Inc. | 18,912 | 270,956 | ||||||
CS Wind Corp. | 1,515 | 85,099 | ||||||
Daesang Corp. | 2,866 | 43,258 | ||||||
Hyundai Home Shopping Network Corp. | 743 | 27,641 | ||||||
KIWOOM Securities Co. Ltd. | 3,546 | 276,600 | ||||||
Kolmar BNH Co. Ltd. | 2,364 | 43,205 | ||||||
Korea Zinc Co. Ltd. | 2,364 | 1,005,797 | ||||||
Kumho Petrochemical Co. Ltd. | 8,471 | 937,008 | ||||||
LEENO Industrial Inc. | 1,182 | 131,084 | ||||||
NAVER Corp. | 3,546 | 555,626 | ||||||
NICE Information Service Co. Ltd. | 5,516 | 52,410 | ||||||
Park Systems Corp. | 357 | 41,945 | ||||||
Samsung Electro-Mechanics Co. Ltd. | 4,180 | 493,538 | ||||||
SK Gas Ltd. | 197 | 18,012 | ||||||
Youngone Corp. | 3,546 | 124,775 | ||||||
Youngone Holdings Co. Ltd. | 743 | 36,717 | ||||||
|
| |||||||
| 4,182,514 | ||||||||
| Spain — 2.6% | ||||||||
Iberdrola SA | 1,204,261 | 15,002,440 | ||||||
Vidrala SA | 2,049 | 224,410 | ||||||
Viscofan SA | 5,516 | 395,031 | ||||||
|
| |||||||
| 15,621,881 | ||||||||
| Sweden — 0.7% | ||||||||
AAK AB | 11,426 | 206,878 | ||||||
Assa Abloy AB, Class B | 79,391 | 1,901,611 | ||||||
Atrium Ljungberg AB, Class B | 7,562 | 123,529 | ||||||
Bravida Holding AB(b) | 27,580 | 311,978 | ||||||
Castellum AB(a) | 83,134 | 967,163 | ||||||
Catena AB | 3,349 | 124,638 | ||||||
Heba Fastighets AB | 9,062 | 24,928 | ||||||
Lifco AB, Class B | 7,880 | 169,913 | ||||||
NP3 Fastigheter AB | 2,758 | 49,763 | ||||||
Platzer Fastigheter Holding AB, Class B | 8,865 | 68,793 | ||||||
|
| |||||||
| 3,949,194 | ||||||||
| Switzerland — 12.1% | ||||||||
ALSO Holding AG, Registered | 788 | 160,412 | ||||||
Chocoladefabriken Lindt & Spruengli AG, Participation Certificates, NVS | 57 | 673,206 | ||||||
Chocoladefabriken Lindt & Spruengli AG, Registered | 6 | 710,617 | ||||||
DKSH Holding AG | 4,925 | 397,055 | ||||||
Geberit AG, Registered | 4,531 | 2,530,324 | ||||||
Givaudan SA, Registered | 985 | 3,205,966 | ||||||
Logitech International SA, Registered | 16,548 | 965,849 | ||||||
Nestle SA, Registered | 154,251 | 18,807,902 | ||||||
Novartis AG, Registered | 208,820 | 19,173,543 | ||||||
Partners Group Holding AG | 4,137 | 3,895,906 | ||||||
Roche Holding AG, Bearer | 4,334 | 1,302,327 | ||||||
Roche Holding AG, NVS | 58,903 | 16,831,088 | ||||||
Siegfried Holding AG, Registered | 86 | 63,274 | ||||||
Sika AG, Registered | 8,668 | 2,431,334 | ||||||
Tecan Group AG, Registered | 414 | 181,348 | ||||||
Temenos AG, Registered | 4,531 | 315,295 | ||||||
VZ Holding AG | 1,773 | 145,619 | ||||||
|
| |||||||
| 71,791,065 | ||||||||
| Taiwan — 0.4% | ||||||||
Advantech Co. Ltd. | 42,000 | 513,821 | ||||||
Lotes Co. Ltd. | 6,155 | 186,031 | ||||||
Parade Technologies Ltd. | 13,000 | 450,084 | ||||||
| Security | Shares | Value | ||||||
| ||||||||
| Taiwan (continued) | ||||||||
Silergy Corp. | 9,000 | $ | 142,889 | |||||
Sinbon Electronics Co. Ltd. | 22,000 | 247,603 | ||||||
Unimicron Technology Corp. | 197,000 | 960,822 | ||||||
Voltronic Power Technology Corp. | 2,000 | 113,887 | ||||||
|
| |||||||
| 2,615,137 | ||||||||
| Turkey — 0.0% | ||||||||
Aselsan Elektronik Sanayi Ve Ticaret AS | 9,958 | 26,992 | ||||||
Otokar Otomotiv Ve Savunma Sanayi AS | 776 | 37,126 | ||||||
Tofas Turk Otomobil Fabrikasi AS | 20,488 | 199,895 | ||||||
|
| |||||||
| 264,013 | ||||||||
| United Kingdom — 11.8% | ||||||||
Advanced Medical Solutions Group PLC | 29,944 | 82,189 | ||||||
Ashtead Group PLC | 27,383 | 1,681,449 | ||||||
BAE Systems PLC | 452,509 | 5,473,604 | ||||||
British American Tobacco PLC | 427,490 | 14,985,392 | ||||||
Bunzl PLC | 32,899 | 1,242,680 | ||||||
Chemring Group PLC | 14,775 | 50,999 | ||||||
Clarkson PLC | 3,940 | 150,270 | ||||||
Coca-Cola HBC AG, Class DI(c) | 27,186 | 744,221 | ||||||
Craneware PLC | 2,561 | 36,331 | ||||||
Cranswick PLC | 6,107 | 227,321 | ||||||
Croda International PLC | 11,229 | 902,514 | ||||||
DCC PLC | 19,503 | 1,136,854 | ||||||
Dechra Pharmaceuticals PLC | 9,259 | 303,135 | ||||||
Diageo PLC | 251,569 | 11,227,430 | ||||||
Diploma PLC | 11,820 | 411,545 | ||||||
Drax Group PLC | 62,055 | 466,114 | ||||||
EMIS Group PLC | 5,319 | 98,423 | ||||||
Ferguson PLC | 25,216 | 3,333,849 | ||||||
Games Workshop Group PLC | 6,501 | 774,339 | ||||||
Gamma Communications PLC | 5,713 | 76,625 | ||||||
GlobalData PLC | 1,379 | 20,754 | ||||||
Halma PLC | 17,730 | 489,463 | ||||||
Hargreaves Lansdown PLC | 83,134 | 823,564 | ||||||
Hilton Food Group PLC | 15,760 | 134,914 | ||||||
Impax Asset Management Group PLC | 18,124 | 179,564 | ||||||
Learning Technologies Group PLC | 28,762 | 45,770 | ||||||
Liontrust Asset Management PLC | 23,246 | 294,029 | ||||||
London Stock Exchange Group PLC | 23,443 | 2,277,011 | ||||||
National Grid PLC | 955,450 | 12,924,370 | ||||||
RELX PLC | 201,531 | 6,526,964 | ||||||
RWS Holdings PLC | 52,796 | 194,736 | ||||||
Sage Group PLC (The) | 127,853 | 1,226,932 | ||||||
Sirius Real Estate Ltd. | 310,472 | 293,759 | ||||||
Softcat PLC | 11,032 | 177,215 | ||||||
Spectris PLC | 11,820 | 536,289 | ||||||
Spirax-Sarco Engineering PLC | 4,531 | 665,254 | ||||||
|
| |||||||
| 70,215,872 | ||||||||
|
| |||||||
Total Common Stocks — 99.1% | 589,928,390 | |||||||
|
| |||||||
Preferred Stocks | ||||||||
| Germany — 0.0% | ||||||||
Fuchs Petrolub SE, Preference Shares, NVS | 9,259 | 377,530 | ||||||
|
| |||||||
| 62 | 2 0 2 3 I SHARES ANNUAL REPORT TO SHAREHOLDERS |
Schedule of Investments (continued) March 31, 2023 | iShares® International Dividend Growth ETF (Percentages shown are based on Net Assets) |
| Security | Shares | Value | ||||||
| ||||||||
| South Korea — 0.0% | ||||||||
Samsung Electro-Mechanics Co. Ltd., Preference Shares | 357 | $ | 20,245 | |||||
|
| |||||||
Total Preferred Stocks — 0.0% | 397,775 | |||||||
|
| |||||||
Rights | ||||||||
| Brazil — 0.0% | ||||||||
Localiza Rent a Car SA, Rights, | ||||||||
(Expires 05/18/23, Strike Price BRL 41.15) | 379 | 982 | ||||||
|
| |||||||
Total Rights — 0.0% | 982 | |||||||
|
| |||||||
Total Long-Term Investments — 99.1% | 590,327,147 | |||||||
|
| |||||||
Short-Term Securities | ||||||||
| Money Market Funds — 0.7% | ||||||||
BlackRock Cash Funds: Institutional, SL Agency Shares, 5.01%(d)(e)(f) | 2,608,428 | 2,609,211 | ||||||
| Security | Shares | Value | ||||||
| ||||||||
| Money Market Funds (continued) | ||||||||
BlackRock Cash Funds: Treasury, SL Agency Shares, 4.73%(d)(e) | 1,310,000 | $ | 1,310,000 | |||||
|
| |||||||
Total Short-Term Securities — 0.7% | 3,919,211 | |||||||
|
| |||||||
Total Investments — 99.8% | 594,246,358 | |||||||
Other Assets Less Liabilities — 0.2% | 1,173,313 | |||||||
|
| |||||||
Net Assets — 100.0% | $ | 595,419,671 | ||||||
|
| |||||||
| (a) | All or a portion of this security is on loan. |
| (b) | Security exempt from registration pursuant to Rule 144A under the Securities Act of 1933, as amended. These securities may be resold in transactions exempt from registration to qualified institutional investors. |
| (c) | Non-income producing security. |
| (d) | Affiliate of the Fund. |
| (e) | Annualized 7-day yield as of period end. |
| (f) | All or a portion of this security was purchased with the cash collateral from loaned securities. |
Affiliates
Investments in issuers considered to be affiliate(s) of the Fund during the year ended March 31, 2023 for purposes of Section 2(a)(3) of the Investment Company Act of 1940, as amended, were as follows:
| ||||||||||||||||||||||||||||||||||||
| Affiliated Issuer | Value at 03/31/22 | Purchases at Cost | Proceeds from Sale | Net Realized Gain (Loss) | Change in Unrealized Appreciation (Depreciation) | Value at 03/31/23 | Shares Held at 03/31/23 | Income | Capital Gain Distributions from Funds | |||||||||||||||||||||||||||
| ||||||||||||||||||||||||||||||||||||
BlackRock Cash Funds: Institutional, SL Agency Shares | $ | — | $ | 2,609,054 | (a) | $ | — | $ | 584 | $ | (427 | ) | $ | 2,609,211 | 2,608,428 | $ | 5,335 | (b) | $ | — | ||||||||||||||||
BlackRock Cash Funds: Treasury, SL Agency Shares | 370,000 | 940,000 | (a) | — | — | — | 1,310,000 | 1,310,000 | 19,818 | 1 | ||||||||||||||||||||||||||
|
|
|
|
|
|
|
|
|
| |||||||||||||||||||||||||||
| $ | 584 | $ | (427 | ) | $ | 3,919,211 | $ | 25,153 | $ | 1 | ||||||||||||||||||||||||||
|
|
|
|
|
|
|
|
|
| |||||||||||||||||||||||||||
| (a) | Represents net amount purchased (sold). |
| (b) | All or a portion represents securities lending income earned from the reinvestment of cash collateral from loaned securities, net of fees and collateral investment expenses, and other payments to and from borrowers of securities. |
Derivative Financial Instruments Outstanding as of Period End
Futures Contracts
| ||||||||||||||||
| Description | Number of Contracts | Expiration Date | Notional Amount (000) | Value/ Unrealized Appreciation (Depreciation) | ||||||||||||
| ||||||||||||||||
| Long Contracts | ||||||||||||||||
S&P/TSX 60 Index | 3 | 06/15/23 | $ | 537 | $ | 6,354 | ||||||||||
MSCI EAFE Index | 41 | 06/16/23 | 4,298 | 135,352 | ||||||||||||
|
| |||||||||||||||
| $ | 141,706 | |||||||||||||||
|
| |||||||||||||||
SCHEDULE OF INVESTMENTS | 63 |
Schedule of Investments (continued) March 31, 2023 | iShares® International Dividend Growth ETF |
Derivative Financial Instruments Categorized by Risk Exposure
As of period end, the fair values of derivative financial instruments located in the Statements of Assets and Liabilities were as follows:
| ||||||||||||||||||||||||||||
Commodity Contracts | Credit Contracts | Equity Contracts |
Foreign Currency Exchange Contracts | Interest Rate Contracts | Other Contracts | Total | ||||||||||||||||||||||
| ||||||||||||||||||||||||||||
Assets — Derivative Financial Instruments | ||||||||||||||||||||||||||||
Futures contracts | ||||||||||||||||||||||||||||
Unrealized appreciation on futures contracts(a) | $ | — | $ | — | $ | 141,706 | $ | — | $ | — | $ | — | $ | 141,706 | ||||||||||||||
|
|
|
|
|
|
|
|
|
|
|
|
|
| |||||||||||||||
| (a) | Net cumulative unrealized appreciation (depreciation) on futures contracts are reported in the Schedule of Investments. In the Statements of Assets and Liabilities, only current day’s variation margin is reported in receivables or payables and the net cumulative unrealized appreciation (depreciation) is included in accumulated earnings (loss). |
For the period ended March 31, 2023, the effect of derivative financial instruments in the Statements of Operations was as follows:
| ||||||||||||||||||||||||||||
Commodity Contracts | Credit Contracts | Equity Contracts |
Foreign Currency Exchange Contracts | Interest Rate Contracts | Other Contracts | Total | ||||||||||||||||||||||
| ||||||||||||||||||||||||||||
Net Realized Gain (Loss) from | ||||||||||||||||||||||||||||
Futures contracts | $ | — | $ | — | $ | (31,130 | ) | $ | — | $ | — | $ | — | $ | (31,130 | ) | ||||||||||||
|
|
|
|
|
|
|
|
|
|
|
|
|
| |||||||||||||||
Net Change in Unrealized Appreciation (Depreciation) on | ||||||||||||||||||||||||||||
Futures contracts | $ | — | $ | — | $ | 103,863 | $ | — | $ | — | $ | — | $ | 103,863 | ||||||||||||||
|
|
|
|
|
|
|
|
|
|
|
|
|
| |||||||||||||||
Average Quarterly Balances of Outstanding Derivative Financial Instruments
| ||||
Futures contracts | ||||
Average notional value of contracts — long | $ | 2,727,191 | ||
| ||||
For more information about the Fund’s investment risks regarding derivative financial instruments, refer to the Notes to Financial Statements.
Fair Value Hierarchy as of Period End
Various inputs are used in determining the fair value of financial instruments. For a description of the input levels and information about the Fund’s policy regarding valuation of financial instruments, refer to the Notes to Financial Statements.
The following table summarizes the Fund’s financial instruments categorized in the fair value hierarchy. The breakdown of the Fund’s financial instruments into major categories is disclosed in the Schedule of Investments above.
| ||||||||||||||||
| Level 1 | Level 2 | Level 3 | Total | |||||||||||||
| ||||||||||||||||
Assets | ||||||||||||||||
Investments | ||||||||||||||||
Long-Term Investments | ||||||||||||||||
Common Stocks | $ | 122,318,632 | $ | 467,609,758 | $ | — | $ | 589,928,390 | ||||||||
Preferred Stocks | — | 397,775 | — | 397,775 | ||||||||||||
Rights | 982 | — | — | 982 | ||||||||||||
Short-Term Securities | ||||||||||||||||
Money Market Funds | 3,919,211 | — | — | 3,919,211 | ||||||||||||
|
|
|
|
|
|
|
| |||||||||
| $ | 126,238,825 | $ | 468,007,533 | $ | — | $ | 594,246,358 | |||||||||
|
|
|
|
|
|
|
| |||||||||
Derivative Financial Instruments(a) | ||||||||||||||||
Assets | ||||||||||||||||
Equity Contracts | $ | 141,706 | $ | — | $ | — | $ | 141,706 | ||||||||
|
|
|
|
|
|
|
| |||||||||
| (a) | Derivative financial instruments are futures contracts. Futures contracts are valued at the unrealized appreciation (depreciation) on the instrument. |
See notes to financial statements.
| 64 | 2 0 2 3 I SHARES ANNUAL REPORT TO SHAREHOLDERS |
Schedule of Investments March 31, 2023 | iShares® Latin America 40 ETF (Percentages shown are based on Net Assets) |
| Security | Shares | Value | ||||||
| ||||||||
Common Stocks | ||||||||
| Brazil — 41.0% | ||||||||
Ambev SA, ADR | 10,721,873 | $ | 30,235,681 | |||||
B3 SA - Brasil, Bolsa, Balcao | 14,828,073 | 30,279,584 | ||||||
Banco do Brasil SA | 3,483,244 | 26,877,975 | ||||||
CCR SA | 2,706,463 | 6,834,975 | ||||||
Centrais Eletricas Brasileiras SA | 3,095,728 | 20,326,890 | ||||||
Localiza Rent a Car SA | 1,842,467 | 19,411,800 | ||||||
Lojas Renner SA | 2,380,233 | 7,781,563 | ||||||
Magazine Luiza SA(a) | 6,861,396 | 4,480,901 | ||||||
Natura & Co. Holding SA | 2,042,340 | 5,318,961 | ||||||
NU Holdings Ltd.(a) | 5,556,541 | 26,449,135 | ||||||
Petroleo Brasileiro SA, ADR | 4,523,580 | 47,180,939 | ||||||
Rede D’Or Sao Luiz SA(b) | 2,116,263 | 8,868,476 | ||||||
Vale SA, ADR | 9,411,049 | 148,506,353 | ||||||
WEG SA | 3,571,626 | 28,574,699 | ||||||
|
| |||||||
| 411,127,932 | ||||||||
| Chile — 7.2% | ||||||||
Banco de Chile | 105,606,185 | 10,256,510 | ||||||
Banco Santander Chile, ADR | 378,545 | 6,749,457 | ||||||
Cencosud SA | 3,139,030 | 6,065,682 | ||||||
Empresas CMPC SA | 2,662,693 | 4,449,825 | ||||||
Empresas COPEC SA | 886,635 | 6,257,498 | ||||||
Enel Americas SA | 47,049,539 | 6,197,193 | ||||||
Falabella SA | 1,821,715 | 4,189,378 | ||||||
Sociedad Quimica y Minera de Chile SA, ADR(c) | 347,226 | 28,146,140 | ||||||
|
| |||||||
| 72,311,683 | ||||||||
| Colombia — 1.7% | ||||||||
Bancolombia SA, ADR | 275,246 | 6,916,932 | ||||||
Ecopetrol SA, ADR | 597,170 | 6,306,115 | ||||||
Interconexion Electrica SA ESP | 1,072,510 | 3,489,055 | ||||||
|
| |||||||
| 16,712,102 | ||||||||
| Mexico — 28.1% | ||||||||
America Movil SAB de CV | 48,039,746 | 50,465,727 | ||||||
Cemex SAB de CV, NVS(a) | 36,802,650 | 20,198,569 | ||||||
Fibra Uno Administracion SA de CV | 6,987,006 | 9,759,320 | ||||||
Fomento Economico Mexicano SAB de CV | 4,466,173 | 42,579,829 | ||||||
Grupo Bimbo SAB de CV, Series A | 3,340,637 | 16,810,708 | ||||||
Grupo Financiero Banorte SAB de CV, Class O | 6,028,899 | 50,820,741 | ||||||
Grupo Mexico SAB de CV, Series B | 7,570,851 | 35,850,206 | ||||||
Grupo Televisa SAB, CPO | 6,162,608 | 6,521,694 | ||||||
Wal-Mart de Mexico SAB de CV | 12,311,280 | 49,210,960 | ||||||
|
| |||||||
| 282,217,754 | ||||||||
| Peru — 3.7% | ||||||||
Credicorp Ltd. | 165,214 | 21,872,681 | ||||||
Southern Copper Corp. | 206,754 | 15,764,993 | ||||||
|
| |||||||
| 37,637,674 | ||||||||
|
| |||||||
Total Common Stocks — 81.7% | 820,007,145 | |||||||
|
| |||||||
| Security | Shares | Value | ||||||
| ||||||||
Preferred Stocks | ||||||||
| Brazil — 17.6% | ||||||||
Banco Bradesco SA, Preference Shares, ADR | 12,934,373 | $ | 33,888,057 | |||||
Gerdau SA, Preference Shares, ADR | 2,631,582 | 12,973,701 | ||||||
Itau Unibanco Holding SA, Preference Shares, ADR | 11,781,365 | 57,375,247 | ||||||
Itausa SA, Preference Shares, NVS | 12,539,474 | 20,336,489 | ||||||
Petroleo Brasileiro SA, Preference Shares, ADR | 5,584,142 | 51,820,838 | ||||||
|
| |||||||
| 176,394,332 | ||||||||
|
| |||||||
Total Preferred Stocks — 17.6% | 176,394,332 | |||||||
|
| |||||||
Rights | ||||||||
| Brazil — 0.0% | ||||||||
Localiza Rent a Car SA, Rights, | 8,243 | 21,354 | ||||||
|
| |||||||
Total Rights — 0.0% | 21,354 | |||||||
|
| |||||||
Total Long-Term Investments — 99.3% | 996,422,831 | |||||||
|
| |||||||
Short-Term Securities | ||||||||
| Money Market Funds — 3.5% | ||||||||
BlackRock Cash Funds: Institutional, SL Agency Shares, 5.01%(d)(e)(f) | 28,490,296 | 28,498,843 | ||||||
BlackRock Cash Funds: Treasury, SL Agency Shares, 4.73%(d)(e) | 6,620,000 | 6,620,000 | ||||||
|
| |||||||
Total Short-Term Securities — 3.5% | 35,118,843 | |||||||
|
| |||||||
Total Investments — 102.8% | 1,031,541,674 | |||||||
Liabilities in Excess of Other Assets — (2.8)% |
| (28,408,667 | ) | |||||
|
| |||||||
Net Assets — 100.0% | $ | 1,003,133,007 | ||||||
|
| |||||||
| (a) | Non-income producing security. |
| (b) | Security exempt from registration pursuant to Rule 144A under the Securities Act of 1933, as amended. These securities may be resold in transactions exempt from registration to qualified institutional investors. |
| (c) | All or a portion of this security is on loan. |
| (d) | Affiliate of the Fund. |
| (e) | Annualized 7-day yield as of period end. |
| (f) | All or a portion of this security was purchased with the cash collateral from loaned securities. |
SCHEDULE OF INVESTMENTS | 65 |
Schedule of Investments (continued) March 31, 2023 | iShares® Latin America 40 ETF |
Affiliates
Investments in issuers considered to be affiliate(s) of the Fund during the year ended March 31, 2023 for purposes of Section 2(a)(3) of the Investment Company Act of 1940, as amended, were as follows:
| ||||||||||||||||||||||||||||||||||||||||||
| Affiliated Issuer | Value at 03/31/22 | Purchases at Cost | Proceeds from Sale | Net Realized Gain (Loss) | Change in Unrealized Appreciation (Depreciation) | Value at 03/31/23 | Shares Held at 03/31/23 | Income |
Capital Gain Distributions from Underlying Funds | |||||||||||||||||||||||||||||||||
| ||||||||||||||||||||||||||||||||||||||||||
| BlackRock Cash Funds: Institutional, SL Agency Shares | $ | 23,454,989 | $ | 5,060,743 | (a) | $ | — | $ | (3,469 | ) | $ | (13,420 | ) | $ | 28,498,843 | 28,490,296 | $ | 104,937 | (b) | $ | — | ||||||||||||||||||||
BlackRock Cash Funds: Treasury, SL Agency Shares | 3,600,000 | 3,020,000 | (a) | — | — | — | 6,620,000 | 6,620,000 | 98,321 | — | ||||||||||||||||||||||||||||||||
|
|
|
|
|
|
|
|
|
| |||||||||||||||||||||||||||||||||
| $ | (3,469 | ) | $ | (13,420 | ) | $ | 35,118,843 | $ | 203,258 | $ | — | |||||||||||||||||||||||||||||||
|
|
|
|
|
|
|
|
|
| |||||||||||||||||||||||||||||||||
| (a) | Represents net amount purchased (sold). |
| (b) | All or a portion represents securities lending income earned from the reinvestment of cash collateral from loaned securities, net of fees and collateral investment expenses, and other payments to and from borrowers of securities. |
Derivative Financial Instruments Outstanding as of Period End
Futures Contracts
| ||||||||||||||||
| Description | Number of Contracts | Expiration Date | Notional Amount (000) |
Value/ Unrealized Appreciation (Depreciation) | ||||||||||||
| ||||||||||||||||
Long Contracts | ||||||||||||||||
Bclear MSCI Brazil Index | 81 | 06/16/23 | $ | 3,804 | $ | 82,755 | ||||||||||
Mexican BOLSA Index | 65 | 06/16/23 | 1,960 | 36,682 | ||||||||||||
|
| |||||||||||||||
| $ | 119,437 | |||||||||||||||
|
| |||||||||||||||
Derivative Financial Instruments Categorized by Risk Exposure
As of period end, the fair values of derivative financial instruments located in the Statements of Assets and Liabilities were as follows:
| ||||||||||||||||||||||||||||
Commodity Contracts | Credit Contracts | Equity Contracts |
Foreign Currency Exchange Contracts | Interest Rate Contracts | Other Contracts | Total | ||||||||||||||||||||||
| ||||||||||||||||||||||||||||
Assets — Derivative Financial Instruments | ||||||||||||||||||||||||||||
Futures contracts | ||||||||||||||||||||||||||||
Unrealized appreciation on futures contracts(a) | $ | — | $ | — | $ | 119,437 | $ | — | $ | — | $ | — | $ | 119,437 | ||||||||||||||
|
|
|
|
|
|
|
|
|
|
|
|
|
| |||||||||||||||
| (a) | Net cumulative unrealized appreciation (depreciation) on futures contracts are reported in the Schedule of Investments. In the Statements of Assets and Liabilities, only current day’s variation margin is reported in receivables or payables and the net cumulative unrealized appreciation (depreciation) is included in accumulated earnings (loss). |
For the period ended March 31, 2023, the effect of derivative financial instruments in the Statements of Operations was as follows:
| ||||||||||||||||||||||||||||
| Commodity Contracts | Credit Contracts | Equity Contracts |
Foreign | Interest Rate Contracts | Other Contracts | Total | ||||||||||||||||||||||
| ||||||||||||||||||||||||||||
Net Realized Gain (Loss) from | ||||||||||||||||||||||||||||
Futures contracts | $ | — | $ | — | $ | (5,906,611 | ) | $ | — | $ | — | $ | — | $ | (5,906,611 | ) | ||||||||||||
|
|
|
|
|
|
|
|
|
|
|
|
|
| |||||||||||||||
Net Change in Unrealized Appreciation (Depreciation) on | ||||||||||||||||||||||||||||
Futures contracts | $ | — | $ | — | $ | (510,411 | ) | $ | — | $ | — | $ | — | $ | (510,411 | ) | ||||||||||||
|
|
|
|
|
|
|
|
|
|
|
|
|
| |||||||||||||||
| 66 | 2 0 2 3 I SHARES ANNUAL REPORT TO SHAREHOLDERS |
Schedule of Investments (continued) March 31, 2023 | iShares® Latin America 40 ETF |
Average Quarterly Balances of Outstanding Derivative Financial Instruments
| ||||
Futures contracts | ||||
Average notional value of contracts — long | $ | 10,601,769 | ||
| ||||
For more information about the Fund’s investment risks regarding derivative financial instruments, refer to the Notes to Financial Statements.
Fair Value Hierarchy as of Period End
Various inputs are used in determining the fair value of financial instruments. For a description of the input levels and information about the Fund’s policy regarding valuation of financial instruments, refer to the Notes to Financial Statements.
The following table summarizes the Fund’s financial instruments categorized in the fair value hierarchy. The breakdown of the Fund’s financial instruments into major categories is disclosed in the Schedule of Investments above.
| ||||||||||||||||
| Level 1 | Level 2 | Level 3 | Total | |||||||||||||
| ||||||||||||||||
Assets | ||||||||||||||||
Investments | ||||||||||||||||
Long-Term Investments | ||||||||||||||||
Common Stocks | $ | 820,007,145 | $ | — | $ | — | $ | 820,007,145 | ||||||||
Preferred Stocks | 176,394,332 | — | — | 176,394,332 | ||||||||||||
Rights | 21,354 | — | — | 21,354 | ||||||||||||
Short-Term Securities | ||||||||||||||||
Money Market Funds | 35,118,843 | — | — | 35,118,843 | ||||||||||||
|
|
|
|
|
|
|
| |||||||||
| $ | 1,031,541,674 | $ | — | $ | — | $ | 1,031,541,674 | |||||||||
|
|
|
|
|
|
|
| |||||||||
Derivative Financial Instruments(a) | ||||||||||||||||
Assets | ||||||||||||||||
Equity Contracts | $ | 119,437 | $ | — | $ | — | $ | 119,437 | ||||||||
|
|
|
|
|
|
|
| |||||||||
| (a) | Derivative financial instruments are futures contracts. Futures contracts are valued at the unrealized appreciation (depreciation) on the instrument. |
See notes to financial statements.
SCHEDULE OF INVESTMENTS | 67 |
Statements of Assets and Liabilities March 31, 2023 |
|
iShares Asia 50 ETF | iShares Blockchain and Tech ETF | iShares Emerging Markets Infrastructure ETF | iShares Europe ETF | |||||||||||||
| ||||||||||||||||
ASSETS | ||||||||||||||||
Investments, at value — unaffiliated(a)(b) | $ | 1,668,266,891 | $ | 6,497,415 | $ | 22,560,350 | $ | 1,825,576,336 | ||||||||
Investments, at value — affiliated(c) | 700,000 | 2,274,838 | 991,005 | 5,834,666 | ||||||||||||
Cash | 1,677 | 5,981 | 3,203 | 9,426 | ||||||||||||
Cash pledged for futures contracts | 516,000 | 1,599 | 2,000 | — | ||||||||||||
Foreign currency collateral pledged for futures contracts(d) | — | — | — | 606,503 | ||||||||||||
Foreign currency, at value(e) | 2,180,173 | 3,902 | 14,361 | 3,110,021 | ||||||||||||
Receivables: | ||||||||||||||||
Investments sold | — | — | 2,001,334 | — | ||||||||||||
Securities lending income — affiliated | 2,876 | 16,953 | 201 | 3,909 | ||||||||||||
Dividends — unaffiliated | 4,550,178 | 4,824 | 48,626 | 5,032,435 | ||||||||||||
Dividends — affiliated | 5,172 | 40 | 103 | 9,306 | ||||||||||||
Tax reclaims | — | — | — | 4,814,738 | ||||||||||||
Variation margin on futures contracts | — | 753 | — | 54,774 | ||||||||||||
|
|
|
|
|
|
|
| |||||||||
Total assets | 1,676,222,967 | 8,806,305 | 25,621,183 | 1,845,052,114 | ||||||||||||
|
|
|
|
|
|
|
| |||||||||
LIABILITIES | ||||||||||||||||
Collateral on securities loaned, at value | — | 2,274,571 | 952,251 | 3,764,849 | ||||||||||||
Payables: | ||||||||||||||||
Investments purchased | — | — | 2,044,639 | — | ||||||||||||
Capital shares redeemed | — | — | — | 1,001,568 | ||||||||||||
Investment advisory fees | 681,516 | 2,349 | 11,289 | 958,518 | ||||||||||||
IRS compliance fee for foreign withholding tax claims | — | — | — | 6,283,073 | ||||||||||||
Professional fees | — | — | — | 110,711 | ||||||||||||
Variation margin on futures contracts | 16,898 | — | 120 | — | ||||||||||||
|
|
|
|
|
|
|
| |||||||||
Total liabilities | 698,414 | 2,276,920 | 3,008,299 | 12,118,719 | ||||||||||||
|
|
|
|
|
|
|
| |||||||||
NET ASSETS | $ | 1,675,524,553 | $ | 6,529,385 | $ | 22,612,884 | $ | 1,832,933,395 | ||||||||
|
|
|
|
|
|
|
| |||||||||
NET ASSETS CONSIST OF | ||||||||||||||||
Paid-in capital | $ | 1,834,932,222 | $ | 8,983,970 | $ | 56,634,068 | $ | 2,263,671,696 | ||||||||
Accumulated loss | (159,407,669 | ) | (2,454,585 | ) | (34,021,184 | ) | (430,738,301 | ) | ||||||||
|
|
|
|
|
|
|
| |||||||||
NET ASSETS | $ | 1,675,524,553 | $ | 6,529,385 | $ | 22,612,884 | $ | 1,832,933,395 | ||||||||
|
|
|
|
|
|
|
| |||||||||
NET ASSETVALUE | ||||||||||||||||
Shares outstanding | 27,100,000 | 400,000 | 1,050,000 | 36,600,000 | ||||||||||||
|
|
|
|
|
|
|
| |||||||||
Net asset value | $ | 61.83 | $ | 16.32 | $ | 21.54 | $ | 50.08 | ||||||||
|
|
|
|
|
|
|
| |||||||||
Shares authorized | Unlimited | Unlimited | Unlimited | Unlimited | ||||||||||||
|
|
|
|
|
|
|
| |||||||||
Par value | None | None | None | None | ||||||||||||
|
|
|
|
|
|
|
| |||||||||
(a) Investments, at cost — unaffiliated | $ | 1,690,716,366 | $ | 5,826,031 | $ | 21,372,931 | $ | 1,869,099,054 | ||||||||
(b) Securities loaned, at value | $ | — | $ | 2,303,103 | $ | 866,108 | $ | 3,585,971 | ||||||||
(c) Investments, at cost — affiliated | $ | 700,000 | $ | 2,274,707 | $ | 990,976 | $ | 5,832,496 | ||||||||
(d) Foreign currency collateral pledged, at cost | $ | — | $ | — | $ | — | $ | 638,094 | ||||||||
(e) Foreign currency, at cost | $ | 2,179,843 | $ | 3,896 | $ | 14,071 | $ | 3,083,443 | ||||||||
See notes to financial statements.
| 68 | 2 0 2 3 I SHARES ANNUAL REPORT TO SHAREHOLDERS |
Statements of Assets and Liabilities (continued) March 31, 2023 |
|
iShares Future Metaverse Tech and Communications ETF | iShares India 50 ETF | iShares International Developed Property ETF | iShares International Developed Small Cap Value Factor ETF | |||||||||||||||||
| ||||||||||||||||||||
ASSETS | ||||||||||||||||||||
Investments, at value — unaffiliated(a)(b) | $ | 5,337,521 | $ | 578,131,122 | $ | 42,753,748 | $ | 156,497,872 | ||||||||||||
Investments, at value — affiliated(c) | — | — | 922,455 | 2,137,769 | ||||||||||||||||
Cash | 3,547 | 2,940,917 | 9,288 | 5,231 | ||||||||||||||||
Cash pledged for futures contracts | — | 126,000 | 18,000 | 76,000 | ||||||||||||||||
Foreign currency collateral pledged for futures contracts(d) | — | — | 5,935 | — | ||||||||||||||||
Foreign currency, at value(e) | 5,329 | 12,629 | 80,362 | 350,995 | ||||||||||||||||
Receivables: | ||||||||||||||||||||
Investments sold | 9,732 | 2,066,726 | — | 32 | ||||||||||||||||
Securities lending income — affiliated | — | — | 1,095 | 8,071 | ||||||||||||||||
Dividends — unaffiliated | 4,896 | — | 240,361 | 953,093 | ||||||||||||||||
Dividends — affiliated | 6 | 22,740 | 9 | 176 | ||||||||||||||||
Tax reclaims | 274 | — | 28,987 | 131,190 | ||||||||||||||||
Variation margin on futures contracts | — | 16,845 | 7,890 | 16,965 | ||||||||||||||||
|
|
|
|
|
|
|
| |||||||||||||
Total assets | 5,361,305 | 583,316,979 | 44,068,130 | 160,177,394 | ||||||||||||||||
|
|
|
|
|
|
|
| |||||||||||||
LIABILITIES | ||||||||||||||||||||
Collateral on securities loaned, at value | — | — | 913,028 | 2,137,073 | ||||||||||||||||
Payables: | ||||||||||||||||||||
Investments purchased | 8,881 | 3,550,377 | 7,798 | — | ||||||||||||||||
Deferred foreign capital gain tax | — | 2,563,330 | 3,503 | — | ||||||||||||||||
Foreign taxes | — | — | 360 | — | ||||||||||||||||
Investment advisory fees | 2,003 | 431,312 | 17,578 | 39,555 | ||||||||||||||||
Professional fees | — | — | 2,462 | — | ||||||||||||||||
|
|
|
|
|
|
|
| |||||||||||||
Total liabilities | 10,884 | 6,545,019 | 944,729 | 2,176,628 | ||||||||||||||||
|
|
|
|
|
|
|
| |||||||||||||
NET ASSETS | $ | 5,350,421 | $ | 576,771,960 | $ | 43,123,401 | $ | 158,000,766 | ||||||||||||
|
|
|
|
|
|
|
| |||||||||||||
NET ASSETS CONSIST OF | ||||||||||||||||||||
Paid-in capital | $ | 5,104,279 | $ | 301,258,434 | $ | 98,016,160 | $ | 170,287,914 | ||||||||||||
Accumulated earnings (loss) | 246,142 | 275,513,526 | (54,892,759 | ) | (12,287,148 | ) | ||||||||||||||
|
|
|
|
|
|
|
| |||||||||||||
NET ASSETS | $ | 5,350,421 | $ | 576,771,960 | $ | 43,123,401 | $ | 158,000,766 | ||||||||||||
|
|
|
|
|
|
|
| |||||||||||||
NET ASSETVALUE | ||||||||||||||||||||
Shares outstanding | 200,000 | 14,000,000 | 1,600,000 | 5,000,000 | ||||||||||||||||
|
|
|
|
|
|
|
| |||||||||||||
Net asset value | $ | 26.75 | $ | 41.20 | $ | 26.95 | $ | 31.60 | ||||||||||||
|
|
|
|
|
|
|
| |||||||||||||
Shares authorized | Unlimited | Unlimited | Unlimited | Unlimited | ||||||||||||||||
|
|
|
|
|
|
|
| |||||||||||||
Par value | None | None | None | None | ||||||||||||||||
|
|
|
|
|
|
|
| |||||||||||||
(a) Investments, at cost — unaffiliated | $ | 5,103,438 | $ | 578,875,509 | $ | 64,844,412 | $ | 167,015,746 | ||||||||||||
(b) Securities loaned, at value | $ | — | $ | — | $ | 802,084 | $ | 2,037,507 | ||||||||||||
(c) Investments, at cost — affiliated | $ | — | $ | — | $ | 922,174 | $ | 2,137,489 | ||||||||||||
(d) Foreign currency collateral pledged, at cost | $ | — | $ | — | $ | 6,022 | $ | — | ||||||||||||
(e) Foreign currency, at cost | $ | 5,307 | $ | 12,604 | $ | 80,318 | $ | 350,696 | ||||||||||||
See notes to financial statements.
FINANCIAL STATEMENTS | 69 |
Statements of Assets and Liabilities (continued) March 31, 2023 |
|
iShares International Dividend Growth ETF |
| iShares Latin America 40 ETF | ||||||||||
| ||||||||||||
ASSETS | ||||||||||||
Investments, at value — unaffiliated(a)(b) | $ | 590,327,147 | $ | 996,422,831 | ||||||||
Investments, at value — affiliated(c) | 3,919,211 | 35,118,843 | ||||||||||
Cash | 105 | 130,620 | ||||||||||
Cash pledged for futures contracts | 165,000 | 983,508 | ||||||||||
Foreign currency collateral pledged for futures contracts(d) | 30,337 | 304,162 | ||||||||||
Foreign currency, at value(e) | 582,799 | 1,169,245 | ||||||||||
Receivables: | ||||||||||||
Investments sold | — | 3,323 | ||||||||||
Securities lending income — affiliated | 326 | 6,785 | ||||||||||
Dividends — unaffiliated | 2,562,398 | 2,083,280 | ||||||||||
Dividends — affiliated | 4,376 | 8,891 | ||||||||||
Tax reclaims | 510,649 | — | ||||||||||
Variation margin on futures contracts | 22,033 | 22,924 | ||||||||||
|
|
|
| |||||||||
Total assets | 598,124,381 | 1,036,254,412 | ||||||||||
|
|
|
| |||||||||
LIABILITIES | ||||||||||||
Collateral on securities loaned, at value | 2,609,638 | 28,438,149 | ||||||||||
Payables: | ||||||||||||
Investments purchased | — | 4,288,304 | ||||||||||
Bank borrowings | 409 | — | ||||||||||
Capital shares redeemed | 27 | — | ||||||||||
Deferred foreign capital gain tax | 20,352 | — | ||||||||||
Investment advisory fees | 73,012 | 394,952 | ||||||||||
Professional fees | 1,272 | — | ||||||||||
|
|
|
| |||||||||
Total liabilities | 2,704,710 | 33,121,405 | ||||||||||
|
|
|
| |||||||||
NET ASSETS | $ | 595,419,671 | $ | 1,003,133,007 | ||||||||
|
|
|
| |||||||||
NET ASSETS CONSIST OF | ||||||||||||
Paid-in capital | $ | 615,780,185 | $ | 2,268,822,948 | ||||||||
Accumulated loss | (20,360,514 | ) | (1,265,689,941 | ) | ||||||||
|
|
|
| |||||||||
NET ASSETS | $ | 595,419,671 | $ | 1,003,133,007 | ||||||||
|
|
|
| |||||||||
NET ASSETVALUE | ||||||||||||
Shares outstanding | 9,850,000 | 42,000,000 | ||||||||||
|
|
|
| |||||||||
Net asset value | $ | 60.45 | $ | 23.88 | ||||||||
|
|
|
| |||||||||
Shares authorized | Unlimited | Unlimited | ||||||||||
|
|
|
| |||||||||
Par value | None | None | ||||||||||
|
|
|
| |||||||||
(a) Investments, at cost — unaffiliated | $ | 578,158,363 | $ | 1,135,188,347 | ||||||||
(b) Securities loaned, at value | $ | 2,468,734 | $ | 27,738,165 | ||||||||
(c) Investments, at cost — affiliated | $ | 3,919,638 | $ | 35,123,444 | ||||||||
(d) Foreign currency collateral pledged, at cost | $ | 29,938 | $ | 298,158 | ||||||||
(e) Foreign currency, at cost | $ | 581,662 | $ | 1,150,735 | ||||||||
See notes to financial statements.
| 70 | 2 0 2 3 I SHARES ANNUAL REPORT TO SHAREHOLDERS |
Year Ended March 31, 2023 |
|
| | iShares Asia 50 ETF |
| | |
| | iShares Blockchain and Tech ETF |
(a) |
| | iShares Emerging Markets Infrastructure ETF |
|
| | iShares Europe ETF |
| ||||||||
| ||||||||||||||||||||||||
INVESTMENT INCOME | ||||||||||||||||||||||||
Dividends — unaffiliated | $ | 42,253,977 | $ | 19,643 | $ | 747,876 | $ | 62,248,688 | ||||||||||||||||
Dividends — affiliated | 33,046 | 206 | 824 | 71,568 | ||||||||||||||||||||
Securities lending income — affiliated — net | 10,844 | 86,813 | 15,180 | 69,366 | ||||||||||||||||||||
Other income — unaffiliated | — | — | — | 1,884,104 | ||||||||||||||||||||
Foreign taxes withheld | (4,875,472 | ) | (742 | ) | (49,765 | ) | (5,560,615 | ) | ||||||||||||||||
Foreign withholding tax claims | — | — | — | 11,482,506 | ||||||||||||||||||||
IRS compliance fee for foreign withholding tax claims | — | — | — | (4,340,623 | ) | |||||||||||||||||||
Other foreign taxes | (191 | ) | — | — | — | |||||||||||||||||||
|
|
|
|
|
|
|
| |||||||||||||||||
Total investment income | 37,422,204 | 105,920 | 714,115 | 65,854,994 | ||||||||||||||||||||
|
|
|
|
|
|
|
| |||||||||||||||||
EXPENSES | ||||||||||||||||||||||||
Investment advisory | 7,623,024 | 24,511 | 129,926 | 10,031,041 | ||||||||||||||||||||
Commitment costs | 18,962 | — | 260 | — | ||||||||||||||||||||
Professional | — | — | — | 1,336,691 | ||||||||||||||||||||
|
|
|
|
|
|
|
| |||||||||||||||||
Total expenses | 7,641,986 | 24,511 | 130,186 | 11,367,732 | ||||||||||||||||||||
|
|
|
|
|
|
|
| |||||||||||||||||
Net investment income | 29,780,218 | 81,409 | 583,929 | 54,487,262 | ||||||||||||||||||||
|
|
|
|
|
|
|
| |||||||||||||||||
REALIZED AND UNREALIZED GAIN (LOSS) | ||||||||||||||||||||||||
Net realized gain (loss) from: | ||||||||||||||||||||||||
Investments — unaffiliated | (26,829,651 | ) | (3,174,374 | ) | (2,072,722 | ) | (46,105,974 | ) | ||||||||||||||||
Investments — affiliated | (3,438 | ) | 136 | (205 | ) | 13,404 | ||||||||||||||||||
Capital gain distributions from underlying funds — affiliated | — | — | — | 3 | ||||||||||||||||||||
Foreign currency transactions | (418,816 | ) | 101 | (1,968 | ) | (285,112 | ) | |||||||||||||||||
Futures contracts | (556,346 | ) | (1,154 | ) | (15,567 | ) | 61,134 | |||||||||||||||||
In-kind redemptions — unaffiliated(b) | (27,215,081 | ) | — | 354,069 | 92,398,942 | |||||||||||||||||||
|
|
|
|
|
|
|
| |||||||||||||||||
| (55,023,332 | ) | (3,175,291 | ) | (1,736,393 | ) | 46,082,397 | ||||||||||||||||||
|
|
|
|
|
|
|
| |||||||||||||||||
Net change in unrealized appreciation (depreciation) on: | ||||||||||||||||||||||||
Investments — unaffiliated | (146,728,195 | ) | 671,384 | 591,564 | (60,341,089 | ) | ||||||||||||||||||
Investments — affiliated | — | 131 | 546 | 1,854 | ||||||||||||||||||||
Foreign currency translations | 27,505 | 4 | 520 | 15,518 | ||||||||||||||||||||
Futures contracts | (63,530 | ) | 750 | (1,832 | ) | 32,693 | ||||||||||||||||||
|
|
|
|
|
|
|
| |||||||||||||||||
| (146,764,220 | ) | 672,269 | 590,798 | (60,291,024 | ) | |||||||||||||||||||
|
|
|
|
|
|
|
| |||||||||||||||||
Net realized and unrealized loss | (201,787,552 | ) | (2,503,022 | ) | (1,145,595 | ) | (14,208,627 | ) | ||||||||||||||||
|
|
|
|
|
|
|
| |||||||||||||||||
NET INCREASE (DECREASE) IN NET ASSETS RESULTING FROM OPERATIONS | $ | (172,007,334 | ) | $ | (2,421,613 | ) | $ | (561,666 | ) | $ | 40,278,635 | |||||||||||||
|
|
|
|
|
|
|
| |||||||||||||||||
| (a) | For the period from April 25, 2022 (commencement of operations) to March 31, 2023. |
| (b) | See Note 2 of the Notes to Financial Statements. |
See notes to financial statements.
FINANCIAL STATEMENTS | 71 |
Statements of Operations (continued) Year Ended March 31, 2023 |
|
| | iShares Future Metaverse Tech and Communications |
| | iShares India 50 ETF |
| | iShares International Developed |
| | iShares International Developed Small Cap Value Factor |
| |||||||||
| ETF | (a) | (Consolidated | ) | Property ETF | ETF | |||||||||||||||
| ||||||||||||||||||||
INVESTMENT INCOME | ||||||||||||||||||||
Dividends — unaffiliated | $ | 8,748 | $ | 8,692,565 | $ | 2,173,940 | $ | 6,319,264 | ||||||||||||
Dividends — affiliated | 6 | 229,967 | 401 | 1,883 | ||||||||||||||||
Securities lending income — affiliated — net | — | — | 23,438 | 26,954 | ||||||||||||||||
Other income — unaffiliated | — | — | 62 | — | ||||||||||||||||
Foreign taxes withheld | (665 | ) | (1,920,511 | ) | (198,651 | ) | (623,112 | ) | ||||||||||||
Foreign withholding tax claims | — | — | 24,774 | — | ||||||||||||||||
|
|
|
|
|
|
|
| |||||||||||||
Total investment income | 8,089 | 7,002,021 | 2,023,964 | 5,724,989 | ||||||||||||||||
|
|
|
|
|
|
|
| |||||||||||||
EXPENSES | ||||||||||||||||||||
Investment advisory | 2,899 | 5,249,288 | 240,576 | 588,646 | ||||||||||||||||
Commitment costs | — | 7,387 | — | — | ||||||||||||||||
Professional | — | — | 2,483 | — | ||||||||||||||||
Interest expense | — | 253,126 | — | — | ||||||||||||||||
|
|
|
|
|
|
|
| |||||||||||||
Total expenses | 2,899 | 5,509,801 | 243,059 | 588,646 | ||||||||||||||||
Less: | ||||||||||||||||||||
Investment advisory fees waived | — | — | — | (147,162 | ) | |||||||||||||||
|
|
|
|
|
|
|
| |||||||||||||
Total expenses after fees waived | 2,899 | 5,509,801 | 243,059 | 441,484 | ||||||||||||||||
|
|
|
|
|
|
|
| |||||||||||||
Net investment income | 5,190 | 1,492,220 | 1,780,905 | 5,283,505 | ||||||||||||||||
|
|
|
|
|
|
|
| |||||||||||||
REALIZED AND UNREALIZED GAIN (LOSS) | ||||||||||||||||||||
Net realized gain (loss) from: | ||||||||||||||||||||
Investments — unaffiliated(b) | 6,851 | 338,548,316 | (1,643,911 | ) | (2,536,783 | ) | ||||||||||||||
Investments — affiliated | — | — | 125 | 449 | ||||||||||||||||
Capital gain distributions from underlying funds — affiliated | — | 18 | — | — | ||||||||||||||||
Foreign currency transactions | (3 | ) | (2,516,535 | ) | (32,807 | ) | (56,406 | ) | ||||||||||||
Futures contracts | — | (294,979 | ) | (21,721 | ) | 76,788 | ||||||||||||||
In-kind redemptions — unaffiliated(c) | — | — | (1,097,678 | ) | — | |||||||||||||||
|
|
|
|
|
|
|
| |||||||||||||
| 6,848 | 335,736,820 | (2,795,992 | ) | (2,515,952 | ) | |||||||||||||||
|
|
|
|
|
|
|
| |||||||||||||
Net change in unrealized appreciation (depreciation) on: | ||||||||||||||||||||
Investments — unaffiliated(d) | 234,083 | (390,353,096 | ) | (12,825,483 | ) | (9,754,481 | ) | |||||||||||||
Investments — affiliated | — | — | 154 | 283 | ||||||||||||||||
Foreign currency translations | 21 | 1,977 | 3,657 | 8,043 | ||||||||||||||||
Futures contracts | — | 21,880 | (7,904 | ) | (249 | ) | ||||||||||||||
|
|
|
|
|
|
|
| |||||||||||||
| 234,104 | (390,329,239 | ) | (12,829,576 | ) | (9,746,404 | ) | ||||||||||||||
|
|
|
|
|
|
|
| |||||||||||||
Net realized and unrealized gain (loss) | 240,952 | (54,592,419 | ) | (15,625,568 | ) | (12,262,356 | ) | |||||||||||||
|
|
|
|
|
|
|
| |||||||||||||
NET INCREASE (DECREASE) IN NET ASSETS RESULTING FROM OPERATIONS | $ | 246,142 | $ | (53,100,199 | ) | $ | (13,844,663 | ) | $ | (6,978,851 | ) | |||||||||
|
|
|
|
|
|
|
| |||||||||||||
(a) For the period from February 14, 2023 (commencement of operations) to March 31, 2023. | ||||||||||||||||||||
(b) Net of foreign capital gain tax and capital gain tax refund, if applicable | $ | — | $ | (20,469,569 | ) | $ | (376 | ) | $ | — | ||||||||||
(c) See Note 2 of the Notes to Financial Statements. | ||||||||||||||||||||
(d) Net of reduction in deferred foreign capital gain tax of | $ | — | $ | 21,974,458 | $ | 9,685 | $ | — | ||||||||||||
See notes to financial statements.
| 72 | 2 0 2 3 I SHARES ANNUAL REPORT TO SHAREHOLDERS |
Statements of Operations (continued) Year Ended March 31, 2023 |
|
iShares International Dividend Growth ETF | iShares Latin America 40 ETF | |||||||
| ||||||||
INVESTMENT INCOME | ||||||||
Dividends — unaffiliated | $ | 14,719,013 | $ | 133,994,753 | ||||
Dividends — affiliated | 19,818 | 98,321 | ||||||
Interest — unaffiliated | 4,997 | — | ||||||
Securities lending income — affiliated — net | 5,335 | 104,937 | ||||||
Other income — unaffiliated | 37 | — | ||||||
Foreign taxes withheld | (1,520,195 | ) | (5,655,392 | ) | ||||
Foreign withholding tax claims | 12,687 | — | ||||||
|
|
|
| |||||
Total investment income | 13,241,692 | 128,542,619 | ||||||
|
|
|
| |||||
EXPENSES | ||||||||
Investment advisory | 652,212 | 5,454,026 | ||||||
Interest expense | 1,969 | — | ||||||
Commitment costs | 1,921 | 14,813 | ||||||
Professional | 1,272 | — | ||||||
|
|
|
| |||||
Total expenses | 657,374 | 5,468,839 | ||||||
|
|
|
| |||||
Net investment income | 12,584,318 | 123,073,780 | ||||||
|
|
|
| |||||
REALIZED AND UNREALIZED GAIN (LOSS) | ||||||||
Investments — unaffiliated(a) | (27,369,878 | ) | (212,716,560 | ) | ||||
Investments — affiliated | 584 | (3,469 | ) | |||||
Capital gain distributions from underlying funds — affiliated | 1 | — | ||||||
Foreign currency transactions | (77,536 | ) | (163,020 | ) | ||||
Futures contracts | (31,130 | ) | (5,906,611 | ) | ||||
In-kind redemptions — unaffiliated(b) | — | 10,857,200 | ||||||
|
|
|
| |||||
| (27,477,959 | ) | (207,932,460 | ) | |||||
|
|
|
| |||||
Net change in unrealized appreciation (depreciation) on: | ||||||||
Investments — unaffiliated(c) | 10,859,367 | (181,418,033 | ) | |||||
Investments — affiliated | (427 | ) | (13,420 | ) | ||||
Foreign currency translations | 17,497 | 79,945 | ||||||
Futures contracts | 103,863 | (510,411 | ) | |||||
|
|
|
| |||||
| 10,980,300 | (181,861,919 | ) | ||||||
|
|
|
| |||||
Net realized and unrealized loss | (16,497,659 | ) | (389,794,379 | ) | ||||
|
|
|
| |||||
NET DECREASE IN NET ASSETS RESULTING FROM OPERATIONS | $ | (3,913,341 | ) | $ | (266,720,599 | ) | ||
|
|
|
| |||||
(a) Net of foreign capital gain tax and capital gain tax refund, if applicable | $ | (39,214 | ) | $ | — | |||
(b) See Note 2 of the Notes to Financial Statements. | ||||||||
(c) Net of reduction in deferred foreign capital gain tax of | $ | 146,252 | $ | — | ||||
See notes to financial statements.
FINANCIAL STATEMENTS | 73 |
Statements of Changes in Net Assets
| iShares Asia 50 ETF | iShares Blockchain and Tech ETF | |||||||||||||||||||
| | Year Ended 03/31/23 |
| | Year Ended 03/31/22 |
| | Period From 04/25/22 to 03/31/23 | (a)
| ||||||||||||
| ||||||||||||||||||||
INCREASE (DECREASE) IN NET ASSETS | ||||||||||||||||||||
OPERATIONS | ||||||||||||||||||||
Net investment income | $ | 29,780,218 | $ | 28,699,918 | $ | 81,409 | ||||||||||||||
Net realized gain (loss) | (55,023,332 | ) | 100,321,770 | (3,175,291 | ) | |||||||||||||||
Net change in unrealized appreciation (depreciation) | (146,764,220 | ) | (756,399,361 | ) | 672,269 | |||||||||||||||
|
|
|
|
|
| |||||||||||||||
Net decrease in net assets resulting from operations | (172,007,334 | ) | (627,377,673 | ) | (2,421,613 | ) | ||||||||||||||
|
|
|
|
|
| |||||||||||||||
DISTRIBUTIONS TO SHAREHOLDERS(b) | ||||||||||||||||||||
Decrease in net assets resulting from distributions to shareholders | (36,273,723 | ) | (35,774,281 | ) | (32,972 | ) | ||||||||||||||
|
|
|
|
|
| |||||||||||||||
CAPITAL SHARE TRANSACTIONS | ||||||||||||||||||||
Net increase (decrease) in net assets derived from capital share transactions | (1,319,572 | ) | (624,392,740 | ) | 8,983,970 | |||||||||||||||
|
|
|
|
|
| |||||||||||||||
NET ASSETS | ||||||||||||||||||||
Total increase (decrease) in net assets | (209,600,629 | ) | (1,287,544,694 | ) | 6,529,385 | |||||||||||||||
Beginning of period | 1,885,125,182 | 3,172,669,876 | — | |||||||||||||||||
|
|
|
|
|
| |||||||||||||||
End of period | $ | 1,675,524,553 | $ | 1,885,125,182 | $ | 6,529,385 | ||||||||||||||
|
|
|
|
|
| |||||||||||||||
| (a) | Commencement of operations. |
| (b) | Distributions for annual periods determined in accordance with U.S. federal income tax regulations. |
See notes to financial statements.
| 74 | 2 0 2 3 I SHARES ANNUAL REPORT TO SHAREHOLDERS |
Statements of Changes in Net Assets (continued)
| iShares Emerging Markets Infrastructure ETF |
| iShares Europe ETF | ||||||||||||||||||||||||||||||||||
| Year Ended 03/31/23 | Year Ended 03/31/22 | Year Ended 03/31/23 | Year Ended 03/31/22 | ||||||||||||||||||||||||||||||||
| ||||||||||||||||||||||||||||||||||||
INCREASE (DECREASE) IN NET ASSETS | ||||||||||||||||||||||||||||||||||||
OPERATIONS | ||||||||||||||||||||||||||||||||||||
Net investment income | $ | 583,929 | $ | 655,382 | $ | 54,487,262 | $ | 46,610,305 | ||||||||||||||||||||||||||||
Net realized gain (loss) | (1,736,393 | ) | (1,282,326 | ) | 46,082,397 | (27,424,827 | ) | |||||||||||||||||||||||||||||
Net change in unrealized appreciation (depreciation) | 590,798 | 76,169 | (60,291,024 | ) | 3,559,544 | |||||||||||||||||||||||||||||||
|
|
|
|
|
|
|
| |||||||||||||||||||||||||||||
Net increase (decrease) in net assets resulting from operations | (561,666 | ) | (550,775 | ) | 40,278,635 | 22,745,022 | ||||||||||||||||||||||||||||||
|
|
|
|
|
|
|
| |||||||||||||||||||||||||||||
DISTRIBUTIONS TO SHAREHOLDERS(a) | ||||||||||||||||||||||||||||||||||||
Decrease in net assets resulting from distributions to shareholders | (641,405 | ) | (642,264 | ) | (50,928,655 | ) | (56,175,033 | ) | ||||||||||||||||||||||||||||
|
|
|
|
|
|
|
| |||||||||||||||||||||||||||||
CAPITAL SHARE TRANSACTIONS | ||||||||||||||||||||||||||||||||||||
Net increase (decrease) in net assets derived from capital share transactions | 3,220,760 | 5,705,641 | (100,395,818 | ) | 311,464,772 | |||||||||||||||||||||||||||||||
|
|
|
|
|
|
|
| |||||||||||||||||||||||||||||
NET ASSETS | ||||||||||||||||||||||||||||||||||||
Total increase (decrease) in net assets | 2,017,689 | 4,512,602 | (111,045,838 | ) | 278,034,761 | |||||||||||||||||||||||||||||||
Beginning of year | 20,595,195 | 16,082,593 | 1,943,979,233 | 1,665,944,472 | ||||||||||||||||||||||||||||||||
|
|
|
|
|
|
|
| |||||||||||||||||||||||||||||
End of year | $ | 22,612,884 | $ | 20,595,195 | $ | 1,832,933,395 | $ | 1,943,979,233 | ||||||||||||||||||||||||||||
|
|
|
|
|
|
|
| |||||||||||||||||||||||||||||
| (a) | Distributions for annual periods determined in accordance with U.S. federal income tax regulations. |
See notes to financial statements.
FINANCIAL STATEMENTS | 75 |
Statements of Changes in Net Assets (continued)
| iShares Future Metaverse Tech and Communications ETF | iShares India 50 ETF (Consolidated) | |||||||||||||||
| | Period From 02/14/23 to 03/31/23 | (a)
| | Year Ended 03/31/23 |
| | Year Ended 03/31/22 |
| ||||||||
| ||||||||||||||||
INCREASE (DECREASE) IN NET ASSETS | ||||||||||||||||
OPERATIONS | ||||||||||||||||
Net investment income | $ | 5,190 | $ | 1,492,220 | $ | 661,178 | ||||||||||
Net realized gain | 6,848 | 335,736,820 | 52,516,496 | |||||||||||||
Net change in unrealized appreciation (depreciation) | 234,104 | (390,329,239 | ) | 16,573,355 | ||||||||||||
|
|
|
|
|
| |||||||||||
Net increase (decrease) in net assets resulting from operations | 246,142 | (53,100,199 | ) | 69,751,029 | ||||||||||||
|
|
|
|
|
| |||||||||||
DISTRIBUTIONS TO SHAREHOLDERS(b) | ||||||||||||||||
Decrease in net assets resulting from distributions to shareholders | — | (21,001,621 | ) | (48,495,153 | ) | |||||||||||
|
|
|
|
|
| |||||||||||
CAPITAL SHARE TRANSACTIONS | ||||||||||||||||
Net increase (decrease) in net assets derived from capital share transactions | 5,104,279 | (12,354,375 | ) | (49,311,607 | ) | |||||||||||
|
|
|
|
|
| |||||||||||
NET ASSETS | ||||||||||||||||
Total increase (decrease) in net assets | 5,350,421 | (86,456,195 | ) | (28,055,731 | ) | |||||||||||
Beginning of period | — | 663,228,155 | 691,283,886 | |||||||||||||
|
|
|
|
|
| |||||||||||
End of period | $ | 5,350,421 | $ | 576,771,960 | $ | 663,228,155 | ||||||||||
|
|
|
|
|
| |||||||||||
| (a) | Commencement of operations. |
| (b) | Distributions for annual periods determined in accordance with U.S. federal income tax regulations. |
See notes to financial statements.
| 76 | 2 0 2 3 I SHARES ANNUAL REPORT TO SHAREHOLDERS |
Statements of Changes in Net Assets (continued)
| iShares International Developed Property ETF | iShares International Developed Small Cap Value Factor ETF | |||||||||||||||
Year Ended 03/31/23 | Year Ended 03/31/22 | Year Ended 03/31/23 | Year Ended 03/31/22 | |||||||||||||
| ||||||||||||||||
INCREASE (DECREASE) IN NET ASSETS | ||||||||||||||||
OPERATIONS | ||||||||||||||||
Net investment income | $ | 1,780,905 | $ | 2,144,487 | $ | 5,283,505 | $ | 1,194,731 | ||||||||
Net realized loss | (2,795,992 | ) | (1,322,252 | ) | (2,515,952 | ) | (452,059 | ) | ||||||||
Net change in unrealized appreciation (depreciation) | (12,829,576 | ) | 1,609,503 | (9,746,404 | ) | (723,621 | ) | |||||||||
|
|
|
|
|
|
|
| |||||||||
Net increase (decrease) in net assets resulting from operations | (13,844,663 | ) | 2,431,738 | (6,978,851 | ) | 19,051 | ||||||||||
|
|
|
|
|
|
|
| |||||||||
DISTRIBUTIONS TO SHAREHOLDERS(a) | ||||||||||||||||
Decrease in net assets resulting from distributions to shareholders | (977,169 | ) | (3,007,345 | ) | (4,915,147 | ) | (407,661 | ) | ||||||||
|
|
|
|
|
|
|
| |||||||||
CAPITAL SHARE TRANSACTIONS | ||||||||||||||||
Net increase (decrease) in net assets derived from capital share transactions | (5,900,739 | ) | (18,963,064 | ) | 5,713,393 | 157,695,420 | ||||||||||
|
|
|
|
|
|
|
| |||||||||
NET ASSETS | ||||||||||||||||
Total increase (decrease) in net assets | (20,722,571 | ) | (19,538,671 | ) | (6,180,605 | ) | 157,306,810 | |||||||||
Beginning of year | 63,845,972 | 83,384,643 | 164,181,371 | 6,874,561 | ||||||||||||
|
|
|
|
|
|
|
| |||||||||
End of year | $ | 43,123,401 | $ | 63,845,972 | $ | 158,000,766 | $ | 164,181,371 | ||||||||
|
|
|
|
|
|
|
| |||||||||
| (a) | Distributions for annual periods determined in accordance with U.S. federal income tax regulations. |
See notes to financial statements.
FINANCIAL STATEMENTS | 77 |
Statements of Changes in Net Assets (continued)
| iShares International Dividend Growth ETF | iShares Latin America 40 ETF | |||||||||||||||||||
Year Ended 03/31/23 | Year Ended 03/31/22 | Year Ended 03/31/23 | Year Ended 03/31/22 | |||||||||||||||||
| ||||||||||||||||||||
INCREASE (DECREASE) IN NET ASSETS | ||||||||||||||||||||
OPERATIONS | ||||||||||||||||||||
Net investment income | $ | 12,584,318 | $ | 6,718,910 | $ | 123,073,780 | $ | 87,719,376 | ||||||||||||
Net realized gain (loss) | (27,477,959 | ) | 5,289,828 | (207,932,460 | ) | (97,985,906 | ) | |||||||||||||
Net change in unrealized appreciation (depreciation) | 10,980,300 | (9,199,161 | ) | (181,861,919 | ) | 277,163,233 | ||||||||||||||
|
|
|
|
|
|
|
| |||||||||||||
Net increase (decrease) in net assets resulting from operations | (3,913,341 | ) | 2,809,577 | (266,720,599 | ) | 266,896,703 | ||||||||||||||
|
|
|
|
|
|
|
| |||||||||||||
DISTRIBUTIONS TO SHAREHOLDERS(a) | ||||||||||||||||||||
Decrease in net assets resulting from distributions to shareholders | (11,034,484 | ) | (5,744,772 | ) | (138,313,795 | ) | (99,359,955 | ) | ||||||||||||
|
|
|
|
|
|
|
| |||||||||||||
CAPITAL SHARE TRANSACTIONS | ||||||||||||||||||||
Net increase (decrease) in net assets derived from capital share transactions | 288,496,363 | 134,951,001 | (330,022,276 | ) | (199,937,506 | ) | ||||||||||||||
|
|
|
|
|
|
|
| |||||||||||||
NET ASSETS | ||||||||||||||||||||
Total increase (decrease) in net assets | 273,548,538 | 132,015,806 | (735,056,670 | ) | (32,400,758 | ) | ||||||||||||||
Beginning of year | 321,871,133 | 189,855,327 | 1,738,189,677 | 1,770,590,435 | ||||||||||||||||
|
|
|
|
|
|
|
| |||||||||||||
End of year | $ | 595,419,671 | $ | 321,871,133 | $ | 1,003,133,007 | $ | 1,738,189,677 | ||||||||||||
|
|
|
|
|
|
|
| |||||||||||||
| (a) | Distributions for annual periods determined in accordance with U.S. federal income tax regulations. |
See notes to financial statements.
| 78 | 2 0 2 3 I SHARES ANNUAL REPORT TO SHAREHOLDERS |
(For a share outstanding throughout each period)
| iShares Asia 50 ETF | ||||||||||||||||||||
|
| |||||||||||||||||||
Year Ended 03/31/23 | Year Ended 03/31/22 | Year Ended 03/31/21 | Year Ended 03/31/20 | Year Ended 03/31/19 | ||||||||||||||||
| ||||||||||||||||||||
Net asset value, beginning of year | $ | 68.67 | $ | 90.91 | $ | 56.05 | $ | 61.05 | $ | 67.20 | ||||||||||
|
|
|
|
|
|
|
|
|
| |||||||||||
Net investment income(a) | 1.17 | 0.93 | 1.31 | 1.42 | 1.48 | |||||||||||||||
Net realized and unrealized gain (loss)(b) | (6.54 | ) | (21.99 | ) | 34.52 | (4.94 | ) | (6.25 | ) | |||||||||||
|
|
|
|
|
|
|
|
|
| |||||||||||
Net increase (decrease) from investment operations | (5.37 | ) | (21.06 | ) | 35.83 | (3.52 | ) | (4.77 | ) | |||||||||||
|
|
|
|
|
|
|
|
|
| |||||||||||
Distributions from net investment income(c) | (1.47 | ) | (1.18 | ) | (0.97 | ) | (1.48 | ) | (1.38 | ) | ||||||||||
|
|
|
|
|
|
|
|
|
| |||||||||||
Net asset value, end of year | $ | 61.83 | $ | 68.67 | $ | 90.91 | $ | 56.05 | $ | 61.05 | ||||||||||
|
|
|
|
|
|
|
|
|
| |||||||||||
Total Return(d) | ||||||||||||||||||||
Based on net asset value | (7.77 | )% | (23.36 | )% | 64.22 | % | (6.00 | )% | (6.94 | )% | ||||||||||
|
|
|
|
|
|
|
|
|
| |||||||||||
Ratios to Average Net Assets(e) | ||||||||||||||||||||
Total expenses | 0.50 | % | 0.50 | % | 0.50 | % | 0.50 | % | 0.50 | % | ||||||||||
|
|
|
|
|
|
|
|
|
| |||||||||||
Net investment income | 1.95 | % | 1.12 | % | 1.66 | % | 2.32 | % | 2.43 | % | ||||||||||
|
|
|
|
|
|
|
|
|
| |||||||||||
Supplemental Data | ||||||||||||||||||||
Net assets, end of year (000) | $ | 1,675,525 | $ | 1,885,125 | $ | 3,172,670 | $ | 1,059,289 | $ | 1,089,745 | ||||||||||
|
|
|
|
|
|
|
|
|
| |||||||||||
Portfolio turnover rate(f) | 12 | % | 13 | % | 46 | % | 6 | % | 10 | % | ||||||||||
|
|
|
|
|
|
|
|
|
| |||||||||||
| (a) | Based on average shares outstanding. |
| (b) | The amounts reported for a share outstanding may not accord with the change in aggregate gains and losses in securities for the fiscal period due to the timing of capital share transactions in relation to the fluctuating market values of the Fund’s underlying securities. |
| (c) | Distributions for annual periods determined in accordance with U.S. federal income tax regulations. |
| (d) | Where applicable, assumes the reinvestment of distributions. |
| (e) | Excludes fees and expenses incurred indirectly as a result of investments in underlying funds. |
| (f) | Portfolio turnover rate excludes in-kind transactions. |
See notes to financial statements.
FINANCIAL HIGHLIGHTS | 79 |
Financial Highlights (continued)
(For a share outstanding throughout each period)
| iShares Blockchain and Tech ETF | ||||||||
|
Period From |
| ||||||
| 04/25/22 | (a) | |||||||
| to 03/31/23 | ||||||||
| ||||||||
Net asset value, beginning of period | $ | 25.56 | ||||||
|
| |||||||
Net investment income(b) | 0.22 | |||||||
Net realized and unrealized gain(c) | (9.38 | ) | ||||||
|
| |||||||
Net increase from investment operations | (9.16 | ) | ||||||
|
| |||||||
Distributions from net investment income(d) | (0.08 | ) | ||||||
|
| |||||||
Net asset value, end of period | $ | 16.32 | ||||||
|
| |||||||
Total Return(e) | ||||||||
Based on net asset value | (35.71 | )%(f) | ||||||
|
| |||||||
Ratios to Average Net Assets(g) | ||||||||
Total expenses | 0.47 | %(h) | ||||||
|
| |||||||
Net investment income | 1.56 | %(h) | ||||||
|
| |||||||
Supplemental Data | ||||||||
Net assets, end of period (000) | $ | 6,529 | ||||||
|
| |||||||
Portfolio turnover rate(i) | 87 | % | ||||||
|
| |||||||
| (a) | Commencement of operations. |
| (b) | Based on average shares outstanding. |
| (c) | The amount reported for a share outstanding may not accord with the change in aggregate gains and losses in securities for the fiscal period due to the timing of capital share transactions in relation to the fluctuating market values of the Fund’s underlying securities. |
| (d) | Distributions for annual periods determined in accordance with U.S. federal income tax regulations. |
| (e) | Where applicable, assumes the reinvestment of distributions. |
| (f) | Not annualized. |
| (g) | Excludes fees and expenses incurred indirectly as a result of investments in underlying funds. |
| (h) | Annualized. |
| (i) | Portfolio turnover rate excludes in-kind transactions. |
See notes to financial statements.
| 80 | 2 0 2 3 I SHARES ANNUAL REPORT TO SHAREHOLDERS |
Financial Highlights (continued)
(For a share outstanding throughout each period)
| iShares Emerging Markets Infrastructure ETF | ||||||||||||||||||||||||||||||||||||||||
|
| |||||||||||||||||||||||||||||||||||||||
Year Ended 03/31/23 | Year Ended 03/31/22 | Year Ended 03/31/21 | Year Ended 03/31/20 | Year Ended 03/31/19 | ||||||||||||||||||||||||||||||||||||
| ||||||||||||||||||||||||||||||||||||||||
Net asset value, beginning of year | $ | 22.88 | $ | 24.74 | $ | 19.80 | $ | 28.64 | $ | 32.07 | ||||||||||||||||||||||||||||||
|
|
|
|
|
|
|
|
|
| |||||||||||||||||||||||||||||||
Net investment income(a) | 0.57 | 0.95 | 0.65 | 0.75 | 0.75 | |||||||||||||||||||||||||||||||||||
Net realized and unrealized gain (loss)(b) | (1.27 | ) | (1.84 | ) | 4.91 | (8.94 | ) | (3.45 | ) | |||||||||||||||||||||||||||||||
|
|
|
|
|
|
|
|
|
| |||||||||||||||||||||||||||||||
Net increase (decrease) from investment operations | (0.70 | ) | (0.89 | ) | 5.56 | (8.19 | ) | (2.70 | ) | |||||||||||||||||||||||||||||||
|
|
|
|
|
|
|
|
|
| |||||||||||||||||||||||||||||||
Distributions from net investment income(c) | (0.64 | ) | (0.97 | ) | (0.62 | ) | (0.65 | ) | (0.73 | ) | ||||||||||||||||||||||||||||||
|
|
|
|
|
|
|
|
|
| |||||||||||||||||||||||||||||||
Net asset value, end of year | $ | 21.54 | $ | 22.88 | $ | 24.74 | $ | 19.80 | $ | 28.64 | ||||||||||||||||||||||||||||||
|
|
|
|
|
|
|
|
|
| |||||||||||||||||||||||||||||||
Total Return(d) | ||||||||||||||||||||||||||||||||||||||||
Based on net asset value | (3.11 | )% | (3.83 | )% | 28.33 | % | (29.33 | )% | (8.35 | )% | ||||||||||||||||||||||||||||||
|
|
|
|
|
|
|
|
|
| |||||||||||||||||||||||||||||||
Ratios to Average Net Assets(e) | ||||||||||||||||||||||||||||||||||||||||
Total expenses | 0.60 | % | 0.60 | % | 0.60 | % | 0.75 | % | 0.75 | % | ||||||||||||||||||||||||||||||
|
|
|
|
|
|
|
|
|
| |||||||||||||||||||||||||||||||
Net investment income | 2.70 | % | 3.96 | % | 2.90 | % | 2.60 | % | 2.56 | % | ||||||||||||||||||||||||||||||
|
|
|
|
|
|
|
|
|
| |||||||||||||||||||||||||||||||
Supplemental Data | ||||||||||||||||||||||||||||||||||||||||
Net assets, end of year (000) | $ | 22,613 | $ | 20,595 | $ | 16,083 | $ | 12,870 | $ | 25,773 | ||||||||||||||||||||||||||||||
|
|
|
|
|
|
|
|
|
| |||||||||||||||||||||||||||||||
Portfolio turnover rate(f) | 26 | % | 23 | % | 27 | % | 18 | % | 25 | % | ||||||||||||||||||||||||||||||
|
|
|
|
|
|
|
|
|
| |||||||||||||||||||||||||||||||
| (a) | Based on average shares outstanding. |
| (b) | The amounts reported for a share outstanding may not accord with the change in aggregate gains and losses in securities for the fiscal period due to the timing of capital share transactions in relation to the fluctuating market values of the Fund’s underlying securities. |
| (c) | Distributions for annual periods determined in accordance with U.S. federal income tax regulations. |
| (d) | Where applicable, assumes the reinvestment of distributions. |
| (e) | Excludes fees and expenses incurred indirectly as a result of investments in underlying funds. |
| (f) | Portfolio turnover rate excludes in-kind transactions. |
See notes to financial statements.
FINANCIAL HIGHLIGHTS | 81 |
Financial Highlights (continued)
(For a share outstanding throughout each period)
| iShares Europe ETF | ||||||||||||||||||||
|
| |||||||||||||||||||
| Year Ended 03/31/23 | Year Ended 03/31/22 | Year Ended 03/31/21 | Year Ended 03/31/20 | Year Ended 03/31/19 | ||||||||||||||||
| ||||||||||||||||||||
Net asset value, beginning of year | $ | 50.17 | $ | 50.25 | $ | 35.42 | $ | 43.40 | $ | 46.48 | ||||||||||
|
|
|
|
|
|
|
|
|
| |||||||||||
Net investment income(a) | 1.45 | (b) | 1.24 | (b) | 0.85 | 1.24 | 1.42 | |||||||||||||
Net realized and unrealized gain (loss)(c) | (0.15 | ) | 0.21 | 14.82 | (7.78 | ) | (3.16 | ) | ||||||||||||
|
|
|
|
|
|
|
|
|
| |||||||||||
Net increase (decrease) from investment operations | 1.30 | 1.45 | 15.67 | (6.54 | ) | (1.74 | ) | |||||||||||||
|
|
|
|
|
|
|
|
|
| |||||||||||
Distributions from net investment income(d) | (1.39 | ) | (1.53 | ) | (0.84 | ) | (1.44 | ) | (1.34 | ) | ||||||||||
|
|
|
|
|
|
|
|
|
| |||||||||||
Net asset value, end of year | $ | 50.08 | $ | 50.17 | $ | 50.25 | $ | 35.42 | $ | 43.40 | ||||||||||
|
|
|
|
|
|
|
|
|
| |||||||||||
Total Return(e) | ||||||||||||||||||||
Based on net asset value | 2.87 | %(b) | 2.69 | %(b) | 44.70 | % | (15.61 | )% | (3.73 | )% | ||||||||||
|
|
|
|
|
|
|
|
|
| |||||||||||
Ratios to Average Net Assets(f) | ||||||||||||||||||||
Total expenses | 0.67 | % | 0.63 | % | 0.60 | % | 0.59 | % | 0.59 | % | ||||||||||
|
|
|
|
|
|
|
|
|
| |||||||||||
Total expenses excluding professional fees for foreign withholding tax claims | 0.59 | % | 0.58 | % | 0.59 | % | 0.59 | % | 0.59 | % | ||||||||||
|
|
|
|
|
|
|
|
|
| |||||||||||
Net investment income | 3.21 | %(b) | 2.34 | %(b) | 1.94 | % | 2.84 | % | 3.23 | % | ||||||||||
|
|
|
|
|
|
|
|
|
| |||||||||||
Supplemental Data | ||||||||||||||||||||
Net assets, end of year (000) | $ | 1,832,933 | $ | 1,943,979 | $ | 1,665,944 | $ | 1,252,107 | $ | 2,002,860 | ||||||||||
|
|
|
|
|
|
|
|
|
| |||||||||||
Portfolio turnover rate(g) | 5 | % | 5 | % | 5 | % | 5 | % | 7 | % | ||||||||||
|
|
|
|
|
|
|
|
|
| |||||||||||
| (a) | Based on average shares outstanding. |
| (b) | Reflects the positive effect of foreign withholding tax claims, net of the associated professional fees, which resulted in the following increases for the years ended March 31, 2023 and March 31, 2022, respectively: |
| • | Net investment income per share by $0.27 and $0.18. |
| • | Total return by 0.56% and 0.36%. |
| • | Ratio of net investment income to average net assets by 0.60% and 0.34%. |
| (c) | The amounts reported for a share outstanding may not accord with the change in aggregate gains and losses in securities for the fiscal period due to the timing of capital share transactions in relation to the fluctuating market values of the Fund’s underlying securities. |
| (d) | Distributions for annual periods determined in accordance with U.S. federal income tax regulations. |
| (e) | Where applicable, assumes the reinvestment of distributions. |
| (f) | Excludes fees and expenses incurred indirectly as a result of investments in underlying funds. |
| (g) | Portfolio turnover rate excludes in-kind transactions. |
See notes to financial statements.
| 82 | 2 0 2 3 I SHARES ANNUAL REPORT TO SHAREHOLDERS |
Financial Highlights (continued)
(For a share outstanding throughout the period)
iShares Future Metaverse Tech and Communications | ||||||||
ETF | ||||||||
| Period From | ||||||||
| 02/14/23 | (a) | |||||||
| to 03/31/23 | ||||||||
| ||||||||
Net asset value, beginning of period | $ | 25.52 | ||||||
|
| |||||||
Net investment income(b) | 0.03 | |||||||
Net realized and unrealized gain(c) | 1.20 | |||||||
|
| |||||||
Net increase from investment operations | 1.23 | |||||||
|
| |||||||
Net asset value, end of period | $ | 26.75 | ||||||
|
| |||||||
Total Return(d) | ||||||||
Based on net asset value | 4.82 | %(e) | ||||||
|
| |||||||
Ratios to Average Net Assets(f) | ||||||||
Total expenses | 0.47 | %(g) | ||||||
|
| |||||||
Net investment income | 0.84 | %(g) | ||||||
|
| |||||||
Supplemental Data | ||||||||
Net assets, end of period (000) | $ | 5,350 | ||||||
|
| |||||||
Portfolio turnover rate(h) | 7 | % | ||||||
|
| |||||||
| (a) | Commencement of operations. |
| (b) | Based on average shares outstanding. |
| (c) | The amounts reported for a share outstanding may not accord with the change in aggregate gains and losses in securities for the fiscal period due to the timing of capital share transactions in relation to the fluctuating market values of the Fund’s underlying securities. |
| (d) | Where applicable, assumes the reinvestment of distributions. |
| (e) | Not annualized. |
| (f) | Excludes fees and expenses incurred indirectly as a result of investments in underlying funds. |
| (g) | Annualized. |
| (h) | Portfolio turnover rate excludes in-kind transactions. |
See notes to financial statements.
FINANCIAL HIGHLIGHTS | 83 |
Financial Highlights (continued)
(For a share outstanding throughout each period)
iShares India 50 ETF (Consolidated) | ||||||||||||||||||||||||||||||||||||||||
|
| |||||||||||||||||||||||||||||||||||||||
Year Ended 03/31/23 | Year Ended 03/31/22 | Year Ended 03/31/21 | Year Ended 03/31/20 | Year Ended 03/31/19 | ||||||||||||||||||||||||||||||||||||
| ||||||||||||||||||||||||||||||||||||||||
Net asset value, beginning of year | $ | 46.38 | $ | 44.60 | $ | 25.87 | $ | 37.92 | $ | 35.00 | ||||||||||||||||||||||||||||||
|
|
|
|
|
|
|
|
|
| |||||||||||||||||||||||||||||||
Net investment income(a) | 0.11 | 0.05 | 0.02 | 0.19 | 0.16 | |||||||||||||||||||||||||||||||||||
Net realized and unrealized gain (loss)(b) | (3.70 | ) | 5.10 | 18.74 | (12.01 | ) | 2.97 | |||||||||||||||||||||||||||||||||
|
|
|
|
|
|
|
|
|
| |||||||||||||||||||||||||||||||
Net increase (decrease) from investment operations | (3.59 | ) | 5.15 | 18.76 | (11.82 | ) | 3.13 | |||||||||||||||||||||||||||||||||
|
|
|
|
|
|
|
|
|
| |||||||||||||||||||||||||||||||
Distributions(c) | ||||||||||||||||||||||||||||||||||||||||
From net investment income | — | (3.37 | ) | (0.03 | ) | (0.23 | ) | (0.21 | ) | |||||||||||||||||||||||||||||||
From net realized gain | (1.59 | ) | — | — | — | — | ||||||||||||||||||||||||||||||||||
|
|
|
|
|
|
|
|
|
| |||||||||||||||||||||||||||||||
Total distributions | (1.59 | ) | (3.37 | ) | (0.03 | ) | (0.23 | ) | (0.21 | ) | ||||||||||||||||||||||||||||||
|
|
|
|
|
|
|
|
|
| |||||||||||||||||||||||||||||||
Net asset value, end of year | $ | 41.20 | $ | 46.38 | $ | 44.60 | $ | 25.87 | $ | 37.92 | ||||||||||||||||||||||||||||||
|
|
|
|
|
|
|
|
|
| |||||||||||||||||||||||||||||||
Total Return(d) | ||||||||||||||||||||||||||||||||||||||||
Based on net asset value | (7.92 | )% | 11.57 | % | 72.59 | % | (31.41 | )% | 9.04 | % | ||||||||||||||||||||||||||||||
|
|
|
|
|
|
|
|
|
| |||||||||||||||||||||||||||||||
Ratios to Average Net Assets(e) | ||||||||||||||||||||||||||||||||||||||||
Total expenses | 0.93 | %(f) | 0.89 | % | 0.90 | % | 0.93 | % | 0.94 | % | ||||||||||||||||||||||||||||||
|
|
|
|
|
|
|
|
|
| |||||||||||||||||||||||||||||||
Net investment income | 0.25 | % | 0.10 | % | 0.06 | % | 0.51 | % | 0.45 | % | ||||||||||||||||||||||||||||||
|
|
|
|
|
|
|
|
|
| |||||||||||||||||||||||||||||||
Supplemental Data | ||||||||||||||||||||||||||||||||||||||||
Net assets, end of year (000) | $ | 576,772 | $ | 663,228 | $ | 691,284 | $ | 483,841 | $ | 828,545 | ||||||||||||||||||||||||||||||
|
|
|
|
|
|
|
|
|
| |||||||||||||||||||||||||||||||
Portfolio turnover rate(g) | 108 | % | 12 | % | 8 | % | 26 | % | 24 | % | ||||||||||||||||||||||||||||||
|
|
|
|
|
|
|
|
|
| |||||||||||||||||||||||||||||||
| (a) | Based on average shares outstanding. |
| (b) | The amounts reported for a share outstanding may not accord with the change in aggregate gains and losses in securities for the fiscal period due to the timing of capital share transactions in relation to the fluctuating market values of the Fund’s underlying securities. |
| (c) | Distributions for annual periods determined in accordance with U.S. federal income tax regulations. |
| (d) | Where applicable, assumes the reinvestment of distributions. |
| (e) | Excludes fees and expenses incurred indirectly as a result of investments in underlying funds. |
| (f) | Includes non-recurring expense of Interest expense. Without this cost, total expenses would have been 0.89%. |
| (g) | Portfolio turnover rate excludes in-kind transactions. |
See notes to financial statements.
| 84 | 2 0 2 3 I SHARES ANNUAL REPORT TO SHAREHOLDERS |
Financial Highlights (continued)
(For a share outstanding throughout each period)
| iShares International Developed Property ETF | ||||||||||||||||||||||||||||||||||||||||
|
| |||||||||||||||||||||||||||||||||||||||
Year Ended 03/31/23 | Year Ended 03/31/22 | Year Ended 03/31/21 | Year Ended 03/31/20 | Year Ended 03/31/19 | ||||||||||||||||||||||||||||||||||||
| ||||||||||||||||||||||||||||||||||||||||
Net asset value, beginning of year | $ | 35.47 | $ | 36.25 | $ | 27.97 | $ | 38.79 | $ | 38.95 | ||||||||||||||||||||||||||||||
|
|
|
|
|
|
|
|
|
| |||||||||||||||||||||||||||||||
Net investment income(a) | 1.03 | (b) | 1.06 | (b) | 0.94 | 1.14 | 1.19 | |||||||||||||||||||||||||||||||||
Net realized and unrealized gain (loss)(c) | (8.99 | ) | (0.35 | ) | 8.19 | (9.31 | ) | 0.23 | ||||||||||||||||||||||||||||||||
|
|
|
|
|
|
|
|
|
| |||||||||||||||||||||||||||||||
Net increase (decrease) from investment operations | (7.96 | ) | 0.71 | 9.13 | (8.17 | ) | 1.42 | |||||||||||||||||||||||||||||||||
|
|
|
|
|
|
|
|
|
| |||||||||||||||||||||||||||||||
Distributions from net investment income(d) | (0.56 | ) | (1.49 | ) | (0.85 | ) | (2.65 | ) | (1.58 | ) | ||||||||||||||||||||||||||||||
|
|
|
|
|
|
|
|
|
| |||||||||||||||||||||||||||||||
Net asset value, end of year | $ | 26.95 | $ | 35.47 | $ | 36.25 | $ | 27.97 | $ | 38.79 | ||||||||||||||||||||||||||||||
|
|
|
|
|
|
|
|
|
| |||||||||||||||||||||||||||||||
Total Return(e) | ||||||||||||||||||||||||||||||||||||||||
Based on net asset value | (22.49 | )%(b) | 1.79 | %(b) | 32.96 | % | (22.52 | )% | 3.91 | % | ||||||||||||||||||||||||||||||
|
|
|
|
|
|
|
|
|
| |||||||||||||||||||||||||||||||
Ratios to Average Net Assets(f) | ||||||||||||||||||||||||||||||||||||||||
Total expenses | 0.48 | % | 0.49 | % | 0.48 | % | 0.48 | % | 0.48 | % | ||||||||||||||||||||||||||||||
|
|
|
|
|
|
|
|
|
| |||||||||||||||||||||||||||||||
Total expenses excluding professional fees for foreign withholding tax claims | 0.48 | % | 0.48 | % | N/A | N/A | N/A | |||||||||||||||||||||||||||||||||
|
|
|
|
|
|
|
|
|
| |||||||||||||||||||||||||||||||
Net investment income | 3.55 | %(b) | 2.82 | %(b) | 2.92 | % | 3.01 | % | 3.16 | % | ||||||||||||||||||||||||||||||
|
|
|
|
|
|
|
|
|
| |||||||||||||||||||||||||||||||
Supplemental Data | ||||||||||||||||||||||||||||||||||||||||
Net assets, end of year (000) | $ | 43,123 | $ | 63,846 | $ | 83,385 | $ | 78,329 | $ | 131,871 | ||||||||||||||||||||||||||||||
|
|
|
|
|
|
|
|
|
| |||||||||||||||||||||||||||||||
Portfolio turnover rate(g) | 6 | % | 12 | % | 16 | % | 8 | % | 9 | % | ||||||||||||||||||||||||||||||
|
|
|
|
|
|
|
|
|
| |||||||||||||||||||||||||||||||
| (a) | Based on average shares outstanding. |
| (b) | Reflects positive effect of foreign withholding tax claims, net of the associated professional fees, which resulted in the following increases for the years ended March 31, 2023 and March 31, 2022, respectively: |
• Net investment income per share by 0.01 and $0.04.
• Total return by 0.04% and 0.12%.
• Ratio of net investment income to average net assets by 0.04% and 0.09%.
| (c) | The amounts reported for a share outstanding may not accord with the change in aggregate gains and losses in securities for the fiscal period due to the timing of capital share transactions in relation to the fluctuating market values of the Fund’s underlying securities. |
| (d) | Distributions for annual periods determined in accordance with U.S. federal income tax regulations. |
| (e) | Where applicable, assumes the reinvestment of distributions. |
| (f) | Excludes fees and expenses incurred indirectly as a result of investments in underlying funds. |
| (g) | Portfolio turnover rate excludes in-kind transactions. |
See notes to financial statements.
FINANCIAL HIGHLIGHTS | 85 |
Financial Highlights (continued)
(For a share outstanding throughout each period)
iShares International Developed Small Cap Value Factor ETF | ||||||||||||||||||||||||
| Period From | ||||||||||||||||||||||||
| Year Ended |
| Year Ended | 03/23/21 | (a) | ||||||||||||||||||||
| 03/31/23 |
| 03/31/22 | to 03/31/21 | |||||||||||||||||||||
| ||||||||||||||||||||||||
Net asset value, beginning of period | $ | 34.20 | $ | 34.37 | $ | 34.52 | ||||||||||||||||||
|
|
|
|
|
| |||||||||||||||||||
Net investment income(b) | 1.09 | 1.59 | 0.16 | |||||||||||||||||||||
Net realized and unrealized loss(c) | (2.68 | ) | (0.74 | ) | (0.31 | ) | ||||||||||||||||||
|
|
|
|
|
| |||||||||||||||||||
Net increase (decrease) from investment operations | (1.59 | ) | 0.85 | (0.15 | ) | |||||||||||||||||||
|
|
|
|
|
| |||||||||||||||||||
Distributions from net investment income(d) | (1.01 | ) | (1.02 | ) | — | |||||||||||||||||||
|
|
|
|
|
| |||||||||||||||||||
Net asset value, end of period | $ | 31.60 | $ | 34.20 | $ | 34.37 | ||||||||||||||||||
|
|
|
|
|
| |||||||||||||||||||
Total Return(e) | ||||||||||||||||||||||||
Based on net asset value | (4.56 | )% | 2.42 | % | (0.43 | )%(f) | ||||||||||||||||||
|
|
|
|
|
| |||||||||||||||||||
Ratios to Average Net Assets(g) | ||||||||||||||||||||||||
Total expenses | 0.40 | % | 0.40 | % | 0.40 | %(h) | ||||||||||||||||||
|
|
|
|
|
| |||||||||||||||||||
Total expenses after fees waived | 0.30 | % | 0.30 | % | 0.30 | %(h) | ||||||||||||||||||
|
|
|
|
|
| |||||||||||||||||||
Net investment income | 3.59 | % | 4.55 | % | 17.96 | %(h) | ||||||||||||||||||
|
|
|
|
|
| |||||||||||||||||||
Supplemental Data | ||||||||||||||||||||||||
Net assets, end of period (000) | $ | 158,001 | $ | 164,181 | $ | 6,875 | ||||||||||||||||||
|
|
|
|
|
| |||||||||||||||||||
Portfolio turnover rate(i) | 18 | % | 35 | % | 0 | % | ||||||||||||||||||
|
|
|
|
|
| |||||||||||||||||||
| (a) | Commencement of operations. |
| (b) | Based on average shares outstanding. |
| (c) | The amounts reported for a share outstanding may not accord with the change in aggregate gains and losses in securities for the fiscal period due to the timing of capital share transactions in relation to the fluctuating market values of the Fund’s underlying securities. |
| (d) | Distributions for annual periods determined in accordance with U.S. federal income tax regulations. |
| (e) | Where applicable, assumes the reinvestment of distributions. |
| (f) | Not annualized. |
| (g) | Excludes fees and expenses incurred indirectly as a result of investments in underlying funds. |
| (h) | Annualized. |
| (i) | Portfolio turnover rate excludes in-kind transactions. |
See notes to financial statements.
| 86 | 2 0 2 3 I SHARES ANNUAL REPORT TO SHAREHOLDERS |
Financial Highlights (continued)
(For a share outstanding throughout each period)
| iShares International Dividend Growth ETF | ||||||||||||||||||||||||||||||||||||||||
|
| |||||||||||||||||||||||||||||||||||||||
Year Ended 03/31/23 | Year Ended 03/31/22 | Year Ended 03/31/21 | Year Ended 03/31/20 | Year Ended 03/31/19 | ||||||||||||||||||||||||||||||||||||
| ||||||||||||||||||||||||||||||||||||||||
Net asset value, beginning of period | $ | 65.02 | $ | 64.36 | $ | 45.51 | $ | 53.81 | $ | 56.40 | ||||||||||||||||||||||||||||||
|
|
|
|
|
|
|
|
|
| |||||||||||||||||||||||||||||||
Net investment income(a) | 1.67 | 1.74 | 1.53 | 1.56 | 1.51 | |||||||||||||||||||||||||||||||||||
Net realized and unrealized gain (loss)(b) | (4.77 | ) | 0.39 | 18.87 | (8.24 | ) | (2.58 | ) | ||||||||||||||||||||||||||||||||
|
|
|
|
|
|
|
|
|
| |||||||||||||||||||||||||||||||
Net increase (decrease) from investment operations | (3.10 | ) | 2.13 | 20.40 | (6.68 | ) | (1.07 | ) | ||||||||||||||||||||||||||||||||
|
|
|
|
|
|
|
|
|
| |||||||||||||||||||||||||||||||
Distributions from net investment income(c) | (1.47 | ) | (1.47 | ) | (1.55 | ) | (1.62 | ) | (1.52 | ) | ||||||||||||||||||||||||||||||
|
|
|
|
|
|
|
|
|
| |||||||||||||||||||||||||||||||
Net asset value, end of period | $ | 60.45 | $ | 65.02 | $ | 64.36 | $ | 45.51 | $ | 53.81 | ||||||||||||||||||||||||||||||
|
|
|
|
|
|
|
|
|
| |||||||||||||||||||||||||||||||
Total Return(d) | ||||||||||||||||||||||||||||||||||||||||
Based on net asset value | (4.60 | )% | 3.28 | % | 45.29 | % | (12.75 | )% | (1.88 | )% | ||||||||||||||||||||||||||||||
|
|
|
|
|
|
|
|
|
| |||||||||||||||||||||||||||||||
Ratios to Average Net Assets(e) | ||||||||||||||||||||||||||||||||||||||||
Total expenses | 0.15 | % | 0.15 | % | 0.19 | % | 0.22 | % | 0.22 | % | ||||||||||||||||||||||||||||||
|
|
|
|
|
|
|
|
|
| |||||||||||||||||||||||||||||||
Total expenses excluding professional fees for foreign withholding tax claims | 0.15 | % | N/A | N/A | N/A | N/A | ||||||||||||||||||||||||||||||||||
|
|
|
|
|
|
|
|
|
| |||||||||||||||||||||||||||||||
Net investment income | 2.89 | % | 2.60 | % | 2.66 | % | 2.81 | % | 2.80 | % | ||||||||||||||||||||||||||||||
|
|
|
|
|
|
|
|
|
| |||||||||||||||||||||||||||||||
Supplemental Data | ||||||||||||||||||||||||||||||||||||||||
Net assets, end of period (000) | $ | 595,420 | $ | 321,871 | $ | 189,855 | $ | 79,644 | $ | 75,329 | ||||||||||||||||||||||||||||||
|
|
|
|
|
|
|
|
|
| |||||||||||||||||||||||||||||||
Portfolio turnover rate(f) | 37 | % | 40 | % | 66 | % | 35 | % | 34 | % | ||||||||||||||||||||||||||||||
|
|
|
|
|
|
|
|
|
| |||||||||||||||||||||||||||||||
| (a) | Based on average shares outstanding. |
| (b) | The amounts reported for a share outstanding may not accord with the change in aggregate gains and losses in securities for the fiscal period due to the timing of capital share transactions in relation to the fluctuating market values of the Fund’s underlying securities. |
| (c) | Distributions for annual periods determined in accordance with U.S. federal income tax regulations. |
| (d) | Where applicable, assumes the reinvestment of distributions. |
| (e) | Excludes fees and expenses incurred indirectly as a result of investments in underlying funds. |
| (f) | Portfolio turnover rate excludes in-kind transactions. |
See notes to financial statements.
FINANCIAL HIGHLIGHTS | 87 |
Financial Highlights (continued)
(For a share outstanding throughout each period)
| iShares Latin America 40 ETF | ||||||||||||||||||||||||||||||||||||||||
|
| |||||||||||||||||||||||||||||||||||||||
Year Ended 03/31/23 | Year Ended 03/31/22 | Year Ended 03/31/21 | Year Ended 03/31/20 | Year Ended 03/31/19 | ||||||||||||||||||||||||||||||||||||
| ||||||||||||||||||||||||||||||||||||||||
Net asset value, beginning of year | $ | 30.36 | $ | 27.56 | $ | 18.34 | $ | 33.24 | $ | 37.28 | ||||||||||||||||||||||||||||||
|
|
|
|
|
|
|
|
|
| |||||||||||||||||||||||||||||||
Net investment income(a) | 2.69 | 1.70 | 0.68 | 0.98 | 0.88 | |||||||||||||||||||||||||||||||||||
Net realized and unrealized gain (loss)(b) | (6.26 | ) | 3.09 | 9.09 | (14.83 | ) | (3.96 | ) | ||||||||||||||||||||||||||||||||
|
|
|
|
|
|
|
|
|
| |||||||||||||||||||||||||||||||
Net increase (decrease) from investment operations | (3.57 | ) | 4.79 | 9.77 | (13.85 | ) | (3.08 | ) | ||||||||||||||||||||||||||||||||
|
|
|
|
|
|
|
|
|
| |||||||||||||||||||||||||||||||
Distributions from net investment income(c) | (2.91 | ) | (1.99 | ) | (0.55 | ) | (1.05 | ) | (0.96 | ) | ||||||||||||||||||||||||||||||
|
|
|
|
|
|
|
|
|
| |||||||||||||||||||||||||||||||
Net asset value, end of year | $ | 23.88 | $ | 30.36 | $ | 27.56 | $ | 18.34 | $ | 33.24 | ||||||||||||||||||||||||||||||
|
|
|
|
|
|
|
|
|
| |||||||||||||||||||||||||||||||
Total Return(d) | ||||||||||||||||||||||||||||||||||||||||
Based on net asset value | (11.29 | )% | 19.25 | % | 53.62 | % | (43.05 | )% | (7.93 | )% | ||||||||||||||||||||||||||||||
|
|
|
|
|
|
|
|
|
| |||||||||||||||||||||||||||||||
Ratios to Average Net Assets(e) | ||||||||||||||||||||||||||||||||||||||||
Total expenses | 0.48 | % | 0.47 | % | 0.48 | % | 0.48 | % | 0.48 | % | ||||||||||||||||||||||||||||||
|
|
|
|
|
|
|
|
|
| |||||||||||||||||||||||||||||||
Net investment income | 10.76 | % | 6.07 | % | 2.78 | % | 3.08 | % | 2.68 | % | ||||||||||||||||||||||||||||||
|
|
|
|
|
|
|
|
|
| |||||||||||||||||||||||||||||||
Supplemental Data | ||||||||||||||||||||||||||||||||||||||||
Net assets, end of year (000) | $ | 1,003,133 | $ | 1,738,190 | $ | 1,770,590 | $ | 797,877 | $ | 1,529,164 | ||||||||||||||||||||||||||||||
|
|
|
|
|
|
|
|
|
| |||||||||||||||||||||||||||||||
Portfolio turnover rate(f) | 24 | % | 27 | % | 20 | % | 22 | % | 20 | % | ||||||||||||||||||||||||||||||
|
|
|
|
|
|
|
|
|
| |||||||||||||||||||||||||||||||
| (a) | Based on average shares outstanding. |
| (b) | The amounts reported for a share outstanding may not accord with the change in aggregate gains and losses in securities for the fiscal period due to the timing of capital share transactions in relation to the fluctuating market values of the Fund’s underlying securities. |
| (c) | Distributions for annual periods determined in accordance with U.S. federal income tax regulations. |
| (d) | Where applicable, assumes the reinvestment of distributions. |
| (e) | Excludes fees and expenses incurred indirectly as a result of investments in underlying funds. |
| (f) | Portfolio turnover rate excludes in-kind transactions. |
See notes to financial statements.
| 88 | 2 0 2 3 I SHARES ANNUAL REPORT TO SHAREHOLDERS |
| 1. | ORGANIZATION |
iShares Trust (the “Trust”) is registered under the Investment Company Act of 1940, as amended (the “1940 Act”), as an open-end management investment company. The Trust is organized as a Delaware statutory trust and is authorized to have multiple series or portfolios.
These financial statements relate only to the following funds (each, a “Fund” and collectively, the “Funds”):
| iShares ETF | Diversification Classification | |||
Asia 50 | Non-diversified | |||
Blockchain and Tech | Non-diversified | |||
Emerging Markets Infrastructure | Non-diversified | |||
Europe | Diversified | |||
Future Metaverse Tech and Communications(a) | Non-diversified | |||
India 50 | Non-diversified | |||
International Developed Property | Diversified | |||
International Developed Small Cap Value Factor | Non-diversified | |||
International Dividend Growth | Diversified | |||
Latin America 40 | Non-diversified | |||
| (a) | The Fund commenced operations on February 14, 2023. |
Basis of Consolidation: The accompanying consolidated financial statements for the iShares India 50 ETF includes the accounts of its subsidiary in the Republic of Mauritius, which is a wholly-owned subsidiary of the Fund that invests in Indian securities. Through this investment structure, the Fund expects to obtain certain benefits under a current tax treaty between Mauritius and India.
Effective March 17, 2023, iShares India 50 ETF no longer invests in the Subsidiary. iShares India 50 ETF transferred all of the assets of iShares India 50 ETF’s wholly owned Mauritius Subsidiary to iShares India 50 ETF through on-exchange transactions in India. iShares India 50 ETF recognized a net realized gain of $348,861,864 as a result of this transaction. After the transfer, iShares India 50 ETF began making new investments in India directly. On March 29, 2023, iShares India 50 ETF’s Subsidiary was dissolved.
| 2. | SIGNIFICANT ACCOUNTING POLICIES |
The financial statements are prepared in conformity with accounting principles generally accepted in the United States of America (“U.S. GAAP”), which may require management to make estimates and assumptions that affect the reported amounts of assets and liabilities in the financial statements, disclosure of contingent assets and liabilities at the date of the financial statements and the reported amounts of increases and decreases in net assets from operations during the reporting period. Actual results could differ from those estimates. Each Fund is considered an investment company under U.S. GAAP and follows the accounting and reporting guidance applicable to investment companies. Below is a summary of significant accounting policies:
Investment Transactions and Income Recognition: For financial reporting purposes, investment transactions are recorded on the dates the transactions are executed. Realized gains and losses on investment transactions are determined using the specific identification method. Dividend income and capital gain distributions, if any, are recorded on the ex-dividend date. Non-cash dividends, if any, are recorded on the ex-dividend date at fair value. Dividends from foreign securities where the ex-dividend date may have passed are subsequently recorded when the Funds are informed of the ex-dividend date. Under the applicable foreign tax laws, a withholding tax at various rates may be imposed on capital gains, dividends and interest. Upon notification from issuers or as estimated by management, a portion of the dividend income received from a real estate investment trust may be redesignated as a reduction of cost of the related investment and/or realized gain. Interest income, including amortization and accretion of premiums and discounts on debt securities, is recognized daily on an accrual basis.
Foreign Currency Translation: Each Fund’s books and records are maintained in U.S. dollars. Securities and other assets and liabilities denominated in foreign currencies are translated into U.S. dollars using prevailing market rates as quoted by one or more data service providers. Purchases and sales of investments are recorded at the rates of exchange prevailing on the respective dates of such transactions. Generally, when the U.S. dollar rises in value against a foreign currency, the investments denominated in that currency will lose value; the opposite effect occurs if the U.S. dollar falls in relative value.
Each Fund does not isolate the effect of fluctuations in foreign exchange rates from the effect of fluctuations in the market prices of investments for financial reporting purposes. Accordingly, the effects of changes in exchange rates on investments are not segregated in the Statements of Operations from the effects of changes in market prices of those investments, but are included as a component of net realized and unrealized gain (loss) from investments. Each Fund reports realized currency gains (losses) on foreign currency related transactions as components of net realized gain (loss) for financial reporting purposes, whereas such components are generally treated as ordinary income for U.S. federal income tax purposes.
Foreign Taxes: The Funds may be subject to foreign taxes (a portion of which may be reclaimable) on income, stock dividends, capital gains on investments, or certain foreign currency transactions. All foreign taxes are recorded in accordance with the applicable foreign tax regulations and rates that exist in the foreign jurisdictions in which each Fund invests. These foreign taxes, if any, are paid by each Fund and are reflected in its Statements of Operations as follows: foreign taxes withheld at source are presented as a reduction of income, foreign taxes on securities lending income are presented as a reduction of securities lending income, foreign taxes on stock dividends are presented as “Other foreign taxes”, and foreign taxes on capital gains from sales of investments and foreign taxes on foreign currency transactions are included in their respective net realized gain (loss) categories. Foreign taxes payable or deferred as of March 31, 2023, if any, are disclosed in the Statements of Assets and Liabilities.
NOTES TO FINANCIAL STATEMENTS | 89 |
Notes to Financial Statements (continued)
The Funds file withholding tax reclaims in certain jurisdictions to recover a portion of amounts previously withheld. The Funds may record a reclaim receivable based on collectability, which includes factors such as the jurisdiction’s applicable laws, payment history and market convention. The Statements of Operations includes tax reclaims recorded as well as professional and other fees, if any, associated with recovery of foreign withholding taxes.
The iShares India 50 ETF has conducted investment activities in India through its Subsidiary and, where applicable, expects to obtain benefits under the Double Tax Avoidance Agreement (“DTAA”) between India and Mauritius. In order to be eligible to claim benefits under the DTAA, the Subsidiary must have commercial substance, on an annual basis, to satisfy certain tests and conditions, including the establishment and maintenance of valid tax residence in Mauritius, have the place of effective management outside of India, and related requirements. The Fund has obtained a current tax residence certificate issued by the Mauritian Revenue Authorities.
Based upon current interpretation and practice of the current tax laws in India and Mauritius and the DTAA, the Subsidiary is subject to tax in Mauritius on its net income at the rate of 15%. However, the Subsidiary is entitled to a tax credit equivalent to the higher of the actual foreign tax incurred or 80% of the Mauritius tax on its foreign source income, thus reducing its maximum effective tax rate to 3% up to June 30, 2021. After June 30, 2021, under the new tax regime and subject to meeting the necessary substance requirements as required under the Financial Services Act 2007 (as amended by the Finance Act 2018) and such guidelines issued by the Financial Services Commission (the “FSC”), the Subsidiary is entitled to either (a) a foreign tax credit equivalent to the actual foreign tax suffered on its foreign income against the Subsidiary’s tax liability computed at 15% on such income, or (b) a partial exemption of 80% of some of the income derived, including interest income or foreign source dividends. Taxes on income, if any, are paid by the Subsidiary and are disclosed in its Consolidated Statements of Operations. Any dividends paid by a Subsidiary to its Fund are not subject to tax in Mauritius. The Subsidiary is currently exempt from tax in Mauritius on any gains from the sale of securities.
The DTAA provides that capital gains will be taxable in India with respect to the sale of shares acquired on or after April 1, 2017. Capital gains arising from shares acquired before April 1, 2017, regardless of when they are sold, will continue to be exempt from taxation under the amended DTAA, assuming requirements for eligibility under the DTAA are satisfied. There can be no assurance, however, that the DTAA will remain in effect during the Subsidiary’s existence or that it will continue to enjoy its benefits on the shares acquired prior to April 1, 2017.
Collateralization: If required by an exchange or counterparty agreement, the Funds may be required to deliver/deposit cash and/or securities to/with an exchange, or broker-dealer or custodian as collateral for certain investments.
In-kind Redemptions: For financial reporting purposes, in-kind redemptions are treated as sales of securities resulting in realized capital gains or losses to the Funds. Because such gains or losses are not taxable to the Funds and are not distributed to existing Fund shareholders, the gains or losses are reclassified from accumulated net realized gain (loss) to paid-in capital at the end of the Funds’ tax year. These reclassifications have no effect on net assets or net asset value (“NAV”) per share.
Distributions: Dividends and distributions paid by each Fund are recorded on the ex-dividend dates. Distributions are determined on a tax basis and may differ from net investment income and net realized capital gains for financial reporting purposes. Dividends and distributions are paid in U.S. dollars and cannot be automatically reinvested in additional shares of the Funds. The character and timing of distributions are determined in accordance with U.S. federal income tax regulations, which may differ from U.S. GAAP.
Indemnifications: In the normal course of business, each Fund enters into contracts that contain a variety of representations that provide general indemnification. The Funds’ maximum exposure under these arrangements is unknown because it involves future potential claims against the Funds, which cannot be predicted with any certainty.
| 3. | INVESTMENT VALUATION AND FAIR VALUE MEASUREMENTS |
Investment Valuation Policies: Each Fund’s investments are valued at fair value (also referred to as “market value” within the financial statements) each day that the Fund’s listing exchange is open and, for financial reporting purposes, as of the report date. U.S. GAAP defines fair value as the price a fund would receive to sell an asset or pay to transfer a liability in an orderly transaction between market participants at the measurement date. The Board of Trustees of the Trust (the “Board”) of each Fund has approved the designation of BlackRock Fund Advisors (“BFA”), the Funds’ investment adviser, as the valuation designee for each Fund. Each Fund determines the fair values of its financial instruments using various independent dealers or pricing services under BFA’s policies. If a security’s market price is not readily available or does not otherwise accurately represent the fair value of the security, the security will be valued in accordance with BFA’s policies and procedures as reflecting fair value. BFA has formed a committee (the “Valuation Committee”) to develop pricing policies and procedures and to oversee the pricing function for all financial instruments, with assistance from other BlackRock pricing committees.
Fair Value Inputs and Methodologies: The following methods and inputs are used to establish the fair value of each Fund’s assets and liabilities:
| • | Equity investments traded on a recognized securities exchange are valued at that day’s official closing price, as applicable, on the exchange where the stock is primarily traded. Equity investments traded on a recognized exchange for which there were no sales on that day are valued at the last traded price. |
| • | Investments in open-end U.S. mutual funds (including money market funds) are valued at that day’s published NAV. |
| • | Futures contracts are valued based on that day’s last reported settlement or trade price on the exchange where the contract is traded. |
| 90 | 2 0 2 3 I SHARES ANNUAL REPORT TO SHAREHOLDERS |
Notes to Financial Statements (continued)
Generally, trading in foreign instruments is substantially completed each day at various times prior to the close of trading on the New York Stock Exchange (“NYSE”). Each business day, the Funds use current market factors supplied by independent pricing services to value certain foreign instruments (“Systematic Fair Value Price”). The Systematic Fair Value Price is designed to value such foreign securities at fair value as of the close of trading on the NYSE, which follows the close of the local markets.
If events (e.g., market volatility, company announcement or a natural disaster) occur that are expected to materially affect the value of such investment, or in the event that application of these methods of valuation results in a price for an investment that is deemed not to be representative of the market value of such investment, or if a price is not available, the investment will be valued by the Valuation Committee, in accordance with BFA’s policies and procedures as reflecting fair value (“Fair Valued Investments”). The fair valuation approaches that may be used by the Valuation Committee include market approach, income approach and cost approach. Valuation techniques such as discounted cash flow, use of market comparables and matrix pricing are types of valuation approaches and are typically used in determining fair value. When determining the price for Fair Valued Investments, the Valuation Committee seeks to determine the price that each Fund might reasonably expect to receive or pay from the current sale or purchase of that asset or liability in an arm’s-length transaction. Fair value determinations shall be based upon all available factors that the Valuation Committee deems relevant and consistent with the principles of fair value measurement.
Fair value pricing could result in a difference between the prices used to calculate a fund’s NAV and the prices used by the fund’s underlying index, which in turn could result in a difference between the fund’s performance and the performance of the fund’s underlying index.
Fair Value Hierarchy: Various inputs are used in determining the fair value of financial instruments. These inputs to valuation techniques are categorized into a fair value hierarchy consisting of three broad levels for financial reporting purposes as follows:
| • | Level 1 – Unadjusted price quotations in active markets/exchanges for identical assets or liabilities that each Fund has the ability to access; |
| • | Level 2 – Other observable inputs (including, but not limited to, quoted prices for similar assets or liabilities in markets that are active, quoted prices for identical or similar assets or liabilities in markets that are not active, inputs other than quoted prices that are observable for the assets or liabilities (such as interest rates, yield curves, volatilities, prepayment speeds, loss severities, credit risks and default rates) or other market-corroborated inputs); and |
| • | Level 3 – Unobservable inputs based on the best information available in the circumstances, to the extent observable inputs are not available, (including the Valuation Committee’s assumptions used in determining the fair value of financial instruments). |
The hierarchy gives the highest priority to unadjusted quoted prices in active markets for identical assets or liabilities (Level 1 measurements) and the lowest priority to unobservable inputs (Level 3 measurements). Accordingly, the degree of judgment exercised in determining fair value is greatest for instruments categorized in Level 3. The inputs used to measure fair value may fall into different levels of the fair value hierarchy. In such cases, for disclosure purposes, the fair value hierarchy classification is determined based on the lowest level input that is significant to the fair value measurement in its entirety. Investments classified within Level 3 have significant unobservable inputs used by the Valuation Committee in determining the price for Fair Valued Investments. Level 3 investments include equity or debt issued by privately held companies or funds that may not have a secondary market and/or may have a limited number of investors. The categorization of a value determined for financial instruments is based on the pricing transparency of the financial instruments and is not necessarily an indication of the risks associated with investing in those securities.
| 4. | SECURITIES AND OTHER INVESTMENTS |
Securities Lending: Each Fund may lend its securities to approved borrowers, such as brokers, dealers and other financial institutions. The borrower pledges and maintains with the Fund collateral consisting of cash, an irrevocable letter of credit issued by an approved bank, or securities issued or guaranteed by the U.S. government. The initial collateral received by each Fund is required to have a value of at least 102% of the current market value of the loaned securities for securities traded on U.S. exchanges and a value of at least 105% for all other securities. The collateral is maintained thereafter at a value equal to at least 100% of the current value of the securities on loan. The market value of the loaned securities is determined at the close of each business day of the Fund and any additional required collateral is delivered to the Fund or excess collateral is returned by the Fund, on the next business day. During the term of the loan, each Fund is entitled to all distributions made on or in respect of the loaned securities but does not receive interest income on securities received as collateral. Loans of securities are terminable at any time and the borrower, after notice, is required to return borrowed securities within the standard time period for settlement of securities transactions.
As of period end, any securities on loan were collateralized by cash and/or U.S. Government obligations. Cash collateral invested in money market funds managed by BFA, or its affiliates is disclosed in the Schedule of Investments. Any non-cash collateral received cannot be sold, re-invested or pledged by the Fund, except in the event of borrower default. The securities on loan, if any, are also disclosed in each Fund’s Schedule of Investments. The market value of any securities on loan and the value of any related cash collateral are disclosed in the Statements of Assets and Liabilities.
Securities lending transactions are entered into by the Funds under Master Securities Lending Agreements (each, an “MSLA”) which provide the right, in the event of default (including bankruptcy or insolvency) for the non-defaulting party to liquidate the collateral and calculate a net exposure to the defaulting party or request additional collateral. In the event that a borrower defaults, the Funds, as lender, would offset the market value of the collateral received against the market value of the securities loaned. When the value of the collateral is greater than that of the market value of the securities loaned, the lender is left with a net amount payable to the defaulting party. However, bankruptcy or insolvency laws of a particular jurisdiction may impose restrictions on or prohibitions against such a right of offset in the event of an MSLA counterparty’s bankruptcy or insolvency. Under the MSLA, absent an event of default, the borrower can resell or re-pledge the loaned securities, and the Funds can reinvest cash collateral received in connection with loaned securities. Upon an event of default, the parties’ obligations to return the securities or collateral to the other party are extinguished, and the parties can resell or re-pledge the loaned securities or the collateral received in connection with the loaned securities in order to satisfy the defaulting party’s net payment obligation for all transactions under the MSLA. The defaulting party remains liable for any deficiency.
NOTES TO FINANCIAL STATEMENTS | 91 |
Notes to Financial Statements (continued)
As of period end, the following table is a summary of the securities on loan by counterparty which are subject to offset under an MSLA:
| ||||||||||||||||
| iShares ETF and Counterparty | | Securities Loaned at Value |
| | Cash Collateral Received | (a) | | Non-Cash Collateral Received, at Fair Value | (a) | Net Amount | ||||||
| ||||||||||||||||
Blockchain and Tech | ||||||||||||||||
BNP Paribas SA | $ | 17,159 | $ | (16,715 | ) | $ | — | $ | 444 | (b) | ||||||
BofA Securities, Inc. | 236,765 | (221,690 | ) | — | 15,075 | (b) | ||||||||||
J.P. Morgan Securities LLC | 441,733 | (441,733 | ) | — | — | |||||||||||
Jefferies LLC | 862,236 | (859,192 | ) | — | 3,044 | (b) | ||||||||||
UBS AG | 745,210 | (705,881 | ) | — | 39,329 | (b) | ||||||||||
|
|
|
|
|
|
|
| |||||||||
| $ | 2,303,103 | $ | (2,245,211 | ) | $ | — | $ | 57,892 | ||||||||
|
|
|
|
|
|
|
| |||||||||
Emerging Markets Infrastructure | ||||||||||||||||
Barclays Bank PLC | $ | 349,082 | $ | (349,082 | ) | $ | — | $ | — | |||||||
HSBC Bank PLC | 517,026 | (517,026 | ) | — | — | |||||||||||
|
|
|
|
|
|
|
| |||||||||
| $ | 866,108 | $ | (866,108 | ) | $ | — | $ | — | ||||||||
|
|
|
|
|
|
|
| |||||||||
Europe | ||||||||||||||||
BNP Paribas SA | $ | 273,441 | $ | (273,441 | ) | $ | — | $ | — | |||||||
BofA Securities, Inc. | 46,634 | (46,634 | ) | — | — | |||||||||||
Citigroup Global Markets, Inc. | 240,627 | (240,627 | ) | — | — | |||||||||||
Goldman Sachs & Co. LLC | 689,403 | (689,403 | ) | — | — | |||||||||||
HSBC Bank PLC | 1,611,173 | (1,611,173 | ) | — | — | |||||||||||
J.P. Morgan Securities LLC | 582,881 | (582,881 | ) | — | — | |||||||||||
UBS Securities LLC | 141,812 | (141,812 | ) | — | — | |||||||||||
|
|
|
|
|
|
|
| |||||||||
| $ | 3,585,971 | $ | (3,585,971 | ) | $ | — | $ | — | ||||||||
|
|
|
|
|
|
|
| |||||||||
International Developed Property | ||||||||||||||||
Barclays Capital, Inc. | $ | 15,842 | $ | (15,842 | ) | $ | — | $ | — | |||||||
BofA Securities, Inc. | 14,193 | (14,193 | ) | — | — | |||||||||||
Citigroup Global Markets, Inc. | 75,464 | (75,464 | ) | — | — | |||||||||||
Goldman Sachs & Co. LLC | 106,089 | (106,089 | ) | — | — | |||||||||||
HSBC Bank PLC | 18,808 | (18,808 | ) | — | — | |||||||||||
J.P. Morgan Securities LLC | 11,944 | (11,944 | ) | — | — | |||||||||||
Morgan Stanley & Co. LLC | 329,327 | (329,327 | ) | — | — | |||||||||||
SG Americas Securities LLC | 221,500 | (221,500 | ) | — | — | |||||||||||
UBS AG | 8,917 | (8,917 | ) | — | — | |||||||||||
|
|
|
|
|
|
|
| |||||||||
| $ | 802,084 | $ | (802,084 | ) | $ | — | $ | — | ||||||||
|
|
|
|
|
|
|
| |||||||||
International Developed Small Cap Value Factor | ||||||||||||||||
Barclays Capital, Inc. | $ | 418,349 | $ | (418,349 | ) | $ | — | $ | — | |||||||
BNP Paribas SA | 55,680 | (55,680 | ) | — | — | |||||||||||
BofA Securities, Inc. | 581,663 | (581,663 | ) | — | — | |||||||||||
Credit Suisse Securities (USA) LLC | 3,451 | (3,451 | ) | — | — | |||||||||||
Goldman Sachs & Co. LLC | 2,962 | (2,962 | ) | — | — | |||||||||||
HSBC Bank PLC | 257,386 | (257,386 | ) | — | — | |||||||||||
J.P. Morgan Securities LLC | 350,702 | (350,702 | ) | — | — | |||||||||||
UBS AG | 367,314 | (367,314 | ) | — | — | |||||||||||
|
|
|
|
|
|
|
| |||||||||
| $ | 2,037,507 | $ | (2,037,507 | ) | $ | — | $ | — | ||||||||
|
|
|
|
|
|
|
| |||||||||
International Dividend Growth | ||||||||||||||||
Goldman Sachs & Co. LLC | $ | 1,453,575 | $ | (1,453,575 | ) | $ | — | $ | — | |||||||
J.P. Morgan Securities LLC | 942,906 | (942,906 | ) | — | — | |||||||||||
Morgan Stanley | 72,253 | (72,253 | ) | — | — | |||||||||||
|
|
|
|
|
|
|
| |||||||||
| $ | 2,468,734 | $ | (2,468,734 | ) | $ | — | $ | — | ||||||||
|
|
|
|
|
|
|
| |||||||||
Latin America 40 | ||||||||||||||||
Citigroup Global Markets, Inc. | $ | 20,029,359 | $ | (20,029,359 | ) | $ | — | $ | — | |||||||
National Financial Services LLC | 7,708,806 | (7,708,806 | ) | — | — | |||||||||||
|
|
|
|
|
|
|
| |||||||||
| $ | 27,738,165 | $ | (27,738,165 | ) | $ | — | $ | — | ||||||||
|
|
|
|
|
|
|
| |||||||||
| (a) | Collateral received, if any, in excess of the market value of securities on loan is not presented in this table. The total cash collateral received by each Fund is disclosed in the Fund’s Statements of Assets and Liabilities. |
| (b) | The market value of the loaned securities is determined as of March 31, 2023. Additional collateral is delivered to the Fund on the next business day in accordance with the MSLA. The net amount would be subject to the borrower default indemnity in the event of default by a counterparty. |
| 92 | 2 0 2 3 I SHARES ANNUAL REPORT TO SHAREHOLDERS |
Notes to Financial Statements (continued)
The risks of securities lending include the risk that the borrower may not provide additional collateral when required or may not return the securities when due. To mitigate these risks, each Fund benefits from a borrower default indemnity provided by BlackRock, Inc. (“BlackRock”). BlackRock’s indemnity allows for full replacement of the securities loaned to the extent the collateral received does not cover the value of the securities loaned in the event of borrower default. Each Fund could incur a loss if the value of an investment purchased with cash collateral falls below the market value of the loaned securities or if the value of an investment purchased with cash collateral falls below the value of the original cash collateral received. Such losses are borne entirely by each Fund.
| 5. | DERIVATIVE FINANCIAL INSTRUMENTS |
Futures Contracts: Futures contracts are purchased or sold to gain exposure to, or manage exposure to, changes in interest rates (interest rate risk) and changes in the value of equity securities (equity risk) or foreign currencies (foreign currency exchange rate risk).
Futures contracts are exchange-traded agreements between the Funds and a counterparty to buy or sell a specific quantity of an underlying instrument at a specified price and on a specified date. Depending on the terms of a contract, it is settled either through physical delivery of the underlying instrument on the settlement date or by payment of a cash amount on the settlement date. Upon entering into a futures contract, the Funds are required to deposit initial margin with the broker in the form of cash or securities in an amount that varies depending on a contract’s size and risk profile. The initial margin deposit must then be maintained at an established level over the life of the contract. Amounts pledged, which are considered restricted, are included in cash pledged for futures contracts in the Statements of Assets and Liabilities.
Securities deposited as initial margin are designated in the Schedule of Investments and cash deposited, if any, are shown as cash pledged for futures contracts in the Statements of Assets and Liabilities. Pursuant to the contract, the Funds agree to receive from or pay to the broker an amount of cash equal to the daily fluctuation in market value of the contract (“variation margin”). Variation margin is recorded as unrealized appreciation (depreciation) and, if any, shown as variation margin receivable (or payable) on futures contracts in the Statements of Assets and Liabilities. When the contract is closed, a realized gain or loss is recorded in the Statements of Operations equal to the difference between the notional amount of the contract at the time it was opened and the notional amount at the time it was closed. The use of futures contracts involves the risk of an imperfect correlation in the movements in the price of futures contracts and interest rates, foreign currency exchange rates or underlying assets.
| 6. | INVESTMENT ADVISORY AGREEMENT AND OTHER TRANSACTIONS WITH AFFILIATES |
Investment Advisory Fees: Pursuant to an Investment Advisory Agreement with the Trust, BFA manages the investment of each Fund’s assets. BFA is a California corporation indirectly owned by BlackRock. Under the Investment Advisory Agreement, BFA is responsible for substantially all expenses of the Funds, except (i) interest and taxes; (ii) brokerage commissions and other expenses connected with the execution of portfolio transactions; (iii) distribution fees; (iv) the advisory fee payable to BFA; and (v) litigation expenses and any extraordinary expenses (in each case as determined by a majority of the independent trustees).
For its investment advisory services to each of the following Funds, BFA is entitled to an annual investment advisory fee, accrued daily and paid monthly by the Funds, based on the average daily net assets of each Fund as follows:
| iShares ETF | Investment Advisory Fees | |||
Asia 50 | 0.50% | |||
Blockchain and Tech | 0.47 | |||
Emerging Markets Infrastructure | 0.60 | |||
Future Metaverse Tech and Communications | 0.47 | |||
India 50 | 0.89 | |||
International Developed Property | 0.48 | |||
International Developed Small Cap Value Factor | 0.40 | |||
International Dividend Growth | 0.15 | |||
For its investment advisory services to the iShares Europe ETF, BFA is entitled to an annual investment advisory fee, accrued daily and paid monthly by the Fund, based on the Fund’s allocable portion of the aggregate of the average daily net assets of the Fund and certain other iShares funds, as follows:
| Aggregate Average Daily Net Assets | Investment Advisory Fees | |||
First $12 billion | 0.6000% | |||
Over $12 billion, up to and including $18 billion | 0.5700 | |||
Over $18 billion, up to and including $24 billion | 0.5415 | |||
Over $24 billion, up to and including $30 billion | 0.5145 | |||
Over $30 billion | 0.4888 | |||
NOTES TO FINANCIAL STATEMENTS | 93 |
Notes to Financial Statements (continued)
For its investment advisory services to the iShares Latin America 40 ETF, BFA is entitled to an annual investment advisory fee, accrued daily and paid monthly by the Fund, based on the Fund’s allocable portion of the aggregate of the average daily net assets of the Fund and certain other iShares funds, as follows:
| Aggregate Average Daily Net Assets | Investment Advisory Fees | |||
First $46 billion | 0.5000 | % | ||
Over $46 billion, up to and including $81 billion | 0.4750 | |||
Over $81 billion, up to and including $111 billion | 0.4513 | |||
Over $111 billion, up to and including $141 billion | 0.4287 | |||
Over $141 billion, up to and including $171 billion | 0.4073 | |||
Over $171 billion | 0.3869 | |||
The Subsidiary has entered into a separate contract with BFA under which BFA provides investment advisory services to the Subsidiary but does not receive separate compensation from the Subsidiary for providing it with such services. The Subsidiary has also entered into separate arrangements that provide for the provision of other services to the Subsidiary (including administrative, custody, transfer agency and other services), and BFA pays the costs and expenses related to the provision of those services.
Expense Waivers: A fund may incur its pro rata share of fees and expenses attributable to its investments in other investment companies (“acquired fund fees and expenses”). The total of the investment advisory fee and acquired fund fees and expenses, if any, is a fund’s total annual operating expenses. Total expenses as shown in the Statements of Operations does not include acquired fund fees and expenses.
For the iShares Emerging Markets Infrastructure ETF, BFA has contractually agreed to waive a portion of its investment advisory fee for the Fund through July 31, 2027 in an amount equal to the acquired fund fees and expenses, if any, attributable to the Fund’s investments in other iShares funds. For the iShares International Developed Small Cap Value Factor ETF, BFA has contractually agreed to waive a portion of its investment advisory fee through July 31, 2024 in order to limit the Fund’s total annual operating expenses after fee waiver to 0.30% of average daily net assets.
These amounts are included in investment advisory fees waived in the Statements of Operations. For the year ended March 31, 2023, the amounts waived in investment advisory fees pursuant to these arrangements were as follows:
| iShares ETF | Amounts Waived | |||
International Developed Small Cap Value Factor | $ | 147,162 | ||
Distributor: BlackRock Investments, LLC, an affiliate of BFA, is the distributor for each Fund. Pursuant to the distribution agreement, BFA is responsible for any fees or expenses for distribution services provided to the Funds.
Securities Lending: The U.S. Securities and Exchange Commission (the “SEC”) has issued an exemptive order which permits BlackRock Institutional Trust Company, N.A. (“BTC”), an affiliate of BFA, to serve as securities lending agent for the Funds, subject to applicable conditions. As securities lending agent, BTC bears all operational costs directly related to securities lending, including any custodial costs. Each Fund is responsible for fees in connection with the investment of cash collateral received for securities on loan (the “collateral investment fees”). The cash collateral is invested in a money market fund, BlackRock Cash Funds: Institutional or BlackRock Cash Funds: Treasury, managed by BFA, or its affiliates. However, BTC has agreed to reduce the amount of securities lending income it receives in order to effectively limit the collateral investment fees each Fund bears to an annual rate of 0.04%. The SL Agency Shares of such money market fund will not be subject to a sales load, distribution fee or service fee. The money market fund in which the cash collateral has been invested may, under certain circumstances, impose a liquidity fee of up to 2% of the value redeemed or temporarily restrict redemptions for up to 10 business days during a 90 day period, in the event that the money market fund’s weekly liquid assets fall below certain thresholds.
Securities lending income is equal to the total of income earned from the reinvestment of cash collateral, net of fees and other payments to and from borrowers of securities, and less the collateral investment fees. Each Fund retains a portion of securities lending income and remits the remaining portion to BTC as compensation for its services as securities lending agent.
Pursuant to the current securities lending agreement, the iShares Blockchain and Tech ETF (the “Group 1 Funds”), retains 81% of securities lending income (which excludes collateral investment fees) and the amount retained can never be less than 70% of the total of securities lending income plus the collateral investment fees.
Pursuant to the current securities lending agreement, each of iShares Asia 50 ETF, iShares Emerging Markets Infrastructure ETF, iShares Europe ETF, iShares Future Metaverse Tech and Communications ETF, iShares India 50 ETF, iShares International Developed Property ETF, iShares International Developed Small Cap Value Factor ETF, iShares International Dividend Growth ETF and iShares Latin America 40 ETF (the “Group 2 Funds”), retains 82% of securities lending income (which excludes collateral investment fees) and the amount retained can never be less than 70% of the total of securities lending income plus the collateral investment fees.
In addition, commencing the business day following the date that the aggregate securities lending income plus the collateral investment fees generated across all 1940 Act iShares exchange-traded funds (the “iShares ETF Complex”) in a given calendar year exceeds a specified threshold: (1) the Group 1 Fund, pursuant to the securities lending agreement, will retain for the remainder of that calendar year 81% of securities lending income (which excludes collateral investment fees), and the amount retained can never be less than 70% of the total of securities lending income plus the collateral investment fees, and (2) each Group 2 Fund will retain for the remainder of that calendar year 85% of securities lending income (which excludes collateral investment fees), and the amount retained can never be less than 70% of the total of securities lending income plus the collateral investment fees.
| 94 | 2 0 2 3 I SHARES ANNUAL REPORT TO SHAREHOLDERS |
Notes to Financial Statements (continued)
The share of securities lending income earned by each Fund is shown as securities lending income – affiliated – net in its Statements of Operations. For the year ended March 31, 2023, the Funds paid BTC the following amounts for securities lending agent services:
| iShares ETF | Amounts | |||
Asia 50 | $ | 3,366 | ||
Blockchain and Tech | 19,925 | |||
Emerging Markets Infrastructure | 3,630 | |||
Europe | 19,638 | |||
International Developed Property | 5,447 | |||
International Developed Small Cap Value Factor | 6,233 | |||
International Dividend Growth | 1,052 | |||
Latin America 40 | 37,558 | |||
Officers and Trustees: Certain officers and/or trustees of the Trust are officers and/or trustees of BlackRock or its affiliates.
Other Transactions: Cross trading is the buying or selling of portfolio securities between funds to which BFA (or an affiliate) serves as investment adviser. At its regularly scheduled quarterly meetings, the Board reviews such transactions as of the most recent calendar quarter for compliance with the requirements and restrictions set forth by Rule 17a-7.
For the year ended March 31, 2023, transactions executed by the Funds pursuant to Rule 17a-7 under the 1940 Act were as follows:
| iShares ETF | Purchases | Sales | Net Realized Gain (Loss) | |||||||||
Asia 50 | $ | 10,674,870 | $ | 8,965,990 | $ | (8,430,634 | ) | |||||
Emerging Markets Infrastructure | 43,929 | 437,039 | (916,303 | ) | ||||||||
Europe | 6,095,333 | 1,799,847 | (1,123,289 | ) | ||||||||
International Developed Property | 2,826 | 64,494 | (45,601 | ) | ||||||||
International Developed Small Cap Value Factor | 1,475,581 | 7,220,023 | 505,819 | |||||||||
International Dividend Growth | 17,284,480 | 8,921,301 | (1,467,285 | ) | ||||||||
Latin America 40 | 482,525 | 1,405,640 | (936,779 | ) | ||||||||
Each Fund may invest its positive cash balances in certain money market funds managed by BFA or an affiliate. The income earned on these temporary cash investments is shown as dividends – affiliated in the Statements of Operations.
A fund, in order to improve its portfolio liquidity and its ability to track its underlying index, may invest in shares of other iShares funds that invest in securities in the fund’s underlying index.
| 7. | PURCHASES AND SALES |
For the year ended March 31, 2023, purchases and sales of investments, excluding short-term securities and in-kind transactions, were as follows:
| iShares ETF | Purchases | Sales | ||||||
Asia 50 | $ | 323,736,679 | $ | 188,518,620 | ||||
Blockchain and Tech | 5,405,035 | 4,754,454 | ||||||
Emerging Markets Infrastructure | 7,900,196 | 5,529,679 | ||||||
Europe | 96,798,817 | 88,305,642 | ||||||
Future Metaverse Tech and Communications | 545,114 | 358,055 | ||||||
India 50 | 639,134,509 | 671,030,490 | ||||||
International Developed Property | 3,680,302 | 2,961,170 | ||||||
International Developed Small Cap Value Factor | 28,230,927 | 26,598,180 | ||||||
International Dividend Growth | 202,329,066 | 159,414,575 | ||||||
Latin America 40 | 276,348,245 | 370,456,208 | ||||||
NOTES TO FINANCIAL STATEMENTS | 95 |
Notes to Financial Statements (continued)
For the year ended March 31, 2023, in-kind transactions were as follows:
| iShares ETF | In-kind Purchases | In-kind Sales | ||||||
Asia 50 | $ | 12,272,331 | $ | 144,395,498 | ||||
Blockchain and Tech | 8,349,861 | — | ||||||
Emerging Markets Infrastructure | 1,914,839 | 1,029,160 | ||||||
Europe | 255,100,997 | 358,964,403 | ||||||
Future Metaverse Tech and Communications | 4,909,528 | — | ||||||
International Developed Property | — | 5,623,202 | ||||||
International Developed Small Cap Value Factor | 5,630,276 | — | ||||||
International Dividend Growth | 244,214,743 | — | ||||||
Latin America 40 | 278,037,013 | 534,657,996 | ||||||
| 8. | INCOME TAX INFORMATION |
Each Fund is treated as an entity separate from the Trust’s other funds for federal income tax purposes. It is each Fund’s policy to comply with the requirements of the Internal Revenue Code of 1986, as amended, applicable to regulated investment companies, and to distribute substantially all of its taxable income to its shareholders. Therefore, no U.S. federal income tax provision is required.
Management has analyzed tax laws and regulations and their application to the Funds as of March 31, 2023, inclusive of the open tax return years, and does not believe that there are any uncertain tax positions that require recognition of a tax liability in the Funds’ financial statements.
U.S. GAAP requires that certain components of net assets be adjusted to reflect permanent differences between financial and tax reporting. These reclassifications have no effect on net assets or NAV per share. As of March 31, 2023, permanent differences attributable to net investment loss, distributions paid in excess of taxable income and realized gains (losses) from in-kind redemptions were reclassified to the following accounts:
| iShares ETF | Paid-in Capital | Accumulated Earnings (Loss) | ||||||
Asia 50 | $ | (39,330,520 | ) | $ | 39,330,520 | |||
Emerging Markets Infrastructure | 285,243 | (285,243 | ) | |||||
Europe | 78,391,052 | (78,391,052 | ) | |||||
India 50 | (36,875,144 | ) | 36,875,144 | |||||
International Developed Property | (1,628,297 | ) | 1,628,297 | |||||
Latin America 40 | (18,256,533 | ) | 18,256,533 | |||||
The tax character of distributions paid was as follows:
| ||||||||
| iShares ETF | Year Ended 03/31/23 | Year Ended 03/31/22 | ||||||
| ||||||||
Asia 50 | ||||||||
Ordinary income | $ | 36,273,723 | $ | 35,774,281 | ||||
|
|
|
| |||||
| ||||||||
| ||||||||
| iShares ETF | Period Ended 03/31/23 | |||||||
| ||||||||
Blockchain and Tech | ||||||||
Ordinary income | $ | 32,972 | ||||||
|
| |||||||
| ||||||||
| ||||||||
| iShares ETF | Year Ended 03/31/23 | Year Ended 03/31/22 | ||||||
| ||||||||
Emerging Markets Infrastructure | ||||||||
Ordinary income | $ | 641,405 | $ | 642,264 | ||||
|
|
|
| |||||
Europe | ||||||||
Ordinary income | $ | 50,928,655 | $ | 56,175,033 | ||||
|
|
|
| |||||
India 50 | ||||||||
Ordinary income | $ | — | $ | 48,495,153 | ||||
Long-term capital gains | 21,001,621 | — | ||||||
|
|
|
| |||||
| $ | 21,001,621 | $ | 48,495,153 | |||||
|
|
|
| |||||
International Developed Property | ||||||||
Ordinary income | $ | 977,169 | $ | 3,007,345 | ||||
|
|
|
| |||||
| 96 | 2 0 2 3 I SHARES ANNUAL REPORT TO SHAREHOLDERS |
Notes to Financial Statements (continued)
| ||||||||
| iShares ETF | Year Ended 03/31/23 | Year Ended 03/31/22 | ||||||
| ||||||||
International Developed Small Cap Value Factor | ||||||||
Ordinary income | $ | 4,915,147 | $ | 407,661 | ||||
|
|
|
| |||||
International Dividend Growth | ||||||||
Ordinary income | $ | 11,034,484 | $ | 5,744,772 | ||||
|
|
|
| |||||
Latin America 40 | ||||||||
Ordinary income | $ | 138,313,795 | $ | 99,359,955 | ||||
|
|
|
| |||||
As of March 31, 2023, the tax components of accumulated net earnings (losses) were as follows:
iShares ETF | | Undistributed Ordinary Income |
| | Undistributed Long-Term Capital Gains |
| | Non-expiring Capital Loss Carryforwards |
(a) | | Net Unrealized Gains (Losses) | (b) | | Qualified Late-Year Losses | (c) | Total | ||||||||
Asia 50 | $ | 9,437,598 | $ | — | $ | (91,304,416 | ) | $ | (77,540,851 | ) | $ | — | $ | (159,407,669 | ) | |||||||||
Blockchain and Tech | 60,658 | — | (3,088,039 | ) | 572,796 | — | (2,454,585 | ) | ||||||||||||||||
Emerging Markets Infrastructure | 20,842 | — | (34,170,843 | ) | 128,817 | — | (34,021,184 | ) | ||||||||||||||||
Europe | 15,182,643 | — | (368,616,712 | ) | (77,304,232 | ) | — | (430,738,301 | ) | |||||||||||||||
Future Metaverse Tech and Communications | 12,038 | — | — | 234,104 | — | 246,142 | ||||||||||||||||||
India 50 | — | 2,101,248 | — | 273,907,902 | (495,624 | ) | 275,513,526 | |||||||||||||||||
International Developed Property | — | — | (31,498,243 | ) | (23,394,516 | ) | — | (54,892,759 | ) | |||||||||||||||
International Developed Small Cap Value Factor | 1,735,366 | — | (2,549,938 | ) | (11,472,576 | ) | — | (12,287,148 | ) | |||||||||||||||
International Dividend Growth | 2,561,443 | — | (32,658,402 | ) | 9,736,445 | — | (20,360,514 | ) | ||||||||||||||||
Latin America 40 | — | — | (1,036,874,384 | ) | (228,815,557 | ) | — | (1,265,689,941 | ) | |||||||||||||||
| (a) | Amounts available to offset future realized capital gains. |
| (b) | The difference between book-basis and tax-basis unrealized gains (losses) was attributable primarily to the tax deferral of losses on wash sales, the realization for tax purposes of unrealized gains (losses) on certain futures contracts, timing and recognition of partnership income, the characterization of corporate actions, the realization for tax purposes of unrealized gains on investments in passive foreign investment companies and the timing and recognition of realized gains (losses) for tax purposes. |
| (c) | The Funds have elected to defer certain qualified late-year losses and recognize such losses in the next taxable year. |
For the year ended March 31, 2023, the iShares India 50 ETF utilized $7,613,251 of its capital loss carryforwards.
A fund may own shares in certain foreign investment entities, referred to, under U.S. tax law, as “passive foreign investment companies.” Such fund may elect to mark-to-market annually the shares of each passive foreign investment company and would be required to distribute to shareholders any such marked-to-market gains.
As of March 31, 2023, gross unrealized appreciation and depreciation based on cost of investments (including short positions and derivatives, if any) for U.S. federal income tax purposes were as follows:
| iShares ETF | Tax Cost | Gross Unrealized Appreciation | Gross Unrealized Depreciation | Net Unrealized Appreciation (Depreciation) | ||||||||||||
Asia 50 | $ | 1,746,449,387 | $ | 301,662,433 | $ | (379,142,706 | ) | $ | (77,480,273 | ) | ||||||
Blockchain and Tech | 8,199,461 | 980,601 | (407,809 | ) | 572,792 | |||||||||||
Emerging Markets Infrastructure | 23,422,793 | 4,561,113 | (4,432,551 | ) | 128,562 | |||||||||||
Europe | 1,908,692,205 | 308,566,030 | (385,847,233 | ) | (77,281,203 | ) | ||||||||||
Future Metaverse Tech and Communications | 5,103,438 | 326,708 | (92,625 | ) | 234,083 | |||||||||||
India 50 | 301,682,071 | 288,368,652 | (11,896,772 | ) | 276,471,880 | |||||||||||
International Developed Property | 67,068,566 | 667,248 | (24,058,713 | ) | (23,391,465 | ) | ||||||||||
International Developed Small Cap Value Factor | 170,119,727 | 8,781,399 | (20,260,291 | ) | (11,478,892 | ) | ||||||||||
International Dividend Growth | 584,512,685 | 38,845,577 | (29,105,550 | ) | 9,740,027 | |||||||||||
Latin America 40 | 1,260,461,317 | 75,180,429 | (304,063,390 | ) | (228,882,961 | ) | ||||||||||
| 9. | LINE OF CREDIT |
The iShares Asia 50 ETF, iShares Emerging Markets Infrastructure ETF, iShares India 50 ETF, iShares International Dividend Growth ETF and iShares Latin America 40 ETF, along with certain other iShares funds (“Participating Funds”), are parties to a $800 million credit agreement (“Syndicated Credit Agreement”) with a group of lenders, which expires on August 11, 2023. The line of credit may be used for temporary or emergency purposes, including redemptions, settlement of trades and rebalancing of portfolio holdings in certain target markets. The Funds may borrow up to the aggregate commitment amount subject to asset coverage and other limitations as specified in the Syndicated Credit Agreement. The Syndicated Credit Agreement has the following terms: a commitment fee of 0.15% per annum on the unused portion of the credit
NOTES TO FINANCIAL STATEMENTS | 97 |
Notes to Financial Statements (continued)
agreement and interest at a rate equal to the higher of (a) Daily Simple Secured Overnight Financing Rate (“SOFR”) plus 0.10% and 1.00% per annum or (b) the U.S. Federal Funds rate plus 1.00% per annum on amounts borrowed. The commitment fee is generally allocated to each Participating Fund based on the lesser of a Participating Fund’s relative exposure to certain target markets or a Participating Fund’s maximum borrowing amount as set forth by the terms of the Syndicated Credit Agreement.
During the year ended March 31, 2023, the iShares Asia 50 ETF, iShares Emerging Markets Infrastructure ETF, iShares India 50 ETF and iShares Latin America 40 ETF did not borrow under the Syndicated Credit Agreement.
For the year ended March 31, 2023, the maximum amount borrowed, the average daily borrowing and the weighted average interest rate, if any, under the Syndicated Credit Agreement were as follows:
| iShares ETF | Maximum Amount Borrowed | Average Borrowing | Weighted Average Interest Rates | |||||||||
International Dividend Growth | $ | 2,600,000 | $ | 35,479 | 4.99 | % | ||||||
Effective April 21, 2022, iShares India 50 ETF, along with certain other iShares funds (“Mauritius Participating Funds”), was a party to a $1.50 billion unsecured and uncommitted line of credit (“Uncommitted Liquidity Facility”) with State Street Bank and Trust Company, which was used solely to facilitate trading associated with the closure of the Fund’s Mauritius subsidiary. The Uncommitted Liquidity Facility had interest at a rate equal to the higher of (a) the U.S. Federal Funds rate (not less than zero) plus 1.25% per annum or (b) the Overnight Bank Funding rate (not less than zero) plus 1.25% per annum on amounts borrowed. The Uncommitted Liquidity Facility was terminated on December 7, 2022.
For the year ended March 31, 2023, the maximum amount borrowed, the average daily borrowing and the weighted average interest rate, if any, under the Uncommitted Liquidity Facility were as follows:
| iShares ETF | Maximum Amount Borrowed | Average Borrowing | Weighted Average Interest Rates | |||||||||
India 50 | $ | 151,350,000 | $ | 7,624,795 | 3.27 | % | ||||||
| 10. | PRINCIPAL RISKS |
In the normal course of business, each Fund invests in securities or other instruments and may enter into certain transactions, and such activities subject the Fund to various risks, including, among others, fluctuations in the market (market risk) or failure of an issuer to meet all of its obligations. The value of securities or other instruments may also be affected by various factors, including, without limitation: (i) the general economy; (ii) the overall market as well as local, regional or global political and/or social instability; (iii) regulation, taxation or international tax treaties between various countries; or (iv) currency, interest rate or price fluctuations. Local, regional or global events such as war, acts of terrorism, the spread of infectious illness or other public health issues, recessions, or other events could have a significant impact on the Funds and their investments. Each Fund’s prospectus provides details of the risks to which the Fund is subject.
BFA uses a “passive” or index approach to try to achieve each Fund’s investment objective following the securities included in its underlying index during upturns as well as downturns. BFA does not take steps to reduce market exposure or to lessen the effects of a declining market. Divergence from the underlying index and the composition of the portfolio is monitored by BFA.
The Funds may be exposed to additional risks when reinvesting cash collateral in money market funds that do not seek to maintain a stable NAV per share of $1.00, which may be subject to redemption gates or liquidity fees under certain circumstances.
Market Risk: Investments in the securities of issuers domiciled in countries with emerging capital markets involve certain additional risks that do not generally apply to investments in securities of issuers in more developed capital markets, such as (i) low or nonexistent trading volume, resulting in a lack of liquidity and increased volatility in prices for such securities; (ii) uncertain national policies and social, political and economic instability, increasing the potential for expropriation of assets, confiscatory taxation, high rates of inflation or unfavorable diplomatic developments; (iii) lack of publicly available or reliable information about issuers as a result of not being subject to the same degree of regulatory requirements and accounting, auditing and financial reporting standards; and (iv) possible fluctuations in exchange rates, differing legal systems and the existence or possible imposition of exchange controls, custodial restrictions or other foreign or U.S. governmental laws or restrictions applicable to such investments.
Infectious Illness Risk: An outbreak of an infectious illness, such as the COVID-19 pandemic, may adversely impact the economies of many nations and the global economy, and may impact individual issuers and capital markets in ways that cannot be foreseen. An infectious illness outbreak may result in, among other things, closed international borders, prolonged quarantines, supply chain disruptions, market volatility or disruptions and other significant economic, social and political impacts.
Valuation Risk: The market values of equities, such as common stocks and preferred securities or equity related investments, such as futures and options, may decline due to general market conditions which are not specifically related to a particular company. They may also decline due to factors which affect a particular industry or industries. A fund may invest in illiquid investments. An illiquid investment is any investment that a fund reasonably expects cannot be sold or disposed of in current market conditions in seven calendar days or less without the sale or disposition significantly changing the market value of the investment. A fund may experience difficulty in selling
| 98 | 2 0 2 3 I SHARES ANNUAL REPORT TO SHAREHOLDERS |
Notes to Financial Statements (continued)
illiquid investments in a timely manner at the price that it believes the investments are worth. Prices may fluctuate widely over short or extended periods in response to company, market or economic news. Markets also tend to move in cycles, with periods of rising and falling prices. This volatility may cause a fund’s NAV to experience significant increases or decreases over short periods of time. If there is a general decline in the securities and other markets, the NAV of a fund may lose value, regardless of the individual results of the securities and other instruments in which a fund invests.
The price each Fund could receive upon the sale of any particular portfolio investment may differ from each Fund’s valuation of the investment, particularly for securities that trade in thin or volatile markets or that are valued using a fair valuation technique or a price provided by an independent pricing service. Changes to significant unobservable inputs and assumptions (i.e., publicly traded company multiples, growth rate, time to exit) due to the lack of observable inputs.
Counterparty Credit Risk: The Funds may be exposed to counterparty credit risk, or the risk that an entity may fail to or be unable to perform on its commitments related to unsettled or open transactions, including making timely interest and/or principal payments or otherwise honoring its obligations. The Funds manage counterparty credit risk by entering into transactions only with counterparties that BFA believes have the financial resources to honor their obligations and by monitoring the financial stability of those counterparties. Financial assets, which potentially expose the Funds to market, issuer and counterparty credit risks, consist principally of financial instruments and receivables due from counterparties. The extent of the Funds’ exposure to market, issuer and counterparty credit risks with respect to these financial assets is approximately their value recorded in the Statements of Assets and Liabilities, less any collateral held by the Funds.
A derivative contract may suffer a mark-to-market loss if the value of the contract decreases due to an unfavorable change in the market rates or values of the underlying instrument. Losses can also occur if the counterparty does not perform under the contract.
With exchange-traded futures, there is less counterparty credit risk to the Funds since the exchange or clearinghouse, as counterparty to such instruments, guarantees against a possible default. The clearinghouse stands between the buyer and the seller of the contract; therefore, credit risk is limited to failure of the clearinghouse. While offset rights may exist under applicable law, a fund does not have a contractual right of offset against a clearing broker or clearinghouse in the event of a default (including the bankruptcy or insolvency). Additionally, credit risk exists in exchange-traded futures with respect to initial and variation margin that is held in a clearing broker’s customer accounts. While clearing brokers are required to segregate customer margin from their own assets, in the event that a clearing broker becomes insolvent or goes into bankruptcy and at that time there is a shortfall in the aggregate amount of margin held by the clearing broker for all its clients, typically the shortfall would be allocated on a pro rata basis across all the clearing broker’s customers, potentially resulting in losses to the Funds.
Concentration Risk: A diversified portfolio, where this is appropriate and consistent with a fund’s objectives, minimizes the risk that a price change of a particular investment will have a material impact on the NAV of a fund. The investment concentrations within each Fund’s portfolio are disclosed in its Schedule of Investments.
Certain Funds invest a significant portion of their assets in issuers located in a single country or a limited number of countries. When a fund concentrates its investments in this manner, it assumes the risk that economic, regulatory, political and social conditions in that country or those countries may have a significant impact on the fund and could affect the income from, or the value or liquidity of, the Fund’s portfolio. Unanticipated or sudden political or social developments may cause uncertainty in the markets and as a result adversely affect the Fund’s investments. Foreign issuers may not be subject to the same uniform accounting, auditing and financial reporting standards and practices as used in the United States. Foreign securities markets may also be more volatile and less liquid than U.S. securities and may be less subject to governmental supervision not typically associated with investing in U.S. securities. Investment percentages in specific countries are presented in the Schedule of Investments.
Certain Funds invest a significant portion of their assets in securities of issuers located in Europe or with significant exposure to European issuers or countries. The European financial markets have recently experienced volatility and adverse trends due to concerns about economic downturns in, or rising government debt levels of, several European countries as well as acts of war in the region. These events may spread to other countries in Europe and may affect the value and liquidity of certain of the Funds’ investments.
Responses to the financial problems by European governments, central banks and others, including austerity measures and reforms, may not work, may result in social unrest and may limit future growth and economic recovery or have other unintended consequences. Further defaults or restructurings by governments and others of their debt could have additional adverse effects on economies, financial markets and asset valuations around the world. The United Kingdom has withdrawn from the European Union, and one or more other countries may withdraw from the European Union and/or abandon the Euro, the common currency of the European Union. These events and actions have adversely affected, and may in the future adversely affect, the value and exchange rate of the Euro and may continue to significantly affect the economies of every country in Europe, including countries that do not use the Euro and non-European Union member states. The impact of these actions, especially if they occur in a disorderly fashion, is not clear but could be significant and far reaching. In addition, Russia launched a large-scale invasion of Ukraine on February 24, 2022. The extent and duration of the military action, resulting sanctions and resulting future market disruptions in the region are impossible to predict, but have been, and may continue to be significant and have a severe adverse effect on the region, including significant negative impacts on the economy and the markets for certain securities and commodities, such as oil and natural gas, as well as other sectors.
Certain Funds invest a significant portion of their assets in securities of issuers located in China or with significant exposure to Chinese issuers. Investments in Chinese securities, including certain Hong Kong-listed securities, involve risks specific to China. China may be subject to considerable degrees of economic, political and social instability and demonstrates significantly higher volatility from time to time in comparison to developed markets. Chinese markets generally continue to experience inefficiency, volatility and pricing anomalies resulting from governmental influence, a lack of publicly available information and/or political and social instability. Internal social unrest or confrontations with other neighboring countries may disrupt economic development in China and result in a greater risk of currency fluctuations, currency non-convertibility, interest rate fluctuations and higher rates of inflation. Incidents involving China’s or the region’s security may cause uncertainty in Chinese markets and may adversely affect the Chinese economy and a fund’s investments. Reduction in spending on Chinese products and services, institution of tariffs or other trade barriers,
NOTES TO FINANCIAL STATEMENTS | 99 |
Notes to Financial Statements (continued)
or a downturn in any of the economies of China’s key trading partners may have an adverse impact on the Chinese economy. In addition, measures may be taken to limit the flow of capital and/or sanctions may be imposed, which could prohibit or restrict the ability to own or transfer fund assets and may also include retaliatory actions, such as seizure of fund assets.
Certain Funds invest a significant portion of their assets in securities of issuers located in Asia or with significant exposure to Asian issuers or countries. The Asian financial markets have recently experienced volatility and adverse trends due to concerns in several Asian countries regarding monetary policy, government intervention in the markets, rising government debt levels or economic downturns. These events may spread to other countries in Asia and may affect the value and liquidity of certain of the Funds’ investments.
Certain Funds invest a significant portion of their assets in securities within a single or limited number of market sectors. When a fund concentrates its investments in this manner, it assumes the risk that economic, regulatory, political and social conditions affecting such sectors may have a significant impact on the fund and could affect the income from, or the value or liquidity of, the fund’s portfolio.
Significant Shareholder Redemption Risk: Certain shareholders may own or manage a substantial amount of fund shares and/or hold their fund investments for a limited period of time. Large redemptions of fund shares by these shareholders may force a fund to sell portfolio securities, which may negatively impact the fund’s NAV, increase the fund’s brokerage costs, and/or accelerate the realization of taxable income/gains and cause the fund to make additional taxable distributions to shareholders.
| 11. | CAPITAL SHARE TRANSACTIONS |
Capital shares are issued and redeemed by each Fund only in aggregations of a specified number of shares or multiples thereof (“Creation Units”) at NAV. Except when aggregated in Creation Units, shares of each Fund are not redeemable.
Transactions in capital shares were as follows:
| ||||||||||||||||
Year Ended 03/31/23 | Year Ended 03/31/22 | |||||||||||||||
|
|
|
| |||||||||||||
| iShares ETF | Shares | Amount | Shares | Amount | ||||||||||||
| ||||||||||||||||
Asia 50 | ||||||||||||||||
Shares sold | 4,250,000 | $ | 268,352,378 | 550,000 | $ | 50,293,530 | ||||||||||
Shares redeemed | (4,600,000 | ) | (269,671,950 | ) | (8,000,000 | ) | (674,686,270 | ) | ||||||||
|
|
|
|
|
|
|
| |||||||||
| (350,000 | ) | $ | (1,319,572 | ) | (7,450,000 | ) | $ | (624,392,740 | ) | |||||||
|
|
|
|
|
|
|
| |||||||||
|
| |||||||||||||||
| ||||||||||||||||
| Period Ended 03/31/23 | ||||||||||||||||
| iShares ETF | Shares | Amount | ||||||||||||||
| ||||||||||||||||
Blockchain and Tech | ||||||||||||||||
Shares sold | 400,000 | $ | 8,983,970 | |||||||||||||
|
|
|
| |||||||||||||
|
| |||||||||||||||
| ||||||||||||||||
| Year Ended 03/31/23 | Year Ended 03/31/22 | |||||||||||||||
| iShares ETF | Shares | Amount | Shares | Amount | ||||||||||||
| ||||||||||||||||
Emerging Markets Infrastructure | ||||||||||||||||
Shares sold | 200,000 | $ | 4,326,610 | 250,000 | $ | 5,705,641 | ||||||||||
Shares redeemed | (50,000 | ) | (1,105,850 | ) | — | — | ||||||||||
|
|
|
|
|
|
|
| |||||||||
| 150,000 | $ | 3,220,760 | 250,000 | $ | 5,705,641 | |||||||||||
|
|
|
|
|
|
|
| |||||||||
Europe | ||||||||||||||||
Shares sold | 5,600,000 | $ | 267,045,938 | 6,250,000 | $ | 340,588,053 | ||||||||||
Shares redeemed | (7,750,000 | ) | (367,441,756 | ) | (650,000 | ) | (29,123,281 | ) | ||||||||
|
|
|
|
|
|
|
| |||||||||
| (2,150,000 | ) | $ | (100,395,818 | ) | 5,600,000 | $ | 311,464,772 | |||||||||
|
|
|
|
|
|
|
| |||||||||
|
| |||||||||||||||
| ||||||||||||||||
Period Ended 03/31/23 | ||||||||||||||||
|
| |||||||||||||||
| iShares ETF | Shares | Amount | ||||||||||||||
| ||||||||||||||||
Future Metaverse Tech and Communications(a) | ||||||||||||||||
Shares sold | 200,000 | $ | 5,104,279 | |||||||||||||
|
|
|
| |||||||||||||
| (a) | The Fund commenced operations on February 14, 2023. |
| 100 | 2 0 2 3 I SHARES ANNUAL REPORT TO SHAREHOLDERS |
Notes to Financial Statements (continued)
| ||||||||||||||||
Year Ended 03/31/23 | Year Ended 03/31/22 | |||||||||||||||
|
|
|
| |||||||||||||
| iShares ETF | Shares | Amount | Shares | Amount | ||||||||||||
| ||||||||||||||||
India 50 | ||||||||||||||||
Shares sold | 750,000 | $ | 32,231,430 | 850,000 | $ | 44,660,162 | ||||||||||
Shares redeemed | (1,050,000 | ) | (44,585,805 | ) | (2,050,000 | ) | (93,971,769 | ) | ||||||||
|
|
|
|
|
|
|
| |||||||||
| (300,000 | ) | $ | (12,354,375 | ) | (1,200,000 | ) | $ | (49,311,607 | ) | |||||||
|
|
|
|
|
|
|
| |||||||||
International Developed Property | ||||||||||||||||
Shares sold | — | $ | 21 | — | $ | 58 | ||||||||||
Shares redeemed | (200,000 | ) | (5,900,760 | ) | (500,000 | ) | (18,963,122 | ) | ||||||||
|
|
|
|
|
|
|
| |||||||||
| (200,000 | ) | $ | (5,900,739 | ) | (500,000 | ) | $ | (18,963,064 | ) | |||||||
|
|
|
|
|
|
|
| |||||||||
International Developed Small Cap Value Factor | ||||||||||||||||
Shares sold | 200,000 | $ | 5,713,393 | 4,600,000 | $ | 157,695,420 | ||||||||||
|
|
|
|
|
|
|
| |||||||||
International Dividend Growth | ||||||||||||||||
Shares sold | 4,900,000 | $ | 288,496,363 | 2,450,000 | $ | 165,044,172 | ||||||||||
Shares redeemed | — | — | (450,000 | ) | (30,093,171 | ) | ||||||||||
|
|
|
|
|
|
|
| |||||||||
| 4,900,000 | $ | 288,496,363 | 2,000,000 | $ | 134,951,001 | |||||||||||
|
|
|
|
|
|
|
| |||||||||
Latin America 40 | ||||||||||||||||
Shares sold | 13,500,000 | $ | 362,330,132 | 25,250,000 | $ | 664,304,225 | ||||||||||
Shares redeemed | (28,750,000 | ) | (692,352,408 | ) | (32,250,000 | ) | (864,241,731 | ) | ||||||||
|
|
|
|
|
|
|
| |||||||||
| (15,250,000 | ) | $ | (330,022,276 | ) | (7,000,000 | ) | $ | (199,937,506 | ) | |||||||
|
|
|
|
|
|
|
| |||||||||
The consideration for the purchase of Creation Units of a fund in the Trust generally consists of the in-kind deposit of a designated portfolio of securities and a specified amount of cash. Certain funds in the Trust may be offered in Creation Units solely or partially for cash in U.S. dollars. Investors purchasing and redeeming Creation Units may pay a purchase transaction fee and a redemption transaction fee directly to State Street Bank and Trust Company, the Trust’s administrator, to offset transfer and other transaction costs associated with the issuance and redemption of Creation Units, including Creation Units for cash. Investors transacting in Creation Units for cash may also pay an additional variable charge to compensate the relevant fund for certain transaction costs (i.e., stamp taxes, taxes on currency or other financial transactions, and brokerage costs) and market impact expenses relating to investing in portfolio securities. Such variable charges, if any, are included in shares sold in the table above.
From time to time, settlement of securities related to in-kind contributions or in-kind redemptions may be delayed. In such cases, securities related to in-kind transactions are reflected as a receivable or a payable in the Statements of Assets and Liabilities.
| 12. | FOREIGN WITHHOLDING TAX CLAIMS |
iShares Europe ETF, iShares International Developed Property ETF, and iShares International Dividend Growth ETF have filed claims to recover taxes withheld by Sweden on dividend income based upon certain provisions in the Treaty on the Functioning of the European Union. The Funds have recorded a receivable for all recoverable taxes withheld by Sweden based upon determinations made by Swedish tax authorities. Professional and other fees associated with the filing of tax claims in Sweden that result in the recovery of foreign withholding taxes have been approved by the Board as appropriate expenses of the Funds. The Funds continue to evaluate developments in Sweden, for potential impacts to the receivables and associated professional fees payable. Swedish tax claims receivable and related liabilities are disclosed in the Statements of Assets and Liabilities. Collection of this receivable, and any subsequent payment of associated liabilities, depends upon determinations made by Swedish tax authorities.
The Internal Revenue Service (“IRS”) has issued guidance to address U.S. income tax liabilities attributable to fund shareholders resulting from the recovery of foreign taxes withheld in prior calendar years. These withheld foreign taxes were passed through to shareholders in the form of foreign tax credits in the year the taxes were withheld. Assuming there are sufficient foreign taxes paid which iShares International Dividend Growth ETF is able to pass through to shareholders as a foreign tax credit in the current year, the Fund will be able to offset the prior years’ withholding taxes recovered against the foreign taxes paid in the current year. Accordingly, no federal income tax liability is recorded by the Fund.
The iShares Europe ETF is seeking or expected to seek a closing agreement with the Internal Revenue Service (“IRS”) to address any prior years’ U.S. income tax liabilities attributable to Fund shareholders resulting from the recovery of foreign taxes. The closing agreement would result in the Fund paying a compliance fee to the IRS, on behalf of its shareholders, representing the estimated tax savings generated from foreign tax credits claimed by Fund shareholders on their tax returns in prior years. The Fund has accrued a liability for the estimated IRS compliance fee related to foreign withholding tax claims, which is disclosed in the Statements of Assets and Liabilities. The actual IRS compliance fee may differ from the estimate and that difference may be material.
NOTES TO FINANCIAL STATEMENTS | 101 |
Notes to Financial Statements (continued)
| 13. | SUBSEQUENT EVENTS |
Management has evaluated the impact of all subsequent events on the Funds through the date the financial statements were available to be issued and has determined that there were no subsequent events requiring adjustment or additional disclosure in the financial statements.
| 102 | 2 0 2 3 I SHARES ANNUAL REPORT TO SHAREHOLDERS |
| Report of Independent Registered Public Accounting Firm |
To the Board of Trustees of
iShares Trust and Shareholders of each of the ten funds listed in the table below
Opinions on the Financial Statements
We have audited the accompanying statements of assets and liabilities, including the schedules of investments, of each of the funds listed in the table below (ten of the funds constituting iShares Trust, hereafter collectively referred to as the “Funds”) as of March 31, 2023, the related statements of operations and of changes in net assets for each of the periods indicated in the table below, including the related notes, and the financial highlights for each of the periods indicated in the table below (collectively referred to as the “financial statements”). In our opinion, the financial statements present fairly, in all material respects, the financial position of each of the Funds as of March 31, 2023, the results of each of their operations, the changes in each of their net assets, and each of the financial highlights for each of the periods indicated in the table below, in conformity with accounting principles generally accepted in the United States of America.
iShares Asia 50 ETF(1) |
iShares Blockchain and Tech ETF(2) iShares Emerging Markets Infrastructure ETF(1) iShares Europe ETF(1) iShares Future Metaverse Tech and Communications ETF(3) iShares India 50 ETF(4) iShares International Developed Property ETF(1) iShares International Developed Small Cap Value Factor ETF(1) iShares International Dividend Growth ETF(1) iShares Latin America 40 ETF(1) |
(1) Statements of operations for the year ended March 31, 2023, statements of changes in net assets for each of the two years in the period ended March 31, 2023 and each of the financial highlights for each of the periods indicated therein.
(2) Statement of operations, statement of changes in net assets and the financial highlights for the period April 25, 2022 (commencement of operations) to March 31, 2023.
(3) Statement of operations, statement of changes in net assets and the financial highlights for the period February 14, 2023 (commencement of operations) to March 31, 2023.
(4) Consolidated statement of operations for the year ended March 31, 2023, consolidated statements of changes in net assets for each of the two years in the period ended March 31, 2023 and the consolidated financial highlights for each of the periods indicated therein.
Basis for Opinions
These financial statements are the responsibility of the Funds’ management. Our responsibility is to express an opinion on the Funds’ financial statements based on our audits. We are a public accounting firm registered with the Public Company Accounting Oversight Board (United States) (PCAOB) and are required to be independent with respect to the Funds in accordance with the U.S. federal securities laws and the applicable rules and regulations of the Securities and Exchange Commission and the PCAOB.
We conducted our audits of these financial statements in accordance with the standards of the PCAOB. Those standards require that we plan and perform the audit to obtain reasonable assurance about whether the financial statements are free of material misstatement, whether due to error or fraud.
Our audits included performing procedures to assess the risks of material misstatement of the financial statements, whether due to error or fraud, and performing procedures that respond to those risks. Such procedures included examining, on a test basis, evidence regarding the amounts and disclosures in the financial statements. Our audits also included evaluating the accounting principles used and significant estimates made by management, as well as evaluating the overall presentation of the financial statements. Our procedures included confirmation of securities owned as of March 31, 2023 by correspondence with the custodian, transfer agent and brokers; when replies were not received from brokers, we performed other auditing procedures. We believe that our audits provide a reasonable basis for our opinions.
/s/PricewaterhouseCoopers LLP
Philadelphia, Pennsylvania
May 25, 2023
We have served as the auditor of one or more BlackRock investment companies since 2000.
REPORT OF INDEPENDENT REGISTERED PUBLIC ACCOUNTING FIRM | 103 |
Important Tax Information (unaudited)
The following amounts, or maximum amounts allowable by law, are hereby designated as qualified dividend income for individuals for the fiscal year ended March 31, 2023:
| iShares ETF | Qualified Dividend Income | |||
Asia 50 | $ | 17,560,404 | ||
Blockchain and Tech | 17,289 | |||
Emerging Markets Infrastructure | 430,694 | |||
Europe | 61,317,041 | |||
Future Metaverse Tech and Communications | 7,911 | |||
India 50 | 8,154,489 | |||
International Developed Property | 1,124,416 | |||
International Developed Small Cap Value Factor | 5,393,511 | |||
International Dividend Growth | 13,785,189 | |||
Latin America 40 | 121,182,425 | |||
The Funds intend to pass through to their shareholders the following amounts, or maximum amounts allowable by law, of foreign source income earned and foreign taxes paid for the fiscal year ended March 31, 2023:
| iShares ETF | Foreign Source Income Earned | Foreign Taxes Paid | ||||||
Asia 50 | $ | 50,744,673 | $ | 5,178,732 | ||||
Emerging Markets Infrastructure | 747,705 | 46,471 | ||||||
Europe | 62,258,308 | — | ||||||
India 50 | 8,689,091 | 22,390,750 | ||||||
International Developed Property | 2,168,003 | 196,339 | ||||||
International Developed Small Cap Value Factor | 6,319,445 | 513,430 | ||||||
International Dividend Growth | 14,719,015 | 1,392,657 | ||||||
Latin America 40 | 133,107,092 | 5,860,869 | ||||||
The following percentage, or maximum percentage allowable by law, of ordinary income distributions paid during the fiscal year ended March 31, 2023 qualified for the dividends-received deduction for corporate shareholders:
| iShares ETF | Dividends-Received Deduction | |||
Blockchain and Tech | 13.33 | % | ||
Future Metaverse Tech and Communications | 15.23 | % | ||
Latin America 40 | 0.66 | % | ||
The Fund hereby designates the following amount, or maximum amount allowable by law, as capital gain dividends, subject to a long-term capital gains tax rate as noted below, for the fiscal year ended March 31, 2023:
| iShares ETF | 20% Rate Long-Term Capital Gain Dividends | |||
India 50 | $ | 21,001,621 | ||
| 104 | 2 0 2 3 I SHARES ANNUAL REPORT TO SHAREHOLDERS |
Board Review and Approval of Investment Advisory Contract
iShares Future Metaverse Tech and Communications ETF (the “Fund”)
Under Section 15(c) of the Investment Company Act of 1940 (the “1940 Act”), the Trust’s Board of Trustees (the “Board”), including a majority of Board Members who are not “interested persons” of the Trust (as that term is defined in the 1940 Act) (the “Independent Board Members”), is required to consider and approve the proposed Investment Advisory Agreement between the Trust and BFA (the “Advisory Agreement”) on behalf of the Fund. The Independent Board Members requested, and BFA provided, such information as the Independent Board Members, with advice from independent counsel, deemed reasonably necessary to evaluate the terms of the proposed Advisory Agreement. At a meeting held on December 12-14, 2022, the Board, including the Independent Board Members, approved the selection of BFA as investment adviser and approved the proposed Advisory Agreement for the Fund, based on a review of qualitative and quantitative information provided by BFA. The Board also considered information previously provided by BFA, BlackRock Institutional Trust Company, N.A. (“BTC”), and BlackRock, Inc. (“BlackRock”), as applicable, at prior Board meetings. The Independent Board Members were advised by their independent counsel throughout the process, including about the legal standards applicable to their review. In approving the Advisory Agreement for the Fund, the Board, including the Independent Board Members, considered various factors, including: (i) the expenses of the Fund; (ii) the nature, extent and quality of the services to be provided by BFA; (iii) the costs of services to be provided to the Fund and the availability of information related to profits to be realized by BFA and its affiliates; (iv) potential economies of scale; (v) the fees and services provided for other comparable funds/accounts managed by BFA and its affiliates; and (vi) other benefits to BFA and/or its affiliates. The material factors, no one of which was controlling, and conclusions that formed the basis for the Board, including the Independent Board Members, to approve the Advisory Agreement are discussed below.
Expenses of the Fund: The Board reviewed statistical information prepared by Broadridge Financial Solutions Inc. (“Broadridge”), an independent provider of investment company data, regarding the expense ratio components of the Fund in comparison with the same information for other ETFs, objectively selected by Broadridge as comprising the Fund’s applicable expense peer group pursuant to Broadridge’s proprietary ETF methodology (the “Peer Group”). The Board was provided with a detailed description of the proprietary ETF methodology used by Broadridge to determine the Fund’s Peer Group. The Board noted that due to the limitations in providing comparable funds in the Peer Group, the statistical information provided in Broadridge’s report may or may not provide meaningful direct comparisons to the Fund in all instances.
The Board also noted that the investment advisory fee rate and overall expenses (net of waivers and reimbursements) for the Fund were lower than the median of the investment advisory fee rates and overall expenses (net of waivers and reimbursements) of the funds in its Peer Group, excluding iShares funds.
Based on this review, the other factors considered at the meeting, and their general knowledge of ETF pricing, the Board concluded that the investment advisory fee rate and expense level of the Fund supported the Board’s approval of the Advisory Agreement.
Nature, Extent and Quality of Services to be Provided by BFA: The Board reviewed the scope of services to be provided by BFA under the Advisory Agreement. In reviewing the scope of these services, the Board considered BFA’s investment philosophy and experience, noting that BFA and its affiliates have committed significant resources over time and have made significant investments into the iShares business to support the iShares funds and their shareholders. The Board considered representations by BFA, BTC, and BlackRock that the scope and quality of services to be provided to the Fund would be similar to the scope and quality of services provided to other iShares funds. The Board also considered BFA’s compliance program and its compliance record with respect to other iShares funds. In that regard, the Board noted that BFA reports to the Board about portfolio management and compliance matters on a periodic basis in connection with regularly scheduled meetings of the Board, and on other occasions as necessary and appropriate, and has provided information and made relevant officers and other employees of BFA (and its affiliates) available as needed to provide further assistance with these matters. The Board also reviewed the background and experience of the persons who will be responsible for the day-to-day management of the Fund, as well as the resources that will be available to them in managing the Fund. The Board also considered detailed presentations regarding BFA’s investment performance, investment and risk management processes and strategies, which were provided throughout the year with respect to other iShares funds, and other matters related to BFA’s portfolio compliance program.
Based on review of this information, the Board concluded that the nature, extent and quality of services to be provided to the Fund under the Advisory Agreement supported the Board’s approval of the Advisory Agreement.
Costs of Services to be Provided to the Fund and Profits to be Realized by BFA and Affiliates: The Board did not consider the profitability of the Fund to BFA based on the fees payable under the Advisory Agreement or revenue to be received by BFA or its affiliates in connection with services to be provided to the Fund since the proposed relationship had not yet commenced. The Board noted that it expects to receive profitability information from BFA periodically following the Fund’s launch and will thus be in a position to evaluate whether any new or additional breakpoints or other adjustments in Fund fees would be appropriate.
Economies of Scale: The Board considered information that it had previously received regarding potential economies of scale, efficiencies and scale benefits shared with the iShares funds through relatively low fee rates established at inception, breakpoints, waivers, or other fee reductions, as well as through additional investment in the iShares business and the provision of improved or additional infrastructure and services to the iShares funds and their shareholders. The Board noted that the Advisory Agreement for the Fund did not provide for breakpoints in the Fund’s investment advisory fee rate as the assets of the Fund increase. However, the Board noted that it would continue to assess the appropriateness of adding breakpoints in the future.
This consideration of potential economies of scale and the sharing of related benefits, as well as the other factors considered at the meeting, supported the Board’s approval of the Advisory Agreement.
Fees and Services Provided for Other Comparable Funds/Accounts Managed by BFA and its Affiliates: The Board received and considered information regarding the investment advisory/management fee rates for other funds/accounts in the U.S. for which BFA (or its affiliates) provides investment advisory/management services, including open-end funds registered under the 1940 Act (including sub-advised funds), collective trust funds, and institutional separate accounts (collectively, the “Other Accounts”). The Board acknowledged BFA’s representation that the iShares funds are fundamentally different investment vehicles from the Other Accounts. The Board noted that BFA and its affiliates do not manage Other Accounts with substantially the same investment objective and strategy as the Fund and that track the same index
BOARD REVIEW AND APPROVAL OF INVESTMENT ADVISORY CONTRACT | 105 |
Board Review and Approval of Investment Advisory Contract (continued)
as the Fund. The Board further noted that BFA previously provided the Board with detailed information regarding how the Other Accounts (particularly institutional clients) generally differ from the iShares funds, including in terms of the different and generally more extensive services provided to the iShares funds, as well as other significant differences. In that regard, the Board considered that the pricing of services to institutional clients is typically based on a number of factors beyond the nature and extent of the specific services to be provided and often depends on the overall relationship between the client and its affiliates and the adviser and its affiliates. In addition, the Board considered the relative complexity and inherent risks and challenges of managing and providing other services to the Fund, as a publicly traded investment vehicle, as compared to the Other Accounts, particularly those that are institutional clients, in light of differing regulatory requirements and client-imposed mandates. The Board considered the “all-inclusive” nature of the Fund’s advisory fee structure, and the Fund’s expenses borne by BFA under this arrangement.
Other Benefits to BFA and/or its Affiliates: Except as noted below, the Board did not consider the “fallout” benefits or ancillary revenue to be received by BFA and/or its affiliates in connection with the services to be provided to the Fund by BFA since the proposed relationship had not yet commenced. However, the Board noted that BFA generally does not use soft dollars or consider the value of research or other services that may be provided to BFA (including its affiliates) in selecting brokers for portfolio transactions for the Fund. The Board considered the potential payment of advisory fees and/or administration fees to BFA (or its affiliates) in connection with any investments by the Fund in other funds for which BFA (or its affiliates) provides investment advisory services and/or administration services. The Board also noted the potential revenue to be received by BFA and/or its affiliates pursuant to an agreement that would permit a service provider to use certain portions of BlackRock’s technology platform to service accounts managed by BFA and/or its affiliates, including the iShares funds. The Board also considered the potential for revenue to BTC, the Fund’s securities lending agent, and its affiliates in the event of any loaning of portfolio securities of the Fund. The Board concluded that any such ancillary benefits would not be disadvantageous to the Fund and thus would not alter the Board’s conclusion with respect to the appropriateness of approving the Advisory Agreement.
Conclusion: Based on a review of the factors described above, as well as such other factors as deemed appropriate by the Board, the Board, including all of the Independent Board Members, determined that the Fund’s investment advisory fee rate under the Advisory Agreement does not constitute a fee that is so disproportionately large as to bear no reasonable relationship to the services to be rendered and that could not have been the product of arm’s-length bargaining, and concluded to approve the Advisory Agreement.
| 106 | 2 0 2 3 I SHARES ANNUAL REPORT TO SHAREHOLDERS |
Statement Regarding Liquidity Risk Management Program (unaudited)
In compliance with Rule 22e-4 under the Investment Company Act of 1940, as amended (the “Liquidity Rule”), iShares Trust (the “Trust”) has adopted and implemented a liquidity risk management program (the “Program”) for iShares Asia 50 ETF, iShares Blockchain and Tech ETF, iShares Emerging Markets Infrastructure ETF, iShares Europe ETF, iShares India 50 ETF, iShares International Developed Property ETF, iShares International Developed Small Cap Value Factor ETF, iShares International Dividend Growth ETF and iShares Latin America 40 ETF (the “Funds” or “ETFs”), each a series of the Trust, which is reasonably designed to assess and manage each Fund’s liquidity risk.
The Board of Trustees (the “Board”) of the Trust, on behalf of the Funds, met on December 9, 2022 (the “Meeting”) to review the Program. The Board previously appointed BlackRock Fund Advisors (“BlackRock”), the investment adviser to the Funds, as the program administrator for each Fund’s Program. BlackRock also previously delegated oversight of the Program to the 40 Act Liquidity Risk Management Committee (the “Committee”). At the Meeting, the Committee, on behalf of BlackRock, provided the Board with a report that addressed the operation of the Program and assessed its adequacy and effectiveness of implementation, including the management of each Fund’s Highly Liquid Investment Minimum (“HLIM”) where applicable, and any material changes to the Program (the “Report”). The Report covered the period from October 1, 2021 through September 30, 2022 (the “Program Reporting Period”).
The Report described the Program’s liquidity classification methodology for categorizing each Fund’s investments (including derivative transactions) into one of four liquidity buckets. It also referenced the methodology used by BlackRock to establish each Fund’s HLIM and noted that the Committee reviews and ratifies the HLIM assigned to each Fund no less frequently than annually. The Report also discussed notable events affecting liquidity over the Program Reporting Period, including extended market holidays, the imposition of capital controls in certain non-U.S. countries, Russian sanctions and the closure of the Russian securities market.
The Report noted that the Program complied with the key factors for consideration under the Liquidity Rule for assessing, managing and periodically reviewing each Fund’s liquidity risk, as follows:
| a) | The Fund’s investment strategy and liquidity of portfolio investments during both normal and reasonably foreseeable stressed conditions. During the Program Reporting Period, the Committee reviewed whether each Fund’s strategy is appropriate for an open-end fund structure, with a focus on funds with more significant and consistent holdings of less liquid and illiquid assets. The Committee also factored a fund’s concentration in an issuer into the liquidity classification methodology by taking issuer position sizes into account. Derivative exposure was also considered in the calculation of a fund’s liquidity bucketing. Finally, a factor for consideration under the Liquidity Rule is a Fund’s use of borrowings for investment purposes. However, the Funds do not borrow for investment purposes. |
| b) | Short-term and long-term cash flow projections during both normal and reasonably foreseeable stressed conditions. During the Program Reporting Period, the Committee reviewed historical redemption activity and used this information as a component to establish each ETF’s reasonably anticipated trading size (“RATS”). The Committee may also take into consideration a fund’s shareholder ownership concentration (which, depending on product type and distribution channel, may or may not be available), a fund’s distribution channels, and the degree of certainty associated with a fund’s short-term and long-term cash flow projections. |
| c) | Holdings of cash and cash equivalents, as well as borrowing arrangements. The Committee considered that ETFs generally do not hold more than de minimis amounts of cash. The Committee also considered that ETFs generally do not engage in borrowing. |
| d) | The relationship between an ETF’s portfolio liquidity and the way in which, and the prices and spreads at which, ETF shares trade, including the efficiency of the arbitrage function and the level of active participation by market participants, including authorized participants. The Committee monitored the prevailing bid/ask spread and the ETF price premium (or discount) to NAV for all ETFs. However, there were no ETFs with persistent deviations of fund premium/discount or bid/ask spreads from long-term averages over the Program Reporting Period. |
| e) | The effect of the composition of baskets on the overall liquidity of an ETF’s portfolio. In reviewing the linkage between the composition of custom baskets accepted by an ETF and any significant change in the liquidity profile of such ETF, the Committee reviewed changes in the proportion of each ETF’s portfolio comprised of less liquid and illiquid holdings to determine if applicable thresholds were met requiring enhanced review. |
There were no material changes to the Program during the Program Reporting Period other than the enhancement of certain model components in the Program’s classification methodology. The Report provided to the Board stated that the Committee concluded that based on the operation of the functions, as described in the Report, the Program is operating as intended and is effective in implementing the requirements of the Liquidity Rule.
STATEMENT REGARDING LIQUIDITY RISK MANAGEMENT PROGRAM | 107 |
Supplemental Information (unaudited)
Section 19(a) Notices
The amounts and sources of distributions reported are estimates and are being provided pursuant to regulatory requirements and are not being provided for tax reporting purposes. The actual amounts and sources for tax reporting purposes will depend upon each Fund’s investment experience during the year and may be subject to changes based on tax regulations. Shareholders will receive a Form 1099-DIV each calendar year that will inform them how to report these distributions for federal income tax purposes.
March 31, 2023
| Total Cumulative Distributions for the Fiscal Year | % Breakdown of the Total Cumulative Distributions for the Fiscal Year | |||||||||||||||||||||||||||||||
| iShares ETF | Net Investment Income | Net Realized Capital Gains | Return of Capital | Total Per Share | Net Investment Income | Net Realized Capital Gains | Return of Capital | Total Per Share | ||||||||||||||||||||||||
Asia 50 | $ | 1.468540 | $ | — | $ | — | $ | 1.468540 | 100 | % | — | % | — | % | 100 | % | ||||||||||||||||
Europe | 1.385332 | — | — | 1.385332 | 100 | — | — | 100 | ||||||||||||||||||||||||
India 50 | — | 1.585028 | — | 1.585028 | — | 100 | — | 100 | ||||||||||||||||||||||||
International Developed Property | 0.557877 | — | — | 0.557877 | 100 | — | — | 100 | ||||||||||||||||||||||||
Premium/Discount Information
Information on the Fund’s net asset value, market price, premiums and discounts, and bid-ask spreads can be found at iShares.com.
Regulation under the Alternative Investment Fund Managers Directive
The Alternative Investment Fund Managers Directive, and its United Kingdom (“UK”) equivalent, (“AIFMD”) impose detailed and prescriptive obligations on fund managers established in the European Union (the “EU”) and the UK. These do not currently apply to managers established outside of the EU or UK, such as BFA (the “Company”). Rather, the Company is only required to comply with certain disclosure, reporting and transparency obligations of AIFMD because it has registered the iShares India 50 ETF (the “Fund”) to be marketed to investors in the EU and/or UK.
Report on Remuneration
The Company is required under AIFMD to make quantitative disclosures of remuneration. These disclosures are made in line with BlackRock’s interpretation of currently available regulatory guidance on quantitative remuneration disclosures. As market or regulatory practice develops BlackRock may consider it appropriate to make changes to the way in which quantitative remuneration disclosures are calculated. Where such changes are made, this may result in disclosures in relation to a fund not being comparable to the disclosures made in the prior year, or in relation to other BlackRock fund disclosures in that same year.
Disclosures are provided in relation to (a) the staff of the Company; (b) staff who are senior management; and (c) staff who have the ability to materially affect the risk profile of the Fund.
All individuals included in the aggregated figures disclosed are rewarded in line with BlackRock’s remuneration policy for their responsibilities across the relevant BlackRock business area. As all individuals have a number of areas of responsibilities, only the portion of remuneration for those individuals’ services attributable to the Fund is included in the aggregate figures disclosed.
BlackRock has a clear and well-defined pay-for-performance philosophy, and compensation programs which support that philosophy.
BlackRock operates a total compensation model for remuneration which includes a base salary, which is contractual, and a discretionary bonus scheme. Although all employees are eligible to receive a discretionary bonus, there is no contractual obligation to make a discretionary bonus award to any employees. For senior management and staff who have the ability to materially affect the risk profile of the Fund, a significant percentage of variable remuneration is deferred over time. All employees are subject to a clawback policy.
Remuneration decisions for employees are made once annually in January following the end of the performance year, based on BlackRock’s full-year financial results and other non-financial goals and objectives. Alongside financial performance, individual total compensation is also based on strategic and operating results and other considerations such as management and leadership capabilities. No set formulas are established and no fixed benchmarks are used in determining annual incentive awards.
Annual incentive awards are paid from a bonus pool which is reviewed throughout the year by BlackRock’s independent compensation committee, taking into account both actual and projected financial information together with information provided by the Enterprise Risk and Regulatory Compliance departments in relation to any activities, incidents or events that warrant consideration in making compensation decisions. Individuals are not involved in setting their own remuneration.
Each of the control functions (Enterprise Risk, Legal & Compliance, and Internal Audit) each have their own organizational structures which are independent of the business units and therefore staff members in control functions are remunerated independently of the businesses they oversee. Functional bonus pools for those control functions are determined with reference to the performance of each individual function and the remuneration of the senior members of control functions is directly overseen by BlackRock’s independent remuneration committee.
| 108 | 2 0 2 3 I SHARES ANNUAL REPORT TO SHAREHOLDERS |
Supplemental Information (unaudited) (continued)
Members of staff and senior management of the Company typically provide both AIFMD and non-AIFMD related services in respect of multiple funds, clients and functions of the Company and across the broader BlackRock group. Conversely, members of staff and senior management of the broader BlackRock group may provide both AIFMD and non-AIFMD related services in respect of multiple funds, clients and functions of the broader BlackRock group and of the Company. Therefore, the figures disclosed are a sum of individuals’ portion of remuneration attributable to the Company according to an objective apportionment methodology which acknowledges the multiple-service nature of the Company and the broader BlackRock group. Accordingly, the figures are not representative of any individual’s actual remuneration or their remuneration structure.
The amount of the total remuneration awarded to the Company’s staff in respect of the Company’s financial year ending December 31, 2022 was USD 4,121 million. This figure is comprised of fixed remuneration of USD 685 million and variable remuneration of USD 3,436 million. There was a total of 8 beneficiaries of the remuneration described above.
The amount of the aggregate remuneration awarded by the Company in respect of the Company’s financial year ending December 31, 2022, to its senior management was USD 2,958 million, and to other members of its staff whose actions potentially have a material impact on the risk profile of the Company or its funds was USD 970 million. These figures relate to the entire Company and not to the Fund.
Disclosures Under the EU Sustainable Finance Disclosure Regulation
The iShares India 50 ETF (the “Fund”) is registered under the Alternative Investment Fund Managers Directive to be marketed to European Union (“EU”) investors, as noted above. As a result, certain disclosures are required under the EU Sustainable Finance Disclosure Regulation (“SFDR”).
The Fund has not been categorized under the SFDR as an “Article 8” or “Article 9” product. In addition, the Fund’s investment strategy does not take into account the criteria for environmentally sustainable economic activities under the EU sustainable investment taxonomy regulation or principal adverse impacts (“PAIs”) on sustainability factors under the SFDR. PAIs are identified under the SFDR as the material impacts of investment decisions on sustainability factors relating to environmental, social and employee matters, respect for human rights, and anti-corruption and anti-bribery matters.
SUPPLEMENTAL INFORMATION | 109 |
Trustee and Officer Information (unaudited)
The Board of Trustees has responsibility for the overall management and operations of the Funds, including general supervision of the duties performed by BFA and other service providers. Each Trustee serves until he or she resigns, is removed, dies, retires or becomes incapacitated. Each officer shall hold office until his or her successor is elected and qualifies or until his or her death, resignation or removal. Trustees who are not “interested persons” (as defined in the 1940 Act) of the Trust are referred to as independent trustees (“Independent Trustees”).
The registered investment companies advised by BFA or its affiliates (the “BlackRock-advised Funds”) are organized into one complex of open-end equity, multi-asset, index and money market funds and ETFs (the “BlackRock Multi-Asset Complex”), one complex of closed-end funds and open-end non-index fixed-income funds (including ETFs) (the “BlackRock Fixed-Income Complex”) and one complex of ETFs (“Exchange-Traded Fund Complex”) (each, a “BlackRock Fund Complex”). Each Fund is included in the Exchange-Traded Fund Complex. Each Trustee also serves as a Director of iShares, Inc. and a Trustee of iShares U.S. ETF Trust and, as a result, oversees all of the funds within the Exchange-Traded Fund Complex, which consists of 380 funds as of March 31, 2023. With the exception of Robert S. Kapito, Salim Ramji and Charles Park, the address of each Trustee and officer is c/o BlackRock, Inc., 400 Howard Street, San Francisco, CA 94105. The address of Mr. Kapito, Mr. Ramji and Mr. Park is c/o BlackRock, Inc., 50 Hudson Yards, New York, NY 10001. The Board has designated John E. Kerrigan as its Independent Board Chair. Additional information about the Funds’ Trustees and officers may be found in the Funds’ combined Statement of Additional Information, which is available without charge, upon request, by calling toll-free 1-800-iShares (1-800-474-2737).
| Interested Trustees | ||||||
Name (Year of Birth) | Position(s) | Principal Occupation(s) During Past 5 Years | Other Directorships Held by Trustee | |||
Robert S. Kapito(a) (1957) | Trustee (since 2009). | President, BlackRock, Inc. (since 2006); Vice Chairman of BlackRock, Inc. and Head of BlackRock’s Portfolio Management Group (since its formation in 1998) and BlackRock, Inc.’s predecessor entities (since 1988); Trustee, University of Pennsylvania (since 2009); President of Board of Directors, Hope & Heroes Children’s Cancer Fund (since 2002). | Director of BlackRock, Inc. (since 2006); Director of iShares, Inc. (since 2009); Trustee of iShares U.S. ETF Trust (since 2011). | |||
Salim Ramji(b) (1970) | Trustee (since 2019). | Senior Managing Director, BlackRock, Inc. (since 2014); Global Head of BlackRock’s ETF and Index Investments Business (since 2019); Head of BlackRock’s U.S. Wealth Advisory Business (2015-2019); Global Head of Corporate Strategy, BlackRock, Inc. (2014-2015); Senior Partner, McKinsey & Company (2010-2014). | Director of iShares, Inc. (since 2019); Trustee of iShares U.S. ETF Trust (since 2019). | |||
(a) Robert S. Kapito is deemed to be an “interested person” (as defined in the 1940 Act) of the Trust due to his affiliations with BlackRock, Inc. and its affiliates. | ||||||
(b) Salim Ramji is deemed to be an “interested person” (as defined in the 1940 Act) of the Trust due to his affiliations with BlackRock, Inc. and its affiliates. | ||||||
| Independent Trustees | ||||||
Name (Year of Birth) | Position(s) | Principal Occupation(s) During Past 5 Years | Other Directorships Held by Trustee | |||
John E. Kerrigan (1955) | Trustee (since 2005); Independent Board Chair (since 2022). | Chief Investment Officer, Santa Clara University (since 2002). | Director of iShares, Inc. (since 2005); Trustee of iShares U.S. ETF Trust (since 2011); Independent Board Chair of iShares, Inc. and iShares U.S. ETF Trust (since 2022). | |||
Jane D. Carlin (1956) | Trustee (since 2015); Risk Committee Chair (since 2016). | Consultant (since 2012); Member of the Audit Committee (2012-2018), Chair of the Nominating and Governance Committee (2017-2018) and Director of PHH Corporation (mortgage solutions) (2012-2018); Managing Director and Global Head of Financial Holding Company Governance & Assurance and the Global Head of Operational Risk Management of Morgan Stanley (2006-2012). | Director of iShares, Inc. (since 2015); Trustee of iShares U.S. ETF Trust (since 2015); Member of the Audit Committee (since 2016), Chair of the Audit Committee (since 2020) and Director of The Hanover Insurance Group, Inc. (since 2016). | |||
Richard L. Fagnani (1954) | Trustee (since 2017); Audit Committee Chair (since 2019). | Partner, KPMG LLP (2002-2016); Director of One Generation Away (since 2021). | Director of iShares, Inc. (since 2017); Trustee of iShares U.S. ETF Trust (since 2017). | |||
| 110 | 2 0 2 3 I SHARES ANNUAL REPORT TO SHAREHOLDERS |
Trustee and Officer Information (unaudited) (continued)
| Independent Trustees (continued) | ||||||
Name (Year of Birth) | Position(s) | Principal Occupation(s) During Past 5 Years | Other Directorships Held by Trustee | |||
Cecilia H. Herbert (1949) | Trustee (since 2005); Nominating and Governance and Equity Plus Committee Chairs (since 2022). | Chair of the Finance Committee (since 2019) and Trustee and Member of the Finance, Audit and Quality Committees of Stanford Health Care (since 2016); Trustee of WNET, New York’s public media company (since 2011) and Member of the Audit Committee (since 2018), Investment Committee (since 2011) and Personnel Committee (since 2022); Chair (1994-2005) and Member (1992-2021) of the Investment Committee, Archdiocese of San Francisco; Trustee of Forward Funds (14 portfolios) (2009-2018); Trustee of Salient MF Trust (4 portfolios) (2015-2018); Director (1998-2013) and President (2007-2011) of the Board of Directors, Catholic Charities CYO; Trustee (2002-2011) and Chair of the Finance and Investment Committee (2006-2010) of the Thacher School; Director of the Senior Center of Jackson Hole (since 2020); Director of the Jackson Hole Center for the Arts (since 2021); Member of the Wyoming State Investment Funds Committee (since 2022). | Director of iShares, Inc. (since 2005); Trustee of iShares U.S. ETF Trust (since 2011). | |||
Drew E. Lawton (1959) | Trustee (since 2017); 15(c) Committee Chair (since 2017). | Senior Managing Director of New York Life Insurance Company (2010-2015). | Director of iShares, Inc. (since 2017); Trustee of iShares U.S. ETF Trust (since 2017); Director of Jackson Financial Inc. (since 2021). | |||
John E. Martinez (1961) | Trustee (since 2003); Securities Lending Committee Chair (since 2019). | Director of Real Estate Equity Exchange, Inc. (since 2005); Director of Cloudera Foundation (2017-2020); and Director of Reading Partners (2012-2016). | Director of iShares, Inc. (since 2003); Trustee of iShares U.S. ETF Trust (since 2011). | |||
Madhav V. Rajan (1964) | Trustee (since 2011); Fixed-Income Plus Committee Chair (since 2019). | Dean, and George Pratt Shultz Professor of Accounting, University of Chicago Booth School of Business (since 2017); Advisory Board Member (since 2016) and Director (since 2020) of C.M. Capital Corporation; Chair of the Board for the Center for Research in Security Prices, LLC (since 2020); Robert K. Jaedicke Professor of Accounting, Stanford University Graduate School of Business (2001-2017); Professor of Law (by courtesy), Stanford Law School (2005-2017); Senior Associate Dean for Academic Affairs and Head of MBA Program, Stanford University Graduate School of Business (2010-2016). | Director of iShares, Inc. (since 2011); Trustee of iShares U.S. ETF Trust (since 2011). | |||
| Officers | ||||||
Name (Year of Birth) | Position(s) | Principal Occupation(s) During Past 5 Years | ||||
Dominik Rohé (1973) | President (since 2019). | Managing Director, BlackRock, Inc. (since 2005); Head of Americas ETF and Index Investments (since 2023); Head of Latin America (2019-2023). | ||||
Trent Walker (1974) | Treasurer and Chief Financial Officer (since 2020). | Managing Director, BlackRock, Inc. (since September 2019); Chief Financial Officer of iShares Delaware Trust Sponsor LLC, BlackRock Funds, BlackRock Funds II, BlackRock Funds IV, BlackRock Funds V and BlackRock Funds VI (since 2021); Executive Vice President of PIMCO (2016-2019); Senior Vice President of PIMCO (2008-2015); Treasurer (2013-2019) and Assistant Treasurer (2007-2017) of PIMCO Funds, PIMCO Variable Insurance Trust, PIMCO ETF Trust, PIMCO Equity Series, PIMCO Equity Series VIT, PIMCO Managed Accounts Trust, 2 PIMCO-sponsored interval funds and 21 PIMCO-sponsored closed-end funds. | ||||
Charles Park (1967) | Chief Compliance Officer (since 2006). | Chief Compliance Officer of BlackRock Advisors, LLC and the BlackRock-advised Funds in the BlackRock Multi-Asset Complex and the BlackRock Fixed-Income Complex (since 2014); Chief Compliance Officer of BFA (since 2006). | ||||
Marisa Rolland (1980) | Secretary (since 2022). | Managing Director, BlackRock, Inc. (since 2023); Director, BlackRock, Inc. (2018-2022); Vice President, BlackRock, Inc. (2010-2017). | ||||
Rachel Aguirre (1982) | Executive Vice President (since 2022). | Managing Director, BlackRock, Inc. (since 2018); Director, BlackRock, Inc. (2009-2018); Head of U.S. iShares Product (since 2022); Head of EII U.S. Product Engineering (since 2021); Co-Head of EII’s Americas Portfolio Engineering (2020-2021); Head of Developed Markets Portfolio Engineering (2016-2019). | ||||
TRUSTEE AND OFFICER INFORMATION | 111 |
Trustee and Officer Information (unaudited) (continued)
| Officers (continued) | ||||
Name (Year of Birth) | Position(s) | Principal Occupation(s) During Past 5 Years | ||
Jennifer Hsui (1976) | Executive Vice President (since 2022). | Managing Director, BlackRock, Inc. (since 2009); Co-Head of Index Equity (since 2022). | ||
| James Mauro (1970) | Executive Vice President (since 2022). | Managing Director, BlackRock, Inc. (since 2010); Head of Fixed Income Index Investments in the Americas and Head of San Francisco Core Portfolio Management (since 2020). | ||
Effective June 15, 2022, Marisa Rolland replaced Deepa Damre Smith as Secretary.
Effective March 30, 2023, Dominik Rohé replaced Armando Senra as President.
| ||||
| 112 | 2 0 2 3 I SHARES ANNUAL REPORT TO SHAREHOLDERS |
Electronic Delivery
Shareholders can sign up for e-mail notifications announcing that the shareholder report or prospectus has been posted on the iShares website at iShares.com. Once you have enrolled, you will no longer receive prospectuses and shareholder reports in the mail.
To enroll in electronic delivery:
| • | Go to icsdelivery.com. |
| • | If your brokerage firm is not listed, electronic delivery may not be available. Please contact your broker-dealer or financial advisor. |
Householding
Householding is an option available to certain fund investors. Householding is a method of delivery, based on the preference of the individual investor, in which a single copy of certain shareholder documents and Rule 30e-3 notices can be delivered to investors who share the same address, even if their accounts are registered under different names. Please contact your broker-dealer if you are interested in enrolling in householding and receiving a single copy of prospectuses and other shareholder documents, or if you are currently enrolled in householding and wish to change your householding status.
Availability of Quarterly Schedule of Investments
The Funds file their complete schedule of portfolio holdings with the SEC for the first and third quarters of each fiscal year as an exhibit to their reports on Form N-PORT. The Funds’ Forms N-PORT are available on the SEC’s website at sec.gov. Additionally, each Fund makes its portfolio holdings for the first and third quarters of each fiscal year available at iShares.com/fundreports.
Availability of Proxy Voting Policies and Proxy Voting Records
A description of the policies and procedures that the iShares Funds use to determine how to vote proxies relating to portfolio securities and information about how the iShares Funds voted proxies relating to portfolio securities during the most recent twelve-month period ending June 30 is available without charge, upon request (1) by calling toll-free 1-800-474-2737; (2) on the iShares website at iShares.com; and (3) on the SEC website at sec.gov.
A description of the Trust’s policies and procedures with respect to the disclosure of the Fund’s portfolio securities is available in the Fund Prospectus. The Fund discloses its portfolio holdings daily and provides information regarding its top holdings in Fund fact sheets at iShares.com.
GENERAL INFORMATION | 113 |
Glossary of Terms Used in this Report
| Portfolio Abbreviation | ||
| ADR | American Depositary Receipt | |
| CPO | Certificates of Participation (Ordinary) | |
| GDR | Global Depositary Receipt | |
| JSC | Joint Stock Company | |
| NVDR | Non-Voting Depositary Receipt | |
| NVS | Non-Voting Shares | |
| PJSC | Public Joint Stock Company | |
| REIT | Real Estate Investment Trust | |
| 114 | 2 0 2 3 I SHARES ANNUAL REPORT TO SHAREHOLDERS |
THIS PAGE INTENTIONALLY LEFT BLANK.
Want to know more?
iShares.com | 1-800-474-2737
This report is intended for the Funds’ shareholders. It may not be distributed to prospective investors unless it is preceded or accompanied by the current prospectus.
Investing involves risk, including possible loss of principal.
The iShares Funds are distributed by BlackRock Investments, LLC (together with its affiliates, “BlackRock”).
The iShares Funds are not sponsored, endorsed, issued, sold or promoted by ICE Data Indices, LLC, FTSE International Limited, India Index Services & Products Ltd., Morningstar Inc. or S&P Dow Jones Indices LLC, nor do these companies make any representation regarding the advisability of investing in the iShares Funds. BlackRock is not affiliated with the companies listed above.
©2023 BlackRock, Inc. All rights reserved. iSHARES and BLACKROCK are registered trademarks of BlackRock, Inc. or its subsidiaries. All other marks are the property of their respective owners.
iS-AR-304-0323
|  |

| MARCH 31, 2023 |

2023 Annual Report
| ||
iShares Trust
| · | iShares JPX-Nikkei 400 ETF | JPXN | NYSE Arca |
Dear Shareholder,
Significant economic headwinds emerged during the 12-month reporting period ended March 31, 2023, as investors navigated changing economic conditions and volatile markets. The U.S. economy shrank in the first half of 2022 before returning to modest growth in the second half of the year, marking a shift to a more challenging post-reopening economic environment. Changes in consumer spending patterns and a tight labor market led to elevated inflation, which reached a 40-year high before beginning to moderate.
Equity prices fell as interest rates rose, particularly during the first half of the reporting period. Both large-and small-capitalization U.S. stocks declined, although equities began to recover in the second half of the period as inflation eased and economic growth resumed. Emerging market stocks and international equities from developed markets declined overall, pressured by rising interest rates and volatile commodities prices.
The 10-year U.S. Treasury yield rose during the reporting period, driving its price down, as investors reacted to fluctuating inflation data and attempted to anticipate its impact on future interest rate changes. The corporate bond market also faced inflationary headwinds, and higher interest rates led to rising borrowing costs for corporate issuers.
The U.S. Federal Reserve (the “Fed”), acknowledging that inflation has been more persistent than expected, raised interest rates eight times. Furthermore, the Fed wound down its bond-buying programs and accelerated the reduction of its balance sheet.
Restricted labor supply kept inflation elevated even as other inflation drivers, such as goods prices and energy costs, moderated. While economic growth slowed in the last year, we believe that taming inflation requires a more substantial decline that lowers demand to a level more in line with the economy’s productive capacity. Although the Fed has decelerated the pace of interest rate hikes, we believe that it still seems determined to get inflation back to target. With this in mind, we believe the possibility of a U.S. recession in the near-term is high, but the dimming economic outlook has not yet been fully reflected in current market prices. We believe investors should expect a period of higher volatility as markets adjust to the new economic reality and policymakers attempt to adapt to rapidly changing conditions. Turmoil in the banking sector late in the period highlighted the potential for the knock-on effects of substantially higher interest rates to disrupt markets with little warning.
While we favor an overweight to equities in the long term, we prefer an underweight stance on equities overall in the near term. Expectations for corporate earnings remain elevated, which seems inconsistent with the possibility of a recession. Nevertheless, we are overweight on emerging market stocks as we believe a weakening U.S. dollar provides a supportive backdrop. We also see long-term opportunities in credit, where we believe that valuations are appealing and higher yields provide attractive income, although we are neutral on credit in the near term, as we’re concerned about tightening credit and financial conditions. However, we believe there are still some strong opportunities for a six- to twelve-month horizon, particularly short-term U.S. Treasuries, global inflation-linked bonds, and emerging market bonds denominated in local currency.
Overall, our view is that investors need to think globally, position themselves to be prepared for a decarbonizing economy, and be nimble as market conditions change. We encourage you to talk with your financial advisor and visit iShares.com for further insight about investing in today’s markets.

Rob Kapito
President, BlackRock, Inc.

Rob Kapito
President, BlackRock, Inc.
| Total Returns as of March 31, 2023 | ||||
| 6-Month | 12-Month | |||
U.S. large cap equities
| 15.62% | (7.73)% | ||
U.S. small cap equities
| 9.14 | (11.61) | ||
International equities
| 27.27 | (1.38) | ||
Emerging market equities
| 14.04 | (10.70) | ||
3-month Treasury bills
| 1.93 | 2.52 | ||
U.S. Treasury securities
| 4.38 | (6.90) | ||
U.S. investment grade bonds
| 4.89 | (4.78) | ||
Tax-exempt municipal bonds
| 7.00 | 0.26 | ||
U.S. high yield bonds
| 7.88 | (3.35) | ||
Past performance is not an indication of future results. Index performance is shown for illustrative purposes only. You cannot invest directly in an index.
| ||||
| 2 | THIS PAGE IS NOT PART OF YOUR FUND REPORT |
| Page | ||||
| ||||
| 2 | ||||
Annual Report: | ||||
| 4 | ||||
| 5 | ||||
| 7 | ||||
| 7 | ||||
| 8 | ||||
Financial Statements | ||||
| 14 | ||||
| 15 | ||||
| 16 | ||||
| 17 | ||||
| 18 | ||||
| 25 | ||||
| 26 | ||||
| 27 | ||||
| 28 | ||||
| 29 | ||||
| 32 | ||||
iShares Trust
Global Market Overview
Global equity markets declined during the 12 months ended March 31, 2023 (“reporting period”). The MSCI ACWI, a broad global equity index that includes both developed and emerging markets, returned -7.44% in U.S. dollar terms for the reporting period. In the first half of the reporting period, concerns about the state of the global economy in the face of high inflation and rapidly rising interest rates drove stocks sharply lower. However, stock prices recovered somewhat in the reporting period’s second half, as economic growth proved resilient despite its slower pace.
Inflation was a significant factor in equity markets, and while its impact varied by country, most major economies experienced substantial inflation during the reporting period. This drove a wave of monetary tightening by most of the world’s central banks, which sent interest rates and borrowing costs sharply higher. The U.S. Federal Reserve (“Fed”) raised interest rates eight times, driving an increase in the value of the U.S. dollar relative to most other currencies. Commodities prices were volatile, and as the reporting period began, disruptions in the wake of Russia’s invasion of Ukraine meant high prices for energy commodities and some foods. While oil, gas, and most other commodities declined as markets adjusted to the war’s disruption, elevated prices exacerbated inflationary pressure.
The U.S. economy recovered from a decline in the first half of 2022 to post modest growth in the third and fourth quarters of 2022. Consumers continued to power the economy with growing spending, despite higher prices for many consumer goods and services. The strong labor market supported spending as unemployment remained very low, at one point dropping to the lowest recorded level since 1969. Furthermore, the labor force participation rate—which measures the total proportion of employed persons of working age—rose, indicating that more people were being drawn into the labor force. Amid tightening labor supply, wages rose significantly, with the largest gains at the lower end of the wage spectrum.
In addition to its interest rate increases, the Fed also started to reduce the size of its balance sheet by reducing the store of U.S. Treasuries it had accumulated to stabilize markets in the early phases of the coronavirus pandemic. While the Fed indicated that more tightening could be needed to achieve its long-term inflation goal, it sounded a more cautious note about the potential for further interest rate increases near the end of the reporting period.
European stocks outpaced most other regions of the globe, advancing modestly for the reporting period despite slowing economic growth. European stocks benefited from a solid recovery following the early phases of the war in Ukraine. While the conflict disrupted critical natural gas supplies, new sources were secured and prices began to decline, while a warm winter helped moderate consumption. The European Central Bank (“ECB”) responded to the highest inflation since the introduction of the euro by raising interest rates six times.
While inflation was somewhat more moderate in the Asia-Pacific region, stocks there declined amid higher interest rates and disruption from coronavirus-related lockdowns in China. However, China relaxed its strict anti-coronavirus protocols in December 2022, boosting analysts’ expectations for future growth in the region. Emerging market stocks declined substantially, pressured by slowing economic growth and a stronger U.S. dollar. The Fed’s interest rate increases weighed on emerging market equities by making U.S. assets relatively more attractive.
| 4 | 2 0 2 3 I SHARES ANNUAL REPORT TO SHAREHOLDERS |
| Fund Summary as of March 31, 2023 | iShares® JPX-Nikkei 400 ETF |
Investment Objective
The iShares JPX-Nikkei 400 ETF (the “Fund”) seeks to track the investment results of a broad-based benchmark composed of Japanese equities, as represented by the JPX-Nikkei Index 400 (the “Index”). The Fund invests in a representative sample of securities included in the Index that collectively has an investment profile similar to the Index. Due to the use of representative sampling, the Fund may or may not hold all of the securities that are included in the Index.
Performance
| Average Annual Total Returns | Cumulative Total Returns | |||||||||||||||||||||||
1 Year
| 5 Years
| 10 Years
| 1 Year
| 5 Years
| 10 Years
| |||||||||||||||||||
Fund NAV |
|
(2.28 |
)% | 1.07 | % | 4.76 | % | (2.28 | )% | 5.47 | % | 59.20 | % | |||||||||||
Fund Market | (2.35 | ) | 0.75 | 4.67 | (2.35 | ) | 3.80 | 57.80 | ||||||||||||||||
Index
|
| (3.89
| )
|
| 1.23
|
|
| 5.04
|
|
| (3.89
| )
|
| 6.31
|
|
| 63.51
|
| ||||||
GROWTH OF $10,000 INVESTMENT
(AT NET ASSET VALUE)
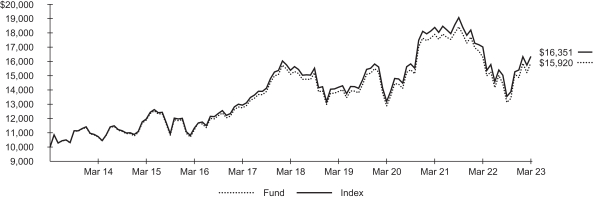
Index performance through January 30, 2013 is calculated using currency exchange (FX) rates corresponding to 5:15 P.M. ET. Index performance beginning on January 31, 2013 is calculated using FX rates corresponding to World Market Reuters 4:00 P.M. London.
Index performance through September 3, 2015 reflects the performance of the S&P/TOPIX 150TM. Index performance beginning on September 4, 2015 reflects the performance of the JPX-Nikkei Index 400.
Past performance is not an indication of future results. Performance results do not reflect the deduction of taxes that a shareholder would pay on fund distributions or on the redemption or sale of fund shares. See “About Fund Performance” for more information.
Expense Example
Actual
| Hypothetical 5% Return
| |||||||||||||||||||||||||||||
|
|
|
| |||||||||||||||||||||||||||
| | Beginning Account Value (10/01/22) | | | Ending Account Value (03/31/23) | | | Expenses Paid During the Period | (a) | | Beginning Account Value (10/01/22) | | | Ending Account Value (03/31/23) | | | Expenses Paid During the Period | (a) | | Annualized Expense Ratio | | ||||||||||
|
$ 1,000.00
|
|
|
$ 1,212.70
|
|
| $ 2.65
|
|
| $ 1,000.00
|
|
| $ 1,022.50
|
|
| $ 2.42
|
|
| 0.48
| %
| ||||||||||
| (a) | Expenses are equal to the annualized expense ratio, multiplied by the average account value over the period, multiplied by 182/365 (to reflect the one-half year period shown). Other fees, such as brokerage commissions and other fees to financial intermediaries, may be paid which are not reflected in the tables and examples above. See “Disclosure of Expenses” for more information. |
FUND SUMMARY | 5 |
| Fund Summary as of March 31, 2023 (continued) | iShares® JPX-Nikkei 400 ETF |
Portfolio Management Commentary
Stocks in Japan declined for the reporting period as the country’s economy remained relatively stagnant amid rising inflation, global monetary policy tightening, and falling manufacturing output. Japan’s trade deficit reached an all-time high as export growth slowed and import costs increased amid rising fuel costs and weaker currency. Exports to China, the country’s largest trade partner, fell even as that country relaxed its strict COVID-19 restrictions in late 2022.
Industrial stocks detracted the most from the Index’s return. Global economic uncertainty, job openings that remained at or below pre-pandemic levels, and a cooling global employment market — including in the U.S., the world’s largest economy — led to declining revenue in the professional services industry. Consequently, a leading online job-search platform announced significant layoffs. Capital goods stocks dropped amid reduced factory output, reflecting declining global demand for a broad range of industrial parts. In particular, the slow recovery of the auto industry cut profits for makers of electric motors and other components.
Information technology stocks also detracted from the Index’s return. Makers of semiconductors and related equipment encountered weakening demand worldwide, especially for smartphones and personal computers. As demand fell, semiconductor prices also decreased. The passage of the CHIPS and Science Act in the U.S., dedicated to promoting both domestic production of semiconductors and export restrictions to China, also pressured the stocks of Japanese semiconductor producers.
The consumer discretionary sector also detracted from performance. In addition to the slowing export demand, domestic consumption recovered somewhat but remained below pre-pandemic levels. Among other products, videogame sales decreased after surging during the pandemic, and bicycle sales slowed. Meanwhile, automakers reduced their production targets amid persistent problems securing production components, which also raised their costs.
Portfolio Information
SECTOR ALLOCATION
Sector
|
| Percent of Total Investments
| (a)
| |
Industrials | 23.5 | % | ||
Information Technology | 13.9 | |||
Consumer Discretionary | 13.3 | |||
Financials | 11.0 | |||
Health Care | 10.9 | |||
Consumer Staples | 8.3 | |||
Communication Services | 8.3 | |||
Materials | 6.2 | |||
Real Estate | 2.4 | |||
Utilities | 1.2 | |||
Energy
|
| 1.0
|
| |
| (a) | Excludes money market funds. |
TEN LARGEST HOLDINGS
Security
|
| Percent of Total Investments
| (a)
| |
Daiichi Sankyo Co. Ltd. | 2.0 | % | ||
Keyence Corp. | 1.9 | |||
Sumitomo Mitsui Financial Group Inc. | 1.8 | |||
Shin-Etsu Chemical Co. Ltd. | 1.8 | |||
Takeda Pharmaceutical Co. Ltd. | 1.6 | |||
Sony Group Corp. | 1.6 | |||
Mitsubishi UFJ Financial Group Inc. | 1.6 | |||
Tokyo Electron Ltd. | 1.5 | |||
Mitsui & Co. Ltd. | 1.5 | |||
Mitsubishi Corp.
|
| 1.5
|
| |
| 6 | 2 0 2 3 I SHARES ANNUAL REPORT TO SHAREHOLDERS |
Past performance is not an indication of future results. Financial markets have experienced extreme volatility and trading in many instruments has been disrupted. These circumstances may continue for an extended period of time and may continue to affect adversely the value and liquidity of the Fund’s investments. As a result, current performance may be lower or higher than the performance data quoted. Performance data current to the most recent month-end is available at iShares.com. Performance results assume reinvestment of all dividends and capital gain distributions and do not reflect the deduction of taxes that a shareholder would pay on fund distributions or on the redemption or sale of fund shares. The investment return and principal value of shares will vary with changes in market conditions. Shares may be worth more or less than their original cost when they are redeemed or sold in the market. Performance for certain funds may reflect a waiver of a portion of investment advisory fees. Without such a waiver, performance would have been lower.
Net asset value or “NAV” is the value of one share of a fund as calculated in accordance with the standard formula for valuing mutual fund shares. Beginning August 10, 2020, the price used to calculate market return (“Market Price”) is the closing price. Prior to August 10, 2020, Market Price was determined using the midpoint between the highest bid and the lowest ask on the primary stock exchange on which shares of a fund are listed for trading, as of the time that such fund’s NAV is calculated. Market and NAV returns assume that dividends and capital gain distributions have been reinvested at Market Price and NAV, respectively.
An index is a statistical composite that tracks a specified financial market or sector. Unlike a fund, an index does not actually hold a portfolio of securities and therefore does not incur the expenses incurred by a fund. These expenses negatively impact fund performance. Also, market returns do not include brokerage commissions that may be payable on secondary market transactions. If brokerage commissions were included, market returns would be lower.
Shareholders of the Fund may incur the following charges: (1) transactional expenses, including brokerage commissions on purchases and sales of fund shares and (2) ongoing expenses, including management fees and other fund expenses. The expense example shown (which is based on a hypothetical investment of $1,000 invested at the beginning of the period and held through the end of the period) is intended to assist shareholders both in calculating expenses based on an investment in the Fund and in comparing these expenses with similar costs of investing in other funds.
The expense example provides information about actual account values and actual expenses. Annualized expense ratios reflect contractual and voluntary fee waivers, if any. In order to estimate the expenses a shareholder paid during the period covered by this report, shareholders can divide their account value by $1,000 and then multiply the result by the number under the heading entitled “Expenses Paid During the Period.”
The expense example also provides information about hypothetical account values and hypothetical expenses based on a fund’s actual expense ratio and an assumed rate of return of 5% per year before expenses. In order to assist shareholders in comparing the ongoing expenses of investing in the Fund and other funds, compare the 5% hypothetical example with the 5% hypothetical examples that appear in the shareholder reports of the other funds.
The expenses shown in the expense example are intended to highlight shareholders’ ongoing costs only and do not reflect any transactional expenses, such as brokerage commissions and other fees paid on purchases and sales of fund shares. Therefore, the hypothetical example is useful in comparing ongoing expenses only and will not help shareholders determine the relative total expenses of owning different funds. If these transactional expenses were included, shareholder expenses would have been higher.
ABOUT FUND PERFORMANCE / DISCLOSURE OF EXPENSES | 7 |
March 31, 2023 | iShares® JPX-Nikkei 400 ETF (Percentages shown are based on Net Assets) |
| Security | Shares | Value | ||||||
Common Stocks | ||||||||
Air Freight & Logistics — 0.6% | ||||||||
AZ-COM MARUWA Holdings Inc. | 600 | $ | 9,037 | |||||
Mitsui-Soko Holdings Co. Ltd. | 600 | 17,823 | ||||||
Nippon Express Holdings Inc. | 1,200 | 72,409 | ||||||
Sankyu Inc. | 600 | 22,266 | ||||||
SBS Holdings Inc. | 600 | 15,246 | ||||||
Senko Group Holdings Co. Ltd. | 1,200 | 8,570 | ||||||
SG Holdings Co. Ltd. | 6,600 | 97,866 | ||||||
Yamato Holdings Co. Ltd. | 4,800 | 82,393 | ||||||
|
| |||||||
| 325,610 | ||||||||
| Automobile Components — 2.6% | ||||||||
Aisin Corp. | 3,000 | 82,687 | ||||||
Bridgestone Corp. | 11,400 | 463,099 | ||||||
Denso Corp. | 7,200 | 406,421 | ||||||
Koito Manufacturing Co. Ltd. | 4,200 | 79,616 | ||||||
NGK Spark Plug Co. Ltd. | 2,400 | 49,663 | ||||||
Nifco Inc./Japan | 1,200 | 34,119 | ||||||
Sumitomo Electric Industries Ltd. | 12,600 | 161,871 | ||||||
Sumitomo Rubber Industries Ltd. | 3,600 | 32,571 | ||||||
Toyo Tire Corp. | 1,800 | 21,069 | ||||||
Toyoda Gosei Co. Ltd. | 1,200 | 20,705 | ||||||
Toyota Boshoku Corp. | 1,800 | 29,125 | ||||||
TS Tech Co. Ltd. | 1,800 | 22,858 | ||||||
Yokohama Rubber Co. Ltd. (The) | 1,800 | 38,121 | ||||||
|
| |||||||
| 1,441,925 | ||||||||
Automobiles — 3.9% | ||||||||
Honda Motor Co. Ltd. | 28,800 | 761,794 | ||||||
Isuzu Motors Ltd. | 10,200 | 121,900 | ||||||
Subaru Corp. | 10,800 | 172,407 | ||||||
Suzuki Motor Corp. | 6,600 | 240,355 | ||||||
Toyota Motor Corp. | 52,820 | 751,914 | ||||||
Yamaha Motor Co. Ltd. | 5,400 | 141,322 | ||||||
|
| |||||||
| 2,189,692 | ||||||||
Banks — 5.9% | ||||||||
Aozora Bank Ltd. | 2,400 | 43,485 | ||||||
Chiba Bank Ltd. (The) | 9,600 | 61,961 | ||||||
Concordia Financial Group Ltd. | 19,200 | 70,770 | ||||||
Fukuoka Financial Group Inc. | 3,000 | 57,723 | ||||||
Mebuki Financial Group Inc. | 16,200 | 39,610 | ||||||
Mitsubishi UFJ Financial Group Inc. | 135,000 | 865,170 | ||||||
Mizuho Financial Group Inc. | 49,850 | 706,253 | ||||||
Resona Holdings Inc. | 43,800 | 211,297 | ||||||
Seven Bank Ltd. | 11,400 | 22,781 | ||||||
Shinsei Bank Ltd.(a) | 1,200 | 21,137 | ||||||
Sumitomo Mitsui Financial Group Inc. | 25,200 | 1,008,443 | ||||||
Sumitomo Mitsui Trust Holdings Inc. | 6,604 | 226,887 | ||||||
|
| |||||||
| 3,335,517 | ||||||||
Beverages — 1.1% | ||||||||
Asahi Group Holdings Ltd. | 7,800 | 290,300 | ||||||
Kirin Holdings Co. Ltd. | 15,600 | 246,804 | ||||||
Suntory Beverage & Food Ltd. | 2,400 | 89,396 | ||||||
Takara Holdings Inc. | 2,400 | 18,554 | ||||||
|
| |||||||
| 645,054 | ||||||||
Biotechnology — 0.1% | ||||||||
PeptiDream Inc.(a) | 1,800 | 25,753 | ||||||
Takara Bio Inc. | 1,200 | 15,743 | ||||||
|
| |||||||
| 41,496 | ||||||||
| Security | Shares | Value | ||||||
Building Products — 1.8% | ||||||||
AGC Inc. | 3,600 | $ | 134,211 | |||||
Daikin Industries Ltd. | 4,200 | 753,507 | ||||||
Nichias Corp. | 1,200 | 24,185 | ||||||
Sanwa Holdings Corp. | 3,600 | 38,622 | ||||||
TOTO Ltd. | 2,400 | 80,409 | ||||||
|
| |||||||
| 1,030,934 | ||||||||
| Capital Markets — 1.0% | ||||||||
Daiwa Securities Group Inc. | 24,600 | 115,487 | ||||||
GMO Financial Holdings Inc. | 600 | 2,619 | ||||||
JAFCO Group Co. Ltd. | 1,200 | 17,188 | ||||||
Japan Exchange Group Inc. | 9,600 | 146,821 | ||||||
Monex Group Inc. | 4,200 | 15,276 | ||||||
Nomura Holdings Inc. | 63,600 | 245,198 | ||||||
|
| |||||||
| 542,589 | ||||||||
Chemicals — 4.5% | ||||||||
Aica Kogyo Co. Ltd. | 1,200 | 27,575 | ||||||
Air Water Inc. | 3,000 | 37,699 | ||||||
Asahi Kasei Corp. | 21,600 | 151,289 | ||||||
Daicel Corp. | 4,800 | 36,270 | ||||||
Denka Co. Ltd. | 1,200 | 24,834 | ||||||
Kansai Paint Co. Ltd. | 3,000 | 40,658 | ||||||
KH Neochem Co. Ltd. | 600 | 10,912 | ||||||
Kuraray Co. Ltd. | 5,400 | 49,668 | ||||||
Mitsubishi Chemical Group Corp. | 23,400 | 139,171 | ||||||
Mitsubishi Gas Chemical Co. Inc. | 2,400 | 35,712 | ||||||
Mitsui Chemicals Inc. | 3,000 | 77,462 | ||||||
Nippon Paint Holdings Co. Ltd. | 15,600 | 146,688 | ||||||
Nippon Sanso Holdings Corp. | 3,600 | 65,040 | ||||||
Nissan Chemical Corp. | 1,800 | 81,751 | ||||||
Nitto Denko Corp. | 2,400 | 155,331 | ||||||
NOF Corp. | 1,200 | 56,076 | ||||||
Shin-Etsu Chemical Co. Ltd. | 30,000 | 973,831 | ||||||
Sumitomo Chemical Co. Ltd. | 26,400 | 88,888 | ||||||
Teijin Ltd. | 3,600 | 37,988 | ||||||
Tokai Carbon Co. Ltd. | 3,000 | 28,656 | ||||||
Tokuyama Corp. | 1,200 | 19,115 | ||||||
Toray Industries Inc. | 23,400 | 133,865 | ||||||
Tosoh Corp. | 4,800 | 65,229 | ||||||
UBE Corp. | 1,800 | 27,960 | ||||||
Zeon Corp. | 2,400 | 25,443 | ||||||
|
| |||||||
| 2,537,111 | ||||||||
Commercial Services & Supplies — 0.5% | ||||||||
Aeon Delight Co. Ltd. | 600 | 13,783 | ||||||
Japan Elevator Service Holdings Co. Ltd. | 1,200 | 19,586 | ||||||
Pilot Corp. | 600 | 19,522 | ||||||
Secom Co. Ltd. | 3,600 | 221,859 | ||||||
Sohgo Security Services Co. Ltd. | 1,200 | 32,320 | ||||||
|
| |||||||
| 307,070 | ||||||||
Construction & Engineering — 1.1% | ||||||||
COMSYS Holdings Corp. | 1,800 | 33,244 | ||||||
EXEO Group Inc. | 1,800 | 32,581 | ||||||
Hazama Ando Corp. | 3,000 | 19,405 | ||||||
INFRONEER Holdings Inc. | 3,600 | 27,824 | ||||||
Kajima Corp. | 7,800 | 94,126 | ||||||
Kandenko Co. Ltd. | 1,800 | 12,716 | ||||||
Kumagai Gumi Co. Ltd. | 600 | 12,045 | ||||||
Kyudenko Corp. | 600 | 15,261 | ||||||
MIRAIT ONE corp. | 1,800 | 22,417 | ||||||
Nishimatsu Construction Co. Ltd. | 600 | 15,513 | ||||||
| 8 | 2 0 2 3 I SHARES ANNUAL REPORT TO SHAREHOLDERS | |
Schedule of Investments (continued) March 31, 2023 | iShares® JPX-Nikkei 400 ETF (Percentages shown are based on Net Assets) |
| Security | Shares | Value | ||||||
| Construction & Engineering (continued) | ||||||||
Obayashi Corp. | 12,600 | $ | 96,421 | |||||
Penta-Ocean Construction Co. Ltd. | 4,800 | 22,936 | ||||||
Shimizu Corp. | 10,200 | 57,806 | ||||||
SHO-BOND Holdings Co. Ltd. | 600 | 24,844 | ||||||
Taisei Corp. | 3,600 | 111,380 | ||||||
Toda Corp. | 4,200 | 21,943 | ||||||
|
| |||||||
| 620,462 | ||||||||
Construction Materials — 0.1% | ||||||||
Taiheiyo Cement Corp. | 2,400 | 45,104 | ||||||
|
| |||||||
Consumer Finance — 0.2% | ||||||||
Acom Co. Ltd. | 6,600 | 15,914 | ||||||
AEON Financial Service Co. Ltd. | 2,400 | 22,411 | ||||||
Marui Group Co. Ltd. | 3,000 | 45,921 | ||||||
Orient Corp. | 900 | 7,498 | ||||||
|
| |||||||
| 91,744 | ||||||||
Containers & Packaging — 0.1% | ||||||||
FP Corp. | 600 | 14,906 | ||||||
Rengo Co. Ltd. | 3,000 | 19,485 | ||||||
|
| |||||||
| 34,391 | ||||||||
Distributors — 0.0% | ||||||||
PALTAC Corp. | 600 | 22,798 | ||||||
|
| |||||||
Financial Services — 1.1% | ||||||||
Fuyo General Lease Co. Ltd. | 600 | 40,824 | ||||||
GMO Payment Gateway Inc. | 600 | 51,946 | ||||||
Mitsubishi HC Capital Inc. | 13,800 | 71,260 | ||||||
Mizuho Leasing Co. Ltd. | 600 | 15,919 | ||||||
ORIX Corp. | 22,800 | 375,927 | ||||||
Tokyo Century Corp. | 600 | 20,031 | ||||||
Zenkoku Hosho Co. Ltd. | 600 | 22,641 | ||||||
|
| |||||||
| 598,548 | ||||||||
Diversified Telecommunication Services — 1.6% | ||||||||
Internet Initiative Japan Inc. | 1,800 | 37,531 | ||||||
Nippon Telegraph & Telephone Corp. | 27,600 | 824,763 | ||||||
Usen-Next Holdings Co. Ltd. | 600 | 11,645 | ||||||
|
| |||||||
| 873,939 | ||||||||
Electric Utilities — 0.6% | ||||||||
Chubu Electric Power Co. Inc. | 13,200 | 139,252 | ||||||
Hokkaido Electric Power Co. Inc.(a) | 3,600 | 13,212 | ||||||
Kansai Electric Power Co. Inc. (The) | 13,800 | 134,397 | ||||||
Kyushu Electric Power Co. Inc.(a) | 7,800 | 44,574 | ||||||
|
| |||||||
| 331,435 | ||||||||
Electrical Equipment — 1.7% | ||||||||
Fuji Electric Co. Ltd. | 2,400 | 94,777 | ||||||
Mitsubishi Electric Corp. | 36,600 | 437,375 | ||||||
Nidec Corp. | 8,400 | 437,144 | ||||||
|
| |||||||
| 969,296 | ||||||||
Electronic Equipment, Instruments & Components — 5.5% | ||||||||
Anritsu Corp. | 3,000 | 27,732 | ||||||
Azbil Corp. | 3,000 | 82,168 | ||||||
Daiwabo Holdings Co. Ltd. | 1,800 | 29,730 | ||||||
Dexerials Corp. | 1,200 | 24,534 | ||||||
Hamamatsu Photonics KK | 3,000 | 161,825 | ||||||
Horiba Ltd. | 600 | 36,010 | ||||||
Ibiden Co. Ltd. | 1,800 | 72,186 | ||||||
Keyence Corp. | 2,144 | 1,050,792 | ||||||
Kyocera Corp. | 5,400 | 281,696 | ||||||
Murata Manufacturing Co. Ltd. | 10,800 | 658,209 | ||||||
| Security | Shares | Value | ||||||
| Electronic Equipment, Instruments & Components (continued) | ||||||||
Omron Corp. | 3,600 | $ | 210,697 | |||||
Shimadzu Corp. | 4,200 | 131,849 | ||||||
Taiyo Yuden Co. Ltd. | 1,800 | 60,693 | ||||||
TDK Corp. | 5,400 | 193,839 | ||||||
Yokogawa Electric Corp. | 4,200 | 68,391 | ||||||
|
| |||||||
| 3,090,351 | ||||||||
Entertainment — 2.4% | ||||||||
Capcom Co. Ltd. | 3,600 | 128,846 | ||||||
GungHo Online Entertainment Inc. | 1,290 | 23,632 | ||||||
Koei Tecmo Holdings Co. Ltd. | 2,480 | 44,822 | ||||||
Konami Group Corp. | 1,800 | 82,616 | ||||||
Nexon Co. Ltd. | 9,000 | 214,909 | ||||||
Nintendo Co. Ltd. | 17,400 | 675,843 | ||||||
Square Enix Holdings Co. Ltd. | 1,800 | 86,500 | ||||||
Toho Co. Ltd./Tokyo | 2,400 | 92,014 | ||||||
|
| |||||||
| 1,349,182 | ||||||||
Consumer Staples Distribution & Retail — 1.9% | ||||||||
Cosmos Pharmaceutical Corp. | 400 | 36,020 | ||||||
Create SD Holdings Co. Ltd. | 600 | 15,250 | ||||||
Kobe Bussan Co. Ltd. | 3,000 | 83,767 | ||||||
Kusuri no Aoki Holdings Co. Ltd. | 600 | 30,431 | ||||||
Lawson Inc. | 1,200 | 50,805 | ||||||
Life Corp. | 600 | 11,713 | ||||||
MatsukiyoCocokara & Co. | 2,400 | 127,132 | ||||||
Seven & i Holdings Co. Ltd. | 12,600 | 569,194 | ||||||
Sugi Holdings Co. Ltd. | 600 | 25,790 | ||||||
Sundrug Co. Ltd. | 1,200 | 32,922 | ||||||
Tsuruha Holdings Inc. | 600 | 40,130 | ||||||
Welcia Holdings Co. Ltd. | 1,800 | 38,536 | ||||||
Yaoko Co. Ltd. | 600 | 31,243 | ||||||
|
| |||||||
| 1,092,933 | ||||||||
Food Products — 2.0% | ||||||||
Ajinomoto Co. Inc. | 8,400 | 292,218 | ||||||
Calbee Inc. | 1,800 | 37,588 | ||||||
Kagome Co. Ltd. | 1,800 | 41,978 | ||||||
Kewpie Corp. | 1,800 | 30,240 | ||||||
Kikkoman Corp. | 2,400 | 122,528 | ||||||
MEIJI Holdings Co. Ltd. | 4,800 | 114,160 | ||||||
Morinaga & Co. Ltd./Japan | 600 | 16,994 | ||||||
Morinaga Milk Industry Co. Ltd. | 600 | 21,581 | ||||||
NH Foods Ltd. | 1,200 | 34,711 | ||||||
Nichirei Corp. | 1,800 | 36,427 | ||||||
Nippon Suisan Kaisha Ltd. | 4,800 | 19,679 | ||||||
Nissin Foods Holdings Co. Ltd. | 1,200 | 109,728 | ||||||
Prima Meat Packers Ltd. | 600 | 9,969 | ||||||
Toyo Suisan Kaisha Ltd. | 1,800 | 75,224 | ||||||
Yakult Honsha Co. Ltd. | 2,400 | 174,385 | ||||||
|
| |||||||
| 1,137,410 | ||||||||
Gas Utilities — 0.5% | ||||||||
Nippon Gas Co. Ltd. | 1,800 | 26,123 | ||||||
Osaka Gas Co. Ltd. | 7,200 | 118,280 | ||||||
Tokyo Gas Co. Ltd. | 7,200 | 135,311 | ||||||
|
| |||||||
| 279,714 | ||||||||
Health Care Equipment & Supplies — 3.3% | ||||||||
Asahi Intecc Co. Ltd. | 4,200 | 74,207 | ||||||
Hoya Corp. | 7,600 | 839,893 | ||||||
Nihon Kohden Corp. | 1,800 | 48,841 | ||||||
Olympus Corp. | 22,200 | 389,893 | ||||||
Sysmex Corp. | 3,000 | 196,895 | ||||||
SCHEDULE OF INVESTMENTS | 9 |
Schedule of Investments (continued) March 31, 2023 | iShares® JPX-Nikkei 400 ETF (Percentages shown are based on Net Assets) |
| Security | Shares | Value | ||||||
| Health Care Equipment & Supplies (continued) | ||||||||
Terumo Corp. | 10,800 | $ | 292,089 | |||||
|
| |||||||
| 1,841,818 | ||||||||
| Health Care Providers & Services — 0.3% | ||||||||
Alfresa Holdings Corp. | 3,600 | 46,126 | ||||||
BML Inc. | 600 | 14,007 | ||||||
H.U. Group Holdings Inc. | 1,200 | 24,164 | ||||||
Medipal Holdings Corp. | 3,600 | 49,062 | ||||||
Ship Healthcare Holdings Inc. | 1,200 | 22,107 | ||||||
|
| |||||||
| 155,466 | ||||||||
| Health Care Technology — 0.3% | ||||||||
M3 Inc. | 7,200 | 181,217 | ||||||
|
| |||||||
| Hotels, Restaurants & Leisure — 0.3% | ||||||||
Food & Life Companies Ltd. | 2,400 | 62,630 | ||||||
McDonald’s Holdings Co. Japan Ltd. | 1,800 | 74,833 | ||||||
Zensho Holdings Co. Ltd. | 1,800 | 53,344 | ||||||
|
| |||||||
| 190,807 | ||||||||
| Household Durables — 3.3% | ||||||||
Casio Computer Co. Ltd. | 2,400 | 23,624 | ||||||
ES-Con Japan Ltd. | 600 | 3,941 | ||||||
Haseko Corp. | 3,600 | 41,845 | ||||||
Iida Group Holdings Co. Ltd. | 3,000 | 48,980 | ||||||
Open House Group Co. Ltd. | 1,200 | 45,000 | ||||||
Panasonic Holdings Corp. | 42,000 | 375,779 | ||||||
Pressance Corp. | 600 | 8,101 | ||||||
Rinnai Corp. | 1,800 | 44,084 | ||||||
Sekisui Chemical Co. Ltd. | 7,200 | 102,258 | ||||||
Sekisui House Ltd. | 10,800 | 220,117 | ||||||
Sharp Corp./Japan(a) | 4,200 | 29,696 | ||||||
Sony Group Corp. | 9,600 | 874,400 | ||||||
Sumitomo Forestry Co. Ltd. | 2,400 | 47,677 | ||||||
|
| |||||||
| 1,865,502 | ||||||||
| Household Products — 0.7% | ||||||||
Lion Corp. | 4,200 | 45,384 | ||||||
Pigeon Corp. | 2,400 | 37,186 | ||||||
Unicharm Corp. | 7,200 | 295,961 | ||||||
|
| |||||||
| 378,531 | ||||||||
| Independent Power and Renewable Electricity Producers — 0.1% | ||||||||
Electric Power Development Co. Ltd. | 2,400 | 38,577 | ||||||
eRex Co. Ltd. | 600 | 8,328 | ||||||
RENOVA Inc.(a) | 1,200 | 18,095 | ||||||
West Holdings Corp. | 600 | 14,746 | ||||||
|
| |||||||
| 79,746 | ||||||||
| Industrial Conglomerates — 1.4% | ||||||||
Hitachi Ltd. | 14,400 | 791,434 | ||||||
TOKAI Holdings Corp. | 1,800 | 11,861 | ||||||
|
| |||||||
| 803,295 | ||||||||
| Insurance — 2.8% | ||||||||
Dai-ichi Life Holdings Inc. | 17,400 | 319,872 | ||||||
MS&AD Insurance Group Holdings Inc. | 7,200 | 223,134 | ||||||
Sompo Holdings Inc. | 6,000 | 237,751 | ||||||
T&D Holdings Inc. | 9,600 | 118,981 | ||||||
Tokio Marine Holdings Inc. | 34,800 | 669,724 | ||||||
|
| |||||||
| 1,569,462 | ||||||||
| Interactive Media & Services — 0.4% | ||||||||
Infocom Corp. | 600 | 10,632 | ||||||
Kakaku.com Inc. | 3,000 | 41,182 | ||||||
| Security | Shares | Value | ||||||
| Interactive Media & Services (continued) | ||||||||
Z Holdings Corp. | 50,400 | $ | 142,907 | |||||
|
| |||||||
| 194,721 | ||||||||
| IT Services — 2.9% | ||||||||
BIPROGY Inc. | 1,200 | 29,487 | ||||||
Change Inc. | 1,200 | 21,389 | ||||||
Digital Garage Inc. | 600 | 19,820 | ||||||
DTS Corp. | 600 | 14,619 | ||||||
Fujitsu Ltd. | 3,600 | 486,469 | ||||||
GMO internet group Inc. | 1,200 | 23,389 | ||||||
Information Services International-Dentsu Ltd. | 600 | 23,667 | ||||||
Itochu Techno-Solutions Corp. | 1,800 | 44,352 | ||||||
NEC Corp. | 4,800 | 185,305 | ||||||
NEC Networks & System Integration Corp. | 1,200 | 14,659 | ||||||
NET One Systems Co. Ltd. | 1,200 | 28,795 | ||||||
Nomura Research Institute Ltd. | 7,264 | 169,888 | ||||||
NS Solutions Corp. | 600 | 16,074 | ||||||
NSD Co. Ltd. | 1,200 | 21,646 | ||||||
NTT Data Corp. | 11,400 | 149,870 | ||||||
Obic Co. Ltd. | 1,200 | 190,072 | ||||||
Otsuka Corp. | 1,800 | 63,927 | ||||||
SCSK Corp. | 3,000 | 43,926 | ||||||
TIS Inc. | 4,200 | 111,072 | ||||||
|
| |||||||
| 1,658,426 | ||||||||
| Leisure Products — 0.9% | ||||||||
Bandai Namco Holdings Inc. | 9,000 | 194,032 | ||||||
Shimano Inc. | 1,400 | 242,740 | ||||||
Yamaha Corp. | 2,400 | 92,698 | ||||||
|
| |||||||
| 529,470 | ||||||||
| Machinery — 6.3% | ||||||||
Amada Co. Ltd. | 6,000 | 56,241 | ||||||
Daifuku Co. Ltd. | 5,400 | 100,263 | ||||||
DMG Mori Co. Ltd. | 2,400 | 40,574 | ||||||
Ebara Corp. | 1,200 | 55,877 | ||||||
FANUC Corp. | 17,000 | 613,907 | ||||||
Fuji Corp./Aichi | 1,800 | 30,479 | ||||||
Hitachi Construction Machinery Co. Ltd. | 1,200 | 27,969 | ||||||
Hoshizaki Corp. | 2,400 | 88,666 | ||||||
IHI Corp. | 2,400 | 60,286 | ||||||
Komatsu Ltd. | 16,800 | 417,062 | ||||||
Kubota Corp. | 18,600 | 282,001 | ||||||
Makita Corp. | 4,200 | 104,600 | ||||||
MINEBEA MITSUMI Inc. | 6,000 | 114,579 | ||||||
MISUMI Group Inc. | 5,400 | 135,693 | ||||||
Mitsubishi Heavy Industries Ltd. | 6,000 | 221,046 | ||||||
Miura Co. Ltd. | 1,800 | 46,165 | ||||||
Nabtesco Corp. | 2,400 | 59,031 | ||||||
NGK Insulators Ltd. | 4,200 | 55,694 | ||||||
SMC Corp. | 1,200 | 636,140 | ||||||
Sumitomo Heavy Industries Ltd. | 2,400 | 58,853 | ||||||
Takeuchi Manufacturing Co. Ltd. | 600 | 13,319 | ||||||
Toyota Industries Corp. | 2,400 | 133,706 | ||||||
Yaskawa Electric Corp. | 4,200 | 184,212 | ||||||
|
| |||||||
| 3,536,363 | ||||||||
| Marine Transportation — 0.8% | ||||||||
Kawasaki Kisen Kaisha Ltd. | 3,000 | 68,807 | ||||||
Mitsui OSK Lines Ltd. | 6,000 | 150,466 | ||||||
Nippon Yusen KK | 9,600 | 224,240 | ||||||
|
| |||||||
| 443,513 | ||||||||
| 10 | 2 0 2 3 I SHARES ANNUAL REPORT TO SHAREHOLDERS |
Schedule of Investments (continued) March 31, 2023 | iShares® JPX-Nikkei 400 ETF (Percentages shown are based on Net Assets) |
| Security | Shares | Value | ||||||
| Media — 0.2% | ||||||||
CyberAgent Inc. | 8,400 | $ | 71,172 | |||||
Hakuhodo DY Holdings Inc. | 4,800 | 54,420 | ||||||
ValueCommerce Co. Ltd. | 600 | 7,739 | ||||||
|
| |||||||
| 133,331 | ||||||||
| Metals & Mining — 1.3% | ||||||||
Asahi Holdings Inc. | 1,200 | 18,338 | ||||||
Dowa Holdings Co. Ltd. | 900 | 28,942 | ||||||
JFE Holdings Inc. | 9,600 | 121,847 | ||||||
Mitsui Mining & Smelting Co. Ltd. | 1,200 | 29,195 | ||||||
Nippon Steel Corp. | 16,200 | 382,020 | ||||||
Sumitomo Metal Mining Co. Ltd. | 4,200 | 160,708 | ||||||
Tokyo Steel Manufacturing Co. Ltd. | 1,200 | 12,394 | ||||||
|
| |||||||
| 753,444 | ||||||||
| Broadline Retail — 0.4% | ||||||||
Izumi Co. Ltd. | 600 | 14,260 | ||||||
Pan Pacific International Holdings Corp. | 7,800 | 150,901 | ||||||
Ryohin Keikaku Co. Ltd. | 4,800 | 54,697 | ||||||
Seria Co. Ltd. | 1,200 | 23,796 | ||||||
|
| |||||||
| 243,654 | ||||||||
| Oil, Gas & Consumable Fuels — 1.0% | ||||||||
Cosmo Energy Holdings Co. Ltd. | 1,200 | 38,876 | ||||||
ENEOS Holdings Inc. | 63,600 | 223,141 | ||||||
Idemitsu Kosan Co. Ltd. | 4,200 | 91,950 | ||||||
Inpex Corp. | 18,000 | 190,485 | ||||||
Iwatani Corp. | 600 | 26,255 | ||||||
|
| |||||||
| 570,707 | ||||||||
| Paper & Forest Products — 0.1% | ||||||||
Daio Paper Corp. | 1,800 | 14,077 | ||||||
Oji Holdings Corp. | 14,400 | 57,015 | ||||||
|
| |||||||
| 71,092 | ||||||||
| Personal Care Products — 1.6% | ||||||||
Fancl Corp. | 1,800 | 33,134 | ||||||
Kao Corp. | 8,400 | 326,972 | ||||||
Kobayashi Pharmaceutical Co. Ltd. | 1,200 | 73,391 | ||||||
Kose Corp. | 600 | 71,315 | ||||||
Rohto Pharmaceutical Co. Ltd. | 3,600 | 75,340 | ||||||
Shiseido Co. Ltd. | 7,200 | 337,560 | ||||||
|
| |||||||
| 917,712 | ||||||||
| Pharmaceuticals — 6.8% | ||||||||
Astellas Pharma Inc. | 33,640 | 477,934 | ||||||
Chugai Pharmaceutical Co. Ltd. | 10,800 | 266,680 | ||||||
Daiichi Sankyo Co. Ltd. | 30,609 | 1,116,544 | ||||||
Eisai Co. Ltd. | 4,200 | 238,558 | ||||||
JCR Pharmaceuticals Co. Ltd. | 1,200 | 12,860 | ||||||
Kaken Pharmaceutical Co. Ltd. | 600 | 16,754 | ||||||
Kyowa Kirin Co. Ltd. | 4,200 | 91,692 | ||||||
Nippon Shinyaku Co. Ltd. | 600 | 26,475 | ||||||
Ono Pharmaceutical Co. Ltd. | 6,600 | 137,532 | ||||||
Otsuka Holdings Co. Ltd. | 8,400 | 266,697 | ||||||
Santen Pharmaceutical Co. Ltd. | 7,200 | 61,519 | ||||||
Shionogi & Co. Ltd. | 4,800 | 216,506 | ||||||
Sumitomo Pharma Co., Ltd. | 2,400 | 14,706 | ||||||
Takeda Pharmaceutical Co. Ltd. | 27,000 | 886,776 | ||||||
Towa Pharmaceutical Co. Ltd. | 600 | 8,592 | ||||||
|
| |||||||
| 3,839,825 | ||||||||
| Professional Services — 2.0% | ||||||||
BayCurrent Consulting Inc. | 3,000 | 124,554 | ||||||
Bell System24 Holdings Inc. | 600 | 6,558 | ||||||
| Security | Shares | Value | ||||||
| Professional Services (continued) | ||||||||
Benefit One Inc. | 1,800 | $ | 25,685 | |||||
dip Corp. | 600 | 16,083 | ||||||
en Japan Inc. | 600 | 10,355 | ||||||
Fullcast Holdings Co. Ltd. | 600 | 10,985 | ||||||
Meitec Corp. | 1,200 | 21,485 | ||||||
Persol Holdings Co. Ltd. | 4,200 | 84,567 | ||||||
Recruit Holdings Co. Ltd. | 25,200 | 693,227 | ||||||
SMS Co. Ltd. | 1,200 | 29,185 | ||||||
TechnoPro Holdings Inc. | 2,400 | 66,566 | ||||||
Transcosmos Inc.(a) | 600 | 14,242 | ||||||
UT Group Co. Ltd.(a) | 600 | 11,216 | ||||||
|
| |||||||
| 1,114,708 | ||||||||
| Real Estate Management & Development — 2.3% | ||||||||
Aeon Mall Co. Ltd. | 1,800 | 23,626 | ||||||
Daito Trust Construction Co. Ltd. | 1,200 | 119,556 | ||||||
Daiwa House Industry Co. Ltd. | 9,600 | 226,188 | ||||||
Hulic Co. Ltd. | 7,800 | 64,157 | ||||||
Katitas Co. Ltd. | 1,200 | 23,485 | ||||||
Mitsubishi Estate Co. Ltd. | 21,600 | 256,925 | ||||||
Mitsui Fudosan Co. Ltd. | 15,000 | 281,766 | ||||||
Nomura Real Estate Holdings Inc. | 2,400 | 53,145 | ||||||
Relo Group Inc. | 1,800 | 28,731 | ||||||
Starts Corp. Inc. | 600 | 11,551 | ||||||
Sumitomo Realty & Development Co. Ltd. | 6,000 | 135,489 | ||||||
Tokyo Tatemono Co. Ltd. | 3,600 | 43,953 | ||||||
Tokyu Fudosan Holdings Corp. | 10,200 | 48,990 | ||||||
|
| |||||||
| 1,317,562 | ||||||||
| Ground Transportation — 0.6% | ||||||||
Central Japan Railway Co. | 2,900 | 346,027 | ||||||
|
| |||||||
| Semiconductors & Semiconductor Equipment — 4.0% | ||||||||
Advantest Corp. | 3,000 | 278,119 | ||||||
Disco Corp. | 1,800 | 209,397 | ||||||
Ferrotec Holdings Corp. | 1,200 | 30,357 | ||||||
Japan Material Co. Ltd. | 1,200 | 21,465 | ||||||
Lasertec Corp. | 1,700 | 302,055 | ||||||
Optorun Co. Ltd. | 600 | 10,086 | ||||||
Renesas Electronics Corp.(a) | 23,400 | 338,851 | ||||||
SCREEN Holdings Co. Ltd. | 600 | 53,222 | ||||||
Shinko Electric Industries Co. Ltd. | 1,200 | 37,328 | ||||||
SUMCO Corp. | 6,600 | 99,290 | ||||||
Tokyo Electron Ltd. | 6,900 | 842,945 | ||||||
Tokyo Seimitsu Co. Ltd. | 600 | 23,293 | ||||||
Ulvac Inc. | 600 | 26,211 | ||||||
|
| |||||||
| 2,272,619 | ||||||||
| Software — 0.3% | ||||||||
Justsystems Corp. | 600 | 16,042 | ||||||
Oracle Corp. Japan | 600 | 43,332 | ||||||
Rakus Co. Ltd. | 1,800 | 26,142 | ||||||
Systena Corp. | 6,000 | 13,194 | ||||||
Trend Micro Inc./Japan | 1,800 | 88,309 | ||||||
|
| |||||||
| 187,019 | ||||||||
| Specialty Retail — 1.5% | ||||||||
ABC-Mart Inc. | 600 | 33,203 | ||||||
Fast Retailing Co. Ltd. | 1,600 | 350,260 | ||||||
Hikari Tsushin Inc. | 600 | 84,316 | ||||||
Kohnan Shoji Co. Ltd. | 600 | 14,714 | ||||||
K’s Holdings Corp. | 3,000 | 26,340 | ||||||
Nextage Co. Ltd. | 600 | 12,541 | ||||||
Nitori Holdings Co. Ltd. | 1,500 | 181,143 | ||||||
SCHEDULE OF INVESTMENTS | 11 |
Schedule of Investments (continued) March 31, 2023 | iShares® JPX-Nikkei 400 ETF (Percentages shown are based on Net Assets) |
| Security | Shares | Value | ||||||
| Specialty Retail (continued) | ||||||||
Nojima Corp. | 1,200 | $ | 12,689 | |||||
T-Gaia Corp. | 600 | 7,564 | ||||||
USS Co. Ltd. | 3,600 | 62,458 | ||||||
Workman Co. Ltd. | 600 | 25,453 | ||||||
ZOZO Inc. | 2,400 | 54,892 | ||||||
|
| |||||||
| 865,573 | ||||||||
| Technology Hardware, Storage & Peripherals — 0.9% | ||||||||
Brother Industries Ltd. | 4,800 | 72,316 | ||||||
Elecom Co. Ltd. | 1,200 | 11,413 | ||||||
FUJIFILM Holdings Corp. | 6,600 | 335,036 | ||||||
MCJ Co. Ltd. | 1,200 | 8,448 | ||||||
Seiko Epson Corp. | 4,800 | 68,583 | ||||||
Wacom Co. Ltd. | 3,000 | 15,715 | ||||||
|
| |||||||
| 511,511 | ||||||||
| Textiles, Apparel & Luxury Goods — 0.1% | ||||||||
Goldwin Inc. | 600 | 57,245 | ||||||
|
| |||||||
| Tobacco — 0.9% | ||||||||
Japan Tobacco Inc. | 22,800 | 481,617 | ||||||
|
| |||||||
| Trading Companies & Distributors — 6.4% | ||||||||
Hanwa Co. Ltd. | 600 | 17,937 | ||||||
ITOCHU Corp. | 22,800 | 742,515 | ||||||
Kanematsu Corp. | 1,200 | 14,903 | ||||||
Marubeni Corp. | 30,000 | 407,991 | ||||||
Mitsubishi Corp. | 23,400 | 840,913 | ||||||
Mitsui & Co. Ltd. | 27,000 | 841,586 | ||||||
MonotaRO Co. Ltd. | 5,400 | 68,016 | ||||||
Nippon Steel Trading Corp. | 600 | 42,102 | ||||||
Sojitz Corp. | 3,620 | 75,643 | ||||||
| Security | Shares | Value | ||||||
Trading Companies & Distributors (continued) |
| |||||||
Sumitomo Corp. | 22,800 | $ | 403,910 | |||||
Toyota Tsusho Corp. | 3,000 | 127,912 | ||||||
|
| |||||||
| 3,583,428 | ||||||||
| Wireless Telecommunication Services — 3.7% | ||||||||
KDDI Corp. | 23,400 | 721,603 | ||||||
SoftBank Corp. | 57,000 | 657,997 | ||||||
SoftBank Group Corp. | 17,400 | 684,055 | ||||||
|
| |||||||
| 2,063,655 | ||||||||
|
| |||||||
Total Long-Term Investments — 98.7% |
| 55,693,371 | ||||||
|
| |||||||
Short-Term Securities | ||||||||
| Money Market Funds — 0.1% | ||||||||
BlackRock Cash Funds: Treasury, SL Agency Shares, 4.73%(b)(c) | 20,000 | 20,000 | ||||||
|
| |||||||
Total Short-Term Securities — 0.1% |
| 20,000 | ||||||
|
| |||||||
Total Investments — 98.8% |
| 55,713,371 | ||||||
Other Assets Less Liabilities — 1.2% |
| 704,595 | ||||||
|
| |||||||
Net Assets — 100.0% |
| $ | 56,417,966 | |||||
|
| |||||||
| (a) | Non-income producing security. |
| (b) | Affiliate of the Fund. |
| (c) | Annualized 7-day yield as of period end. |
Affiliates
Investments in issuers considered to be affiliate(s) of the Fund during the year ended March 31, 2023 for purposes of Section 2(a)(3) of the Investment CompanyAct of 1940, as amended, were as follows:
| ||||||||||||||||||||||||||||||||||||
| Affiliated Issuer | | Value at 03/31/22 | | | Purchases at Cost | | | Proceeds from Sale | | | Net Realized Gain (Loss) | | | Change in Unrealized Appreciation (Depreciation | ) | | Value at 03/31/23 | | | Shares Held at 03/31/23 |
| Income | | Capital Gain Underlying Funds |
| |||||||||||
| ||||||||||||||||||||||||||||||||||||
BlackRock Cash Funds: Institutional, SL Agency Shares(a) | $ | 97,990 | $ | — | $ | (98,640 | )(b) | $ | 653 | $ | (3 | ) | $ | — | — | $ | 551 | (c) | $ | — | ||||||||||||||||
BlackRock Cash Funds: Treasury, SL Agency Shares | 30,000 | — | (10,000 | )(b) | — | — | 20,000 | 20,000 | 557 | — | ||||||||||||||||||||||||||
|
|
|
|
|
|
|
|
|
| |||||||||||||||||||||||||||
| $ | 653 | $ | (3 | ) | $ | 20,000 | $ | 1,108 | $ | — | ||||||||||||||||||||||||||
|
|
|
|
|
|
|
|
|
| |||||||||||||||||||||||||||
| (a) | As of period end, the entity is no longer held. |
| (b) | Represents net amount purchased (sold). |
| (c) | All or a portion represents securities lending income earned from the reinvestment of cash collateral from loaned securities, net of fees and collateral investment expenses, and other payments to and from borrowers of securities. |
Derivative Financial Instruments Outstanding as of Period End
Futures Contracts
Description
| Number of
| Expiration
| Notional (000)
|
Value/
| ||||||||||||
Long Contracts | ||||||||||||||||
Mini TOPIX Index | 45 | 06/08/23 | $ | 682 | $ | 8,496 | ||||||||||
|
| |||||||||||||||
| 12 | 2 0 2 3 I SHARES ANNUAL REPORT TO SHAREHOLDERS |
Schedule of Investments (continued) March 31, 2023 | iShares® JPX-Nikkei 400 ETF |
Derivative Financial Instruments Categorized by Risk Exposure
As of period end, the fair values of derivative financial instruments located in the Statement of Assets and Liabilities were as follows:
| Commodity Contracts | Credit Contracts | Equity Contracts | Foreign Currency Exchange Contracts | Interest Rate Contracts | Other Contracts | Total | ||||||||||||||||||||||
Assets — Derivative Financial Instruments |
| |||||||||||||||||||||||||||
Futures contracts | ||||||||||||||||||||||||||||
Unrealized appreciation on futures contracts(a) | $ | — | $ | — | $ | 8,496 | $ | — | $ | — | $ | — | $ | 8,496 | ||||||||||||||
|
|
|
|
|
|
|
|
|
|
|
|
|
| |||||||||||||||
| (a) | Net cumulative unrealized appreciation (depreciation) on futures contracts are reported in the Schedule of Investments. In the Statement of Assets and Liabilities, only current day’s variation margin is reported in receivables or payables and the net cumulative unrealized appreciation (depreciation) is included in accumulated earnings (loss). |
For the period ended March 31, 2023, the effect of derivative financial instruments in the Statement of Operations was as follows:
| Commodity Contracts | Credit Contracts | Equity Contracts | Foreign Currency Exchange Contracts | Interest Rate Contracts | Other Contracts | Total | ||||||||||||||||||||||
Net Realized Gain (Loss) from |
| |||||||||||||||||||||||||||
Futures contracts | $ | — | $ | — | $ | 10,449 | $ | — | $ | — | $ | — | $ | 10,449 | ||||||||||||||
|
|
|
|
|
|
|
|
|
|
|
|
|
| |||||||||||||||
Net Change in Unrealized Appreciation (Depreciation) on |
| |||||||||||||||||||||||||||
Futures contracts | $ | — | $ | — | $ | 7,669 | $ | — | $ | — | $ | — | $ | 7,669 | ||||||||||||||
|
|
|
|
|
|
|
|
|
|
|
|
|
| |||||||||||||||
Average Quarterly Balances of Outstanding Derivative Financial Instruments
Futures contracts | ||||
Average notional value of contracts — long | $ | 442,737 |
For more information about the Fund’s investment risks regarding derivative financial instruments, refer to the Notes to Financial Statements.
Fair Value Hierarchy as of Period End
Various inputs are used in determining the fair value of financial instruments. For a description of the input levels and information about the Fund’s policy regarding valuation of financial instruments, refer to the Notes to Financial Statements.
The following table summarizes the Fund’s financial instruments categorized in the fair value hierarchy. The breakdown of the Fund’s financial instruments into major categories is disclosed in the Schedule of Investments above.
| Level 1 | Level 2 | Level 3 | Total | |||||||||||||
Assets | ||||||||||||||||
Investments | ||||||||||||||||
Long-Term Investments | ||||||||||||||||
Common Stocks | $ | 74,833 | $ | 55,618,538 | $ | — | $ | 55,693,371 | ||||||||
Short-Term Securities | ||||||||||||||||
Money Market Funds | 20,000 | — | — | 20,000 | ||||||||||||
|
|
|
|
|
|
|
| |||||||||
| $ | 94,833 | $ | 55,618,538 | $ | — | $ | 55,713,371 | |||||||||
|
|
|
|
|
|
|
| |||||||||
Derivative Financial Instruments(a) | ||||||||||||||||
Assets | ||||||||||||||||
Equity Contracts | $ | — | $ | 8,496 | $ | — | $ | 8,496 | ||||||||
|
|
|
|
|
|
|
| |||||||||
| (a) | Derivative financial instruments are futures contracts. Futures contracts are valued at the unrealized appreciation (depreciation) on the instrument. |
See notes to financial statements.
SCHEDULE OF INVESTMENTS | 13 |
Statement of Assets and Liabilities
March 31, 2023
iShares 400 ETF | ||||
ASSETS | ||||
Investments, at value — unaffiliated(a) | $ | 55,693,371 | ||
Investments, at value — affiliated(b) | 20,000 | |||
Cash | 5,535 | |||
Foreign currency collateral pledged for futures contracts(c) | 4,157 | |||
Foreign currency, at value(d) | 92,498 | |||
Receivables: | ||||
Investments sold | 11,216 | |||
Securities lending income — affiliated | 37 | |||
Dividends — unaffiliated | 602,487 | |||
Dividends — affiliated | 63 | |||
Variation margin on futures contracts | 10,905 | |||
|
| |||
Total assets | 56,440,269 | |||
|
| |||
LIABILITIES | ||||
Payables: | ||||
Investment advisory fees | 22,303 | |||
|
| |||
Total liabilities | 22,303 | |||
|
| |||
NET ASSETS | $ | 56,417,966 | ||
|
| |||
NET ASSETS CONSIST OF | ||||
Paid-in capital | $ | 77,967,449 | ||
Accumulated loss | (21,549,483 | ) | ||
|
| |||
NET ASSETS | $ | 56,417,966 | ||
|
| |||
NET ASSET VALUE | ||||
Shares outstanding | 900,000 | |||
|
| |||
Net asset value | $ | 62.69 | ||
|
| |||
Shares authorized | Unlimited | |||
|
| |||
Par value | None | |||
|
| |||
(a) Investments, at cost — unaffiliated | $ | 52,285,012 | ||
(b) Investments, at cost — affiliated | $ | 20,000 | ||
(c) Foreign currency collateral pledged, at cost | $ | 4,250 | ||
(d) Foreign currency, at cost | $ | 93,340 | ||
See notes to financial statements.
| 14 | 2 0 2 3 I SHARES ANNUAL REPORT TO SHAREHOLDERS |
Year Ended March 31, 2023
| | iShares JPX-Nikkei 400 ETF |
| ||
| ||||
INVESTMENT INCOME | ||||
Dividends — unaffiliated | $ | 1,544,248 | ||
Dividends — affiliated | 557 | |||
Securities lending income — affiliated — net | 551 | |||
Foreign taxes withheld | (154,152 | ) | ||
|
| |||
Total investment income | 1,391,204 | |||
|
| |||
EXPENSES | ||||
Investment advisory | 270,592 | |||
|
| |||
Total expenses | 270,592 | |||
|
| |||
Net investment income | 1,120,612 | |||
|
| |||
REALIZED AND UNREALIZED GAIN (LOSS) | ||||
Net realized gain (loss) from: | ||||
Investments — unaffiliated | (1,691,829 | ) | ||
Investments — affiliated | 653 | |||
Foreign currency transactions | (55,805 | ) | ||
Futures contracts | 10,449 | |||
In-kind redemptions — unaffiliated(a) | 2,395,202 | |||
|
| |||
| 658,670 | ||||
|
| |||
Net change in unrealized appreciation (depreciation) on: | ||||
Investments — unaffiliated | (5,212,946 | ) | ||
Investments — affiliated | (3 | ) | ||
Foreign currency translations | 25 | |||
Futures contracts | 7,669 | |||
|
| |||
| (5,205,255 | ) | |||
|
| |||
Net realized and unrealized loss | (4,546,585 | ) | ||
|
| |||
NET DECREASE IN NET ASSETS RESULTING FROM OPERATIONS | $ | (3,425,973 | ) | |
|
| |||
| (a) | See Note 2 of the Notes to Financial Statements. |
See notes to financial statements.
FINANCIAL STATEMENTS | 15 |
Statements of Changes in Net Assets
| iShares JPX-Nikkei 400 ETF | ||||||||
|
Year Ended
|
|
|
Year Ended
|
| |||
| ||||||||
INCREASE (DECREASE) IN NET ASSETS | ||||||||
OPERATIONS | ||||||||
Net investment income | $ | 1,120,612 | $ | 1,349,510 | ||||
Net realized gain (loss) | 658,670 | (1,794,704 | ) | |||||
Net change in unrealized appreciation (depreciation) | (5,205,255 | ) | (7,233,344 | ) | ||||
|
|
|
| |||||
Net decrease in net assets resulting from operations | (3,425,973 | ) | (7,678,538 | ) | ||||
|
|
|
| |||||
DISTRIBUTIONS TO SHAREHOLDERS(a) | ||||||||
Decrease in net assets resulting from distributions to shareholders | (865,818 | ) | (2,229,146 | ) | ||||
|
|
|
| |||||
CAPITAL SHARE TRANSACTIONS | ||||||||
Net decrease in net assets derived from capital share transactions | (17,344,758 | ) | — | |||||
|
|
|
| |||||
NET ASSETS | ||||||||
Total decrease in net assets | (21,636,549 | ) | (9,907,684 | ) | ||||
Beginning of year | 78,054,515 | 87,962,199 | ||||||
|
|
|
| |||||
End of year | $ | 56,417,966 | $ | 78,054,515 | ||||
|
|
|
| |||||
| (a) | Distributions for annual periods determined in accordance with U.S. federal income tax regulations. |
See notes to financial statements.
| 16 | 2 0 2 3 I SHARES ANNUAL REPORT TO SHAREHOLDERS |
(For a share outstanding throughout each period)
| iShares JPX-Nikkei 400 ETF | ||||||||||||||||||||
|
| Year Ended 03/31/23
|
|
| Year Ended 03/31/22
|
|
| Year Ended 03/31/21
|
|
| Year Ended 03/31/20
|
|
|
Year Ended
|
| ||||||
| ||||||||||||||||||||
Net asset value, beginning of year | $ | 65.05 | $ | 73.30 | $ | 53.52 | $ | 58.88 | $ | 65.42 | ||||||||||
|
|
|
|
|
|
|
|
|
| |||||||||||
Net investment income(a) | 1.16 | 1.12 | 0.88 | 0.96 | 1.06 | |||||||||||||||
Net realized and unrealized gain (loss)(b) | (2.66 | ) | (7.51 | ) | 19.82 | (5.10 | ) | (6.73 | ) | |||||||||||
|
|
|
|
|
|
|
|
|
| |||||||||||
Net increase (decrease) from investment operations | (1.50 | ) | (6.39 | ) | 20.70 | (4.14 | ) | (5.67 | ) | |||||||||||
|
|
|
|
|
|
|
|
|
| |||||||||||
Distributions from net investment income(c) | (0.86 | ) | (1.86 | ) | (0.92 | ) | (1.22 | ) | (0.87 | ) | ||||||||||
|
|
|
|
|
|
|
|
|
| |||||||||||
Net asset value, end of year | $ | 62.69 | $ | 65.05 | $ | 73.30 | $ | 53.52 | $ | 58.88 | ||||||||||
|
|
|
|
|
|
|
|
|
| |||||||||||
Total Return(d) | ||||||||||||||||||||
Based on net asset value | (2.28 | )% | (8.94 | )% | 38.91 | % | (7.29 | )% | (8.67 | )% | ||||||||||
|
|
|
|
|
|
|
|
|
| |||||||||||
Ratios to Average Net Assets(e) | ||||||||||||||||||||
Total expenses | 0.48 | % | 0.48 | % | 0.48 | % | 0.48 | % | 0.48 | % | ||||||||||
|
|
|
|
|
|
|
|
|
| |||||||||||
Net investment income | 1.99 | % | 1.57 | % | 1.36 | % | 1.61 | % | 1.73 | % | ||||||||||
|
|
|
|
|
|
|
|
|
| |||||||||||
Supplemental Data | ||||||||||||||||||||
Net assets, end of year (000) | $ | 56,418 | $ | 78,055 | $ | 87,962 | $ | 80,279 | $ | 114,817 | ||||||||||
|
|
|
|
|
|
|
|
|
| |||||||||||
Portfolio turnover rate(f) | 12 | % | 11 | % | 10 | % | 7 | % | 11 | % | ||||||||||
|
|
|
|
|
|
|
|
|
| |||||||||||
| (a) | Based on average shares outstanding. |
| (b) | The amounts reported for a share outstanding may not accord with the change in aggregate gains and losses in securities for the fiscal period due to the timing of capital share transactions in relation to the fluctuating market values of the Fund’s underlying securities. |
| (c) | Distributions for annual periods determined in accordance with U.S. federal income tax regulations. |
| (d) | Where applicable, assumes the reinvestment of distributions. |
| (e) | Excludes fees and expenses incurred indirectly as a result of investments in underlying funds. |
| (f) | Portfolio turnover rate excludes in-kind transactions. |
See notes to financial statements.
FINANCIAL HIGHLIGHTS | 17 |
| 1. | ORGANIZATION |
iShares Trust (the “Trust”) is registered under the Investment Company Act of 1940, as amended (the “1940 Act”), as an open-end management investment company. The Trust is organized as a Delaware statutory trust and is authorized to have multiple series or portfolios.
These financial statements relate only to the following fund (the “Fund”):
iShares ETF
| Diversification
| |||
JPX-Nikkei 400
|
| Diversified
|
| |
| 2. | SIGNIFICANT ACCOUNTING POLICIES |
The financial statements are prepared in conformity with accounting principles generally accepted in the United States of America (“U.S. GAAP”), which may require management to make estimates and assumptions that affect the reported amounts of assets and liabilities in the financial statements, disclosure of contingent assets and liabilities at the date of the financial statements and the reported amounts of increases and decreases in net assets from operations during the reporting period. Actual results could differ from those estimates. The Fund is considered an investment company under U.S. GAAP and follows the accounting and reporting guidance applicable to investment companies. Below is a summary of significant accounting policies:
Investment Transactions and Income Recognition: For financial reporting purposes, investment transactions are recorded on the dates the transactions are executed. Realized gains and losses on investment transactions are determined using the specific identification method. Dividend income and capital gain distributions, if any, are recorded on the ex-dividend date. Non-cash dividends, if any, are recorded on the ex-dividend date at fair value. Dividends from foreign securities where the ex-dividend date may have passed are subsequently recorded when the Fund is informed of the ex-dividend date. Under the applicable foreign tax laws, a withholding tax at various rates may be imposed on capital gains, dividends and interest.
Foreign Currency Translation: The Fund’s books and records are maintained in U.S. dollars. Securities and other assets and liabilities denominated in foreign currencies are translated into U.S. dollars using prevailing market rates as quoted by one or more data service providers. Purchases and sales of investments are recorded at the rates of exchange prevailing on the respective dates of such transactions. Generally, when the U.S. dollar rises in value against a foreign currency, the investments denominated in that currency will lose value; the opposite effect occurs if the U.S. dollar falls in relative value.
The Fund does not isolate the effect of fluctuations in foreign exchange rates from the effect of fluctuations in the market prices of investments for financial reporting purposes. Accordingly, the effects of changes in exchange rates on investments are not segregated in the Statement of Operations from the effects of changes in market prices of those investments, but are included as a component of net realized and unrealized gain (loss) from investments. The Fund reports realized currency gains (losses) on foreign currency related transactions as components of net realized gain (loss) for financial reporting purposes, whereas such components are generally treated as ordinary income for U.S. federal income tax purposes. However, the currency hedged fund has elected to treat realized gains (losses) from certain foreign currency contracts as capital gain (loss) for U.S. federal income tax purposes.
Foreign Taxes: The Fund may be subject to foreign taxes (a portion of which may be reclaimable) on income, stock dividends, capital gains on investments, or certain foreign currency transactions. All foreign taxes are recorded in accordance with the applicable foreign tax regulations and rates that exist in the foreign jurisdictions in which the Fund invests. These foreign taxes, if any, are paid by the Fund and are reflected in its Statement of Operations as follows: foreign taxes withheld at source are presented as a reduction of income, foreign taxes on securities lending income are presented as a reduction of securities lending income, foreign taxes on stock dividends are presented as “Other foreign taxes”, and foreign taxes on capital gains from sales of investments and foreign taxes on foreign currency transactions are included in their respective net realized gain (loss) categories. Foreign taxes payable or deferred as of March 31, 2023, if any, are disclosed in the Statement of Assets and Liabilities.
The Fund files withholding tax reclaims in certain jurisdictions to recover a portion of amounts previously withheld. The Fund may record a reclaim receivable based on collectability, which includes factors such as the jurisdiction’s applicable laws, payment history and market convention. The Statement of Operations includes tax reclaims recorded as well as professional and other fees, if any, associated with recovery of foreign withholding taxes.
Collateralization: If required by an exchange or counterparty agreement, the Fund may be required to deliver/deposit cash and/or securities to/with an exchange, or broker-dealer or custodian as collateral for certain investments.
In-kind Redemptions: For financial reporting purposes, in-kind redemptions are treated as sales of securities resulting in realized capital gains or losses to the Fund. Because such gains or losses are not taxable to the Fund and are not distributed to existing Fund shareholders, the gains or losses are reclassified from accumulated net realized gain (loss) to paid-in capital at the end of the Fund’s tax year. These reclassifications have no effect on net assets or net asset value (“NAV”) per share.
Distributions: Dividends and distributions paid by the Fund are recorded on the ex-dividend dates. Distributions are determined on a tax basis and may differ from net investment income and net realized capital gains for financial reporting purposes. Dividends and distributions are paid in U.S. dollars and cannot be automatically reinvested in additional shares of the Fund. The character and timing of distributions are determined in accordance with U.S. federal income tax regulations, which may differ from U.S. GAAP.
Indemnifications: In the normal course of business, the Fund enters into contracts that contain a variety of representations that provide general indemnification. The Fund’s maximum exposure under these arrangements is unknown because it involves future potential claims against the Fund, which cannot be predicted with any certainty.
| 18 | 2 0 2 3 I SHARES ANNUAL REPORT TO SHAREHOLDERS |
Notes to Financial Statements (continued)
| 3. | INVESTMENT VALUATION AND FAIR VALUE MEASUREMENTS |
Investment Valuation Policies: The Fund’s investments are valued at fair value (also referred to as “market value” within the financial statements) each day that the Fund’s listing exchange is open and, for financial reporting purposes, as of the report date. U.S. GAAP defines fair value as the price a fund would receive to sell an asset or pay to transfer a liability in an orderly transaction between market participants at the measurement date. The Board of Trustees of the Trust (the “Board”) of the Fund has approved the designation of BlackRock Fund Advisors (“BFA”), the Fund’s investment adviser, as the valuation designee for the Fund. The Fund determines the fair values of its financial instruments using various independent dealers or pricing services under BFA’s policies. If a security’s market price is not readily available or does not otherwise accurately represent the fair value of the security, the security will be valued in accordance with BFA’s policies and procedures as reflecting fair value. BFA has formed a committee (the “Valuation Committee”) to develop pricing policies and procedures and to oversee the pricing function for all financial instruments, with assistance from other BlackRock pricing committees.
Fair Value Inputs and Methodologies: The following methods and inputs are used to establish the fair value of the Fund’s assets and liabilities:
| • | Equity investments traded on a recognized securities exchange are valued at that day’s official closing price, as applicable, on the exchange where the stock is primarily traded. Equity investments traded on a recognized exchange for which there were no sales on that day are valued at the last traded price. |
| • | Investments in open-end U.S. mutual funds (including money market funds) are valued at that day’s published NAV. |
| • | Futures contracts are valued based on that day’s last reported settlement or trade price on the exchange where the contract is traded. |
Generally, trading in foreign instruments is substantially completed each day at various times prior to the close of trading on the New York Stock Exchange (“NYSE”). Each business day, the Fund uses current market factors supplied by independent pricing services to value certain foreign instruments (“Systematic Fair Value Price”). The Systematic Fair Value Price is designed to value such foreign securities at fair value as of the close of trading on the NYSE, which follows the close of the local markets.
If events (e.g., market volatility, company announcement or a natural disaster) occur that are expected to materially affect the value of such investment, or in the event that application of these methods of valuation results in a price for an investment that is deemed not to be representative of the market value of such investment, or if a price is not available, the investment will be valued by the Valuation Committee, in accordance with BFA’s policies and procedures as reflecting fair value (“Fair Valued Investments”). The fair valuation approaches that may be used by the Valuation Committee include market approach, income approach and cost approach. Valuation techniques such as discounted cash flow, use of market comparables and matrix pricing are types of valuation approaches and are typically used in determining fair value. When determining the price for Fair Valued Investments, the Valuation Committee seeks to determine the price that the Fund might reasonably expect to receive or pay from the current sale or purchase of that asset or liability in an arm’s-length transaction. Fair value determinations shall be based upon all available factors that the Valuation Committee deems relevant and consistent with the principles of fair value measurement.
Fair value pricing could result in a difference between the prices used to calculate a fund’s NAV and the prices used by the fund’s underlying index, which in turn could result in a difference between the fund’s performance and the performance of the fund’s underlying index.
Fair Value Hierarchy: Various inputs are used in determining the fair value of financial instruments. These inputs to valuation techniques are categorized into a fair value hierarchy consisting of three broad levels for financial reporting purposes as follows:
| • | Level 1 – Unadjusted price quotations in active markets/exchanges for identical assets or liabilities that the Fund has the ability to access; |
| • | Level 2 – Other observable inputs (including, but not limited to, quoted prices for similar assets or liabilities in markets that are active, quoted prices for identical or similar assets or liabilities in markets that are not active, inputs other than quoted prices that are observable for the assets or liabilities (such as interest rates, yield curves, volatilities, prepayment speeds, loss severities, credit risks and default rates) or other market-corroborated inputs); and |
| • | Level 3 – Unobservable inputs based on the best information available in the circumstances, to the extent observable inputs are not available, (including the Valuation Committee’s assumptions used in determining the fair value of financial instruments). |
The hierarchy gives the highest priority to unadjusted quoted prices in active markets for identical assets or liabilities (Level 1 measurements) and the lowest priority to unobservable inputs (Level 3 measurements). Accordingly, the degree of judgment exercised in determining fair value is greatest for instruments categorized in Level 3. The inputs used to measure fair value may fall into different levels of the fair value hierarchy. In such cases, for disclosure purposes, the fair value hierarchy classification is determined based on the lowest level input that is significant to the fair value measurement in its entirety. Investments classified within Level 3 have significant unobservable inputs used by the Valuation Committee in determining the price for Fair Valued Investments. Level 3 investments include equity or debt issued by privately held companies or funds that may not have a secondary market and/or may have a limited number of investors. The categorization of a value determined for financial instruments is based on the pricing transparency of the financial instruments and is not necessarily an indication of the risks associated with investing in those securities.
| 4. | SECURITIES AND OTHER INVESTMENTS |
Securities Lending: The Fund may lend its securities to approved borrowers, such as brokers, dealers and other financial institutions. The borrower pledges and maintains with the Fund collateral consisting of cash, an irrevocable letter of credit issued by an approved bank, or securities issued or guaranteed by the U.S. government. The initial collateral received by the Fund is required to have a value of at least 102% of the current market value of the loaned securities for securities traded on U.S. exchanges and a value of at least 105% for all other securities. The collateral is maintained thereafter at a value equal to at least 100% of the current value of the securities on loan. The market value of the loaned securities is determined at the close of each business day of the Fund and any additional required collateral is delivered to the Fund or excess
NOTES TO FINANCIAL STATEMENTS | 19 |
Notes to Financial Statements (continued)
collateral is returned by the Fund, on the next business day. During the term of the loan, the Fund is entitled to all distributions made on or in respect of the loaned securities but does not receive interest income on securities received as collateral. Loans of securities are terminable at any time and the borrower, after notice, is required to return borrowed securities within the standard time period for settlement of securities transactions.
As of period end, any securities on loan were collateralized by cash and/or U.S. Government obligations. Cash collateral invested in money market funds managed by BFA, or its affiliates is disclosed in the Schedule of Investments. Any non-cash collateral received cannot be sold, re-invested or pledged by the Fund, except in the event of borrower default. The securities on loan, if any, are also disclosed in the Fund’s Schedule of Investments. The market value of any securities on loan and the value of any related cash collateral are disclosed in the Statement of Assets and Liabilities.
Securities lending transactions are entered into by the Fund under Master Securities Lending Agreements (each, an “MSLA”) which provide the right, in the event of default (including bankruptcy or insolvency) for the non-defaulting party to liquidate the collateral and calculate a net exposure to the defaulting party or request additional collateral. In the event that a borrower defaults, the Fund, as lender, would offset the market value of the collateral received against the market value of the securities loaned. When the value of the collateral is greater than that of the market value of the securities loaned, the lender is left with a net amount payable to the defaulting party. However, bankruptcy or insolvency laws of a particular jurisdiction may impose restrictions on or prohibitions against such a right of offset in the event of an MSLA counterparty’s bankruptcy or insolvency. Under the MSLA, absent an event of default, the borrower can resell or re-pledge the loaned securities, and the Fund can reinvest cash collateral received in connection with loaned securities. Upon an event of default, the parties’ obligations to return the securities or collateral to the other party are extinguished, and the parties can resell or re-pledge the loaned securities or the collateral received in connection with the loaned securities in order to satisfy the defaulting party’s net payment obligation for all transactions under the MSLA. The defaulting party remains liable for any deficiency.
The risks of securities lending include the risk that the borrower may not provide additional collateral when required or may not return the securities when due. To mitigate these risks, the Fund benefits from a borrower default indemnity provided by BlackRock, Inc. (“BlackRock”). BlackRock’s indemnity allows for full replacement of the securities loaned to the extent the collateral received does not cover the value of the securities loaned in the event of borrower default. The Fund could incur a loss if the value of an investment purchased with cash collateral falls below the market value of the loaned securities or if the value of an investment purchased with cash collateral falls below the value of the original cash collateral received. Such losses are borne entirely by the Fund.
| 5. | DERIVATIVE FINANCIAL INSTRUMENTS |
Futures Contracts: Futures contracts are purchased or sold to gain exposure to, or manage exposure to, changes in interest rates (interest rate risk) and changes in the value of equity securities (equity risk) or foreign currencies (foreign currency exchange rate risk).
Futures contracts are exchange-traded agreements between the Fund and a counterparty to buy or sell a specific quantity of an underlying instrument at a specified price and on a specified date. Depending on the terms of a contract, it is settled either through physical delivery of the underlying instrument on the settlement date or by payment of a cash amount on the settlement date. Upon entering into a futures contract, the Fund is required to deposit initial margin with the broker in the form of cash or securities in an amount that varies depending on a contract’s size and risk profile. The initial margin deposit must then be maintained at an established level over the life of the contract. Amounts pledged, which are considered restricted, are included in cash pledged for futures contracts in the Statement of Assets and Liabilities.
Securities deposited as initial margin are designated in the Schedule of Investments and cash deposited, if any, are shown as cash pledged for futures contracts in the Statement of Assets and Liabilities. Pursuant to the contract, the Fund agrees to receive from or pay to the broker an amount of cash equal to the daily fluctuation in market value of the contract (“variation margin”). Variation margin is recorded as unrealized appreciation (depreciation) and, if any, shown as variation margin receivable (or payable) on futures contracts in the Statement of Assets and Liabilities. When the contract is closed, a realized gain or loss is recorded in the Statement of Operations equal to the difference between the notional amount of the contract at the time it was opened and the notional amount at the time it was closed. The use of futures contracts involves the risk of an imperfect correlation in the movements in the price of futures contracts and interest rates, foreign currency exchange rates or underlying assets.
| 6. | INVESTMENT ADVISORY AGREEMENT AND OTHER TRANSACTIONS WITH AFFILIATES |
Investment Advisory Fees: Pursuant to an Investment Advisory Agreement with the Trust, BFA manages the investment of the Fund’s assets. BFA is a California corporation indirectly owned by BlackRock. Under the Investment Advisory Agreement, BFA is responsible for substantially all expenses of the Fund, except (i) interest and taxes; (ii) brokerage commissions and other expenses connected with the execution of portfolio transactions; (iii) distribution fees; (iv) the advisory fee payable to BFA; and (v) litigation expenses and any extraordinary expenses (in each case as determined by a majority of the independent trustees).
For its investment advisory services to the Fund, BFA is entitled to an annual investment advisory fee of 0.48%, accrued daily and paid monthly by the Fund, based on the average daily net assets of the Fund.
Distributor: BlackRock Investments, LLC, an affiliate of BFA, is the distributor for the Fund. Pursuant to the distribution agreement, BFA is responsible for any fees or expenses for distribution services provided to the Fund.
Securities Lending: The U.S. Securities and Exchange Commission (the “SEC”) has issued an exemptive order which permits BlackRock Institutional Trust Company, N.A. (“BTC”), an affiliate of BFA, to serve as securities lending agent for the Fund, subject to applicable conditions. As securities lending agent, BTC bears all operational costs directly related to securities lending, including any custodial costs. The Fund is responsible for fees in connection with the investment of cash collateral received for securities on loan (the “collateral investment fees”). The cash collateral is invested in a money market fund, BlackRock Cash Funds: Institutional or BlackRock Cash Funds: Treasury, managed by BFA, or its affiliates. However, BTC has agreed to reduce the amount of securities lending income it receives in order to effectively limit the collateral investment fees the Fund bears to an annual rate of 0.04%. The SL Agency Shares of such money market fund will not be subject to a sales load, distribution fee
| 20 | 2 0 2 3 I SHARES ANNUAL REPORT TO SHAREHOLDERS |
Notes to Financial Statements (continued)
or service fee. The money market fund in which the cash collateral has been invested may, under certain circumstances, impose a liquidity fee of up to 2% of the value redeemed or temporarily restrict redemptions for up to 10 business days during a 90 day period, in the event that the money market fund’s weekly liquid assets fall below certain thresholds.
Securities lending income is equal to the total of income earned from the reinvestment of cash collateral, net of fees and other payments to and from borrowers of securities, and less the collateral investment fees. The Fund retains a portion of securities lending income and remits the remaining portion to BTC as compensation for its services as securities lending agent.
Pursuant to the current securities lending agreement, the Fund retains 82% of securities lending income (which excludes collateral investment fees), and the amount retained can never be less than 70% of the total of securities lending income plus the collateral investment fees.
In addition, commencing the business day following the date that the aggregate securities lending income plus the collateral investment fees generated across all 1940 Act iShares exchange-traded funds (the “iShares ETF Complex”) in that calendar year exceeds a specified threshold, the Fund, pursuant to the securities lending agreement, will retain for the remainder of that calendar year 85% of securities lending income (which excludes collateral investment fees), and the amount retained can never be less than 70% of the total of securities lending income plus the collateral investment fees.
The share of securities lending income earned by the Fund is shown as securities lending income – affiliated – net in its Statement of Operations. For the year ended March 31, 2023, the Fund paid BTC $201 for securities lending agent services.
Officers and Trustees: Certain officers and/or trustees of the Trust are officers and/or trustees of BlackRock or its affiliates.
Other Transactions: Cross trading is the buying or selling of portfolio securities between funds to which BFA (or an affiliate) serves as investment adviser. At its regularly scheduled quarterly meetings, the Board reviews such transactions as of the most recent calendar quarter for compliance with the requirements and restrictions set forth by Rule 17a-7.
For the year ended March 31, 2023, transactions executed by the Fund pursuant to Rule 17a-7 under the 1940 Act were as follows:
iShares ETF
| Purchases
| Sales
|
Net Realized
| |||||||||
JPX-Nikkei 400
| $
| 26,255
|
| $
| 79,686
|
| $
| (19,324
| )
| |||
The Fund may invest its positive cash balances in certain money market funds managed by BFA or an affiliate. The income earned on these temporary cash investments is shown as dividends – affiliated in the Statement of Operations.
A fund, in order to improve its portfolio liquidity and its ability to track its underlying index, may invest in shares of other iShares funds that invest in securities in the fund’s underlying index.
| 7. | PURCHASES AND SALES |
For the year ended March 31, 2023, purchases and sales of investments, excluding short-term securities and in-kind transactions, were as follows:
iShares ETF
|
Purchases
| Sales
| ||||||
JPX-Nikkei 400
|
$
|
6,746,656
|
|
$
|
7,042,460
|
| ||
For the year ended March 31, 2023, in-kind transactions were as follows:
| iShares ETF |
In-kind | In-kind Sales | ||||||
JPX-Nikkei 400
|
$
|
—
|
|
$
|
16,667,500
|
| ||
| 8. | INCOME TAX INFORMATION |
The Fund is treated as an entity separate from the Trust’s other funds for federal income tax purposes. It is the Fund’s policy to comply with the requirements of the Internal Revenue Code of 1986, as amended, applicable to regulated investment companies, and to distribute substantially all of its taxable income to its shareholders. Therefore, no U.S. federal income tax provision is required.
Management has analyzed tax laws and regulations and their application to the Fund as of March 31, 2023, inclusive of the open tax return years, and does not believe that there are any uncertain tax positions that require recognition of a tax liability in the Fund’s financial statements.
NOTES TO FINANCIAL STATEMENTS | 21 |
Notes to Financial Statements (continued)
U.S. GAAP requires that certain components of net assets be adjusted to reflect permanent differences between financial and tax reporting. These reclassifications have no effect on net assets or NAV per share. As of March 31, 2023, permanent differences attributable to realized gains (losses) from in-kind redemptions were reclassified to the following accounts:
| ||||||
| iShares ETF | Paid-in Capital |
Accumulated | ||||
| ||||||
JPX-Nikkei 400 | $ | 1,929,955 | $ (1,929,955) | |||
| ||||||
The tax character of distributions paid was as follows:
| ||||||||
| iShares ETF | Year Ended 03/31/23 |
Year Ended | ||||||
| ||||||||
JPX-Nikkei 400 | ||||||||
Ordinary income | $ | 865,818 | $ | 2,229,146 | ||||
|
|
|
| |||||
As of March 31, 2023, the tax components of accumulated net earnings (losses) were as follows:
iShares ETF | | Undistributed Ordinary Income | | | Non-expiring Capital Loss Carryforwards | (a) | | Net Unrealized Gains (Losses) | (b) | Total | ||||||
JPX-Nikkei 400 | $ | 535,936 | $ | (24,591,227 | ) | $ | 2,505,808 | $ | (21,549,483 | ) |
| (a) | Amounts available to offset future realized capital gains. |
| (b) | The difference between book-basis and tax-basis unrealized gains (losses) was attributable primarily to the tax deferral of losses on wash sales and the realization for tax purposes of unrealized gains on investments in passive foreign investment companies. |
A fund may own shares in certain foreign investment entities, referred to, under U.S. tax law, as “passive foreign investment companies.” Such fund may elect to mark-to-market annually the shares of each passive foreign investment company and would be required to distribute to shareholders any such marked-to-market gains.
As of March 31, 2023, gross unrealized appreciation and depreciation based on cost of investments (including short positions and derivatives, if any) for U.S. federal income tax purposes were as follows:
| iShares ETF | Tax Cost | Gross Unrealized Appreciation | Gross Unrealized Depreciation | Net Unrealized Appreciation (Depreciation) | ||||||||||||
JPX-Nikkei 400 | $ | 53,215,126 | $ | 10,119,869 | $ | (7,613,128 | ) | $ | 2,506,741 | |||||||
| 9. | PRINCIPAL RISKS |
In the normal course of business, the Fund invests in securities or other instruments and may enter into certain transactions, and such activities subject the Fund to various risks, including, among others, fluctuations in the market (market risk) or failure of an issuer to meet all of its obligations. The value of securities or other instruments may also be affected by various factors, including, without limitation: (i) the general economy; (ii) the overall market as well as local, regional or global political and/or social instability; (iii) regulation, taxation or international tax treaties between various countries; or (iv) currency, interest rate or price fluctuations. Local, regional or global events such as war, acts of terrorism, the spread of infectious illness or other public health issues, recessions, or other events could have a significant impact on the Fund and its investments. The Fund’s prospectus provides details of the risks to which the Fund is subject.
BFA uses a “passive” or index approach to try to achieve the Fund’s investment objective following the securities included in its underlying index during upturns as well as downturns. BFA does not take steps to reduce market exposure or to lessen the effects of a declining market. Divergence from the underlying index and the composition of the portfolio is monitored by BFA.
The Fund may be exposed to additional risks when reinvesting cash collateral in money market funds that do not seek to maintain a stable NAV per share of $1.00, which may be subject to redemption gates or liquidity fees under certain circumstances.
Infectious Illness Risk: An outbreak of an infectious illness, such as the COVID-19 pandemic, may adversely impact the economies of many nations and the global economy, and may impact individual issuers and capital markets in ways that cannot be foreseen. An infectious illness outbreak may result in, among other things, closed international borders, prolonged quarantines, supply chain disruptions, market volatility or disruptions and other significant economic, social and political impacts.
Valuation Risk: The market values of equities, such as common stocks and preferred securities or equity related investments, such as futures and options, may decline due to general market conditions which are not specifically related to a particular company. They may also decline due to factors which affect a particular industry or industries. A fund may invest in illiquid investments. An illiquid investment is any investment that a fund reasonably expects cannot be sold or disposed of in current market conditions in seven calendar days or less without the sale or disposition significantly changing the market value of the investment. A fund may experience difficulty in selling illiquid investments in a timely manner at the price that it believes the investments are worth. Prices may fluctuate widely over short or extended periods in response to
| 22 | 2 0 2 3 I SHARES ANNUAL REPORT TO SHAREHOLDERS |
Notes to Financial Statements (continued)
company, market or economic news. Markets also tend to move in cycles, with periods of rising and falling prices. This volatility may cause a fund’s NAV to experience significant increases or decreases over short periods of time. If there is a general decline in the securities and other markets, the NAV of a fund may lose value, regardless of the individual results of the securities and other instruments in which a fund invests.
Counterparty Credit Risk: The Fund may be exposed to counterparty credit risk, or the risk that an entity may fail to or be unable to perform on its commitments related to unsettled or open transactions, including making timely interest and/or principal payments or otherwise honoring its obligations. The Fund manages counterparty credit risk by entering into transactions only with counterparties that BFA believes have the financial resources to honor their obligations and by monitoring the financial stability of those counterparties. Financial assets, which potentially expose the Fund to market, issuer and counterparty credit risks, consist principally of financial instruments and receivables due from counterparties. The extent of the Fund’s exposure to market, issuer and counterparty credit risks with respect to these financial assets is approximately their value recorded in the Statement of Assets and Liabilities, less any collateral held by the Fund.
A derivative contract may suffer a mark-to-market loss if the value of the contract decreases due to an unfavorable change in the market rates or values of the underlying instrument. Losses can also occur if the counterparty does not perform under the contract.
With exchange-traded futures, there is less counterparty credit risk to the Fund since the exchange or clearinghouse, as counterparty to such instruments, guarantees against a possible default. The clearinghouse stands between the buyer and the seller of the contract; therefore, credit risk is limited to failure of the clearinghouse. While offset rights may exist under applicable law, a fund does not have a contractual right of offset against a clearing broker or clearinghouse in the event of a default (including the bankruptcy or insolvency). Additionally, credit risk exists in exchange-traded futures with respect to initial and variation margin that is held in a clearing broker’s customer accounts. While clearing brokers are required to segregate customer margin from their own assets, in the event that a clearing broker becomes insolvent or goes into bankruptcy and at that time there is a shortfall in the aggregate amount of margin held by the clearing broker for all its clients, typically the shortfall would be allocated on a pro rata basis across all the clearing broker’s customers, potentially resulting in losses to the Fund.
Concentration Risk: A diversified portfolio, where this is appropriate and consistent with a fund’s objectives, minimizes the risk that a price change of a particular investment will have a material impact on the NAV of a fund. The investment concentrations within the Fund’s portfolio are disclosed in its Schedule of Investments.
The Fund invests a significant portion of its assets in issuers located in a single country or a limited number of countries. When a fund concentrates its investments in this manner, it assumes the risk that economic, regulatory, political and social conditions in that country or those countries may have a significant impact on the fund and could affect the income from, or the value or liquidity of, the Fund’s portfolio. Unanticipated or sudden political or social developments may cause uncertainty in the markets and as a result adversely affect the Fund’s investments. Foreign issuers may not be subject to the same uniform accounting, auditing and financial reporting standards and practices as used in the United States. Foreign securities markets may also be more volatile and less liquid than U.S. securities and may be less subject to governmental supervision not typically associated with investing in U.S. securities.
The Fund invests a significant portion of its assets in securities of issuers located in Asia or with significant exposure to Asian issuers or countries. The Asian financial markets have recently experienced volatility and adverse trends due to concerns in several Asian countries regarding monetary policy, government intervention in the markets, rising government debt levels or economic downturns. These events may spread to other countries in Asia and may affect the value and liquidity of certain of the Fund’s investments.
Significant Shareholder Redemption Risk: Certain shareholders may own or manage a substantial amount of fund shares and/or hold their fund investments for a limited period of time. Large redemptions of fund shares by these shareholders may force a fund to sell portfolio securities, which may negatively impact the fund’s NAV, increase the fund’s brokerage costs, and/or accelerate the realization of taxable income/gains and cause the fund to make additional taxable distributions to shareholders.
| 10. | CAPITAL SHARE TRANSACTIONS |
Capital shares are issued and redeemed by the Fund only in aggregations of a specified number of shares or multiples thereof (“Creation Units”) at NAV. Except when aggregated in Creation Units, shares of the Fund are not redeemable.
Transactions in capital shares were as follows:
| ||||||||||||||||
| Year Ended 03/31/23 | Year Ended 03/31/22 | |||||||||||||||
| iShares ETF | Shares | Amount | Shares | Amount | ||||||||||||
JPX-Nikkei 400 | ||||||||||||||||
Shares redeemed | (300,000 | ) | $ | (17,344,758 | ) | — | $ | — | ||||||||
|
|
|
|
|
|
|
| |||||||||
The consideration for the purchase of Creation Units of a fund in the Trust generally consists of the in-kind deposit of a designated portfolio of securities and a specified amount of cash. Certain funds in the Trust may be offered in Creation Units solely or partially for cash in U.S. dollars. Investors purchasing and redeeming Creation Units may pay a purchase transaction fee and a redemption transaction fee directly to State Street Bank and Trust Company, the Trust’s administrator, to offset transfer and other transaction costs associated with the issuance and redemption of Creation Units, including Creation Units for cash. Investors transacting in Creation Units for cash may also pay an additional variable charge to compensate the relevant fund for certain transaction costs (i.e., stamp taxes, taxes on currency or other financial transactions, and brokerage costs) and market impact expenses relating to investing in portfolio securities. Such variable charges, if any, are included in shares sold in the table above.
NOTES TO FINANCIAL STATEMENTS | 23 |
Notes to Financial Statements (continued)
From time to time, settlement of securities related to in-kind contributions or in-kind redemptions may be delayed. In such cases, securities related to in-kind transactions are reflected as a receivable or a payable in the Statement of Assets and Liabilities.
| 11. | SUBSEQUENT EVENTS |
Management has evaluated the impact of all subsequent events on the Fund through the date the financial statements were available to be issued and has determined that there were no subsequent events requiring adjustment or additional disclosure in the financial statements.
| 24 | 2 0 2 3 I SHARES ANNUAL REPORT TO SHAREHOLDERS |
Report of Independent Registered Public Accounting Firm
To the Board of Trustees of
iShares Trust and Shareholders of iShares JPX-Nikkei 400 ETF
Opinion on the Financial Statements
We have audited the accompanying statement of assets and liabilities, including the schedule of investments, of iShares JPX-Nikkei 400 ETF (one of the funds constituting iShares Trust, referred to hereafter as the “Fund”) as of March 31, 2023, the related statement of operations for the year ended March 31, 2023, the statements of changes in net assets for each of the two years in the period ended March 31, 2023, including the related notes, and the financial highlights for each of the five years in the period ended March 31, 2023 (collectively referred to as the “financial statements”). In our opinion, the financial statements present fairly, in all material respects, the financial position of the Fund as of March 31, 2023, the results of its operations for the year then ended, the changes in its net assets for each of the two years in the period ended March 31, 2023 and the financial highlights for each of the five years in the period ended March 31, 2023 in conformity with accounting principles generally accepted in the United States of America.
Basis for Opinion
These financial statements are the responsibility of the Fund’s management. Our responsibility is to express an opinion on the Fund’s financial statements based on our audits. We are a public accounting firm registered with the Public Company Accounting Oversight Board (United States) (PCAOB) and are required to be independent with respect to the Fund in accordance with the U.S. federal securities laws and the applicable rules and regulations of the Securities and Exchange Commission and the PCAOB.
We conducted our audits of these financial statements in accordance with the standards of the PCAOB. Those standards require that we plan and perform the audit to obtain reasonable assurance about whether the financial statements are free of material misstatement, whether due to error or fraud.
Our audits included performing procedures to assess the risks of material misstatement of the financial statements, whether due to error or fraud, and performing procedures that respond to those risks. Such procedures included examining, on a test basis, evidence regarding the amounts and disclosures in the financial statements. Our audits also included evaluating the accounting principles used and significant estimates made by management, as well as evaluating the overall presentation of the financial statements. Our procedures included confirmation of securities owned as of March 31, 2023 by correspondence with the custodian, transfer agent and brokers. We believe that our audits provide a reasonable basis for our opinion.
/s/PricewaterhouseCoopers LLP
Philadelphia, Pennsylvania
May 25, 2023
We have served as the auditor of one or more BlackRock investment companies since 2000.
REPORT OF INDEPENDENT REGISTERED PUBLIC ACCOUNTING FIRM | 25 |
Important Tax Information (unaudited)
The following amount, or maximum amount allowable by law, are hereby designated as qualified dividend income for individuals for the fiscal year ended March 31, 2023:
| iShares ETF | Qualified Dividend Income | |||
JPX-Nikkei 400 | $ | 1,468,770 | ||
The Fund intends to pass through to its shareholders the following amount, or maximum amounts allowable by law, of foreign source income earned and foreign taxes paid for the fiscal year ended March 31, 2023:
| iShares ETF | Foreign Source Income Earned | Foreign Taxes Paid | ||||||
JPX-Nikkei 400 | $ | 1,544,388 | $ | 171,142 | ||||
| 26 | 2 0 2 3 I SHARES ANNUAL REPORT TO SHAREHOLDERS |
Statement Regarding Liquidity Risk Management Program (unaudited)
In compliance with Rule 22e-4 under the Investment Company Act of 1940, as amended (the “Liquidity Rule”), iShares Trust (the “Trust”) has adopted and implemented a liquidity risk management program (the “Program”) for iShares JPX-Nikkei 400 ETF (the “Fund” or “ETF”), a series of the Trust, which is reasonably designed to assess and manage the Fund’s liquidity risk.
The Board of Trustees (the “Board”) of the Trust, on behalf of the Fund, met on December 9, 2022 (the “Meeting”) to review the Program. The Board previously appointed BlackRock Fund Advisors (“BlackRock”), the investment adviser to the Fund, as the program administrator for the Fund’s Program. BlackRock also previously delegated oversight of the Program to the 40 Act Liquidity Risk Management Committee (the “Committee”). At the Meeting, the Committee, on behalf of BlackRock, provided the Board with a report that addressed the operation of the Program and assessed its adequacy and effectiveness of implementation, including the management of the Fund’s Highly Liquid Investment Minimum (“HLIM”) where applicable, and any material changes to the Program (the “Report”). The Report covered the period from October 1, 2021 through September 30, 2022 (the “Program Reporting Period”).
The Report described the Program’s liquidity classification methodology for categorizing the Fund’s investments (including derivative transactions) into one of four liquidity buckets. It also referenced the methodology used by BlackRock to establish the Fund’s HLIM and noted that the Committee reviews and ratifies the HLIM assigned to the Fund no less frequently than annually. The Report also discussed notable events affecting liquidity over the Program Reporting Period, including extended market holidays, the imposition of capital controls in certain non-U.S. countries, Russian sanctions and the closure of the Russian securities market.
The Report noted that the Program complied with the key factors for consideration under the Liquidity Rule for assessing, managing and periodically reviewing the Fund’s liquidity risk, as follows:
| a) | The Fund’s investment strategy and liquidity of portfolio investments during both normal and reasonably foreseeable stressed conditions. During the Program Reporting Period, the Committee reviewed whether the Fund’s strategy is appropriate for an open-end fund structure, with a focus on funds with more significant and consistent holdings of less liquid and illiquid assets. The Committee also factored a fund’s concentration in an issuer into the liquidity classification methodology by taking issuer position sizes into account. Derivative exposure was also considered in the calculation of a fund’s liquidity bucketing. Finally, a factor for consideration under the Liquidity Rule is a Fund’s use of borrowings for investment purposes. However, the Funds do not borrow for investment purposes. |
| b) | Short-term and long-term cash flow projections during both normal and reasonably foreseeable stressed conditions. During the Program Reporting Period, the Committee reviewed historical redemption activity and used this information as a component to establish each ETF’s reasonably anticipated trading size (“RATS”). The Committee may also take into consideration a fund’s shareholder ownership concentration (which, depending on product type and distribution channel, may or may not be available), a fund’s distribution channels, and the degree of certainty associated with a fund’s short-term and long-term cash flow projections. |
| c) | Holdings of cash and cash equivalents, as well as borrowing arrangements. The Committee considered that ETFs generally do not hold more than de minimis amounts of cash. The Committee also considered that ETFs generally do not engage in borrowing. |
| d) | The relationship between an ETF’s portfolio liquidity and the way in which, and the prices and spreads at which, ETF shares trade, including the efficiency of the arbitrage function and the level of active participation by market participants, including authorized participants. The Committee monitored the prevailing bid/ask spread and the ETF price premium (or discount) to NAV for all ETFs. However, there were no ETFs with persistent deviations of fund premium/discount or bid/ask spreads from long-term averages over the Program Reporting Period. |
| e) | The effect of the composition of baskets on the overall liquidity of an ETF’s portfolio. In reviewing the linkage between the composition of custom baskets accepted by an ETF and any significant change in the liquidity profile of such ETF, the Committee reviewed changes in the proportion of each ETF’s portfolio comprised of less liquid and illiquid holdings to determine if applicable thresholds were met requiring enhanced review. |
There were no material changes to the Program during the Program Reporting Period other than the enhancement of certain model components in the Program’s classification methodology. The Report provided to the Board stated that the Committee concluded that based on the operation of the functions, as described in the Report, the Program is operating as intended and is effective in implementing the requirements of the Liquidity Rule.
STATEMENT REGARDING LIQUIDITY RISK MANAGEMENT PROGRAM | 27 |
Supplemental Information (unaudited)
Section 19(a) Notices
The amounts and sources of distributions reported are estimates and are being provided pursuant to regulatory requirements and are not being provided for tax reporting purposes. The actual amounts and sources for tax reporting purposes will depend upon the Fund’s investment experience during the year and may be subject to changes based on tax regulations. Shareholders will receive a Form 1099-DIV each calendar year that will inform them how to report these distributions for federal income tax purposes.
March 31, 2023
| Total Cumulative Distributions for the Fiscal Year | % Breakdown of the Total Cumulative Distributions for the Fiscal Year | |||||||||||||||||||||||||||||||
| iShares ETF | Net Investment Income | Net Realized Capital Gains | Return of Capital | Total Per Share | Net Investment Income | Net Realized Capital Gains | Return of Capital | Total Per Share | ||||||||||||||||||||||||
JPX-Nikkei 400 | $ | 0.858656 | $ | — | $ | — | $ | 0.858656 | 100 | % | — | % | — | % | 100 | % | ||||||||||||||||
Premium/Discount Information
Information on the Fund’s net asset value, market price, premiums and discounts, and bid-ask spreads can be found at iShares.com.
| 28 | 2 0 2 3 I SHARES ANNUAL REPORT TO SHAREHOLDERS |
Trustee and Officer Information (unaudited)
The Board of Trustees has responsibility for the overall management and operations of the Funds, including general supervision of the duties performed by BFA and other service providers. Each Trustee serves until he or she resigns, is removed, dies, retires or becomes incapacitated. Each officer shall hold office until his or her successor is elected and qualifies or until his or her death, resignation or removal. Trustees who are not “interested persons” (as defined in the 1940 Act) of the Trust are referred to as independent trustees (“Independent Trustees”).
The registered investment companies advised by BFA or its affiliates (the “BlackRock-advised Funds”) are organized into one complex of open-end equity, multi-asset, index and money market funds and ETFs (the “BlackRock Multi-Asset Complex”), one complex of closed-end funds and open-end non-index fixed-income funds (including ETFs) (the “BlackRock Fixed-Income Complex”) and one complex of ETFs (“Exchange-Traded Fund Complex”) (each, a “BlackRock Fund Complex”). Each Fund is included in the Exchange-Traded Fund Complex. Each Trustee also serves as a Director of iShares, Inc. and a Trustee of iShares U.S. ETF Trust and, as a result, oversees all of the funds within the Exchange-Traded Fund Complex, which consists of 380 funds as of March 31, 2023. With the exception of Robert S. Kapito, Salim Ramji and Charles Park, the address of each Trustee and officer is c/o BlackRock, Inc., 400 Howard Street, San Francisco, CA 94105. The address of Mr. Kapito, Mr. Ramji and Mr. Park is c/o BlackRock, Inc., 50 Hudson Yards, New York, NY 10001. The Board has designated John E. Kerrigan as its Independent Board Chair. Additional information about the Funds’ Trustees and officers may be found in the Funds’ combined Statement of Additional Information, which is available without charge, upon request, by calling toll-free 1-800-iShares (1-800-474-2737).
| Interested Trustees | ||||||
Name (Year of Birth) | Position(s) | Principal Occupation(s) During Past 5 Years | Other Directorships Held by Trustee | |||
Robert S. Kapito(a) (1957) | Trustee (since 2009). | President, BlackRock, Inc. (since 2006); Vice Chairman of BlackRock, Inc. and Head of BlackRock’s Portfolio Management Group (since its formation in 1998) and BlackRock, Inc.’s predecessor entities (since 1988); Trustee, University of Pennsylvania (since 2009); President of Board of Directors, Hope & Heroes Children’s Cancer Fund (since 2002). | Director of BlackRock, Inc. (since 2006); Director of iShares, Inc. (since 2009); Trustee of iShares U.S. ETF Trust (since 2011). | |||
Salim Ramji(b) (1970) | Trustee (since 2019). | Senior Managing Director, BlackRock, Inc. (since 2014); Global Head of BlackRock’s ETF and Index Investments Business (since 2019); Head of BlackRock’s U.S. Wealth Advisory Business (2015-2019); Global Head of Corporate Strategy, BlackRock, Inc. (2014-2015); Senior Partner, McKinsey & Company (2010-2014). | Director of iShares, Inc. (since 2019); Trustee of iShares U.S. ETF Trust (since 2019). | |||
| (a) | Robert S. Kapito is deemed to be an “interested person” (as defined in the 1940 Act) of the Trust due to his affiliations with BlackRock, Inc. and its affiliates. |
| (b) | Salim Ramji is deemed to be an “interested person” (as defined in the 1940 Act) of the Trust due to his affiliations with BlackRock, Inc. and its affiliates. |
| Independent Trustees | ||||||
Name (Year of Birth) | Position(s) | Principal Occupation(s) During Past 5 Years | Other Directorships Held by Trustee | |||
John E. Kerrigan (1955) | Trustee (since 2005); Independent Board Chair (since 2022). | Chief Investment Officer, Santa Clara University (since 2002). | Director of iShares, Inc. (since 2005); Trustee of iShares U.S. ETF Trust (since 2011); Independent Board Chair of iShares, Inc. and iShares U.S. ETF Trust (since 2022). | |||
Jane D. Carlin (1956) | Trustee (since 2015); Risk Committee Chair (since 2016). | Consultant (since 2012); Member of the Audit Committee (2012-2018), Chair of the Nominating and Governance Committee (2017-2018) and Director of PHH Corporation (mortgage solutions) (2012-2018); Managing Director and Global Head of Financial Holding Company Governance & Assurance and the Global Head of Operational Risk Management of Morgan Stanley (2006-2012). | Director of iShares, Inc. (since 2015); Trustee of iShares U.S. ETF Trust (since 2015); Member of the Audit Committee (since 2016), Chair of the Audit Committee (since 2020) and Director of The Hanover Insurance Group, Inc. (since 2016). | |||
Richard L. Fagnani (1954) | Trustee (since 2017); Audit Committee Chair (since 2019). | Partner, KPMG LLP (2002-2016); Director of One Generation Away (since 2021). | Director of iShares, Inc. (since 2017); Trustee of iShares U.S. ETF Trust (since 2017). | |||
TRUSTEE AND OFFICER INFORMATION | 29 |
Trustee and Officer Information (unaudited (continued)
| Independent Trustees (continued) | ||||||
Name (Year of Birth) | Position(s) | Principal Occupation(s) During Past 5 Years | Other Directorships Held by Trustee | |||
Cecilia H. Herbert (1949) | Trustee (since 2005); Nominating and Governance and Equity Plus Committee Chairs (since 2022). | Chair of the Finance Committee (since 2019) and Trustee and Member of the Finance, Audit and Quality Committees of Stanford Health Care (since 2016); Trustee of WNET, New York’s public media company (since 2011) and Member of the Audit Committee (since 2018), Investment Committee (since 2011) and Personnel Committee (since 2022); Chair (1994-2005) and Member (1992-2021) of the Investment Committee, Archdiocese of San Francisco; Trustee of Forward Funds (14 portfolios) (2009-2018); Trustee of Salient MF Trust (4 portfolios) (2015-2018); Director (1998-2013) and President (2007-2011) of the Board of Directors, Catholic Charities CYO; Trustee (2002-2011) and Chair of the Finance and Investment Committee (2006-2010) of the Thacher School; Director of the Senior Center of Jackson Hole (since 2020); Director of the Jackson Hole Center for the Arts (since 2021); Member of the Wyoming State Investment Funds Committee (since 2022). | Director of iShares, Inc. (since 2005); Trustee of iShares U.S. ETF Trust (since 2011). | |||
Drew E. Lawton (1959) | Trustee (since 2017); 15(c) Committee Chair (since 2017). | Senior Managing Director of New York Life Insurance Company (2010-2015). | Director of iShares, Inc. (since 2017); Trustee of iShares U.S. ETF Trust (since 2017); Director of Jackson Financial Inc. (since 2021). | |||
John E. Martinez (1961) | Trustee (since 2003); Securities Lending Committee Chair (since 2019). | Director of Real Estate Equity Exchange, Inc. (since 2005); Director of Cloudera Foundation (2017-2020); and Director of Reading Partners (2012-2016). | Director of iShares, Inc. (since 2003); Trustee of iShares U.S. ETF Trust (since 2011). | |||
Madhav V. Rajan (1964) | Trustee (since 2011); Fixed-Income Plus Committee Chair (since 2019). | Dean, and George Pratt Shultz Professor of Accounting, University of Chicago Booth School of Business (since 2017); Advisory Board Member (since 2016) and Director (since 2020) of C.M. Capital Corporation; Chair of the Board for the Center for Research in Security Prices, LLC (since 2020); Robert K. Jaedicke Professor of Accounting, Stanford University Graduate School of Business (2001-2017); Professor of Law (by courtesy), Stanford Law School (2005-2017); Senior Associate Dean for Academic Affairs and Head of MBA Program, Stanford University Graduate School of Business (2010-2016). | Director of iShares, Inc. (since 2011); Trustee of iShares U.S. ETF Trust (since 2011). | |||
| Officers | ||||||
Name (Year of Birth) | Position(s) | Principal Occupation(s) During Past 5 Years | ||||
Dominik Rohé (1973) | President (since 2019). | Managing Director, BlackRock, Inc. (since 2005); Head of Americas ETF and Index Investments (since 2023); Head of Latin America (2019-2023). | ||||
Trent Walker (1974) | Treasurer and Chief Financial Officer (since 2020). | Managing Director, BlackRock, Inc. (since September 2019); Chief Financial Officer of iShares Delaware Trust Sponsor LLC, BlackRock Funds, BlackRock Funds II, BlackRock Funds IV, BlackRock Funds V and BlackRock Funds VI (since 2021); Executive Vice President of PIMCO (2016-2019); Senior Vice President of PIMCO (2008-2015); Treasurer (2013-2019) and Assistant Treasurer (2007-2017) of PIMCO Funds, PIMCO Variable Insurance Trust, PIMCO ETF Trust, PIMCO Equity Series, PIMCO Equity Series VIT, PIMCO Managed Accounts Trust, 2 PIMCO-sponsored interval funds and 21 PIMCO-sponsored closed-end funds. | ||||
Charles Park (1967) | Chief Compliance Officer (since 2006). | Chief Compliance Officer of BlackRock Advisors, LLC and the BlackRock-advised Funds in the BlackRock Multi-Asset Complex and the BlackRock Fixed-Income Complex (since 2014); Chief Compliance Officer of BFA (since 2006). | ||||
Marisa Rolland (1980) | Secretary (since 2022). | Managing Director, BlackRock, Inc. (since 2023); Director, BlackRock, Inc. (2018-2022); Vice President, BlackRock, Inc. (2010-2017). | ||||
Rachel Aguirre (1982) | Executive Vice President (since 2022). | Managing Director, BlackRock, Inc. (since 2018); Director, BlackRock, Inc. (2009-2018); Head of U.S. iShares Product (since 2022); Head of EII U.S. Product Engineering (since 2021); Co-Head of EII’s Americas Portfolio Engineering (2020-2021); Head of Developed Markets Portfolio Engineering (2016-2019). | ||||
| 30 | 2 0 2 3 I SHARES ANNUAL REPORT TO SHAREHOLDERS |
Trustee and Officer Information (unaudited) (continued)
| Officers (continued) | ||||||
Name (Year of Birth) | Position(s) | Principal Occupation(s) During Past 5 Years | ||||
Jennifer Hsui (1976) | Executive Vice President (since 2022). | Managing Director, BlackRock, Inc. (since 2009); Co-Head of Index Equity (since 2022). | ||||
James Mauro (1970) | Executive Vice President (since 2022). | Managing Director, BlackRock, Inc. (since 2010); Head of Fixed Income Index Investments in the Americas and Head of San Francisco Core Portfolio Management (since 2020). | ||||
Effective June 15, 2022, Marisa Rolland replaced Deepa Damre Smith as Secretary. |
Effective March 30, 2023, Dominik Rohé replaced Armando Senra as President.
|
TRUSTEE AND OFFICER INFORMATION | 31 |
Electronic Delivery
Shareholders can sign up for e-mail notifications announcing that the shareholder report or prospectus has been posted on the iShares website at iShares.com. Once you have enrolled, you will no longer receive prospectuses and shareholder reports in the mail.
To enroll in electronic delivery:
| • | Go to icsdelivery.com. |
| • | If your brokerage firm is not listed, electronic delivery may not be available. Please contact your broker-dealer or financial advisor. |
Householding
Householding is an option available to certain fund investors. Householding is a method of delivery, based on the preference of the individual investor, in which a single copy of certain shareholder documents and Rule 30e-3 notices can be delivered to investors who share the same address, even if their accounts are registered under different names. Please contact your broker-dealer if you are interested in enrolling in householding and receiving a single copy of prospectuses and other shareholder documents, or if you are currently enrolled in householding and wish to change your householding status.
Availability of Quarterly Schedule of Investments
The Fund files its complete schedule of portfolio holdings with the SEC for the first and third quarters of each fiscal year as an exhibit to its reports on Form N-PORT. The Fund’s Forms N-PORT are available on the SEC’s website at sec.gov. Additionally, the Fund makes its portfolio holdings for the first and third quarters of each fiscal year available at iShares.com/fundreports.
Availability of Proxy Voting Policies and Proxy Voting Records
A description of the policies and procedures that the iShares Funds use to determine how to vote proxies relating to portfolio securities and information about how the iShares Funds voted proxies relating to portfolio securities during the most recent twelve-month period ending June 30 is available without charge, upon request (1) by calling toll-free 1-800-474-2737; (2) on the iShares website at iShares.com; and (3) on the SEC website at sec.gov.
A description of the Trust’s policies and procedures with respect to the disclosure of the Fund’s portfolio securities is available in the Fund Prospectus. The Fund discloses its portfolio holdings daily and provides information regarding its top holdings in Fund fact sheets at iShares.com.
| 32 | 2 0 2 3 I SHARES ANNUAL REPORT TO SHAREHOLDERS |
THIS PAGE INTENTIONALLY LEFT BLANK.
THIS PAGE INTENTIONALLY LEFT BLANK.
THIS PAGE INTENTIONALLY LEFT BLANK.
Want to know more?
iShares.com | 1-800-474-2737
This report is intended for the Fund’s shareholders. It may not be distributed to prospective investors unless it is preceded or accompanied by the current prospectus.
Investing involves risk, including possible loss of principal.
The iShares Funds are distributed by BlackRock Investments, LLC (together with its affiliates, “BlackRock”).
The iShares Funds are not sponsored, endorsed, issued, sold or promoted by the Japan Exchange Group, Inc., JPX Market Innovation & Research, Inc. or Nikkei, Inc., nor do these companies make any representation regarding the advisability of investing in the iShares Funds. BlackRock is not affiliated with the companies listed above.
©2023 BlackRock, Inc. All rights reserved. iSHARES and BLACKROCK are registered trademarks of BlackRock, Inc. or its subsidiaries. All other marks are the property of their respective owners.
iS-AR-310-0323
|  |
(b) Not Applicable
| Item 2. | Code of Ethics. |
The registrant has adopted a code of ethics, as of the end of the period covered by this report, applicable to the registrant’s principal executive officer, principal financial officer, principal accounting officer or controller, or persons performing similar functions. During the period covered by this report, the registrant has not amended the code of ethics and there have been no waivers granted under the code of ethics. The registrant undertakes to provide a copy of the code of ethics to any person upon request, without charge, by calling 1-800-474-2737.
| Item 3. | Audit Committee Financial Expert. |
The registrant’s Board of Trustees has determined that the registrant has more than one audit committee financial expert, as that term is defined under Item 3(b) and 3(c), serving on its audit committee. The audit committee financial experts serving on the registrant’s audit committee are Richard L. Fagnani and Madhav V. Rajan, all of whom are independent, as that term is defined under Item 3(a)(2).
| Item 4. | Principal Accountant Fees and Services. |
The principal accountant fees disclosed in items 4(a), 4(b), 4(c), 4(d) and 4(g) are for the twenty-five series of the registrant for which the fiscal year-end is March 31, 2023 (the “Funds”), and whose annual financial statements are reported in Item 1.
(a) Audit Fees – The aggregate fees billed for each of the last two fiscal years for professional services rendered by the principal accountant for the audit of the Funds’ annual financial statements or services that are normally provided by the accountant in connection with statutory and regulatory filings or engagements for those fiscal years were $356,500 for the fiscal year ended March 31, 2022 and $404,000 for the fiscal year ended March 31, 2023.
(b) Audit-Related Fees – There were no fees billed for the fiscal years ended March 31, 2022 and March 31, 2023 for assurance and related services by the principal accountant that were reasonably related to the performance of the audit of the Fund’s financial statements and are not reported under (a) of this Item.
(c) Tax Fees – The aggregate fees billed in each of the last two fiscal years for professional services rendered by the principal accountant for tax compliance, tax advice and tax planning for the Funds were $223,100 for the fiscal year ended March 31, 2022 and $242,500 for the fiscal year ended March 31, 2023. These services related to the review of the Funds’ tax returns and excise tax calculations.
(d) All Other Fees – There were no other fees billed in each of the fiscal years ended March 31, 2022 and March 31, 2023 for products and services provided by the principal accountant, other than the services reported in (a) through (c) of this Item.
(e) (1) The registrant’s audit committee charter, as amended, provides that the audit committee is responsible for the approval, prior to appointment, of the engagement of the principal accountant to annually audit and provide their opinion on the registrant’s financial statements. The audit committee must also approve, prior to appointment, the engagement of the principal accountant to provide non-audit services to the registrant or to any entity controlling, controlled by or under common control with the registrant’s investment adviser (“Adviser Affiliate”) that provides ongoing services to the registrant, if the engagement relates directly to the operations and financial reporting of the registrant.
(2) There were no services described in (b) through (d) above that were approved by the audit committee pursuant to paragraph (c)(7)(i)(C) of Rule 2-01 of Regulation S-X.
(f) Not Applicable
(g) The aggregate non-audit fees billed by the registrant’s principal accountant for services rendered to the Funds, and rendered to the registrant’s investment adviser, and any Adviser Affiliate that provides ongoing services to the registrant for the last two fiscal years were $223,100 for the fiscal year ended March 31, 2022 and $242,500 for the fiscal year ended March 31, 2023.
(h) The registrant’s audit committee has considered whether the provision of non-audit services rendered to the registrant’s investment adviser and any Adviser Affiliate that provides ongoing services to the registrant that were not pre-approved pursuant to paragraph (c)(7)(ii) of Rule 2-01 of Regulation S-X, if any, is compatible with maintaining the principal accountant’s independence, and has determined that the provision of these services, if any, does not compromise the principal accountant’s independence.
(i) Not Applicable
(j) Not Applicable
| Item 5. | Audit Committee of Listed Registrants |
(a) The registrant is a listed issuer as defined in Rule 10A-3 under the Exchange Act of 1934 and has a separately-designated standing audit committee established in accordance with Section 3(a)(58)(A) of the Exchange Act of 1934. The registrant’s audit committee members are Richard L. Fagnani, Cecilia H. Herbert and Madhav V. Rajan.
(b) Not applicable.
| Item 6. | Investments. |
(a) Schedules of investments are included as part of the reports to shareholders filed under Item 1 of this Form.
(b) Not applicable.
| Item 7. | Disclosure of Proxy Voting Policies and Procedures for Closed-End Management Investment Companies. |
Not applicable to the registrant.
| Item 8. | Portfolio Managers of Closed-End Management Investment Companies. |
Not applicable to the registrant.
| Item 9. | Purchases of Equity Securities by Closed-End Management Investment Company and Affiliated Purchasers. |
Not applicable to the registrant.
| Item 10. | Submission of Matters to a Vote of Security Holders. |
There were no material changes to the procedures by which shareholders may recommend nominees to the registrant’s Board of Trustees.
| Item 11. | Controls and Procedures. |
(a) The President (the registrant’s Principal Executive Officer) and Treasurer and Chief Financial Officer (the registrant’s Principal Financial Officer) have concluded that the registrant’s disclosure controls and procedures (as defined in Rule 30a-3(c) under the Investment Company Act of 1940) are effective as of a date within 90 days of the filing date of this report, based on their evaluation of these controls and procedures required by Rule 30a-3(b) under the Investment Company Act of 1940 and Rules 13a-15(b) or 15d-15(b) under the Exchange Act of 1934.
(b) There were no changes in the registrant’s internal control over financial reporting (as defined in Rule 30a-3(d) under the Investment Company Act of 1940) that occurred during the period covered by this report that have materially affected, or are reasonably likely to materially affect, the registrant’s internal control over financial reporting.
| Item 12. | Disclosure of Securities Lending Activities for Closed-End Management Investment Companies. |
Not applicable to the registrant.
| Item 13. | Exhibits. |
(a) (1) Code of Ethics is not filed as an exhibit; please refer to Item 2.
(a) (2) Section 302 Certifications are attached.
(a) (3) Any written solicitation to purchase securities under Rule 23c-1 – Not Applicable.
(a) (4) Change in Registrant’s independent public accountant – Not Applicable.
(b) Section 906 Certifications are attached.
SIGNATURES
Pursuant to the requirements of the Securities Exchange Act of 1934 and the Investment Company Act of 1940, the registrant has duly caused this report to be signed on its behalf by the undersigned, thereunto duly authorized.
iShares Trust
| By: | /s/ Dominik Rohe | |||||
| Dominik Rohe, President (Principal Executive Officer) | ||||||
Date: May 25, 2023
Pursuant to the requirements of the Securities Exchange Act of 1934 and the Investment Company Act of 1940, this report has been signed below by the following persons on behalf of the registrant and in the capacities and on the dates indicated.
| By: | /s/ Dominik Rohe | |||||
| Dominik Rohe, President (Principal Executive Officer) | ||||||
Date: May 25, 2023
| By: | /s/ Trent Walker | |||||
| Trent Walker, Treasurer and Chief Financial Officer (Principal Financial Officer) | ||||||
Date: May 25, 2023