UNITED STATES
SECURITIES AND EXCHANGE COMMISSION
Washington, D.C. 20549
FORM N-CSR
CERTIFIED SHAREHOLDER REPORT
OF REGISTERED MANAGEMENT INVESTMENT COMPANIES
Investment Company Act file number 811-09729
iShares Trust
(Exact name of registrant as specified in charter)
c/o BlackRock Fund Advisors
400 Howard Street, San Francisco, CA 94105
(Address of principal executive offices) (Zip code)
The Corporation Trust Company
1209 Orange Street, Wilmington, DE 19801
(Name and address of agent for service)
Registrant’s telephone number, including area code: (415) 670-2000
Date of fiscal year end: April 30, 2024
Date of reporting period: April 30, 2024
| Item 1. | Reports to Stockholders. |
(a) The Report to Shareholders is attached herewith.


President, BlackRock Inc.
Total Returns as of April 30, 2024 | ||
6-Month | 12-Month | |
U.S. large cap equities (S&P 500® Index) | 20.98% | 22.66% |
U.S. small cap equities (Russell 2000® Index) | 19.66 | 13.32 |
International equities (MSCI Europe, Australasia, Far East Index) | 18.63 | 9.28 |
Emerging market equities (MSCI Emerging Markets Index) | 15.40 | 9.88 |
3-month Treasury bills (ICE BofA 3-Month U.S. Treasury Bill Index) | 2.66 | 5.36 |
U.S. Treasury securities (ICE BofA 10-Year U.S. Treasury Index) | 3.66 | (6.40) |
U.S. investment grade bonds (Bloomberg U.S. Aggregate Bond Index) | 4.97 | (1.47) |
Tax-exempt municipal bonds (Bloomberg Municipal Bond Index) | 7.06 | 2.08 |
U.S. high yield bonds (Bloomberg U.S. Corporate High Yield 2% Issuer Capped Index) | 8.99 | 9.01 |
Past performance is not an indication of future results. Index performance is shown for illustrative purposes only. You cannot invest directly in an index. | ||
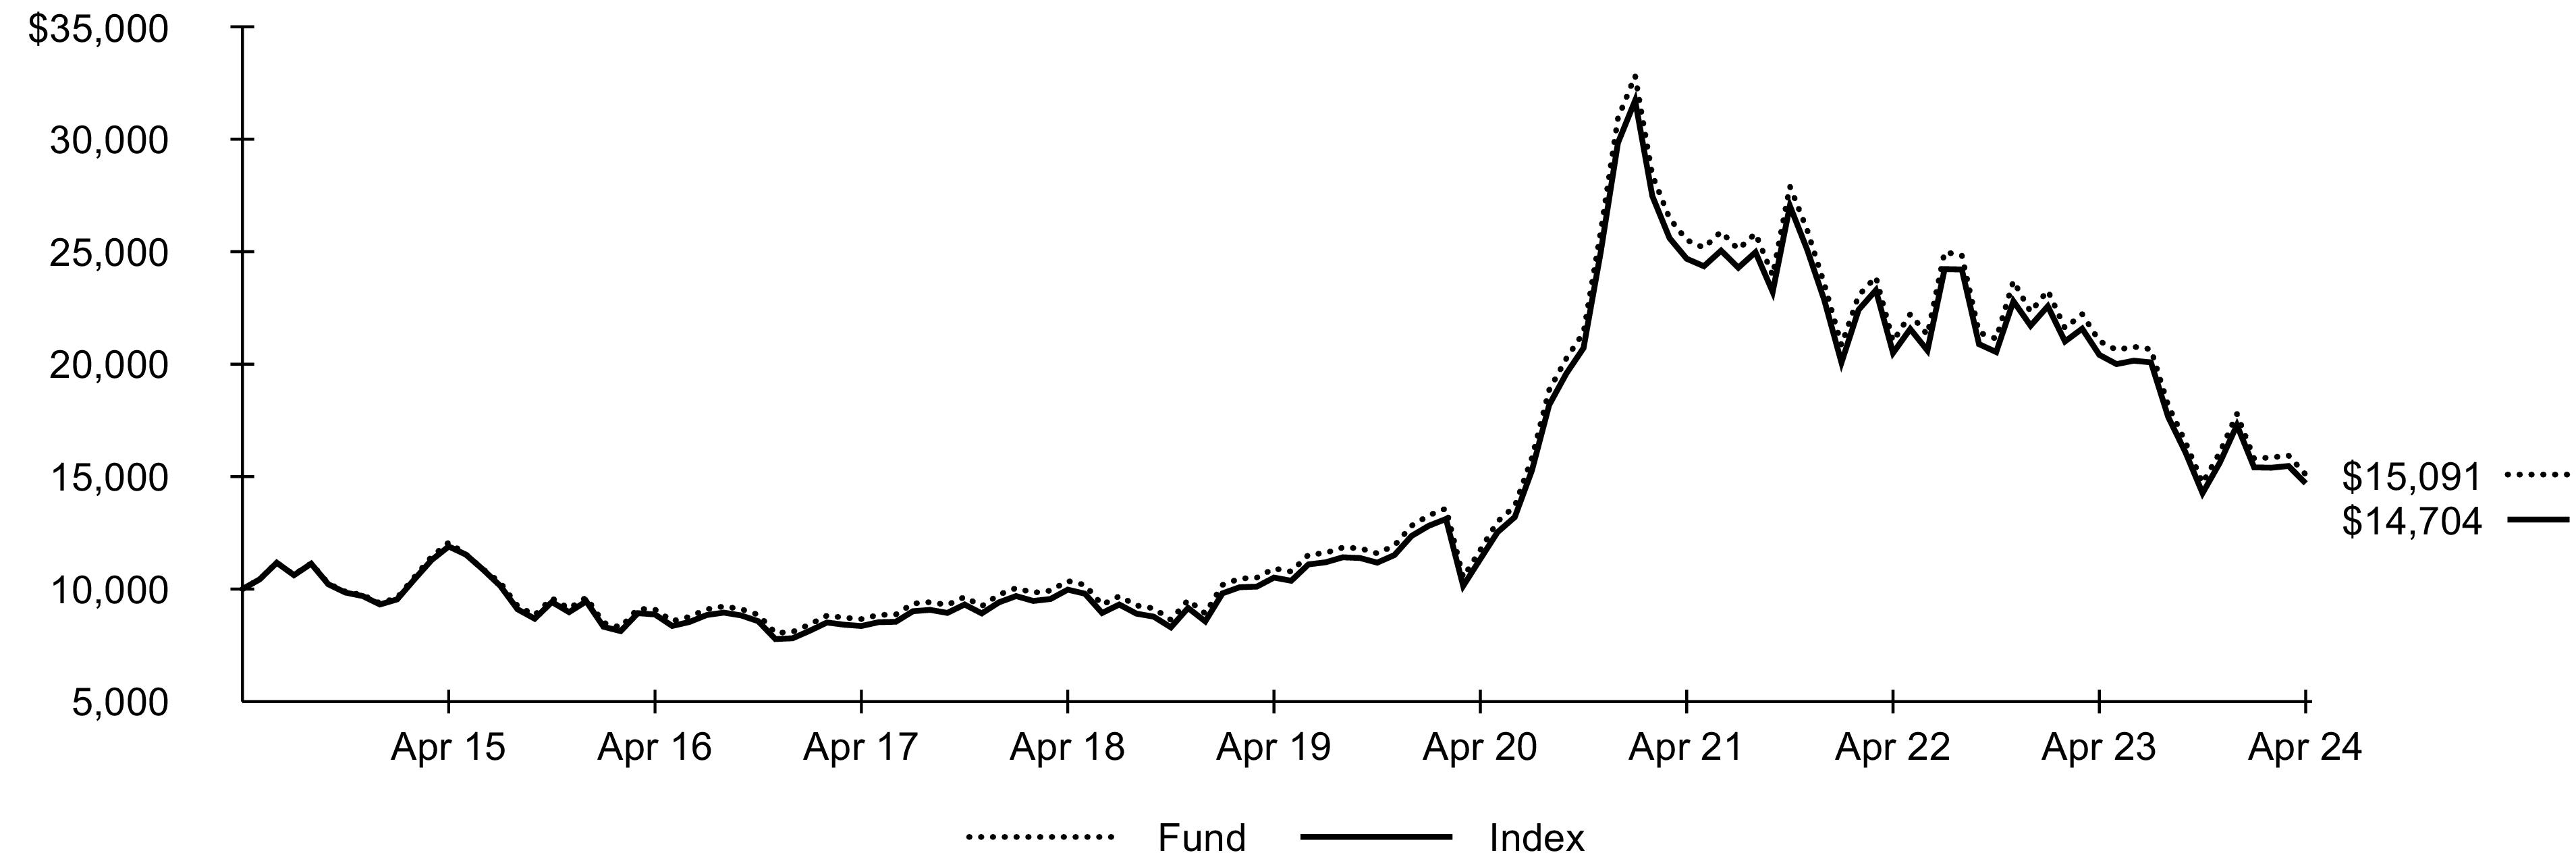
Average Annual Total Returns | Cumulative Total Returns | ||||||
1 Year | 5 Years | 10 Years | 1 Year | 5 Years | 10 Years | ||
Fund NAV | (28.22 )% | 6.69 % | 4.20 % | (28.22 )% | 38.23 % | 50.91 % | |
Fund Market | (28.23 ) | 6.60 | 4.13 | (28.23 ) | 37.67 | 49.88 | |
Index | (27.96 ) | 6.94 | 3.93 | (27.96 ) | 39.89 | 47.04 | |
(AT NET ASSET VALUE)
Actual | Hypothetical 5% Return | |||||
Beginning Account Value (11/01/23) | Ending Account Value (04/30/24) | Expenses Paid During the Period(a) | Beginning Account Value (11/01/23) | Ending Account Value (04/30/24) | Expenses Paid During the Period(a) | Annualized Expense Ratio |
$1,000.00 | $1,025.60 | $2.06 | $1,000.00 | $1,022.80 | $2.06 | 0.41% |
(a) | Expenses are equal to the annualized expense ratio, multiplied by the average account value over the period, multiplied by 182/366 (to reflect the one-half year period shown). Other fees, such as brokerage commissions and other fees to financial intermediaries, may be paid which are not reflected in the tables and examples above. See “Disclosure of Expenses” for more information. |
Industry | Percent of Total Investments(a) |
Electric Utilities | 29.1 % |
Renewable Electricity | 23.5 |
Heavy Electrical Equipment | 10.5 |
Semiconductor Materials & Equipment | 9.9 |
Semiconductors | 9.9 |
Electrical Components & Equipment | 6.9 |
Multi-Utilities | 6.5 |
Commodity Chemicals | 1.1 |
Other (each representing less than 1%) | 2.6 |
Country/Geographic Region | Percent of Total Investments(a) |
United States | 34.2 % |
Denmark | 10.9 |
China | 9.1 |
Brazil | 8.3 |
Spain | 7.4 |
Portugal | 5.1 |
India | 4.6 |
Canada | 3.9 |
Japan | 3.7 |
Germany | 2.1 |
South Korea | 1.9 |
Indonesia | 1.9 |
Austria | 1.3 |
Switzerland | 1.0 |
Other (each representing less than 1%) | 4.6 |
(a) | Excludes money market funds. |
Security | Shares | Value |
Common Stocks | ||
Austria — 1.3% | ||
Verbund AG | 371,775 | $28,400,322 |
Brazil — 5.9% | ||
AES Brasil Energia SA | 2,621,228 | 4,780,462 |
Auren Energia SA | 3,377,656 | 7,539,004 |
CPFL Energia SA | 2,087,899 | 12,826,711 |
Energisa SA | 3,362,213 | 29,202,289 |
Engie Brasil Energia SA | 2,860,586 | 22,531,673 |
Equatorial Energia SA | 7,394,701 | 43,562,744 |
Neoenergia SA | 2,196,382 | 8,112,816 |
128,555,699 | ||
Canada — 3.8% | ||
Boralex Inc., Class A | 708,438 | 14,218,677 |
Brookfield Renewable Corp., Class A | 700,836 | 16,280,634 |
Canadian Solar Inc.(a)(b) | 575,744 | 9,332,810 |
Innergex Renewable Energy Inc. | 1,778,006 | 10,371,110 |
Northland Power Inc. | 2,160,000 | 32,965,242 |
83,168,473 | ||
Chile — 0.3% | ||
Enel Americas SA | 75,136,280 | 7,043,659 |
China — 9.0% | ||
CECEP Solar Energy Co. Ltd., Class A | 3,566,100 | 2,532,071 |
CECEP Wind-Power Corp., Class A | 5,907,720 | 2,553,464 |
China Conch Venture Holdings Ltd. | 17,413,000 | 12,701,306 |
China Datang Corp. Renewable Power Co. Ltd., Class H | 26,053,000 | 5,544,819 |
China Green Electricity Investment of Tianjin Co. Ltd. | 1,273,900 | 1,630,371 |
China Three Gorges Renewables Group Co. Ltd., Class A | 25,820,596 | 16,667,571 |
China Yangtze Power Co. Ltd., Class A | 22,113,630 | 78,623,395 |
Chongqing Three Gorges Water Conservancy & Electric Power Co. Ltd. | 1,743,600 | 1,725,884 |
Dajin Heavy Industry Co. Ltd. | 580,500 | 1,675,401 |
GCL System Integration Technology Co. Ltd., Class A(a) | 5,336,600 | 1,791,524 |
Ginlong Technologies Co. Ltd., Class A | 366,450 | 2,693,600 |
GoodWe Technologies Co. Ltd., NVS | 160,632 | 2,050,638 |
Guangxi Guiguan Electric Power Co. Ltd. | 3,595,800 | 3,123,335 |
Hainan Drinda New Energy Technology Co. Ltd. | 208,300 | 1,472,659 |
Hoymiles Power Electronics Inc., NVS | 77,411 | 2,412,947 |
Huaneng Lancang River Hydropower Inc. | 6,087,657 | 8,023,216 |
JA Solar Technology Co. Ltd., Class A | 2,980,452 | 5,834,910 |
Jiangsu Haili Wind Power Equipment Technology Co. Ltd. | 199,000 | 1,334,952 |
Jinko Solar Co. Ltd. | 5,615,339 | 5,826,431 |
Ming Yang Smart Energy Group Ltd., Class A | 2,071,700 | 2,785,401 |
NYOCOR Co. Ltd. | 1,822,700 | 1,505,159 |
Risen Energy Co. Ltd. | 1,041,200 | 1,856,706 |
Sany Renewable Energy Co. Ltd. | 560,029 | 2,213,062 |
Shanghai Aiko Solar Energy Co. Ltd. | 1,668,800 | 2,745,918 |
Sichuan Chuantou Energy Co. Ltd., Class A | 4,405,600 | 10,173,263 |
TCL Zhonghuan Renewable Energy Technology Co. Ltd., Class A | 3,623,200 | 5,191,158 |
Titan Wind Energy Suzhou Co. Ltd., Class A(a) | 1,639,500 | 2,343,280 |
Trina Solar Co. Ltd. | 1,955,574 | 5,712,573 |
Yuneng Technology Co. Ltd. | 104,060 | 998,520 |
Security | Shares | Value |
China (continued) | ||
Zhejiang Akcome New Energy Technology Co. Ltd.(a)(c) | 4,087,000 | $991,648 |
194,735,182 | ||
Denmark — 10.8% | ||
Orsted A/S(a)(d) | 1,856,659 | 102,038,855 |
Vestas Wind Systems A/S(a) | 4,925,849 | 132,006,016 |
234,044,871 | ||
France — 0.5% | ||
Neoen SA(d) | 324,094 | 9,918,936 |
Germany — 2.1% | ||
Encavis AG(a) | 612,486 | 11,026,535 |
Nordex SE(a)(b) | 1,414,286 | 19,907,660 |
SMA Solar Technology AG(a) | 191,986 | 10,069,650 |
Verbio SE(b) | 217,313 | 4,530,223 |
45,534,068 | ||
India — 4.6% | ||
MTAR Technologies Ltd.(a) | 213,987 | 4,819,521 |
NHPC Ltd., NVS | 30,638,601 | 35,269,900 |
PTC India Ltd. | 2,750,232 | 7,380,500 |
SJVN Ltd. | 5,761,960 | 9,211,909 |
Suzlon Energy Ltd.(a) | 85,240,118 | 42,239,581 |
98,921,411 | ||
Indonesia — 1.9% | ||
Barito Renewables Energy Tbk PT | 64,385,700 | 36,528,787 |
Pertamina Geothermal Energy PT(d) | 47,209,800 | 3,540,586 |
40,069,373 | ||
Israel — 0.5% | ||
Enlight Renewable Energy Ltd.(a)(b) | 683,503 | 10,985,623 |
Italy — 0.8% | ||
ERG SpA | 626,670 | 16,875,952 |
Japan — 3.7% | ||
Abalance Corp.(b) | 122,800 | 1,571,331 |
Chubu Electric Power Co. Inc. | 5,787,600 | 74,289,382 |
RENOVA Inc.(a) | 497,000 | 4,670,019 |
80,530,732 | ||
New Zealand — 0.6% | ||
Contact Energy Ltd. | 1,061,543 | 5,423,207 |
Meridian Energy Ltd. | 2,088,020 | 7,382,193 |
12,805,400 | ||
Norway — 0.4% | ||
NEL ASA(a)(b) | 18,827,899 | 8,699,535 |
Portugal — 5.0% | ||
EDP - Energias de Portugal SA | 19,865,010 | 74,596,432 |
EDP Renovaveis SA | 2,507,223 | 34,324,329 |
108,920,761 | ||
South Korea — 1.9% | ||
CS Wind Corp. | 314,430 | 11,781,889 |
Doosan Fuel Cell Co. Ltd.(a)(b) | 456,158 | 6,519,814 |
Hanwha Solutions Corp. | 1,281,605 | 23,325,479 |
41,627,182 | ||
Spain — 7.4% | ||
Corp. ACCIONA Energias Renovables SA | 632,302 | 12,840,347 |
Iberdrola SA | 11,186,325 | 137,161,976 |
Solaria Energia y Medio Ambiente SA(a) | 917,018 | 9,330,748 |
159,333,071 | ||
Switzerland — 0.9% | ||
BKW AG | 137,427 | 20,399,379 |
Security | Shares | Value |
Taiwan — 0.8% | ||
Century Iron & Steel Industrial Co. Ltd. | 1,900,000 | $12,972,926 |
TSEC Corp. | 5,722,235 | 4,877,886 |
17,850,812 | ||
Turkey — 0.5% | ||
Akfen Yenilenebilir Enerji A/S, NVS(a) | 3,805,604 | 2,820,163 |
CW Enerji Muhendislik Ticaret VE Sanayi A/S, NVS(a) | 330,559 | 2,941,138 |
Galata Wind Enerji AS | 1,881,444 | 1,646,382 |
Smart Gunes Enerjisi Teknolojileri ArGE Uretim Sanayi ve Ticaret AS, NVS(a) | 1,727,439 | 2,960,295 |
10,367,978 | ||
United Kingdom — 0.3% | ||
ReNew Energy Global PLC(a)(b) | 940,755 | 5,305,858 |
United States — 34.0% | ||
Altus Power Inc., Class A(a)(b) | 689,035 | 2,528,759 |
Array Technologies Inc.(a)(b) | 1,605,759 | 19,815,066 |
Avangrid Inc. | 589,843 | 21,546,965 |
Clearway Energy Inc., Class C | 931,105 | 21,769,235 |
Consolidated Edison Inc. | 1,489,959 | 140,652,130 |
Enphase Energy Inc.(a)(b) | 1,476,498 | 160,583,923 |
First Solar Inc.(a)(b) | 953,038 | 168,020,599 |
NEXTracker Inc., Class A(a) | 1,388,237 | 59,402,661 |
Ormat Technologies Inc.(b) | 606,810 | 38,732,682 |
Plug Power Inc.(a)(b) | 6,142,745 | 14,189,741 |
REX American Resources Corp.(a) | 171,804 | 9,505,915 |
Shoals Technologies Group Inc., Class A(a)(b) | 1,915,597 | 16,186,795 |
SolarEdge Technologies Inc.(a)(b) | 641,765 | 37,639,517 |
Sunnova Energy International Inc.(a)(b) | 1,188,630 | 5,004,132 |
SunPower Corp.(a)(b) | 979,972 | 2,018,742 |
Sunrun Inc.(a)(b) | 1,844,857 | 18,983,579 |
736,580,441 | ||
Total Common Stocks — 97.0% (Cost: $2,775,168,785) | 2,100,674,718 | |
Preferred Stocks | ||
Brazil — 2.4% | ||
Cia. Energetica de Minas Gerais, Preference Shares, NVS | 16,141,777 | 30,371,136 |
Security | Shares | Value |
Brazil (continued) | ||
Companhia Paranaense de Energia, Preference Shares, NVS | 11,796,728 | $20,650,976 |
51,022,112 | ||
Total Preferred Stocks — 2.4% (Cost: $48,580,405) | 51,022,112 | |
Total Long-Term Investments — 99.4% (Cost: $2,823,749,190) | 2,151,696,830 | |
Short-Term Securities | ||
Money Market Funds — 7.8% | ||
BlackRock Cash Funds: Institutional, SL Agency Shares, 5.49%(e)(f)(g) | 163,182,154 | 163,231,108 |
BlackRock Cash Funds: Treasury, SL Agency Shares, 5.28%(e)(f) | 6,500,000 | 6,500,000 |
Total Short-Term Securities — 7.8% (Cost: $169,628,707) | 169,731,108 | |
Total Investments — 107.2% (Cost: $2,993,377,897) | 2,321,427,938 | |
Liabilities in Excess of Other Assets — (7.2)% | (155,975,233 ) | |
Net Assets — 100.0% | $2,165,452,705 | |
(a) | Non-income producing security. |
(b) | All or a portion of this security is on loan. |
(c) | Security is valued using significant unobservable inputs and is classified as Level 3 in the fair value hierarchy. |
(d) | Security exempt from registration pursuant to Rule 144A under the Securities Act of 1933, as amended. These securities may be resold in transactions exempt from registration to qualified institutional investors. |
(e) | Affiliate of the Fund. |
(f) | Annualized 7-day yield as of period end. |
(g) | All or a portion of this security was purchased with the cash collateral from loaned securities. |
Affiliated Issuer | Value at 04/30/23 | Purchases at Cost | Proceeds from Sales | Net Realized Gain (Loss) | Change in Unrealized Appreciation (Depreciation) | Value at 04/30/24 | Shares Held at 04/30/24 | Income | Capital Gain Distributions from Underlying Funds |
BlackRock Cash Funds: Institutional, SL Agency Shares | $709,863,596 | $— | $(546,680,043 )(a) | $191,695 | $(144,140 ) | $163,231,108 | 163,182,154 | $3,319,292 (b) | $— |
BlackRock Cash Funds: Treasury, SL Agency Shares | 14,710,000 | — | (8,210,000 )(a) | — | — | 6,500,000 | 6,500,000 | 452,138 | — |
$191,695 | $(144,140 ) | $169,731,108 | $3,771,430 | $— |
(a) | Represents net amount purchased (sold). |
(b) | All or a portion represents securities lending income earned from the reinvestment of cash collateral from loaned securities, net of fees and collateral investment expenses, and other payments to and from borrowers of securities. |
Description | Number of Contracts | Expiration Date | Notional Amount (000) | Value/ Unrealized Appreciation (Depreciation) |
Long Contracts | ||||
Euro STOXX 50 Index | 64 | 06/21/24 | $3,327 | $(28,407 ) |
MSCI Emerging Markets Index | 79 | 06/21/24 | 4,116 | 65,445 |
S&P 500 E-Mini Index | 24 | 06/21/24 | 6,081 | (22,001 ) |
$15,037 |
Commodity Contracts | Credit Contracts | Equity Contracts | Foreign Currency Exchange Contracts | Interest Rate Contracts | Other Contracts | Total | |
Assets—Derivative Financial Instruments | |||||||
Futures contracts | |||||||
Unrealized appreciation on futures contracts(a) | $— | $— | $65,445 | $— | $— | $— | $65,445 |
Liabilities—Derivative Financial Instruments | |||||||
Futures contracts | |||||||
Unrealized depreciation on futures contracts(a) | $— | $— | $50,408 | $— | $— | $— | $50,408 |
(a) | Net cumulative unrealized appreciation (depreciation) on futures contracts are reported in the Schedule of Investments. In the Statement of Assets and Liabilities, only current day's variation margin is reported in receivables or payables and the net cumulative unrealized appreciation (depreciation) is included in accumulated earnings (loss). |
Commodity Contracts | Credit Contracts | Equity Contracts | Foreign Currency Exchange Contracts | Interest Rate Contracts | Other Contracts | Total | |
Net Realized Gain (Loss) from | |||||||
Futures contracts | $— | $— | $1,762,892 | $— | $— | $— | $1,762,892 |
Swaps | — | — | (1,058,458 ) | — | — | — | (1,058,458 ) |
$— | $— | $704,434 | $— | $— | $— | $704,434 | |
Net Change in Unrealized Appreciation (Depreciation) on | |||||||
Futures contracts | $— | $— | $(516,236 ) | $— | $— | $— | $(516,236 ) |
Swaps | — | — | (515,186 ) | — | — | — | (515,186 ) |
$— | $— | $(1,031,422 ) | $— | $— | $— | $(1,031,422 ) |
Futures contracts: | |
Average notional value of contracts — long | $13,200,801 |
Total return swaps: | |
Average notional value | $2,167,917 |
Level 1 | Level 2 | Level 3 | Total | |
Assets | ||||
Investments | ||||
Long-Term Investments | ||||
Common Stocks | $1,118,801,026 | $980,882,044 | $991,648 | $2,100,674,718 |
Preferred Stocks | 51,022,112 | — | — | 51,022,112 |
Short-Term Securities | ||||
Money Market Funds | 169,731,108 | — | — | 169,731,108 |
$1,339,554,246 | $980,882,044 | $991,648 | $2,321,427,938 | |
Derivative Financial Instruments(a) | ||||
Assets | ||||
Equity Contracts | $65,445 | $— | $— | $65,445 |
Liabilities | ||||
Equity Contracts | (22,001 ) | (28,407 ) | — | (50,408 ) |
$43,444 | $(28,407 ) | $— | 15,037 |
(a) | Derivative financial instruments are futures contracts. Futures contracts are valued at the unrealized appreciation (depreciation) on the instrument. |
iShares Global Clean Energy ETF | |
ASSETS | |
Investments, at value—unaffiliated(a)(b) | $2,151,696,830 |
Investments, at value—affiliated(c) | 169,731,108 |
Cash pledged for futures contracts | 389,000 |
Foreign currency collateral pledged for futures contracts(d) | 232,650 |
Foreign currency, at value(e) | 1,508,533 |
Receivables: | |
Investments sold | 109,600 |
Securities lending income—affiliated | 216,289 |
Dividends— unaffiliated | 8,580,703 |
Dividends—affiliated | 51,649 |
Tax reclaims | 2,263,591 |
Total assets | 2,334,779,953 |
LIABILITIES | |
Bank overdraft | 396,582 |
Collateral on securities loaned, at value | 163,218,104 |
Payables: | |
Capital shares redeemed | 109,655 |
Investment advisory fees | 744,096 |
Due to custodian | 4,656,228 |
Variation margin on futures contracts | 202,583 |
Total liabilities | 169,327,248 |
Commitments and contingent liabilities | |
NET ASSETS | $2,165,452,705 |
NET ASSETS CONSIST OF | |
Paid-in capital | $5,026,798,885 |
Accumulated loss | (2,861,346,180) |
NET ASSETS | $2,165,452,705 |
NET ASSET VALUE | |
Shares outstanding | 163,500,000 |
Net asset value | $13.24 |
Shares authorized | Unlimited |
Par value | None |
(a) Investments, at cost—unaffiliated | $2,823,749,190 |
(b) Securities loaned, at value | $153,276,290 |
(c) Investments, at cost—affiliated | $169,628,707 |
(d) Foreign currency collateral pledged, at cost | $232,591 |
(e) Foreign currency, at cost | $1,513,579 |
iShares Global Clean Energy ETF | |
INVESTMENT INCOME | |
Dividends—unaffiliated | $48,556,015 |
Dividends—affiliated | 452,138 |
Interest—unaffiliated | 112,220 |
Securities lending income—affiliated—net | 3,319,292 |
Non-cash dividends—unaffiliated | 5,284,673 |
Foreign taxes withheld | (4,054,380 ) |
Foreign withholding tax claims | 42,633 |
Total investment income | 53,712,591 |
EXPENSES | |
Investment advisory | 13,026,134 |
Interest expense | 65,720 |
Commitment costs | 39,082 |
Professional | 4,263 |
Total expenses | 13,135,199 |
Net investment income | 40,577,392 |
REALIZED AND UNREALIZED GAIN (LOSS) | |
Net realized gain (loss) from: | |
Investments—unaffiliated | (729,095,334 ) |
Investments—affiliated | 191,695 |
Foreign currency transactions | (163,891 ) |
Futures contracts | 1,762,892 |
In-kind redemptions—unaffiliated(a) | 52,660,651 |
Swaps | (1,058,458 ) |
(675,702,445 ) | |
Net change in unrealized appreciation (depreciation) on: | |
Investments—unaffiliated | (494,104,962 ) |
Investments—affiliated | (144,140 ) |
Foreign currency translations | (604,715 ) |
Futures contracts | (516,236 ) |
Swaps | (515,186 ) |
(495,885,239 ) | |
Net realized and unrealized loss | (1,171,587,684 ) |
NET DECREASE IN NET ASSETS RESULTING FROM OPERATIONS | $(1,131,010,292 ) |
(a) See Note 2 of the Notes to Financial Statements. | |
iShares Global Clean Energy ETF | ||
Year Ended 04/30/24 | Year Ended 04/30/23 | |
INCREASE (DECREASE) IN NET ASSETS | ||
OPERATIONS | ||
Net investment income | $40,577,392 | $45,344,322 |
Net realized loss | (675,702,445 ) | (529,875,327 ) |
Net change in unrealized appreciation (depreciation) | (495,885,239 ) | 477,505,167 |
Net decrease in net assets resulting from operations | (1,131,010,292 ) | (7,025,838 ) |
DISTRIBUTIONS TO SHAREHOLDERS(a) | ||
Decrease in net assets resulting from distributions to shareholders | (53,312,071 ) | (44,565,129 ) |
CAPITAL SHARE TRANSACTIONS | ||
Net decrease in net assets derived from capital share transactions | (1,223,329,030 ) | (358,900,445 ) |
NET ASSETS | ||
Total decrease in net assets | (2,407,651,393 ) | (410,491,412 ) |
Beginning of year | 4,573,104,098 | 4,983,595,510 |
End of year | $2,165,452,705 | $4,573,104,098 |
(a) | Distributions for annual periods determined in accordance with U.S. federal income tax regulations. |
iShares Global Clean Energy ETF | ||||||
Year Ended 04/30/24 | Year Ended 04/30/23 | Year Ended 04/30/22 | Period From 04/01/21 to 04/30/21 | Year Ended 03/31/21 | Year Ended 03/31/20 | |
Net asset value, beginning of period | $18.73 | $18.88 | $23.19 | $24.07 | $9.62 | $9.75 |
Net investment income(a) | 0.20 | 0.18 | 0.23 | 0.06 | 0.13 | 0.11 |
Net realized and unrealized gain (loss)(b) | (5.44 ) | (0.15 ) | (4.29 ) | (0.94 ) | 14.42 | (0.08 ) |
Net increase (decrease) from investment operations | (5.24 ) | 0.03 | (4.06 ) | (0.88 ) | 14.55 | 0.03 |
Distributions from net investment income(c) | (0.25 ) | (0.18 ) | (0.25 ) | — | (0.10 ) | (0.16 ) |
Net asset value, end of period | $13.24 | $18.73 | $18.88 | $23.19 | $24.07 | $9.62 |
Total Return(d) | ||||||
Based on net asset value | (28.22 )% | 0.04 % | (17.64 )% | (3.66 )%(e) | 151.73 % | 0.12 % |
Ratios to Average Net Assets (f) | ||||||
Total expenses | 0.41 % | 0.41 % | 0.40 % | 0.41 %(g) | 0.42 % | 0.46 % |
Net investment income | 1.26 % | 0.90 % | 1.07 % | 3.07 %(g) | 0.57 % | 1.01 % |
Supplemental Data | ||||||
Net assets, end of period (000) | $2,165,453 | $4,573,104 | $4,983,596 | $5,855,954 | $5,642,271 | $499,227 |
Portfolio turnover rate(h) | 42 % | 51 % | 52 % | 54 % | 31 % | 37 % |
(a) Based on average shares outstanding. | ||||||
(b) The amounts reported for a share outstanding may not accord with the change in aggregate gains and losses in securities for the fiscal period due to the timing of capital share transactions in relation to the fluctuating market values of the Fund’s underlying securities. | ||||||
(c) Distributions for annual periods determined in accordance with U.S. federal income tax regulations. | ||||||
(d) Where applicable, assumes the reinvestment of distributions. | ||||||
(e) Not annualized. | ||||||
(f) Excludes fees and expenses incurred indirectly as a result of investments in underlying funds. | ||||||
(g) Annualized. | ||||||
(h) Portfolio turnover rate excludes in-kind transactions, if any. | ||||||
iShares ETF | Diversification Classification |
Global Clean Energy | Non-diversified |
iShares ETF and Counterparty | Securities Loaned at Value | Cash Collateral Received(a) | Non-Cash Collateral Received, at Fair Value(a) | Net Amount |
Global Clean Energy | ||||
Barclays Bank PLC | $15,663,384 | $(15,663,384) | $— | $— |
Barclays Capital, Inc. | 4,166,259 | (4,166,259) | — | — |
BNP Paribas SA | 9,967,788 | (9,967,788) | — | — |
BofA Securities, Inc. | 15,274,456 | (15,274,456) | — | — |
Citigroup Global Markets, Inc. | 902,665 | (902,665) | — | — |
Goldman Sachs & Co. LLC | 9,658,217 | (9,658,217) | — | — |
HSBC Bank PLC | 603,474 | (603,474) | — | — |
J.P. Morgan Securities LLC | 34,419,685 | (34,419,685) | — | — |
Jefferies LLC | 56,615 | (56,615) | — | — |
Morgan Stanley | 30,235,503 | (30,235,503) | — | — |
National Financial Services LLC | 995,657 | (995,657) | — | — |
Natixis SA | 107,724 | (107,724) | — | — |
RBC Capital Markets LLC | 11,505,829 | (11,505,829) | — | — |
State Street Bank & Trust Co. | 13,960 | (13,960) | — | — |
Toronto-Dominion Bank | 305,844 | (305,844) | — | — |
UBS AG | 19,276,189 | (19,276,189) | — | — |
Wells Fargo Securities LLC | 123,041 | (123,041) | — | — |
$153,276,290 | $(153,276,290) | $— | $— |
(a) | Collateral received, if any, in excess of the market value of securities on loan is not presented in this table. The total cash collateral received by the Fund is disclosed in the Fund’s Statements of Assets and Liabilities. |
Aggregate Average Daily Net Assets | Investment Advisory Fees |
First $10 billion | 0.4800% |
Over $10 billion, up to and including $20 billion | 0.4300 |
Over $20 billion, up to and including $30 billion | 0.3800 |
Over $30 billion, up to and including $40 billion | 0.3420 |
Over $40 billion | 0.3078 |
iShares ETF | Purchases | Sales | Net Realized Gain (Loss) |
Global Clean Energy | $2,476,839 | $6,887 | $1,390 |
iShares ETF | Purchases | Sales |
Global Clean Energy | $1,343,902,202 | $1,645,121,639 |
iShares ETF | In-kind Purchases | In-kind Sales |
Global Clean Energy | $41,283,304 | $959,354,081 |
iShares ETF | Paid-in Capital | Accumulated Earnings (Loss) |
Global Clean Energy | $46,389,688 | $ (46,389,688) |
iShares ETF | Year Ended 04/30/24 | Year Ended 04/30/23 |
Global Clean Energy | ||
Ordinary income | $53,312,071 | $44,565,129 |
iShares ETF | Undistributed Ordinary Income | Non-expiring Capital Loss Carryforwards(a) | Net Unrealized Gains (Losses)(b) | Total |
Global Clean Energy | $6,493,353 | $(2,158,580,223) | $(709,259,310) | $(2,861,346,180) |
(a) | Amounts available to offset future realized capital gains. |
(b) | The difference between book-basis and tax-basis net unrealized gains (losses) was attributable primarily to the tax deferral of losses on wash sales, the realization for tax purposes of unrealized gains (losses) on certain futures contracts and the realization for tax purposes of unrealized gains on investments in passive foreign investment companies. |
iShares ETF | Tax Cost | Gross Unrealized Appreciation | Gross Unrealized Depreciation | Net Unrealized Appreciation (Depreciation) |
Global Clean Energy | $3,030,229,944 | $196,711,541 | $(905,513,547) | $(708,802,006) |
Year Ended 04/30/24 | Year Ended 04/30/23 | |||
iShares ETF | Shares | Amount | Shares | Amount |
Global Clean Energy | ||||
Shares sold | 4,900,000 | $73,371,339 | 16,300,000 | $333,990,804 |
Shares redeemed | (85,600,000 ) | (1,296,700,369 ) | (36,000,000 ) | (692,891,249 ) |
(80,700,000 ) | $(1,223,329,030 ) | (19,700,000 ) | $(358,900,445 ) | |
iShares Trust and Shareholders of iShares Global Clean Energy ETF
Philadelphia, Pennsylvania
June 24, 2024
iShares ETF | Qualified Dividend Income |
Global Clean Energy | $36,271,223 |
iShares ETF | Foreign Source Income Earned | Foreign Taxes Paid |
Global Clean Energy | $46,373,811 | $4,895,743 |
iShares ETF | Dividends-Received Deduction |
Global Clean Energy | 17.66 % |
Interested Trustees | |||
Name (Year of Birth) | Position(s) | Principal Occupation(s) During Past 5 Years | Other Directorships Held by Trustee |
Robert S. Kapito(a) (1957) | Trustee (since 2009). | President of BlackRock, Inc. (since 2006); Vice Chairman of BlackRock, Inc. and Head of BlackRock’s Portfolio Management Group (since its formation in 1998) and BlackRock, Inc.’s predecessor entities (since 1988); Trustee, University of Pennsylvania (since 2009); President of Board of Directors, Hope & Heroes Children’s Cancer Fund (since 2002). | Director of BlackRock, Inc. (since 2006); Director of iShares, Inc. (since 2009); Trustee of iShares U.S. ETF Trust (since 2011). |
Stephen Cohen(b) (1975) | Trustee (since 2024). | Senior Managing Director, Head of Global Product Solutions of BlackRock, Inc. (since 2024); Senior Managing Director, Head of Europe, Middle East and Africa Regions of BlackRock, Inc. (2021-2024); Head of iShares Index and Wealth in EMEA of BlackRock, Inc. (2017-2021); Global Head of Fixed Income Indexing of BlackRock, Inc. (2016-2017); Chief Investment Strategist for International Fixed Income and iShares of BlackRock, Inc. (2011-2015). | Director of iShares, Inc. (since 2024); Trustee of iShares U.S. ETF Trust (since 2024). |
(a) Robert S. Kapito is deemed to be an “interested person” (as defined in the 1940 Act) of the Trust due to his affiliations with BlackRock, Inc. and its affiliates. | |||
(b) Stephen Cohen is deemed to be an "interested person" (as defined in the 1940 Act) of the Trust due to his affiliations with BlackRock, Inc. and its affiliates. | |||
Independent Trustees | |||
Name (Year of Birth) | Position(s) | Principal Occupation(s) During Past 5 Years | Other Directorships Held by Trustee |
John E. Kerrigan (1955) | Trustee (since 2005); Independent Board Chair (since 2022). | Chief Investment Officer, Santa Clara University (since 2002). | Director of iShares, Inc. (since 2005); Trustee of iShares U.S. ETF Trust (since 2011); Independent Board Chair of iShares, Inc. and iShares U.S. ETF Trust (since 2022). |
Jane D. Carlin (1956) | Trustee (since 2015); Risk Committee Chair (since 2016). | Consultant (since 2012); Member of the Audit Committee (2012-2018), Chair of the Nominating and Governance Committee (2017-2018) and Director of PHH Corporation (mortgage solutions) (2012-2018); Managing Director and Global Head of Financial Holding Company Governance & Assurance and the Global Head of Operational Risk Management of Morgan Stanley (2006-2012). | Director of iShares, Inc. (since 2015); Trustee of iShares U.S. ETF Trust (since 2015); Member of the Audit Committee (since 2016), Chair of the Audit Committee (since 2020) and Director of The Hanover Insurance Group, Inc. (since 2016). |
Richard L. Fagnani (1954) | Trustee (since 2017); Audit Committee Chair (since 2019). | Partner, KPMG LLP (2002-2016); Director of One Generation Away (since 2021). | Director of iShares, Inc. (since 2017); Trustee of iShares U.S. ETF Trust (since 2017). |
Laura F. Fergerson (1962) | Trustee since (2024). | President, Franklin Templeton Services, LLC (2017-2024); Director of the Board of Crocker Art Museum Association (since 2019); President, Crocker Art Museum Foundation (2022-2023). | Director of iShares, Inc. (since 2024); Trustee of iShares U.S. ETF Trust (since 2024). |
Independent Trustees (continued) | |||
Name (Year of Birth) | Position(s) | Principal Occupation(s) During Past 5 Years | Other Directorships Held by Trustee |
Cecilia H. Herbert (1949) | Trustee (since 2005); Nominating and Governance and Equity Plus Committee Chairs (since 2022). | Chair of the Finance Committee (since 2019) and Trustee and Member of the Finance, Audit and Quality Committees of Stanford Health Care (since 2016); Trustee of WNET, New York’s public media company (since 2011) and Member of the Audit Committee (since 2018), Investment Committee (since 2011) and Personnel Committee (since 2022); Member of the Wyoming State Investment Funds Committee (since 2022); Trustee of Forward Funds (14 portfolios) (2009-2018); Trustee of Salient MF Trust (4 portfolios) (2015-2018); Director of the Jackson Hole Center for the Arts (since 2021). | Director of iShares, Inc. (since 2005); Trustee of iShares U.S. ETF Trust (since 2011). |
James Lam (1961) | Trustee (since 2024). | President, James Lam & Associates, Inc. (since 2002); Director of the FAIR Institute (since 2020); adjunct professor at Carnegie Mellon University (since 2018); Member, Zicklin School of Business Dean's Council of Baruch College (since 2017); Director and Audit Committee Chair of RiskLens, Inc. (2018-2023); Director, Risk Oversight Committee Chair and Audit Committee Member of E*TRADE Financial and E*TRADE Bank (2012-2020). | Director of iShares, Inc. (since 2024); Trustee of iShares U.S. ETF Trust (since 2024). |
Drew E. Lawton (1959) | Trustee (since 2017); 15(c) Committee Chair (since 2017). | Senior Managing Director of New York Life Insurance Company (2010-2015). | Director of iShares, Inc. (since 2017); Trustee of iShares U.S. ETF Trust (since 2017); Director of Jackson Financial Inc. (since 2021). |
John E. Martinez (1961) | Trustee (since 2003); Securities Lending Committee Chair (since 2019). | Director of Real Estate Equity Exchange, Inc. (since 2005); Director of Cloudera Foundation (2017-2020); and Director of Reading Partners (2012-2016). | Director of iShares, Inc. (since 2003); Trustee of iShares U.S. ETF Trust (since 2011). |
Madhav V. Rajan (1964) | Trustee (since 2011); Fixed-Income Plus Committee Chair (since 2019). | Dean, and George Pratt Shultz Professor of Accounting, University of Chicago Booth School of Business (since 2017); Advisory Board Member (since 2016) and Director (since 2020) of C.M. Capital Corporation; Chair of the Board for the Center for Research in Security Prices, LLC (since 2020); Director of WellBe Senior Medical (since 2023); Robert K. Jaedicke Professor of Accounting, Stanford University Graduate School of Business (2001-2017); Professor of Law (by courtesy), Stanford Law School (2005-2017); Senior Associate Dean for Academic Affairs and Head of MBA Program, Stanford University Graduate School of Business (2010-2016). | Director of iShares, Inc. (since 2011); Trustee of iShares U.S. ETF Trust (since 2011). |
Officers | ||
Name (Year of Birth) | Position(s) | Principal Occupation(s) During Past 5 Years |
Jessica Tan (1980) | President (since 2024). | Managing Director of BlackRock, Inc. (since 2015); Head of Global Product Solutions, Americas of BlackRock, Inc. (since 2024) and Head of Sustainable and Transition Solutions of BlackRock, Inc. (2022-2024); Global Head of Corporate Strategy of BlackRock, Inc. (2019-2022); Chief of Staff to the CEO of BlackRock, Inc. (2017-2019). |
Trent Walker (1974) | Treasurer and Chief Financial Officer (since 2020). | Managing Director of BlackRock, Inc. (since 2019); Chief Financial Officer of iShares Delaware Trust Sponsor LLC, BlackRock Funds, BlackRock Funds II, BlackRock Funds IV, BlackRock Funds V and BlackRock Funds VI (since 2021). |
Aaron Wasserman (1974) | Chief Compliance Officer (iShares, Inc. and iShares Trust, since 2023; iShares U.S. ETF Trust, since 2023). | Managing Director of BlackRock, Inc. (since 2018); Chief Compliance Officer of the BlackRock Multi-Asset Complex, the BlackRock Fixed-Income Complex and the iShares Complex (since 2023); Deputy Chief Compliance Officer for the BlackRock Multi-Asset Complex, the BlackRock Fixed-Income Complex and the iShares Complex (2014-2023). |
Marisa Rolland (1980) | Secretary (since 2022). | Managing Director of BlackRock, Inc. (since 2023); Director of BlackRock, Inc. (2018-2022). |
Officers (continued) | ||
Name (Year of Birth) | Position(s) | Principal Occupation(s) During Past 5 Years |
Rachel Aguirre (1982) | Executive Vice President (since 2022). | Managing Director of BlackRock, Inc. (since 2018); Head of U.S. iShares Product (since 2022); Head of EII U.S. Product Engineering of BlackRock, Inc. (since 2021); Co-Head of EII’s Americas Portfolio Engineering of BlackRock, Inc. (2020-2021); Head of Developed Markets Portfolio Engineering of BlackRock, Inc. (2016-2019). |
Jennifer Hsui (1976) | Executive Vice President (since 2022). | Managing Director of BlackRock, Inc. (since 2009); Co-Head of Index Equity of BlackRock, Inc. (since 2022). |
James Mauro (1970) | Executive Vice President (since 2022). | Managing Director of BlackRock, Inc. (since 2010); Head of Fixed Income Index Investments in the Americas and Head of San Francisco Core Portfolio Management of BlackRock, Inc. (since 2020). |
Effective July 1, 2023, Aaron Wasserman replaced Charles Park as Chief Compliance Officer. |
Effective February 1, 2024, Salim Ramji resigned as Trustee of the Trust. |
Effective March 5, 2024, Stephen Cohen replaced Salim Ramji as Trustee of the Trust. |
Effective March 5, 2024, Dominik Rohé resigned as President of the Trust. |
Effective March 5, 2024, Jessica Tan replaced Dominik Rohé as President of the Trust. |
Effective April 8, 2024, Laura Fergerson was appointed as Trustee of the Trust. |
Effective April 8, 2024, James Lam was appointed as Trustee of the Trust. |
• If your brokerage firm is not listed, electronic delivery may not be available. Please contact your broker-dealer or financial advisor.
Portfolio Abbreviation | |
NVS | Non-Voting Shares |
S&P | Standard & Poor's |


2024 Annual Report |
iShares Trust |
• iShares International Select Dividend ETF | IDV | Cboe BZX |


President, BlackRock Inc.
Total Returns as of April 30, 2024 | ||
6-Month | 12-Month | |
U.S. large cap equities (S&P 500® Index) | 20.98% | 22.66% |
U.S. small cap equities (Russell 2000® Index) | 19.66 | 13.32 |
International equities (MSCI Europe, Australasia, Far East Index) | 18.63 | 9.28 |
Emerging market equities (MSCI Emerging Markets Index) | 15.40 | 9.88 |
3-month Treasury bills (ICE BofA 3-Month U.S. Treasury Bill Index) | 2.66 | 5.36 |
U.S. Treasury securities (ICE BofA 10-Year U.S. Treasury Index) | 3.66 | (6.40) |
U.S. investment grade bonds (Bloomberg U.S. Aggregate Bond Index) | 4.97 | (1.47) |
Tax-exempt municipal bonds (Bloomberg Municipal Bond Index) | 7.06 | 2.08 |
U.S. high yield bonds (Bloomberg U.S. Corporate High Yield 2% Issuer Capped Index) | 8.99 | 9.01 |
Past performance is not an indication of future results. Index performance is shown for illustrative purposes only. You cannot invest directly in an index. | ||
Average Annual Total Returns | Cumulative Total Returns | ||||||
1 Year | 5 Years | 10 Years | 1 Year | 5 Years | 10 Years | ||
Fund NAV | 6.00 % | 3.92 % | 2.14 % | 6.00 % | 21.21 % | 23.58 % | |
Fund Market | 5.95 | 3.80 | 2.07 | 5.95 | 20.50 | 22.71 | |
Index | 6.88 | 3.91 | 2.20 | 6.88 | 21.13 | 24.33 | |
(AT NET ASSET VALUE)

Actual | Hypothetical 5% Return | |||||
Beginning Account Value (11/01/23) | Ending Account Value (04/30/24) | Expenses Paid During the Period(a) | Beginning Account Value (11/01/23) | Ending Account Value (04/30/24) | Expenses Paid During the Period(a) | Annualized Expense Ratio |
$1,000.00 | $1,149.20 | $2.67 | $1,000.00 | $1,022.40 | $2.51 | 0.50% |
(a) | Expenses are equal to the annualized expense ratio, multiplied by the average account value over the period, multiplied by 182/366 (to reflect the one-half year period shown). Other fees, such as brokerage commissions and other fees to financial intermediaries, may be paid which are not reflected in the tables and examples above. See “Disclosure of Expenses” for more information. |
Sector | Percent of Total Investments(a) |
Financials | 30.9 % |
Utilities | 16.4 |
Communication Services | 11.3 |
Materials | 10.3 |
Energy | 8.8 |
Consumer Discretionary | 7.8 |
Consumer Staples | 6.5 |
Industrials | 5.6 |
Real Estate | 2.0 |
Information Technology | 0.4 |
Country/Geographic Region | Percent of Total Investments(a) |
United Kingdom | 22.5 % |
Italy | 10.5 |
Spain | 8.9 |
France | 8.6 |
Australia | 7.7 |
Canada | 7.5 |
Germany | 7.5 |
Hong Kong | 6.8 |
South Korea | 4.3 |
Netherlands | 4.0 |
Switzerland | 2.4 |
Denmark | 2.1 |
Austria | 1.4 |
Finland | 1.4 |
Belgium | 1.2 |
Sweden | 1.0 |
Norway | 1.0 |
Other (each representing less than 1%) | 1.2 |
(a) | Excludes money market funds. |
Security | Shares | Value |
Common Stocks | ||
Australia — 7.6% | ||
APA Group | 7,611,602 | $40,619,155 |
BHP Group Ltd. | 4,887,688 | 134,050,272 |
Fortescue Ltd. | 5,363,920 | 88,903,988 |
IGO Ltd. | 5,565,253 | 27,718,748 |
Magellan Financial Group Ltd. | 1,931,108 | 10,965,082 |
Perpetual Ltd. | 565,450 | 8,597,237 |
310,854,482 | ||
Austria — 1.4% | ||
Oesterreichische Post AG | 398,606 | 12,698,492 |
OMV AG | 903,941 | 42,893,269 |
55,591,761 | ||
Belgium — 1.2% | ||
Ageas SA/NV | 685,280 | 31,455,420 |
Proximus SADP | 2,388,559 | 17,626,829 |
49,082,249 | ||
Canada — 7.5% | ||
Bank of Nova Scotia (The) | 1,444,277 | 66,262,693 |
Birchcliff Energy Ltd.(a) | 4,319,270 | 17,758,376 |
Canadian Utilities Ltd., Class A, NVS | 969,052 | 21,666,670 |
Emera Inc. | 1,183,332 | 39,910,002 |
Great-West Lifeco Inc. | 684,008 | 20,227,339 |
IGM Financial Inc. | 488,668 | 12,214,482 |
Labrador Iron Ore Royalty Corp. | 995,558 | 21,745,853 |
Manulife Financial Corp. | 1,868,269 | 43,576,884 |
Peyto Exploration & Development Corp. | 2,889,817 | 32,306,166 |
Power Corp. of Canada | 1,045,689 | 27,861,746 |
303,530,211 | ||
Denmark — 2.0% | ||
AP Moller - Maersk A/S, Class A | 15,164 | 21,505,404 |
D/S Norden A/S | 366,322 | 15,445,886 |
Danske Bank A/S | 1,578,930 | 45,452,638 |
Svitzer A/S, NVS | 30,328 | 1,019,120 |
83,423,048 | ||
Finland — 1.4% | ||
Fortum OYJ | 4,173,126 | 54,990,923 |
France — 8.5% | ||
ALD SA(b) | 3,097,205 | 20,368,807 |
Bouygues SA | 774,442 | 28,542,285 |
Credit Agricole SA | 3,357,259 | 51,947,654 |
Orange SA | 5,714,389 | 63,602,766 |
Rubis SCA | 1,023,123 | 35,406,457 |
TotalEnergies SE | 2,039,154 | 148,040,048 |
347,908,017 | ||
Germany — 4.2% | ||
Freenet AG | 1,024,205 | 28,471,238 |
Hapag-Lloyd AG(a)(b) | 110,168 | 20,294,382 |
Mercedes-Benz Group AG | 1,634,558 | 123,639,417 |
172,405,037 | ||
Hong Kong — 6.7% | ||
BOC Hong Kong Holdings Ltd. | 11,442,500 | 35,072,327 |
CK Hutchison Holdings Ltd. | 10,901,000 | 52,943,677 |
CK Infrastructure Holdings Ltd. | 3,836,500 | 21,672,917 |
Hang Seng Bank Ltd. | 2,630,900 | 34,692,560 |
Henderson Land Development Co. Ltd. | 11,869,000 | 35,782,907 |
Hysan Development Co. Ltd. | 10,261,000 | 15,992,617 |
Kerry Properties Ltd. | 9,545,500 | 18,505,050 |
New World Development Co. Ltd.(a) | 11,625,750 | 12,345,971 |
PCCW Ltd. | 61,808,000 | 30,903,644 |
Security | Shares | Value |
Hong Kong (continued) | ||
VTech Holdings Ltd. | 2,693,500 | $15,568,965 |
273,480,635 | ||
Israel — 0.5% | ||
ICL Group Ltd. | 4,497,756 | 21,112,332 |
Italy — 10.4% | ||
A2A SpA | 11,021,293 | 21,735,670 |
Anima Holding SpA(b) | 1,669,060 | 7,820,128 |
Azimut Holding SpA | 413,202 | 10,888,886 |
Banca Popolare di Sondrio SpA | 2,683,944 | 22,423,711 |
Banco BPM SpA | 7,627,833 | 50,081,604 |
BPER Banca SpA | 5,870,156 | 30,484,879 |
Enel SpA | 17,193,649 | 113,004,244 |
Eni SpA | 5,697,053 | 91,504,285 |
Italgas SpA | 4,083,813 | 22,637,186 |
Snam SpA | 9,338,789 | 42,727,493 |
UnipolSai Assicurazioni SpA | 3,186,933 | 9,125,166 |
422,433,252 | ||
Netherlands — 4.0% | ||
ING Groep NV | 6,195,305 | 97,949,418 |
NN Group NV | 880,392 | 40,613,255 |
SBM Offshore NV | 1,515,753 | 22,393,133 |
160,955,806 | ||
New Zealand — 0.7% | ||
Spark New Zealand Ltd. | 10,394,724 | 29,216,677 |
Norway — 1.0% | ||
DNB Bank ASA | 2,245,798 | 39,142,336 |
South Korea — 3.5% | ||
BNK Financial Group Inc. | 2,048,527 | 12,367,915 |
DB Insurance Co. Ltd. | 196,890 | 13,810,818 |
DGB Financial Group Inc. | 1,327,330 | 8,107,786 |
Hana Financial Group Inc. | 706,896 | 29,814,615 |
Industrial Bank of Korea | 1,712,177 | 17,213,420 |
Samsung Securities Co. Ltd. | 339,940 | 9,299,361 |
Shinhan Financial Group Co. Ltd. | 818,394 | 27,495,814 |
Woori Financial Group Inc. | 2,340,161 | 23,981,341 |
142,091,070 | ||
Spain — 8.8% | ||
ACS Actividades de Construccion y Servicios SA | 805,242 | 32,250,306 |
Bankinter SA | 3,409,128 | 26,946,293 |
CaixaBank SA | 12,579,563 | 66,339,037 |
Cia. de Distribucion Integral Logista Holdings SA | 737,357 | 20,055,678 |
Enagas SA | 2,035,755 | 29,856,414 |
Mapfre SA | 6,971,891 | 16,820,146 |
Naturgy Energy Group SA | 1,210,141 | 30,608,539 |
Redeia Corp. SA | 2,402,137 | 40,100,325 |
Telefonica SA | 20,916,913 | 93,699,313 |
356,676,051 | ||
Sweden — 1.0% | ||
Telia Co. AB | 17,752,826 | 40,609,161 |
Switzerland — 2.4% | ||
Swiss Re AG | 368,679 | 40,077,385 |
Zurich Insurance Group AG | 120,315 | 58,238,033 |
98,315,418 | ||
United Kingdom — 22.2% | ||
abrdn PLC | 12,406,473 | 22,624,209 |
Ashmore Group PLC | 4,571,040 | 11,046,512 |
British American Tobacco PLC | 6,011,497 | 176,475,138 |
BT Group PLC(a) | 33,466,259 | 42,796,765 |
Security | Shares | Value |
United Kingdom (continued) | ||
IG Group Holdings PLC | 1,864,254 | $17,395,819 |
Imperial Brands PLC | 3,734,893 | 85,342,861 |
Legal & General Group PLC | 15,874,555 | 46,599,748 |
National Grid PLC | 6,538,038 | 85,760,452 |
NatWest Group PLC, NVS | 13,630,457 | 51,446,541 |
OSB Group PLC | 2,850,291 | 14,595,497 |
Persimmon PLC | 1,762,194 | 28,535,257 |
Phoenix Group Holdings PLC | 5,625,863 | 34,265,471 |
Rio Tinto PLC | 1,781,516 | 120,538,663 |
SSE PLC | 2,789,189 | 57,977,183 |
Vodafone Group PLC | 130,109,949 | 109,721,904 |
905,122,020 | ||
Total Common Stocks — 95.0% (Cost: $3,961,747,742) | 3,866,940,486 | |
Preferred Stocks | ||
Germany — 3.1% | ||
Bayerische Motoren Werke AG, Preference Shares, NVS | 432,081 | 44,397,056 |
Schaeffler AG, Preference Shares, NVS | 2,265,704 | 13,258,280 |
Volkswagen AG, Preference Shares, NVS | 576,218 | 70,589,644 |
128,244,980 | ||
South Korea — 0.8% | ||
Hyundai Motor Co., Series 2, Preference Shares, NVS | 279,014 | 31,882,301 |
Total Preferred Stocks — 3.9% (Cost: $154,512,771) | 160,127,281 | |
Total Long-Term Investments — 98.9% (Cost: $4,116,260,513) | 4,027,067,767 | |
Security | Shares | Value |
Short-Term Securities | ||
Money Market Funds — 2.0% | ||
BlackRock Cash Funds: Institutional, SL Agency Shares, 5.49%(c)(d)(e) | 77,134,029 | $77,157,169 |
BlackRock Cash Funds: Treasury, SL Agency Shares, 5.28%(c)(d) | 2,560,000 | 2,560,000 |
Total Short-Term Securities — 2.0% (Cost: $79,712,034) | 79,717,169 | |
Total Investments — 100.9% (Cost: $4,195,972,547) | 4,106,784,936 | |
Liabilities in Excess of Other Assets — (0.9)% | (35,827,750 ) | |
Net Assets — 100.0% | $4,070,957,186 | |
(a) | All or a portion of this security is on loan. |
(b) | Security exempt from registration pursuant to Rule 144A under the Securities Act of 1933, as amended. These securities may be resold in transactions exempt from registration to qualified institutional investors. |
(c) | Affiliate of the Fund. |
(d) | Annualized 7-day yield as of period end. |
(e) | All or a portion of this security was purchased with the cash collateral from loaned securities. |
Affiliated Issuer | Value at 04/30/23 | Purchases at Cost | Proceeds from Sales | Net Realized Gain (Loss) | Change in Unrealized Appreciation (Depreciation) | Value at 04/30/24 | Shares Held at 04/30/24 | Income | Capital Gain Distributions from Underlying Funds |
BlackRock Cash Funds: Institutional, SL Agency Shares | $68,492,998 | $8,666,236 (a) | $— | $8,475 | $(10,540 ) | $77,157,169 | 77,134,029 | $6,250,857 (b) | $— |
BlackRock Cash Funds: Treasury, SL Agency Shares | 4,300,000 | — | (1,740,000 )(a) | — | — | 2,560,000 | 2,560,000 | 328,578 | — |
$8,475 | $(10,540 ) | $79,717,169 | $6,579,435 | $— |
(a) | Represents net amount purchased (sold). |
(b) | All or a portion represents securities lending income earned from the reinvestment of cash collateral from loaned securities, net of fees and collateral investment expenses, and other payments to and from borrowers of securities. |
Description | Number of Contracts | Expiration Date | Notional Amount (000) | Value/ Unrealized Appreciation (Depreciation) |
Long Contracts | ||||
SPI 200 Index | 49 | 06/20/24 | $6,020 | $(137,298 ) |
Euro STOXX 50 Index | 175 | 06/21/24 | 9,098 | (149,911 ) |
FTSE 100 Index | 239 | 06/21/24 | 24,275 | 580,549 |
$293,340 |
Reference Entity | Payment Frequency | Counterparty(a) | Termination Date | Net Notional | Accrued Unrealized Appreciation (Depreciation) | Net Value of Reference Entity | Gross Notional Amount Net Asset Percentage |
Equity Securities Long | Monthly | Goldman Sachs Bank USA(b) | 08/19/26 | $637,507 | $938 (c) | $640,030 | 0.0 % |
Monthly | HSBC Bank PLC(d) | 02/10/28 | 485,949 | (45,108 )(e) | 491,952 | 0.0 | |
Monthly | JPMorgan Chase Bank NA(f) | 02/10/25 | 425,396 | 10,296 (g) | 437,035 | 0.0 | |
$(33,874 ) | $1,569,017 |
(a) | The Fund receives the total return on a portfolio of long positions underlying the total return swap. The Fund pays the total return on a portfolio of short positions underlying the total return swap. In addition, the Fund pays or receives a variable rate of interest, based on a specified benchmark. The benchmark and spread are determined based upon the country and/or currency of the individual underlying positions. |
(c) | Amount includes $(1,585) of net dividends and financing fees. |
(e) | Amount includes $(51,111) of net dividends, payable for referenced securities purchased and financing fees. |
(g) | Amount includes $(1,343) of net dividends, payable for referenced securities purchased and financing fees. |
The following are the specified benchmarks (plus or minus a range) used in determining the variable rate of interest: | ||||||
(b) | (d) | (f) | ||||
Range: Benchmarks: | 45 basis points EUR - 1D Euro Short Term Rate (ESTR) | 45 basis points EUR - 1D Euro Short Term Rate (ESTR) | 40 basis points EUR - 1D Euro Short Term Rate (ESTR) | |||
Shares | Value | % of Basket Value | |
Reference Entity — Long | |||
Common Stocks | |||
Spain | |||
Enagas SA | 18,706 | $273,163 | 42.7% |
Red Electrica Corp. SA | 22,073 | 366,867 | 57.3 |
Net Value of Reference Entity — Goldman Sachs Bank USA | $640,030 | ||
Shares | Value | % of Basket Value | |
Reference Entity — Long | |||
Common Stocks | |||
Spain | |||
Telefonica SA | 109,744 | $491,952 | 100.0% |
Net Value of Reference Entity — HSBC Bank PLC | $491,952 | ||
Shares | Value | % of Basket Value | |
Reference Entity — Long | |||
Common Stocks | |||
Spain | |||
Enagas SA | 6,727 | $100,323 | 22.9% |
Red Electrica Corp. SA | 11,862 | 201,409 | 46.1 |
Telefonica SA | 29,719 | 135,303 | 31.0 |
Net Value of Reference Entity — JPMorgan Chase Bank NA | $437,035 | ||
Description | Swap Premiums Paid | Swap Premiums Received | Unrealized Appreciation | Unrealized Depreciation |
Total Return Swaps | $— | $— | $11,234 | $(45,108 ) |
Commodity Contracts | Credit Contracts | Equity Contracts | Foreign Currency Exchange Contracts | Interest Rate Contracts | Other Contracts | Total | |
Assets—Derivative Financial Instruments | |||||||
Futures contracts | |||||||
Unrealized appreciation on futures contracts(a) | $— | $— | $580,549 | $— | $— | $— | $580,549 |
Swaps — OTC | |||||||
Unrealized appreciation on OTC swaps; Swap premiums paid | $— | $— | $11,234 | $— | $— | $— | $11,234 |
$— | $— | $591,783 | $— | $— | $— | $591,783 | |
Liabilities—Derivative Financial Instruments | |||||||
Futures contracts | |||||||
Unrealized depreciation on futures contracts(a) | $— | $— | $287,209 | $— | $— | $— | $287,209 |
Swaps — OTC | |||||||
Unrealized depreciation on OTC swaps; Swap premiums received | $— | $— | $45,108 | $— | $— | $— | $45,108 |
$— | $— | $332,317 | $— | $— | $— | $332,317 |
(a) | Net cumulative unrealized appreciation (depreciation) on futures contracts are reported in the Schedule of Investments. In the Statement of Assets and Liabilities, only current day's variation margin is reported in receivables or payables and the net cumulative unrealized appreciation (depreciation) is included in accumulated earnings (loss). |
Commodity Contracts | Credit Contracts | Equity Contracts | Foreign Currency Exchange Contracts | Interest Rate Contracts | Other Contracts | Total | |
Net Realized Gain (Loss) from | |||||||
Futures contracts | $— | $— | $1,602,531 | $— | $— | $— | $1,602,531 |
Swaps | — | — | (2,034,468 ) | — | — | — | (2,034,468 ) |
$— | $— | $(431,937 ) | $— | $— | $— | $(431,937 ) | |
Net Change in Unrealized Appreciation (Depreciation) on | |||||||
Futures contracts | $— | $— | $(1,277,797 ) | $— | $— | $— | $(1,277,797 ) |
Swaps | — | — | (998,515 ) | — | — | — | (998,515 ) |
$— | $— | $(2,276,312 ) | $— | $— | $— | $(2,276,312 ) |
Futures contracts: | |
Average notional value of contracts — long | $30,957,074 |
Total return swaps: | |
Average notional value | $13,621,301 |
Assets | Liabilities | |
Derivative Financial Instruments: | ||
Futures contracts | $580,549 | $287,209 |
Swaps - OTC | 11,234 | 45,108 |
Total derivative assets and liabilities in the Statement of Assets and Liabilities | 591,783 | 332,317 |
Derivatives not subject to a Master Netting Agreement or similar agreement ("MNA") | (580,549 ) | (287,209 ) |
Total derivative assets and liabilities subject to an MNA | $11,234 | $45,108 |
Counterparty | Derivative Assets Subject to an MNA by Counterparty | Derivatives Available for Offset(a) | Non-Cash Collateral Received | Cash Collateral Received(b) | Net Amount of Derivative Assets(c) |
Goldman Sachs Bank USA | $938 | $— | $— | $— | $938 |
JPMorgan Chase Bank NA | 10,296 | — | — | — | 10,296 |
$11,234 | $— | $— | $— | $11,234 |
Counterparty | Derivative Liabilities Subject to an MNA by Counterparty | Derivatives Available for Offset(a) | Non-Cash Collateral Pledged | Cash Collateral Pledged(b) | Net Amount of Derivative Liabilities(d) |
HSBC Bank PLC | $45,108 | $— | $— | $— | $45,108 |
(a) | The amount of derivatives available for offset is limited to the amount of derivative assets and/or liabilities that are subject to an MNA. |
(b) | Excess of collateral received/pledged, if any, from the individual counterparty is not shown for financial reporting purposes. |
(c) | Net amount represents the net amount receivable from the counterparty in the event of default. |
(d) | Net amount represents the net amount payable due to the counterparty in the event of default. |
Level 1 | Level 2 | Level 3 | Total | |
Assets | ||||
Investments | ||||
Long-Term Investments | ||||
Common Stocks | $362,439,349 | $3,504,501,137 | $— | $3,866,940,486 |
Preferred Stocks | — | 160,127,281 | — | 160,127,281 |
Short-Term Securities | ||||
Money Market Funds | 79,717,169 | — | — | 79,717,169 |
$442,156,518 | $3,664,628,418 | $— | $4,106,784,936 | |
Derivative Financial Instruments(a) | ||||
Assets | ||||
Equity Contracts | $— | $591,783 | $— | $591,783 |
Liabilities | ||||
Equity Contracts | — | (332,317 ) | — | (332,317 ) |
$— | $259,466 | $— | 259,466 |
(a) | Derivative financial instruments are swaps and futures contracts. Swaps and futures contracts are valued at the unrealized appreciation (depreciation) on the instrument. |
iShares International Select Dividend ETF | |
ASSETS | |
Investments, at value—unaffiliated(a)(b) | $4,027,067,767 |
Investments, at value—affiliated(c) | 79,717,169 |
Cash | 633 |
Foreign currency collateral pledged for futures contracts(d) | 1,970,898 |
Foreign currency, at value(e) | 9,376,121 |
Receivables: | |
Securities lending income—affiliated | 372,669 |
Swaps | 862,559 |
Dividends— unaffiliated | 21,929,895 |
Dividends—affiliated | 12,570 |
Tax reclaims | 14,306,407 |
Unrealized appreciation on OTC swaps | 11,234 |
Total assets | 4,155,627,922 |
LIABILITIES | |
Cash received: | |
OTC derivatives | 960,000 |
Futures contracts | 6,478 |
Collateral on securities loaned, at value | 77,136,973 |
Payables: | |
Swaps | 1,485 |
Investment advisory fees | 1,660,882 |
IRS compliance fee for foreign withholding tax claims | 4,578,145 |
Professional fees | 14,353 |
Variation margin on futures contracts | 267,312 |
Unrealized depreciation on OTC swaps | 45,108 |
Total liabilities | 84,670,736 |
Commitments and contingent liabilities | |
NET ASSETS | $4,070,957,186 |
NET ASSETS CONSIST OF | |
Paid-in capital | $5,509,496,759 |
Accumulated loss | (1,438,539,573) |
NET ASSETS | $4,070,957,186 |
NET ASSET VALUE | |
Shares outstanding | 146,300,000 |
Net asset value | $27.83 |
Shares authorized | Unlimited |
Par value | None |
(a) Investments, at cost—unaffiliated | $4,116,260,513 |
(b) Securities loaned, at value | $71,912,643 |
(c) Investments, at cost—affiliated | $79,712,034 |
(d) Foreign currency collateral pledged, at cost | $2,083,002 |
(e) Foreign currency, at cost | $9,329,247 |
iShares International Select Dividend ETF | |
INVESTMENT INCOME | |
Dividends—unaffiliated | $318,017,376 |
Dividends—affiliated | 328,578 |
Interest—unaffiliated | 233,148 |
Securities lending income—affiliated—net | 6,250,857 |
Other income—unaffiliated | 102,546 |
Foreign taxes withheld | (31,111,042 ) |
IRS compliance fee for foreign withholding tax claims | 128,887 |
Total investment income | 293,950,350 |
EXPENSES | |
Investment advisory | 21,760,376 |
Professional | 31,220 |
Commitment costs | 20,450 |
Interest expense | 5,691 |
Total expenses | 21,817,737 |
Net investment income | 272,132,613 |
REALIZED AND UNREALIZED GAIN (LOSS) | |
Net realized gain (loss) from: | |
Investments—unaffiliated | (221,813,356 ) |
Investments—affiliated | 8,475 |
Foreign currency transactions | (3,442,680 ) |
Futures contracts | 1,602,531 |
In-kind redemptions—unaffiliated(a) | 80,417,572 |
Swaps | (2,034,468 ) |
(145,261,926 ) | |
Net change in unrealized appreciation (depreciation) on: | |
Investments—unaffiliated | 94,465,318 |
Investments—affiliated | (10,540 ) |
Foreign currency translations | (177,206 ) |
Futures contracts | (1,277,797 ) |
Swaps | (998,515 ) |
92,001,260 | |
Net realized and unrealized loss | (53,260,666 ) |
NET INCREASE IN NET ASSETS RESULTING FROM OPERATIONS | $218,871,947 |
(a) See Note 2 of the Notes to Financial Statements. | |
iShares International Select Dividend ETF | ||
Year Ended 04/30/24 | Year Ended 04/30/23 | |
INCREASE (DECREASE) IN NET ASSETS | ||
OPERATIONS | ||
Net investment income | $272,132,613 | $346,145,773 |
Net realized loss | (145,261,926 ) | (158,688,634 ) |
Net change in unrealized appreciation (depreciation) | 92,001,260 | (219,514,963 ) |
Net increase (decrease) in net assets resulting from operations | 218,871,947 | (32,057,824 ) |
DISTRIBUTIONS TO SHAREHOLDERS(a) | ||
Decrease in net assets resulting from distributions to shareholders | (310,046,633 ) | (304,367,747 ) |
CAPITAL SHARE TRANSACTIONS | ||
Net increase (decrease) in net assets derived from capital share transactions | (860,444,926 ) | 749,314,980 |
NET ASSETS | ||
Total increase (decrease) in net assets | (951,619,612 ) | 412,889,409 |
Beginning of year | 5,022,576,798 | 4,609,687,389 |
End of year | $4,070,957,186 | $5,022,576,798 |
(a) | Distributions for annual periods determined in accordance with U.S. federal income tax regulations. |
iShares International Select Dividend ETF | |||||
Year Ended 04/30/24 | Year Ended 04/30/23 | Year Ended 04/30/22 | Year Ended 04/30/21 | Year Ended 04/30/20 | |
Net asset value, beginning of year | $28.14 | $30.17 | $32.41 | $24.14 | $31.59 |
Net investment income(a) | 1.66 | 2.06 (b) | 1.95 (b) | 1.35 | 1.83 |
Net realized and unrealized gain (loss)(c) | (0.13 ) | (2.25 ) | (2.48 ) | 8.19 | (7.10 ) |
Net increase (decrease) from investment operations | 1.53 | (0.19 ) | (0.53 ) | 9.54 | (5.27 ) |
Distributions from net investment income(d) | (1.84 ) | (1.84 ) | (1.71 ) | (1.27 ) | (2.18 ) |
Net asset value, end of year | $27.83 | $28.14 | $30.17 | $32.41 | $24.14 |
Total Return(e) | |||||
Based on net asset value | 6.00 % | (0.06 )%(b) | (1.76 )%(b) | 40.57 % | (17.15 )% |
Ratios to Average Net Assets(f) | |||||
Total expenses | 0.49 % | 0.51 % | 0.54 % | 0.49 % | 0.49 % |
Total expenses after fees waived | 0.49 % | 0.51 % | 0.54 % | 0.49 % | 0.49 % |
Total expenses excluding professional fees for foreign withholding tax claims | 0.49 % | 0.49 % | 0.49 % | N/A | N/A |
Net investment income | 6.17 % | 7.58 %(b) | 6.12 %(b) | 4.87 % | 6.06 % |
Supplemental Data | |||||
Net assets, end of year (000) | $4,070,957 | $5,022,577 | $4,609,687 | $4,329,942 | $3,421,123 |
Portfolio turnover rate(g) | 48 % | 29 % | 36 % | 86 % | 12 % |
(a) Based on average shares outstanding. | |||||
(b) Reflects the one-time, positive effect of foreign withholding tax claims, net of the associated professional fees, which resulted in the following increases for the years ended April 30, 2023 and April 30,2022 respectively: • Net investment income per share by $0.04 and $0.13. • Total return by 0.13% and 0.39%. • Ratio of net investment income to average net assets by 0.15% and 0.41%. | |||||
(c) The amounts reported for a share outstanding may not accord with the change in aggregate gains and losses in securities for the fiscal period due to the timing of capital share transactions in relation to the fluctuating market values of the Fund’s underlying securities. | |||||
(d) Distributions for annual periods determined in accordance with U.S. federal income tax regulations. | |||||
(e) Where applicable, assumes the reinvestment of distributions. | |||||
(f) Excludes fees and expenses incurred indirectly as a result of investments in underlying funds. | |||||
(g) Portfolio turnover rate excludes in-kind transactions, if any. | |||||
iShares ETF | Diversification Classification |
International Select Dividend | Diversified |
iShares ETF and Counterparty | Securities Loaned at Value | Cash Collateral Received(a) | Non-Cash Collateral Received, at Fair Value(a) | Net Amount |
International Select Dividend | ||||
Barclays Capital, Inc. | $1,756,656 | $(1,756,656) | $— | $— |
BNP Paribas SA | 1,576,863 | (1,576,863) | — | — |
BofA Securities, Inc. | 2,558,136 | (2,558,136) | — | — |
Goldman Sachs & Co. LLC | 5,518,334 | (5,518,334) | — | — |
HSBC Bank PLC | 42,851,499 | (42,851,499) | — | — |
J.P. Morgan Securities LLC | 6,045,136 | (6,045,136) | — | — |
Macquarie Bank Ltd. | 18,421 | (16,325) | — | 2,096(b) |
Morgan Stanley | 10,819,798 | (10,819,798) | — | — |
Scotia Capital (USA), Inc. | 296,030 | (296,030) | — | — |
UBS AG | 471,770 | (471,770) | — | — |
$71,912,643 | $(71,910,547) | $— | $2,096 |
(a) | Collateral received, if any, in excess of the market value of securities on loan is not presented in this table. The total cash collateral received by the Fund is disclosed in the Fund’s Statements of Assets and Liabilities. |
(b) | The market value of the loaned securities is determined as of April 30, 2024. Additional collateral is delivered to the Fund on the next business day in accordance with the MSLA. The net amount would be subject to the borrower default indemnity in the event of default by a counterparty. |
Aggregate Average Daily Net Assets | Investment Advisory Fees |
First $12 billion | 0.5000% |
Over $12 billion, up to and including $18 billion | 0.4750 |
Over $18 billion, up to and including $24 billion | 0.4513 |
Over $24 billion, up to and including $30 billion | 0.4287 |
Over $30 billion | 0.4073 |
iShares ETF | Purchases | Sales | Net Realized Gain (Loss) |
International Select Dividend | $34,703,908 | $19,058,408 | $(3,900,235) |
iShares ETF | Purchases | Sales |
International Select Dividend | $2,097,144,779 | $2,209,900,659 |
iShares ETF | In-kind Purchases | In-kind Sales |
International Select Dividend | $9,850,720 | $759,520,436 |
iShares ETF | Paid-in Capital | Accumulated Earnings (Loss) |
International Select Dividend | $27,325,717 | $ (27,325,717) |
iShares ETF | Year Ended 04/30/24 | Year Ended 04/30/23 |
International Select Dividend | ||
Ordinary income | $310,046,633 | $304,367,747 |
iShares ETF | Undistributed Ordinary Income | Non-expiring Capital Loss Carryforwards(a) | Net Unrealized Gains (Losses)(b) | Total |
International Select Dividend | $45,574,716 | $(1,338,068,550) | $(146,045,739) | $(1,438,539,573) |
(a) | Amounts available to offset future realized capital gains. |
(b) | The difference between book-basis and tax-basis net unrealized gains (losses) was attributable primarily to the tax deferral of losses on wash sales, the realization for tax purposes of unrealized gains (losses) on certain futures contracts, the accounting for swap agreements and the realization for tax purposes of unrealized gains on investments in passive foreign investment companies. |
iShares ETF | Tax Cost | Gross Unrealized Appreciation | Gross Unrealized Depreciation | Net Unrealized Appreciation (Depreciation) |
International Select Dividend | $4,252,147,006 | $301,209,010 | $(446,708,378) | $(145,499,368) |
Year Ended 04/30/24 | Year Ended 04/30/23 | |||
iShares ETF | Shares | Amount | Shares | Amount |
International Select Dividend | ||||
Shares sold | 800,000 | $21,685,544 | 29,750,000 | $855,301,402 |
Shares redeemed | (33,000,000 ) | (882,130,470 ) | (4,050,000 ) | (105,986,422 ) |
(32,200,000 ) | $(860,444,926 ) | 25,700,000 | $749,314,980 | |
iShares Trust and Shareholders of iShares International Select Dividend ETF
Philadelphia, Pennsylvania
June 24, 2024
iShares ETF | Qualified Dividend Income |
International Select Dividend | $273,376,626 |
iShares ETF | Foreign Source Income Earned | Foreign Taxes Paid |
International Select Dividend | $318,017,378 | $31,230,786 |
Interested Trustees | |||
Name (Year of Birth) | Position(s) | Principal Occupation(s) During Past 5 Years | Other Directorships Held by Trustee |
Robert S. Kapito(a) (1957) | Trustee (since 2009). | President of BlackRock, Inc. (since 2006); Vice Chairman of BlackRock, Inc. and Head of BlackRock’s Portfolio Management Group (since its formation in 1998) and BlackRock, Inc.’s predecessor entities (since 1988); Trustee, University of Pennsylvania (since 2009); President of Board of Directors, Hope & Heroes Children’s Cancer Fund (since 2002). | Director of BlackRock, Inc. (since 2006); Director of iShares, Inc. (since 2009); Trustee of iShares U.S. ETF Trust (since 2011). |
Stephen Cohen(b) (1975) | Trustee (since 2024). | Senior Managing Director, Head of Global Product Solutions of BlackRock, Inc. (since 2024); Senior Managing Director, Head of Europe, Middle East and Africa Regions of BlackRock, Inc. (2021-2024); Head of iShares Index and Wealth in EMEA of BlackRock, Inc. (2017-2021); Global Head of Fixed Income Indexing of BlackRock, Inc. (2016-2017); Chief Investment Strategist for International Fixed Income and iShares of BlackRock, Inc. (2011-2015). | Director of iShares, Inc. (since 2024); Trustee of iShares U.S. ETF Trust (since 2024). |
(a) Robert S. Kapito is deemed to be an “interested person” (as defined in the 1940 Act) of the Trust due to his affiliations with BlackRock, Inc. and its affiliates. | |||
(b) Stephen Cohen is deemed to be an "interested person" (as defined in the 1940 Act) of the Trust due to his affiliations with BlackRock, Inc. and its affiliates. | |||
Independent Trustees | |||
Name (Year of Birth) | Position(s) | Principal Occupation(s) During Past 5 Years | Other Directorships Held by Trustee |
John E. Kerrigan (1955) | Trustee (since 2005); Independent Board Chair (since 2022). | Chief Investment Officer, Santa Clara University (since 2002). | Director of iShares, Inc. (since 2005); Trustee of iShares U.S. ETF Trust (since 2011); Independent Board Chair of iShares, Inc. and iShares U.S. ETF Trust (since 2022). |
Jane D. Carlin (1956) | Trustee (since 2015); Risk Committee Chair (since 2016). | Consultant (since 2012); Member of the Audit Committee (2012-2018), Chair of the Nominating and Governance Committee (2017-2018) and Director of PHH Corporation (mortgage solutions) (2012-2018); Managing Director and Global Head of Financial Holding Company Governance & Assurance and the Global Head of Operational Risk Management of Morgan Stanley (2006-2012). | Director of iShares, Inc. (since 2015); Trustee of iShares U.S. ETF Trust (since 2015); Member of the Audit Committee (since 2016), Chair of the Audit Committee (since 2020) and Director of The Hanover Insurance Group, Inc. (since 2016). |
Richard L. Fagnani (1954) | Trustee (since 2017); Audit Committee Chair (since 2019). | Partner, KPMG LLP (2002-2016); Director of One Generation Away (since 2021). | Director of iShares, Inc. (since 2017); Trustee of iShares U.S. ETF Trust (since 2017). |
Laura F. Fergerson (1962) | Trustee since (2024). | President, Franklin Templeton Services, LLC (2017-2024); Director of the Board of Crocker Art Museum Association (since 2019); President, Crocker Art Museum Foundation (2022-2023). | Director of iShares, Inc. (since 2024); Trustee of iShares U.S. ETF Trust (since 2024). |
Independent Trustees (continued) | |||
Name (Year of Birth) | Position(s) | Principal Occupation(s) During Past 5 Years | Other Directorships Held by Trustee |
Cecilia H. Herbert (1949) | Trustee (since 2005); Nominating and Governance and Equity Plus Committee Chairs (since 2022). | Chair of the Finance Committee (since 2019) and Trustee and Member of the Finance, Audit and Quality Committees of Stanford Health Care (since 2016); Trustee of WNET, New York’s public media company (since 2011) and Member of the Audit Committee (since 2018), Investment Committee (since 2011) and Personnel Committee (since 2022); Member of the Wyoming State Investment Funds Committee (since 2022); Trustee of Forward Funds (14 portfolios) (2009-2018); Trustee of Salient MF Trust (4 portfolios) (2015-2018); Director of the Jackson Hole Center for the Arts (since 2021). | Director of iShares, Inc. (since 2005); Trustee of iShares U.S. ETF Trust (since 2011). |
James Lam (1961) | Trustee (since 2024). | President, James Lam & Associates, Inc. (since 2002); Director of the FAIR Institute (since 2020); adjunct professor at Carnegie Mellon University (since 2018); Member, Zicklin School of Business Dean's Council of Baruch College (since 2017); Director and Audit Committee Chair of RiskLens, Inc. (2018-2023); Director, Risk Oversight Committee Chair and Audit Committee Member of E*TRADE Financial and E*TRADE Bank (2012-2020). | Director of iShares, Inc. (since 2024); Trustee of iShares U.S. ETF Trust (since 2024). |
Drew E. Lawton (1959) | Trustee (since 2017); 15(c) Committee Chair (since 2017). | Senior Managing Director of New York Life Insurance Company (2010-2015). | Director of iShares, Inc. (since 2017); Trustee of iShares U.S. ETF Trust (since 2017); Director of Jackson Financial Inc. (since 2021). |
John E. Martinez (1961) | Trustee (since 2003); Securities Lending Committee Chair (since 2019). | Director of Real Estate Equity Exchange, Inc. (since 2005); Director of Cloudera Foundation (2017-2020); and Director of Reading Partners (2012-2016). | Director of iShares, Inc. (since 2003); Trustee of iShares U.S. ETF Trust (since 2011). |
Madhav V. Rajan (1964) | Trustee (since 2011); Fixed-Income Plus Committee Chair (since 2019). | Dean, and George Pratt Shultz Professor of Accounting, University of Chicago Booth School of Business (since 2017); Advisory Board Member (since 2016) and Director (since 2020) of C.M. Capital Corporation; Chair of the Board for the Center for Research in Security Prices, LLC (since 2020); Director of WellBe Senior Medical (since 2023); Robert K. Jaedicke Professor of Accounting, Stanford University Graduate School of Business (2001-2017); Professor of Law (by courtesy), Stanford Law School (2005-2017); Senior Associate Dean for Academic Affairs and Head of MBA Program, Stanford University Graduate School of Business (2010-2016). | Director of iShares, Inc. (since 2011); Trustee of iShares U.S. ETF Trust (since 2011). |
Officers | ||
Name (Year of Birth) | Position(s) | Principal Occupation(s) During Past 5 Years |
Jessica Tan (1980) | President (since 2024). | Managing Director of BlackRock, Inc. (since 2015); Head of Global Product Solutions, Americas of BlackRock, Inc. (since 2024) and Head of Sustainable and Transition Solutions of BlackRock, Inc. (2022-2024); Global Head of Corporate Strategy of BlackRock, Inc. (2019-2022); Chief of Staff to the CEO of BlackRock, Inc. (2017-2019). |
Trent Walker (1974) | Treasurer and Chief Financial Officer (since 2020). | Managing Director of BlackRock, Inc. (since 2019); Chief Financial Officer of iShares Delaware Trust Sponsor LLC, BlackRock Funds, BlackRock Funds II, BlackRock Funds IV, BlackRock Funds V and BlackRock Funds VI (since 2021). |
Aaron Wasserman (1974) | Chief Compliance Officer (iShares, Inc. and iShares Trust, since 2023; iShares U.S. ETF Trust, since 2023). | Managing Director of BlackRock, Inc. (since 2018); Chief Compliance Officer of the BlackRock Multi-Asset Complex, the BlackRock Fixed-Income Complex and the iShares Complex (since 2023); Deputy Chief Compliance Officer for the BlackRock Multi-Asset Complex, the BlackRock Fixed-Income Complex and the iShares Complex (2014-2023). |
Marisa Rolland (1980) | Secretary (since 2022). | Managing Director of BlackRock, Inc. (since 2023); Director of BlackRock, Inc. (2018-2022). |
Officers (continued) | ||
Name (Year of Birth) | Position(s) | Principal Occupation(s) During Past 5 Years |
Rachel Aguirre (1982) | Executive Vice President (since 2022). | Managing Director of BlackRock, Inc. (since 2018); Head of U.S. iShares Product (since 2022); Head of EII U.S. Product Engineering of BlackRock, Inc. (since 2021); Co-Head of EII’s Americas Portfolio Engineering of BlackRock, Inc. (2020-2021); Head of Developed Markets Portfolio Engineering of BlackRock, Inc. (2016-2019). |
Jennifer Hsui (1976) | Executive Vice President (since 2022). | Managing Director of BlackRock, Inc. (since 2009); Co-Head of Index Equity of BlackRock, Inc. (since 2022). |
James Mauro (1970) | Executive Vice President (since 2022). | Managing Director of BlackRock, Inc. (since 2010); Head of Fixed Income Index Investments in the Americas and Head of San Francisco Core Portfolio Management of BlackRock, Inc. (since 2020). |
Effective July 1, 2023, Aaron Wasserman replaced Charles Park as Chief Compliance Officer. |
Effective February 1, 2024, Salim Ramji resigned as Trustee of the Trust. |
Effective March 5, 2024, Stephen Cohen replaced Salim Ramji as Trustee of the Trust. |
Effective March 5, 2024, Dominik Rohé resigned as President of the Trust. |
Effective March 5, 2024, Jessica Tan replaced Dominik Rohé as President of the Trust. |
Effective April 8, 2024, Laura Fergerson was appointed as Trustee of the Trust. |
Effective April 8, 2024, James Lam was appointed as Trustee of the Trust. |
• If your brokerage firm is not listed, electronic delivery may not be available. Please contact your broker-dealer or financial advisor.
Portfolio Abbreviation | |
NVS | Non-Voting Shares |


2024 Annual Report |
iShares Trust |
• iShares Environmentally Aware Real Estate ETF | ERET | NASDAQ |
• iShares Global REIT ETF | REET | NYSE Arca |
• iShares International Developed Real Estate ETF | IFGL | NASDAQ |


President, BlackRock Inc.
Total Returns as of April 30, 2024 | ||
6-Month | 12-Month | |
U.S. large cap equities (S&P 500® Index) | 20.98% | 22.66% |
U.S. small cap equities (Russell 2000® Index) | 19.66 | 13.32 |
International equities (MSCI Europe, Australasia, Far East Index) | 18.63 | 9.28 |
Emerging market equities (MSCI Emerging Markets Index) | 15.40 | 9.88 |
3-month Treasury bills (ICE BofA 3-Month U.S. Treasury Bill Index) | 2.66 | 5.36 |
U.S. Treasury securities (ICE BofA 10-Year U.S. Treasury Index) | 3.66 | (6.40) |
U.S. investment grade bonds (Bloomberg U.S. Aggregate Bond Index) | 4.97 | (1.47) |
Tax-exempt municipal bonds (Bloomberg Municipal Bond Index) | 7.06 | 2.08 |
U.S. high yield bonds (Bloomberg U.S. Corporate High Yield 2% Issuer Capped Index) | 8.99 | 9.01 |
Past performance is not an indication of future results. Index performance is shown for illustrative purposes only. You cannot invest directly in an index. | ||
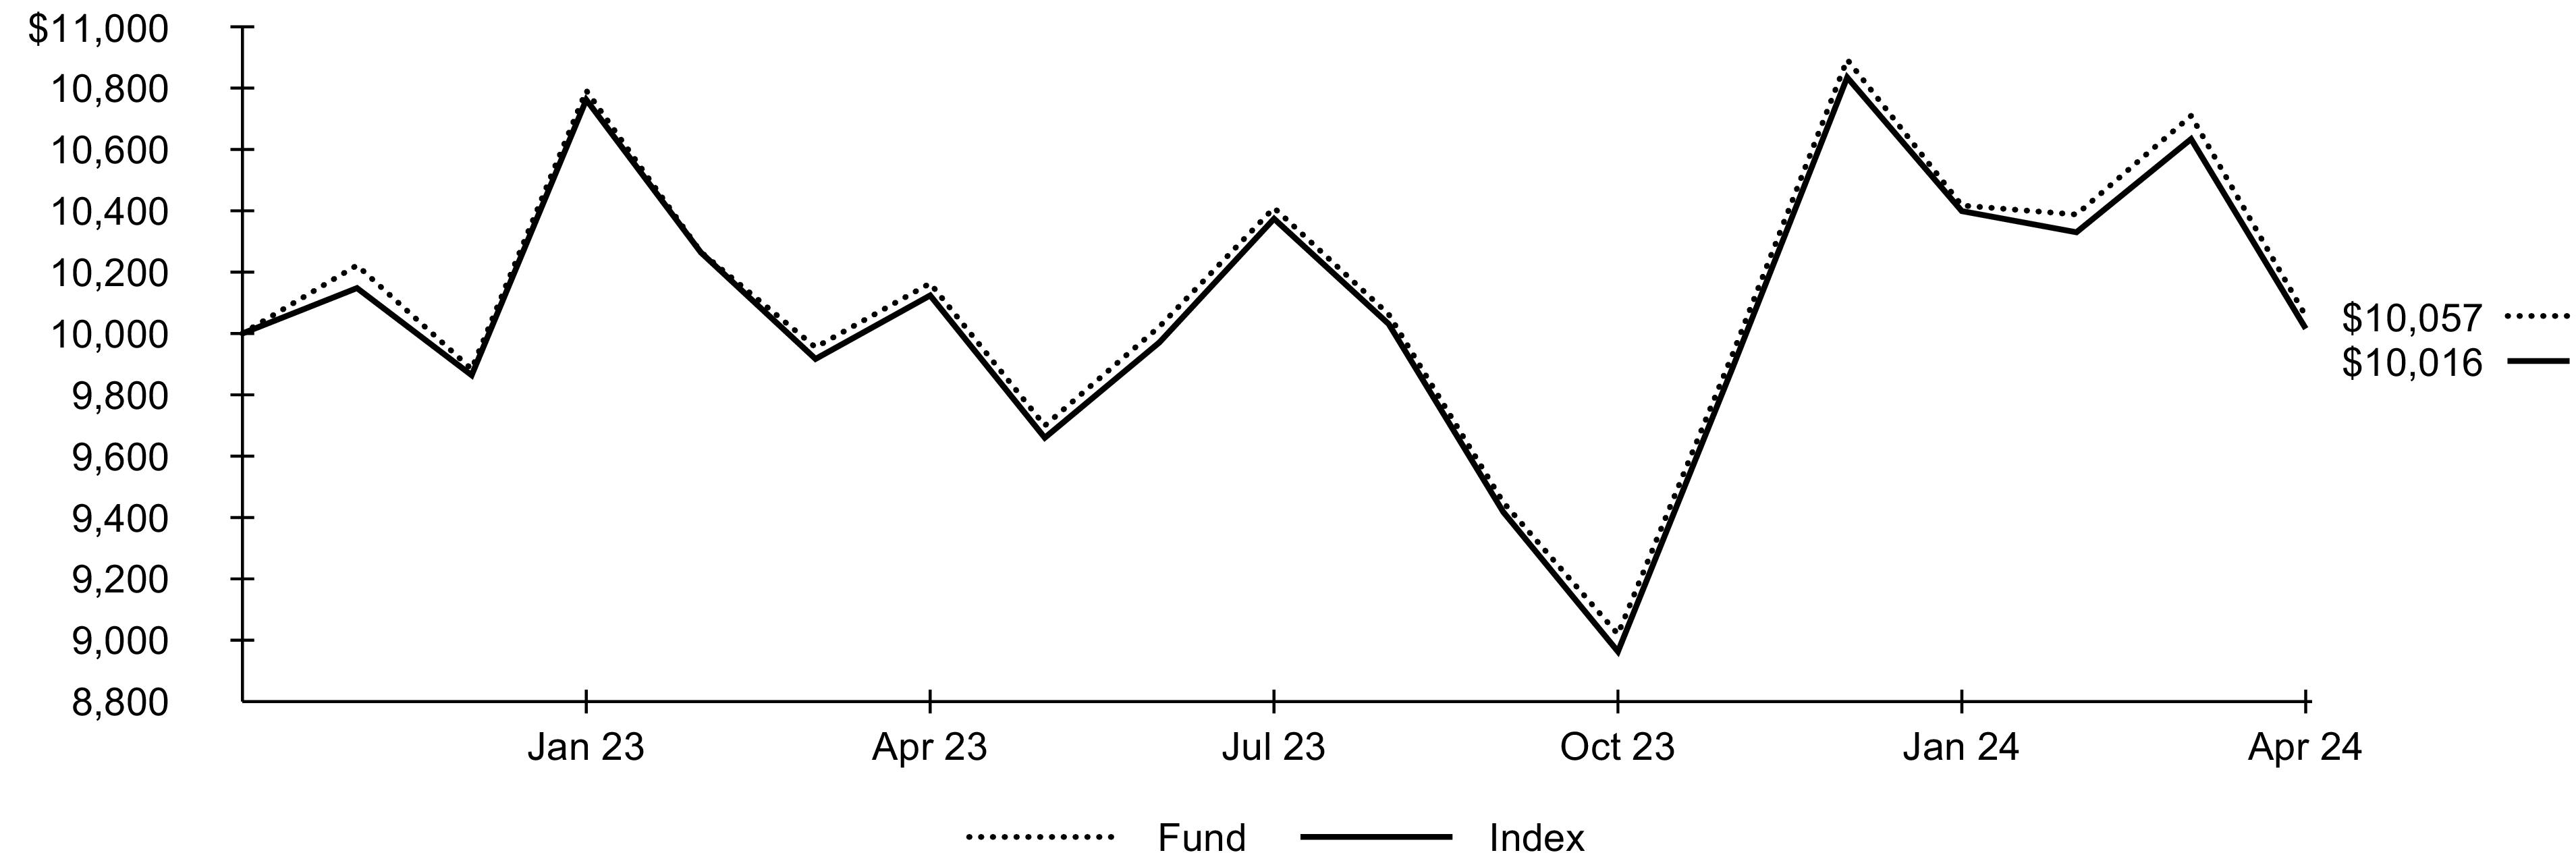
Average Annual Total Returns | Cumulative Total Returns | ||||
1 Year | Since Inception | 1 Year | Since Inception | ||
Fund NAV | (1.05 )% | 0.39 % | (1.05 )% | 0.57 % | |
Fund Market | (1.21 ) | 0.52 | (1.21 ) | 0.76 | |
Index | (1.07 ) | 0.11 | (1.07 ) | 0.16 | |
(SINCE INCEPTION AT NET ASSET VALUE)
Actual | Hypothetical 5% Return | |||||
Beginning Account Value (11/01/23) | Ending Account Value (04/30/24) | Expenses Paid During the Period(a) | Beginning Account Value (11/01/23) | Ending Account Value (04/30/24) | Expenses Paid During the Period(a) | Annualized Expense Ratio |
$1,000.00 | $1,115.00 | $1.58 | $1,000.00 | $1,023.40 | $1.51 | 0.30% |
(a) | Expenses are equal to the annualized expense ratio, multiplied by the average account value over the period, multiplied by 182/366 (to reflect the one-half year period shown). Other fees, such as brokerage commissions and other fees to financial intermediaries, may be paid which are not reflected in the tables and examples above. See “Disclosure of Expenses” for more information. |
Industry | Percent of Total Investments(a) |
Retail REITs | 15.8 % |
Industrial REITs | 14.5 |
Multi-Family Residential REITs | 12.1 |
Office REITs | 9.5 |
Data Center REITs | 8.7 |
Diversified REITs | 7.7 |
Real Estate Operating Companies | 7.5 |
Health Care REITs | 5.9 |
Diversified Real Estate Activities | 5.6 |
Self Storage REITs | 4.3 |
Single-Family Residential REITs | 3.1 |
Hotel & Resort REITs | 2.3 |
Other Specialized REITs | 2.0 |
Other (each representing less than 1%) | 1.0 |
Country/Geographic Region | Percent of Total Investments(a) |
United States | 61.0 % |
Japan | 9.7 |
Australia | 5.0 |
Singapore | 4.9 |
Hong Kong | 4.4 |
United Kingdom | 3.6 |
Germany | 2.3 |
Canada | 2.0 |
Sweden | 1.8 |
France | 1.7 |
(a) | Excludes money market funds. |
Average Annual Total Returns | Cumulative Total Returns | ||||||
1 Year | 5 Years | Since Inception | 1 Year | 5 Years | Since Inception | ||
Fund NAV | (1.50 )% | (0.14 )% | 2.74 % | (1.50 )% | (0.69 )% | 30.39 % | |
Fund Market | (1.74 ) | (0.15 ) | 2.73 | (1.74 ) | (0.72 ) | 30.23 | |
Index | (1.99 ) | (0.85 ) | 1.98 | (1.99 ) | (4.16 ) | 21.21 | |
(SINCE INCEPTION AT NET ASSET VALUE)
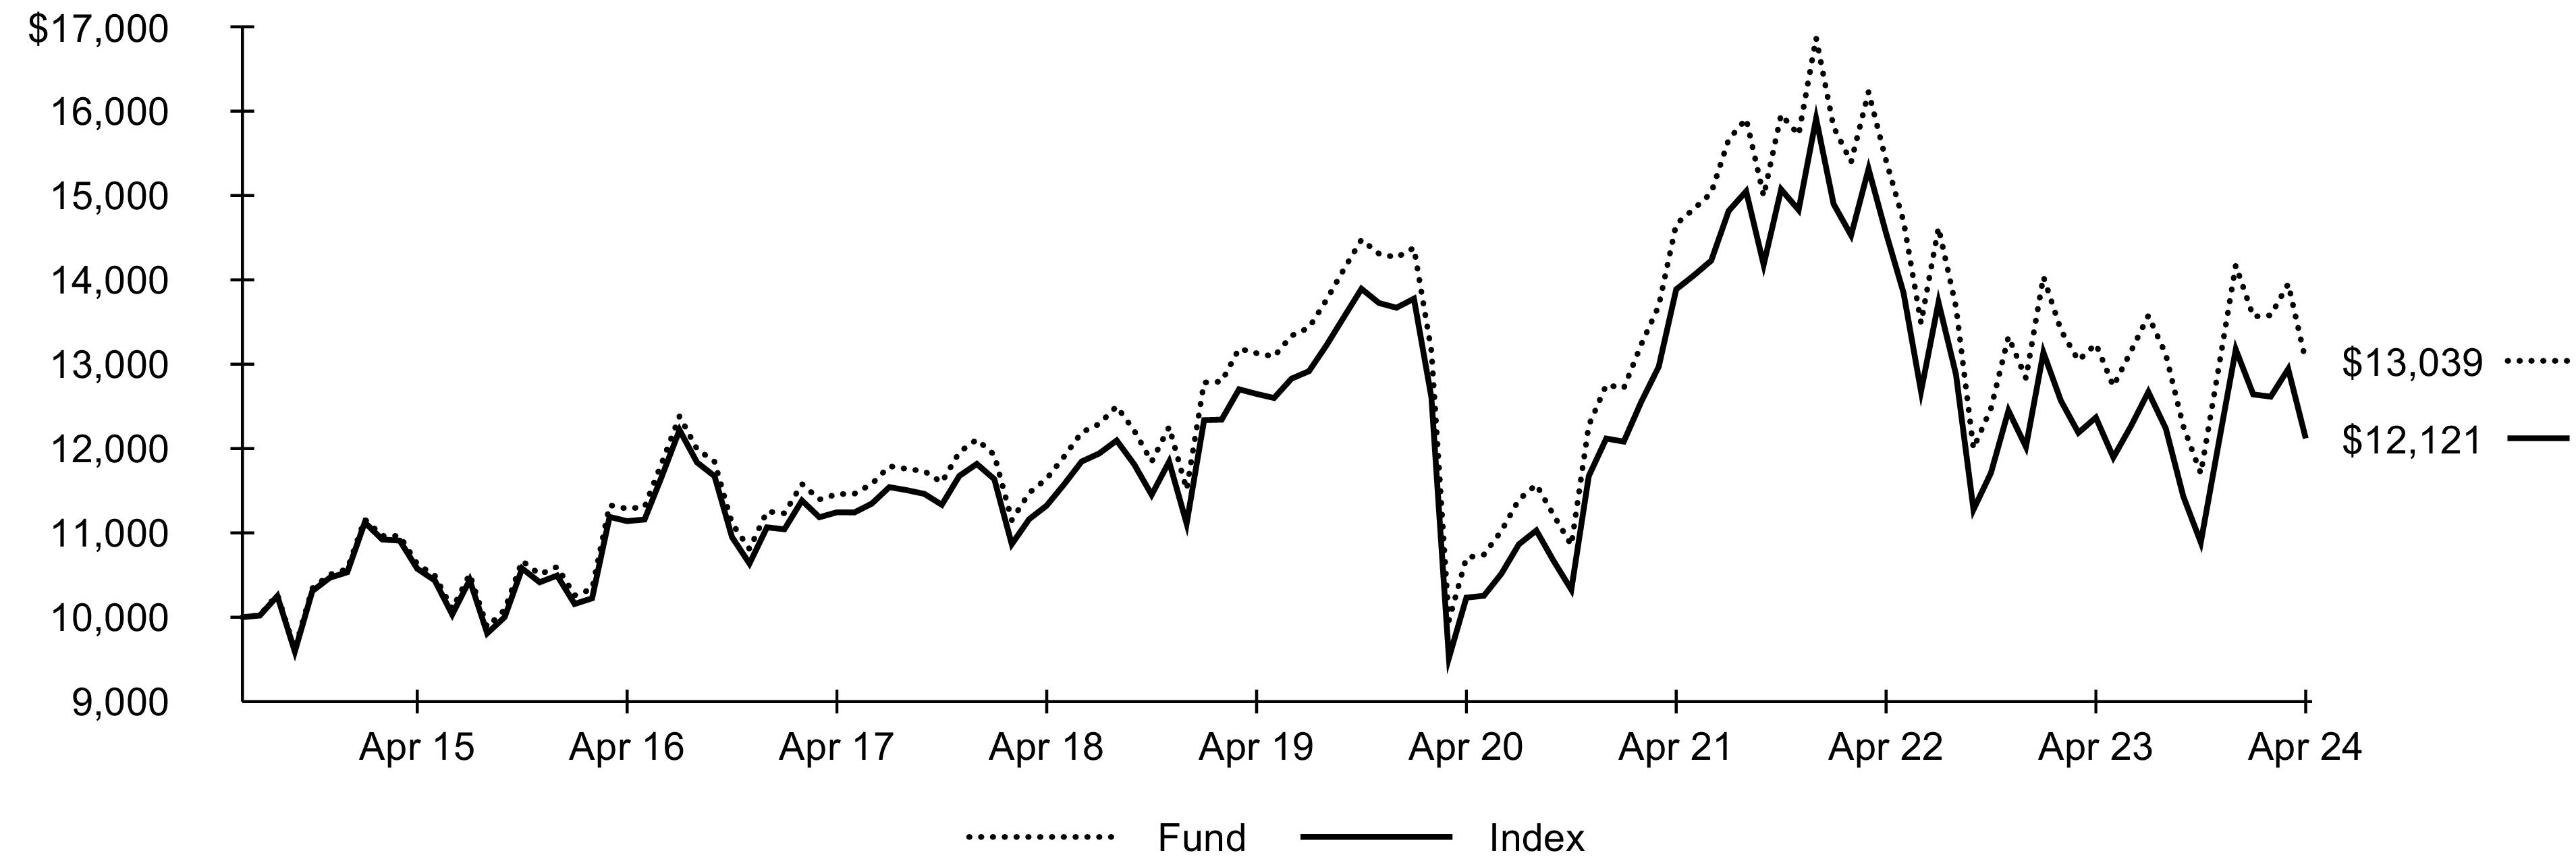
Actual | Hypothetical 5% Return | |||||
Beginning Account Value (11/01/23) | Ending Account Value (04/30/24) | Expenses Paid During the Period(a) | Beginning Account Value (11/01/23) | Ending Account Value (04/30/24) | Expenses Paid During the Period(a) | Annualized Expense Ratio |
$1,000.00 | $1,114.10 | $0.74 | $1,000.00 | $1,024.20 | $0.70 | 0.14% |
(a) | Expenses are equal to the annualized expense ratio, multiplied by the average account value over the period, multiplied by 182/366 (to reflect the one-half year period shown). Other fees, such as brokerage commissions and other fees to financial intermediaries, may be paid which are not reflected in the tables and examples above. See “Disclosure of Expenses” for more information. |
Industry | Percent of Total Investments(a) |
Retail REITs | 19.4 % |
Industrial REITs | 18.6 |
Multi-Family Residential REITs | 10.7 |
Health Care REITs | 9.1 |
Diversified REITs | 8.3 |
Data Center REITs | 8.2 |
Office REITs | 7.9 |
Self Storage REITs | 6.5 |
Single-Family Residential REITs | 4.3 |
Other Specialized REITs | 3.5 |
Hotel & Resort REITs | 3.4 |
Other (each representing less than 1%) | 0.1 |
Country/Geographic Region | Percent of Total Investments(a) |
United States | 69.9 % |
Australia | 6.6 |
Japan | 6.5 |
United Kingdom | 4.7 |
Singapore | 3.0 |
Canada | 2.3 |
France | 1.9 |
Belgium | 1.1 |
Hong Kong | 0.9 |
Mexico | 0.8 |
(a) | Excludes money market funds. |
Average Annual Total Returns | Cumulative Total Returns | ||||||
1 Year | 5 Years | 10 Years | 1 Year | 5 Years | 10 Years | ||
Fund NAV | (2.77 )% | (3.83 )% | (0.01 )% | (2.77 )% | (17.75 )% | (0.12 )% | |
Fund Market | (3.42 ) | (3.95 ) | (0.10 ) | (3.42 ) | (18.25 ) | (0.99 ) | |
Index | (2.01 ) | (3.65 ) | 0.20 | (2.01 ) | (16.99 ) | 2.04 | |
(AT NET ASSET VALUE)
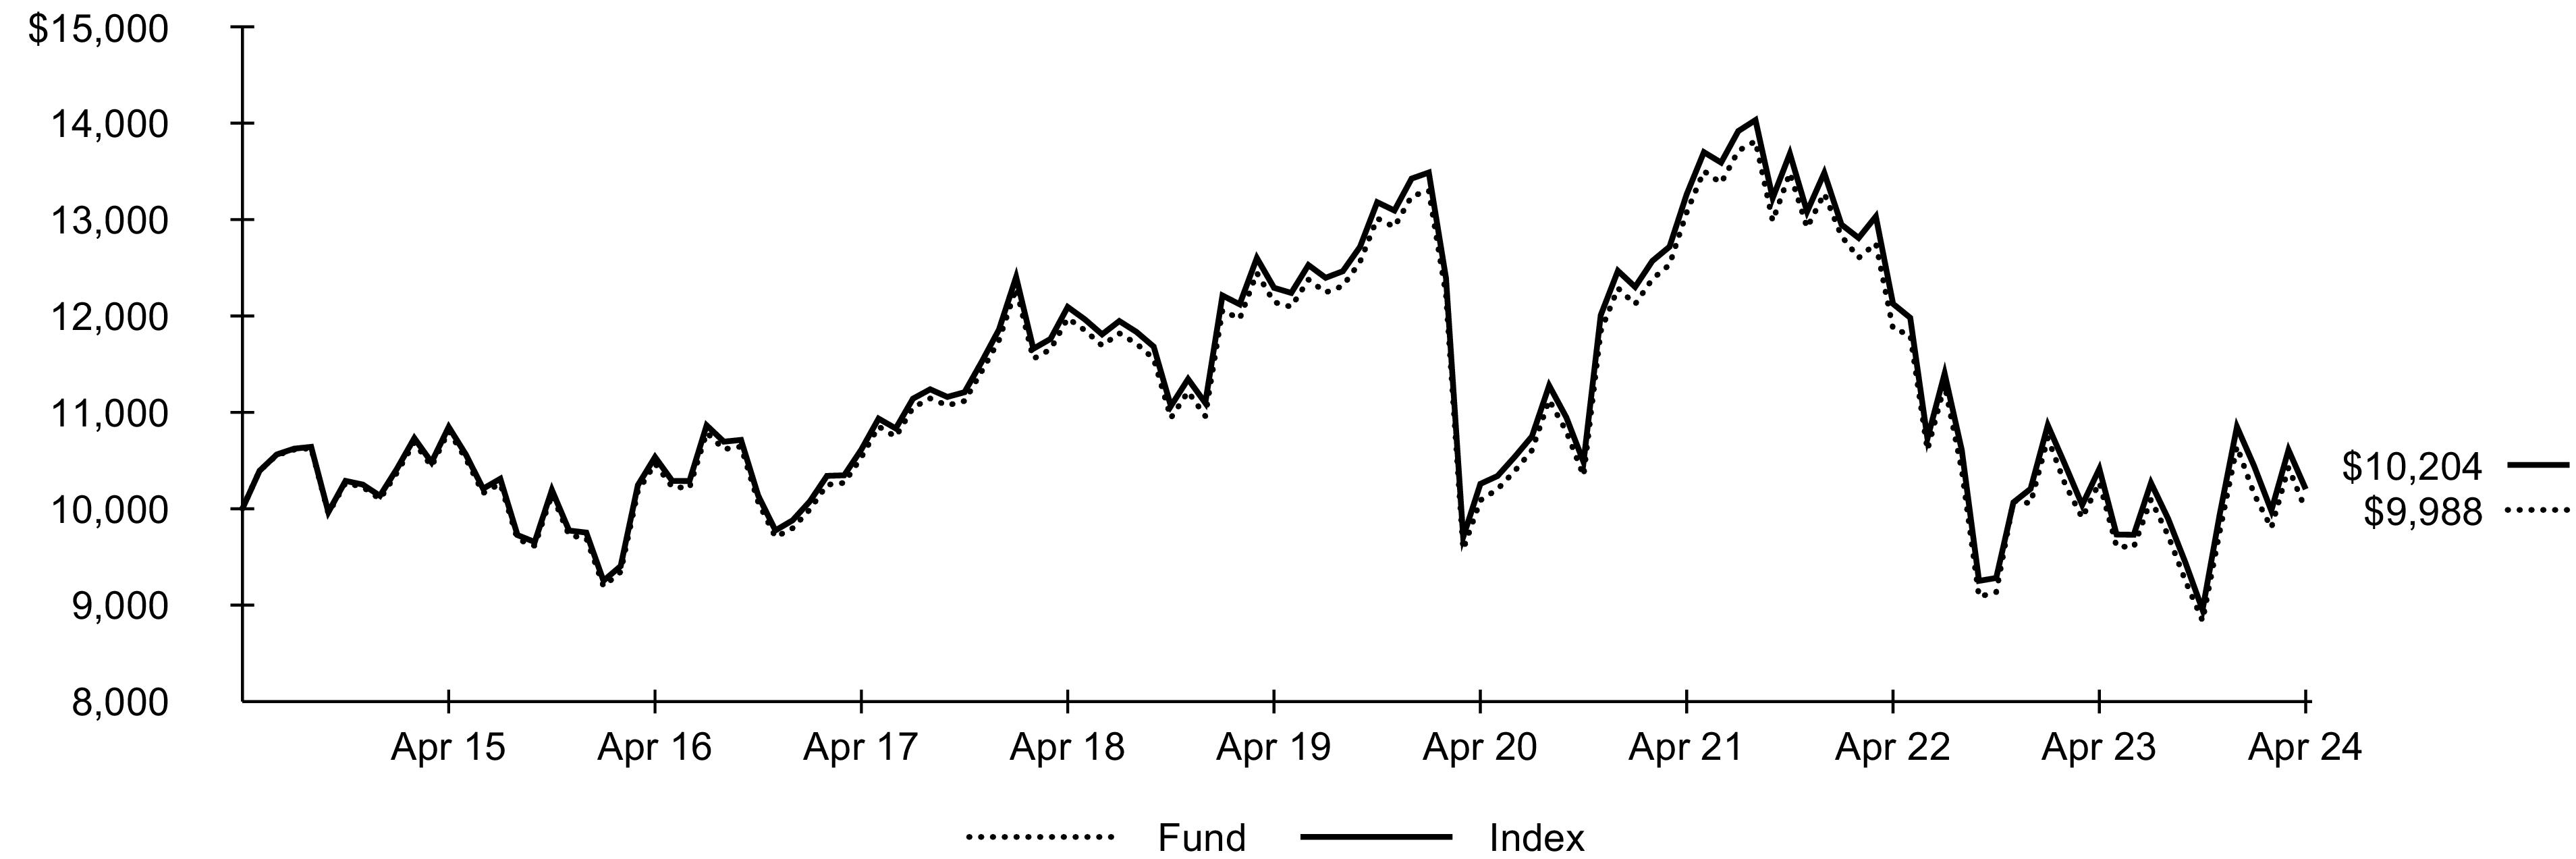
Actual | Hypothetical 5% Return | |||||
Beginning Account Value (11/01/23) | Ending Account Value (04/30/24) | Expenses Paid During the Period(a) | Beginning Account Value (11/01/23) | Ending Account Value (04/30/24) | Expenses Paid During the Period(a) | Annualized Expense Ratio |
$1,000.00 | $1,130.20 | $3.18 | $1,000.00 | $1,021.90 | $3.02 | 0.60% |
(a) | Expenses are equal to the annualized expense ratio, multiplied by the average account value over the period, multiplied by 182/366 (to reflect the one-half year period shown). Other fees, such as brokerage commissions and other fees to financial intermediaries, may be paid which are not reflected in the tables and examples above. See “Disclosure of Expenses” for more information. |
Industry | Percent of Total Investments(a) |
Real Estate Operating Companies | 19.3 % |
Industrial REITs | 17.7 |
Retail REITs | 15.4 |
Diversified Real Estate Activities | 14.8 |
Diversified REITs | 12.7 |
Office REITs | 7.5 |
Multi-Family Residential REITs | 4.4 |
Real Estate Development | 2.1 |
Health Care REITs | 2.1 |
Hotel & Resort REITs | 1.6 |
Self Storage REITs | 1.3 |
Other (each representing less than 1%) | 1.1 |
Country/Geographic Region | Percent of Total Investments(a) |
Japan | 26.8 % |
Australia | 15.1 |
United Kingdom | 11.0 |
Hong Kong | 8.4 |
Singapore | 8.1 |
Canada | 6.2 |
Germany | 5.4 |
Sweden | 5.0 |
France | 4.3 |
Switzerland | 3.0 |
(a) | Excludes money market funds. |
Security | Shares | Value |
Common Stocks | ||
Data Center REITs — 8.7% | ||
Digital Core REIT Management Pte Ltd. | 2,100 | $1,281 |
Digital Realty Trust Inc. | 2,220 | 308,092 |
Equinix Inc. | 610 | 433,777 |
Keppel DC REIT | 5,400 | 6,735 |
749,885 | ||
Diversified Real Estate Activities — 5.6% | ||
Allreal Holding AG, Registered | 51 | 8,237 |
City Developments Ltd. | 2,700 | 12,101 |
Heiwa Real Estate Co. Ltd. | 200 | 5,529 |
Mitsubishi Estate Co. Ltd. | 5,900 | 108,116 |
Mitsui Fudosan Co. Ltd. | 11,900 | 121,107 |
New World Development Co. Ltd. | 19,000 | 20,177 |
Nomura Real Estate Holdings Inc. | 600 | 16,798 |
Sumitomo Realty & Development Co. Ltd. | 1,700 | 58,827 |
Sun Hung Kai Properties Ltd. | 11,500 | 106,087 |
Tokyo Tatemono Co. Ltd. | 600 | 9,984 |
UOL Group Ltd. | 3,900 | 16,652 |
483,615 | ||
Diversified REITs — 7.7% | ||
Abrdn Property Income Trust Ltd. | 1,956 | 1,225 |
Activia Properties Inc. | 7 | 17,374 |
AEW U.K. REIT PLC | 813 | 855 |
Alexander & Baldwin Inc. | 333 | 5,484 |
American Assets Trust Inc. | 420 | 8,967 |
Argosy Property Ltd. | 4,323 | 2,858 |
Armada Hoffler Properties Inc. | 582 | 6,123 |
Balanced Commercial Property Trust Ltd. | 2,946 | 2,864 |
British Land Co. PLC (The) | 7,941 | 38,293 |
Broadstone Net Lease Inc. | 1,236 | 17,996 |
Charter Hall Long Wale REIT | 3,016 | 6,524 |
Covivio SA/France | 264 | 13,141 |
Cromwell European Real Estate Investment Trust | 1,800 | 2,859 |
Custodian Property Income REIT PLC | 2,010 | 1,850 |
Daiwa House REIT Investment Corp. | 12 | 20,157 |
Empire State Realty Trust Inc., Class A | 1,965 | 17,881 |
Essential Properties Realty Trust Inc. | 926 | 24,391 |
Global Net Lease Inc. | 1,359 | 9,445 |
GPT Group (The) | 15,132 | 40,696 |
Growthpoint Properties Australia Ltd. | 2,055 | 3,145 |
H&R Real Estate Investment Trust | 1,257 | 8,218 |
Hankyu Hanshin REIT Inc. | 3 | 2,685 |
Heiwa Real Estate REIT Inc. | 5 | 4,483 |
Hulic REIT Inc. | 3 | 2,867 |
ICADE | 144 | 3,829 |
KDX Realty Investment Corp. | 15 | 14,795 |
Land Securities Group PLC | 3,612 | 29,192 |
LondonMetric Property PLC | 9,441 | 23,045 |
Merlin Properties SOCIMI SA | 3,687 | 41,476 |
Mirvac Group | 41,358 | 54,190 |
Mori Trust REIT Inc. | 6 | 2,784 |
NIPPON REIT Investment Corp. | 3 | 6,776 |
Nomura Real Estate Master Fund Inc. | 21 | 20,074 |
NTT UD REIT Investment Corp. | 9 | 6,900 |
OUE REIT | 29,100 | 5,734 |
Picton Property Income Ltd. | 2,436 | 2,008 |
Schroder REIT Ltd. | 3,483 | 1,932 |
Sekisui House REIT Inc. | 54 | 27,670 |
SK REITs Co. Ltd. | 615 | 1,840 |
Star Asia Investment Corp. | 9 | 3,511 |
Stockland | 15,333 | 43,440 |
Security | Shares | Value |
Diversified REITs (continued) | ||
Stride Property Group | 2,178 | $1,604 |
Sunlight REIT | 9,000 | 1,933 |
Suntec REIT | 20,400 | 16,083 |
Takara Leben Real Estate Investment Corp. | 3 | 1,944 |
Tokyu REIT Inc. | 6 | 6,174 |
UK Commercial Property REIT Ltd. | 2,670 | 2,241 |
United Urban Investment Corp. | 9 | 8,624 |
WP Carey Inc. | 1,362 | 74,692 |
662,872 | ||
Health Care Facilities — 0.2% | ||
Chartwell Retirement Residences | 1,506 | 13,664 |
Health Care REITs — 5.9% | ||
Aedifica SA | 273 | 17,444 |
Assura PLC | 6,840 | 3,502 |
CareTrust REIT Inc. | 336 | 8,306 |
Cofinimmo SA | 129 | 8,545 |
Community Healthcare Trust Inc. | 52 | 1,380 |
Healthcare Realty Trust Inc., Class A | 801 | 11,398 |
Healthpeak Properties Inc. | 2,266 | 42,170 |
Life Science Reit PLC | 1,271 | 627 |
LTC Properties Inc. | 93 | 3,078 |
Medical Properties Trust Inc.(a) | 1,407 | 6,472 |
National Health Investors Inc. | 273 | 17,216 |
NorthWest Healthcare Properties REIT | 339 | 1,244 |
Omega Healthcare Investors Inc. | 564 | 17,151 |
Parkway Life REIT | 1,500 | 3,938 |
Primary Health Properties PLC | 2,409 | 2,757 |
Sabra Health Care REIT Inc. | 615 | 8,561 |
Target Healthcare REIT PLC | 1,497 | 1,450 |
Ventas Inc. | 3,332 | 147,541 |
Welltower Inc. | 2,160 | 205,805 |
508,585 | ||
Hotel & Resort REITs — 2.3% | ||
Apple Hospitality REIT Inc. | 825 | 12,177 |
CapitaLand Ascott Trust | 6,680 | 4,437 |
CDL Hospitality Trusts | 2,100 | 1,494 |
DiamondRock Hospitality Co. | 1,023 | 9,105 |
Far East Hospitality Trust | 2,700 | 1,216 |
Host Hotels & Resorts Inc. | 3,813 | 71,951 |
Hotel Property Investments Ltd. | 2,010 | 4,208 |
Invincible Investment Corp. | 9 | 4,032 |
Japan Hotel REIT Investment Corp. | 6 | 3,153 |
Park Hotels & Resorts Inc. | 843 | 13,598 |
Pebblebrook Hotel Trust | 558 | 8,108 |
RLJ Lodging Trust | 657 | 7,227 |
Ryman Hospitality Properties Inc. | 261 | 27,530 |
Service Properties Trust | 687 | 4,211 |
Summit Hotel Properties Inc. | 465 | 2,795 |
Sunstone Hotel Investors Inc. | 1,281 | 13,066 |
Xenia Hotels & Resorts Inc. | 779 | 10,805 |
199,113 | ||
Industrial REITs — 14.5% | ||
Advance Logistics Investment Corp. | 3 | 2,315 |
AIMS APAC REIT | 5,247 | 4,839 |
Americold Realty Trust Inc. | 1,380 | 30,319 |
ARGAN SA, NVS | 48 | 3,773 |
CapitaLand Ascendas REIT | 30,600 | 57,963 |
Centuria Industrial REIT | 2,766 | 5,648 |
CRE Logistics REIT Inc. | 3 | 2,871 |
Dream Industrial REIT | 738 | 6,653 |
Security | Shares | Value |
Industrial REITs (continued) | ||
EastGroup Properties Inc. | 365 | $56,706 |
ESR Kendall Square REIT Co. Ltd. | 1,278 | 4,245 |
ESR-LOGOS REIT | 43,200 | 9,178 |
First Industrial Realty Trust Inc. | 638 | 28,978 |
Frasers Logistics & Commercial Trust | 36,600 | 26,512 |
GLP J-REIT | 33 | 26,839 |
Goodman Property Trust | 4,731 | 6,356 |
Granite REIT | 267 | 13,198 |
Industrial & Infrastructure Fund Investment Corp. | 10 | 8,269 |
Innovative Industrial Properties Inc. | 93 | 9,616 |
Japan Logistics Fund Inc. | 3 | 5,349 |
LaSalle Logiport REIT | 27 | 27,080 |
LXP Industrial Trust. | 1,785 | 14,905 |
Mapletree Industrial Trust | 17,400 | 28,812 |
Mapletree Logistics Trust | 18,900 | 18,547 |
Mitsubishi Estate Logistics REIT Investment Corp. | 3 | 7,689 |
Mitsui Fudosan Logistics Park Inc. | 6 | 17,213 |
Montea NV | 147 | 12,603 |
Nippon Prologis REIT Inc. | 33 | 57,038 |
Prologis Inc. | 5,630 | 574,542 |
Rexford Industrial Realty Inc. | 855 | 36,603 |
Segro PLC | 4,341 | 45,659 |
SOSiLA Logistics REIT Inc. | 9 | 7,086 |
STAG Industrial Inc. | 663 | 22,801 |
Terreno Realty Corp. | 342 | 18,588 |
Tritax Big Box REIT PLC | 12,387 | 23,397 |
Urban Logistics REIT PLC | 2,208 | 3,195 |
Warehouse REIT PLC | 1,527 | 1,521 |
Warehouses De Pauw CVA | 849 | 22,451 |
1,249,357 | ||
Multi-Family Residential REITs — 12.0% | ||
Advance Residence Investment Corp. | 6 | 12,972 |
Apartment Income REIT Corp. | 1,158 | 44,444 |
Apartment Investment & Management Co., Class A(b) | 804 | 6,432 |
AvalonBay Communities Inc. | 1,218 | 230,896 |
Boardwalk REIT | 126 | 6,487 |
Camden Property Trust | 705 | 70,274 |
Canadian Apartment Properties REIT | 621 | 19,330 |
Centerspace | 102 | 6,860 |
Comforia Residential REIT Inc. | 3 | 6,494 |
Daiwa Securities Living Investments Corp. | 15 | 10,185 |
Elme Communities | 765 | 11,597 |
Empiric Student Property PLC | 2,502 | 2,812 |
Equity Residential | 3,243 | 208,849 |
Essex Property Trust Inc. | 460 | 113,275 |
Independence Realty Trust Inc. | 1,044 | 16,464 |
Ingenia Communities Group | 3,000 | 8,892 |
InterRent REIT | 627 | 5,456 |
Irish Residential Properties REIT PLC | 2,940 | 3,109 |
Killam Apartment REIT | 420 | 5,245 |
Mid-America Apartment Communities Inc. | 791 | 102,830 |
NexPoint Residential Trust Inc. | 162 | 5,547 |
Nippon Accommodations Fund Inc. | 2 | 8,329 |
Samty Residential Investment Corp. | 3 | 2,064 |
Triple Point Social Housing REIT PLC(c) | 291 | 219 |
UDR Inc. | 2,452 | 93,372 |
UNITE Group PLC (The) | 2,154 | 24,901 |
Veris Residential Inc. | 624 | 8,992 |
Xior Student Housing NV | 100 | 2,975 |
1,039,302 | ||
Security | Shares | Value |
Office REITs — 9.5% | ||
Abacus Group | 2,679 | $1,996 |
Alexandria Real Estate Equities Inc. | 1,047 | 121,316 |
Allied Properties REIT | 513 | 6,309 |
Boston Properties Inc. | 1,749 | 108,246 |
Brandywine Realty Trust | 1,653 | 7,505 |
Centuria Office REIT | 1,449 | 1,105 |
Champion REIT | 27,000 | 6,015 |
COPT Defense Properties | 819 | 19,631 |
Cousins Properties Inc. | 2,481 | 56,914 |
Cromwell Property Group | 8,058 | 2,093 |
Daiwa Office Investment Corp. | 2 | 7,292 |
Derwent London PLC | 593 | 15,235 |
Dexus | 6,414 | 29,134 |
Douglas Emmett Inc. | 909 | 12,462 |
Easterly Government Properties Inc., Class A | 711 | 8,311 |
Gecina SA | 252 | 25,730 |
Global One Real Estate Investment Corp. | 9 | 6,124 |
Great Portland Estates PLC | 1,290 | 6,319 |
Helical PLC | 468 | 1,193 |
Highwoods Properties Inc. | 989 | 25,912 |
Hudson Pacific Properties Inc. | 2,016 | 11,693 |
Ichigo Office REIT Investment Corp. | 12 | 6,153 |
Inmobiliaria Colonial SOCIMI SA | 2,172 | 12,703 |
Japan Excellent Inc. | 11 | 8,986 |
Japan Prime Realty Investment Corp. | 3 | 6,492 |
Japan Real Estate Investment Corp. | 5 | 16,956 |
JBG SMITH Properties | 2,310 | 34,673 |
JR Global REIT | 955 | 2,780 |
Keppel REIT | 30,300 | 19,455 |
Kilroy Realty Corp. | 1,500 | 50,700 |
Mirai Corp. | 12 | 3,436 |
Mori Hills REIT Investment Corp. | 15 | 13,053 |
Nippon Building Fund Inc. | 6 | 22,925 |
NSI NV | 87 | 1,651 |
Orix JREIT Inc. | 21 | 22,136 |
Paramount Group Inc. | 3,091 | 14,342 |
Piedmont Office Realty Trust Inc., Class A | 1,728 | 11,906 |
Precinct Properties Group | 7,476 | 5,154 |
Prosperity REIT | 21,000 | 3,340 |
Sankei Real Estate Inc. | 3 | 1,737 |
SL Green Realty Corp. | 642 | 31,991 |
Vornado Realty Trust | 1,693 | 44,069 |
Workspace Group PLC | 357 | 2,207 |
817,380 | ||
Other Specialized REITs — 2.0% | ||
Arena REIT | 1,626 | 3,836 |
EPR Properties | 237 | 9,620 |
Four Corners Property Trust Inc. | 663 | 15,547 |
Gaming and Leisure Properties Inc. | 957 | 40,893 |
Safehold Inc. | 333 | 6,074 |
VICI Properties Inc., Class A | 3,354 | 95,757 |
171,727 | ||
Real Estate Development — 0.7% | ||
CK Asset Holdings Ltd. | 11,000 | 46,921 |
Lifestyle Communities Ltd. | 465 | 3,548 |
Sino Land Co. Ltd. | 14,000 | 14,969 |
65,438 | ||
Real Estate Operating Companies — 7.4% | ||
Abrdn European Logistics Income PLC(c) | 5,304 | 3,924 |
Aeon Mall Co. Ltd. | 300 | 3,430 |
Amot Investments Ltd. | 1,170 | 4,907 |
Security | Shares | Value |
Real Estate Operating Companies (continued) | ||
Aroundtown SA(b) | 4,506 | $9,341 |
Atrium Ljungberg AB, Class B | 504 | 8,936 |
Azrieli Group Ltd. | 306 | 19,688 |
CA Immobilien Anlagen AG | 285 | 9,270 |
CapitaLand Investment Ltd/Singapore | 17,400 | 33,649 |
Castellum AB(b) | 2,447 | 29,075 |
Catena AB | 159 | 6,959 |
Cibus Nordic Real Estate AB | 126 | 1,641 |
Citycon OYJ | 318 | 1,301 |
Corem Property Group AB, Class B | 2,706 | 2,010 |
Deutsche EuroShop AG | 282 | 5,701 |
Deutsche Wohnen SE | 276 | 5,207 |
Dios Fastigheter AB | 510 | 3,897 |
Entra ASA(b)(c) | 393 | 3,630 |
Fabege AB | 1,563 | 11,954 |
Fastighets AB Balder, Class B(b) | 2,775 | 17,492 |
Grainger PLC | 2,232 | 7,154 |
Grand City Properties SA(b) | 492 | 5,494 |
Hongkong Land Holdings Ltd. | 7,500 | 23,964 |
Hufvudstaden AB, Class A | 1,260 | 14,635 |
Hulic Co. Ltd. | 1,500 | 13,822 |
Hysan Development Co. Ltd. | 5,000 | 7,793 |
Intershop Holding AG | 20 | 2,680 |
Kennedy-Wilson Holdings Inc. | 1,164 | 9,999 |
Kojamo OYJ(b) | 912 | 10,075 |
LEG Immobilien SE(b) | 439 | 37,266 |
Melisron Ltd. | 126 | 8,644 |
Mobimo Holding AG, Registered | 27 | 7,558 |
NP3 Fastigheter AB | 99 | 2,084 |
Nyfosa AB | 705 | 6,099 |
Pandox AB, Class B | 237 | 3,665 |
Platzer Fastigheter Holding AB, Class B | 249 | 2,013 |
PSP Swiss Property AG, Registered | 144 | 17,801 |
Sagax AB, Class B | 732 | 18,331 |
Samhallsbyggnadsbolaget i Norden AB(a) | 5,264 | 1,888 |
Sirius Real Estate Ltd. | 5,184 | 6,305 |
StorageVault Canada Inc., NVS | 489 | 1,680 |
Swire Properties Ltd. | 11,400 | 23,577 |
Swiss Prime Site AG, Registered | 333 | 30,747 |
TAG Immobilien AG(b) | 1,038 | 14,758 |
Tricon Residential Inc. | 609 | 6,821 |
VGP NV | 54 | 5,875 |
Vonovia SE | 3,934 | 113,677 |
Wallenstam AB, Class B | 1,788 | 7,904 |
Wharf Real Estate Investment Co. Ltd. | 12,000 | 37,230 |
Wihlborgs Fastigheter AB | 1,326 | 11,106 |
642,657 | ||
Retail REITs — 15.7% | ||
Acadia Realty Trust | 346 | 5,979 |
AEON REIT Investment Corp. | 11 | 9,620 |
Agree Realty Corp. | 411 | 23,517 |
Ascencio | 36 | 1,861 |
Brixmor Property Group Inc. | 961 | 21,238 |
BWP Trust | 3,420 | 7,826 |
Capital & Counties Properties PLC | 5,478 | 9,170 |
CapitaLand Integrated Commercial Trust | 54,900 | 78,260 |
Carmila SA | 420 | 7,056 |
Charter Hall Retail REIT | 3,018 | 6,440 |
Choice Properties REIT | 1,200 | 11,349 |
Crombie REIT | 339 | 3,164 |
Eurocommercial Properties NV | 558 | 12,691 |
Federal Realty Investment Trust | 436 | 45,418 |
Security | Shares | Value |
Retail REITs (continued) | ||
First Capital Real Estate Investment Trust | 1,284 | $13,785 |
Fortune REIT | 6,000 | 2,948 |
Frasers Centrepoint Trust | 15,000 | 23,761 |
Frontier Real Estate Investment Corp. | 1 | 2,907 |
Fukuoka REIT Corp. | 3 | 3,222 |
Getty Realty Corp. | 297 | 8,049 |
Hamborner REIT AG | 459 | 3,132 |
Hammerson PLC | 39,935 | 13,593 |
HomeCo Daily Needs REIT | 10,361 | 8,123 |
InvenTrust Properties Corp. | 219 | 5,549 |
Japan Metropolitan Fund Invest | 12 | 7,245 |
Kimco Realty Corp. | 2,636 | 49,109 |
Kite Realty Group Trust | 1,020 | 22,236 |
Kiwi Property Group Ltd. | 8,721 | 4,152 |
Klepierre SA | 1,494 | 40,117 |
Lar Espana Real Estate SOCIMI SA | 690 | 5,029 |
Lendlease Global Commercial REIT | 24,000 | 9,546 |
Link REIT | 20,100 | 86,124 |
LOTTE REIT Co. Ltd. | 426 | 977 |
Macerich Co. (The) | 768 | 10,568 |
Mapletree Pan Asia Commercial Trust | 31,800 | 29,141 |
Mercialys SA | 1,221 | 13,216 |
NETSTREIT Corp. | 384 | 6,470 |
NewRiver REIT PLC | 2,121 | 1,981 |
NNN REIT Inc. | 828 | 33,559 |
Paragon REIT | 8,400 | 5,200 |
Phillips Edison & Co. Inc. | 465 | 15,205 |
Prinmaris REIT | 459 | 4,401 |
Realty Income Corp. | 2,532 | 135,563 |
Regency Centers Corp. | 764 | 45,244 |
Region RE Ltd. | 8,112 | 11,372 |
Retail Estates NV | 60 | 4,188 |
Retail Opportunity Investments Corp. | 491 | 6,025 |
RioCan REIT | 1,905 | 24,133 |
Scentre Group | 37,166 | 75,263 |
Simon Property Group Inc. | 1,249 | 175,522 |
SITE Centers Corp. | 534 | 7,204 |
SmartCentres Real Estate Investment Trust | 1,002 | 16,217 |
Starhill Global REIT | 9,600 | 3,341 |
Supermarket Income REIT PLC | 6,591 | 5,954 |
Tanger Inc. | 580 | 16,443 |
Unibail-Rodamco-Westfield, New(b) | 477 | 39,750 |
Urban Edge Properties | 450 | 7,528 |
Vastned Retail NV | 81 | 1,811 |
Vicinity Ltd. | 80,429 | 98,491 |
Waypoint REIT Ltd | 4,119 | 6,181 |
Wereldhave NV | 282 | 3,915 |
1,357,079 | ||
Self Storage REITs — 4.2% | ||
Abacus Storage King | 2,511 | 1,831 |
Big Yellow Group PLC | 657 | 8,838 |
CubeSmart | 924 | 37,367 |
Extra Space Storage Inc. | 875 | 117,495 |
National Storage Affiliates Trust | 330 | 11,563 |
National Storage REIT | 4,341 | 5,986 |
Public Storage | 659 | 170,978 |
Safestore Holdings PLC | 784 | 7,556 |
Shurgard Self Storage Ltd. | 93 | 3,811 |
365,425 | ||
Single-Family Residential REITs — 3.1% | ||
American Homes 4 Rent, Class A | 1,398 | 50,048 |
Security | Shares | Value |
Single-Family Residential REITs (continued) | ||
Equity LifeStyle Properties Inc. | 1,027 | $61,918 |
Invitation Homes Inc. | 2,459 | 84,098 |
PRS REIT PLC (The) | 5,601 | 5,520 |
Sun Communities Inc. | 579 | 64,454 |
Tritax EuroBox PLC(c) | 5,163 | 3,581 |
269,619 | ||
Total Long-Term Investments — 99.5% (Cost: $8,949,714) | 8,595,718 | |
Short-Term Securities | ||
Money Market Funds — 0.2% | ||
BlackRock Cash Funds: Institutional, SL Agency Shares, 5.49%(d)(e)(f) | 8,209 | 8,212 |
BlackRock Cash Funds: Treasury, SL Agency Shares, 5.28%(d)(e) | 10,000 | 10,000 |
Total Short -Term Investments — 0.2% (Cost: $18,212) | 18,212 | |
Total Investments — 99.7% (Cost: $8,967,926) | 8,613,930 | |
Other Assets Less Liabilities — 0.3% | 27,435 | |
Net Assets — 100.0% | $8,641,365 | |
(a) | All or a portion of this security is on loan. |
(b) | Non-income producing security. |
(c) | Security exempt from registration pursuant to Rule 144A under the Securities Act of 1933, as amended. These securities may be resold in transactions exempt from registration to qualified institutional investors. |
(d) | Affiliate of the Fund. |
(e) | Annualized 7-day yield as of period end. |
(f) | All or a portion of this security was purchased with the cash collateral from loaned securities. |
Affiliated Issuer | Value at 04/30/23 | Purchases at Cost | Proceeds from Sales | Net Realized Gain (Loss) | Change in Unrealized Appreciation (Depreciation) | Value at 04/30/24 | Shares Held at 04/30/24 | Income | Capital Gain Distributions from Underlying Funds |
BlackRock Cash Funds: Institutional, SL Agency Shares | $66,735 | $— | $(58,516 )(a) | $(7 ) | $— | $8,212 | 8,209 | $596 (b) | $— |
BlackRock Cash Funds: Treasury, SL Agency Shares | — | 10,000 (a) | — | — | — | 10,000 | 10,000 | 447 | — |
$(7 ) | $— | $18,212 | $1,043 | $— |
(a) | Represents net amount purchased (sold). |
(b) | All or a portion represents securities lending income earned from the reinvestment of cash collateral from loaned securities, net of fees and collateral investment expenses, and other payments to and from borrowers of securities. |
Description | Number of Contracts | Expiration Date | Notional Amount (000) | Value/ Unrealized Appreciation (Depreciation) |
Long Contracts | ||||
Dow Jones U.S. Real Estate Index | 1 | 06/21/24 | $32 | $(3,038 ) |
Commodity Contracts | Credit Contracts | Equity Contracts | Foreign Currency Exchange Contracts | Interest Rate Contracts | Other Contracts | Total | |
Liabilities—Derivative Financial Instruments | |||||||
Futures contracts | |||||||
Unrealized depreciation on futures contracts(a) | $— | $— | $3,038 | $— | $— | $— | $3,038 |
(a) | Net cumulative unrealized appreciation (depreciation) on futures contracts are reported in the Schedule of Investments. In the Statements of Assets and Liabilities, only current day's variation margin is reported in receivables or payables and the net cumulative unrealized appreciation (depreciation) is included in accumulated earnings (loss). |
Commodity Contracts | Credit Contracts | Equity Contracts | Foreign Currency Exchange Contracts | Interest Rate Contracts | Other Contracts | Total | |
Net Realized Gain (Loss) from | |||||||
Futures contracts | $— | $— | $(1,456 ) | $— | $— | $— | $(1,456 ) |
Net Change in Unrealized Appreciation (Depreciation) on | |||||||
Futures contracts | $— | $— | $(3,889 ) | $— | $— | $— | $(3,889 ) |
Futures contracts: | |
Average notional value of contracts — long | $32,175 |
Level 1 | Level 2 | Level 3 | Total | |
Assets | ||||
Investments | ||||
Long-Term Investments | ||||
Common Stocks | $5,588,886 | $3,006,832 | $— | $8,595,718 |
Short-Term Securities | ||||
Money Market Funds | 18,212 | — | — | 18,212 |
$5,607,098 | $3,006,832 | $— | $8,613,930 | |
Derivative Financial Instruments(a) | ||||
Liabilities | ||||
Equity Contracts | $(3,038 ) | $— | $— | $(3,038 ) |
(a) | Derivative financial instruments are futures contracts. Futures contracts are valued at the unrealized appreciation (depreciation) on the instrument. |
Security | Shares | Value |
Common Stocks | ||
Australia — 6.6% | ||
Abacus Group | 1,287,496 | $959,481 |
Abacus Storage King | 1,287,496 | 938,969 |
Arena REIT | 870,726 | 2,054,397 |
BWP Trust | 1,196,350 | 2,737,711 |
Centuria Industrial REIT | 1,298,582 | 2,651,528 |
Centuria Office REIT | 1,192,592 | 909,577 |
Charter Hall Long Wale REIT | 1,638,426 | 3,543,902 |
Charter Hall Retail REIT | 1,218,574 | 2,600,138 |
Charter Hall Social Infrastructure REIT | 850,488 | 1,389,219 |
Cromwell Property Group | 3,671,406 | 953,675 |
Dexus | 2,675,023 | 12,150,518 |
Dexus Industria REIT | 540,421 | 1,016,117 |
Goodman Group | 4,585,231 | 92,619,958 |
GPT Group (The) | 4,760,780 | 12,803,799 |
Growthpoint Properties Australia Ltd. | 655,438 | 1,003,119 |
HealthCo REIT | 1,140,490 | 880,261 |
HomeCo Daily Needs REIT | 4,268,914 | 3,346,981 |
Hotel Property Investments Ltd. | 451,255 | 944,648 |
Mirvac Group | 9,792,926 | 12,831,361 |
National Storage REIT | 3,087,800 | 4,257,850 |
Region RE Ltd. | 2,867,267 | 4,019,487 |
Scentre Group | 12,862,434 | 26,047,069 |
Stockland | 5,929,390 | 16,798,652 |
Vicinity Ltd. | 9,371,616 | 11,476,190 |
Waypoint REIT Ltd | 1,649,108 | 2,474,521 |
221,409,128 | ||
Belgium — 1.1% | ||
Aedifica SA | 116,935 | 7,471,866 |
Ascencio | 13,012 | 672,630 |
Cofinimmo SA | 91,276 | 6,046,267 |
Home Invest Belgium SA, NVS | 24,762 | 436,031 |
Montea NV | 44,367 | 3,803,755 |
Retail Estates NV | 29,879 | 2,085,513 |
Shurgard Self Storage Ltd. | 76,089 | 3,118,216 |
Warehouses De Pauw CVA | 416,657 | 11,018,228 |
Xior Student Housing NV | 81,588 | 2,427,274 |
37,079,780 | ||
Canada — 2.3% | ||
Allied Properties REIT | 313,705 | 3,857,935 |
Boardwalk REIT | 99,616 | 5,128,236 |
Canadian Apartment Properties REIT | 414,342 | 12,896,927 |
Choice Properties REIT | 635,546 | 6,010,830 |
Crombie REIT | 260,268 | 2,429,408 |
Dream Industrial REIT | 625,232 | 5,636,240 |
First Capital Real Estate Investment Trust | 525,090 | 5,637,475 |
Granite REIT | 148,167 | 7,324,131 |
H&R Real Estate Investment Trust | 635,211 | 4,152,761 |
InterRent REIT | 333,180 | 2,899,427 |
Killam Apartment REIT | 282,335 | 3,525,470 |
NorthWest Healthcare Properties REIT | 519,504 | 1,905,710 |
Prinmaris REIT | 233,179 | 2,235,835 |
RioCan REIT | 742,833 | 9,410,531 |
SmartCentres Real Estate Investment Trust | 321,501 | 5,203,241 |
78,254,157 | ||
China — 0.0% | ||
Yuexiu REIT(a) | 5,690,000 | 629,466 |
France — 1.9% | ||
ARGAN SA, NVS | 24,998 | 1,965,205 |
Carmila SA | 144,533 | 2,428,223 |
Security | Shares | Value |
France (continued) | ||
Covivio SA/France | 131,932 | $6,567,064 |
Gecina SA | 128,347 | 13,104,458 |
ICADE | 79,045 | 2,101,604 |
Klepierre SA | 511,081 | 13,723,754 |
Mercialys SA | 231,849 | 2,509,571 |
Unibail-Rodamco-Westfield, New(b) | 255,514 | 21,292,736 |
63,692,615 | ||
Germany — 0.0% | ||
Hamborner REIT AG | 184,012 | 1,255,512 |
Hong Kong — 0.9% | ||
Champion REIT | 4,542,000 | 1,011,820 |
Fortune REIT | 3,343,000 | 1,642,340 |
Link REIT | 6,325,020 | 27,101,395 |
Prosperity REIT | 2,856,000 | 454,272 |
Sunlight REIT | 2,460,000 | 528,320 |
30,738,147 | ||
India — 0.4% | ||
Embassy Office Parks REIT | 2,175,439 | 9,377,961 |
Mindspace Business Parks REIT(c) | 555,002 | 2,358,957 |
Nexus Select Trust, NVS | 819,709 | 1,312,703 |
13,049,621 | ||
Ireland — 0.0% | ||
Irish Residential Properties REIT PLC | 1,137,445 | 1,202,957 |
Italy — 0.0% | ||
Immobiliare Grande Distribuzione SIIQ SpA(a) | 168,285 | 295,612 |
Japan — 6.5% | ||
Activia Properties Inc. | 1,791 | 4,445,171 |
Advance Logistics Investment Corp. | 1,645 | 1,269,148 |
Advance Residence Investment Corp. | 3,306 | 7,147,616 |
AEON REIT Investment Corp. | 4,391 | 3,840,028 |
Comforia Residential REIT Inc. | 1,708 | 3,697,379 |
CRE Logistics REIT Inc. | 1,458 | 1,395,485 |
Daiwa House REIT Investment Corp. | 5,535 | 9,297,559 |
Daiwa Office Investment Corp. | 661 | 2,409,948 |
Daiwa Securities Living Investments Corp. | 4,809 | 3,265,352 |
Frontier Real Estate Investment Corp. | 1,184 | 3,441,999 |
Fukuoka REIT Corp. | 1,761 | 1,891,505 |
Global One Real Estate Investment Corp. | 2,516 | 1,712,117 |
GLP J-REIT(a) | 11,487 | 9,342,517 |
Hankyu Hanshin REIT Inc. | 1,652 | 1,478,773 |
Health Care & Medical Investment Corp. | 868 | 724,369 |
Heiwa Real Estate REIT Inc. | 2,506 | 2,246,695 |
Hoshino Resorts REIT Inc. | 626 | 2,191,344 |
Hulic REIT Inc. | 3,186 | 3,044,965 |
Ichigo Office REIT Investment Corp. | 2,864 | 1,468,572 |
Industrial & Infrastructure Fund Investment Corp. | 5,819 | 4,811,616 |
Invincible Investment Corp. | 16,637 | 7,454,051 |
Japan Excellent Inc. | 3,116 | 2,545,444 |
Japan Hotel REIT Investment Corp. | 11,463 | 6,023,777 |
Japan Logistics Fund Inc. | 2,204 | 3,929,778 |
Japan Metropolitan Fund Invest | 17,009 | 10,268,816 |
Japan Prime Realty Investment Corp. | 2,265 | 4,901,149 |
Japan Real Estate Investment Corp. | 3,301 | 11,194,154 |
KDX Realty Investment Corp. | 10,243 | 10,103,050 |
LaSalle Logiport REIT | 4,695 | 4,708,994 |
Mirai Corp. | 4,621 | 1,323,122 |
Mitsubishi Estate Logistics REIT Investment Corp. | 1,213 | 3,109,113 |
Mitsui Fudosan Logistics Park Inc. | 1,409 | 4,042,204 |
Mori Hills REIT Investment Corp. | 3,876 | 3,372,971 |
Security | Shares | Value |
Japan (continued) | ||
Mori Trust REIT Inc. | 6,234 | $2,892,363 |
Nippon Accommodations Fund Inc. | 1,145 | 4,768,364 |
Nippon Building Fund Inc. | 3,796 | 14,503,736 |
Nippon Prologis REIT Inc. | 6,081 | 10,510,608 |
NIPPON REIT Investment Corp. | 1,078 | 2,434,710 |
Nomura Real Estate Master Fund Inc. | 11,190 | 10,696,743 |
NTT UD REIT Investment Corp. | 3,527 | 2,704,019 |
One REIT Inc. | 591 | 994,992 |
Orix JREIT Inc. | 6,520 | 6,872,603 |
Samty Residential Investment Corp. | 992 | 682,622 |
Sankei Real Estate Inc. | 1,164 | 674,148 |
Sekisui House REIT Inc. | 10,159 | 5,205,464 |
SOSiLA Logistics REIT Inc. | 1,784 | 1,404,602 |
Star Asia Investment Corp. | 5,447 | 2,124,993 |
Starts Proceed Investment Corp. | 611 | 801,405 |
Takara Leben Real Estate Investment Corp. | 1,616 | 1,047,323 |
Tokyu REIT Inc. | 2,359 | 2,427,244 |
United Urban Investment Corp. | 7,287 | 6,982,359 |
219,827,079 | ||
Malaysia — 0.1% | ||
Axis Real Estate Investment Trust | 3,459,000 | 1,391,573 |
Pavilion REIT | 3,325,300 | 912,759 |
2,304,332 | ||
Mexico — 0.8% | ||
Concentradora Fibra Danhos SA de CV(a) | 590,215 | 710,776 |
FIBRA Macquarie Mexico(c) | 1,884,776 | 3,390,908 |
Fibra Uno Administracion SA de CV | 7,142,238 | 10,252,186 |
Prologis Property Mexico SA de CV | 1,720,061 | 6,783,551 |
TF Administradora Industrial S de Real de CV | 1,918,205 | 4,716,361 |
25,853,782 | ||
Netherlands — 0.2% | ||
Eurocommercial Properties NV | 106,531 | 2,422,931 |
NSI NV | 45,500 | 863,355 |
Vastned Retail NV | 43,721 | 977,508 |
Wereldhave NV | 109,946 | 1,526,425 |
5,790,219 | ||
New Zealand — 0.3% | ||
Argosy Property Ltd. | 1,999,156 | 1,321,765 |
Goodman Property Trust | 2,714,718 | 3,647,195 |
Kiwi Property Group Ltd. | 4,035,153 | 1,921,275 |
Stride Property Group | 1,238,255 | 912,052 |
Vital Healthcare Property Trust | 1,227,904 | 1,577,999 |
9,380,286 | ||
Philippines — 0.0% | ||
AREIT Inc. | 1,981,320 | 1,190,126 |
Saudi Arabia — 0.2% | ||
Al Maather REIT Fund | 119,999 | 285,430 |
Al Rajhi REIT | 590,376 | 1,333,249 |
Alahli REIT Fund 1 | 114,992 | 247,083 |
Alinma Retail REIT Fund, NVS | 230,289 | 313,757 |
Al-Jazira Reit Fund | 31,792 | 150,427 |
Alkhabeer REIT | 323,075 | 544,402 |
Bonyan REIT, NVS | 166,591 | 436,925 |
Derayah REIT | 282,635 | 525,994 |
MEFIC REIT, NVS | 147,976 | 188,460 |
Mulkia Gulf Real Estate REIT Fund, NVS | 216,028 | 343,286 |
Musharaka Real Estate Income Fund, NVS | 209,371 | 292,514 |
Riyad REIT Fund | 377,401 | 780,844 |
Sedco Capital REIT Fund | 181,861 | 416,031 |
Sico Saudi REIT, NVS(b) | 107,984 | 133,688 |
Security | Shares | Value |
Saudi Arabia (continued) | ||
Taleem REIT | 80,604 | $236,401 |
6,228,491 | ||
Singapore — 3.0% | ||
AIMS APAC REIT | 1,596,328 | 1,472,240 |
CapitaLand Ascendas REIT | 8,843,014 | 16,750,627 |
CapitaLand Ascott Trust(a) | 6,079,732 | 4,038,108 |
CapitaLand China Trust(a) | 2,883,630 | 1,400,759 |
CapitaLand Integrated Commercial Trust | 12,611,626 | 17,977,810 |
CDL Hospitality Trusts(a) | 2,218,300 | 1,578,701 |
Cromwell European Real Estate Investment Trust(a) | 776,100 | 1,232,666 |
Digital Core REIT Management Pte Ltd.(a) | 1,814,300 | 1,106,723 |
ESR-LOGOS REIT | 15,183,742 | 3,225,732 |
Far East Hospitality Trust | 2,494,600 | 1,123,900 |
First REIT(a) | 2,323,000 | 416,933 |
Frasers Centrepoint Trust | 2,723,270 | 4,313,759 |
Frasers Logistics & Commercial Trust | 7,087,100 | 5,133,785 |
Keppel DC REIT | 3,169,833 | 3,953,821 |
Keppel REIT | 6,075,200 | 3,900,852 |
Lendlease Global Commercial REIT | 4,152,591 | 1,651,612 |
Mapletree Industrial Trust | 4,900,710 | 8,114,769 |
Mapletree Logistics Trust | 8,207,513 | 8,054,047 |
Mapletree Pan Asia Commercial Trust | 5,685,191 | 5,209,756 |
OUE REIT | 5,028,400 | 990,754 |
Paragon REIT | 2,751,100 | 1,703,000 |
Parkway Life REIT | 930,500 | 2,442,490 |
Sasseur Real Estate Investment Trust(a) | 1,295,500 | 640,608 |
Starhill Global REIT(a) | 3,666,100 | 1,275,702 |
Suntec REIT | 5,247,100 | 4,136,727 |
101,845,881 | ||
South Africa — 0.4% | ||
Attacq Ltd.(a) | 1,834,789 | 981,349 |
Burstone Group Ltd. | 1,516,478 | 552,784 |
Emira Property Fund Ltd. | 603,664 | 312,717 |
Equites Property Fund Ltd. | 1,904,693 | 1,243,843 |
Growthpoint Properties Ltd. | 8,455,519 | 4,914,837 |
Redefine Properties Ltd.(a) | 16,745,429 | 3,502,265 |
Resilient REIT Ltd. | 717,579 | 1,686,694 |
Stor-Age Property REIT Ltd.(a) | 894,316 | 633,392 |
13,827,881 | ||
South Korea — 0.1% | ||
ESR Kendall Square REIT Co. Ltd. | 309,711 | 1,028,660 |
JR Global REIT | 295,720 | 860,942 |
LOTTE REIT Co. Ltd. | 312,104 | 715,745 |
Shinhan Alpha REIT Co. Ltd. | 165,352 | 756,596 |
SK REITs Co. Ltd. | 278,559 | 833,529 |
4,195,472 | ||
Spain — 0.4% | ||
Inmobiliaria Colonial SOCIMI SA | 784,411 | 4,587,782 |
Lar Espana Real Estate SOCIMI SA | 142,351 | 1,037,594 |
Merlin Properties SOCIMI SA | 829,808 | 9,334,633 |
14,960,009 | ||
Thailand — 0.0% | ||
CPN Retail Growth Leasehold REIT | 4,177,800 | 1,172,399 |
Turkey — 0.1% | ||
AKIS Gayrimenkul Yatirimi A/S(b) | 963,422 | 547,063 |
Alarko Gayrimenkul Yatirim Ortakligi A/S | 171,118 | 238,293 |
Emlak Konut Gayrimenkul Yatirim Ortakligi AS(b) | 4,748,893 | 1,427,113 |
Is Gayrimenkul Yatirim Ortakligi AS(b) | 1,079,920 | 521,182 |
Ozak Gayrimenkul Yatirim Ortakligi(b) | 951,249 | 247,900 |
2,981,551 | ||
Security | Shares | Value |
United Kingdom — 4.6% | ||
Abrdn Property Income Trust Ltd. | 975,985 | $611,465 |
AEW U.K. REIT PLC | 402,660 | 423,533 |
Assura PLC | 7,201,201 | 3,686,795 |
Balanced Commercial Property Trust Ltd. | 1,385,072 | 1,346,498 |
Big Yellow Group PLC | 464,146 | 6,243,841 |
British Land Co. PLC (The) | 2,296,446 | 11,073,799 |
Capital & Counties Properties PLC | 3,383,587 | 5,663,786 |
CLS Holdings PLC | 423,578 | 436,138 |
Custodian Property Income REIT PLC | 1,041,419 | 958,712 |
Derwent London PLC | 276,467 | 7,102,645 |
Empiric Student Property PLC | 1,496,187 | 1,681,311 |
Great Portland Estates PLC | 534,097 | 2,616,133 |
Hammerson PLC | 9,536,479 | 3,246,003 |
Helical PLC | 261,210 | 665,846 |
Home REIT PLC(b)(d) | 1,719,812 | 572,384 |
Impact Healthcare REIT PLC, Class B | 794,497 | 832,929 |
Land Securities Group PLC | 1,831,973 | 14,806,110 |
Life Science Reit PLC | 896,892 | 442,681 |
LondonMetric Property PLC | 4,682,190 | 11,428,816 |
NewRiver REIT PLC | 776,561 | 725,214 |
Picton Property Income Ltd. | 1,381,705 | 1,138,754 |
Primary Health Properties PLC | 3,265,606 | 3,737,790 |
PRS REIT PLC (The) | 1,311,624 | 1,292,711 |
Regional REIT Ltd.(c) | 1,086,600 | 304,138 |
Residential Secure Income PLC, NVS(c) | 473,753 | 292,997 |
Safestore Holdings PLC | 526,374 | 5,073,118 |
Schroder REIT Ltd. | 1,279,662 | 709,957 |
Segro PLC | 3,311,820 | 34,834,128 |
Sirius Real Estate Ltd. | 3,285,197 | 3,995,673 |
Supermarket Income REIT PLC | 3,054,612 | 2,759,307 |
Target Healthcare REIT PLC | 1,565,632 | 1,516,780 |
Triple Point Social Housing REIT PLC(c) | 831,680 | 626,153 |
Tritax Big Box REIT PLC | 4,724,004 | 8,922,864 |
UK Commercial Property REIT Ltd. | 1,766,634 | 1,482,785 |
UNITE Group PLC (The) | 860,509 | 9,947,947 |
Urban Logistics REIT PLC | 1,114,153 | 1,612,156 |
Warehouse REIT PLC | 913,364 | 910,052 |
Workspace Group PLC | 363,594 | 2,247,389 |
155,969,338 | ||
United States — 69.5% | ||
Acadia Realty Trust | 246,318 | 4,256,375 |
Agree Realty Corp. | 245,794 | 14,064,333 |
Alexander & Baldwin Inc. | 178,382 | 2,937,952 |
Alexandria Real Estate Equities Inc. | 430,339 | 49,863,380 |
American Assets Trust Inc. | 118,033 | 2,520,005 |
American Homes 4 Rent, Class A | 826,816 | 29,600,013 |
Americold Realty Trust Inc. | 703,230 | 15,449,963 |
Apartment Income REIT Corp. | 363,747 | 13,960,610 |
Apartment Investment & Management Co., Class A(b) | 352,102 | 2,816,816 |
Apple Hospitality REIT Inc. | 530,777 | 7,834,269 |
Armada Hoffler Properties Inc. | 169,673 | 1,784,960 |
AvalonBay Communities Inc. | 351,646 | 66,661,532 |
Boston Properties Inc. | 389,035 | 24,077,376 |
Brandywine Realty Trust | 417,365 | 1,894,837 |
Brixmor Property Group Inc. | 742,290 | 16,404,609 |
Broadstone Net Lease Inc. | 462,484 | 6,733,767 |
Camden Property Trust | 257,362 | 25,653,844 |
CareTrust REIT Inc. | 294,902 | 7,289,977 |
Centerspace | 36,891 | 2,480,920 |
Community Healthcare Trust Inc. | 64,606 | 1,713,997 |
COPT Defense Properties | 277,370 | 6,648,559 |
Cousins Properties Inc. | 375,216 | 8,607,455 |
Security | Shares | Value |
United States (continued) | ||
CubeSmart | 553,812 | $22,396,157 |
DiamondRock Hospitality Co. | 517,300 | 4,603,970 |
Digital Realty Trust Inc. | 749,533 | 104,020,190 |
Douglas Emmett Inc. | 374,099 | 5,128,897 |
Easterly Government Properties Inc., Class A | 239,010 | 2,794,027 |
EastGroup Properties Inc. | 113,365 | 17,612,386 |
Elme Communities | 218,267 | 3,308,928 |
Empire State Realty Trust Inc., Class A | 324,909 | 2,956,672 |
EPR Properties | 184,047 | 7,470,468 |
Equinix Inc. | 231,731 | 164,786,231 |
Equity LifeStyle Properties Inc. | 441,349 | 26,608,931 |
Equity Residential | 925,486 | 59,601,298 |
Essential Properties Realty Trust Inc. | 383,686 | 10,106,289 |
Essex Property Trust Inc. | 158,370 | 38,998,613 |
Extra Space Storage Inc. | 518,899 | 69,677,758 |
Federal Realty Investment Trust | 200,352 | 20,870,668 |
First Industrial Realty Trust Inc. | 327,382 | 14,869,690 |
Four Corners Property Trust Inc. | 222,421 | 5,215,772 |
Gaming and Leisure Properties Inc. | 634,521 | 27,113,082 |
Getty Realty Corp. | 115,961 | 3,142,543 |
Global Net Lease Inc. | 478,758 | 3,327,368 |
Healthcare Realty Trust Inc., Class A | 941,991 | 13,404,532 |
Healthpeak Properties Inc. | 1,752,783 | 32,619,292 |
Highwoods Properties Inc. | 257,999 | 6,759,574 |
Host Hotels & Resorts Inc. | 1,734,104 | 32,722,543 |
Hudson Pacific Properties Inc. | 337,029 | 1,954,768 |
Independence Realty Trust Inc. | 555,072 | 8,753,485 |
Innovative Industrial Properties Inc. | 68,664 | 7,099,858 |
InvenTrust Properties Corp. | 167,196 | 4,236,747 |
Invitation Homes Inc. | 1,516,374 | 51,859,991 |
JBG SMITH Properties | 224,832 | 3,374,728 |
Kilroy Realty Corp. | 289,232 | 9,776,042 |
Kimco Realty Corp. | 1,628,891 | 30,346,239 |
Kite Realty Group Trust | 535,431 | 11,672,396 |
LTC Properties Inc. | 100,887 | 3,339,360 |
LXP Industrial Trust. | 712,546 | 5,949,759 |
Macerich Co. (The) | 531,710 | 7,316,330 |
Medical Properties Trust Inc. | 1,472,123 | 6,771,766 |
Mid-America Apartment Communities Inc. | 288,039 | 37,445,070 |
National Health Investors Inc. | 102,658 | 6,473,614 |
National Storage Affiliates Trust | 186,184 | 6,523,887 |
NETSTREIT Corp. | 170,091 | 2,866,033 |
NexPoint Residential Trust Inc. | 57,451 | 1,967,122 |
NNN REIT Inc. | 449,714 | 18,226,908 |
Omega Healthcare Investors Inc. | 606,924 | 18,456,559 |
Paramount Group Inc. | 463,724 | 2,151,679 |
Park Hotels & Resorts Inc. | 515,342 | 8,312,467 |
Pebblebrook Hotel Trust(a) | 292,456 | 4,249,386 |
Phillips Edison & Co. Inc. | 295,752 | 9,671,090 |
Piedmont Office Realty Trust Inc., Class A | 310,936 | 2,142,349 |
Prologis Inc. | 2,290,381 | 233,733,381 |
Public Storage | 388,847 | 100,886,354 |
Realty Income Corp. | 2,063,952 | 110,503,990 |
Regency Centers Corp. | 448,985 | 26,588,892 |
Retail Opportunity Investments Corp. | 302,828 | 3,715,700 |
Rexford Industrial Realty Inc. | 521,061 | 22,306,621 |
RLJ Lodging Trust | 377,185 | 4,149,035 |
Ryman Hospitality Properties Inc. | 143,646 | 15,151,780 |
Sabra Health Care REIT Inc. | 569,296 | 7,924,600 |
Safehold Inc. | 122,332 | 2,231,336 |
Service Properties Trust | 401,830 | 2,463,218 |
Simon Property Group Inc. | 805,200 | 113,154,756 |
Security | Shares | Value |
United States (continued) | ||
SITE Centers Corp. | 468,906 | $6,325,542 |
SL Green Realty Corp. | 158,077 | 7,876,977 |
STAG Industrial Inc. | 450,804 | 15,503,150 |
Summit Hotel Properties Inc. | 258,578 | 1,554,054 |
Sun Communities Inc. | 304,851 | 33,936,013 |
Sunstone Hotel Investors Inc. | 505,639 | 5,157,518 |
Tanger Inc. | 257,424 | 7,297,970 |
Terreno Realty Corp. | 221,241 | 12,024,448 |
UDR Inc. | 814,742 | 31,025,375 |
Urban Edge Properties | 282,629 | 4,728,383 |
Ventas Inc. | 991,230 | 43,891,664 |
Veris Residential Inc. | 192,510 | 2,774,069 |
VICI Properties Inc., Class A | 2,566,141 | 73,263,326 |
Vornado Realty Trust | 438,337 | 11,409,912 |
Welltower Inc. | 1,375,189 | 131,028,008 |
WP Carey Inc. | 538,192 | 29,514,449 |
Xenia Hotels & Resorts Inc. | 259,743 | 3,602,635 |
2,348,032,217 | ||
Total Long-Term Investments — 99.4% (Cost: $3,786,957,333) | 3,361,166,058 | |
Short-Term Securities | ||
Money Market Funds — 0.6% | ||
BlackRock Cash Funds: Institutional, SL Agency Shares, 5.49%(e)(f)(g) | 12,075,839 | 12,079,462 |
Security | Shares | Value |
Money Market Funds (continued) | ||
BlackRock Cash Funds: Treasury, SL Agency Shares, 5.28%(e)(f) | 7,200,000 | $7,200,000 |
Total Short-Term Securities — 0.6% (Cost: $19,278,921) | 19,279,462 | |
Total Investments — 100.0% (Cost: $3,806,236,254) | 3,380,445,520 | |
Other Assets Less Liabilities — 0.0% | 257,759 | |
Net Assets — 100.0% | $3,380,703,279 | |
(a) | All or a portion of this security is on loan. |
(b) | Non-income producing security. |
(c) | Security exempt from registration pursuant to Rule 144A under the Securities Act of 1933, as amended. These securities may be resold in transactions exempt from registration to qualified institutional investors. |
(d) | Security is valued using significant unobservable inputs and is classified as Level 3 in the fair value hierarchy. |
(e) | Affiliate of the Fund. |
(f) | Annualized 7-day yield as of period end. |
(g) | All or a portion of this security was purchased with the cash collateral from loaned securities. |
Affiliated Issuer | Value at 04/30/23 | Purchases at Cost | Proceeds from Sales | Net Realized Gain (Loss) | Change in Unrealized Appreciation (Depreciation) | Value at 04/30/24 | Shares Held at 04/30/24 | Income | Capital Gain Distributions from Underlying Funds |
BlackRock Cash Funds: Institutional, SL Agency Shares | $15,717,990 | $— | $(3,636,229 )(a) | $(3,585 ) | $1,286 | $12,079,462 | 12,075,839 | $85,689 (b) | $— |
BlackRock Cash Funds: Treasury, SL Agency Shares | 7,630,000 | — | (430,000 )(a) | — | — | 7,200,000 | 7,200,000 | 453,979 | — |
$(3,585 ) | $1,286 | $19,279,462 | $539,668 | $— |
(a) | Represents net amount purchased (sold). |
(b) | All or a portion represents securities lending income earned from the reinvestment of cash collateral from loaned securities, net of fees and collateral investment expenses, and other payments to and from borrowers of securities. |
Description | Number of Contracts | Expiration Date | Notional Amount (000) | Value/ Unrealized Appreciation (Depreciation) |
Long Contracts | ||||
SPI 200 Index | 23 | 06/20/24 | $2,826 | $(63,813 ) |
Dow Jones U.S. Real Estate Index | 510 | 06/21/24 | 16,218 | (973,168 ) |
$(1,036,981 ) |
Commodity Contracts | Credit Contracts | Equity Contracts | Foreign Currency Exchange Contracts | Interest Rate Contracts | Other Contracts | Total | |
Liabilities—Derivative Financial Instruments | |||||||
Futures contracts | |||||||
Unrealized depreciation on futures contracts(a) | $— | $— | $1,036,981 | $— | $— | $— | $1,036,981 |
(a) | Net cumulative unrealized appreciation (depreciation) on futures contracts are reported in the Schedule of Investments. In the Statements of Assets and Liabilities, only current day's variation margin is reported in receivables or payables and the net cumulative unrealized appreciation (depreciation) is included in accumulated earnings (loss). |
Commodity Contracts | Credit Contracts | Equity Contracts | Foreign Currency Exchange Contracts | Interest Rate Contracts | Other Contracts | Total | |
Net Realized Gain (Loss) from | |||||||
Futures contracts | $— | $— | $(897,671 ) | $— | $— | $— | $(897,671 ) |
Net Change in Unrealized Appreciation (Depreciation) on | |||||||
Futures contracts | $— | $— | $(1,434,949 ) | $— | $— | $— | $(1,434,949 ) |
Futures contracts: | |
Average notional value of contracts — long | $16,715,832 |
Level 1 | Level 2 | Level 3 | Total | |
Assets | ||||
Investments | ||||
Long-Term Investments | ||||
Common Stocks | $2,527,891,995 | $832,701,679 | $572,384 | $3,361,166,058 |
Short-Term Securities | ||||
Money Market Funds | 19,279,462 | — | — | 19,279,462 |
$2,547,171,457 | $832,701,679 | $572,384 | $3,380,445,520 | |
Derivative Financial Instruments(a) | ||||
Liabilities | ||||
Equity Contracts | $(973,168 ) | $(63,813 ) | $— | $(1,036,981 ) |
(a) | Derivative financial instruments are futures contracts. Futures contracts are valued at the unrealized appreciation (depreciation) on the instrument. |
Security | Shares | Value |
Common Stocks | ||
Australia — 15.0% | ||
Abacus Group | 89,441 | $66,654 |
Abacus Storage King | 94,383 | 68,833 |
Arena REIT | 63,504 | 149,832 |
BWP Trust | 96,570 | 220,990 |
Centuria Industrial REIT | 93,079 | 190,055 |
Centuria Office REIT | 81,824 | 62,406 |
Charter Hall Long Wale REIT | 118,932 | 257,249 |
Charter Hall Retail REIT | 87,015 | 185,669 |
Charter Hall Social Infrastructure REIT | 59,195 | 96,691 |
Cromwell Property Group | 251,581 | 65,350 |
Dexus | 191,722 | 870,842 |
Dexus Industria REIT | 37,544 | 70,591 |
Goodman Group | 329,182 | 6,649,354 |
GPT Group (The) | 341,455 | 918,320 |
Growthpoint Properties Australia Ltd. | 48,177 | 73,733 |
HealthCo REIT | 79,471 | 61,338 |
HomeCo Daily Needs REIT | 308,903 | 242,191 |
Hotel Property Investments Ltd. | 35,353 | 74,007 |
Ingenia Communities Group | 65,402 | 193,848 |
Lifestyle Communities Ltd.(a) | 19,411 | 148,104 |
Mirvac Group | 702,583 | 920,572 |
National Storage REIT | 220,480 | 304,026 |
Region RE Ltd. | 208,938 | 292,900 |
Scentre Group | 924,333 | 1,871,820 |
Stockland | 426,638 | 1,208,715 |
Vicinity Ltd. | 672,176 | 823,126 |
Waypoint REIT Ltd | 119,225 | 178,900 |
16,266,116 | ||
Austria — 0.2% | ||
CA Immobilien Anlagen AG | 6,038 | 196,397 |
Belgium — 2.6% | ||
Aedifica SA | 8,363 | 534,376 |
Ascencio | 915 | 47,299 |
Cofinimmo SA | 6,550 | 433,882 |
Home Invest Belgium SA, NVS | 1,810 | 31,872 |
Montea NV | 3,172 | 271,948 |
Retail Estates NV | 2,181 | 152,231 |
Shurgard Self Storage Ltd. | 5,439 | 222,896 |
VGP NV | 1,788 | 194,531 |
Warehouses De Pauw CVA | 29,910 | 790,951 |
Xior Student Housing NV | 5,938 | 176,658 |
2,856,644 | ||
Canada — 6.1% | ||
Allied Properties REIT | 22,497 | 276,667 |
Boardwalk REIT | 7,126 | 366,847 |
Canadian Apartment Properties REIT | 29,685 | 923,984 |
Chartwell Retirement Residences | 42,336 | 384,104 |
Choice Properties REIT | 45,846 | 433,600 |
Crombie REIT | 18,700 | 174,550 |
Dream Industrial REIT | 45,118 | 406,722 |
First Capital Real Estate Investment Trust | 37,889 | 406,784 |
Granite REIT | 10,665 | 527,188 |
H&R Real Estate Investment Trust | 45,557 | 297,834 |
InterRent REIT | 23,792 | 207,045 |
Killam Apartment REIT | 20,490 | 255,855 |
NorthWest Healthcare Properties REIT | 37,724 | 138,384 |
Prinmaris REIT | 17,038 | 163,369 |
RioCan REIT | 53,244 | 674,518 |
SmartCentres Real Estate Investment Trust | 23,218 | 375,765 |
Security | Shares | Value |
Canada (continued) | ||
StorageVault Canada Inc., NVS | 41,759 | $143,479 |
Tricon Residential Inc. | 43,365 | 485,736 |
6,642,431 | ||
Finland — 0.4% | ||
Citycon OYJ | 14,941 | 61,126 |
Kojamo OYJ(b) | 28,023 | 309,565 |
370,691 | ||
France — 4.2% | ||
ARGAN SA, NVS | 1,745 | 137,182 |
Carmila SA | 10,134 | 170,256 |
Covivio SA/France | 9,503 | 473,023 |
Gecina SA | 9,210 | 940,357 |
ICADE | 5,769 | 153,383 |
Klepierre SA | 36,642 | 983,926 |
Mercialys SA | 16,894 | 182,863 |
Unibail-Rodamco-Westfield, New(b) | 18,323 | 1,526,910 |
4,567,900 | ||
Germany — 5.4% | ||
Aroundtown SA(a)(b) | 121,136 | 251,123 |
Deutsche EuroShop AG(a) | 2,233 | 45,140 |
Deutsche Wohnen SE | 8,736 | 164,808 |
Grand City Properties SA(b) | 17,563 | 196,138 |
Hamborner REIT AG | 12,643 | 86,263 |
LEG Immobilien SE(b) | 13,210 | 1,121,375 |
TAG Immobilien AG(b) | 26,851 | 381,759 |
Vonovia SE | 124,170 | 3,588,020 |
5,834,626 | ||
Hong Kong — 8.3% | ||
Champion REIT | 330,000 | 73,514 |
CK Asset Holdings Ltd. | 343,000 | 1,463,092 |
Fortune REIT | 246,000 | 120,854 |
Hongkong Land Holdings Ltd. | 195,300 | 624,018 |
Hysan Development Co. Ltd. | 107,000 | 166,768 |
Link REIT | 454,640 | 1,948,038 |
New World Development Co. Ltd. | 252,333 | 267,965 |
Prosperity REIT | 215,000 | 34,198 |
Sino Land Co. Ltd. | 628,800 | 672,312 |
Sun Hung Kai Properties Ltd. | 253,500 | 2,338,527 |
Sunlight REIT | 193,000 | 41,450 |
Swire Properties Ltd. | 187,800 | 388,402 |
Wharf Real Estate Investment Co. Ltd. | 276,900 | 859,086 |
8,998,224 | ||
Ireland — 0.1% | ||
Irish Residential Properties REIT PLC | 78,809 | 83,348 |
Israel — 0.8% | ||
Amot Investments Ltd. | 38,166 | 160,073 |
Azrieli Group Ltd. | 6,516 | 419,241 |
Melisron Ltd. | 4,461 | 306,025 |
885,339 | ||
Italy — 0.0% | ||
Immobiliare Grande Distribuzione SIIQ SpA | 12,833 | 22,543 |
Japan — 26.6% | ||
Activia Properties Inc. | 129 | 320,171 |
Advance Logistics Investment Corp. | 117 | 90,268 |
Advance Residence Investment Corp. | 238 | 514,559 |
Aeon Mall Co. Ltd. | 16,400 | 187,500 |
AEON REIT Investment Corp. | 315 | 275,475 |
Comforia Residential REIT Inc. | 123 | 266,263 |
CRE Logistics REIT Inc. | 107 | 102,412 |
Security | Shares | Value |
Japan (continued) | ||
Daiwa House REIT Investment Corp. | 398 | $668,551 |
Daiwa Office Investment Corp. | 47 | 171,358 |
Daiwa Securities Living Investments Corp. | 345 | 234,258 |
Frontier Real Estate Investment Corp. | 87 | 252,917 |
Fukuoka REIT Corp. | 129 | 138,560 |
Global One Real Estate Investment Corp. | 182 | 123,849 |
GLP J-REIT(a) | 832 | 676,676 |
Hankyu Hanshin REIT Inc. | 118 | 105,627 |
Health Care & Medical Investment Corp. | 66 | 55,079 |
Heiwa Real Estate Co. Ltd. | 5,800 | 160,347 |
Heiwa Real Estate REIT Inc. | 177 | 158,685 |
Hoshino Resorts REIT Inc. | 45 | 157,525 |
Hulic Co. Ltd. | 73,700 | 679,120 |
Hulic REIT Inc. | 230 | 219,819 |
Ichigo Office REIT Investment Corp. | 209 | 107,169 |
Industrial & Infrastructure Fund Investment Corp. | 415 | 343,155 |
Invincible Investment Corp. | 1,191 | 533,616 |
Japan Excellent Inc. | 218 | 178,083 |
Japan Hotel REIT Investment Corp. | 824 | 433,010 |
Japan Logistics Fund Inc. | 159 | 283,500 |
Japan Metropolitan Fund Invest | 1,223 | 738,360 |
Japan Prime Realty Investment Corp. | 165 | 357,037 |
Japan Real Estate Investment Corp. | 237 | 803,700 |
KDX Realty Investment Corp. | 740 | 729,889 |
LaSalle Logiport REIT | 331 | 331,987 |
Mirai Corp. | 331 | 94,775 |
Mitsubishi Estate Co. Ltd. | 193,300 | 3,542,165 |
Mitsubishi Estate Logistics REIT Investment Corp. | 87 | 222,995 |
Mitsui Fudosan Co. Ltd. | 477,500 | 4,859,547 |
Mitsui Fudosan Logistics Park Inc. | 101 | 289,753 |
Mori Hills REIT Investment Corp. | 280 | 243,661 |
Mori Trust REIT Inc. | 447 | 207,393 |
Nippon Accommodations Fund Inc. | 83 | 345,654 |
Nippon Building Fund Inc. | 273 | 1,043,077 |
Nippon Prologis REIT Inc. | 438 | 757,054 |
NIPPON REIT Investment Corp. | 78 | 176,166 |
Nomura Real Estate Holdings Inc. | 19,200 | 537,545 |
Nomura Real Estate Master Fund Inc. | 799 | 763,780 |
NTT UD REIT Investment Corp. | 255 | 195,499 |
One REIT Inc. | 45 | 75,761 |
Orix JREIT Inc. | 468 | 493,309 |
Samty Residential Investment Corp. | 76 | 52,298 |
Sankei Real Estate Inc. | 83 | 48,071 |
Sekisui House REIT Inc. | 729 | 373,539 |
SOSiLA Logistics REIT Inc. | 125 | 98,417 |
Star Asia Investment Corp. | 393 | 153,318 |
Starts Proceed Investment Corp. | 44 | 57,712 |
Sumitomo Realty & Development Co. Ltd. | 70,500 | 2,439,575 |
Takara Leben Real Estate Investment Corp. | 114 | 73,883 |
Tokyo Tatemono Co. Ltd. | 35,500 | 590,719 |
Tokyu REIT Inc. | 165 | 169,773 |
United Urban Investment Corp. | 524 | 502,094 |
28,806,058 | ||
Netherlands — 0.4% | ||
Eurocommercial Properties NV | 7,468 | 169,852 |
NSI NV | 3,201 | 60,738 |
Vastned Retail NV | 3,042 | 68,013 |
Wereldhave NV | 7,888 | 109,512 |
408,115 | ||
New Zealand — 0.8% | ||
Argosy Property Ltd. | 148,805 | 98,384 |
Security | Shares | Value |
New Zealand (continued) | ||
Goodman Property Trust | 195,322 | $262,413 |
Kiwi Property Group Ltd.(a) | 282,489 | 134,503 |
Precinct Properties Group | 235,880 | 162,621 |
Stride Property Group | 90,477 | 66,642 |
Vital Healthcare Property Trust | 88,022 | 113,118 |
837,681 | ||
Norway — 0.1% | ||
Entra ASA(b)(c) | 12,638 | 116,727 |
Singapore — 8.1% | ||
AIMS APAC REIT(a) | 112,126 | 103,410 |
CapitaLand Ascendas REIT | 634,790 | 1,202,433 |
CapitaLand Ascott Trust | 436,930 | 290,205 |
CapitaLand Integrated Commercial Trust | 904,407 | 1,289,228 |
CapitaLand Investment Ltd/Singapore | 447,300 | 865,012 |
CDL Hospitality Trusts | 155,521 | 110,680 |
City Developments Ltd. | 83,200 | 372,897 |
Cromwell European Real Estate Investment Trust | 56,700 | 90,055 |
Digital Core REIT Management Pte Ltd. | 131,800 | 80,398 |
ESR-LOGOS REIT | 1,090,720 | 231,719 |
Far East Hospitality Trust | 173,300 | 78,077 |
Frasers Centrepoint Trust | 191,949 | 304,054 |
Frasers Logistics & Commercial Trust | 512,000 | 370,885 |
Keppel DC REIT | 230,171 | 287,099 |
Keppel REIT | 434,900 | 279,247 |
Lendlease Global Commercial REIT | 296,847 | 118,065 |
Mapletree Industrial Trust | 351,445 | 581,935 |
Mapletree Logistics Trust | 589,160 | 578,144 |
Mapletree Pan Asia Commercial Trust | 410,917 | 376,553 |
OUE REIT | 381,300 | 75,128 |
Paragon REIT | 192,465 | 119,141 |
Parkway Life REIT | 68,800 | 180,595 |
Starhill Global REIT | 254,500 | 88,559 |
Suntec REIT | 374,900 | 295,565 |
UOL Group Ltd. | 87,600 | 374,030 |
8,743,114 | ||
South Korea — 0.3% | ||
ESR Kendall Square REIT Co. Ltd. | 21,324 | 70,825 |
JR Global REIT | 20,166 | 58,710 |
LOTTE REIT Co. Ltd. | 21,567 | 49,459 |
Shinhan Alpha REIT Co. Ltd. | 12,084 | 55,292 |
SK REITs Co. Ltd. | 19,891 | 59,520 |
293,806 | ||
Spain — 1.0% | ||
Inmobiliaria Colonial SOCIMI SA | 56,337 | 329,498 |
Lar Espana Real Estate SOCIMI SA | 10,517 | 76,658 |
Merlin Properties SOCIMI SA | 59,640 | 670,899 |
1,077,055 | ||
Sweden — 5.0% | ||
Atrium Ljungberg AB, Class B | 7,912 | 140,286 |
Castellum AB(a)(b) | 76,028 | 903,362 |
Catena AB | 6,007 | 262,895 |
Cibus Nordic Real Estate AB | 10,000 | 130,241 |
Corem Property Group AB, Class B | 118,462 | 88,010 |
Dios Fastigheter AB | 15,692 | 119,892 |
Fabege AB | 44,669 | 341,642 |
Fastighets AB Balder, Class B(b) | 111,345 | 701,841 |
FastPartner AB | 9,182 | 61,653 |
Hufvudstaden AB, Class A | 19,025 | 220,985 |
NP3 Fastigheter AB | 5,181 | 109,070 |
Nyfosa AB | 32,220 | 278,729 |
Security | Shares | Value |
Sweden (continued) | ||
Pandox AB, Class B | 15,652 | $242,049 |
Platzer Fastigheter Holding AB, Class B | 9,564 | 77,313 |
Sagax AB, Class B | 38,256 | 958,009 |
Samhallsbyggnadsbolaget i Norden AB(a) | 195,972 | 70,288 |
Wallenstam AB, Class B | 60,164 | 265,951 |
Wihlborgs Fastigheter AB | 47,544 | 398,211 |
5,370,427 | ||
Switzerland — 2.9% | ||
Allreal Holding AG, Registered | 2,613 | 422,005 |
Intershop Holding AG | 964 | 129,173 |
Mobimo Holding AG, Registered | 1,262 | 353,289 |
Peach Property Group AG(b) | 2,688 | 27,604 |
PSP Swiss Property AG, Registered | 8,037 | 993,545 |
Swiss Prime Site AG, Registered | 13,503 | 1,246,770 |
3,172,386 | ||
United Kingdom — 10.9% | ||
Abrdn European Logistics Income PLC(c) | 67,889 | 50,220 |
Abrdn Property Income Trust Ltd. | 67,615 | 42,362 |
AEW U.K. REIT PLC | 30,252 | 31,820 |
Assura PLC | 516,474 | 264,419 |
Balanced Commercial Property Trust Ltd. | 95,855 | 93,185 |
Big Yellow Group PLC | 33,143 | 445,850 |
British Land Co. PLC (The) | 164,959 | 795,456 |
Capital & Counties Properties PLC | 244,056 | 408,525 |
CLS Holdings PLC | 27,163 | 27,968 |
Custodian Property Income REIT PLC | 72,163 | 66,432 |
Derwent London PLC | 19,825 | 509,319 |
Empiric Student Property PLC | 104,048 | 116,922 |
Grainger PLC | 130,556 | 418,445 |
Great Portland Estates PLC | 38,142 | 186,829 |
Hammerson PLC | 688,396 | 234,314 |
Helical PLC | 17,481 | 44,560 |
Home REIT PLC(b)(d) | 191,393 | 63,699 |
Impact Healthcare REIT PLC, Class B | 59,285 | 62,153 |
Land Securities Group PLC | 131,349 | 1,061,570 |
Life Science Reit PLC | 59,601 | 29,417 |
LondonMetric Property PLC | 336,077 | 820,335 |
NewRiver REIT PLC | 54,193 | 50,610 |
Picton Property Income Ltd. | 97,053 | 79,988 |
Primary Health Properties PLC | 237,863 | 272,256 |
PRS REIT PLC (The) | 91,460 | 90,141 |
Regional REIT Ltd.(c) | 82,259 | 23,024 |
Residential Secure Income PLC, NVS(c) | 34,444 | 21,302 |
Safestore Holdings PLC | 37,749 | 363,820 |
Security | Shares | Value |
United Kingdom (continued) | ||
Schroder REIT Ltd. | 86,690 | $48,096 |
Segro PLC | 237,882 | 2,502,072 |
Sirius Real Estate Ltd. | 238,104 | 289,598 |
Supermarket Income REIT PLC | 220,533 | 199,213 |
Target Healthcare REIT PLC | 109,972 | 106,541 |
Triple Point Social Housing REIT PLC(c) | 62,213 | 46,839 |
Tritax Big Box REIT PLC | 339,855 | 641,930 |
Tritax EuroBox PLC(c) | 143,160 | 99,281 |
UK Commercial Property REIT Ltd. | 130,539 | 109,565 |
UNITE Group PLC (The) | 61,803 | 714,476 |
Urban Logistics REIT PLC | 81,726 | 118,256 |
Warehouse REIT PLC | 69,255 | 69,004 |
Workspace Group PLC | 25,386 | 156,912 |
11,776,724 | ||
Total Long-Term Investments — 99.2% (Cost: $155,811,021) | 107,326,352 | |
Short-Term Securities | ||
Money Market Funds — 2.0% | ||
BlackRock Cash Funds: Institutional, SL Agency Shares, 5.49%(e)(f)(g) | 2,068,106 | 2,068,726 |
BlackRock Cash Funds: Treasury, SL Agency Shares, 5.28%(e)(f) | 50,000 | 50,000 |
Total Short-Term Securities — 2.0% (Cost: $2,119,120) | 2,118,726 | |
Total Investments — 101.2% (Cost: $157,930,141) | 109,445,078 | |
Liabilities in Excess of Other Assets — (1.2)% | (1,310,373 ) | |
Net Assets — 100.0% | $108,134,705 | |
(a) | All or a portion of this security is on loan. |
(b) | Non-income producing security. |
(c) | Security exempt from registration pursuant to Rule 144A under the Securities Act of 1933, as amended. These securities may be resold in transactions exempt from registration to qualified institutional investors. |
(d) | Security is valued using significant unobservable inputs and is classified as Level 3 in the fair value hierarchy. |
(e) | Affiliate of the Fund. |
(f) | Annualized 7-day yield as of period end. |
(g) | All or a portion of this security was purchased with the cash collateral from loaned securities. |
Affiliated Issuer | Value at 04/30/23 | Purchases at Cost | Proceeds from Sales | Net Realized Gain (Loss) | Change in Unrealized Appreciation (Depreciation) | Value at 04/30/24 | Shares Held at 04/30/24 | Income | Capital Gain Distributions from Underlying Funds |
BlackRock Cash Funds: Institutional, SL Agency Shares | $2,371,728 | $— | $(303,013 )(a) | $74 | $(63 ) | $2,068,726 | 2,068,106 | $36,642 (b) | $— |
BlackRock Cash Funds: Treasury, SL Agency Shares | 50,000 | 0 (a) | — | — | — | 50,000 | 50,000 | 3,789 | — |
$74 | $(63 ) | $2,118,726 | $40,431 | $— |
(a) | Represents net amount purchased (sold). |
(b) | All or a portion represents securities lending income earned from the reinvestment of cash collateral from loaned securities, net of fees and collateral investment expenses, and other payments to and from borrowers of securities. |
Description | Number of Contracts | Expiration Date | Notional Amount (000) | Value/ Unrealized Appreciation (Depreciation) |
Long Contracts | ||||
MSCI Singapore Index | 4 | 05/30/24 | $89 | $(95 ) |
TOPIX Index | 1 | 06/13/24 | 173 | (798 ) |
Dow Jones U.S. Real Estate Index | 9 | 06/21/24 | 286 | (10,225 ) |
Euro STOXX 50 Index | 2 | 06/21/24 | 104 | (2,275 ) |
$(13,393 ) |
Commodity Contracts | Credit Contracts | Equity Contracts | Foreign Currency Exchange Contracts | Interest Rate Contracts | Other Contracts | Total | |
Liabilities—Derivative Financial Instruments | |||||||
Futures contracts | |||||||
Unrealized depreciation on futures contracts(a) | $— | $— | $13,393 | $— | $— | $— | $13,393 |
(a) | Net cumulative unrealized appreciation (depreciation) on futures contracts are reported in the Schedule of Investments. In the Statements of Assets and Liabilities, only current day's variation margin is reported in receivables or payables and the net cumulative unrealized appreciation (depreciation) is included in accumulated earnings (loss). |
Commodity Contracts | Credit Contracts | Equity Contracts | Foreign Currency Exchange Contracts | Interest Rate Contracts | Other Contracts | Total | |
Net Realized Gain (Loss) from | |||||||
Futures contracts | $— | $— | $72,144 | $— | $— | $— | $72,144 |
Net Change in Unrealized Appreciation (Depreciation) on | |||||||
Futures contracts | $— | $— | $(40,380 ) | $— | $— | $— | $(40,380 ) |
Futures contracts: | |
Average notional value of contracts — long | $830,952 |
Level 1 | Level 2 | Level 3 | Total | |
Assets | ||||
Investments | ||||
Long-Term Investments | ||||
Common Stocks | $11,111,141 | $96,151,512 | $63,699 | $107,326,352 |
Short-Term Securities | ||||
Money Market Funds | 2,118,726 | — | — | 2,118,726 |
$13,229,867 | $96,151,512 | $63,699 | $109,445,078 | |
Derivative Financial Instruments(a) | ||||
Liabilities | ||||
Equity Contracts | $(10,225 ) | $(3,168 ) | $— | $(13,393 ) |
(a) | Derivative financial instruments are futures contracts. Futures contracts are valued at the unrealized appreciation (depreciation) on the instrument. |
iShares Environmentally Aware Real Estate ETF | iShares Global REIT ETF | iShares International Developed Real Estate ETF | |
ASSETS | |||
Investments, at value—unaffiliated(a)(b) | $8,595,718 | $3,361,166,058 | $107,326,352 |
Investments, at value—affiliated(c) | 18,212 | 19,279,462 | 2,118,726 |
Cash | 4,143 | 143,416 | 11,571 |
Cash pledged for futures contracts | 3,000 | 923,000 | 21,000 |
Foreign currency collateral pledged for futures contracts(d) | — | 189,806 | 11,865 |
Foreign currency, at value(e) | 9,182 | 2,874,413 | 80,609 |
Receivables: | |||
Investments sold | — | — | 73,142 |
Securities lending income—affiliated | 8 | 3,109 | 1,128 |
Dividends—unaffiliated | 21,387 | 7,817,777 | 625,109 |
Dividends— affiliated | 20 | 32,441 | 365 |
Tax reclaims | 641 | 1,059,247 | 205,500 |
Total assets | 8,652,311 | 3,393,488,729 | 110,475,367 |
LIABILITIES | |||
Collateral on securities loaned, at value | 8,212 | 12,099,915 | 2,072,341 |
Payables: | |||
Investments purchased | — | — | 23,754 |
Deferred foreign capital gain tax | — | 11,916 | — |
Investment advisory fees | 2,162 | 395,896 | 43,813 |
IRS compliance fee for foreign withholding tax claims | — | — | 123,871 |
Professional fees | — | — | 68,947 |
Variation margin on futures contracts | 572 | 277,723 | 7,936 |
Total liabilities | 10,946 | 12,785,450 | 2,340,662 |
Commitments and contingent liabilities | |||
NET ASSETS | $8,641,365 | $3,380,703,279 | $108,134,705 |
NET ASSETS CONSIST OF | |||
Paid-in capital | $8,978,314 | $4,000,443,481 | $257,654,380 |
Accumulated loss | (336,949) | (619,740,202) | (149,519,675) |
NET ASSETS | $8,641,365 | $3,380,703,279 | $108,134,705 |
NET ASSET VALUE | |||
Shares outstanding | 360,000 | 152,750,000 | 5,300,000 |
Net asset value | $24.00 | $22.13 | $20.40 |
Shares authorized | Unlimited | Unlimited | Unlimited |
Par value | None | None | None |
(a) Investments, at cost—unaffiliated | $8,949,714 | $3,786,957,333 | $155,811,021 |
(b) Securities loaned, at value | $7,716 | $11,394,305 | $1,959,436 |
(c) Investments, at cost—affiliated | $18,212 | $19,278,921 | $2,119,120 |
(d) Foreign currency collateral pledged, at cost | $— | $196,168 | $12,495 |
(e) Foreign currency, at cost | $9,292 | $2,894,255 | $80,564 |
iShares Environmentally Aware Real Estate ETF | iShares Global REIT ETF | iShares International Developed Real Estate ETF | |
INVESTMENT INCOME | |||
Dividends—unaffiliated | $335,245 | $129,482,156 | $5,595,946 |
Dividends—affiliated | 447 | 453,979 | 3,789 |
Interest—unaffiliated | 379 | 73,955 | 2,843 |
Securities lending income—affiliated—net | 596 | 85,689 | 36,642 |
Other income—unaffiliated | — | — | 220,976 |
Foreign taxes withheld | (16,485 ) | (5,941,513 ) | (532,804 ) |
Foreign withholding tax claims | — | — | 477,127 |
IRS compliance fee for foreign withholding tax claims | — | — | (123,872 ) |
Total investment income | 320,182 | 124,154,266 | 5,680,647 |
EXPENSES | |||
Investment advisory | 26,400 | 4,488,498 | 586,625 |
Professional | — | — | 69,815 |
Total expenses | 26,400 | 4,488,498 | 656,440 |
Net investment income | 293,782 | 119,665,768 | 5,024,207 |
REALIZED AND UNREALIZED GAIN (LOSS) | |||
Net realized gain (loss) from: | |||
Investments—unaffiliated | (18,534 ) | (37,640,266 ) | (7,750,843 ) |
Investments—affiliated | (7 ) | (3,585 ) | 74 |
Foreign currency transactions | (1,336 ) | (457,835 ) | (68,437 ) |
Futures contracts | (1,456 ) | (897,671 ) | 72,144 |
In-kind redemptions—unaffiliated(a) | — | 6,077,833 | (8,760,306 ) |
(21,333 ) | (32,921,524 ) | (16,507,368 ) | |
Net change in unrealized appreciation (depreciation) on: | |||
Investments—unaffiliated(b) | (351,883 ) | (133,503,752 ) | 7,364,604 |
Investments—affiliated | — | 1,286 | (63 ) |
Foreign currency translations | (444 ) | (142,097 ) | (13,750 ) |
Futures contracts | (3,889 ) | (1,434,949 ) | (40,380 ) |
(356,216 ) | (135,079,512 ) | 7,310,411 | |
Net realized and unrealized loss | (377,549 ) | (168,001,036 ) | (9,196,957 ) |
NET DECREASE IN NET ASSETS RESULTING FROM OPERATIONS | $(83,767 ) | $(48,335,268 ) | $(4,172,750 ) |
(a) See Note 2 of the Notes to Financial Statements. | |||
(b) Net of increase in deferred foreign capital gain tax of | $— | $(11,916 ) | $— |
iShares Environmentally Aware Real Estate ETF | iShares Global REIT ETF | |||
Year Ended 04/30/24 | Period From 11/15/22(a) to 04/30/23 | Year Ended 04/30/24 | Year Ended 04/30/23 | |
INCREASE (DECREASE) IN NET ASSETS | ||||
OPERATIONS | ||||
Net investment income | $293,782 | $157,427 | $119,665,768 | $116,427,785 |
Net realized gain (loss) | (21,333 ) | (8,617 ) | (32,921,524 ) | 7,324,697 |
Net change in unrealized appreciation (depreciation) | (356,216 ) | (1,273 ) | (135,079,512 ) | (584,908,292 ) |
Net increase (decrease) in net assets resulting from operations | (83,767 ) | 147,537 | (48,335,268 ) | (461,155,810 ) |
DISTRIBUTIONS TO SHAREHOLDERS(b) | ||||
Decrease in net assets resulting from distributions to shareholders | (343,922 ) | (56,797 ) | (108,606,050 ) | (69,453,870 ) |
CAPITAL SHARE TRANSACTIONS | ||||
Net increase in net assets derived from capital share transactions | — | 8,978,314 | 539,741,698 | 66,934,776 |
NET ASSETS | ||||
Total increase (decrease) in net assets | (427,689 ) | 9,069,054 | 382,800,380 | (463,674,904 ) |
Beginning of period | 9,069,054 | — | 2,997,902,899 | 3,461,577,803 |
End of period | $8,641,365 | $9,069,054 | $3,380,703,279 | $2,997,902,899 |
(a) | Commencement of operations. |
(b) | Distributions for annual periods determined in accordance with U.S. federal income tax regulations. |
iShares International Developed Real Estate ETF | ||
Year Ended 04/30/24 | Year Ended 04/30/23 | |
INCREASE (DECREASE) IN NET ASSETS | ||
OPERATIONS | ||
Net investment income | $5,024,207 | $6,482,421 |
Net realized loss | (16,507,368 ) | (15,189,405 ) |
Net change in unrealized appreciation (depreciation) | 7,310,411 | (20,445,849 ) |
Net decrease in net assets resulting from operations | (4,172,750 ) | (29,152,833 ) |
DISTRIBUTIONS TO SHAREHOLDERS(a) | ||
Decrease in net assets resulting from distributions to shareholders | (3,126,272 ) | (3,488,984 ) |
CAPITAL SHARE TRANSACTIONS | ||
Net decrease in net assets derived from capital share transactions | (33,075,689 ) | (31,833,293 ) |
NET ASSETS | ||
Total decrease in net assets | (40,374,711 ) | (64,475,110 ) |
Beginning of year | 148,509,416 | 212,984,526 |
End of year | $108,134,705 | $148,509,416 |
(a) | Distributions for annual periods determined in accordance with U.S. federal income tax regulations. |
iShares Environmentally Aware Real Estate ETF | ||
Year Ended 04/30/24 | Period From 11/15/22(a) to 04/30/23 | |
Net asset value, beginning of period | $25.19 | $24.94 |
Net investment income(b) | 0.82 | 0.44 |
Net realized and unrealized loss(c) | (1.05 ) | (0.03 ) |
Net increase (decrease) from investment operations | (0.23 ) | 0.41 |
Distributions from net investment income(d) | (0.96 ) | (0.16 ) |
Net asset value, end of period | $24.00 | $25.19 |
Total Return(e) | ||
Based on net asset value | (1.05 )% | 1.64 %(f) |
Ratios to Average Net Assets(g) | ||
Total expenses | 0.30 % | 0.30 %(h) |
Net investment income | 3.34 % | 3.82 %(h) |
Supplemental Data | ||
Net assets, end of period (000) | $8,641 | $9,069 |
Portfolio turnover rate(i) | 13 % | 4 % |
(a) Commencement of operations. | ||
(b) Based on average shares outstanding. | ||
(c) The amounts reported for a share outstanding may not accord with the change in aggregate gains and losses in securities for the fiscal period due to the timing of capital share transactions in relation to the fluctuating market values of the Fund’s underlying securities. | ||
(d) Distributions for annual periods determined in accordance with U.S. federal income tax regulations. | ||
(e) Where applicable, assumes the reinvestment of distributions. | ||
(f) Not annualized. | ||
(g) Excludes fees and expenses incurred indirectly as a result of investments in underlying funds. | ||
(h) Annualized. | ||
(i) Portfolio turnover rate excludes in-kind transactions, if any. | ||
iShares Global REIT ETF | |||||
Year Ended 04/30/24 | Year Ended 04/30/23 | Year Ended 04/30/22 | Year Ended 04/30/21 | Year Ended 04/30/20 | |
Net asset value, beginning of year | $23.25 | $27.77 | $27.22 | $20.42 | $26.53 |
Net investment income(a) | 0.85 | 0.94 | 0.68 | 0.66 | 0.88 |
Net realized and unrealized gain (loss)(b) | (1.20 ) | (4.89 ) | 0.74 | 6.75 | (5.54 ) |
Net increase (decrease) from investment operations | (0.35 ) | (3.95 ) | 1.42 | 7.41 | (4.66 ) |
Distributions from net investment income(c) | (0.77 ) | (0.57 ) | (0.87 ) | (0.61 ) | (1.45 ) |
Net asset value, end of year | $22.13 | $23.25 | $27.77 | $27.22 | $20.42 |
Total Return(d) | |||||
Based on net asset value | (1.50 )% | (14.12 )% | 5.14 % | 36.95 % | (18.47 )% |
Ratios to Average Net Assets(e) | |||||
Total expenses | 0.14 % | 0.14 % | 0.14 % | 0.14 % | 0.14 % |
Net investment income | 3.73 % | 3.95 % | 2.36 % | 2.91 % | 3.36 % |
Supplemental Data | |||||
Net assets, end of year (000) | $3,380,703 | $2,997,903 | $3,461,578 | $3,083,221 | $1,900,334 |
Portfolio turnover rate(f) | 6 % | 7 % | 13 % | 6 % | 8 % |
(a) Based on average shares outstanding. | |||||
(b) The amounts reported for a share outstanding may not accord with the change in aggregate gains and losses in securities for the fiscal period due to the timing of capital share transactions in relation to the fluctuating market values of the Fund’s underlying securities. | |||||
(c) Distributions for annual periods determined in accordance with U.S. federal income tax regulations. | |||||
(d) Where applicable, assumes the reinvestment of distributions. | |||||
(e) Excludes fees and expenses incurred indirectly as a result of investments in underlying funds. | |||||
(f) Portfolio turnover rate excludes in-kind transactions, if any. | |||||
iShares International Developed Real Estate ETF | |||||
Year Ended 04/30/24 | Year Ended 04/30/23 | Year Ended 04/30/22 | Year Ended 04/30/21 | Year Ended 04/30/20 | |
Net asset value, beginning of year | $21.52 | $25.36 | $28.82 | $22.75 | $29.65 |
Net investment income(a) | 0.83 (b) | 0.83 | 0.79 (b) | 0.78 | 0.86 |
Net realized and unrealized gain (loss)(c) | (1.44 ) | (4.25 ) | (3.35 ) | 5.86 | (5.47 ) |
Net increase (decrease) from investment operations | (0.61 ) | (3.42 ) | (2.56 ) | 6.64 | (4.61 ) |
Distributions from net investment income(d) | (0.51 ) | (0.42 ) | (0.90 ) | (0.57 ) | (2.29 ) |
Net asset value, end of year | $20.40 | $21.52 | $25.36 | $28.82 | $22.75 |
Total Return(e) | |||||
Based on net asset value | (2.77 )%(b) | (13.44 )% | (9.24 )%(b) | 29.62 % | (16.93 )% |
Ratios to Average Net Assets(f) | |||||
Total expenses | 0.54 % | 0.48 % | 0.50 % | 0.48 % | 0.48 % |
Total expenses excluding professional fees for foreign withholding tax claims | 0.48 % | N/A | 0.48 % | 0.48 % | N/A |
Net investment income | 4.11 %(b) | 3.82 % | 2.75 %(b) | 3.08 % | 2.99 % |
Supplemental Data | |||||
Net assets, end of year (000) | $108,135 | $148,509 | $212,985 | $256,514 | $259,384 |
Portfolio turnover rate(g) | 13 % | 9 % | 16 % | 9 % | 10 % |
(a) Based on average shares outstanding. | |||||
(b) Reflects the positive effect of foreign withholding tax claims, net of the associated professional fees, which resulted in the following increases for the years ended April 30, 2024 and April 30, 2022 respectively: • Net investment income per share by $0.07 and $0.04. • Total return by 0.37% and 0.17%. • Ratio of net investment income to average net assets by 0.33% and 0.15%. | |||||
(c) The amounts reported for a share outstanding may not accord with the change in aggregate gains and losses in securities for the fiscal period due to the timing of capital share transactions in relation to the fluctuating market values of the Fund’s underlying securities. | |||||
(d) Distributions for annual periods determined in accordance with U.S. federal income tax regulations. | |||||
(e) Where applicable, assumes the reinvestment of distributions. | |||||
(f) Excludes fees and expenses incurred indirectly as a result of investments in underlying funds. | |||||
(g) Portfolio turnover rate excludes in-kind transactions, if any. | |||||
iShares ETF | Diversification Classification |
Environmentally Aware Real Estate | Non-Diversified |
Global REIT | Diversified |
International Developed Real Estate | Diversified |
iShares ETF and Counterparty | Securities Loaned at Value | Cash Collateral Received(a) | Non-Cash Collateral Received, at Fair Value(a) | Net Amount |
Environmentally Aware Real Estate | ||||
Goldman Sachs & Co. LLC | $7,716 | $(7,716) | $— | $— |
Global REIT | ||||
BofA Securities, Inc. | $335,203 | $(335,203) | $— | $— |
Citigroup Global Markets, Inc. | 81,408 | (81,408) | — | — |
Goldman Sachs & Co. LLC | 840,755 | (840,755) | — | — |
HSBC Bank PLC | 33,210 | (33,210) | — | — |
J.P. Morgan Securities LLC | 641,906 | (641,906) | — | — |
Jefferies LLC | 699,162 | (699,162) | — | — |
Morgan Stanley | 7,836,824 | (7,836,824) | — | — |
National Financial Services LLC | 925,837 | (925,837) | — | — |
$11,394,305 | $(11,394,305) | $— | $— | |
International Developed Real Estate | ||||
BofA Securities, Inc. | $852,031 | $(852,031) | $— | $— |
Goldman Sachs & Co. LLC | 318,196 | (318,196) | — | — |
J.P. Morgan Securities LLC | 41,117 | (41,117) | — | — |
Morgan Stanley | 664,476 | (664,476) | — | — |
SG Americas Securities LLC | 2,885 | (2,885) | — | — |
State Street Bank & Trust Co. | 80,731 | (80,731) | — | — |
$1,959,436 | $(1,959,436) | $— | $— |
(a) | Collateral received, if any, in excess of the market value of securities on loan is not presented in this table. The total cash collateral received by each Fund is disclosed in the Fund’s Statements of Assets and Liabilities. |
iShares ETF | Investment Advisory Fees |
Environmentally Aware Real Estate | 0.30% |
Global REIT | 0.14 |
International Developed Real Estate | 0.48 |
iShares ETF | Amounts |
Environmentally Aware Real Estate | $139 |
Global REIT | 19,263 |
International Developed Real Estate | 8,360 |
iShares ETF | Purchases | Sales | Net Realized Gain (Loss) |
Global REIT | $10,414,686 | $55,703,553 | $(10,400,682) |
International Developed Real Estate | 136,591 | 835,434 | (376,650) |
iShares ETF | Purchases | Sales |
Environmentally Aware Real Estate | $1,174,834 | $1,181,289 |
Global REIT | 296,677,097 | 193,842,723 |
International Developed Real Estate | 16,393,967 | 15,959,783 |
iShares ETF | In-kind Purchases | In-kind Sales |
Global REIT | $494,316,481 | $30,386,037 |
International Developed Real Estate | — | 31,209,928 |
iShares ETF | Paid-in Capital | Accumulated Earnings (Loss) |
Global REIT | $5,855,184 | $ (5,855,184) |
International Developed Real Estate | (9,795,631) | 9,795,631 |
iShares ETF | Year Ended 04/30/24 | Period Ended 04/30/23 |
Environmentally Aware Real Estate | ||
Ordinary income | $343,922 | $56,797 |
iShares ETF | Year Ended 04/30/24 | Year Ended 04/30/23 |
Global REIT | ||
Ordinary income | $108,606,050 | $69,453,870 |
International Developed Real Estate | ||
Ordinary income | $3,126,272 | $3,488,984 |
iShares ETF | Undistributed Ordinary Income | Non-expiring Capital Loss Carryforwards(a) | Net Unrealized Gains (Losses)(b) | Total |
Environmentally Aware Real Estate | $61,685 | $(20,336) | $(378,298) | $(336,949) |
Global REIT | 22,672,874 | (176,009,729) | (466,403,347) | (619,740,202) |
International Developed Real Estate | 1,302,073 | (100,302,431) | (50,519,317) | (149,519,675) |
(a) | Amounts available to offset future realized capital gains. |
(b) | The difference between book-basis and tax-basis net unrealized gains (losses) was attributable primarily to the tax deferral of losses on wash sales, the realization for tax purposes of unrealized gains (losses) on certain futures contracts, the timing and recognition of partnership income, the characterization of corporate actions, the realization for tax purposes of unrealized gains on investments in passive foreign investment companies and the timing and recognition of realized gains/losses for tax purposes. |
iShares ETF | Tax Cost | Gross Unrealized Appreciation | Gross Unrealized Depreciation | Net Unrealized Appreciation (Depreciation) |
Environmentally Aware Real Estate | $8,991,343 | $467,647 | $(845,060) | $(377,413) |
Global REIT | 3,846,391,169 | 118,588,074 | (584,597,536) | (466,009,462) |
International Developed Real Estate | 159,945,838 | 1,258,650 | (51,760,303) | (50,501,653) |
Year Ended 04/30/24 | Period Ended 04/30/23 | |||
iShares ETF | Shares | Amount | Shares | Amount |
Environmentally Aware Real Estate(a) | ||||
Shares sold | — | $— | 360,000 | $8,978,314 |
Year Ended 04/30/24 | Year Ended 04/30/23 | |||
iShares ETF | Shares | Amount | Shares | Amount |
Global REIT | ||||
Shares sold | 25,250,000 | $572,252,440 | 14,400,000 | $325,705,239 |
Shares redeemed | (1,450,000 ) | (32,510,742 ) | (10,100,000 ) | (258,770,463 ) |
23,800,000 | $539,741,698 | 4,300,000 | $66,934,776 | |
International Developed Real Estate | ||||
Shares sold | — | $438 | 200,000 | $4,481,991 |
Shares redeemed | (1,600,000 ) | (33,076,127 ) | (1,700,000 ) | (36,315,284 ) |
(1,600,000 ) | $(33,075,689 ) | (1,500,000 ) | $(31,833,293 ) | |
(a) | The Fund commenced operations on November 15, 2022. |
iShares Trust and Shareholders of each of the three funds listed in the table below
iShares Environmentally Aware Real Estate ETF(1) |
iShares Global REIT ETF(2) |
iShares International Developed Real Estate ETF(2) |
Basis for Opinions
Philadelphia, Pennsylvania
June 24, 2024
iShares ETF | Qualified Dividend Income |
Environmentally Aware Real Estate | $78,532 |
Global REIT | 25,694,637 |
International Developed Real Estate | 2,676,547 |
iShares ETF | Qualified Business Income |
Environmentally Aware Real Estate | $147,578 |
Global REIT | 71,940,655 |
iShares ETF | Foreign Source Income Earned |
International Developed Real Estate | $5,595,949 |
Interested Trustees | |||
Name (Year of Birth) | Position(s) | Principal Occupation(s) During Past 5 Years | Other Directorships Held by Trustee |
Robert S. Kapito(a) (1957) | Trustee (since 2009). | President of BlackRock, Inc. (since 2006); Vice Chairman of BlackRock, Inc. and Head of BlackRock’s Portfolio Management Group (since its formation in 1998) and BlackRock, Inc.’s predecessor entities (since 1988); Trustee, University of Pennsylvania (since 2009); President of Board of Directors, Hope & Heroes Children’s Cancer Fund (since 2002). | Director of BlackRock, Inc. (since 2006); Director of iShares, Inc. (since 2009); Trustee of iShares U.S. ETF Trust (since 2011). |
Stephen Cohen(b) (1975) | Trustee (since 2024). | Senior Managing Director, Head of Global Product Solutions of BlackRock, Inc. (since 2024); Senior Managing Director, Head of Europe, Middle East and Africa Regions of BlackRock, Inc. (2021-2024); Head of iShares Index and Wealth in EMEA of BlackRock, Inc. (2017-2021); Global Head of Fixed Income Indexing of BlackRock, Inc. (2016-2017); Chief Investment Strategist for International Fixed Income and iShares of BlackRock, Inc. (2011-2015). | Director of iShares, Inc. (since 2024); Trustee of iShares U.S. ETF Trust (since 2024). |
(a) Robert S. Kapito is deemed to be an “interested person” (as defined in the 1940 Act) of the Trust due to his affiliations with BlackRock, Inc. and its affiliates. | |||
(b) Stephen Cohen is deemed to be an "interested person" (as defined in the 1940 Act) of the Trust due to his affiliations with BlackRock, Inc. and its affiliates. | |||
Independent Trustees | |||
Name (Year of Birth) | Position(s) | Principal Occupation(s) During Past 5 Years | Other Directorships Held by Trustee |
John E. Kerrigan (1955) | Trustee (since 2005); Independent Board Chair (since 2022). | Chief Investment Officer, Santa Clara University (since 2002). | Director of iShares, Inc. (since 2005); Trustee of iShares U.S. ETF Trust (since 2011); Independent Board Chair of iShares, Inc. and iShares U.S. ETF Trust (since 2022). |
Jane D. Carlin (1956) | Trustee (since 2015); Risk Committee Chair (since 2016). | Consultant (since 2012); Member of the Audit Committee (2012-2018), Chair of the Nominating and Governance Committee (2017-2018) and Director of PHH Corporation (mortgage solutions) (2012-2018); Managing Director and Global Head of Financial Holding Company Governance & Assurance and the Global Head of Operational Risk Management of Morgan Stanley (2006-2012). | Director of iShares, Inc. (since 2015); Trustee of iShares U.S. ETF Trust (since 2015); Member of the Audit Committee (since 2016), Chair of the Audit Committee (since 2020) and Director of The Hanover Insurance Group, Inc. (since 2016). |
Richard L. Fagnani (1954) | Trustee (since 2017); Audit Committee Chair (since 2019). | Partner, KPMG LLP (2002-2016); Director of One Generation Away (since 2021). | Director of iShares, Inc. (since 2017); Trustee of iShares U.S. ETF Trust (since 2017). |
Laura F. Fergerson (1962) | Trustee since (2024). | President, Franklin Templeton Services, LLC (2017-2024); Director of the Board of Crocker Art Museum Association (since 2019); President, Crocker Art Museum Foundation (2022-2023). | Director of iShares, Inc. (since 2024); Trustee of iShares U.S. ETF Trust (since 2024). |
Independent Trustees (continued) | |||
Name (Year of Birth) | Position(s) | Principal Occupation(s) During Past 5 Years | Other Directorships Held by Trustee |
Cecilia H. Herbert (1949) | Trustee (since 2005); Nominating and Governance and Equity Plus Committee Chairs (since 2022). | Chair of the Finance Committee (since 2019) and Trustee and Member of the Finance, Audit and Quality Committees of Stanford Health Care (since 2016); Trustee of WNET, New York’s public media company (since 2011) and Member of the Audit Committee (since 2018), Investment Committee (since 2011) and Personnel Committee (since 2022); Member of the Wyoming State Investment Funds Committee (since 2022); Trustee of Forward Funds (14 portfolios) (2009-2018); Trustee of Salient MF Trust (4 portfolios) (2015-2018); Director of the Jackson Hole Center for the Arts (since 2021). | Director of iShares, Inc. (since 2005); Trustee of iShares U.S. ETF Trust (since 2011). |
James Lam (1961) | Trustee (since 2024). | President, James Lam & Associates, Inc. (since 2002); Director of the FAIR Institute (since 2020); adjunct professor at Carnegie Mellon University (since 2018); Member, Zicklin School of Business Dean's Council of Baruch College (since 2017); Director and Audit Committee Chair of RiskLens, Inc. (2018-2023); Director, Risk Oversight Committee Chair and Audit Committee Member of E*TRADE Financial and E*TRADE Bank (2012-2020). | Director of iShares, Inc. (since 2024); Trustee of iShares U.S. ETF Trust (since 2024). |
Drew E. Lawton (1959) | Trustee (since 2017); 15(c) Committee Chair (since 2017). | Senior Managing Director of New York Life Insurance Company (2010-2015). | Director of iShares, Inc. (since 2017); Trustee of iShares U.S. ETF Trust (since 2017); Director of Jackson Financial Inc. (since 2021). |
John E. Martinez (1961) | Trustee (since 2003); Securities Lending Committee Chair (since 2019). | Director of Real Estate Equity Exchange, Inc. (since 2005); Director of Cloudera Foundation (2017-2020); and Director of Reading Partners (2012-2016). | Director of iShares, Inc. (since 2003); Trustee of iShares U.S. ETF Trust (since 2011). |
Madhav V. Rajan (1964) | Trustee (since 2011); Fixed-Income Plus Committee Chair (since 2019). | Dean, and George Pratt Shultz Professor of Accounting, University of Chicago Booth School of Business (since 2017); Advisory Board Member (since 2016) and Director (since 2020) of C.M. Capital Corporation; Chair of the Board for the Center for Research in Security Prices, LLC (since 2020); Director of WellBe Senior Medical (since 2023); Robert K. Jaedicke Professor of Accounting, Stanford University Graduate School of Business (2001-2017); Professor of Law (by courtesy), Stanford Law School (2005-2017); Senior Associate Dean for Academic Affairs and Head of MBA Program, Stanford University Graduate School of Business (2010-2016). | Director of iShares, Inc. (since 2011); Trustee of iShares U.S. ETF Trust (since 2011). |
Officers | ||
Name (Year of Birth) | Position(s) | Principal Occupation(s) During Past 5 Years |
Jessica Tan (1980) | President (since 2024). | Managing Director of BlackRock, Inc. (since 2015); Head of Global Product Solutions, Americas of BlackRock, Inc. (since 2024) and Head of Sustainable and Transition Solutions of BlackRock, Inc. (2022-2024); Global Head of Corporate Strategy of BlackRock, Inc. (2019-2022); Chief of Staff to the CEO of BlackRock, Inc. (2017-2019). |
Trent Walker (1974) | Treasurer and Chief Financial Officer (since 2020). | Managing Director of BlackRock, Inc. (since 2019); Chief Financial Officer of iShares Delaware Trust Sponsor LLC, BlackRock Funds, BlackRock Funds II, BlackRock Funds IV, BlackRock Funds V and BlackRock Funds VI (since 2021). |
Aaron Wasserman (1974) | Chief Compliance Officer (iShares, Inc. and iShares Trust, since 2023; iShares U.S. ETF Trust, since 2023). | Managing Director of BlackRock, Inc. (since 2018); Chief Compliance Officer of the BlackRock Multi-Asset Complex, the BlackRock Fixed-Income Complex and the iShares Complex (since 2023); Deputy Chief Compliance Officer for the BlackRock Multi-Asset Complex, the BlackRock Fixed-Income Complex and the iShares Complex (2014-2023). |
Marisa Rolland (1980) | Secretary (since 2022). | Managing Director of BlackRock, Inc. (since 2023); Director of BlackRock, Inc. (2018-2022). |
Officers (continued) | ||
Name (Year of Birth) | Position(s) | Principal Occupation(s) During Past 5 Years |
Rachel Aguirre (1982) | Executive Vice President (since 2022). | Managing Director of BlackRock, Inc. (since 2018); Head of U.S. iShares Product (since 2022); Head of EII U.S. Product Engineering of BlackRock, Inc. (since 2021); Co-Head of EII’s Americas Portfolio Engineering of BlackRock, Inc. (2020-2021); Head of Developed Markets Portfolio Engineering of BlackRock, Inc. (2016-2019). |
Jennifer Hsui (1976) | Executive Vice President (since 2022). | Managing Director of BlackRock, Inc. (since 2009); Co-Head of Index Equity of BlackRock, Inc. (since 2022). |
James Mauro (1970) | Executive Vice President (since 2022). | Managing Director of BlackRock, Inc. (since 2010); Head of Fixed Income Index Investments in the Americas and Head of San Francisco Core Portfolio Management of BlackRock, Inc. (since 2020). |
Effective July 1, 2023, Aaron Wasserman replaced Charles Park as Chief Compliance Officer. |
Effective February 1, 2024, Salim Ramji resigned as Trustee of the Trust. |
Effective March 5, 2024, Stephen Cohen replaced Salim Ramji as Trustee of the Trust. |
Effective March 5, 2024, Dominik Rohé resigned as President of the Trust. |
Effective March 5, 2024, Jessica Tan replaced Dominik Rohé as President of the Trust. |
Effective April 8, 2024, Laura Fergerson was appointed as Trustee of the Trust. |
Effective April 8, 2024, James Lam was appointed as Trustee of the Trust. |
• If your brokerage firm is not listed, electronic delivery may not be available. Please contact your broker-dealer or financial advisor.
Portfolio Abbreviation | |
NVS | Non-Voting Shares |
REIT | Real Estate Investment Trust |


(b) Not Applicable
| Item 2. | Code of Ethics. |
The registrant has adopted a code of ethics, as of the end of the period covered by this report, applicable to the registrant’s principal executive officer, principal financial officer, principal accounting officer or controller, or persons performing similar functions. During the period covered by this report, the registrant has not amended the code of ethics and there have been no waivers granted under the code of ethics. The registrant undertakes to provide a copy of the code of ethics to any person upon request, without charge, by calling 1-800-474-2737.
| Item 3. | Audit Committee Financial Expert. |
The registrant’s Board of Trustees has determined that the registrant has more than one audit committee financial expert, as that term is defined under Item 3(b) and 3(c), serving on its audit committee. The audit committee financial experts serving on the registrant’s audit committee are Richard L. Fagnani and Madhav V. Rajan, all of whom are independent, as that term is defined under Item 3(a)(2).
| Item 4. | Principal Accountant Fees and Services. |
The principal accountant fees disclosed in items 4(a), 4(b), 4(c), 4(d) and 4(g) are for the five series of the registrant for which the fiscal year-end is April 30, 2024 (the “Funds”), and whose annual financial statements are reported in Item 1.
(a) Audit Fees – The aggregate fees billed for each of the last two fiscal years for professional services rendered by the principal accountant for the audit of the Funds’ annual financial statements or services that are normally provided by the accountant in connection with statutory and regulatory filings or engagements for those fiscal years were $81,400 for the fiscal year ended April 30, 2023 and $83,000 for the fiscal year ended April 30, 2024.
(b) Audit-Related Fees – There were no fees billed for the fiscal years ended April 30, 2023 and April 30, 2024 for assurance and related services by the principal accountant that were reasonably related to the performance of the audit of the Fund’s financial statements and are not reported under (a) of this Item.
(c) Tax Fees – The aggregate fees billed in each of the last two fiscal years for professional services rendered by the principal accountant for tax compliance, tax advice and tax planning for the Funds were $48,500 for the fiscal year ended April 30, 2023 and $48,500 for the fiscal year ended April 30, 2024. These services related to the review of the Funds’ tax returns and excise tax calculations.
(d) All Other Fees – There were no other fees billed in each of the fiscal years ended April 30, 2023 and April 30, 2024 for products and services provided by the principal accountant, other than the services reported in (a) through (c) of this Item.
(e) (1) The registrant’s audit committee charter, as amended, provides that the audit committee is responsible for the approval, prior to appointment, of the engagement of the principal accountant to annually audit and provide their opinion on the registrant’s financial statements. The audit committee must also approve, prior to appointment, the engagement of the principal accountant to provide non-audit services to the registrant or to any entity controlling, controlled by or under common control with the registrant’s investment adviser (“Adviser Affiliate”) that provides ongoing services to the registrant, if the engagement relates directly to the operations and financial reporting of the registrant.
(2) There were no services described in (b) through (d) above that were approved by the audit committee pursuant to paragraph (c)(7)(i)(C) of Rule 2-01 of Regulation S-X.
(f) Not Applicable
(g) The aggregate non-audit fees billed by the registrant’s principal accountant for services rendered to the Funds, and rendered to the registrant’s investment adviser, and any Adviser Affiliate that provides ongoing services to the registrant for the last two fiscal years were $48,500 for the fiscal year ended April 30, 2023 and $48,500 for the fiscal year ended April 30, 2024.
(h) The registrant’s audit committee has considered whether the provision of non-audit services rendered to the registrant’s investment adviser and any Adviser Affiliate that provides ongoing services to the registrant that were not pre-approved pursuant to paragraph (c)(7)(ii) of Rule 2-01 of Regulation S-X, if any, is compatible with maintaining the principal accountant’s independence, and has determined that the provision of these services, if any, does not compromise the principal accountant’s independence.
(i) Not Applicable
(j) Not Applicable
| Item 5. | Audit Committee of Listed Registrants. |
(a) The registrant is a listed issuer as defined in Rule 10A-3 under the Exchange Act of 1934 and has a separately-designated standing audit committee established in accordance with Section 3(a)(58)(A) of the Exchange Act of 1934. The registrant’s audit committee members are Richard L. Fagnani, Cecilia H. Herbert and Madhav V. Rajan.
(b) Not applicable.
| Item 6. | Investments. |
(a) Schedules of investments are included as part of the reports to shareholders filed under Item 1 of this Form.
(b) Not applicable.
| Item 7. | Disclosure of Proxy Voting Policies and Procedures for Closed-End Management Investment Companies. |
Not applicable to the registrant.
| Item 8. | Portfolio Managers of Closed-End Management Investment Companies. |
Not applicable to the registrant.
| Item 9. | Purchases of Equity Securities by Closed-End Management Investment Company and Affiliated Purchasers. |
Not applicable to the registrant.
| Item 10. | Submission of Matters to a Vote of Security Holders. |
There were no material changes to the procedures by which shareholders may recommend nominees to the registrant’s Board of Trustees.
| Item 11. | Controls and Procedures. |
(a) The President (the registrant’s Principal Executive Officer) and Treasurer and Chief Financial Officer (the registrant’s Principal Financial Officer) have concluded that the registrant’s disclosure controls and procedures (as defined in Rule 30a-3(c) under the Investment Company Act of 1940) are effective as of a date within 90 days of the filing date of this report, based on their evaluation of these controls and procedures required by Rule 30a-3(b) under the Investment Company Act of 1940 and Rules 13a-15(b) or 15d-15(b) under the Exchange Act of 1934.
(b) There were no changes in the registrant’s internal control over financial reporting (as defined in Rule 30a-3(d) under the Investment Company Act of 1940) that occurred during the period covered by this report that have materially affected, or are reasonably likely to materially affect, the registrant’s internal control over financial reporting.
| Item 12. | Disclosure of Securities Lending Activities for Closed-End Management Investment Companies. |
Not applicable to the registrant.
| Item 13. | Recovery of Erroneously Awarded Compensation. |
Not applicable
| Item 14. | Exhibits. |
(a)(1) Code of Ethics – See Item 2
(a)(2) Any policy required by the listing standards adopted pursuant to Rule 10D-1 under the Exchange Act (17 CFR 240.10D-1) by the registered national securities exchange or registered national securities association upon which the Registrant’s securities are listed – Not Applicable
(a)(3) Section 302 Certifications are attached
(a)(4) Any written solicitation to purchase securities under Rule 23c-1 – Not Applicable
(a)(5) Change in Registrant’s independent public accountant – Not Applicable
(b) Section 906 Certifications are attached
SIGNATURES
Pursuant to the requirements of the Securities Exchange Act of 1934 and the Investment Company Act of 1940, the registrant has duly caused this report to be signed on its behalf by the undersigned, thereunto duly authorized.
iShares Trust
By: | /s/ Jessica Tan | |||
Jessica Tan, President (Principal Executive Officer) |
Date: June 24, 2024
Pursuant to the requirements of the Securities Exchange Act of 1934 and the Investment Company Act of 1940, this report has been signed below by the following persons on behalf of the registrant and in the capacities and on the dates indicated.
By: | /s/ Jessica Tan | |||
Jessica Tan, President (Principal Executive Officer) |
Date: June 24, 2024
By: | /s/ Trent Walker | |||
Trent Walker, Treasurer and Chief Financial Officer (Principal Financial Officer) |
Date: June 24, 2024