Exhibit 99.1
Link to searchable text of Slide 1
Link to searchable text of Slide 2
Link to searchable text of Slide 3
Link to searchable text of Slide 4
Link to searchable text of Slide 5
Link to searchable text of Slide 6
Link to searchable text of Slide 7
Link to searchable text of Slide 8
Link to searchable text of Slide 9
Link to searchable text of Slide 10
Link to searchable text of Slide 11
Link to searchable text of Slide 12
Link to searchable text of Slide 13
Link to searchable text of Slide 14
Link to searchable text of Slide 15
Link to searchable text of Slide 16
Link to searchable text of Slide 17
Link to searchable text of Slide 18
Link to searchable text of Slide 19
Link to searchable text of Slide 20
Link to searchable text of Slide 21
Link to searchable text of Slide 22
Link to searchable text of Slide 23
Link to searchable text of Slide 24

Link to searchable text of Slide 25
Link to searchable text of Slide 26
Link to searchable text of Slide 27
Link to searchable text of Slide 28
Link to searchable text of Slide 29
Link to searchable text of Slide 30
Link to searchable text of Slide 31

Link to searchable text of Slide 32
Link to searchable text of Slide 33
Link to searchable text of Slide 34
Link to searchable text of Slide 35
Link to searchable text of Slide 36
Link to searchable text of Slide 37
Link to searchable text of Slide 38
Link to searchable text of Slide 39

Link to searchable text of Slide 40
Link to searchable text of Slide 41
Link to searchable text of Slide 42
Searchable text section of graphics shown above
Exhibit 99.1
[CHARLES RIVER LABORATORIES LOGO]
Contributing to the Search for Healthier LivesTM
COMPANY OVERVIEW
SAFE HARBOR STATEMENT
This presentation includes “forward-looking statements” within the meaning of the Private Securities Litigation Reform Act of 1995. Forward-looking statements may be identified by the use of words such as “anticipate,” “believe,” “expect,” “estimate,” “plan,” and “project” and other similar expressions that predict or indicate future events or trends or that are not statements of historical matters. These statements are based on management’s current expectations, and involve a number of risks and uncertainties that could cause actual results to differ materially from those stated or implied by the forward-looking statements, and the Company expressly does not undertake any duty to update forward-looking statements, which speak only as of the date of this document. Those risks and uncertainties include, but are not limited to: a decrease in pre-clinical research and development spending or a decrease in the level of outsourced services; acquisition integration risks; special interest groups; contaminations; industry trends; new displacement technologies; outsourcing trends; USDA and FDA regulations; changes in law; continued availability of products and supplies; loss of key personnel; interest rate and foreign currency exchange rate fluctuations; changes in generally accepted accounting principles; and any changes in business, political, or economic conditions due to the threat of future terrorist activity in the U.S. and other parts of the world, and related U.S. military action overseas. A further description of these risks, uncertainties, and other matters can be found in the Risk Factors detailed in the Company’s Annual Report on Form 10-K as filed on March 20, 2003, with the Securities an d Exchange Commission.
2
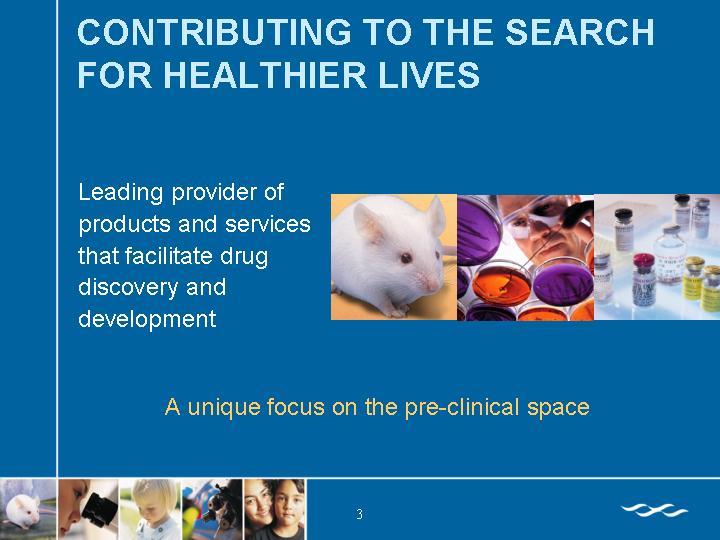
CONTRIBUTING TO THE SEARCH FOR HEALTHIER LIVES
Leading provider of products and services that facilitate drug discovery and development
[GRAPHIC]
A unique focus on the pre-clinical space
3
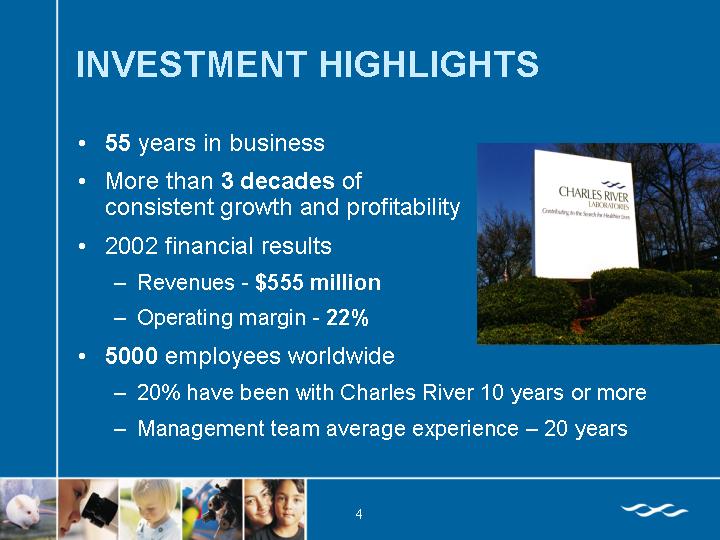
INVESTMENT HIGHLIGHTS
• 55 years in business
• More than 3 decades of consistent growth and profitability
• 2002 financial results
• Revenues - - $555 million
• Operating margin - 22%
• 5000 employees worldwide
• 20% have been with Charles River 10 years or more
• Management team average experience — 20 years
[GRAPHIC]
4
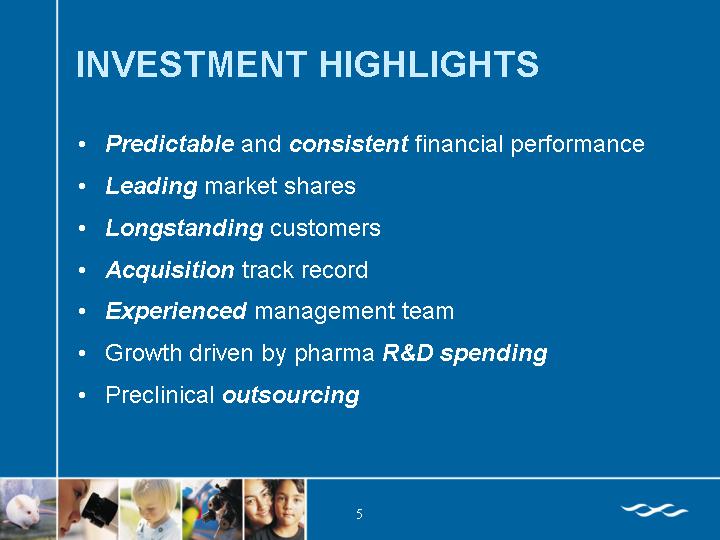
INVESTMENT HIGHLIGHTS
• Predictable and consistent financial performance
• Leading market shares
• Longstanding customers
• Acquisition track record
• Experienced management team
• Growth driven by pharma R&D spending
• Preclinical outsourcing
5
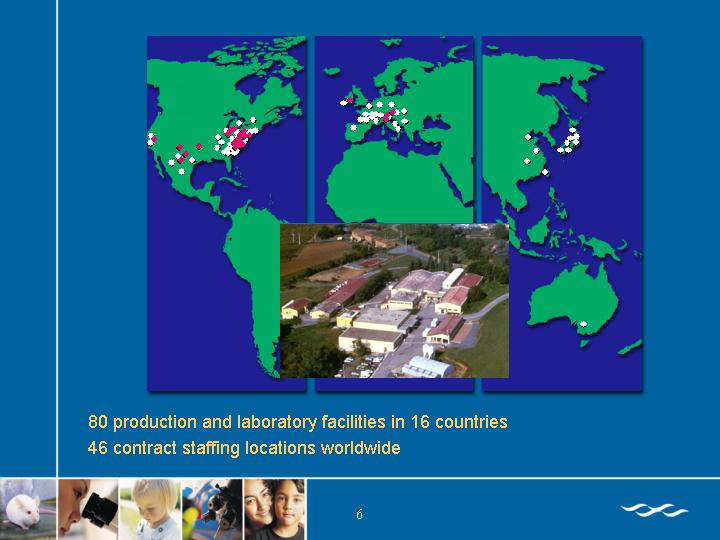
[GRAPHIC]
80 production and laboratory facilities in 16 countries
46 contract staffing locations worldwide
6
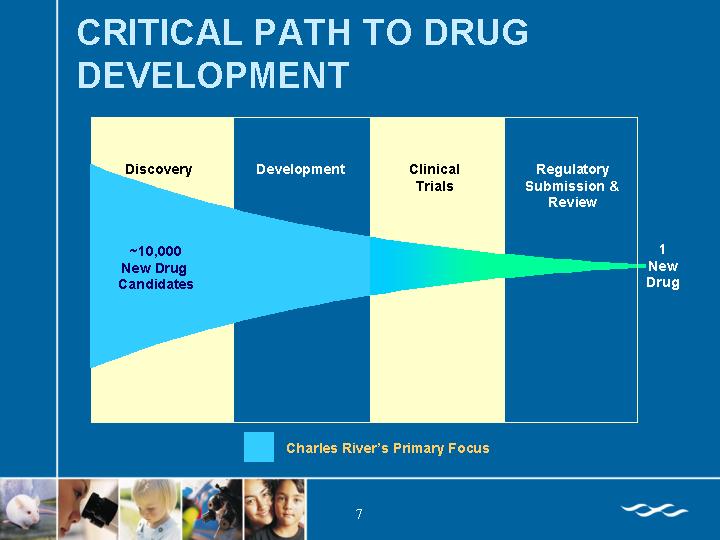
CRITICAL PATH TO DRUG DEVELOPMENT
[CHART]
7
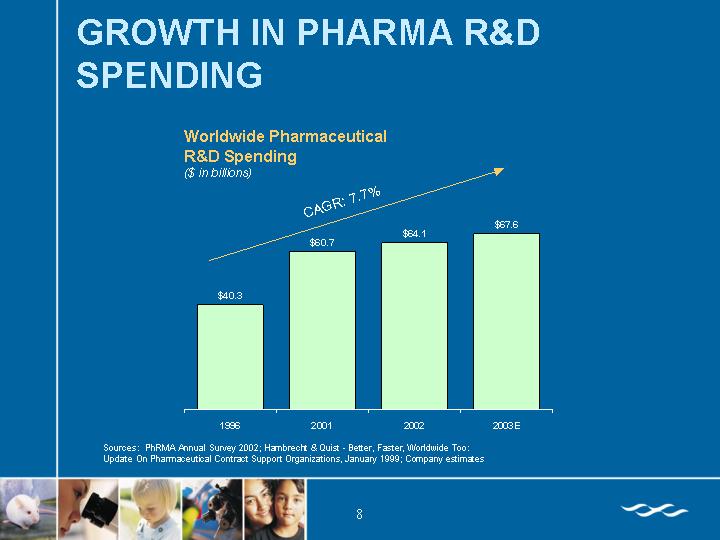
GROWTH IN PHARMA R&D SPENDING
Worldwide Pharmaceutical
R&D Spending
($ in billions)
[CHART]
Sources: PhRMA Annual Survey 2002; Hambrecht & Quist - Better, Faster, Worldwide Too:
Update On Pharmaceutical Contract Support Organizations, January 1999; Company estimates
8
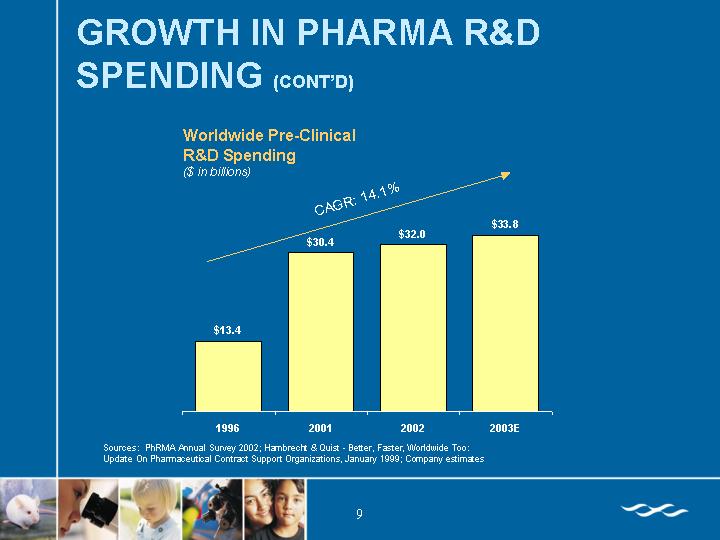
Worldwide Pre-Clinical
R&D Spending
($ in billions)
[CHART]
Sources: PhRMA Annual Survey 2002; Hambrecht & Quist - Better, Faster, Worldwide Too:
Update On Pharmaceutical Contract Support Organizations, January 1999; Company estimates
9
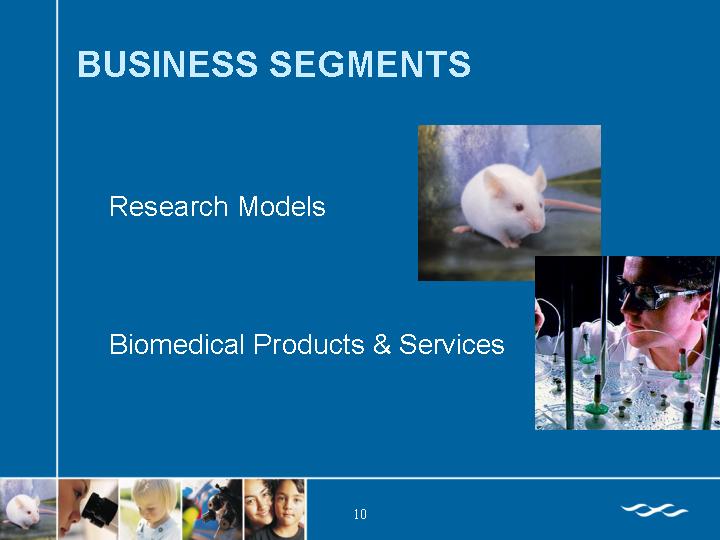
BUSINESS SEGMENTS
Research Models
Biomedical Products & Services
[GRAPHIC]
10
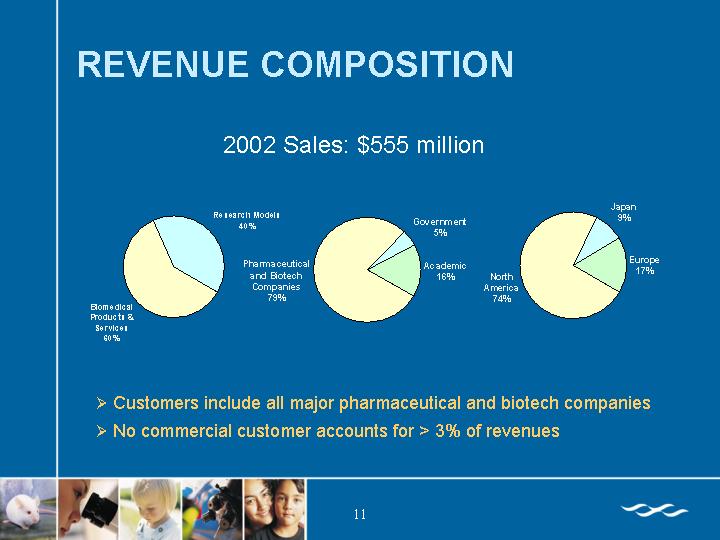
REVENUE COMPOSITION
2002 Sales: $555 million
[CHART]
• Customers include all major pharmaceutical and biotech companies
• No commercial customer accounts for > 3% of revenues
11
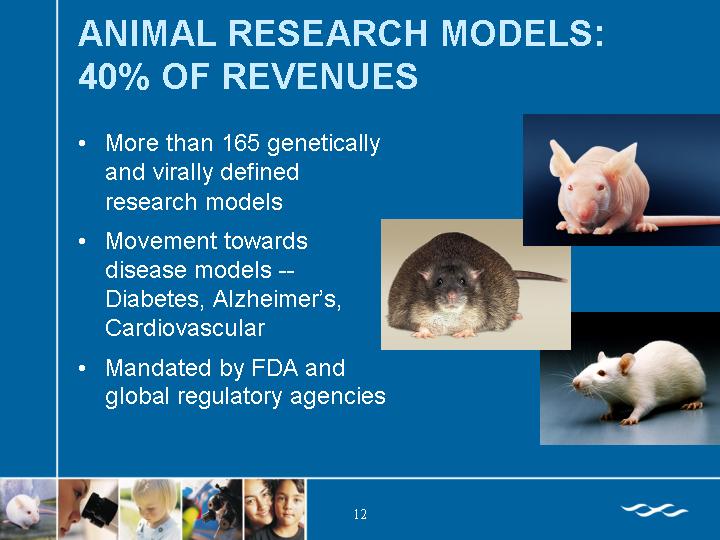
ANIMAL RESEARCH MODELS: 40% OF REVENUES
• More than 165 genetically and virally defined research models
• Movement towards disease models — Diabetes, Alzheimer’s, Cardiovascular
• Mandated by FDA and global regulatory agencies
[GRAPHIC]
12
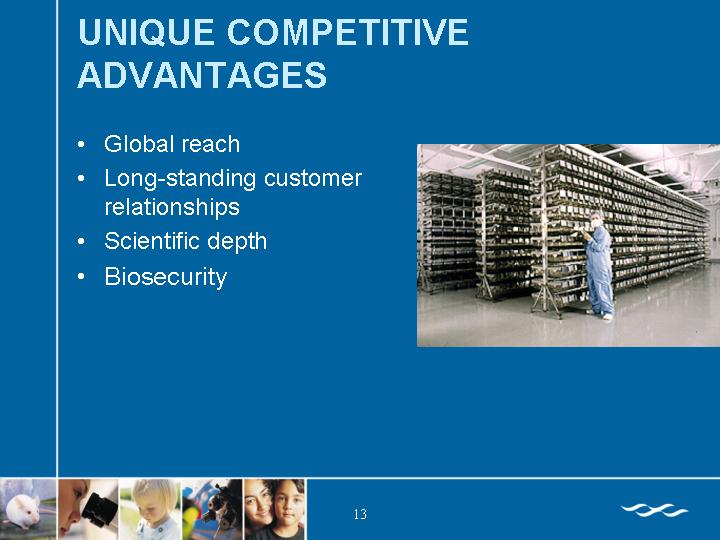
UNIQUE COMPETITIVE ADVANTAGES
• Global reach
• Long-standing customer relationships
• Scientific depth
• Biosecurity
[GRAPHIC]
13
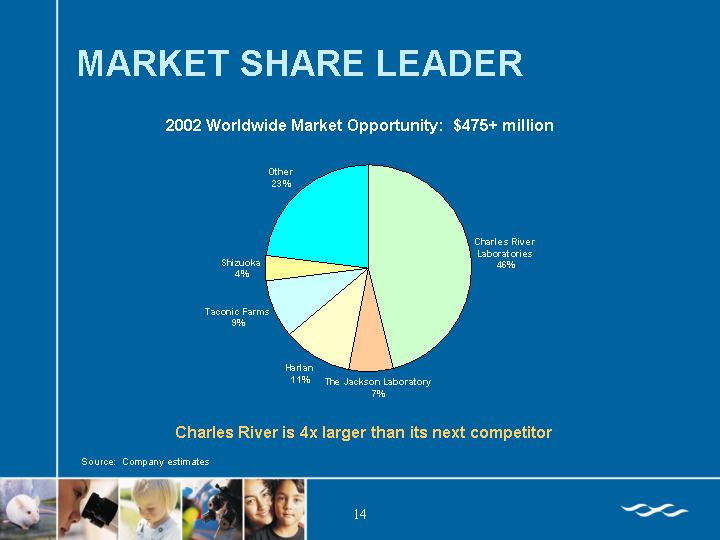
MARKET SHARE LEADER
2002 Worldwide Market Opportunity: $475+ million
[CHART]
Charles River is 4x larger than its next competitor
Source: Company estimates
14
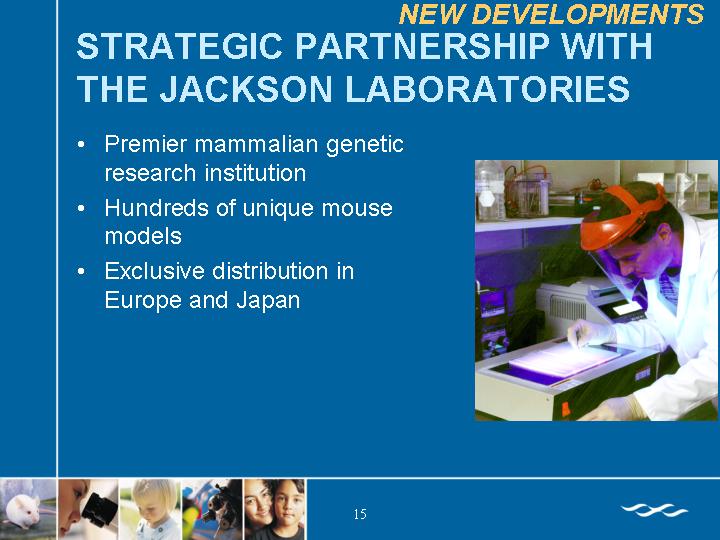
NEW DEVELOPMENTS
STRATEGIC PARTNERSHIP WITH THE JACKSON LABORATORIES
• Premier mammalian genetic research institution
• Hundreds of unique mouse models
• Exclusive distribution in Europe and Japan
[GRAPHIC]
15
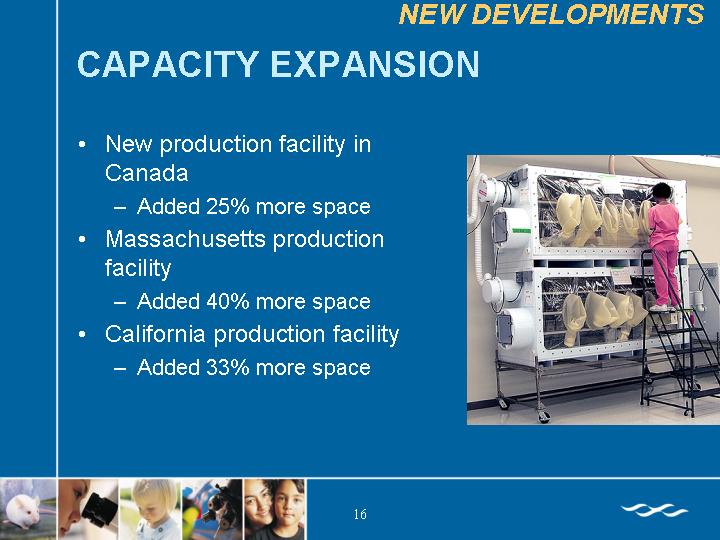
CAPACITY EXPANSION
• New production facility in Canada
• Added 25% more space
• Massachusetts production facility
• Added 40% more space
• California production facility
• Added 33% more space
[GRAPHIC]
16
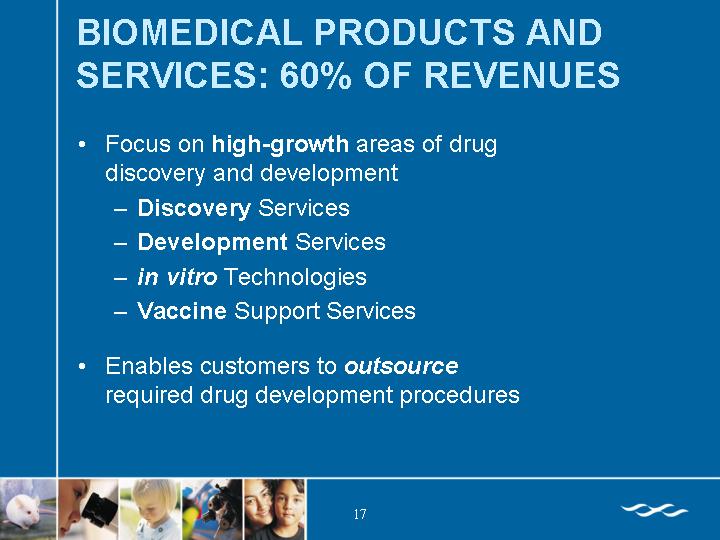
BIOMEDICAL PRODUCTS AND SERVICES: 60% OF REVENUES
• Focus on high-growth areas of drug discovery and development
• Discovery Services
• Development Services
• in vitro Technologies
• Vaccine Support Services
• Enables customers to outsource required drug development procedures
17
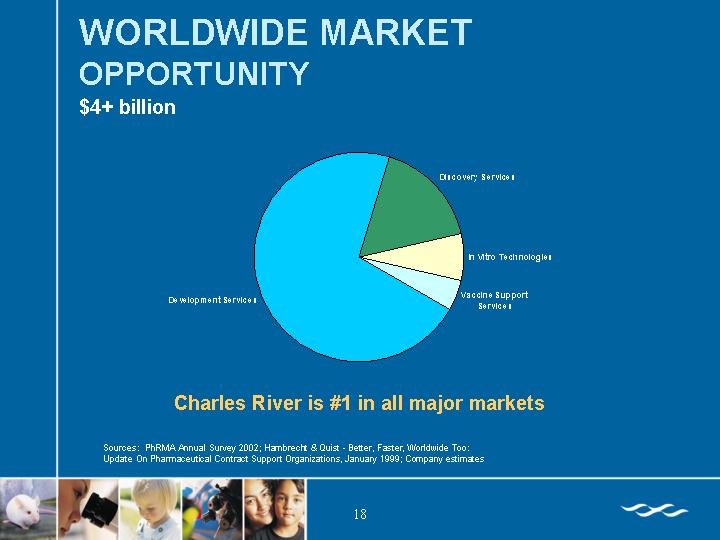
WORLDWIDE MARKET OPPORTUNITY
$4+ billion
[CHART]
Charles River is #1 in all major markets
Sources: PhRMA Annual Survey 2002; Hambrecht & Quist - Better, Faster, Worldwide Too:
Update On Pharmaceutical Contract Support Organizations, January 1999; Company estimates
18
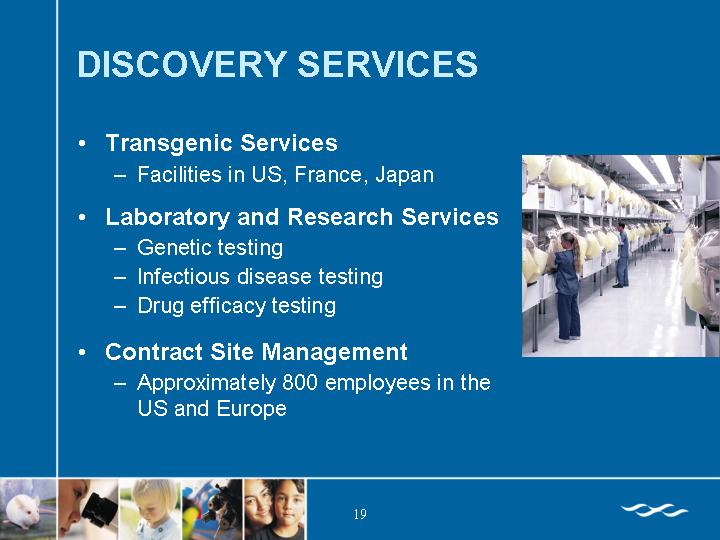
DISCOVERY SERVICES
• Transgenic Services
• Facilities in US, France, Japan
• Laboratory and Research Services
• Genetic testing
• Infectious disease testing
• Drug efficacy testing
• Contract Site Management
• Approximately 800 employees in the US and Europe
[GRAPHIC]
19
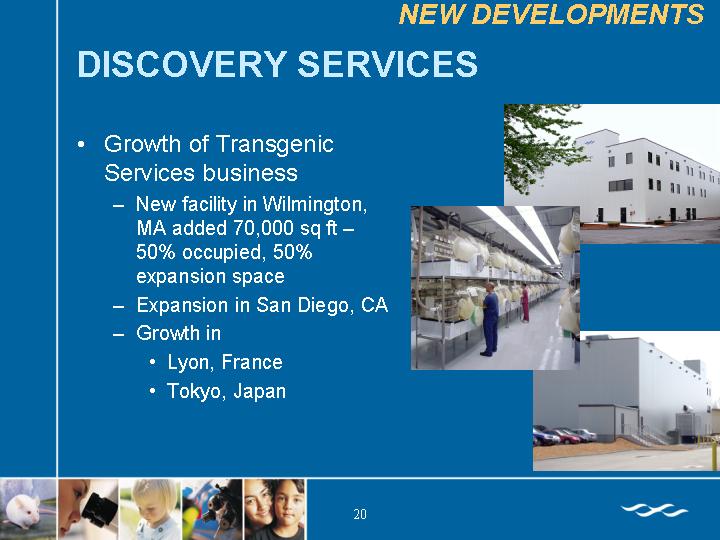
NEW DEVELOPMENTS
DISCOVERY SERVICES
• Growth of Transgenic Services business
• New facility in Wilmington, MA added 70,000 sq ft — 50% occupied, 50% expansion space
• Expansion in San Diego, CA
• Growth in
• Lyon, France
• Tokyo, Japan
[GRAPHIC]
20
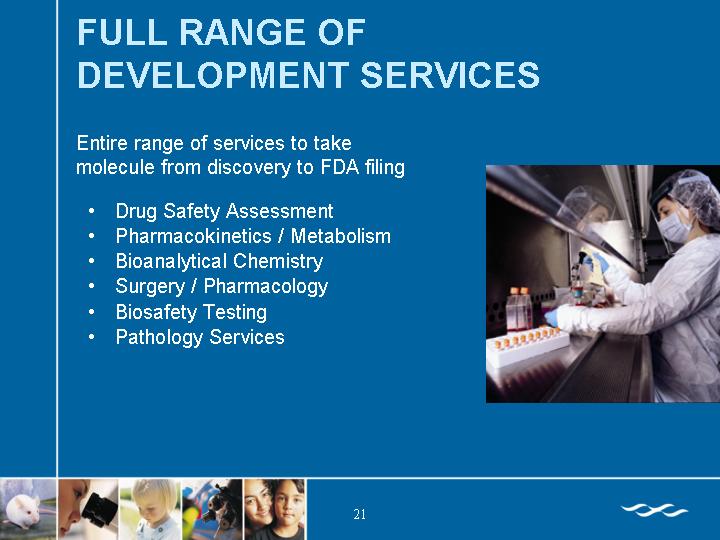
FULL RANGE OF DEVELOPMENT SERVICES
Entire range of services to take molecule from discovery to FDA filing
• Drug Safety Assessment
• Pharmacokinetics / Metabolism
• Bioanalytical Chemistry
• Surgery / Pharmacology
• Biosafety Testing
• Pathology Services
[GRAPHIC]
21
NEW DEVELOPMENTS
DEVELOPMENT SERVICES
• Lower demand for drug safety testing
• Pharma’s “barbell” focus
• Biotech’s clinical focus
• Pharma budgets solidified end of Q1
• Some potential outsourcing business staying in-house
• Waiting until last minute to commit to expensive studies
• Increased capacity
• Price pressure
22
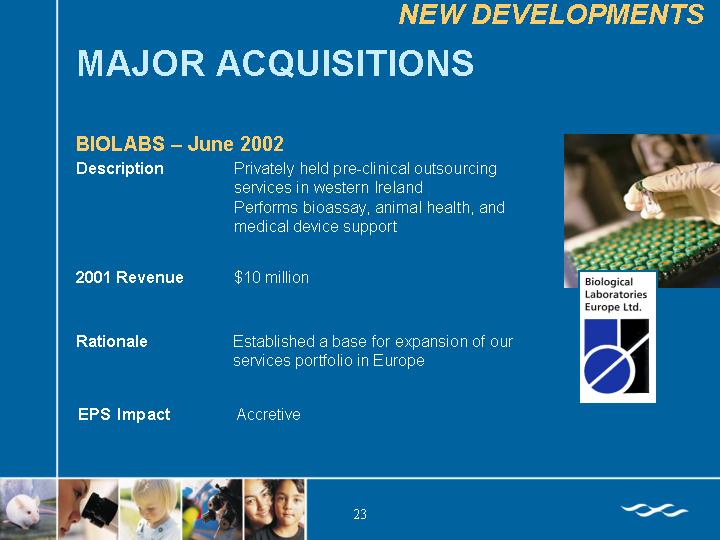
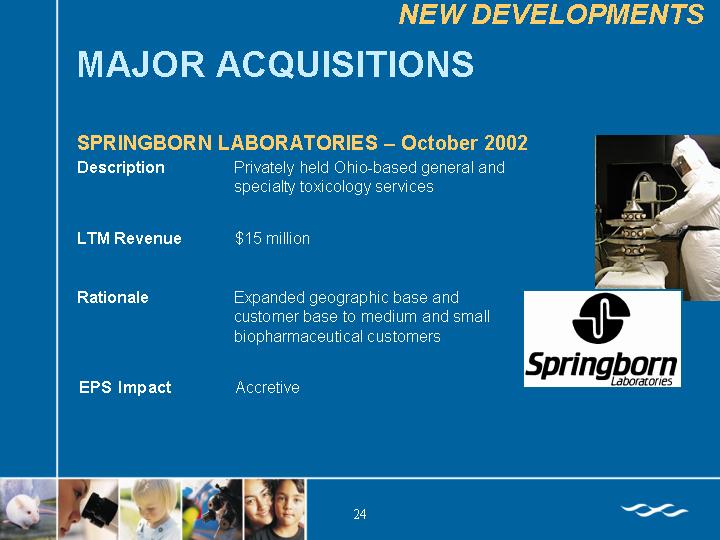
MAJOR ACQUISITIONS
BIOLABS – June 2002
Description | Privately held pre-clinical outsourcing services in western Ireland |
| Performs bioassay, animal health, and medical device support |
| |
2001 Revenue | $10 million |
| |
Rationale | Established a base for expansion of our services portfolio in Europe |
| |
EPS Impact | Accretive |
[GRAPHIC]
[BIOLOGICAL LABORATORIES EUROPE LTD. LOGO]
23
SPRINGBORN LABORATORIES — October 2002
Description | Privately held Ohio-based general and specialty toxicology services |
| |
LTM Revenue | $15 million |
| |
Rationale | Expanded geographic base and customer base to medium and small biopharmaceutical customers |
| |
EPS Impact | Accretive |
[GRAPHIC]
[SPRINGBORN LABORATORIES LOGO]
24
JOINT VENTURE
CHARLES RIVER PROTEOMICS SERVICES – Opened April 2003
80/20 joint venture between Charles River and Proteome Systems Ltd provides leading-edge proteomics testing and analysis to enable researchers to rapidly identify proteins that may have commercial value as drug targets, biomarkers, or as the basis for diagnostic tests
[GRAPHIC]
25
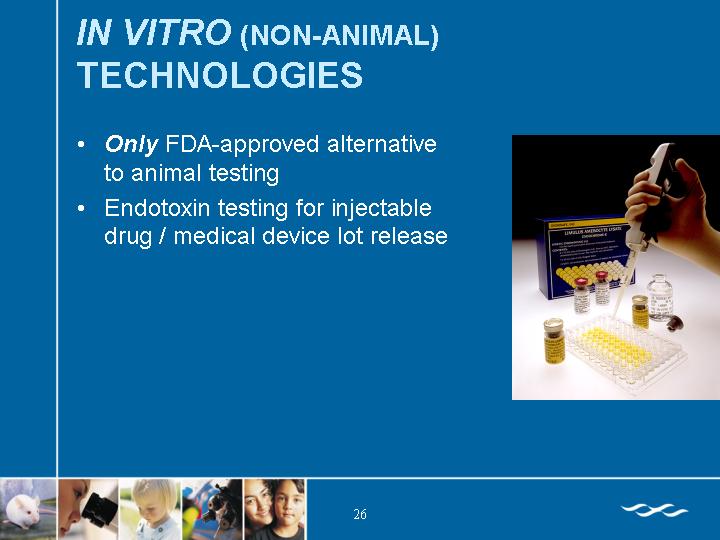
IN VITRO (NON-ANIMAL) TECHNOLOGIES
• Only FDA-approved alternative to animal testing
• Endotoxin testing for injectable drug / medical device lot release
[GRAPHIC]
26
NEW DEVELOPMENTS
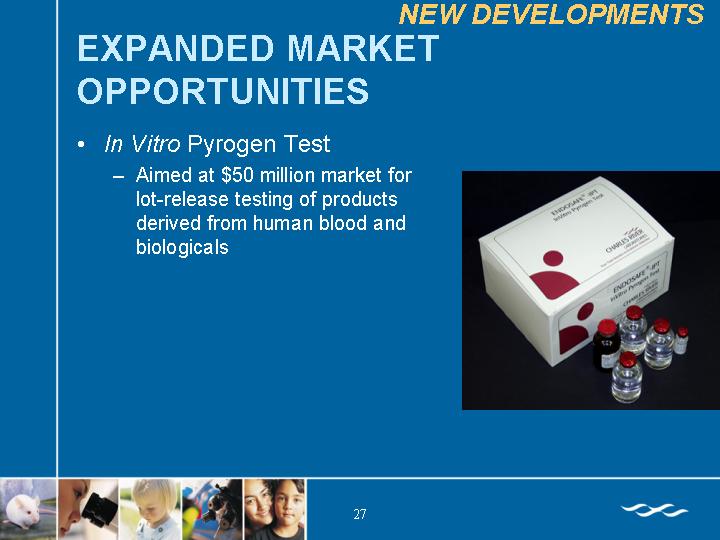
EXPANDED MARKET OPPORTUNITIES
• In Vitro Pyrogen Test
• Aimed at $50 million market for lot-release testing of products derived from human blood and biologicals
[GRAPHIC]
27
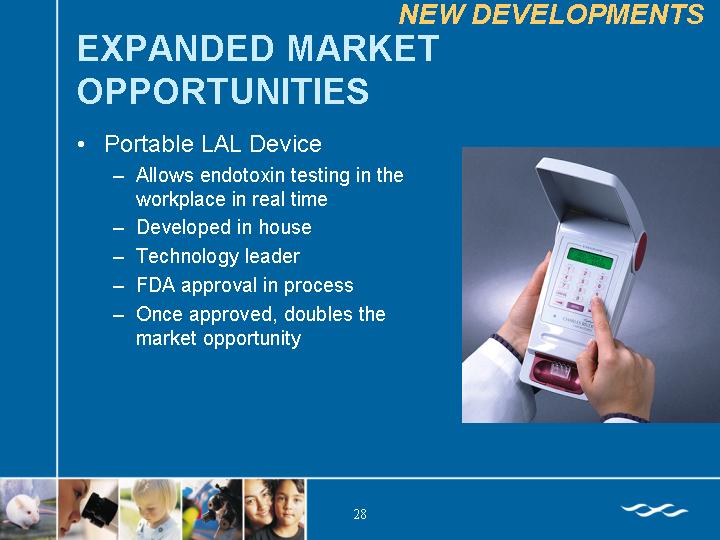
EXPANDED MARKET OPPORTUNITIES
• Portable LAL Device
• Allows endotoxin testing in the workplace in real time
• Developed in house
• Technology leader
• FDA approval in process
• Once approved, doubles the market opportunity
[GRAPHIC]
28
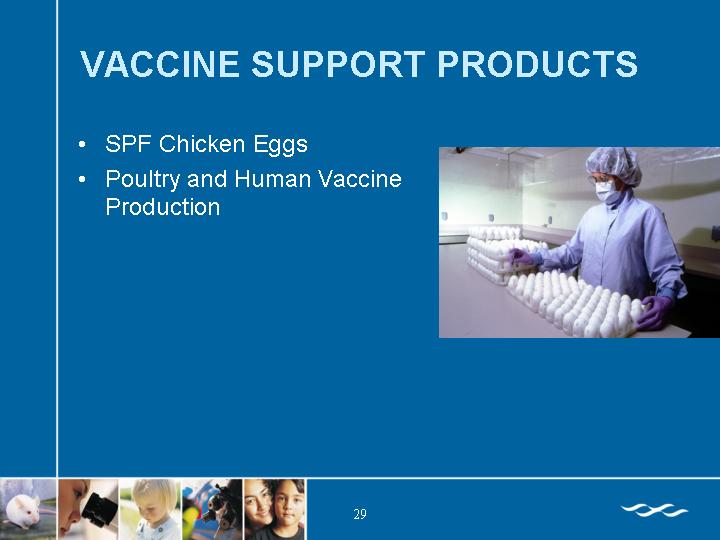
VACCINE SUPPORT PRODUCTS
• SPF Chicken Eggs
• Poultry and Human Vaccine Production
[GRAPHIC]
29
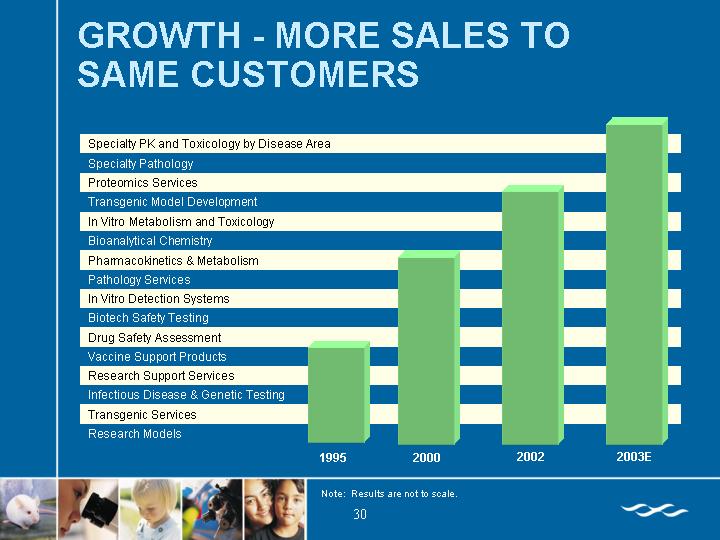
GROWTH - MORE SALES TO SAME CUSTOMERS
[CHART]
Note: Results are not to scale.
30
GROWTH THROUGH STRATEGIC ACQUISITIONS
• 21 acquisitions and alliances since 1994
• Stringent criteria for acquisitions
• Non-dilutive
• 20% operating margin
• 15%+ top-line growth
• Leading player
• Scientific leadership
• Leverage worldwide infrastructure
31
FINANCIAL REVIEW
32
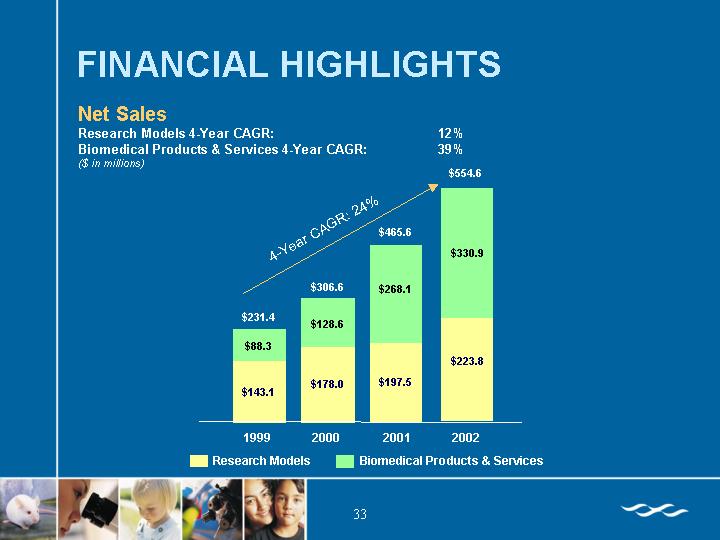
FINANCIAL HIGHLIGHTS
Net Sales
Research Models 4-Year CAGR: | | 12 | % |
Biomedical Products & Services 4-Year CAGR: | | 39 | % |
($ in millions)
[CHART]
33
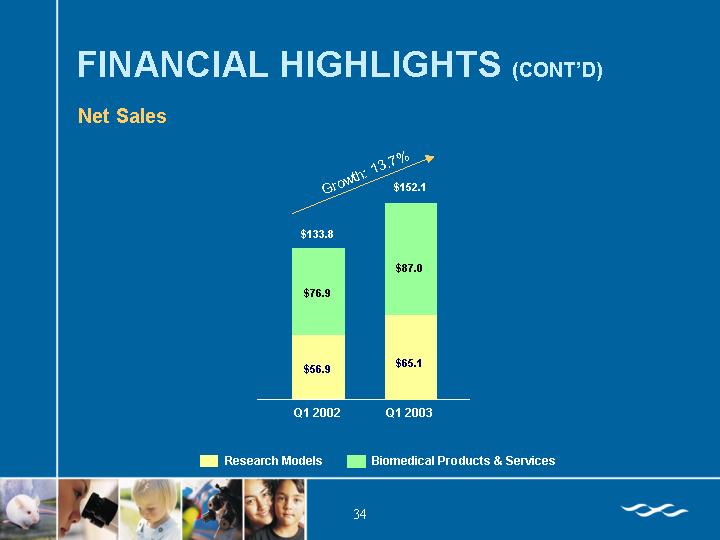
[CHART]
34
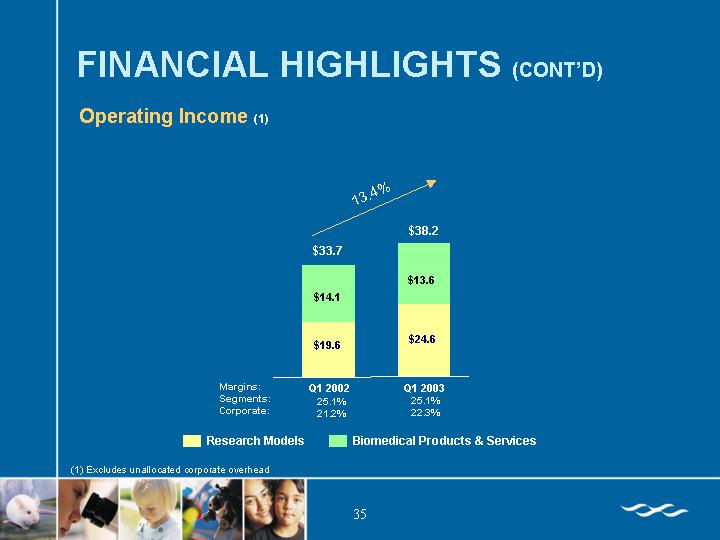
Operating Income(1)
[CHART]
(1) Excludes unallocated corporate overhead
35
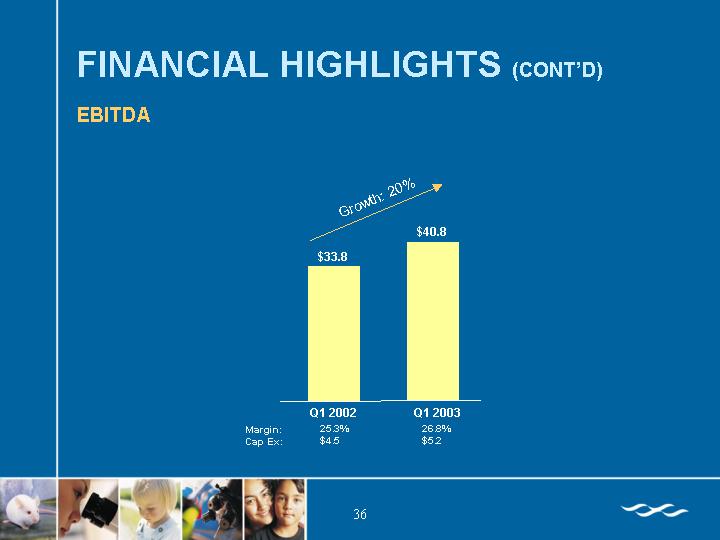
EBITDA
[CHART]
36
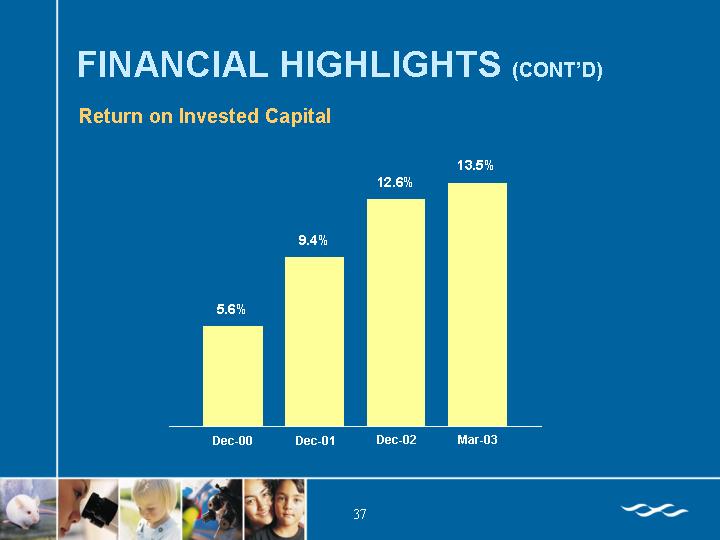
Return on Invested Capital
[CHART]
37
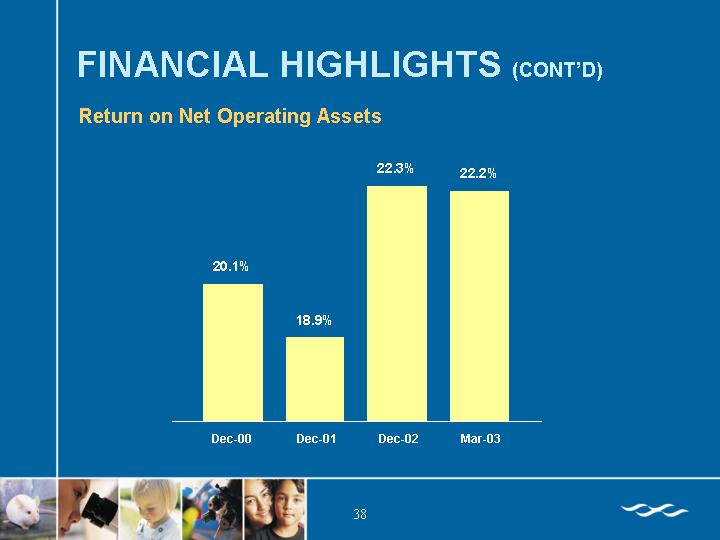
Return on Net Operating Assets
[CHART]
38
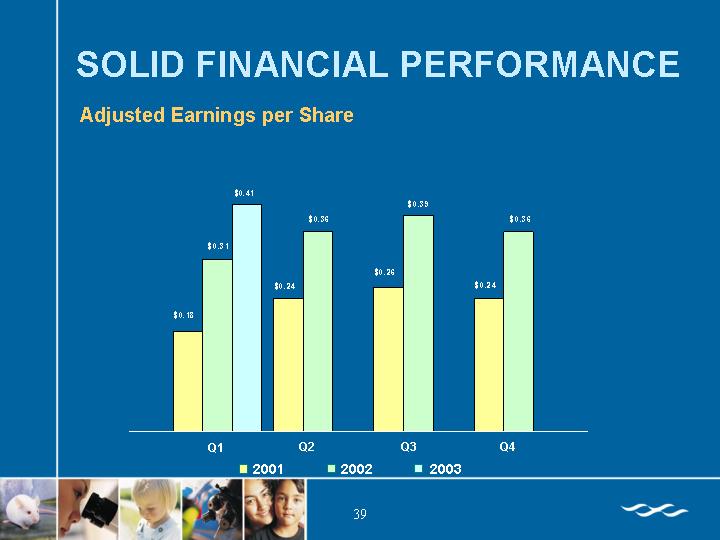
SOLID FINANCIAL PERFORMANCE
Adjusted Earnings per Share
[CHART]
39
STRONG CAPITALIZATION
| | As of
Mar. 29, 2003 | | As of
Dec. 28, 2002 | |
($ in millions) | | Actual | | Actual | |
Cash & Cash Equivalents | | $ | 119.0 | | $ | 127.5 | |
| | | | | |
Other Debt | | 7.6 | | 10.8 | |
Senior Convertible Debentures | | 185.0 | | 185.0 | |
Total Debt | | $ | 192.6 | | $ | 195.8 | |
| | | | | |
Shareholder’s Equity | | 380.3 | | 357.4 | |
Total Capitalization | | $ | 572.9 | | $ | 553.2 | |
Net Debt / Total Capitalization | | 12.8 | % | 12.3 | % |
(1) Adjusted for subsequent retirements of Senior Subordinated Notes and the Senior Convertible Debenture offering.
40
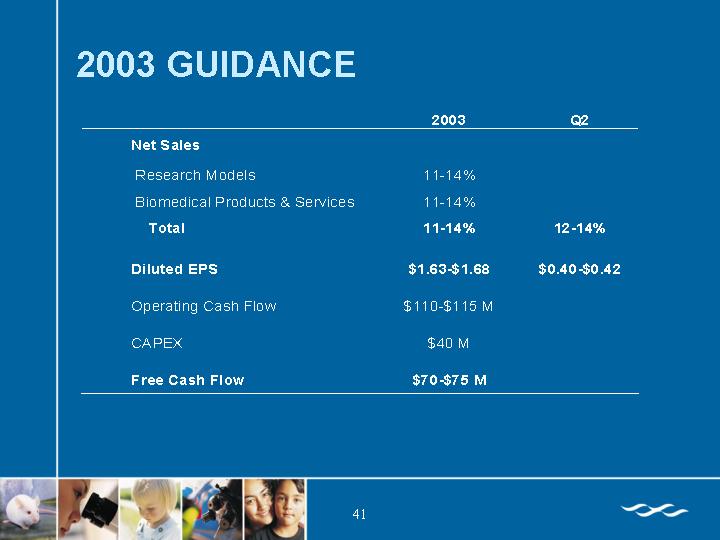
2003 GUIDANCE
| | 2003 | | Q2 | |
Net Sales | | | | | |
Research Models | | 11-14% | | | |
Biomedical Products & Services | | 11-14% | | | |
Total | | 11-14% | | 12-14% | |
| | | | | |
Diluted EPS | | $1.63-$1.68 | | $0.40-$ 0.42 | |
Operating Cash Flow | | $110-$115 M | | | |
CAPEX | | $40 M | | | |
Free Cash Flow | | $70-$75 M | | | |
41
[CHARLES RIVER LABORATORIES LOGO]
Contributing to the Search for Healthier LivesTM
Ticker: CRL
42
CHARLES RIVER LABORATORIES INTERNATIONAL, INC.
RECONCILIATION OF GAAP SALES TO NON-GAAP SALES EXCLUDING FOREIGN EXCHANGE
(dollars in thousands)
| | Three Months Ended | | | |
| | March 29, 2003 | | March 30, 2002 | | %
Increase | |
| | | | | | | |
North American Research Model Sales | | | | | | | |
North American Research Model Sales | | $ | 27,539 | | $ | 24,991 | | 10.2 | % |
| | | | | | | |
Foreign exchange impact | | (119 | ) | — | | | |
North American Research Model Sales at prior year rates | | $ | 27,420 | | $ | 24,991 | | 9.7 | % |
| | | | | | | |
European Research Model Sales | | | | | | | |
European Research Model Sales | | $ | 18,714 | | $ | 14,503 | | 29.0 | % |
| | | | | | | |
Foreign exchange impact | | (3,236 | ) | — | | | |
European Research Model Sales at prior year rates | | $ | 15,478 | | $ | 14,503 | | 6.7 | % |
| | | | | | | |
Japan Research Model Sales | | | | | | | |
Japan Research Model Sales | | $ | 12,990 | | $ | 11,867 | | 9.5 | % |
| | | | | | | |
Foreign exchange impact | | (1,327 | ) | — | | | |
Japan Research Model Sales at prior year rates | | $ | 11,663 | | $ | 11,867 | | -1.7 | % |
| | | | | | | |
Large Model Sales | | | | | | | |
Large Model Sales | | $ | 5,884 | | $ | 5,538 | | 6.2 | % |
| | | | | | | |
Total Research Model Sales | | | | | | | |
Total Research Model Sales | | $ | 65,127 | | $ | 56,899 | | 14.5 | % |
| | | | | | | |
Foreign exchange impact | | (4,682 | ) | — | | | |
Total Research Model Sales at prior year rates | | $ | 60,445 | | $ | 56,899 | | 6.2 | % |
43
May 5, 2003
CHARLES RIVER LABORATORIES INTERNATIONAL, INC.
RECONCILIATION OF GAAP TO NON-GAAP EBITDA
(dollars in thousands)
| | Three Months Ended | |
| | March 29, 2003 | | March 30, 2002 | |
| | | | | |
EBITDA | | | | | |
| | | | | |
Operating Earning | | $ | 33,848 | | $ | 28,410 | |
| | | | | |
Depreciation and amortization | | 6,925 | | 5,434 | |
EBITDA | | $ | 40,773 | | $ | 33,844 | |
| | | | | |
Total Net Sales | | $ | 152,125 | | $ | 133,820 | |
| | | | | |
EBITDA as a percent of net sales | | 26.8 | % | 25.3 | % |
44
CHARLES RIVER LABORATORIES INTERNATIONAL, INC.
RECONCILIATION OF GAAP EPS TO NON-GAAP EPS
(dollars in thousands, except for per share data)
| | Three Months Ended | |
| | March 31, 2001 | | June 30, 2001 | | September 29, 2001 | | December 29, 2001 | | March 30, 2002 | | June 29, 2002 | | September 28, 2002 | | December 28, 2002 | |
| | | | | | | | | | | | | | | | | |
Net Income (loss) | | $ | 6,951 | | $ | 9,018 | | $ | 10,521 | | $ | 8,917 | | (2,232 | ) | 16,328 | | 18,531 | | 17,505 | |
| | | | | | | | | | | | | | | | | |
Add Back: | | | | | | | | | | | | | | | | | |
Loss on debt retirement | | 365 | | 2,435 | | 1,975 | | 3,291 | | 27,479 | | 1,790 | | 613 | | — | |
Non-GAAP impact on provision for income taxes | | (128 | ) | (852 | ) | (691 | ) | (1,152 | ) | (10,717 | ) | (698 | ) | (236 | ) | — | |
Non-GAAP net income | | $ | 7,188 | | $ | 10,601 | | $ | 11,805 | | $ | 11,056 | | $ | 14,530 | | $ | 17,420 | | $ | 18,908 | | $ | 17,505 | |
After tax equivalent Interest Expense | | 28 | | 27 | | 27 | | 27 | | $ | 714 | | $ | 996 | | $ | 995 | | $ | 996 | |
Non-GAAP net income for calculation of fully diluted earnings per share | | $ | 7,216 | | $ | 10,628 | | $ | 11,832 | | $ | 11,083 | | $ | 15,244 | | $ | 18,416 | | $ | 19,903 | | $ | 18,501 | |
| | | | | | | | | | | | | | | | | |
Non-GAAP Earnings per common share | | | | | | | | | | | | | | | | | |
Basic | | $ | 0.20 | | $ | 0.26 | | $ | 0.27 | | $ | 0.25 | | $ | 0.33 | | $ | 0.39 | | $ | 0.42 | | $ | 0.39 | |
Diluted | | $ | 0.18 | | $ | 0.24 | | $ | 0.26 | | $ | 0.24 | | $ | 0.31 | | $ | 0.36 | | $ | 0.39 | | $ | 0.36 | |
| | | | | | | | | | | | | | | | | |
Non-GAAP Weighted average number of common shares outstanding | | | | | | | | | | | | | | | | | |
Basic | | 36,582,532 | | 40,175,630 | | 43,054,478 | | 44,133,268 | | 44,254,895 | | 44,557,027 | | 44,836,974 | | 45,077,506 | |
3.5% senior convertible debentures | | | | | | | | | | 3,401,024 | | 4,759,455 | | 4,759,455 | | 4,759,455 | |
Stock options | | 985,782 | | 1,036,294 | | 1,089,075 | | 1,101,873 | | 990,494 | | 1,076,211 | | 1,242,543 | | 1,198,628 | |
Warrants | | 2,718,731 | | 2,711,927 | | 1,407,259 | | 1,034,810 | | 855,707 | | 659,682 | | 523,291 | | 483,054 | |
2% Convertible notes | | — | | 128,315 | | 128,315 | | 128,315 | | 35,251 | | — | | — | | — | |
Non-GAAP Diluted | | 40,287,045 | | 44,052,166 | | 45,679,127 | | 46,398,266 | | 49,537,371 | | 51,052,375 | | 51,362,263 | | 51,518,643 | |
45