Exhibit 99.2


Alliance Data NYSE: ADS Third Quarter 2018 ResultsOctober 18, 2018
11 2 Forward-Looking StatementsThis presentation contains forward-looking statements within the meaning of Section 27A of the Securities Act of 1933 and Section 21E of the Securities Exchange Act of 1934. Forward-looking statements give our expectations or forecasts of future events and can generally be identified by the use of words such as “believe,” “expect,” “anticipate,” “estimate,” “intend,” “project,” “plan,” “likely,” “may,” “should” or other words or phrases of similar import. Similarly, statements that describe our business strategy, outlook, objectives, plans, intentions or goals also are forward-looking statements. Examples of forward-looking statements include, but are not limited to, statements we make regarding strategic evaluations, our expected operating results, future economic conditions including currency exchange rates, future dividend declarations and the guidance we give with respect to our anticipated financial performance. We believe that our expectations are based on reasonable assumptions. Forward-looking statements, however, are subject to a number of risks and uncertainties that could cause actual results to differ materially from the projections, anticipated results or other expectations expressed in this presentation, and no assurances can be given that our expectations will prove to have been correct. These risks and uncertainties include, but are not limited to, factors set forth in the Risk Factors section in our Annual Report on Form 10-K for the most recently ended fiscal year, which may be updated in Item 1A of, or elsewhere in, our Quarterly Reports on Form 10-Q filed for periods subsequent to such Form 10-K. Our forward-looking statements speak only as of the date made, and we undertake no obligation, other than as required by applicable law, to update or revise any forward-looking statements, whether as a result of new information, subsequent events, anticipated or unanticipated circumstances or otherwise.
Agenda Speakers: Ed Heffernan President and CEO Charles Horn EVP and CFO Consolidated ResultsSegment Results & OutlookGuidance2019: A look Ahead 1 3
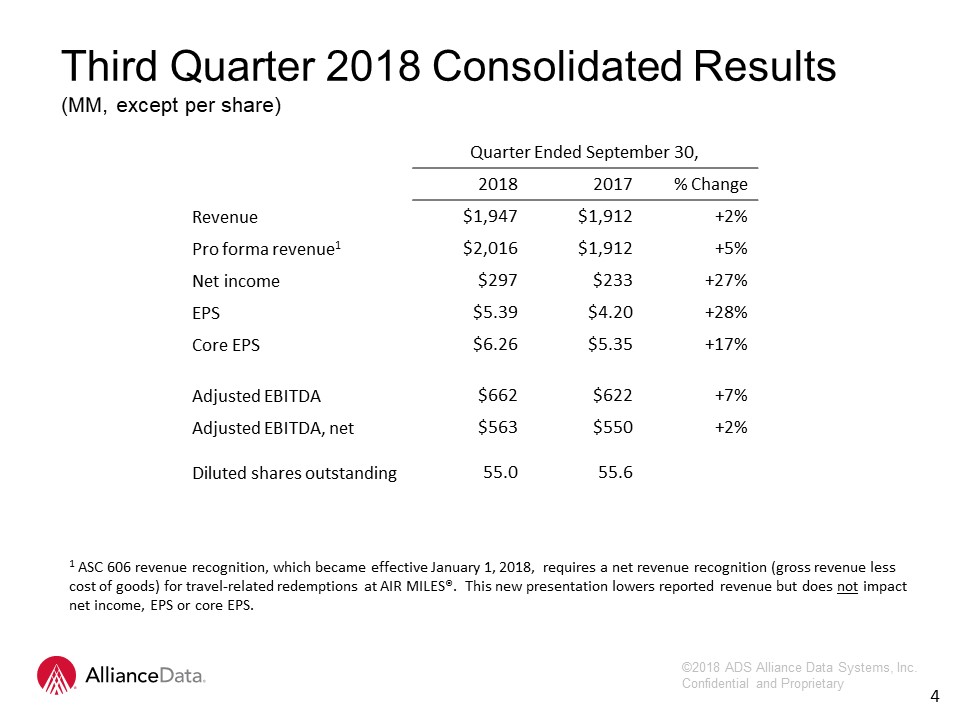
Third Quarter 2018 Consolidated Results(MM, except per share) 2 4 Quarter Ended September 30, 2018 2017 % Change Revenue $1,947 $1,912 +2% Pro forma revenue1 $2,016 $1,912 +5% Net income $297 $233 +27% EPS $5.39 $4.20 +28% Core EPS $6.26 $5.35 +17% Adjusted EBITDA $662 $622 +7% Adjusted EBITDA, net $563 $550 +2% Diluted shares outstanding 55.0 55.6 1 ASC 606 revenue recognition, which became effective January 1, 2018, requires a net revenue recognition (gross revenue less cost of goods) for travel-related redemptions at AIR MILES®. This new presentation lowers reported revenue but does not impact net income, EPS or core EPS.
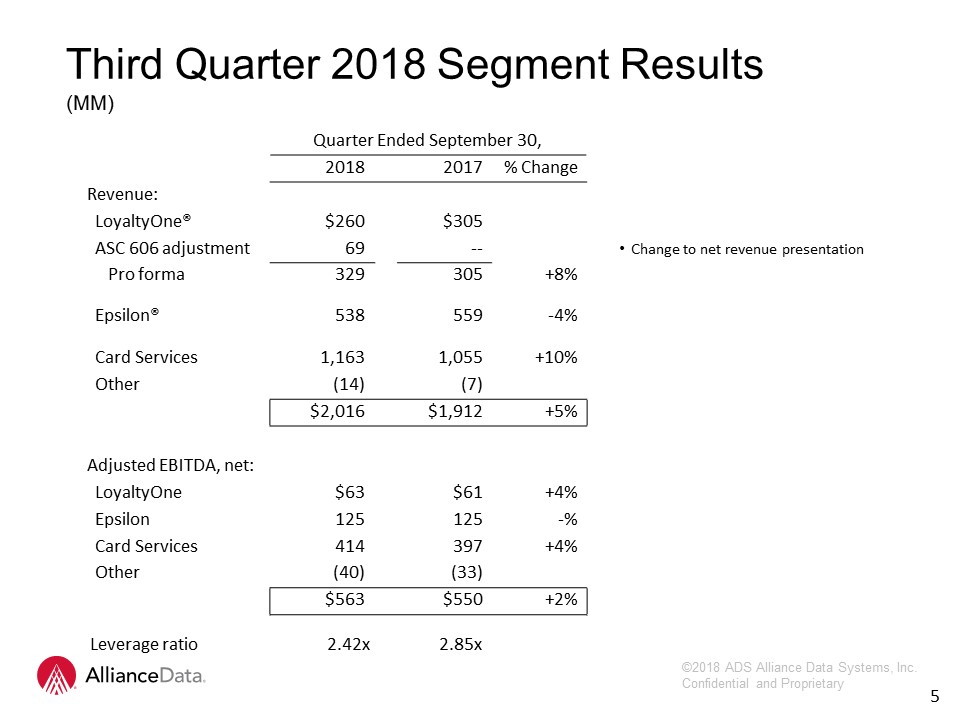
Quarter Ended September 30, 2018 2017 % Change Revenue: LoyaltyOne® $260 $305 ASC 606 adjustment 69 -- Change to net revenue presentation Pro forma 329 305 +8% Epsilon® 538 559 -4% Card Services 1,163 1,055 +10% Other (14) (7) $2,016 $1,912 +5% Adjusted EBITDA, net: LoyaltyOne $63 $61 +4% Epsilon 125 125 -% Card Services 414 397 +4% Other (40) (33) $563 $550 +2% Third Quarter 2018 Segment Results(MM) 5 Leverage ratio 2.42x 2.85x
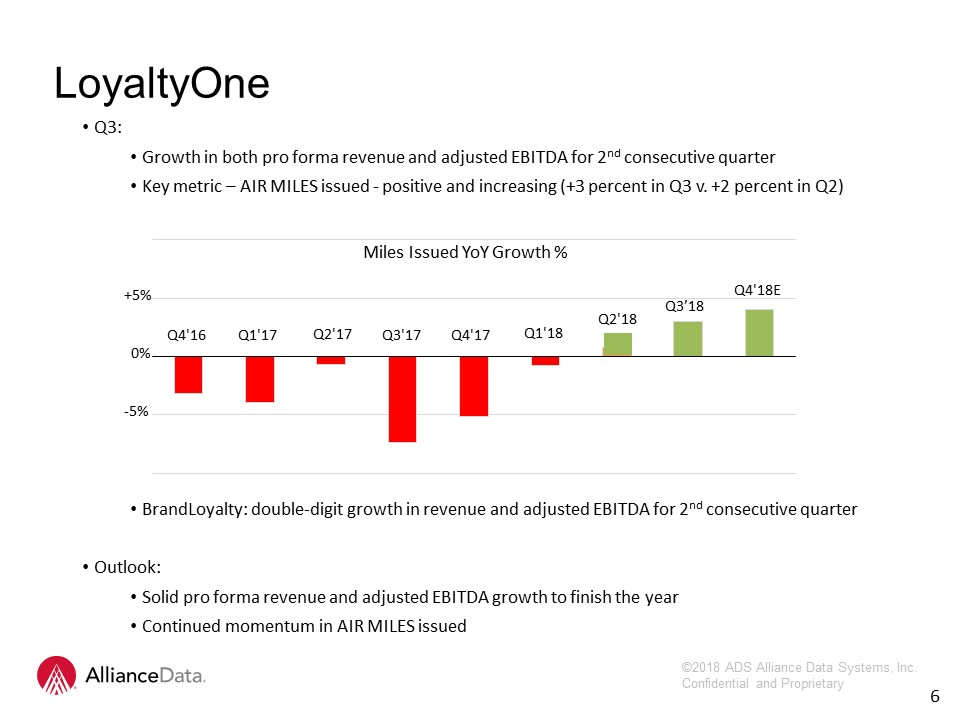
Q3: Growth in both pro forma revenue and adjusted EBITDA for 2nd consecutive quarterKey metric – AIR MILES issued - positive and increasing (+3 percent in Q3 v. +2 percent in Q2)BrandLoyalty: double-digit growth in revenue and adjusted EBITDA for 2nd consecutive quarterOutlook: Solid pro forma revenue and adjusted EBITDA growth to finish the yearContinued momentum in AIR MILES issued 6 LoyaltyOne 6 +5% 0% -5%
Epsilon Q3: Revenue down 4 percent compared to down 5 percent in 1st half of 2018Still soft and below expectationsMix of growing, stable and declining product offeringsChallenges:Agency and Site-Based Display (old Valueclick) platforms Several client bankruptciesOutlook: Revenue expected to be down 3-5 percent for year, but adjusted EBITDA approximately flat with the prior yearAdjusted EBITDA margin expansion of approximately 100 basis points 7
Card Services Q3: New signings exceptionally strongContinues aggressive strategy to diversify away from mall-based specialty apparelBon-Ton receivables moved to held-for-saleYTD:IKEA – home décorWyndham – hospitalityAcademy Sports – sporting goodsFloor & Decor – home décorAdorama – consumer electronics (store/e-commerce)Appliances Connection – consumer electronics (e-commerce)Announced signing of $2.0 billion vintage plus signed-not-yet-announced of $2.0 billion vintage puts 2018 at $4 billion vintage (2x recent record years) 100 percent away from mall-based specialty apparelActive client base strongCredit sales +11 percent, receivables growth +17 percentContinued turmoil in retail – discontinued programs reduce reported credit sales and receivables growth to 0 percent and 10 percentCredit quality continues to improveQ1: 6.7 percent → Q2: 6.4 percent → Q3: 5.9 percentRecovery rate: Q1: ~9 percent → Q2: ~15 percent → Q3: ~18 percent (higher than Q3, 2017 rate) 8
Card Services Q3: New signings exceptionally strongContinues aggressive strategy to diversify away from mall-based specialty apparelBon-Ton receivables moved to held-for-saleYTD:IKEA – home décorWyndham – hospitalityAcademy Sports – sporting goodsFloor & Décor – home décorAdorama – consumer electronics (store/e-commerce)Appliances Connection – consumer electronics (e-commerce)Announced signing of $2.0 billion vintage plus signed-not-yet-announced of $2.0 billion vintage puts 2018 at $4 billion vintage (2x recent record years) 100 percent away from mall-based specialty apparelActive client base strongCredit sales +11 percent, receivables growth +17 percentContinued turmoil in retail – discontinued programs reduce reported credit sales and receivables growth to 0 percent and 10 percentCredit quality continues to improveQ1: 6.7 percent → Q2: 6.4 percent → Q3: 5.9 percentRecovery rate: Q1: ~9 percent → Q2: ~15 percent → Q3: ~18 percent (higher than Q3, 2017 rate) 8
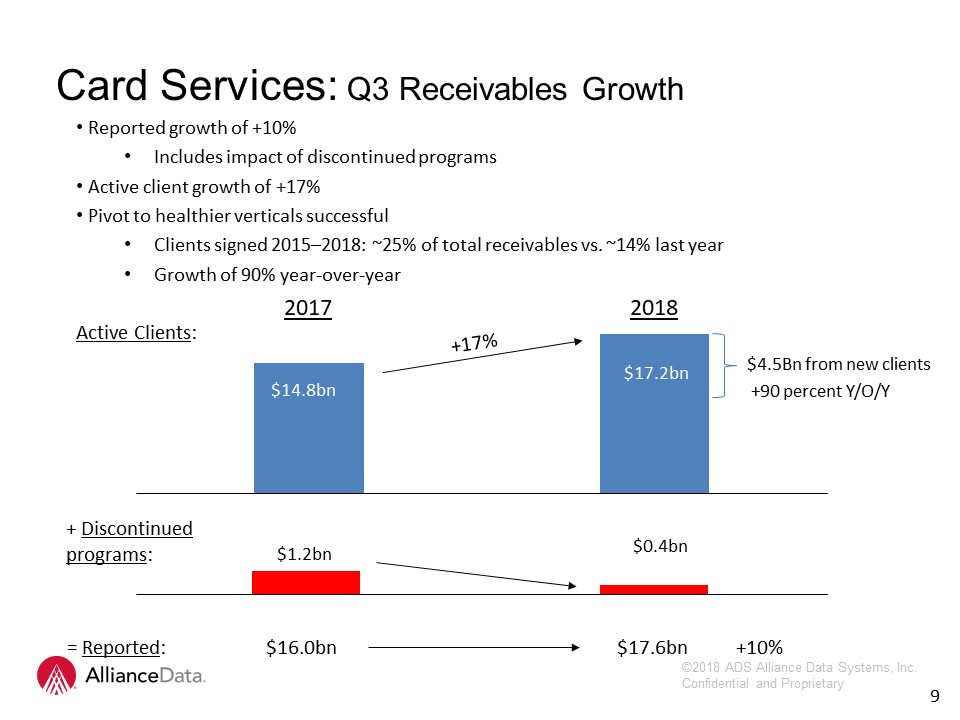
Card Services: Q3 Receivables Growth 9 Reported growth of +10%Includes impact of discontinued programsActive client growth of +17%Pivot to healthier verticals successfulClients signed 2015–2018: ~25% of total receivables vs. ~14% last yearGrowth of 90% year-over-year +17% Active Clients: + Discontinued programs: = Reported: $16.0bn $17.6bn +10% $17.2bn $1.2bn $0.4bn $4.5Bn from new clients +90 percent Y/O/Y
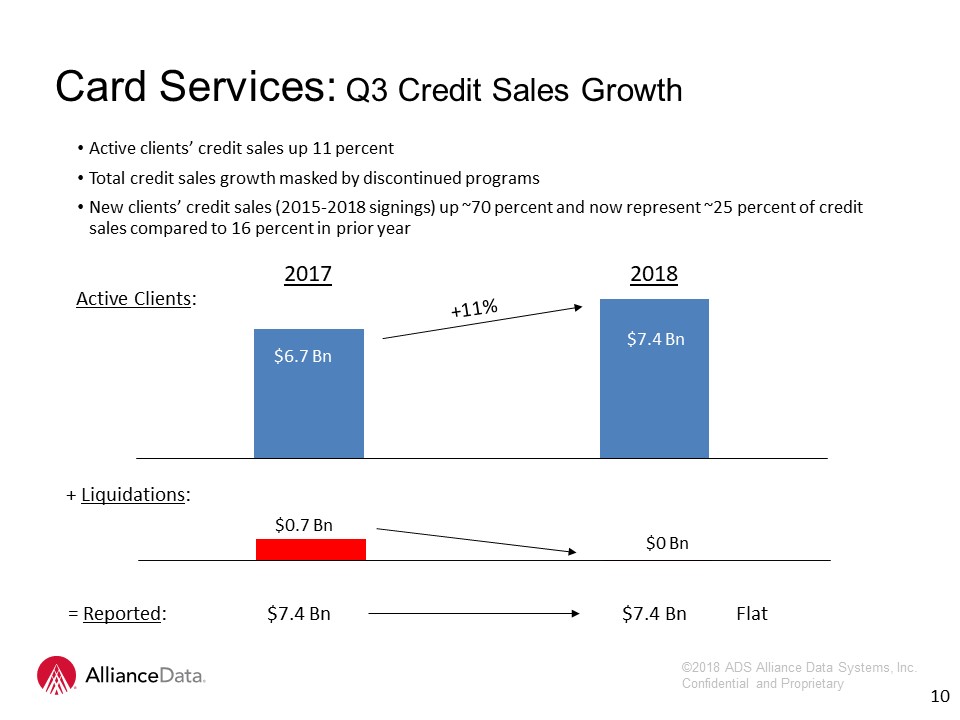
Card Services: Q3 Credit Sales Growth 6 Active clients’ credit sales up 11 percentTotal credit sales growth masked by discontinued programsNew clients’ credit sales (2015-2018 signings) up ~70 percent and now represent ~25 percent of credit sales compared to 16 percent in prior year +11% Active Clients: + Liquidations: = Reported: $7.4 Bn $7.4 Bn Flat $7.4 Bn $0.7 Bn $0 Bn 10
Active client receivables growth in mid-teens rangeNon-strategic clients (liquidating, bankrupt or in decline due to M&A) will be aggressively moved out of the portfolioReported growth slows and then recovers during 2019; active client growth remains strong throughout 2019Frees up capital and makes room for record new vintageNew Signings: on track for $4 billion vintage (2x recent years)2015-18 Signings ~ 25 percent of portfolio; ~ 50 percent in 2 yearsCurrent card receivables reflect only $4.5 billion of the expected $11 billion run-rate as ramp-up continuesCredit Quality: we are now at our long-term annual rate of ~6 percentLoss rate: Q1: 6.7 percent → Q4 forecast: mid-5’sRecovery rate: Q1: (50) bps headwind → Q4: 65 bps tailwindDespite all the noise, the difference between Q1’s rate of 6.7% and Q4’s rate in mid-5’s is virtually entirely due to the ramp-up in recovery ratesGives us comfort looking forward Card Services: Outlook 11
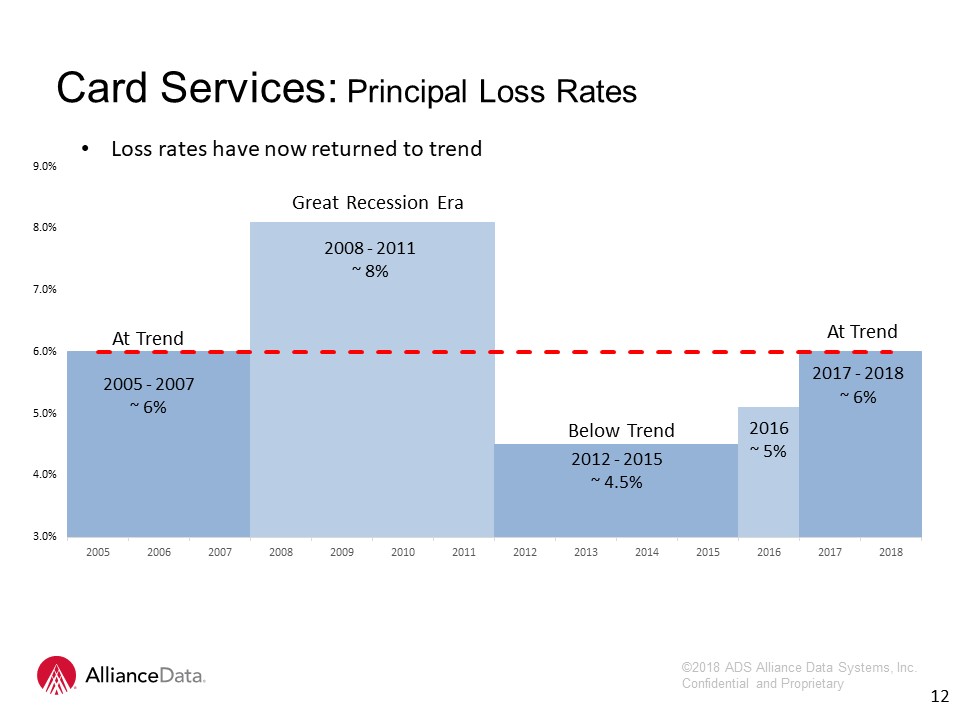
6 12 Card Services: Principal Loss Rates 2005 - 2007~ 6% At Trend Below Trend 2016~ 5% 2017 ‐ 2018~ 6% At Trend Loss rates have now returned to trend
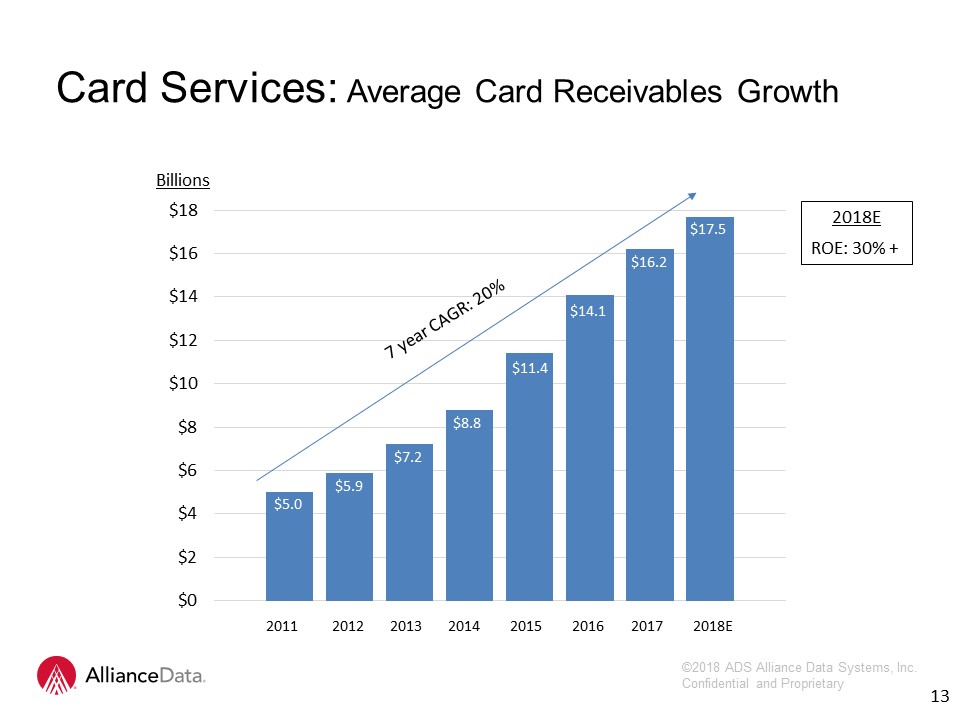
Card Services: Average Card Receivables Growth 7 year CAGR: 20% Billions 2011 2012 2013 2014 2015 2016 2017 2018E $5.0 $5.9 $7.2 $8.8 $11.4 $14.1 $16.2 $17.5 13 2018EROE: 30% +
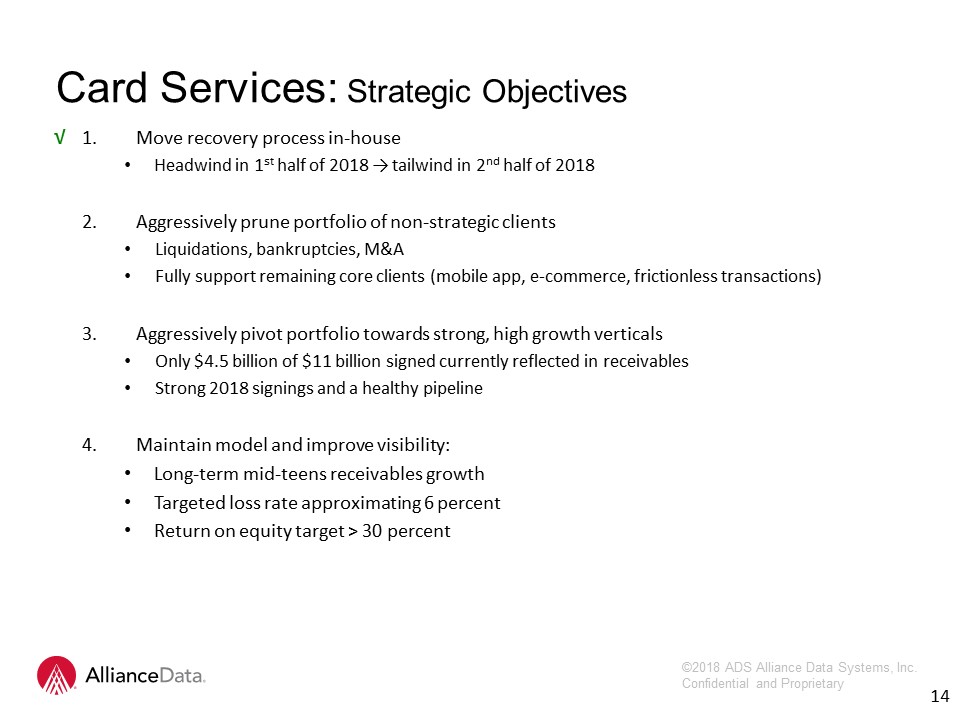
Move recovery process in-houseHeadwind in 1st half of 2018 → tailwind in 2nd half of 2018Aggressively prune portfolio of non-strategic clientsLiquidations, bankruptcies, M&AFully support remaining core clients (mobile app, e-commerce, frictionless transactions)Aggressively pivot portfolio towards strong, high growth verticalsOnly $4.5 billion of $11 billion signed currently reflected in receivablesStrong 2018 signings and a healthy pipelineMaintain model and improve visibility:Long-term mid-teens receivables growthTargeted loss rate approximating 6 percentReturn on equity target > 30 percent Card Services: Strategic Objectives 14 √
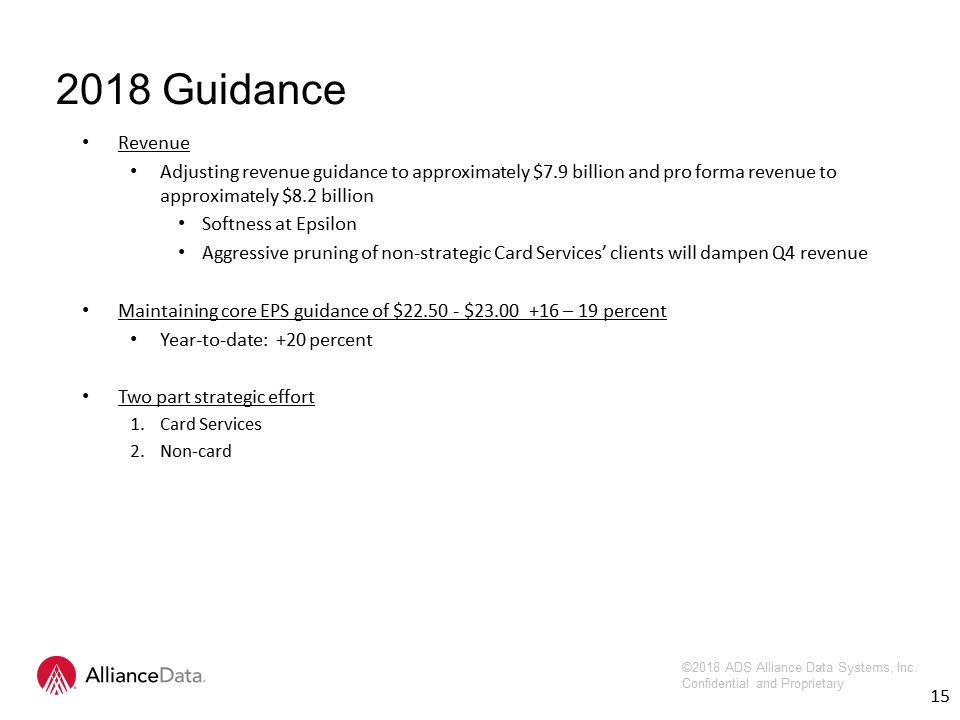
RevenueAdjusting revenue guidance to approximately $7.9 billion and pro forma revenue to approximately $8.2 billionSoftness at EpsilonAggressive pruning of non-strategic Card Services’ clients will dampen Q4 revenueMaintaining core EPS guidance of $22.50 - $23.00 +16 – 19 percentYear-to-date: +20 percentTwo part strategic effortCard ServicesNon-card 2018 Guidance 15
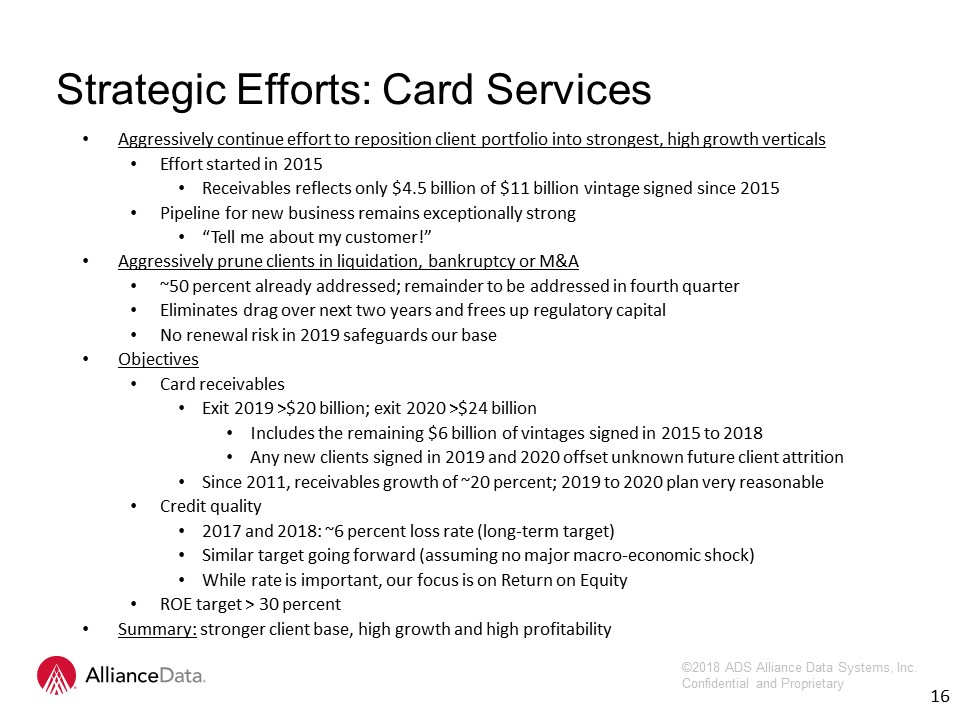
Strategic Efforts: Card Services Aggressively continue effort to reposition client portfolio into strongest, high growth verticalsEffort started in 2015Receivables reflects only $4.5 billion of $11 billion vintage signed since 2015Pipeline for new business remains exceptionally strong“Tell me about my customer!”Aggressively prune clients in liquidation, bankruptcy or M&A~50 percent already addressed; remainder to be addressed in fourth quarterEliminates drag over next two years and frees up regulatory capitalNo renewal risk in 2019 safeguards our baseObjectivesCard receivablesExit 2019 >$20 billion; exit 2020 >$24 billionIncludes the remaining $6 billion of vintages signed in 2015 to 2018Any new clients signed in 2019 and 2020 offset unknown future client attritionSince 2011, receivables growth of ~20 percent; 2019 to 2020 plan very reasonableCredit quality2017 and 2018: ~6 percent loss rate (long-term target)Similar target going forward (assuming no major macro-economic shock)While rate is important, our focus is on Return on EquityROE target > 30 percentSummary: stronger client base, high growth and high profitability 16
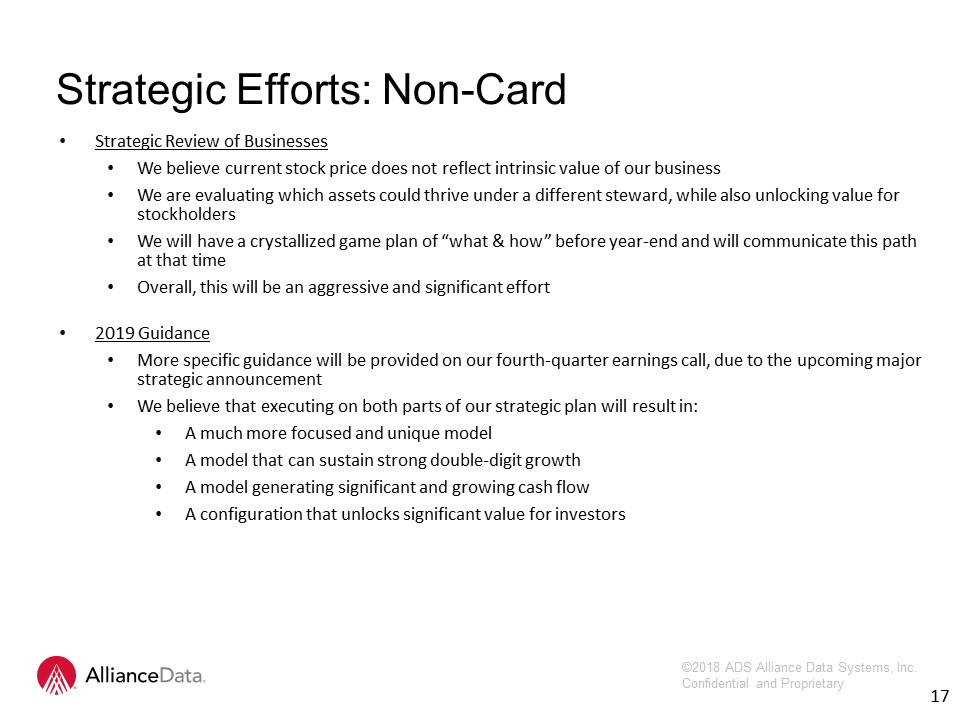
Strategic Review of BusinessesWe believe current stock price does not reflect intrinsic value of our businessWe are evaluating which assets could thrive under a different steward, while also unlocking value for stockholdersWe will have a crystallized game plan of “what & how” before year-end and will communicate this path at that timeOverall, this will be an aggressive and significant effort2019 GuidanceMore specific guidance will be provided on our fourth-quarter earnings call, due to the upcoming major strategic announcementWe believe that executing on both parts of our strategic plan will result in:A much more focused and unique modelA model that can sustain strong double-digit growthA model generating significant and growing cash flowA configuation that unlocks significant value for investors 17 Strategic Efforts: Non-Card
Strategic Review of BusinessesWe believe current stock price does not reflect intrinsic value of our businessWe are evaluating which assets could thrive under a different steward, while also unlocking value for stockholdersWe will have a crystallized game plan of “what & how” before year-end and will communicate this path at that timeOverall, this will be an aggressive and significant effort2019 GuidanceMore specific guidance will be provided on our fourth-quarter earnings call, due to the upcoming major strategic announcementWe believe that executing on both parts of our strategic plan will result in:A much more focused and unique modelA model that can sustain strong double-digit growthA model generating significant and growing cash flowA configuration that unlocks significant value for investors 17 Strategic Efforts: Non-Card
12 18 Financial MeasuresIn addition to the results presented in accordance with generally accepted accounting principles, or GAAP, the Company may present financial measures that are non-GAAP measures, such as constant currency financial measures, adjusted EBITDA, adjusted EBITDA margin, adjusted EBITDA, net of funding costs, core earnings and core earnings per diluted share (core EPS). Constant currency excludes the impact of fluctuations in foreign exchange rates. The Company calculates constant currency by converting our current period local currency financial results using the prior period exchange rates. The Company uses adjusted EBITDA and adjusted EBITDA, net as an integral part of internal reporting to measure the performance and operational strength of reportable segments and to evaluate the performance of senior management. Adjusted EBITDA eliminates the uneven effect across all reportable segments of non-cash depreciation of tangible assets and amortization of intangible assets, including certain intangible assets that were recognized in business combinations, and the non-cash effect of stock compensation expense. Similarly, core earnings and core EPS eliminate non-cash or non-operating items, including, but not limited to, stock compensation expense, amortization of purchased intangibles, amortization of debt issuance and hedging costs. The Company believes that these non-GAAP financial measures, viewed in addition to and not in lieu of the Company’s reported GAAP results, provide useful information to investors regarding the Company’s performance and overall results of operations. Reconciliations to comparable GAAP financial measures are available in the Company’s earnings release, which is posted in both the News and Investors sections on the Company’s website (www.alliancedata.com). No reconciliation is provided with respect to forward-looking annual guidance for 2018 core EPS as the Company cannot reliably predict all necessary components or their impact to reconcile core EPS to GAAP EPS without unreasonable effort. The events necessitating a non-GAAP adjustment are inherently unpredictable and may have a material impact on the Company’s future results. The financial measures presented are consistent with the Company’s historical financial reporting practices. Core earnings and core EPS represent performance measures and are not intended to represent liquidity measures. The non-GAAP financial measures presented herein may not be comparable to similarly titled measures presented by other companies, and are not identical to corresponding measures used in other various agreements or public filings.
Q & A 19