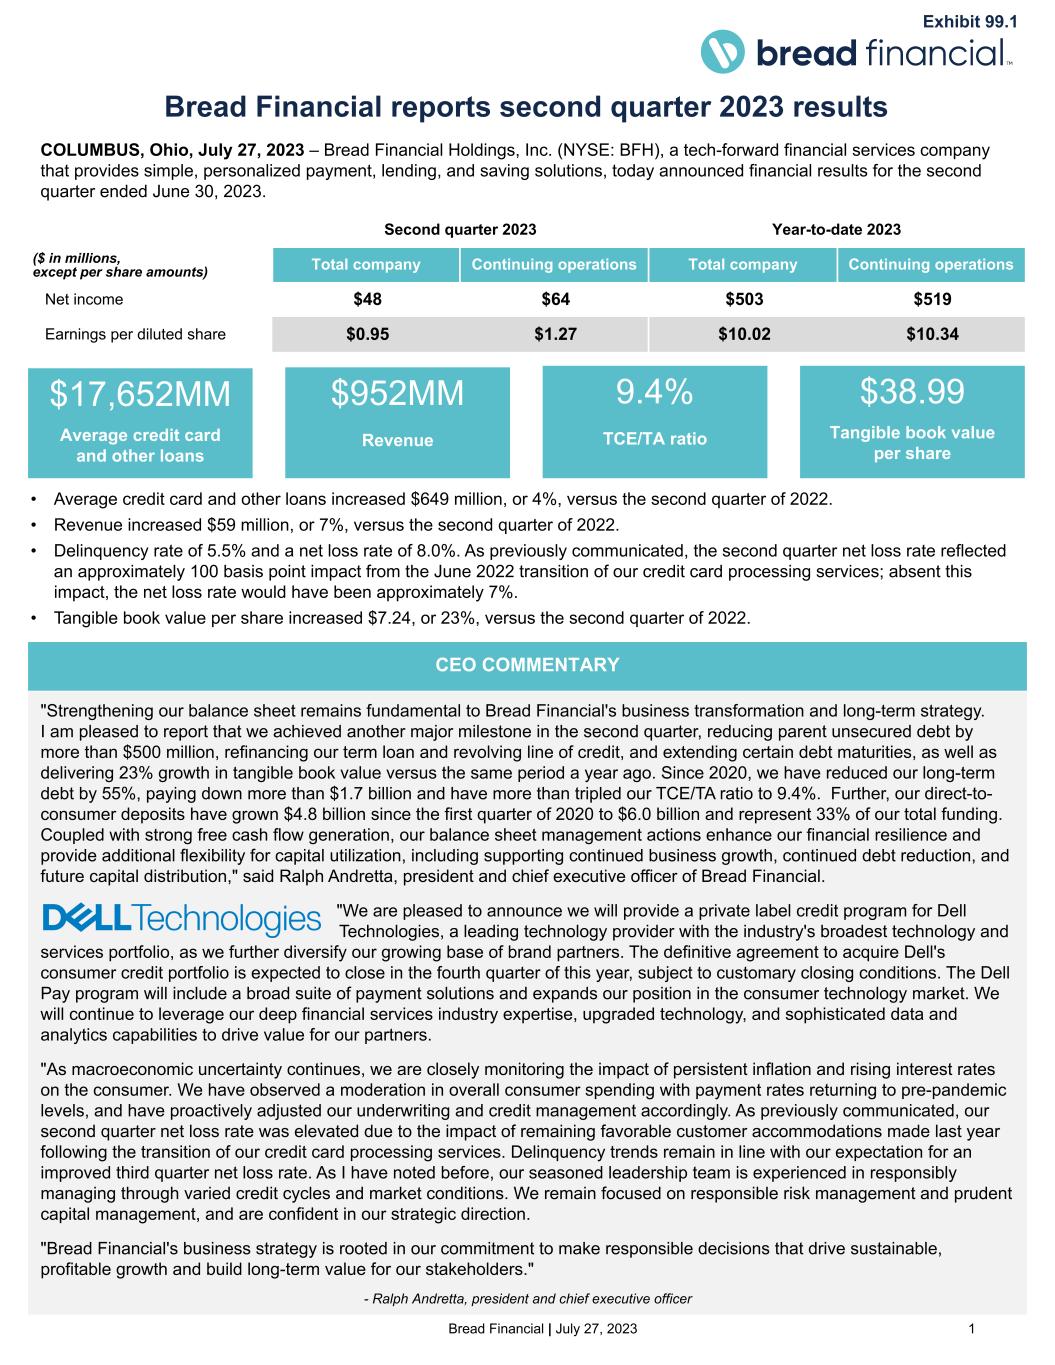
Bread Financial | July 27, 2023 1 "Strengthening our balance sheet remains fundamental to Bread Financial's business transformation and long-term strategy. I am pleased to report that we achieved another major milestone in the second quarter, reducing parent unsecured debt by more than $500 million, refinancing our term loan and revolving line of credit, and extending certain debt maturities, as well as delivering 23% growth in tangible book value versus the same period a year ago. Since 2020, we have reduced our long-term debt by 55%, paying down more than $1.7 billion and have more than tripled our TCE/TA ratio to 9.4%. Further, our direct-to- consumer deposits have grown $4.8 billion since the first quarter of 2020 to $6.0 billion and represent 33% of our total funding. Coupled with strong free cash flow generation, our balance sheet management actions enhance our financial resilience and provide additional flexibility for capital utilization, including supporting continued business growth, continued debt reduction, and future capital distribution," said Ralph Andretta, president and chief executive officer of Bread Financial. "We are pleased to announce we will provide a private label credit program for Dell t Technologies, a leading technology provider with the industry's broadest technology and services portfolio, as we further diversify our growing base of brand partners. The definitive agreement to acquire Dell's consumer credit portfolio is expected to close in the fourth quarter of this year, subject to customary closing conditions. The Dell Pay program will include a broad suite of payment solutions and expands our position in the consumer technology market. We will continue to leverage our deep financial services industry expertise, upgraded technology, and sophisticated data and analytics capabilities to drive value for our partners. "As macroeconomic uncertainty continues, we are closely monitoring the impact of persistent inflation and rising interest rates on the consumer. We have observed a moderation in overall consumer spending with payment rates returning to pre-pandemic levels, and have proactively adjusted our underwriting and credit management accordingly. As previously communicated, our second quarter net loss rate was elevated due to the impact of remaining favorable customer accommodations made last year following the transition of our credit card processing services. Delinquency trends remain in line with our expectation for an improved third quarter net loss rate. As I have noted before, our seasoned leadership team is experienced in responsibly managing through varied credit cycles and market conditions. We remain focused on responsible risk management and prudent capital management, and are confident in our strategic direction. "Bread Financial's business strategy is rooted in our commitment to make responsible decisions that drive sustainable, profitable growth and build long-term value for our stakeholders." - Ralph Andretta, president and chief executive officer Second quarter 2023 Year-to-date 2023 ($ in millions, except per share amounts) Total company Continuing operations Total company Continuing operations Net income $48 $64 $503 $519 Earnings per diluted share $0.95 $1.27 $10.02 $10.34 Bread Financial reports second quarter 2023 results CEO COMMENTARY COLUMBUS, Ohio, July 27, 2023 – Bread Financial Holdings, Inc. (NYSE: BFH), a tech-forward financial services company that provides simple, personalized payment, lending, and saving solutions, today announced financial results for the second quarter ended June 30, 2023. • Average credit card and other loans increased $649 million, or 4%, versus the second quarter of 2022. • Revenue increased $59 million, or 7%, versus the second quarter of 2022. • Delinquency rate of 5.5% and a net loss rate of 8.0%. As previously communicated, the second quarter net loss rate reflected an approximately 100 basis point impact from the June 2022 transition of our credit card processing services; absent this impact, the net loss rate would have been approximately 7%. • Tangible book value per share increased $7.24, or 23%, versus the second quarter of 2022. $17,652MM Average credit card and other loans $952MM Revenue 9.4% TCE/TA ratio $38.99 Tangible book value per share Exhibit 99.1
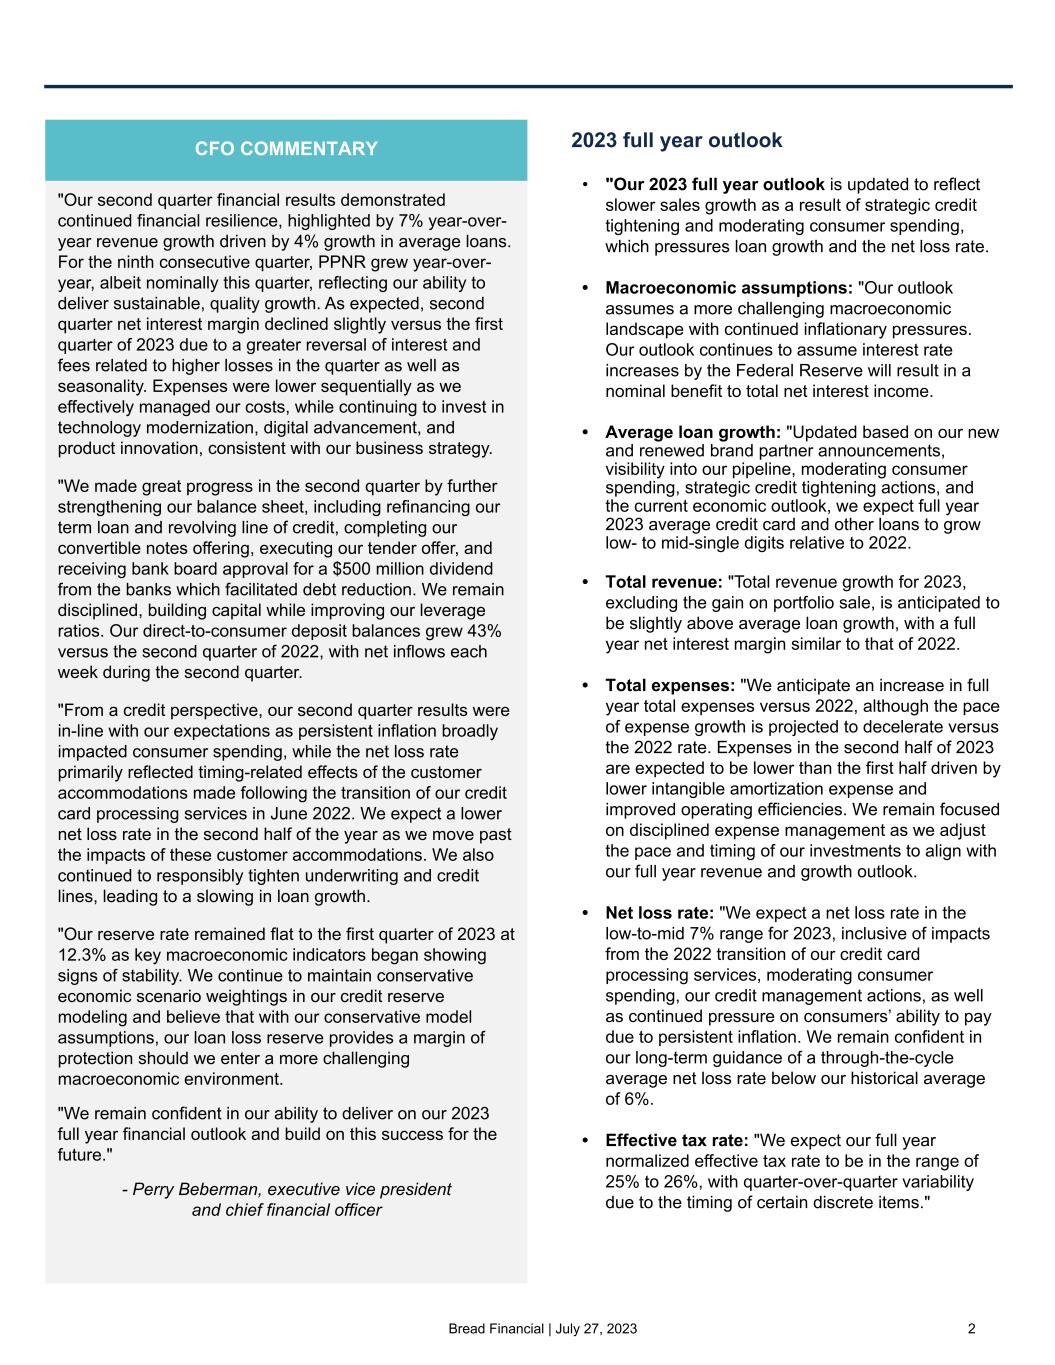
Bread Financial | July 27, 2023 2 2023 full year outlook • "Our 2023 full year outlook is updated to reflect slower sales growth as a result of strategic credit tightening and moderating consumer spending, which pressures loan growth and the net loss rate. • Macroeconomic assumptions: "Our outlook assumes a more challenging macroeconomic landscape with continued inflationary pressures. Our outlook continues to assume interest rate increases by the Federal Reserve will result in a nominal benefit to total net interest income. • Average loan growth: "Updated based on our new and renewed brand partner announcements, visibility into our pipeline, moderating consumer spending, strategic credit tightening actions, and the current economic outlook, we expect full year 2023 average credit card and other loans to grow low- to mid-single digits relative to 2022. • Total revenue: "Total revenue growth for 2023, excluding the gain on portfolio sale, is anticipated to be slightly above average loan growth, with a full year net interest margin similar to that of 2022. • Total expenses: "We anticipate an increase in full year total expenses versus 2022, although the pace of expense growth is projected to decelerate versus the 2022 rate. Expenses in the second half of 2023 are expected to be lower than the first half driven by lower intangible amortization expense and improved operating efficiencies. We remain focused on disciplined expense management as we adjust the pace and timing of our investments to align with our full year revenue and growth outlook. • Net loss rate: "We expect a net loss rate in the low-to-mid 7% range for 2023, inclusive of impacts from the 2022 transition of our credit card processing services, moderating consumer spending, our credit management actions, as well as continued pressure on consumers’ ability to pay due to persistent inflation. We remain confident in our long-term guidance of a through-the-cycle average net loss rate below our historical average of 6%. • Effective tax rate: "We expect our full year normalized effective tax rate to be in the range of 25% to 26%, with quarter-over-quarter variability due to the timing of certain discrete items." "Our second quarter financial results demonstrated continued financial resilience, highlighted by 7% year-over- year revenue growth driven by 4% growth in average loans. For the ninth consecutive quarter, PPNR grew year-over- year, albeit nominally this quarter, reflecting our ability to deliver sustainable, quality growth. As expected, second quarter net interest margin declined slightly versus the first quarter of 2023 due to a greater reversal of interest and fees related to higher losses in the quarter as well as seasonality. Expenses were lower sequentially as we effectively managed our costs, while continuing to invest in technology modernization, digital advancement, and product innovation, consistent with our business strategy. "We made great progress in the second quarter by further strengthening our balance sheet, including refinancing our term loan and revolving line of credit, completing our convertible notes offering, executing our tender offer, and receiving bank board approval for a $500 million dividend from the banks which facilitated debt reduction. We remain disciplined, building capital while improving our leverage ratios. Our direct-to-consumer deposit balances grew 43% versus the second quarter of 2022, with net inflows each week during the second quarter. "From a credit perspective, our second quarter results were in-line with our expectations as persistent inflation broadly impacted consumer spending, while the net loss rate primarily reflected timing-related effects of the customer accommodations made following the transition of our credit card processing services in June 2022. We expect a lower net loss rate in the second half of the year as we move past the impacts of these customer accommodations. We also continued to responsibly tighten underwriting and credit lines, leading to a slowing in loan growth. "Our reserve rate remained flat to the first quarter of 2023 at 12.3% as key macroeconomic indicators began showing signs of stability. We continue to maintain conservative economic scenario weightings in our credit reserve modeling and believe that with our conservative model assumptions, our loan loss reserve provides a margin of protection should we enter a more challenging macroeconomic environment. "We remain confident in our ability to deliver on our 2023 full year financial outlook and build on this success for the future." - Perry Beberman, executive vice president and chief financial officer CFO COMMENTARY
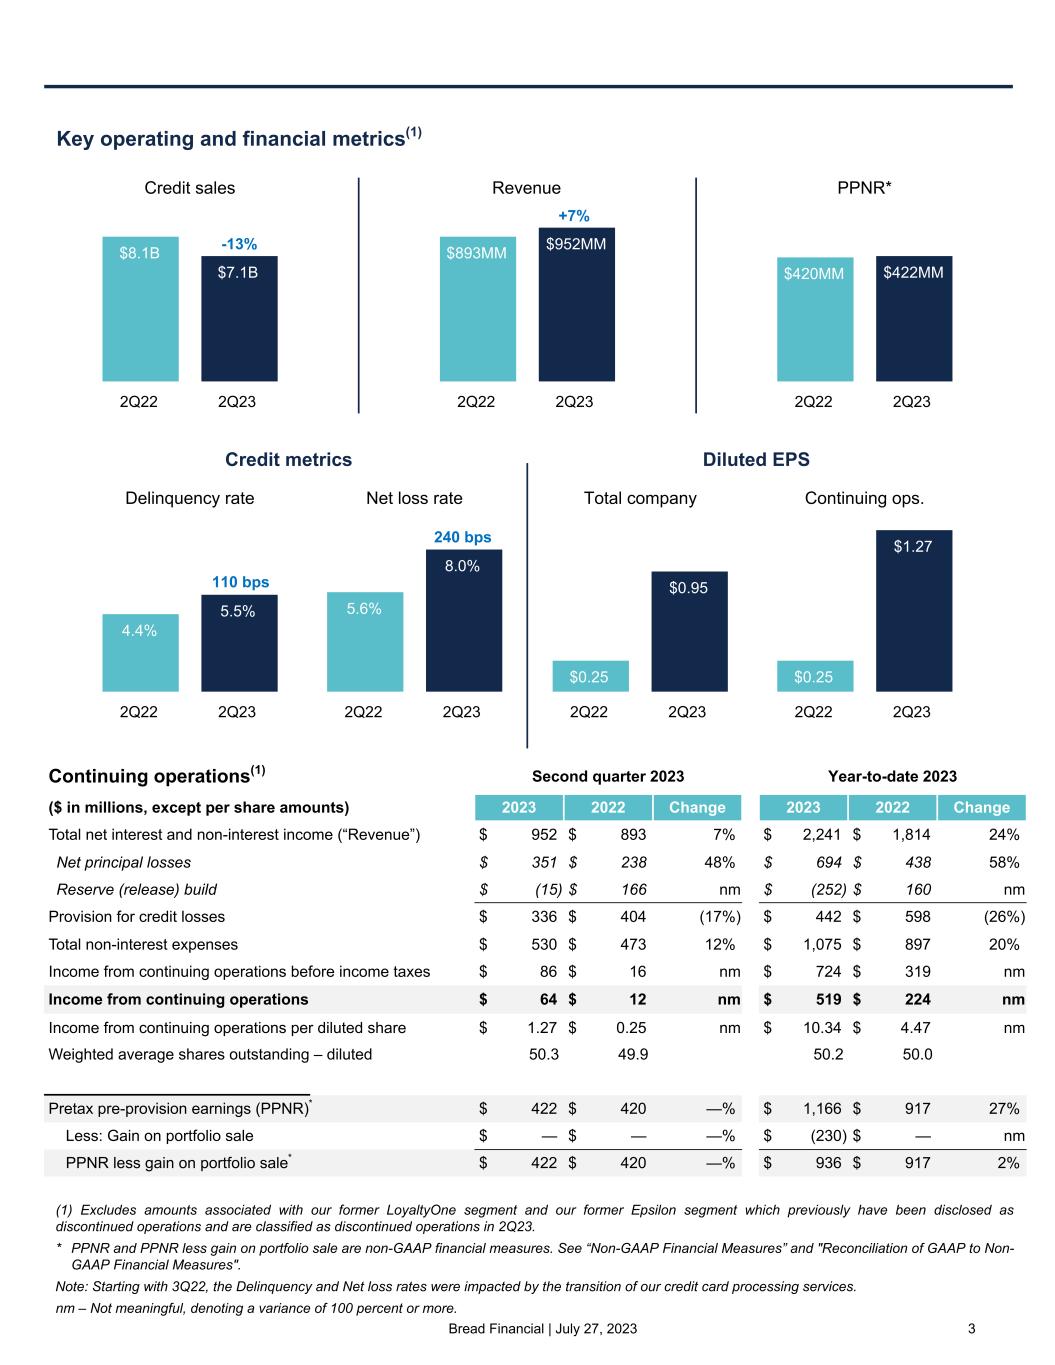
Bread Financial | July 27, 2023 3 Continuing operations(1) Second quarter 2023 Year-to-date 2023 ($ in millions, except per share amounts) 2023 2022 Change 2023 2022 Change Total net interest and non-interest income (“Revenue”) $ 952 $ 893 7% $ 2,241 $ 1,814 24% Net principal losses $ 351 $ 238 48% $ 694 $ 438 58% Reserve (release) build $ (15) $ 166 nm $ (252) $ 160 nm Provision for credit losses $ 336 $ 404 (17%) $ 442 $ 598 (26%) Total non-interest expenses $ 530 $ 473 12% $ 1,075 $ 897 20% Income from continuing operations before income taxes $ 86 $ 16 nm $ 724 $ 319 nm Income from continuing operations $ 64 $ 12 nm $ 519 $ 224 nm Income from continuing operations per diluted share $ 1.27 $ 0.25 nm $ 10.34 $ 4.47 nm Weighted average shares outstanding – diluted 50.3 49.9 50.2 50.0 Pretax pre-provision earnings (PPNR)* $ 422 $ 420 —% $ 1,166 $ 917 27% Less: Gain on portfolio sale $ — $ — —% $ (230) $ — nm PPNR less gain on portfolio sale* $ 422 $ 420 —% $ 936 $ 917 2% PPNR* $420MM $422MM 2Q22 2Q23 Revenue $893MM $952MM 2Q22 2Q23 +7% Key operating and financial metrics(1) Credit metrics (1) Excludes amounts associated with our former LoyaltyOne segment and our former Epsilon segment which previously have been disclosed as discontinued operations and are classified as discontinued operations in 2Q23. * PPNR and PPNR less gain on portfolio sale are non-GAAP financial measures. See “Non-GAAP Financial Measures” and "Reconciliation of GAAP to Non- GAAP Financial Measures". Note: Starting with 3Q22, the Delinquency and Net loss rates were impacted by the transition of our credit card processing services. nm – Not meaningful, denoting a variance of 100 percent or more. Diluted EPS Credit sales $8.1B $7.1B 2Q22 2Q23 -13% Net loss rate 5.6% 8.0% 2Q22 2Q23 Delinquency rate 4.4% 5.5% 2Q22 2Q23 Total company $0.25 $0.95 2Q22 2Q23 Continuing ops. $0.25 $1.27 2Q22 2Q23 110 bps 240 bps
Bread Financial | July 27, 2023 4 Second quarter 2023 compared with second quarter 2022 – continuing operations • Credit sales were $7.1 billion for the second quarter of 2023, a decrease of $1.1 billion, or 13%, versus the second quarter of 2022, reflecting the sale of the BJ's Wholesale Club portfolio in late February 2023, credit tightening, and moderating consumer spending, partially offset by new partner growth. • Average and end-of-period credit card and other loans were $17.7 billion and $18.0 billion, respectively, up 4% and 1%, respectively. These increases were driven by the addition of new partners as well as further moderation in the consumer payment rate, partially offset by the sale of the BJ's portfolio. • Revenue increased $59 million, or 7%, resulting from higher average credit card and other loan balances and non- interest income, partially offset by increased reversals of interest and fees resulting from higher gross losses. • Total non-interest expenses increased $57 million, or 12%, as card and processing expenses increased $32 million, or 37%; employee compensation and benefit costs increased $26 million, or 14%; and information processing and communications expenses increased $14 million, or 23%. • Income from continuing operations increased $52 million due to revenue growth and a lower provision for credit losses, partially offset by expense growth. • PPNR, a non-GAAP financial measure, increased $2 million, reflecting nominal growth versus the second quarter of 2022. • The delinquency rate of 5.5% increased from 4.4% in the second quarter of 2022 and decreased from 5.7% in the first quarter of 2023. The year-over-year increase was primarily the result of expected consumer payment rate normalization. • The net loss rate of 8.0% increased from 5.6% in the second quarter of 2022 and 7.0% in the first quarter of 2023. The second quarter of 2023 rate reflected an approximately 100 basis point impact from the June 2022 transition of our credit card processing services, as well as continued consumer payment rate normalization. Contacts Investor Relations: Brian Vereb (brian.vereb@breadfinancial.com) Susan Haugen (susan.haugen@breadfinancial.com) Media Relations: Rachel Stultz (rachel.stultz@breadfinancial.com)
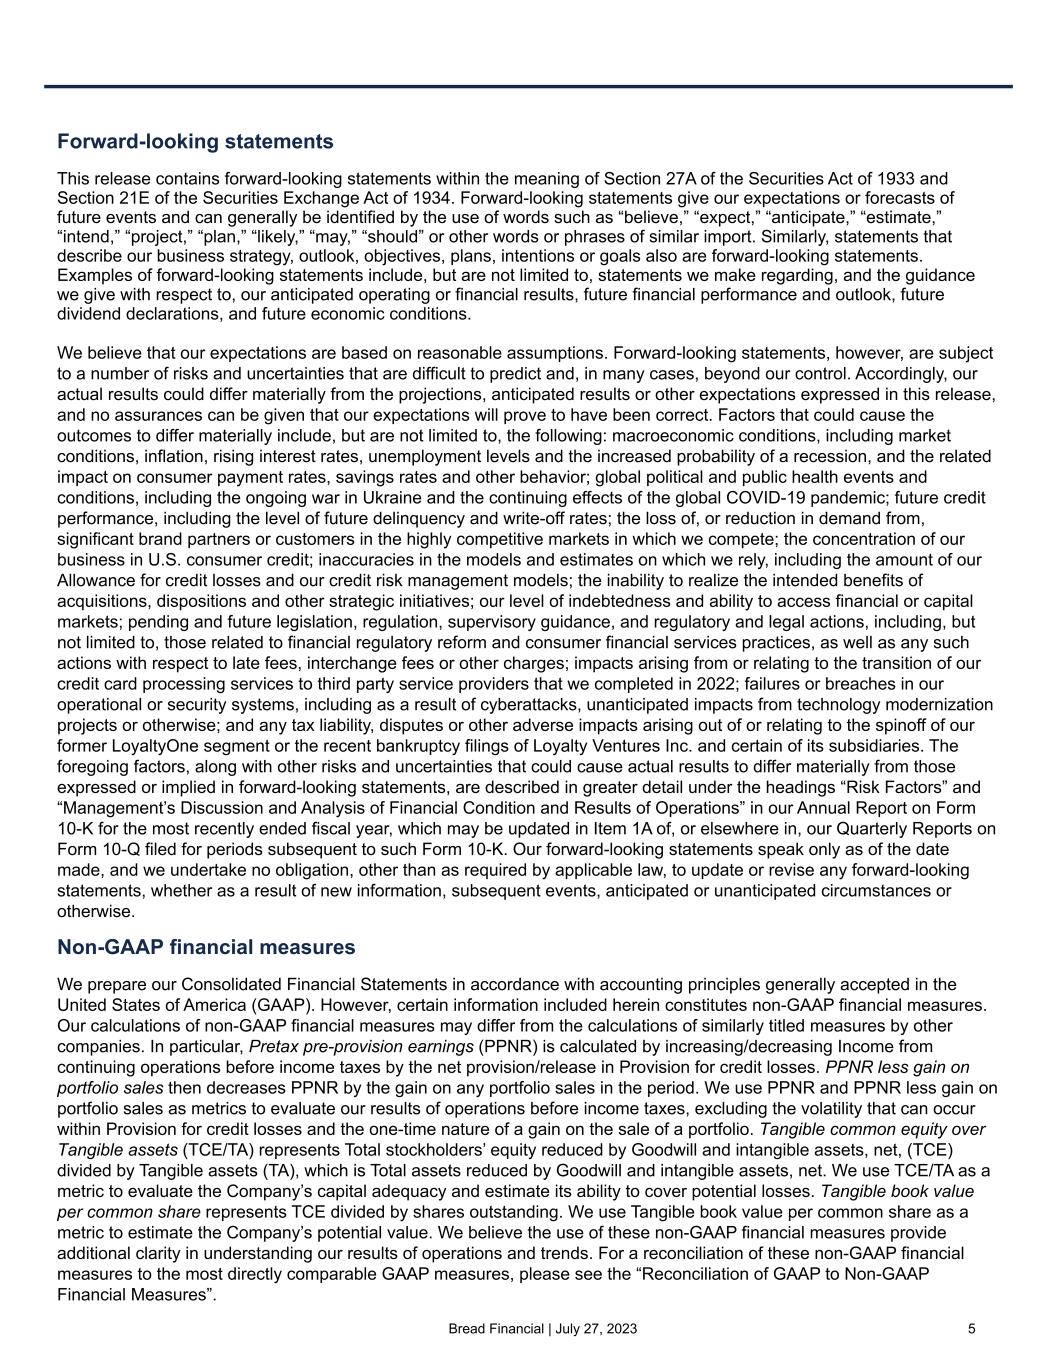
Bread Financial | July 27, 2023 5 Forward-looking statements This release contains forward-looking statements within the meaning of Section 27A of the Securities Act of 1933 and Section 21E of the Securities Exchange Act of 1934. Forward-looking statements give our expectations or forecasts of future events and can generally be identified by the use of words such as “believe,” “expect,” “anticipate,” “estimate,” “intend,” “project,” “plan,” “likely,” “may,” “should” or other words or phrases of similar import. Similarly, statements that describe our business strategy, outlook, objectives, plans, intentions or goals also are forward-looking statements. Examples of forward-looking statements include, but are not limited to, statements we make regarding, and the guidance we give with respect to, our anticipated operating or financial results, future financial performance and outlook, future dividend declarations, and future economic conditions. We believe that our expectations are based on reasonable assumptions. Forward-looking statements, however, are subject to a number of risks and uncertainties that are difficult to predict and, in many cases, beyond our control. Accordingly, our actual results could differ materially from the projections, anticipated results or other expectations expressed in this release, and no assurances can be given that our expectations will prove to have been correct. Factors that could cause the outcomes to differ materially include, but are not limited to, the following: macroeconomic conditions, including market conditions, inflation, rising interest rates, unemployment levels and the increased probability of a recession, and the related impact on consumer payment rates, savings rates and other behavior; global political and public health events and conditions, including the ongoing war in Ukraine and the continuing effects of the global COVID-19 pandemic; future credit performance, including the level of future delinquency and write-off rates; the loss of, or reduction in demand from, significant brand partners or customers in the highly competitive markets in which we compete; the concentration of our business in U.S. consumer credit; inaccuracies in the models and estimates on which we rely, including the amount of our Allowance for credit losses and our credit risk management models; the inability to realize the intended benefits of acquisitions, dispositions and other strategic initiatives; our level of indebtedness and ability to access financial or capital markets; pending and future legislation, regulation, supervisory guidance, and regulatory and legal actions, including, but not limited to, those related to financial regulatory reform and consumer financial services practices, as well as any such actions with respect to late fees, interchange fees or other charges; impacts arising from or relating to the transition of our credit card processing services to third party service providers that we completed in 2022; failures or breaches in our operational or security systems, including as a result of cyberattacks, unanticipated impacts from technology modernization projects or otherwise; and any tax liability, disputes or other adverse impacts arising out of or relating to the spinoff of our former LoyaltyOne segment or the recent bankruptcy filings of Loyalty Ventures Inc. and certain of its subsidiaries. The foregoing factors, along with other risks and uncertainties that could cause actual results to differ materially from those expressed or implied in forward-looking statements, are described in greater detail under the headings “Risk Factors” and “Management’s Discussion and Analysis of Financial Condition and Results of Operations” in our Annual Report on Form 10-K for the most recently ended fiscal year, which may be updated in Item 1A of, or elsewhere in, our Quarterly Reports on Form 10-Q filed for periods subsequent to such Form 10-K. Our forward-looking statements speak only as of the date made, and we undertake no obligation, other than as required by applicable law, to update or revise any forward-looking statements, whether as a result of new information, subsequent events, anticipated or unanticipated circumstances or otherwise. Non-GAAP financial measures We prepare our Consolidated Financial Statements in accordance with accounting principles generally accepted in the United States of America (GAAP). However, certain information included herein constitutes non-GAAP financial measures. Our calculations of non-GAAP financial measures may differ from the calculations of similarly titled measures by other companies. In particular, Pretax pre-provision earnings (PPNR) is calculated by increasing/decreasing Income from continuing operations before income taxes by the net provision/release in Provision for credit losses. PPNR less gain on portfolio sales then decreases PPNR by the gain on any portfolio sales in the period. We use PPNR and PPNR less gain on portfolio sales as metrics to evaluate our results of operations before income taxes, excluding the volatility that can occur within Provision for credit losses and the one-time nature of a gain on the sale of a portfolio. Tangible common equity over Tangible assets (TCE/TA) represents Total stockholders’ equity reduced by Goodwill and intangible assets, net, (TCE) divided by Tangible assets (TA), which is Total assets reduced by Goodwill and intangible assets, net. We use TCE/TA as a metric to evaluate the Company’s capital adequacy and estimate its ability to cover potential losses. Tangible book value per common share represents TCE divided by shares outstanding. We use Tangible book value per common share as a metric to estimate the Company’s potential value. We believe the use of these non-GAAP financial measures provide additional clarity in understanding our results of operations and trends. For a reconciliation of these non-GAAP financial measures to the most directly comparable GAAP measures, please see the “Reconciliation of GAAP to Non-GAAP Financial Measures”.
Bread Financial | July 27, 2023 6 Conference call / webcast information Bread Financial will host a conference call on Thursday, July 27, 2023, at 8:30 a.m. (Eastern Time) to discuss the company’s second quarter results. The conference call will be available via the internet at investor.breadfinancial.com. There will be several slides accompanying the webcast. Please go to the website at least 15 minutes prior to the call to register, download, and install any necessary software. The recorded webcast will also be available on the company’s website. About Bread Financial™ Bread Financial™ (NYSE: BFH) is a tech-forward financial services company providing simple, personalized payment, lending and saving solutions. The company creates opportunities for its customers and partners through digitally enabled choices that offer ease, empowerment, financial flexibility and exceptional customer experiences. Driven by a digital-first approach, data insights and white-label technology, Bread Financial delivers growth for its partners through a comprehensive suite of payment solutions that includes private label and co-brand credit cards and Bread Pay™ buy now, pay later products. Bread Financial also offers direct-to-consumer products that give customers more access, choice and freedom through its branded Bread Cashback™ American Express® Credit Card and Bread Savings™ products. Headquartered in Columbus, Ohio, Bread Financial is powered by its 7,500+ global associates and is committed to sustainable business practices. To learn more about Bread Financial, visit breadfinancial.com or follow us on Facebook, LinkedIn, Twitter and Instagram.
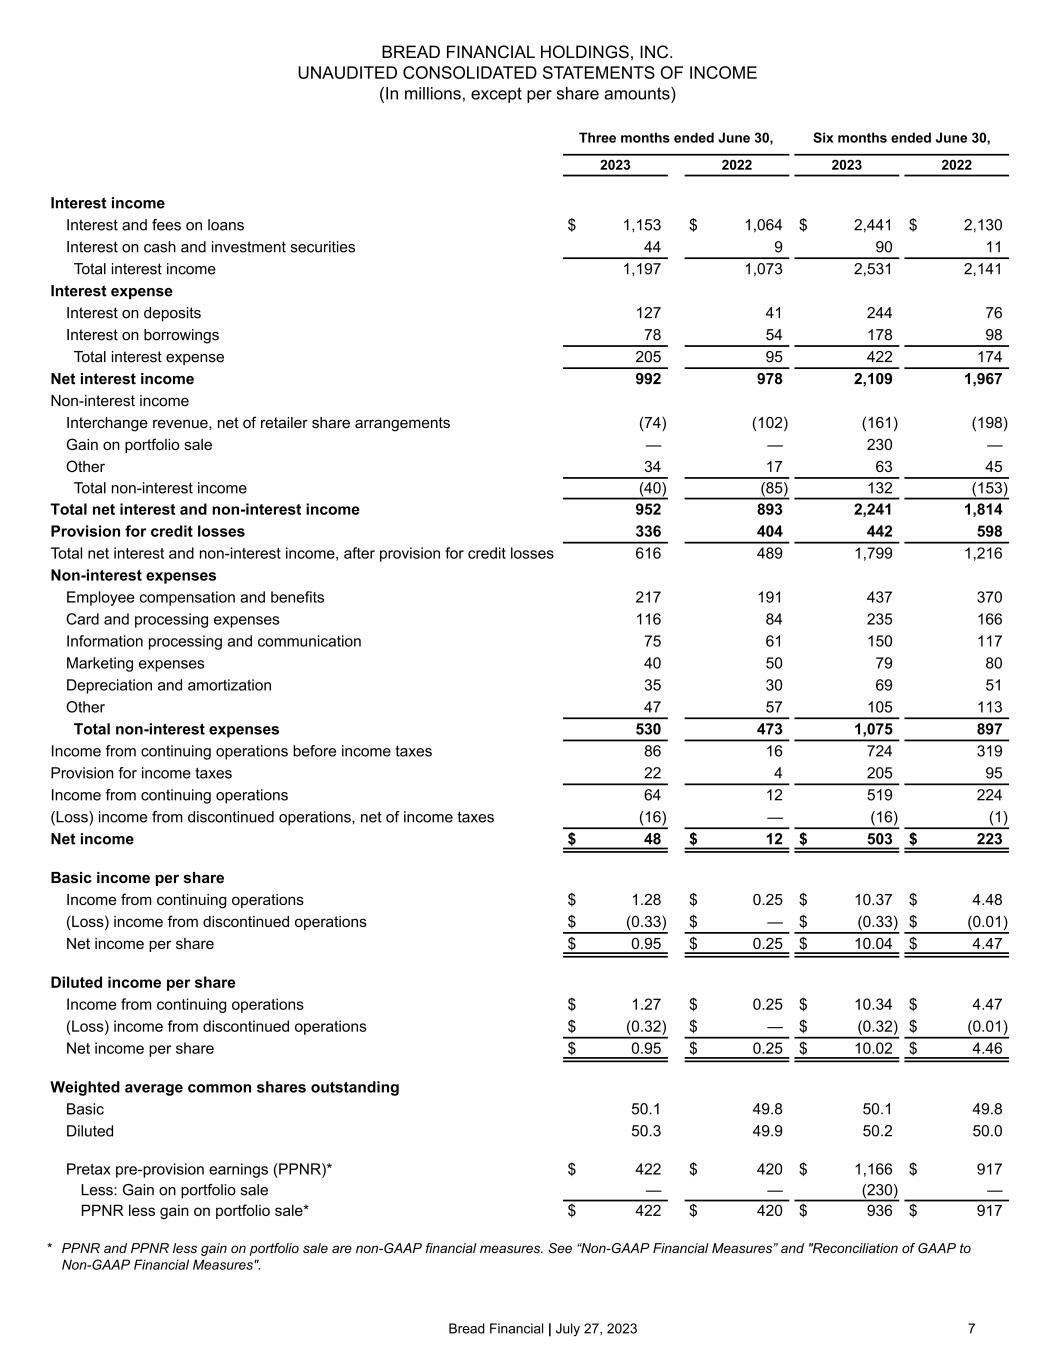
Bread Financial | July 27, 2023 7 Three months ended June 30, Six months ended June 30, 2023 2022 2023 2022 Interest income Interest and fees on loans $ 1,153 $ 1,064 $ 2,441 $ 2,130 Interest on cash and investment securities 44 9 90 11 Total interest income 1,197 1,073 2,531 2,141 Interest expense Interest on deposits 127 41 244 76 Interest on borrowings 78 54 178 98 Total interest expense 205 95 422 174 Net interest income 992 978 2,109 1,967 Non-interest income Interchange revenue, net of retailer share arrangements (74) (102) (161) (198) Gain on portfolio sale — — 230 — Other 34 17 63 45 Total non-interest income (40) (85) 132 (153) Total net interest and non-interest income 952 893 2,241 1,814 Provision for credit losses 336 404 442 598 Total net interest and non-interest income, after provision for credit losses 616 489 1,799 1,216 Non-interest expenses Employee compensation and benefits 217 191 437 370 Card and processing expenses 116 84 235 166 Information processing and communication 75 61 150 117 Marketing expenses 40 50 79 80 Depreciation and amortization 35 30 69 51 Other 47 57 105 113 Total non-interest expenses 530 473 1,075 897 Income from continuing operations before income taxes 86 16 724 319 Provision for income taxes 22 4 205 95 Income from continuing operations 64 12 519 224 (Loss) income from discontinued operations, net of income taxes (16) — (16) (1) Net income $ 48 $ 12 $ 503 $ 223 Basic income per share Income from continuing operations $ 1.28 $ 0.25 $ 10.37 $ 4.48 (Loss) income from discontinued operations $ (0.33) $ — $ (0.33) $ (0.01) Net income per share $ 0.95 $ 0.25 $ 10.04 $ 4.47 Diluted income per share Income from continuing operations $ 1.27 $ 0.25 $ 10.34 $ 4.47 (Loss) income from discontinued operations $ (0.32) $ — $ (0.32) $ (0.01) Net income per share $ 0.95 $ 0.25 $ 10.02 $ 4.46 Weighted average common shares outstanding Basic 50.1 49.8 50.1 49.8 Diluted 50.3 49.9 50.2 50.0 Pretax pre-provision earnings (PPNR)* $ 422 $ 420 $ 1,166 $ 917 Less: Gain on portfolio sale — — (230) — PPNR less gain on portfolio sale* $ 422 $ 420 $ 936 $ 917 BREAD FINANCIAL HOLDINGS, INC. UNAUDITED CONSOLIDATED STATEMENTS OF INCOME (In millions, except per share amounts) * PPNR and PPNR less gain on portfolio sale are non-GAAP financial measures. See “Non-GAAP Financial Measures” and "Reconciliation of GAAP to Non-GAAP Financial Measures".

Bread Financial | July 27, 2023 8 BREAD FINANCIAL HOLDINGS, INC. UNAUDITED CONSOLIDATED BALANCE SHEETS (In millions) June 30, 2023 December 31, 2022 ASSETS Cash and cash equivalents $ 3,325 $ 3,891 Credit card and other loans Total credit card and other loans 17,962 21,365 Allowance for credit losses (2,208) (2,464) Credit card and other loans, net 15,754 18,901 Investment securities 239 221 Property and equipment, net 162 195 Goodwill and intangible assets, net 780 799 Other assets 1,349 1,400 Total assets $ 21,609 $ 25,407 LIABILITIES AND STOCKHOLDERS' EQUITY Deposits Direct-to-consumer (retail) $ 5,993 $ 5,466 Wholesale and other 7,055 8,360 Total deposits 13,048 13,826 Debt issued by consolidated variable interest entities 3,323 6,115 Long-term and other debt 1,375 1,892 Other liabilities 1,127 1,309 Total liabilities 18,873 23,142 Total stockholders’ equity 2,736 2,265 Total liabilities and stockholders’ equity $ 21,609 $ 25,407 Shares of common stock outstanding 50.1 49.9
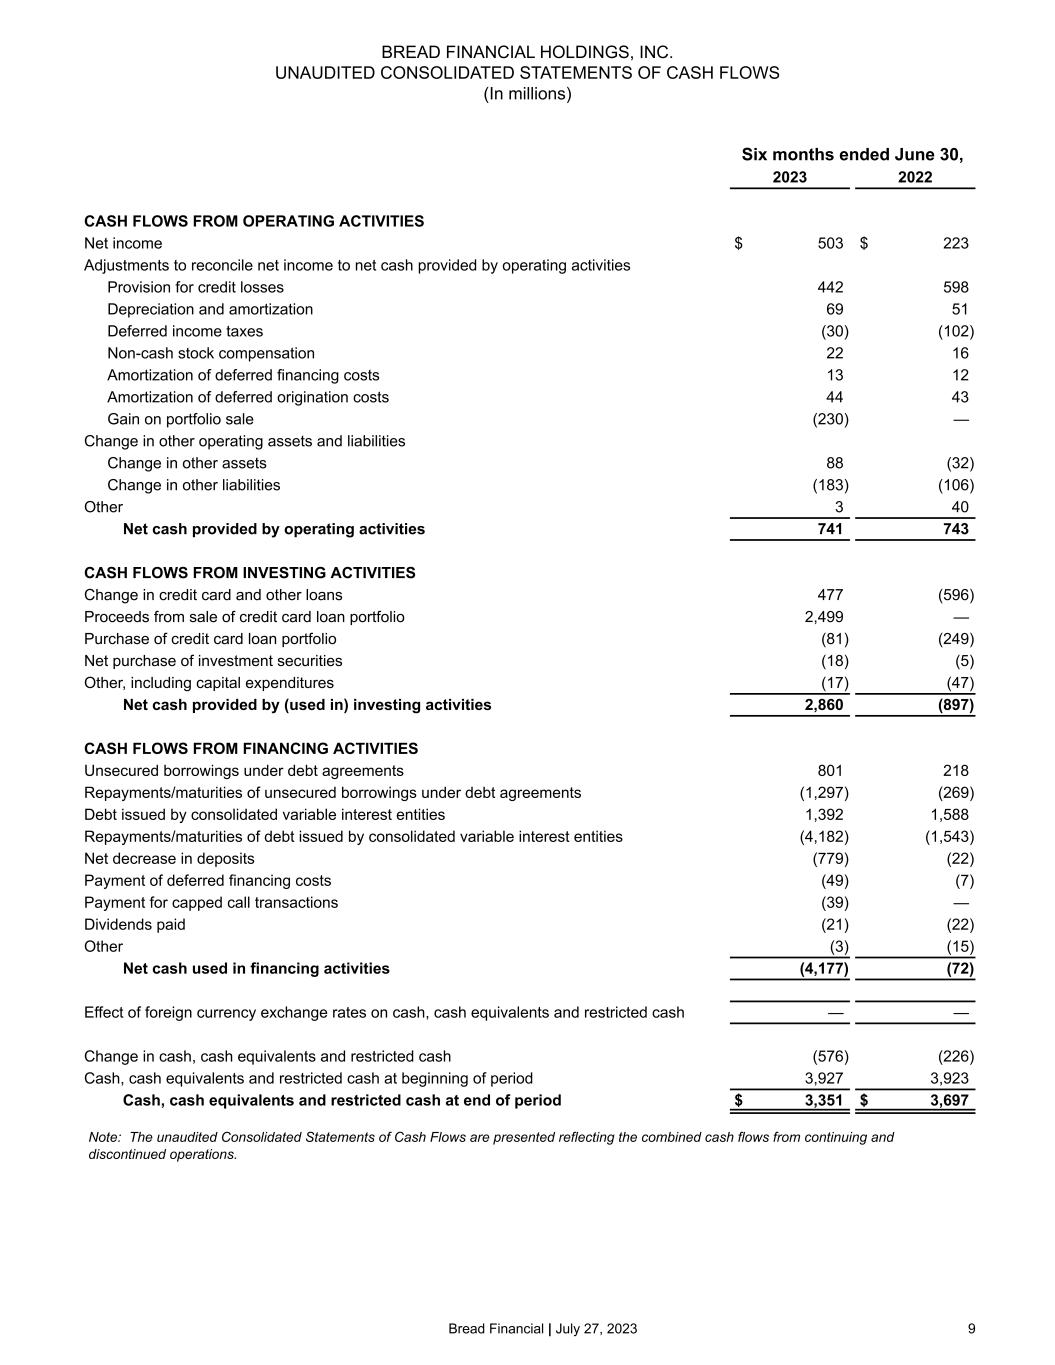
Bread Financial | July 27, 2023 9 Note: The unaudited Consolidated Statements of Cash Flows are presented reflecting the combined cash flows from continuing and discontinued operations. BREAD FINANCIAL HOLDINGS, INC. UNAUDITED CONSOLIDATED STATEMENTS OF CASH FLOWS (In millions) Six months ended June 30, 2023 2022 CASH FLOWS FROM OPERATING ACTIVITIES Net income $ 503 $ 223 Adjustments to reconcile net income to net cash provided by operating activities Provision for credit losses 442 598 Depreciation and amortization 69 51 Deferred income taxes (30) (102) Non-cash stock compensation 22 16 Amortization of deferred financing costs 13 12 Amortization of deferred origination costs 44 43 Gain on portfolio sale (230) — Change in other operating assets and liabilities Change in other assets 88 (32) Change in other liabilities (183) (106) Other 3 40 Net cash provided by operating activities 741 743 CASH FLOWS FROM INVESTING ACTIVITIES Change in credit card and other loans 477 (596) Proceeds from sale of credit card loan portfolio 2,499 — Purchase of credit card loan portfolio (81) (249) Net purchase of investment securities (18) (5) Other, including capital expenditures (17) (47) Net cash provided by (used in) investing activities 2,860 (897) CASH FLOWS FROM FINANCING ACTIVITIES Unsecured borrowings under debt agreements 801 218 Repayments/maturities of unsecured borrowings under debt agreements (1,297) (269) Debt issued by consolidated variable interest entities 1,392 1,588 Repayments/maturities of debt issued by consolidated variable interest entities (4,182) (1,543) Net decrease in deposits (779) (22) Payment of deferred financing costs (49) (7) Payment for capped call transactions (39) — Dividends paid (21) (22) Other (3) (15) Net cash used in financing activities (4,177) (72) Effect of foreign currency exchange rates on cash, cash equivalents and restricted cash — — Change in cash, cash equivalents and restricted cash (576) (226) Cash, cash equivalents and restricted cash at beginning of period 3,927 3,923 Cash, cash equivalents and restricted cash at end of period $ 3,351 $ 3,697
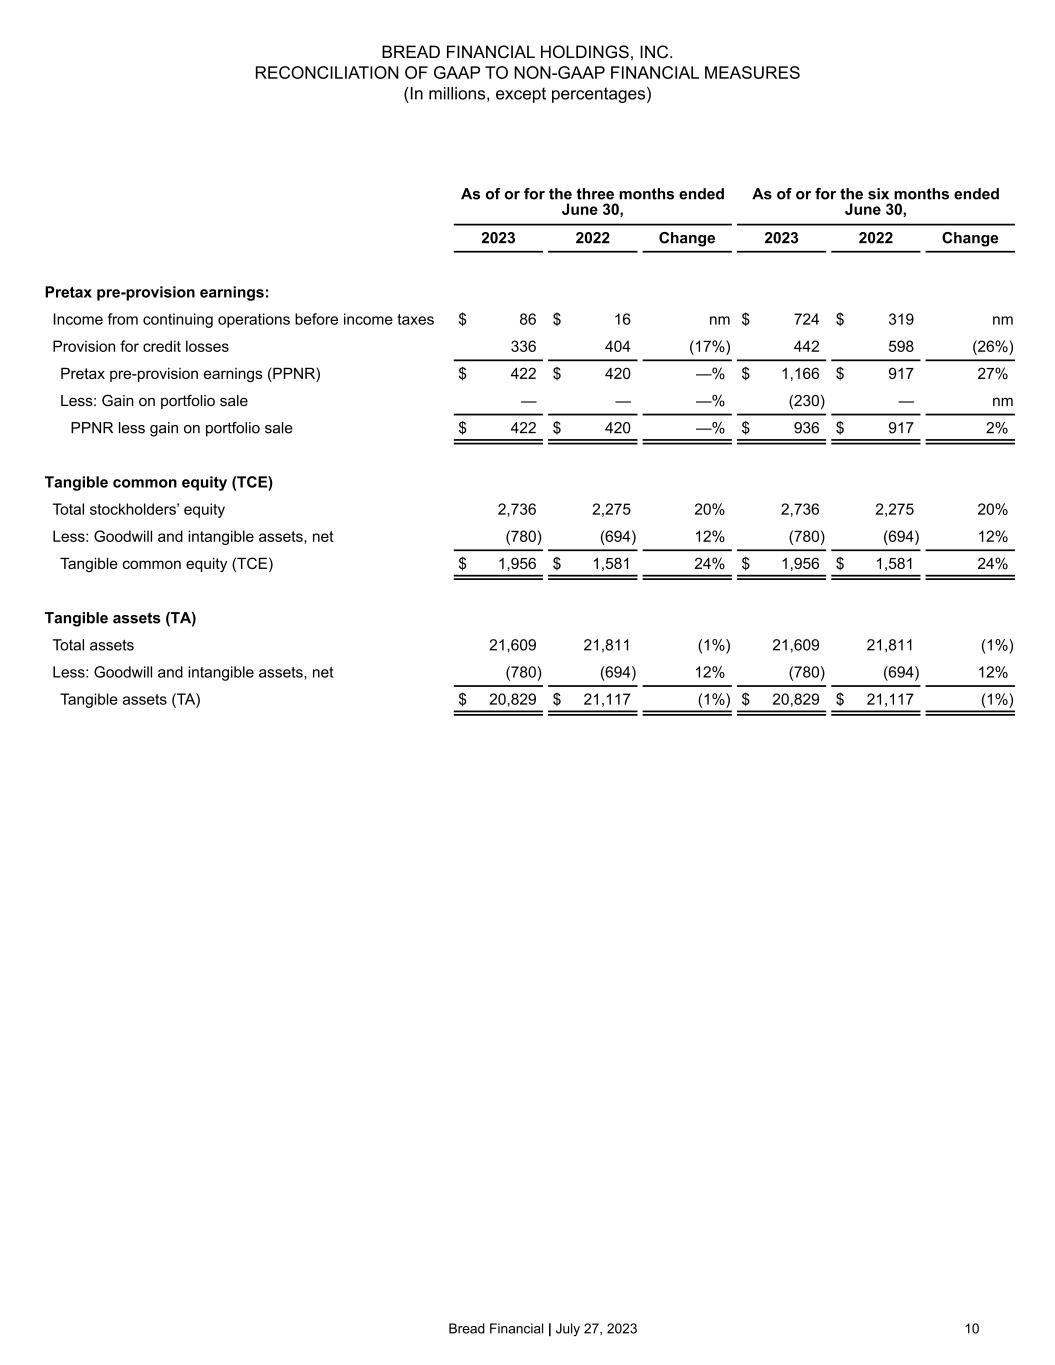
Bread Financial | July 27, 2023 10 BREAD FINANCIAL HOLDINGS, INC. RECONCILIATION OF GAAP TO NON-GAAP FINANCIAL MEASURES (In millions, except percentages) As of or for the three months ended June 30, As of or for the six months ended June 30, 2023 2022 Change 2023 2022 Change Pretax pre-provision earnings: Income from continuing operations before income taxes $ 86 $ 16 nm $ 724 $ 319 nm Provision for credit losses 336 404 (17%) 442 598 (26%) Pretax pre-provision earnings (PPNR) $ 422 $ 420 —% $ 1,166 $ 917 27% Less: Gain on portfolio sale — — —% (230) — nm PPNR less gain on portfolio sale $ 422 $ 420 —% $ 936 $ 917 2% Tangible common equity (TCE) Total stockholders’ equity 2,736 2,275 20% 2,736 2,275 20% Less: Goodwill and intangible assets, net (780) (694) 12% (780) (694) 12% Tangible common equity (TCE) $ 1,956 $ 1,581 24% $ 1,956 $ 1,581 24% Tangible assets (TA) Total assets 21,609 21,811 (1%) 21,609 21,811 (1%) Less: Goodwill and intangible assets, net (780) (694) 12% (780) (694) 12% Tangible assets (TA) $ 20,829 $ 21,117 (1%) $ 20,829 $ 21,117 (1%)
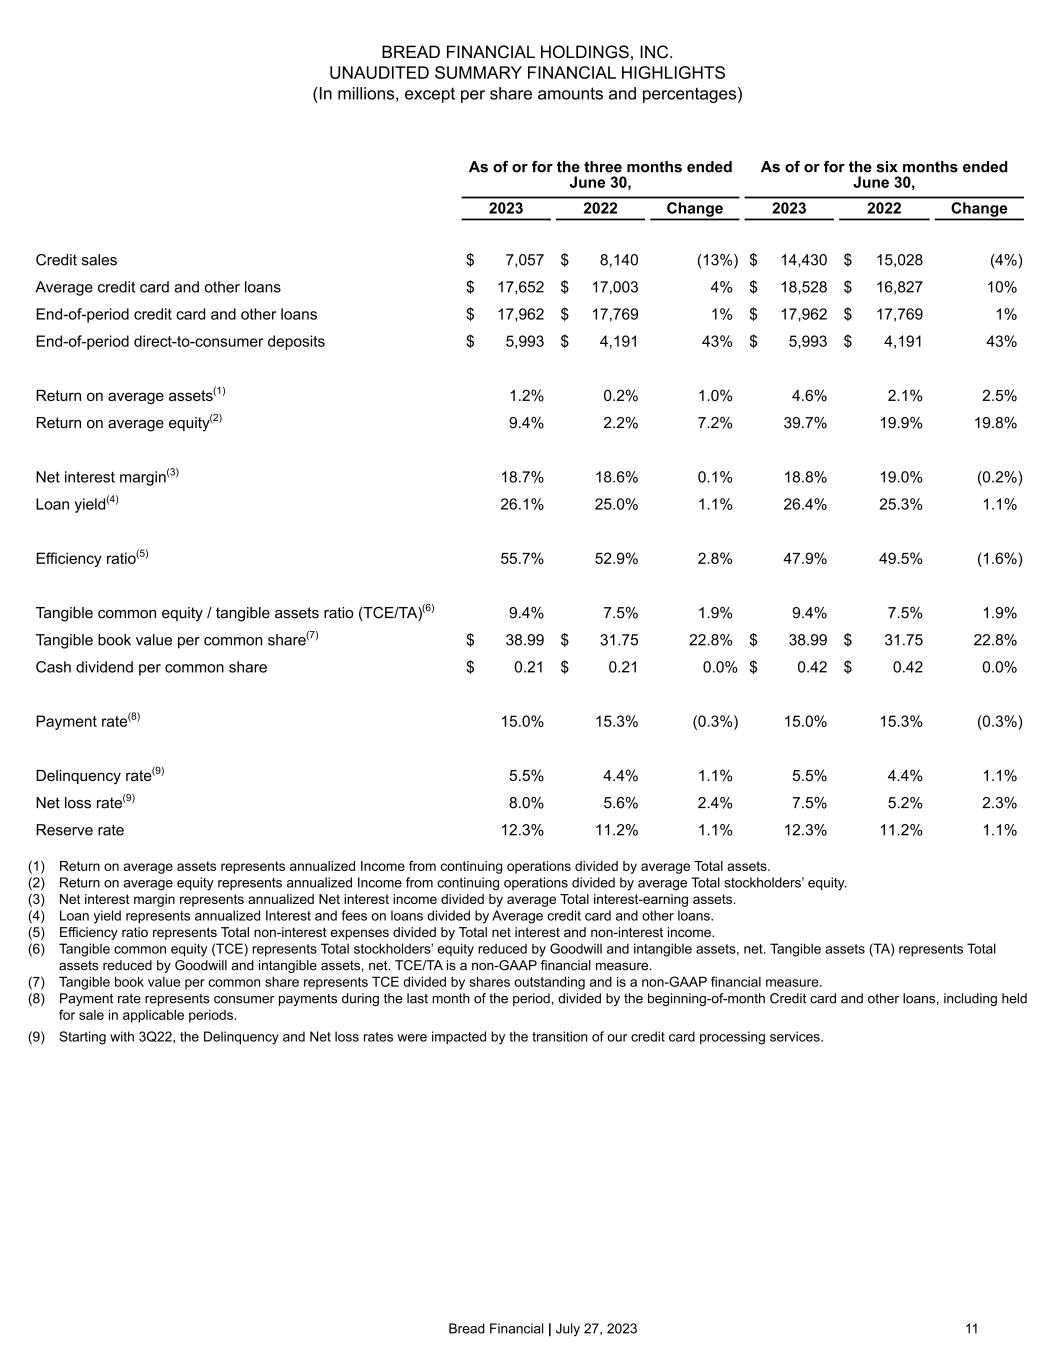
Bread Financial | July 27, 2023 11 BREAD FINANCIAL HOLDINGS, INC. UNAUDITED SUMMARY FINANCIAL HIGHLIGHTS (In millions, except per share amounts and percentages) As of or for the three months ended June 30, As of or for the six months ended June 30, 2023 2022 Change 2023 2022 Change Credit sales $ 7,057 $ 8,140 (13%) $ 14,430 $ 15,028 (4%) Average credit card and other loans $ 17,652 $ 17,003 4% $ 18,528 $ 16,827 10% End-of-period credit card and other loans $ 17,962 $ 17,769 1% $ 17,962 $ 17,769 1% End-of-period direct-to-consumer deposits $ 5,993 $ 4,191 43% $ 5,993 $ 4,191 43% Return on average assets(1) 1.2% 0.2% 1.0% 4.6% 2.1% 2.5% Return on average equity(2) 9.4% 2.2% 7.2% 39.7% 19.9% 19.8% Net interest margin(3) 18.7% 18.6% 0.1% 18.8% 19.0% (0.2%) Loan yield(4) 26.1% 25.0% 1.1% 26.4% 25.3% 1.1% Efficiency ratio(5) 55.7% 52.9% 2.8% 47.9% 49.5% (1.6%) Tangible common equity / tangible assets ratio (TCE/TA)(6) 9.4% 7.5% 1.9% 9.4% 7.5% 1.9% Tangible book value per common share(7) $ 38.99 $ 31.75 22.8% $ 38.99 $ 31.75 22.8% Cash dividend per common share $ 0.21 $ 0.21 0.0% $ 0.42 $ 0.42 0.0% Payment rate(8) 15.0% 15.3% (0.3%) 15.0% 15.3% (0.3%) Delinquency rate(9) 5.5% 4.4% 1.1% 5.5% 4.4% 1.1% Net loss rate(9) 8.0% 5.6% 2.4% 7.5% 5.2% 2.3% Reserve rate 12.3% 11.2% 1.1% 12.3% 11.2% 1.1% (1) Return on average assets represents annualized Income from continuing operations divided by average Total assets. (2) Return on average equity represents annualized Income from continuing operations divided by average Total stockholders’ equity. (3) Net interest margin represents annualized Net interest income divided by average Total interest-earning assets. (4) Loan yield represents annualized Interest and fees on loans divided by Average credit card and other loans. (5) Efficiency ratio represents Total non-interest expenses divided by Total net interest and non-interest income. (6) Tangible common equity (TCE) represents Total stockholders’ equity reduced by Goodwill and intangible assets, net. Tangible assets (TA) represents Total assets reduced by Goodwill and intangible assets, net. TCE/TA is a non-GAAP financial measure. (7) Tangible book value per common share represents TCE divided by shares outstanding and is a non-GAAP financial measure. (8) Payment rate represents consumer payments during the last month of the period, divided by the beginning-of-month Credit card and other loans, including held for sale in applicable periods. (9) Starting with 3Q22, the Delinquency and Net loss rates were impacted by the transition of our credit card processing services.


