UNITED STATES
SECURITIES AND EXCHANGE COMMISSION
Washington, D.C. 20549
FORM 10-K
(Mark One)
x ANNUAL REPORT PURSUANT TO SECTION 13 OR 15(d) OF THE SECURITIES EXCHANGE ACT OF 1934
For the fiscal year ended December 31, 2024
or
o TRANSITION REPORT PURSUANT TO SECTION 13 OR 15(d) OF THE SECURITIES EXCHANGE ACT OF 1934
For the transition period from to
Commission file number 001-15749
__________________________________________________
BREAD FINANCIAL HOLDINGS, INC.
(Exact name of registrant as specified in its charter)
| | | | | | | | |
| Delaware | | 31-1429215 |
(State or other jurisdiction of
incorporation or organization) | (I.R.S. Employer
Identification No.) |
| |
| 3095 Loyalty Circle | 43219 |
| Columbus, Ohio | (Zip Code) |
| (Address of principal executive offices) | |
(614) 729-4000
(Registrant’s telephone number, including area code)
__________________________________________________
Securities registered pursuant to Section 12(b) of the Act:
| | | | | | | | | | | | | | |
| Title of each class | | Trading symbol | | Name of each exchange on which registered |
| Common stock, par value $0.01 per share | | BFH | | New York Stock Exchange |
Securities registered pursuant to Section 12(g) of the Act:
None
(Title of class)
__________________________________________________
Indicate by check mark if the registrant is a well-known seasoned issuer, as defined in Rule 405 of the Securities Act. Yes x No o
Indicate by check mark if the registrant is not required to file reports pursuant to Section 13 or Section 15(d) of the Act. Yes o No x
Indicate by check mark whether the registrant (1) has filed all reports required to be filed by Section 13 or 15(d) of the Securities Exchange Act of 1934 during the preceding 12 months (or for such shorter period that the registrant was required to file such reports), and (2) has been subject to such filing requirements for the past 90 days. Yes x No o
Indicate by check mark whether the registrant has submitted electronically every Interactive Data File required to be submitted pursuant to Rule 405 of Regulation S-T (§232.405 of this chapter) during the preceding 12 months (or for such shorter period that the registrant was required to submit such files). Yes x No o
Indicate by check mark whether the registrant is a large accelerated filer, an accelerated filer, a non-accelerated filer, a smaller reporting company, or an emerging growth company. See the definitions of “large accelerated filer”, “accelerated filer”, “smaller reporting company”, and “emerging growth company” in Rule 12b-2 of the Exchange Act.
Large accelerated filer x Accelerated filer o Non-accelerated filer o Smaller reporting company o Emerging growth company o
If an emerging growth company, indicate by check mark if the registrant has elected not to use the extended transition period for complying with any new or revised financial accounting standards provided pursuant to Section 13(a) of the Exchange Act. o
Indicate by check mark whether the registrant has filed a report on and attestation to its management’s assessment of the effectiveness of its internal control over financial reporting under Section 404(b) of the Sarbanes-Oxley Act (15 U.S.C. 7262(b)) by the registered public accounting firm that prepared or issued its audit report. x
If securities are registered pursuant to Section 12(b) of the Act, indicate by check mark whether the financial statements of the registrant included in the filing reflect the correction of an error to previously issued financial statements. o
Indicate by check mark whether any of those error corrections are restatements that required a recovery analysis of incentive-based compensation received by any of the registrant’s executive officers during the relevant recovery period pursuant to §240.10D-1(b). o
Indicate by check mark whether the registrant is a shell company (as defined in Rule 12b-2 of the Act). Yes o No x
As of June 30, 2024, the aggregate market value of the common stock held by non-affiliates of the registrant was approximately $2.2 billion, based upon the closing sale price $44.56 as reported on the New York Stock Exchange on June 28, 2024, the last trading day immediately preceding June 30, 2024.
As of February 7, 2025, 49,092,356 shares of common stock of the registrant were outstanding.
Documents Incorporated By Reference
Certain information called for by Part III is incorporated by reference to certain sections of the Proxy Statement for the 2025 Annual Meeting of our stockholders, which will be filed with the Securities and Exchange Commission not later than 120 days after December 31, 2024.
BREAD FINANCIAL HOLDINGS, INC.
TABLE OF CONTENTS
| | | | | | | | | | | |
| Item No. | | Form 10-K Report Page |
| | | |
| | | |
| | | |
| | | |
| | | |
| | | |
| | | |
| | | |
| | | |
| | | |
| | | |
| | | |
| | | |
| | | |
| | [RESERVED] | |
| | | |
| | | |
| | | |
| | | |
| | | |
| | | |
| | | |
| | | |
| | | |
| | | |
| | | |
| | | |
| | | |
| | | |
| | | |
| | | |
| | | |
| | | |
This report includes trademarks, such as Bread®, Bread Financial®, Bread Cashback®, Bread Rewards™, Bread Pay® and Bread Savings®, which are protected under applicable intellectual property laws and are the property of Bread Financial Holdings, Inc. or our subsidiaries. This report also contains trademarks, service marks, copyrights and trade names of other companies, which are the property of their respective owners. Solely for convenience, our trademarks and trade names referred to in this report may appear without the ® or ™ symbols, but such references are not intended to indicate, in any way, that we will not assert, to the fullest extent under applicable law, our rights or the right of the applicable licensor to these trademarks and trade names.
Throughout this report, unless stated or the context implies otherwise, the terms “Bread Financial”, “BFH”, the “Company”, “we”, “our” or “us” refer to Bread Financial Holdings, Inc. and its subsidiaries on a consolidated basis. References to “Parent Company” refer to Bread Financial Holdings, Inc. on a parent-only standalone basis. In addition, in this report we may refer to the retailers and other companies with whom we do business as our “partners”, “brand partners”, or “clients”, provided that the use of the term “partner”, “partnering” or any similar term does not mean or imply a formal legal partnership, and is not meant in any way to alter the terms of Bread Financial’s relationship with any third parties. We offer our credit products through our insured depository institution subsidiaries, Comenity Bank and Comenity Capital Bank, which together are referred to herein as the “Banks”. Bread Financial or other of the terms listed above are also used in this report to include references to transactions and arrangements occurring prior to our name change from Alliance Data Systems Corporation to Bread Financial Holdings, Inc. in March 2022.
Cautionary Note Regarding Forward-Looking Statements
This Form 10-K and the documents incorporated by reference herein contain forward-looking statements within the meaning of Section 27A of the Securities Act of 1933, as amended, and Section 21E of the Securities Exchange Act of 1934, as amended. Forward-looking statements give our expectations or forecasts of future events and can generally be identified by the use of words such as “believe”, “expect”, “anticipate”, “estimate”, “intend”, “project”, “plan”, “likely”, “may”, “should” or other words or phrases of similar import. Similarly, statements that describe our business strategy, outlook, objectives, plans, intentions or goals also are forward-looking statements. Examples of forward-looking statements include, but are not limited to, statements we make regarding, and the guidance we give with respect to, our anticipated operating or financial results, future financial performance and outlook, future dividend declarations or stock repurchases and future economic conditions.
We believe that our expectations are based on reasonable assumptions. Forward-looking statements, however, are subject to a number of risks and uncertainties that are difficult to predict and, in many cases, beyond our control. Accordingly, our actual results could differ materially from the projections, anticipated results or other expectations expressed in this report, and no assurances can be given that our expectations will prove to have been correct. Factors that could cause the outcomes to differ materially include, but are not limited to, the following:
•macroeconomic conditions, including market conditions, inflation, interest rates, labor market conditions, recessionary pressures or concerns over a prolonged economic slowdown, and the related impact on consumer spending behavior, payments, debt levels, savings rates and other behaviors;
•global political, public health and social events or conditions, including ongoing wars and military conflicts, and natural disasters;
•future credit performance of our customers, including the level of future delinquency and write-off rates;
•loss of, or reduction in demand for services from, significant brand partners or customers in the highly competitive markets in which we compete;
•the concentration of our business in U.S. consumer credit;
•increases or volatility in the Allowance for credit losses that may result from the application of the current expected credit loss (CECL) model;
•inaccuracies in the models and estimates on which we rely, including the amount of our Allowance for credit losses and our credit risk management models;
•increases in fraudulent activity;
•failure to identify, complete or successfully integrate or disaggregate business acquisitions, divestitures and other strategic initiatives, including, with respect to divested businesses, any associated guarantees, indemnities or other liabilities;
•the extent to which our results are dependent upon our brand partners, including our brand partners’ financial performance and reputation, as well as the effective promotion and support of our products by brand partners;
•increases in the cost of doing business, including market interest rates;
•our level of indebtedness and inability to access financial or capital markets, including asset-backed securitization funding or deposits markets;
•restrictions that limit our Banks’ ability to pay dividends to us;
•pending and future litigation;
•pending and future federal, state, local and foreign legislation, regulation, supervisory guidance and regulatory and legal actions including, but not limited to, those related to financial regulatory reform and consumer financial services practices, as well as any such actions with respect to late fees, interchange fees or other charges;
•increases in regulatory capital requirements or other support for our Banks;
•impacts arising from or relating to the transition of our credit card processing services to third-party service providers that we completed in 2022;
•failures, or breaches in our operational or security systems, including as a result of cyberattacks, unanticipated impacts from technology modernization projects, failure of our information security controls or otherwise;
•loss of consumer information or other data due to compromised physical or cyber security, including disruptive attacks from financially motivated bad actors and third-party supply chain issues;
•any tax or other liability, or adverse impacts arising out of or related to the spinoff of our former LoyaltyOne segment or the bankruptcy filings of Loyalty Ventures Inc. (LVI) and certain of its subsidiaries, and subsequent litigation or other disputes; and
•those factors discussed in Item 1A of this Form 10-K, elsewhere in this Form 10-K and in the documents incorporated by reference in this Form 10-K.
If one or more of these or other risks or uncertainties materialize, or if our underlying assumptions prove to be incorrect, actual results may vary materially from what we projected. In addition, the Consumer Financial Protection Bureau (CFPB) issued a final rule in 2024 that, absent a successful legal challenge or other invalidation of the rule, will place significant limits on credit card late fees, which would have a significant impact on our business and results of operations for at least the short term and, depending on the effectiveness of the mitigating actions that we have taken or may in the future take in anticipation of, or in response to, the final rule, may potentially adversely impact us over the long term; we cannot provide any assurance as to the effective date, if any, of the rule, the result of any pending or future challenges or other litigation relating to the rule, or our ability to mitigate or offset the impact of the rule on our business and results of operations.
Any forward-looking statements contained in this Form 10-K speak only as of the date made, and we undertake no obligation, other than as required by applicable law, to update or revise any forward-looking statements, whether as a result of new information, subsequent events, anticipated or unanticipated circumstances or otherwise.
PART I
Item 1. Business.
We are a tech-forward financial services company that provides simple, personalized payment, lending, and saving solutions to millions of U.S. consumers. Our payment solutions, including Bread Financial general purpose credit cards and savings products, empower our customers and their passions for a better life. Additionally, we deliver growth for some of the most recognized brands in travel & entertainment, health & beauty, jewelry and specialty apparel through our private label and co-brand credit cards and pay-over-time products providing choice and value to our shared customers.
Our partner base consists of large consumer-based businesses, including well-known brands such as (alphabetically) AAA, Academy Sports + Outdoors, Caesars, Dell Technologies, Hard Rock International, the NFL, Saks Fifth Avenue, Signet, Ulta and Victoria’s Secret, as well as small- and medium-sized businesses (SMBs). Our partner base is well diversified across a broad range of industries and retail verticals, including travel and entertainment, health and beauty, jewelry, sporting goods, technology and electronics, home goods and the industry in which we first began, specialty apparel. We believe our comprehensive suite of payment, lending and saving solutions, along with our related marketing and data and analytics, offers us a significant competitive advantage with products relevant across all customer segments (Gen Z, Millennial, Gen X and Baby Boomers). The breadth and quality of our product and service offerings, coupled with our customer-centric approach, have enabled us to establish and maintain long-standing partner relationships. We operate our business through a single reportable segment, with our primary source of revenue being from Interest and fees on loans from our various credit card and other loan products, and to a lesser extent from contractual relationships with our brand partners.
With our range of offerings, we provide relevant products across consumer segments, including Gen Z and Millennials who we believe are more likely to be drawn to cash flow management products such as our pay-over-time installment loans and “split-pay” offerings, while Gen X and Baby Boomers generally gravitate toward rewards and the convenience of a private label or co-brand credit card. In addition, we continue to develop and scale our direct-to-consumer lending, payment and saving products for new and existing customers, including through our proprietary credit cards and Bread Savings products. We also continue to diversify and optimize our portfolio, prioritizing our investment in strong and profitable partners, industries and affinity brands, while continuing to develop our Bread Pay products, which are our installment loans and “split-pay” offerings, and exploring various strategic business opportunities adjacent to our core private label and co-brand credit card business (business adjacencies) in an evolving payments, macroeconomic and regulatory environment. As of December 31, 2024, we had $17.4 billion in principal on our Credit card and other loans from approximately 38 million open and outstanding accounts, with an average balance for the year ended December 31, 2024 of $975 for accounts with outstanding balances.
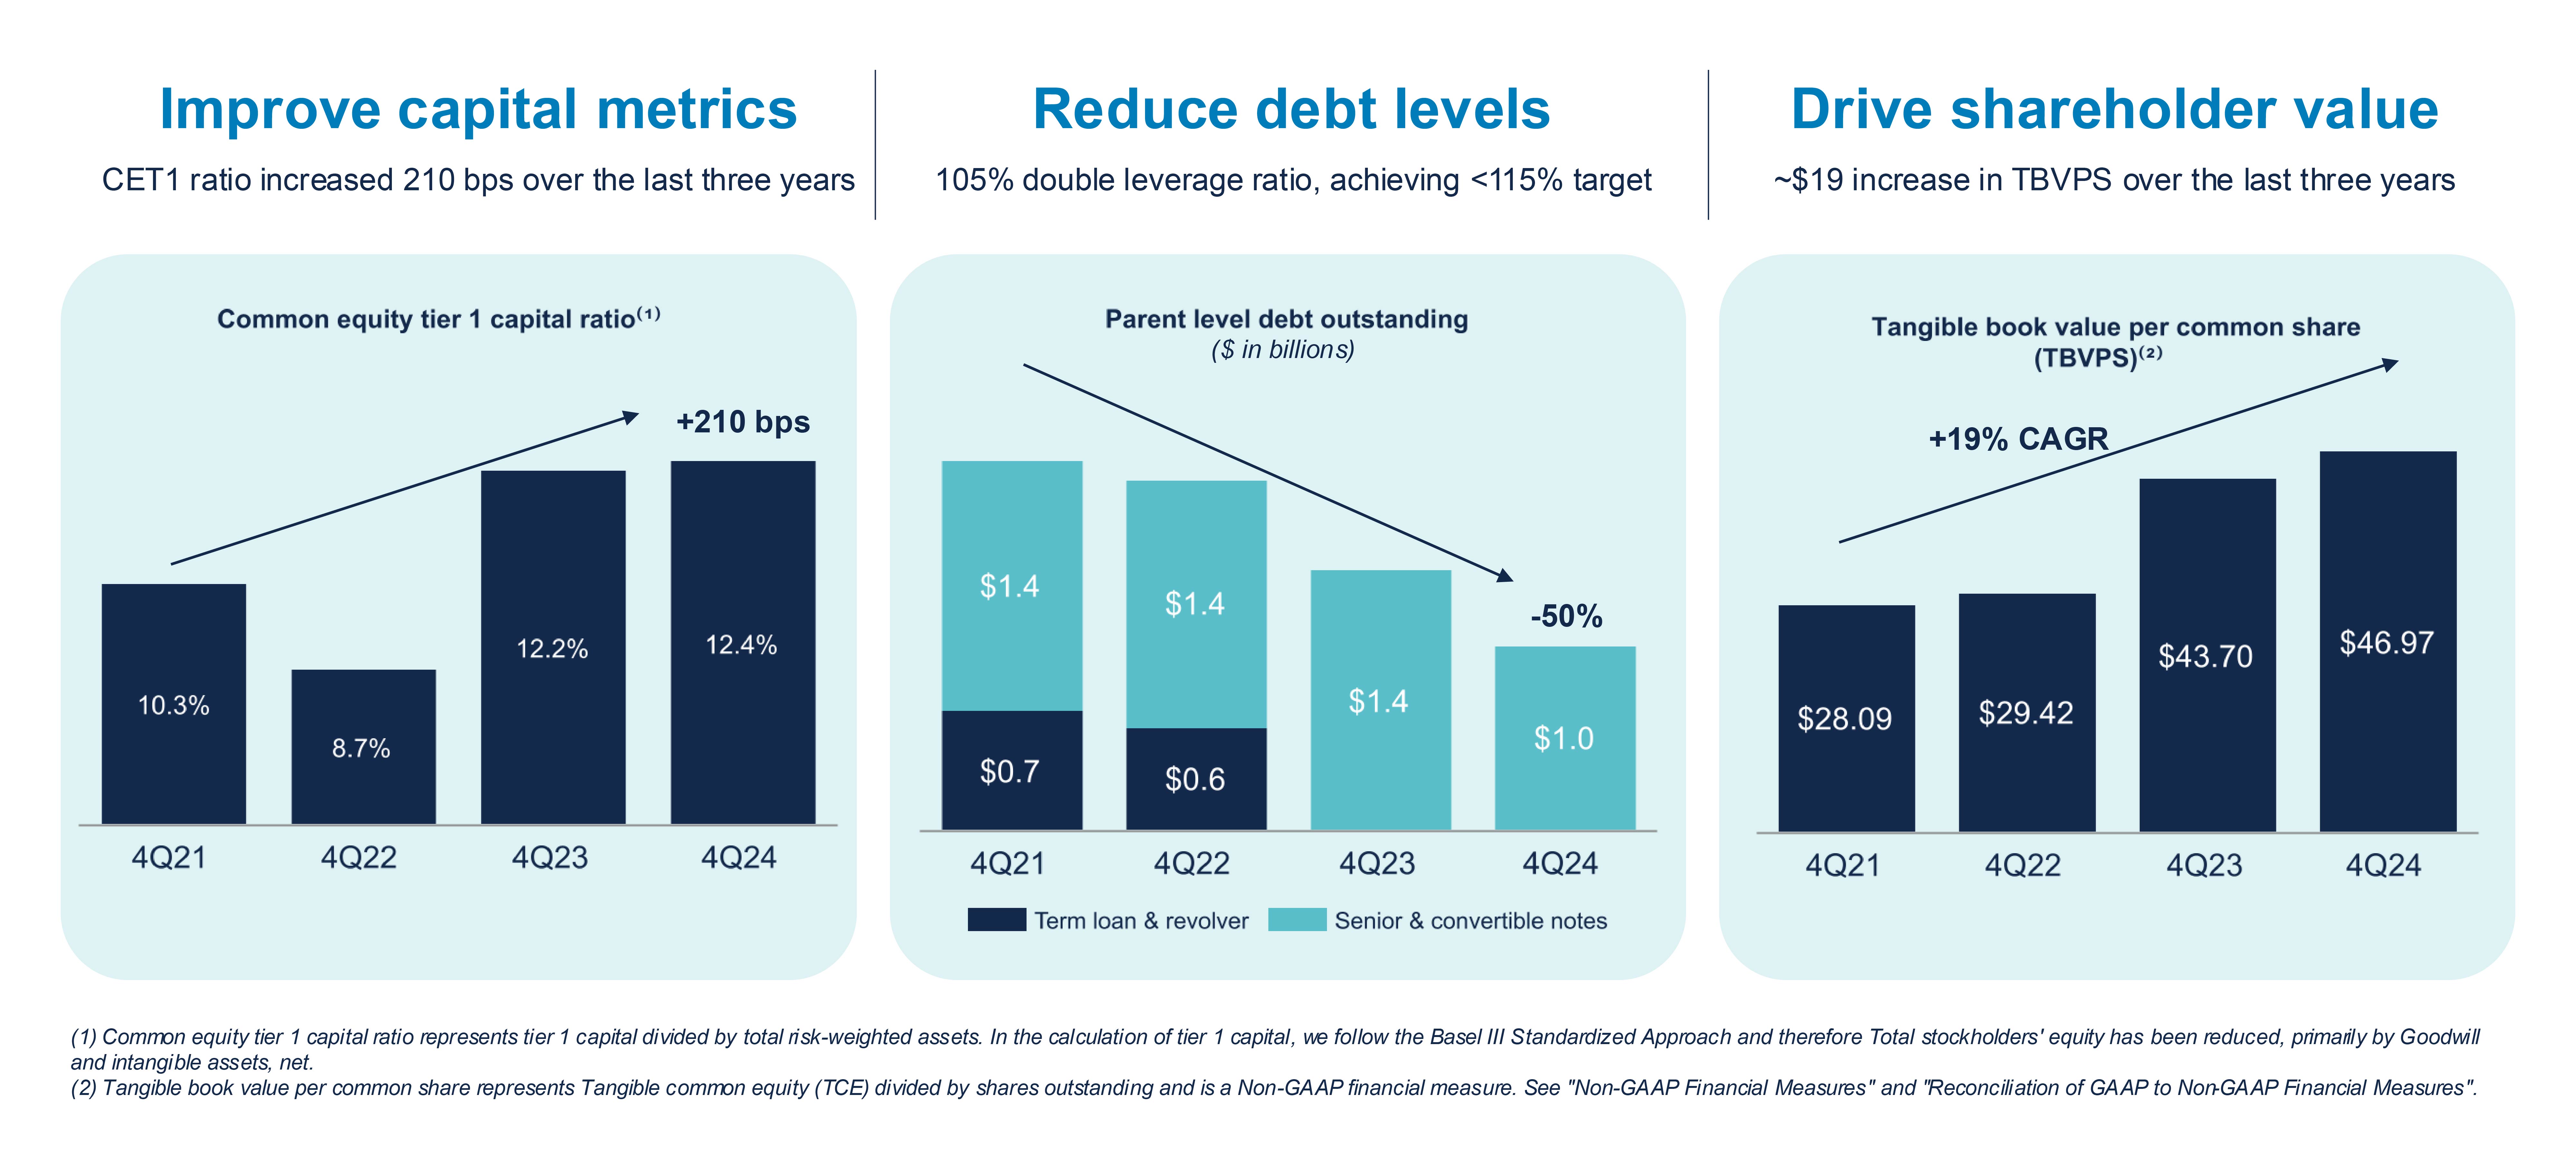
We proactively manage our credit risk to strengthen our balance sheet and ensure we are appropriately compensated for the risks we take. We closely monitor our projected returns with the goal of generating risk adjusted margins above our peers. Since December 31, 2021, we have significantly strengthened our capital levels and balance sheet; reduced our Parent Company debt levels by approximately 50%; refinanced and extended our near-term debt maturities; diversified our funding mix; increased our tangible book value per common share, a non-GAAP financial measure (as defined and reconciled below) by a compound annual growth rate of approximately 19%; and diversified our product mix through growth of our co-brand credit card programs, the introduction of new proprietary credit cards and the expansion of our Bread Pay product offerings. See “Management’s Discussion and Analysis of Financial Condition and Results of Operations—Non-GAAP Financial Measures” and “—Table 6: Reconciliation of GAAP to Non-GAAP Financial Measures.”
Our Primary Product Offerings
Our primary product offerings consist of our: (i) private label and co-brand credit card programs with retailers and other brand partners; (ii) direct-to-consumer (DTC) credit cards; (iii) Bread Pay products; and (iv) Bread Savings products. These product offerings are not exclusive, and, where appropriate, we seek to introduce partners and customers to our other product offerings.
Private Label and Co-Brand Credit Card Lending
Our core business is working with many of the country’s best-known brands and retailers (who we call our partners or brand partners) to drive sales and loyalty through their private label and co-brand credit card programs. In these programs, we (through our Banks) are the credit card issuer and lender to our partners’ customers, and we also service the loans and provide a variety of other related services, which are described in more detail below. Our private label and co-brand partner base, with approximately 100 brands and numerous online merchants, consists of many large consumer-based businesses, including well-known brands such as (alphabetically) AAA, Academy Sports + Outdoors, Caesars, Dell Technologies, Hard Rock International, the NFL, Saks Fifth Avenue, Signet, Ulta and Victoria’s Secret. Our partners benefit from customer insights and analytics, with each of our branded credit card programs tailored to our partner’s brand and their unique customers. Our private label and co-brand program agreements with our brand partners are generally long-term, exclusive contracts, with terms typically ranging from 5 to 10 years.
Private label credit cards are partner-branded credit cards used by consumers exclusively for the purchase of goods and services from that particular partner. Credit under a private label credit card typically is extended either on standard terms, which means accounts are assessed periodic interest charges using an agreed non-promotional fixed and/or variable interest rate, or pursuant to a promotional financing offer, involving deferred interest, reduced interest or no interest during a set promotional period (typically between six and 60 months). We typically do not charge interchange or other fees to our partners when customers use our private label credit cards to purchase our partners’ goods and services. Our private label credit card loan balances are typically smaller, with an average outstanding account balance for the year ended December 31, 2024 of $738; although, we do offer “big ticket” financing and financing for medical and dental procedures with certain private label brand partners, which often involve larger amounts. Relative to our co-brand loan portfolio, our private label loan portfolio generally has higher revenue yields. In addition, our private label customers generally have lower credit scores and therefore lower credit lines, and are generally more likely to be delinquent in their payments, have accounts with higher APRs and have more late fees assessed.
Our co-brand credit cards are general purpose credit cards that can be used to purchase goods and services from the applicable partner, as well as any other retailers wherever cards from the named card network are accepted. We currently issue co-brand credit cards for use on the MasterCard and Visa networks (our DTC general purpose credit cards use the American Express network, as described further below). Credit extended under our co-brand credit cards is typically on standard terms only. Charges made using a co-brand credit card, particularly charges made outside of the co-brand partner, generate interchange income for us. Relative to our private label loan portfolio, our co-brand loan portfolio generally has
lower revenue yields. In addition, our co-brand customers generally have higher credit scores and therefore higher credit lines, with the majority of our co-brand customers having a Vantage score in excess of 660. Our average outstanding co-brand credit card account balance for the year ended December 31, 2024 was $1,840. For the year ended December 31, 2024, customer spending on our co-brand credit cards comprised approximately 50% of our credit sales, which we believe enables us to capture incremental and non-discretionary sales as consumer spending patterns shift in response to evolving economic conditions.
We offer deferred interest rate, as well as low or no interest rate promotional financing to customers in certain of our brand partner programs. In both our private label and co-brand partner relationships, we receive a merchant discount fee from our partners to compensate us for all or part of the foregone interest income associated with promotional financing. The terms of these promotions vary by partner, but generally the longer the deferred interest, reduced interest or interest-free period, the greater the partner’s merchant discount. Some offers permit customers to pay for a purchase in equal monthly payments with no interest or at a reduced interest rate over a specified period of time, rather than deferring or delaying interest charges. As well, in 2024 we began charging an initial fee to customers entering into promotional plan financing arrangements, for certain of our brand partner programs. Our credit card program agreements may also provide for royalty payments, or retailer share arrangements, to our brand partners based on purchase volume or if certain contractual incentives are met, such as if the economic performance of the program exceeds a contractually defined threshold, or for new accounts acquired. These amounts are recorded as a reduction of revenue in the period incurred.
In addition to the retailer share arrangements, our program agreements typically provide that the parties will develop a marketing plan to support the program, along with the terms by which a joint marketing budget is funded. Marketing costs for which we are responsible under the plan are expensed as incurred. Our program agreements also typically provide that the parties will develop the terms of the rewards program linked to the use of our product (such as opportunities to receive double rewards points for purchases made on a product), along with the allocation of costs related to the rewards program. More broadly, the credit card programs we operate typically provide rewards points, which are redeemable for a variety of products or awards, or merchandise discounts earned by the customer having achieved a preset spending level. Other programs may include cash back rewards or statement credits. The rewards can be mailed to the cardholder, accessed digitally, or may be immediately redeemable at the partner’s retail location. Costs of cardholder rewards arrangements are recognized when the rewards are earned by the cardholders and are generally recorded as a reduction of revenue.
As a general matter, the financial terms and conditions governing our private label and co-brand credit card products vary by program and product type and may change over time; although, we seek to standardize the non-financial provisions consistently across all products. The terms and conditions of all of our credit card products are governed by a cardholder agreement and applicable laws and regulations. We assign each credit card account a credit limit when the account is initially opened by the customer. Thereafter, we may increase or decrease individual credit limits from time to time, at our sole discretion, based primarily on our evaluation of the customer’s creditworthiness and ability to pay. For the vast majority of accounts, periodic interest charges are calculated using the daily balance method, which results in daily compounding of periodic interest charges. Cash advances are not subject to an interest grace period, and some credit card programs do not provide an interest grace period for promotional purchases. In addition to periodic interest charges, we may impose other charges and fees on credit card accounts, including, as applicable and provided in the cardholder agreement, late fees where a customer has not paid at least the minimum payment due by the required due date, as well as paper statement fees which, in 2024 for selected brand partner programs, we began to charge on certain credit card accounts receiving monthly paper statements. Typically, each customer with an outstanding amount due on his or her credit card account must make a minimum payment each month; a customer may pay the total amount due at any time without penalty. We also may enter into arrangements with delinquent customers to modify their payments and/or waive or reduce interest charges and/or fees; we do not offer programs involving the forgiveness of principal. We make it easier for customers to make payments by offering recurring automatic payment functionality and other electronic payments methods on all cardholder accounts.
Direct-to-Consumer Credit Cards
In 2022, we launched our branded Bread Cashback American Express Credit Card, which is a DTC, general purpose cashback credit card. Our DTC credit cards are an important component of our overall product offerings and allow for us to capture incremental, non-discretionary spend and build and retain customer relationships. As a DTC product, our Bread Cashback credit card and other proprietary credit cards we may issue are not dependent upon the performance of our brand partners or impacted by any partner revenue-sharing obligations. We believe that our Bread Cashback credit card will continue to increase our total addressable market, including within the Millennial and Gen Z populations, offering unlimited 2% cashback, no annual fee, no foreign transaction fees, premium protection benefits, American Express lifestyle
benefits and instant mobile acquisition and wallet provisioning. In addition, in the fourth quarter of 2023, we introduced our newest DTC general purpose credit card, the Bread Rewards American Express Credit Card, which offers 3% rewards points on gas station, grocery store, dining and utility purchases, among other benefits. We currently issue our DTC credit cards on the American Express network. Our average outstanding DTC credit card account balance for the year ended December 31, 2024 was $2,317.
Bread Pay
Bread Pay is our payment technology solution for our pay-over-time products, which includes both our installment loan and “split-pay” offerings, as described in more detail below. Through Bread Pay, we offer an omnichannel solution for more than 1,300 SMB retailers and merchants, and we continue to explore and pursue growth opportunities in various business adjacencies, including through the integration of our suite of products (primarily Bread Pay installment loans) into third-party platforms to gain efficient distribution of our lending solutions.
We believe the expansion of our Bread Pay products is an attractive growth opportunity for us; our Bread Pay offerings and on-boarding capabilities enhance our growth prospects across the industries in which we lend and increase the addressable market of our Bread Pay partners. Bread Pay also offers our existing private label and co-brand credit card partners a broader digital product suite and additional white-label product solutions for those customers preferring a non-revolving loan with fixed repayment terms such as our installment loans and “split-pay” offerings. We offer a flexible platform and robust suite of application programming interfaces (APIs) that allow merchants and partners to seamlessly integrate online point-of-sale financing and other digital payment products.
Our Bread Pay installment loans are fixed extensions of credit where the customer pays down the outstanding balance in monthly installments, typically over a 3 to 48 month period. The terms of our installment loans are governed by customer agreements and applicable laws and regulations. Installment loans are generally assessed interest charges using fixed interest rates. Historically we have not imposed other charges or fees, such as late fees, where a customer has not made the required payment by the required due date, or returned payment fees.
Our Bread Pay “split-pay” loans are short-term, interest-free financing, to be repaid by the customer in four equal installments, with the first payment due at the time of purchase and the remaining three payments due in subsequent two-week intervals. The terms of our split-pay loans are governed by customer agreements and applicable laws and regulations. Historically we have not imposed charges or fees, whether that be late fees or returned payment fees.
Bread Savings
Bread Savings refers to our DTC, or retail, deposit products, primarily in the form of certificates of deposit and high-yield savings accounts, including traditional and Roth Individual Retirement Accounts. Our Bread Savings products support loan growth and improve our funding mix, making us less reliant on other sources of wholesale funding. In recent years, retail deposits have become an increasingly important source of funds for us, growing 19% from $6.5 billion as of December 31, 2023 to $7.7 billion as of December 31, 2024. As of December 31, 2024, average retail deposits represented 43% of our total funding sources and as of that same date, deposits that exceeded applicable Federal Deposit Insurance Corporation (FDIC) insurance limits, which are generally $250,000 per depositor, per insured bank, per ownership category, were estimated to be $574 million, or 4% of Total deposits. The measurement of estimated uninsured deposits aligns with regulatory guidelines.
Our online Bread Savings platform is scalable, allowing us to expand without having to rely on a traditional “brick and mortar” branch network. We continue to focus on growing our Bread Savings operations and believe we are well-positioned to continue to benefit from the consumer-driven shift from branch banking to direct banking. We seek to differentiate our deposit product offerings from our competitors on the basis of rates we pay on deposits, the quality of our customer service and the competitiveness of our digital banking capabilities.
Services Supporting our Primary Product Offerings
Our primary product offerings, as described above, are supported and enhanced by numerous services and capabilities that we provide, including: (i) risk management, account origination and funding services; (ii) credit card and other loan processing and servicing; (iii) fraud prevention; (iv) marketing, and data and analytics; and (v) our digital and mobile capabilities.
Risk Management, Account Origination and Funding Services. We provide risk management solutions, account origination and funding services for our private label and co-brand credit card programs, as well as our Bread Pay partnerships.
We process millions of credit card applications each year using automated proprietary scoring technology and verification procedures to make responsible risk-based underwriting and origination decisions when approving new accounts and establishing credit limits. Credit quality is monitored on a regular and consistent basis, using internal algorithms and external credit bureau risk scores. This information helps us segment new and existing customers into narrower risk ranges, allowing us to better evaluate individual credit risk. As macroeconomic conditions have changed in recent years, we have continued to enhance our credit risk management, including through stronger underwriting resulting from enhanced technology, monitoring, and data, prudent and proactive credit line management (as part of our recession readiness playbook), and well-established risk appetite metrics.
Credit Card and Other Loan Processing and Servicing. We manage and service the accounts we originate for our private label and co-brand credit card programs, as well as our DTC credit cards and Bread Pay products. In 2022, we completed the transition of our credit card processing services to Fiserv, a leading global provider of outsourced payments and financial services technology solutions; this transition enables improved speed to market, including the ability to quickly and seamlessly add new products and capabilities that benefit our partners and cardholders. It has also strengthened our ability to ensure we are operating on a compliant core platform, and enables efficient integration of digital technology, while supporting our data and analytics capabilities and improving operational efficiencies. See also “—Technology/Systems” below for additional information regarding our approach toward the systems and technologies we use in the operation of our business.
Our customer care operations are influenced by our retail heritage, and we view every customer touch point as an opportunity to provide an exceptional experience. Our customer care operations offer omnichannel servicing, including through phone, mail, email, text, smartphone application and the web. We blend domestic and off-shore locations as an important part of our servicing strategy, to maintain service availability beyond typical work hours in the United States and to optimize our cost structure. We provide focused training programs in all areas to achieve the highest possible customer service standards and customer experience and monitor our performance by conducting surveys with our partners and our customers, including the recent development of an AI-powered knowledge management solution for our customer care associates. In 2024, for the nineteenth consecutive time, we were certified by BenchmarkPortal as a Center of Excellence for the quality of our operations, the most prestigious customer care industry ranking attainable. Founded by Purdue University in 1995, BenchmarkPortal is a global leader of best practices for customer care centers.
Fraud Prevention. We monitor our customers’ accounts to help prevent, detect, investigate and resolve fraud across the various products we offer. We employ a variety of fraud mitigation controls during the lifecycle of accounts, including capabilities related to account acquisition, transaction processing and account management. We use proprietary custom fraud models developed by our data scientists, together with externally-sourced scores and solutions used across the industry, to seek to identify fraud and protect our stakeholders, including our customers and brand partners. We leverage device intelligence technology to risk-assess digital applications and online servicing channels, and we subject monetary transactions to authorization and approval scrutiny through a variety of techniques designed to help identify and halt fraudulent transactions, including machine-learning models, rules-based decision-making logic, report analysis, data integrity checks and manual account reviews. We have a cross-functional team of risk, fraud and security professionals that regularly evaluate our fraud-prevention capabilities and emerging industry trends and solutions.
Marketing, and Data and Analytics. Through our integrated marketing services, we design and implement strategies that assist our partners in acquiring, retaining and expanding customer engagement to drive a more loyal, frequent shopper that increases customer lifetime value. Our programs capture transaction data that we analyze to better understand consumer behavior, which we use to increase the effectiveness of our partners’ marketing activities. Through our data and analytics capabilities, including the use of machine learning and artificial intelligence (AI) technology, we focus on data insights that drive actionable strategies and enhance revenue growth and customer retention. We use multi-channel marketing communication tools, including in-store, web, permission-based email, permission-based mobile messaging and direct mail to engage customers in the channels of their choice.
Digital and Mobile Capabilities. We are constantly seeking to improve our digital and mobile capabilities, in order to support and enhance our product offerings, drive growth for our brand partners and improve the customer experience. We seek to provide a seamless, personalized digital and mobile experience that is responsive to our customers’ evolving expectations. Recent improvements to our digital and mobile capabilities include API enhancements, enriched software development kits, virtual card commercialization, and our new Bread Financial mobile app which we launched to Bread
Cashback American Express Credit Card customers in the fourth quarter of 2023, then throughout 2024 began to roll out to brand partner customers along with all Bread Rewards American Express Credit Card customers, and in 2025 we will complete the full rollout to all remaining credit card customers. We are continually seeking to enhance customers’ self-service capabilities in our digital channels, which allows customers to address their needs when and how they want, while also generating efficiencies for us over time by reducing the costs to serve our customers.
In addition, through our Enhanced Digital Suite, a group of marketing and credit application features, we help our brand partners capitalize on online trends by bringing through more qualified applicants, a higher credit sales conversion rate and a higher average purchase value. Enhanced Digital Suite includes a unified software development kit that provides access to our broad suite of products; it also promotes credit payment options, relevant to the customer, earlier in the shopping experience. The credit application is simple and easy, offers prefilled fields and pre-screens customers in real-time, allowing for immediate credit approval without leaving the brand partner’s site. Across all product offerings, we remain focused on creating an exceptional digital and mobile experience for our customers, which we believe improves our competitive position and drive future growth.
For additional information relating to our business, business strategy and products and services, see “Item 7. Management’s Discussion and Analysis of Financial Condition and Results of Operations – Business Environment”.
Technology/Systems
We leverage information and technology to help achieve our business objectives and to develop and deliver products and services that satisfy our brand partners’ and customers’ needs, all while seeking to enhance our governance and control over the availability, quality and security of our data.
A key part of our strategic focus is the development and use of resilient, efficient and flexible computer and operational systems to deliver growth for our brand partners, support sophisticated marketing and account management strategies, service our customers, and develop and scale new and diversified products. We believe the continued development and integration of these systems is an important part of our efforts to reduce costs, improve quality and security, and provide faster, more flexible technology services. Consequently, we continuously review capabilities and develop or acquire systems, processes and competencies to meet our unique business requirements, including strategic investments in cloud capabilities, machine learning and AI, emerging technologies and automation, and data and analytics.
As part of our continuous efforts to review and improve our technologies, we may either develop such capabilities internally or use third-party service providers who have the ability to deliver technology that is of higher quality, lower cost, or both. Specifically, we rely on third parties to help us deliver systems and operational infrastructure, these relationships include (but are not limited to): Microsoft and Amazon Web Services, Inc. for our cloud infrastructure and Fiserv for our credit card processing services.
We are committed to safeguarding our customers’ and our own information and technology, implementing backup and recovery systems, and generally require the same of our third-party service providers. We take measures that mitigate against known attacks and use internal and external resources to scan for vulnerabilities in platforms, systems, and applications necessary for delivering our products and services. We cannot guarantee, however, that our cybersecurity risk management program and processes, or those of our third-party providers, including our policies, controls or procedures, will be fully implemented, adhered to, or effective in protecting both our customers’ and our own information and technology from cyberattacks. For a discussion of the risks associated with our use of technology systems, see “Part I—Item 1A. Risk Factors” under the heading “Cybersecurity, Technology and Vendor Risks”.
Disaster and Contingency Planning
We operate, either internally or through third-party service providers, multiple data processing centers to store and otherwise process our customer transaction data. Given the significant amount of data that we or our third-party service providers manage, much of which is real-time data to support our partners’ commerce initiatives, we have established redundant capabilities for our data centers. We have a number of safeguards in place that are designed to protect us from data-related risks and in the event of a disaster, to restore our data centers’ systems. For additional information, see “Item 1A. Risk Factors – Risk Management – Operational Risk”.
Protection of Intellectual Property and Other Proprietary Rights
We rely on a combination of patents, copyrights, trademarks, and trade secrets (and corresponding laws relating to such intellectual property), confidentiality procedures, contractual provisions, and other similar measures to protect our technology and proprietary information used in our business. We generally enter into confidentiality agreements with our employees, consultants and third-party business partners to protect our proprietary information. We control access to and distribution of our technology and its related documentation and other proprietary information through licenses and contractual restrictions. Despite our efforts to protect our technology and proprietary rights, unauthorized parties may attempt to copy or otherwise obtain the use of our technology that we consider proprietary, and third parties may attempt to develop similar technology independently. We have a number of domestic and foreign patents and pending patent applications. We pursue protection of our trademarks through registration, primarily in the United States, although we also have either registered trademarks or applications pending for certain marks in other countries. We maintain a trade secret program for certain proprietary intellectual property for which we choose not to seek patent or copyright protection. No individual patent, copyright, or trademark is material to us or our business.
Competition
The markets for our products and services are highly competitive, continuously changing, highly innovative, and subject to regulatory scrutiny and oversight. We compete with a wide range of businesses, including major financial institutions and financial technology firms, or fintechs. Some of our current and potential competitors may be larger than we are, have larger customer bases, greater brand recognition, longer operating histories, a dominant or more secure position, broader geographic scope, volume, scale, resources, and market share than we do, or offer products and services that we do not offer. Other competitors may be smaller or younger companies that are more agile in responding quickly to regulatory and technological changes. Many of the areas in which we compete evolve rapidly with innovative and disruptive technologies, emerging competitors, business alliances, shifting consumer habits and user needs, price sensitivity on the part of merchants and consumers, and frequent introductions of new products and services. The consumer credit and payments industry is highly competitive and we face an increasingly dynamic industry as emerging technologies enter the marketplace.
In competing to acquire and retain the business of brand partners and customers, our primary competition is with other financial institutions whose marketing focus has been on developing credit card programs with attractive value propositions, high spend and consequentially large revolving balances. These competitors further drive their businesses by cross-selling their other financial products to their cardholders. We also compete for brand partners on the basis of a number of factors, including program financial and other terms, underwriting standards and capabilities, marketing expertise, service levels, the breadth of our product and service offerings, digital, technological and integration capabilities, brand recognition and reputation. We focus on retailers and other brand partners that understand the competitive advantage of building a loyal customer base. We have a long history of effectively analyzing transaction data we obtain through partner loyalty programs and managing our lending programs, including customer specific transaction data and overall consumer spending patterns, to develop and implement successful marketing strategies for our partners.
As a form of payment, our customers have numerous consumer credit and other payment options available to them, and our products compete with cash, checks, electronic bank transfers, debit cards, general purpose credit cards (including those on the Visa, MasterCard, American Express and Discover Card networks), various forms of consumer installment loans and split-pay products, other private label credit card brands, prepaid cards, digital wallets and mobile payment solutions, and other tools that simplify and personalize shopping experiences for consumers and merchants. Among other factors, our products compete with these other forms of payment on the basis of interest rates and fees, credit limits, reward programs and other product features. As the payments industry continues to evolve, in the future we expect increasing competition with emerging payment technologies from fintechs and payment networks. Moreover, some of our competitors, including new and emerging competitors in the digital and mobile payments space, are not subject to the same regulatory requirements or legislative scrutiny to which we are subject, which could place us at a competitive disadvantage.
In our retail deposits business, we have acquisition and servicing capabilities similar to other direct-banking competitors. We compete for deposits with traditional banks, and in seeking to grow our Bread Savings platform, we compete with other banks that have direct-banking models similar to ours. Competition among direct banks is intense because online banking provides customers the ability to quickly and easily deposit and withdraw funds, and open and close accounts in favor of products and services offered by competitors.
Supervision and Regulation
We operate primarily through our insured depository institution subsidiaries, Comenity Bank (CB) and Comenity Capital Bank (CCB), which, as noted above, together are referred to herein as the “Banks”. Federal and state laws and regulations extensively regulate the operations of the Banks. This regulatory framework is intended to protect individual consumers, depositors, the Deposit Insurance Fund (DIF) of the FDIC and the U.S. banking system as a whole, rather than for the protection of stockholders and creditors. Set forth below is a summary of the significant laws and regulations applicable to each of CB and CCB. The description that follows is qualified in its entirety by reference to the full text of the statutes, regulations, and supervisory policies that are described. Such statutes, regulations, and supervisory policies are subject to ongoing review by Congress, state legislatures, and federal and state regulatory agencies. A change in any of the statutes, regulations, or supervisory policies applicable to CB and/or CCB, or in the leadership or direction of our regulators, could have a material effect on our operations or financial condition. Further, while the new Presidential Administration and the congressional majorities in the U.S. Senate and House of Representatives support reducing the regulatory burden, the scope of regulation and the intensity of supervision will likely remain uncertain in the current regulatory and political environments.
CB is a Delaware-chartered bank operating as a credit card bank under a Competitive Equality Banking Act (CEBA) exemption from the definition of “bank” under the Bank Holding Company Act (BHC Act). To maintain its status as a CEBA credit card bank, CB must continue to comply with the following requirements:
•engage only in credit card operations;
•do not accept demand deposits or deposits that the depositor may withdraw by check or similar means for payment to third parties;
•do not accept any savings or time deposits of less than $100,000, except for deposits pledged as collateral for its extensions of credit;
•maintain only one office that accepts deposits; and
•do not engage in the business of making commercial loans (except credit card loans to certain small businesses).
CB is subject to prudential regulation, supervision and examination by the Delaware Office of the State Bank Commissioner, as its chartering authority, and the FDIC as its primary federal regulator. CB’s deposits are insured by the FDIC up to the applicable deposit insurance limits in accordance with applicable law and FDIC regulations. CB is not a member of the Federal Reserve System.
CCB is a Utah-chartered industrial bank. As an industrial bank, CCB is exempt from the definition of “bank” under the BHC Act. CCB is subject to prudential regulation, supervision and examination by the Utah Department of Financial Institutions (UDFI), as its chartering authority, and the FDIC as its primary federal regulator. CCB’s deposits are insured by the FDIC up to the applicable deposit insurance limits in accordance with applicable law and FDIC regulations. CCB is not a member of the Federal Reserve System.
The Consumer Financial Protection Bureau (CFPB) promulgates regulations for the federal consumer financial protection laws and supervises and examines large banks (those with more than $10 billion of total assets) with respect to those laws. Banks in a multi-bank organization, such as CB and CCB, are subject to supervision and examination by the CFPB with respect to the federal consumer financial protection laws if at least one bank reports total assets over $10 billion for four consecutive quarters. While the Banks were subject to supervision and examination by the CFPB with respect to the federal consumer financial protection laws between 2016 and 2021, this reverted to the FDIC in 2022. However, CCB’s total assets then exceeded $10 billion for four consecutive quarters as of September 30, 2022, and both Banks are now again subject to supervision and examination by the CFPB with respect to federal consumer protection laws.
Regulation of Bread Financial Holdings, Inc.
Because neither CB nor CCB is considered a “bank” within the meaning of the BHC Act, the Parent Company is not a bank holding company (BHC) subject to regulation thereunder. If any of our entities became subject to regulation as a BHC, among other things, BFH and our non-bank subsidiaries would be subject to regulation, supervision and examination by the Board of Governors of the Federal Reserve System (Federal Reserve Board) and our operations would be limited to activities that are closely related to banking. If the Parent Company were to qualify as a financial holding company (FHC), operations could include those activities that are financial in nature. However, under Section 616 of the Dodd-Frank Act, any company that directly or indirectly controls an insured depository institution is required to serve as a source of financial strength to its subsidiary institution and may not conduct its operations in an unsafe or unsound manner. This
doctrine is commonly known as the “Source of Strength” doctrine. As such a company, this means that BFH must stand ready to use available resources to provide adequate capital funds to the Banks during periods of financial stress or adversity and should maintain the financial flexibility and capital-raising capacity to obtain additional funding resources to support the Banks. This support may be required at times when BFH might otherwise have determined not to provide it or when doing so is not otherwise in the interests of BFH or its stockholders or creditors. BFH’s failure to meet its obligation to serve as a source of strength to the Banks may be considered an unsafe and unsound banking practice. In that regard, although the Parent Company is not a BHC, we seek to maintain capital levels and ratios in excess of the minimums required for bank holding companies.
Separately, under Utah state law the Parent Company is subject to examination by the UDFI. Under that statutory authority, the UDFI subjects the Parent Company to periodic inspections to determine the degree to which it serves as source of financial and managerial strength to CCB, and to understand the business activities conducted outside CCB.
Regulation of the Banks
Federal and state banking laws and regulations govern, among other things, the scope of a bank’s business, the investments a bank may make, the reserves against deposits a bank must maintain, the loans a bank makes and collateral it takes, the activities of a bank with respect to mergers and acquisitions, management practices, and numerous other aspects of our operations.
Examinations by regulators consider not only compliance with applicable laws, regulations, and supervisory policies of the agency, but also capital levels, asset quality, risk management effectiveness, the ability and performance of management and the board of directors, the effectiveness of internal controls, earnings, liquidity, and various other factors. Following examinations by its bank regulators, the Banks receive supervisory findings and ultimately are assigned supervisory ratings. Examination reports, supervisory ratings, and other actions under this supervisory framework, which are considered confidential supervisory information, can impact the conduct, growth, and profitability of our operations, possibly to a significant degree.
Regulatory Capital Requirements
The Banks are subject to certain risk-based capital and leverage ratio requirements under the Basel Committee on Banking Supervision standardized approach for U.S. banking organizations adopted by the FDIC. These rules implement the Basel III international regulatory capital standards in the United States, as well as certain provisions of the Dodd-Frank Act. These quantitative calculations are minimums, and the FDIC may determine that a bank, based on size, complexity, or risk profile, must maintain a higher level of capital in order to operate in a safe and sound manner.
Under the Basel III capital rules, the Banks’ assets, exposures, and certain off-balance sheet items are subject to risk weights used to determine CB’s and CCB’s risk-weighted assets, which then are used to determine the minimum capital that CB and CCB should keep as reserves to reduce the risk of insolvency. These risk-weighted assets are used to calculate the following minimum capital ratios for the Banks:
•Common Equity Tier 1 (CET1) Risk-Based Capital Ratio – the ratio of CET1 capital to risk-weighted assets. In the calculation of CET1 capital, we follow the Basel III Standardized Approach. CET1 capital primarily includes common stockholders’ equity subject to certain regulatory adjustments and deductions, including for goodwill and intangible assets, certain deferred tax assets, and accumulated other comprehensive income or loss.
•Tier 1 Risk-Based Capital Ratio – the ratio of Tier 1 capital to risk-weighted assets. In the calculation of Tier 1 capital, we follow the Basel III Standardized Approach. Tier 1 capital is primarily comprised of CET1 capital, perpetual preferred stock, and certain qualifying capital instruments. For us, this ratio is the same as the CET1 Risk-Based Capital Ratio because we do not currently have any preferred stock or other qualifying capital instruments that would adjust the ratio.
•Total Risk-Based Capital Ratio – the ratio of total capital, including CET1 capital, Tier 1 capital, and Tier 2 capital, to risk-weighted assets. In the calculation of total capital, we follow the Basel III Standardized Approach. Tier 2 capital primarily includes qualifying subordinated debt and qualifying allowance for credit losses.
The Banks are also subject to the requirements of a fourth ratio, the Leverage ratio, which itself does not incorporate risk-weighted assets:
•Tier 1 Leverage Ratio – the ratio of Tier 1 capital to quarterly average assets (net of goodwill, certain other intangible assets, and certain other deductions).
The Basel III capital rules require a minimum CET1 Risk-Based Capital Ratio of 4.5%, a minimum Tier 1 Risk-Based Capital Ratio of 6.0%, and a minimum Total Risk-Based Capital Ratio of 8.0%. In addition to meeting the minimum capital requirements, under the Basel III capital rules, the Banks must also maintain the required 2.5% Capital Conservation Buffer to avoid becoming subject to restrictions on capital distributions and certain discretionary bonus payments to executive management. The Capital Conservation Buffer is calculated as a ratio of CET1 capital to risk-weighted assets, and it essentially increases the required minimum risk-based capital ratios. As a result, the Banks must maintain a CET1 Risk-Based Capital Ratio of at least 7%, a Tier 1 Risk-Based Capital Ratio of at least 8.5% and a Total Risk-Based Capital Ratio of at least 10.5% to avoid being subject to restrictions on capital distributions and discretionary bonus payments to its executive management. A bank, however, may be considered well-capitalized while remaining out of compliance with the Capital Conservation Buffer. The Tier 1 Leverage Ratio is not impacted by the Capital Conservation Buffer; the required minimum Tier 1 Leverage Ratio for all banks and BHCs is 4%.
To be considered well-capitalized, the Banks must maintain the following capital ratios which are in excess of the minimums described above:
•CET1 Risk-Based Capital Ratio of 6.5% or greater;
•Tier 1 Risk-Based Capital Ratio of 8.0% or greater;
•Total Risk-Based Capital Ratio of 10.0% or greater; and
•Tier 1 Leverage Ratio of 5.0% or greater.
Failure to be well-capitalized or to meet minimum capital requirements could result in certain mandatory and possible additional discretionary actions by regulators that, if undertaken, could have a material adverse effect on our operations or financial condition. Failure to be well-capitalized or to meet minimum capital requirements could also result in restrictions on the Banks’ ability to pay dividends or otherwise distribute capital or to receive regulatory approval of applications. The Banks seek to maintain capital levels and ratios in excess of the minimum regulatory requirements inclusive of the 2.5% Capital Conservation Buffer. As of December 31, 2024, the Banks’ regulatory capital ratios were above the well-capitalized standards and met the Capital Conservation Buffer.
Dividends
Bread Financial Holdings, Inc. is a legal entity separate and distinct from the Banks. Declaration and payment of cash dividends or repurchases of our common stock depends upon cash dividend payments to Bread Financial Holdings, Inc. by the Banks, which are our primary source of revenue and cash flow. As state-chartered banks, under Delaware or Utah law, as applicable, the Banks are subject to regulatory restrictions on the payment and amounts of dividends. Further, the ability of the Banks to pay dividends to Bread Financial Holdings, Inc. is also subject to their profitability, financial condition, capital expenditures and other cash flow requirements, and any such dividends are also subject to the approval of the Board of Directors of the applicable Bank. No assurances can be given that the Banks will, in any circumstances, pay dividends to Bread Financial Holdings, Inc.
The payment of dividends by the Banks and Bread Financial Holdings, Inc. and any repurchases of our common stock may also be affected by other factors, such as the requirement to maintain adequate capital above regulatory requirements. The Federal Banking Agencies, being the Office of the Comptroller of the Currency (OCC), the Federal Reserve Board and the FDIC, have indicated that paying dividends that deplete a bank’s capital base to an inadequate level would be an unsafe and unsound banking practice; a bank may not pay any dividend if payment would cause it to become undercapitalized or if it already is undercapitalized. Moreover, the Federal Banking Agencies have issued policy statements that provide that banks should generally only pay dividends out of current operating earnings. The Federal Banking Agencies have the authority to prohibit banks from paying a dividend if it is deemed that such payment would be an unsafe or unsound practice. The FDIC also may require its prior consent before a bank pays a dividend that exceeds retained
earnings or comes from the surplus account of common or preferred stock.
Prompt Corrective Action and Safety and Soundness
Under applicable “prompt corrective action” (PCA) statutes and regulations, insured depository institutions, such as the Banks, are placed into one of five capital categories, ranging from “well capitalized” to “critically undercapitalized”. The PCA statute and regulations provide for progressively more stringent supervisory measures as an institution’s capital
category declines. An institution that is not well capitalized is generally prohibited from accepting brokered deposits and offering interest rates on deposits higher than the prevailing rate in its market. An undercapitalized institution must submit an acceptable restoration plan to the appropriate Federal Banking Agency. One requisite element of such a plan is that the institution’s parent holding company guarantee the institution’s compliance with the plan, subject to certain limitations. As of December 31, 2024, the Banks qualified as “well capitalized” under applicable regulatory capital standards.
Insured depository institutions may also be subject to potential enforcement actions of varying levels of severity by the Federal Banking Agencies for unsafe or unsound practices in conducting their businesses, or for violation of any law, rule, regulation, condition imposed in writing by the agency, or term of a written agreement with the agency. In more serious cases, enforcement actions may include the issuance of directives to increase capital; the issuance of formal and informal agreements; the imposition of civil monetary penalties; the issuance of a cease and desist order that can be judicially enforced; the issuance of removal and prohibition orders against officers, directors, and other institution-affiliated parties; the termination of the institution’s deposit insurance; the appointment of a conservator or receiver for the institution; and the enforcement of such actions through injunctions or restraining orders based upon a judicial determination that the FDIC, as receiver, would be harmed if such equitable relief was not granted.
Reserve Requirements
Federal Reserve Board regulations require insured depository institutions to maintain cash reserves against their transaction accounts, primarily interest-bearing and regular checking accounts, as well as cardholder credit balances. The required cash reserves can be in the form of vault cash and, if vault cash does not fully satisfy the required cash reserves, in the form of a balance maintained with the Federal Reserve Banks; we maintain a significant majority of our liquidity portfolio on deposit within the Federal Reserve banking system.
The regulations authorize different ranges of reserve requirement ratios depending on the amount of transaction account balances held. A zero percent reserve requirement ratio is applied to transaction balances below the reserve requirement exemption amount. In addition, transaction account balances maintained over the reserve requirement exemption amount and up to a certain amount, known as the low reserve tranche, may be subject to a reserve requirement ratio of not more than 3 percent (and which may be zero), and transaction account balances over the low reserve tranche may be subject to a reserve requirement ratio of not more than 14 percent (and which may be zero). The reserve requirement exemption and the low reserve tranche are both subject to adjustment on an annual basis, as applicable, by the Federal Reserve Board. Effective March 26, 2020, in response to the COVID-19 pandemic, the reserve requirement ratios on all net transaction accounts were reduced to zero percent, thereby eliminating reserve requirements for all depository institutions. The annual indexation of the reserve requirement exemption amount and the low reserve tranche for the years 2021-2025 was required by statute, but did not affect depository institutions’ reserve requirements, which remain at zero.
Federal Deposit Insurance
The deposits of the Banks are insured up to applicable limits by the DIF of the FDIC. The current standard maximum deposit insurance amount is $250,000 per depositor, per insured depository institution, per ownership category, in accordance with applicable FDIC regulations.
The FDIC uses a risk-based assessment system that imposes insurance premiums based on a risk matrix that takes into account the risks attributable to different categories and concentrations of an insured depository institution’s assets and liabilities, and supervisory rating. The base for insurance assessments is the average consolidated total assets less the average tangible equity capital of an institution. Assessment rates are calculated using formulas that take into account the risk of the institution being assessed.
Under the Federal Deposit Insurance Act (the FDIA), the FDIC may terminate an institution’s deposit insurance upon a finding that the institution has engaged in unsafe and unsound practices, is in an unsafe and unsound condition or has violated any applicable law, regulation, order or condition imposed by the FDIC.
Cross Guaranty Provisions
The cross guaranty provisions of the FDIA require each insured depository institution controlled by the same parent company to be financially responsible for the failure or resolution costs of any affiliated insured depository institution. Generally, the amount of the cross guaranty liability is equal to the estimated loss to the DIF for the resolution of the affiliated institution(s) in default. The FDIC’s claim under the cross guaranty provision is superior to claims of
shareholders of the insured depository institution or its parent company and to most claims arising out of obligations or liabilities owed to affiliates of the institution, but is subordinate to claims of depositors, secured creditors and holders of subordinated debt (other than affiliates) of the commonly controlled insured depository institution. The FDIC may decline to enforce the cross guaranty provision if it determines that a waiver is in the best interest of the DIF.
Depositor Preference
The FDIA provides that, in the event of the liquidation or other resolution of an insured depository institution, the claims of depositors of the institution, including the claims of the FDIC as subrogee of insured depositors, and certain claims for administrative expenses of the FDIC as a receiver, will have priority over other general unsecured claims against the institution. If an insured depository institution fails, insured and uninsured depositors, along with the FDIC, will have priority in payment ahead of unsecured, non-deposit creditors, including the parent company, with respect to any extensions of credit they have made to such insured depository institution.
Restrictions on Transactions with Affiliates and Insiders
Sections 23A and 23B of the Federal Reserve Act and the Federal Reserve Board’s Regulation W limit the extent to which the Parent Company and its non-bank affiliates (including non-bank subsidiaries) can borrow or otherwise obtain credit from, or engage in other covered transactions with either of the Banks, which may have the effect of limiting the extent to which either Bank can finance or otherwise supply funds to the Parent Company or its non-bank affiliates. “Covered transactions” include loans or extensions of credit, purchases of or investments in securities, purchases of assets, including assets subject to an agreement to repurchase, acceptance of securities as collateral for a loan or extension of credit, a derivative transaction to the extent that the transaction causes the bank to have a credit exposure to the affiliate, or the issuance of a guarantee, acceptance, or letter of credit. Covered transactions are subject to quantitative and qualitative limits.
In addition, with certain exceptions, each loan or extension of credit by either Bank to the Parent Company or its non-bank affiliates must be secured by collateral with a market value ranging from 100% to 130% of the amount of the loan or extension of credit, depending on the type of collateral. Further, all transactions between the Banks and the Parent Company or any non-bank affiliates must be on arm’s length terms and consistent with safe and sound banking practices. The Banks are also prohibited from purchasing low-quality assets from the Parent Company or any non-bank affiliates.
The Banks are also subject to Sections 22(g) and 22(h) of the Federal Reserve Act, and the Federal Reserve Board's implementing Regulation O as made applicable to the Banks by the regulations of the FDIC. These provisions impose limitations on loans and extensions of credit by the Banks to their executive officers, directors and principal stockholders and their related interests, as well as those of the Banks’ affiliates. The limitations restrict the terms and aggregate amount of such transactions. Regulation O also imposes certain recordkeeping and reporting requirements.
Volcker Rule
Section 619 of the Dodd-Frank Act, commonly known as the Volcker Rule, restricts the ability of banking entities, such as Bread Financial Holdings, Inc. and the Banks, from (i) engaging in proprietary trading and (ii) investing in or sponsoring covered funds, subject to certain limited exceptions. Under the Volcker Rule, the term covered funds is defined as any issuer that would be an investment company under the Investment Company Act but for the exemption in section 3(c)(1) or 3(c)(7) of that Act, which includes collateralized loan obligation securities, collateralized debt obligation securities, and certain foreign funds. There are also several exemptions from the definition of covered funds, including, among other things, loan securitization, joint ventures, certain types of foreign funds, entities issuing asset-backed commercial paper, and registered investment companies. We do not engage in proprietary trading or invest in or sponsor covered funds.
Incentive Compensation
The Federal Banking Agencies have issued comprehensive guidance intended to ensure that the incentive compensation
policies of banking organizations do not undermine the safety and soundness of those organizations by encouraging
excessive risk-taking. The incentive compensation guidance sets expectations for banking organizations concerning their
incentive compensation arrangements and related risk management, control and governance processes. The incentive
compensation guidance, which covers all employees that have the ability to materially affect the risk profile of an
organization, either individually or as part of a group, is based upon three primary principles: (i) balanced risk-taking
incentives; (ii) compatibility with effective controls and risk management; and (iii) strong corporate governance. Any
deficiencies in compensation practices that are identified may be incorporated into the organization’s supervisory ratings,
which can affect its ability to make acquisitions or take other actions. In addition, under the incentive compensation
guidance, a banking organization’s federal supervisor may initiate enforcement action if the organization’s incentive
compensation arrangements pose a risk to the safety and soundness of the organization. Further, the Basel III capital rules
limit discretionary bonus payments to bank executives if the institution’s regulatory capital ratios fail to exceed certain
thresholds.
The Dodd-Frank Act requires the Federal Banking Agencies and the Securities and Exchange Commission (SEC) to establish joint regulations or guidelines prohibiting incentive-based payment arrangements at specified regulated entities, including the Banks, that encourage inappropriate risks by providing an executive officer, employee, director or principal stockholder with excessive compensation, fees, or benefits resulting from inappropriate risk taking, as these actions could lead to material financial loss to the entity. The Federal Banking Agencies, apart from the Federal Reserve Board, and the SEC most recently proposed such regulations in 2024, but the regulations have not yet been finalized. If the regulations are adopted in the form initially proposed, the manner in which executive compensation is structured will be restricted.
The Dodd-Frank Act also requires publicly traded companies to give stockholders a non-binding vote on executive compensation at least every three years and on so-called “golden parachute” payments in connection with approvals of mergers and acquisitions. We have held our “say-on-pay” vote annually.
USA PATRIOT Act
Under Title III of the USA PATRIOT Act, all financial institutions are required to take certain measures to identify their customers, prevent money laundering, monitor customer transactions, and report suspicious activity to U.S. law enforcement agencies. Financial institutions are also required to respond to requests for information from Federal Banking Agencies and law enforcement agencies. Information sharing among financial institutions for the above purposes is encouraged by an exemption granted to complying financial institutions from the privacy provisions of the Gramm-Leach-Bliley Act (GLBA) and other privacy laws. Financial institutions that hold correspondent accounts for foreign banks or provide private banking services to foreign individuals are required to take measures to avoid dealing with certain foreign individuals or entities, including foreign banks with profiles that raise money laundering concerns, and are prohibited from dealing with foreign “shell banks” and persons from jurisdictions of particular concern. The Federal Banking Agencies and the Secretary of the Treasury have adopted regulations to implement several of these provisions.
Furthermore, financial institutions are required to establish internal anti-money laundering programs. These programs must include policies, procedures, processes and other internal controls designed to monitor, identify, manage and mitigate the risk of money laundering or terrorist financing posed by a financial institution’s products, services, customers and geographic locale. These controls include procedures and processes to detect and report suspicious transactions, perform customer due diligence, respond to requests from law enforcement, identify and verify a legal entity customer’s beneficial owner(s) at the time a new account is opened and to understand the nature and purpose of the customer relationship, and meet all recordkeeping and reporting requirements related to particular transactions involving currency or monetary instruments. These programs are coordinated by a compliance officer, undergo annual independent audits to assess effectiveness, and require training of employees. The effectiveness of a financial institution in combating money laundering activities is a factor to be considered in any application submitted by a financial institution to engage in a merger transaction under the Bank Merger Act. Failure to comply with these regulations may result in fines, penalties, lawsuits, regulatory sanctions, reputational damage, or restrictions on business. Our Banks have in place a Bank Secrecy Act and USA PATRIOT Act compliance program and engage in very few transactions of any kind with foreign financial institutions or foreign persons.
Office of Foreign Assets Control Regulations
The United States government has imposed economic sanctions that affect transactions with designated foreign countries, nationals, and others. These are typically known as the “OFAC” rules based on their administration by the U.S. Treasury Department Office of Foreign Assets Control. The Office of Foreign Assets Control administered sanctions targeting countries take many different forms. Generally, OFAC sanctions contain one or more of the following elements: (i) restrictions on trade with or investment in a sanctioned country, including prohibitions against direct or indirect imports from and exports to a sanctioned country and prohibitions on U.S. persons engaging in financial transactions relating to making investments in, or providing investment-related advice or assistance to, a sanctioned country; and (ii) a blocking of assets in which the government or specially designated nationals of the sanctioned country have an interest, by prohibiting transfers of property subject to U.S. jurisdiction (including property in the possession or control of U.S. persons). Blocked
assets (e.g., property and bank deposits) cannot be paid out, withdrawn, set off, or transferred in any manner without a license from the Office of Foreign Assets Control. Failure to comply with these sanctions could have serious legal and reputational consequences.
Third-Party Risk Management
The FDIC, along with the other Federal Banking Agencies, issued final guidance on managing risks associated with third-party relationships. The guidance states that sound third-party risk management takes into account the level of risk, complexity, and size of the bank and the nature of the third-party relationship. In July 2024, the Federal Banking Agencies released a joint statement on banks’ arrangements with third parties to deliver bank deposit products and services. The joint statement cautions that operational and compliance risks arise when banks hand over substantial control of key functions to a third-party. Banks can manage risk through policies and procedures governing organizational structures, lines of reporting, expertise and staffing, internal controls and audit functions. Banks can also conduct risk assessments to assess controls for mitigating risk relating to specific third-party arrangements, engage in due diligence of third-party relationships, set appropriate contractual relationships, and establish monitoring routines to identify risks.
Identity Theft
The FDIC issued final rules and guidelines implementing the provisions of the Fair Credit Reporting Act (FCRA), as amended by the Dodd-Frank Act, that require insured state nonmember banks, such as the Banks, to establish programs to address risks of identity theft. The rules require financial institutions and creditors to develop and implement a written identity theft prevention program that is designed to detect, prevent, and mitigate identity theft in connection with certain existing accounts or the opening of new accounts. The rules include guidelines to assist entities in the formulation and maintenance of programs that would satisfy these requirements. In addition, the rules establish special requirements for any credit and debit card issuers that are subject to the jurisdiction of the FDIC to assess the validity of notifications of changes of address under certain circumstances. The Banks implemented an ID Theft Prevention Program, approved by their Boards of Directors, in compliance with these requirements.
Open Banking
In October 2024, the CFPB finalized a rule implementing a section of the Dodd-Frank Act, which requires certain entities, including the Banks, to, among other things, make available to a consumer, upon request, information in its control or possession concerning the consumer financial product or service that the consumer obtained from that entity. The final rule also requires data providers holding a consumer account, such as the Banks, to establish a developer interface satisfying certain data security specifications and other standards, through which the data provider can receive requests for, and provide specific types of data covered by the rule in electronic, usable form to authorized third parties, including data aggregators. Under the final rule, data providers are prohibited from charging consumers or third parties fees for processing these consumer data requests. The final rule also places certain data security, authorization, and other obligations on third parties accessing covered data from data providers, which could include the Banks when acting in certain capacities. The final rule also requires third parties to limit their collection, use, and retention of the data received to only what is reasonably necessary to provide the consumers’ requested product or service. In October 2024, industry trade associations filed a lawsuit against the CFPB alleging the agency exceeded its statutory authority and asking the court to vacate the rule. As of the date of this report, the District Court for the Eastern District of Kentucky has not issued a ruling on the matter.
Community Reinvestment Act
The Community Reinvestment Act of 1977 (CRA) is intended to encourage banks to help meet the credit needs of their service areas, including low- and moderate-income neighborhoods, consistent with safe and sound business practices. The relevant Federal Banking Agency, the FDIC in the Banks’ case, examines each bank and assigns it a public CRA rating. A bank’s record of fair lending compliance is part of the resulting CRA examination report. CRA performance evaluations are based on a four-tiered rating system: Outstanding, Satisfactory, Needs to Improve and Substantial Noncompliance. CRA performance evaluations are considered in evaluating applications for such things as mergers, acquisitions and applications to open branches. The Banks each received a CRA rating of “Outstanding” at their most recent CRA examinations.
In October 2023, the Federal Banking Agencies issued a final rule overhauling the process and substantive tests used by the agencies to assess a bank’s record of meeting the credit needs of its community. In February 2024, industry trade associations filed a lawsuit against the Federal Banking Agencies alleging the agencies exceeded their statutory authority
and asking the court to vacate the final rule. In March 2024, the District Court for the Northern District of Texas enjoined the Federal Banking Agencies from enforcing the final rule, and the previous CRA rule continues to apply.
Consumer Protection Regulation and Supervision
We are subject to the federal consumer financial protection laws implemented by the CFPB, as well as by other federal agencies including the FDIC and Federal Trade Commission. The CFPB has broad rulemaking authority that has impacted, and may continue to impact, the Banks’ operations, including with respect to credit card late fees and other amounts that we may charge. For example, the CFPB’s rulemaking authority may allow it to change regulations adopted in the past by other regulators, including regulations issued under the Truth in Lending Act by the Federal Reserve Board. We are also subject to certain state consumer protection laws, and state attorneys general and other state officials are empowered to enforce certain federal consumer protection laws and regulations. State authorities have increased their focus on and enforcement of consumer protection rules. These federal and state consumer protection laws apply to a broad range of our activities and to various aspects of our business, and include laws relating to interest rates, fair lending, disclosures of credit terms and estimated transaction costs to consumer borrowers, debt collection practices, the use and provision of information to consumer reporting agencies, and the prohibition of unfair, deceptive, or abusive acts or practices in connection with the offer, sale, or provision of consumer financial products and services. Each Bank has in place an effective compliance management system to comply with these laws and regulations.
In March 2024 the CFPB published a final rule that would significantly reduce the safe harbor amount for late fees that credit card issuers are authorized to charge. As of the date of this report, the rule is subject to an injunction issued by the United States District Court for the Northern District of Texas. For a detailed discussion regarding the status of the CFPB’s late fee rule, and the risks associated with the rule, see “Risk Factors—Legal, Regulatory and Compliance Risks” and “Management’s Discussion & Analysis—Business Environment” below.
More generally, the CFPB’s ability to rescind, modify or interpret past regulatory guidance could reduce fee income, and increase our compliance costs and litigation exposure. Further, the CFPB has broad authority to enforce the prohibitions of “unfair, deceptive or abusive” acts or practices regardless of which agency supervises the Banks. The CFPB has taken enforcement action against other credit card issuers and financial services companies. Evolution of these standards could result in changes to pricing, practices, procedures and other activities relating to our credit card accounts in ways that could reduce the associated return from those accounts and potentially impact business growth plans. While the CFPB has taken public positions on certain matters, it is unclear what additional changes may be promulgated by the CFPB and what effect, if any, such changes would have on our credit accounts.
With the recent change in Presidential Administration and the current congressional majorities in the U.S. Senate and House of Representatives, the scope of regulation by the CFPB and other federal agencies remains uncertain. Most recently, in February 2025, the acting director of the CFPB directed the CFPB’s staff to cease all supervision and examination activity and stakeholder engagement, stop all work on proposed rulemaking, suspend the effective dates of any finalized but not yet effective rules, and halt other actions relating to investigations, enforcement and litigation. The extent to which these recent or other future developments will ultimately impact the CFPB’s regulation of our business, including the CFPB’s credit card late fee rule and the associated litigation, remains uncertain.
Privacy, Information Security and Data Protection
We are subject to various privacy, information security and data protection laws, including requirements concerning security breach notification. For example, we are subject to the GLBA and implementing regulations and guidance in the United States. Among other things, the GLBA: (i) imposes certain limitations on the ability of financial institutions to share consumers’ nonpublic personal information with nonaffiliated third parties; (ii) requires that financial institutions provide certain disclosures to consumers about their information collection, sharing and security practices and affords consumers the right to “opt out” of the institution’s disclosure of their personal financial information to nonaffiliated third parties (with certain exceptions); and (iii) requires financial institutions to develop, implement and maintain a written comprehensive information security program containing safeguards that are appropriate to the financial institution’s size and complexity, the nature and scope of the financial institution’s activities, the sensitivity of consumer information processed by the financial institution as well as plans for responding to data security breaches.
In 2018, the State of California enacted the California Consumer Privacy Act (CCPA), which was modified in 2020 through a voter referendum adopting the California Privacy Rights Act (CPRA). The CCPA/CPRA requires covered businesses to comply with requirements that give consumers the right to know what information is being collected from
them and whether such information is sold or disclosed to third parties. The statute also allows consumers to access, delete, correct, and prevent the sale and sharing of personal information that has been collected by covered businesses in certain circumstances. The CCPA/CPRA does not apply to personal information collected, processed, sold, or disclosed pursuant to the GLBA or the California Financial Information Privacy Act. We are a covered business under the CCPA, which became effective on January 1, 2020 and under the CPRA which became effective on January 1, 2023. The enactment of the CCPA has prompted a wave of legislative developments in other states, which has created a patchwork of overlapping but different state laws, certain of which include exemptions for GLBA-regulated entities and/or personal information. Similar privacy laws also have been proposed in other states and at the federal level.
Federal and state laws also require us to respond appropriately to data security breaches. A final rule issued by the Federal Reserve, OCC, and FDIC, which became effective in May 2022, requires banking organizations to notify their primary federal regulator of significant computer security incidents within 36 hours of determining that such an incident has occurred. The SEC has also adopted rules on Cybersecurity Risk Management, Strategy, Governance and Incident Disclosure, which, among other things, require the filing of a Current Report on Form 8-K following certain cybersecurity incidents.
We continue to monitor, and have a program in place designed to comply with, applicable privacy, information security and data protection requirements imposed by federal, state, and foreign laws. However, if we experience a significant cybersecurity incident or our regulators deem our information security controls to be inadequate, we could be subject to supervisory criticism or penalties, and/or suffer reputational harm. For further discussion of privacy, data protection and cybersecurity, and related risks for our business, see “Part I—Item 1A. Risk Factors” under the headings “Regulation in the areas of privacy, data protection, data governance, account access and information and cyber security could increase our costs and affect or limit our business opportunities and how we collect and/or use Personal Information, and any actual or perceived failure to comply with any of these new or existing laws could adversely affect our business, results of operations, or financial condition”, “If we, our third-party providers, or brand partners fail to safeguard our confidential information and/or experience a data security incident, there may be damage to our brand and reputation, material financial penalties and legal claims, which could materially adversely affect our business, results of operations, and financial condition”, and “Business interruptions, including loss of data center capacity, interruption due to cyber-attacks, loss of network connectivity or inability to utilize proprietary software of third-party vendors, could affect our ability to timely meet the needs of our partners and customers and harm our business” and “Part I—Item 1C. Cybersecurity”.
Human Capital
Providing a meaningful value proposition for our associates is one of our top priorities. We seek to enhance our associate value proposition continuously to ensure that we offer competitive rewards, career opportunities and workplace conditions, which we believe enables us to attract and retain a highly qualified and motivated workforce.
As of December 31, 2024, we employed approximately 6,000 associates worldwide, with the majority concentrated in the United States. Attracting, developing and retaining top talent is critical to our business. In making these employment-related decisions, we comply with all applicable laws. We promote an inclusive, engaged culture that empowers associates through opportunities to grow, develop and lead. Our associates have been, and will remain, the backbone of our business, and we take a holistic approach to our associates’ experiences, recognizing that an engaged workforce drives our long-term growth and sustainability. Our Board of Directors and Compensation & Human Capital Committee provide important oversight of our human capital management strategy, and receive regular updates from senior management and third-party consultants on human capital trends and developments and other key human capital matters that drive our ongoing success and performance.
Associate Benefits and Well-Being
Associate well-being remains a top human capital priority, and we are committed to providing our associates with competitive total compensation, benefits and wellness resources. Our associates continue to value flexible hybrid work policies that allow them to balance office work and remote work time. Nearly 9 out of 10 associates view our flexible work arrangements as a competitive advantage relative to other potential employment opportunities. We intend to continue flexible work arrangements, seeking to take advantage of the engagement and productivity benefits associated with increased flexibility, as well as opportunities for connectedness and social interaction. Other associate well-being resources include mental health awareness and counseling support, financial education and wellness courses, a variety of fitness and meditation classes, a well-being cost reimbursement program and other benefits to promote mental and physical health.
During 2024, we further improved the competitiveness of our associate benefit offerings in various ways, including (i) depositing 3% “free money” (i.e., 3% of annual pay) into all eligible associates’ Bread Financial 401(k) Plan, including those associates that do not make any voluntary contributions; (ii) increasing the number of free therapy sessions for associates and their immediate family members; and (iii) adding other new life-event benefits to help new parents.
Associate Experience and Engagement
Delivering an exceptional customer experience relies on our ability to cultivate an engaging and rewarding experience for our associates. We maintained high levels of associate engagement and retention in 2024 and were successful with talent acquisition in key areas. As discussed further below, in 2024 we continued to focus on developing our internal talent through opportunities to learn new skills and make lateral moves across the organization. We continue to listen to and act on feedback from our associates, including through our annual Associate Experience Survey and other more frequent surveys and communications. Each year after the results of the annual Associate Experience Survey have been tabulated, our senior management presents those results to our Compensation & Human Capital Committee and our Board of Directors, including discussion regarding trends observed and actions to be taken in response to the results. Input from our Board of Directors helps inform our human capital strategies and objectives going forward; our global themes for 2024 included expanding growth options within the Company and fostering collaboration to meet our BFH goals and objectives.
Workforce Readiness, Growth and Advancement
In a competitive environment where companies must offer an associate value proposition that addresses the needs of a multigenerational workforce, we have developed and implemented strategies focused on human capital to ensure workforce readiness, growth and advancement. We offer a broad suite of workforce mobility programs as a focused effort to help attract new talent and those entering the workforce, develop our talent through stretch projects and skill development, hone leadership skills to further careers, and rotate associates across the business, broadening their expertise and abilities. During the year, we continued to offer and expand our suite of mobility programs including our six-month apprenticeship program, which creates a feeder pipeline for multiple areas across the organization, typically from Care Center positions to non-Care Center positions.
Robust training and development remains central to our human capital strategy. Another program within our suite of workforce mobility programs is our RISE Program. This program is tailored to our Care Center associates and provides a track for those associates to remain in the Care Center but work through their career journeys and become leaders within their respective teams. In addition to career-oriented training and development, we require annual associate training to ensure ongoing adherence to responsible business practices and ethical conduct, and all associates must certify annually that they have read and will adhere to our Code of Ethics.
Inclusive Culture
We are committed to creating an inclusive culture that attracts and values diversity of thought, experience, background, skills and ideas, driving our associates’ sense of belonging. Over the past few years, we have advanced our actions and activities in support of creating a more inclusive work environment, including the maturation of our associate programs and our nine Business Resource Groups, which are open to all associates and that nearly 1,400 unique associates have voluntarily joined. Based on our annual Associate Experience Survey, 83% of our associates feel a sense of belonging and 92% believe Bread Financial is committed to a diverse and inclusive work culture.
Sustainability Strategy
We are a financial services company dedicated to empowering our customers and optimizing opportunities to create value for all our stakeholders, while advancing long-term financial and reputational goals. We prioritize initiatives that strengthen our communities, reduce our environmental impact, promote inclusion and build financial confidence. We continue to advance the integration of environmental and social factors into our overall governance, risk management and reporting practices in ways that increase transparency and enhance the quality of our disclosures. Additional information regarding our sustainability strategy and responsible business practices can be found in our annual sustainability report published on our website at: https://investor.breadfinancial.com/sustainability/. No information from this website is incorporated by reference herein. Please also see “Human Capital” above.
Other Information
Our corporate headquarters are located at 3095 Loyalty Circle, Columbus, Ohio 43219, where our telephone number is 614-729-4000.
We file or furnish annual, quarterly and current reports, proxy statements and other information with the SEC. Our SEC filings are available to the public at the SEC’s website at www.sec.gov. You may also obtain copies of our annual, quarterly and current reports, proxy statements and certain other information filed or furnished with the SEC, as well as amendments thereto, free of charge from our website, www.BreadFinancial.com. No information from this website is incorporated by reference herein. These documents are posted to our website as soon as reasonably practicable after we have filed or furnished these documents with the SEC. We post our Audit Committee, Risk & Technology Committee, Compensation & Human Capital Committee and Nominating & Corporate Governance Committee charters, our corporate governance guidelines, and our code of ethics, code of ethics for senior financial officers, and code of ethics for Board members on our website.
Item 1A. Risk Factors.
RISK FACTORS
This section should be carefully reviewed, in addition to the other information appearing in this Form 10-K, including the sections entitled “Risk Management” and “Management’s Discussion and Analysis of Financial Condition and Results of Operations” and our audited Consolidated Financial Statements and related Notes, for important information regarding risks and uncertainties that affect us. The risks and uncertainties described below are not the only ones we face. Additional risks and uncertainties that we are unaware of, or that we currently believe are not material, may also become important factors that adversely affect our business. If any of the following risks actually occur, our business, financial condition, results of operations, and future prospects could be materially and adversely affected.
Summary
This risk factor summary is qualified in its entirety by reference to the complete description of our risk factors set forth immediately below.
Risks related to our macroeconomic, global, strategic, business and competitive environment include:
•Market conditions, inflation, interest rates, labor market conditions, recessionary pressures or concerns over a prolonged economic slowdown, and the related impact on consumer spending behavior, payments, debt levels, savings rates and other behavior, could have a material adverse effect on our business.
•Global political, public health and social events or conditions, including ongoing wars and military conflicts, may harm our business.
•Our unsecured loans make us reliant on the future credit performance of our customers, and if customers are unable to repay our loans, our level of future delinquency and write-off rates will increase.
•A significant percentage of our revenue is generated through relationships with a limited number of partners, and a decrease in business from, or the loss of, any of these partners, could have an adverse effect on our business.
•Our business is heavily concentrated in U.S. consumer credit, and therefore our results are more susceptible to fluctuations in the U.S. consumer credit market than a more diversified company.
•The amount of our Allowance for credit losses could adversely affect our business and may be insufficient to cover actual losses on our loans.
•We may be unable to successfully identify, complete or successfully integrate or disaggregate business acquisitions, divestitures and other strategic initiatives.
•Competition in our industry is intense.
•Our results of operations and growth depend on our ability to retain existing partners and attract new partners, and our results are impacted, to a significant extent, on the active and effective promotion and support of our products by our partners and on the financial performance of our partners.
•Underwriting performance of acquired or new lending programs may not be consistent with existing experience.
•We rely extensively on models in managing many aspects of our business, and if they are not accurate or are misinterpreted, such factors could have a material adverse effect on our business and results of operations.
•Fraudulent activity associated with our products and services could negatively impact our operating results, brand and reputation, decreasing the use of our products and services and increasing our fraud losses.
Risks related to our liquidity, market and credit risk include:
•Adverse financial market conditions or our inability to effectively manage our funding and liquidity risk could have a material adverse effect on our business, liquidity and ability to meet our debt service requirements and other obligations.
•Our inability to effectively access the securitization or other capital markets could limit our funding opportunities for loans and other business opportunities.
•Competition for deposits and regulatory restrictions on deposit products can impact availability and cost of funds.
•Our level of indebtedness may restrict our ability to compete and grow our business.
•Our market valuation has been, and may continue to be, volatile, and returns to stockholders may be limited.
•We are a holding company and depend on dividends and other payments from our Banks, which are subject to various legal and regulatory restrictions.
Risks related to our legal, regulatory and compliance environment include:
•We face various risks related to the extensive government regulation and supervision of our business, including by the FDIC, CFPB and other federal and state authorities. These risks include pending and future laws and regulations that may adversely impact our business, such as the CFPB’s final rule with respect to late fees, as well as supervisory and other actions that may be taken against us by our regulators.
•Pending and future litigation could subject us to significant fines, penalties, judgments and/or requirements.
•Regulations relating to privacy, information security and data protection could increase our costs, affect or limit how we collect and use personal information and adversely affect our business opportunities.
•Financial institution capital requirements may limit cash available for business operations, growth and returns to stockholders.
Risks related to cybersecurity, technology and third-party vendors include:
•We rely on third-party vendors, and could be adversely impacted if such vendors fail to fulfill their obligations.
•Impacts arising from or relating to the transition of our credit card processing services to strategic outsourcing providers that we completed in 2022 have, and may continue to adversely affect our business.
•Failures in data protection, cybersecurity and information security, as well as business interruptions to our data centers and other systems, could critically impair our products, services and ability to conduct business.
•Our industry is subject to rapid and significant technological changes, and we may be unable to successfully develop and commercialize new or enhanced products and services.
•The development and use of AI presents risks and challenges to our business, including compliance with new AI laws and regulations, risks associated with AI models, and the malicious use of AI technology by bad actors.
Risks related to the spinoff of our former LoyaltyOne segment include potential tax and other liabilities, existing or future litigation or other disputes, or other adverse impacts.
Macroeconomic, Global, Strategic, Business and Competitive Risks
Weakness and instability in the macroeconomic environment could have a material adverse effect on our business, results of operations and financial condition.
Macroeconomic conditions historically have affected our business, results of operations and financial condition and will continue to affect them in the future. We offer an array of payment, lending and saving solutions to consumers, and a prolonged period of economic weakness, including a recession or economic slowdown, economic and market volatility, and other adverse economic conditions, including persistent inflation, high interest rates and high levels of unemployment, could have a material adverse effect on our business, results of operations and financial condition, as these macroeconomic conditions may reduce consumer confidence and negatively impact customers’ payment and spending behavior. Some of the specific risks we face as a result of these conditions include:
•Adverse impacts on our customers’ ability and willingness to pay amounts owed to us, increasing delinquencies, defaults, charge-offs, bankruptcies and consequentially our Allowance for credit losses, and decreasing recoveries;
•Decreased consumer spending, changes in payment patterns, lower demand for credit and shifts in consumer payment behavior towards avoiding late fees, finance charges and other fees;
•Decreased reliability of the processes and modeling we use to estimate our Allowance for credit losses, particularly if unexpected variations in key inputs and assumptions cause actual losses to diverge from the projections of our modeling and our estimates become increasingly subject to management’s judgment; and
•Limitations on our ability to replace maturing liabilities and to access the capital and deposit markets to meet liquidity needs.
While we closely monitor economic conditions and indicators, including inflation, interest rates, changes in monetary policy, housing values, the state of the commercial real estate industry, energy prices, consumer wages, consumer saving rates and debt levels, including student loan debt, consumer and business spending, unemployment, financial markets, government policy and concerns about the level of U.S. government debt, as well as economic and political conditions in the U.S. and global markets, the outcome of any of these conditions and indicators remains difficult to predict. During 2024, the economic scenario weightings in our credit reserve modeling continued to reflect an increased probability of a recession, high interest rates, persistent inflation, and the increased cost of overall consumer debt. A recession or prolonged period of economic weakness would likely, among other things, adversely affect consumer discretionary spending levels
and the ability and willingness of customers to pay amounts owed to us and could have a material adverse effect on our business, key credit trends, results of operations and financial condition. Moreover, the current macroeconomic environment may have a disproportionately adverse impact on us, as compared to our peers, due to our relatively higher proportion of private label credit card accounts and our deeper underwriting. In the current macroeconomic landscape, the wage growth of many moderate and lower-income households has been challenged by the compounding effect of persistent inflation, even while unemployment rates remain low. Given the higher proportion of moderate and lower-income households within our partners’ customer bases relative to many of our peers, a continuation of this trend could impact us more negatively than others in our industry. Moreover, the current Presidential Administration’s policies on trade, immigration and taxes could create inflationary pressures, which in turn could disproportionately impact our customer base.
For context, during the Great Recession, our Delinquency and Net loss rates peaked in 2009 at 6.2% and 10.0%, respectively. As of December 31, 2024, our Delinquency rate was 5.9% and our 2024 full-year Net loss rate was 8.2%. While these 2024 rates were lower than those experienced in 2009 during the Great Recession, the current and near-term anticipated Delinquency and Net loss rates are high, relative to our historical experience, and a prolonged continuation or worsening of these rates could have a material adverse impact on us.
In addition, outbreaks of illnesses, pandemics, endemic diseases, or other local or global health issues, political uncertainties (including those arising from significant shifts in policy that impact consumers, such as tariffs and other trade-related measures, taxes and immigration, among others), international hostilities, armed conflict, war (such as the ongoing wars between Ukraine and Russia, and between Israel and Hamas), civil unrest, climate-related events, impacts to the power grid, and natural disasters have, to varying degrees, negatively impacted our operations, brand partners, service providers and consumer spending, and such events and conditions may negatively impact us going forward.
The loans we make are unsecured, and we may not be able to ultimately collect from customers that default on their loans.
The primary risk associated with unsecured consumer lending is the risk of default or bankruptcy of the borrower, resulting in the borrower’s balance being written-off as uncollectible. We rely principally on the borrower’s creditworthiness for repayment of the loan and, therefore, have no other recourse for collection. An increase in defaults or net principal losses could result in a reduction in Net income.
We may not be able to successfully identify and evaluate the creditworthiness of borrowers to minimize delinquencies and losses. As part of our efforts to manage our credit risk, we use our automated proprietary scoring technology and verification procedures to make risk-based origination decisions when approving new account holders, establishing or adjusting their credit limits and applying our risk-based pricing. These models may not accurately predict future write-offs for various reasons discussed elsewhere in these Risk Factors, including “Our risk management policies and procedures may not be effective, and the models we rely on may not be accurate or may be misinterpreted.” below. While we monitor credit quality on a regular and consistent basis, utilizing internal algorithms and external credit bureau risk scores and other data, these algorithms and data sources may be inaccurate or incomplete, including as a result of certain customers’ credit profiles not fully reflecting their credit risk due to any number of factors, including, for example, the less-regulated reporting requirements for many fintechs offering buy now, pay later products or other lending options and existing or future limitations on the reporting of medical debt. Mandated changes to credit bureau reporting, or the information that may be included in a credit bureau report, can change the accuracy of scoring models that leverage tradelines and performance in determining credit risk. As a result, the data and models upon which we rely may not fully reflect the extent of our customers’ actual financial obligations.
General economic conditions, including a recession or prolonged economic slowdown, persistent inflation, interest rates, high unemployment or volatility in energy prices, may result in greater delinquencies that lead to greater credit losses. In addition to being affected by general economic conditions and the success of our collection and recovery efforts, the stability of our Delinquency and Net loss rates are affected by the credit risk inherent in our Credit card and other loan portfolios, as well as the vintage of the accounts in our various credit card portfolios. We are also closely monitoring the effects on our business of the lifting of the moratorium on federal student loan payments in October 2023, which moratorium had been originally implemented as part of the federal government’s COVID-19 response under the CARES Act in March 2020. Under the applicable rules, there was a grace period for federal student loan borrowers until late 2024 before any adverse credit bureau reporting was to be made in the event they fail to resume payments on their loans. This grace period has ended, and we are closely monitoring the segment of our portfolio with student loans to observe payment
trends. In addition, targeted government efforts to forgive or discharge portions of student loan debt or provide additional relief may further influence these trends.
Further, our pricing strategy may not offset the negative impact on profitability caused by increases in delinquencies and losses, thus any material increases in delinquencies and losses beyond our current estimates could have a material adverse impact on us. Our Delinquency rates were 5.9% of Credit card and other loans as of December 31, 2024, compared with 6.5% and 5.5% as of December 31, 2023 and 2022, respectively. For 2024, our Net principal loss rate was 8.2%, compared with 7.5% and 5.4% for 2023 and 2022, respectively. As referenced above, the current and near-term anticipated Delinquency and Net loss rates remain high, relative to our historical experience, and a prolonged continuation or worsening of these rates could have a material adverse impact on our business and results of operations.
A significant percentage of our Total net interest and non-interest income, or revenue, is generated through our
relationships with a limited number of partners, and a decrease in business from, or the loss of, any of these partners could cause a significant drop in our revenue.
We depend on a limited number of large partner relationships for a significant portion of our revenue. As of and for the year ended December 31, 2024, our five largest credit card programs (based on Total net interest and non-interest income) accounted for approximately 48% of our Total net interest and non-interest income excluding the gain on sale and 38% of our End-of-period credit card and other loans. In particular, our programs with (alphabetically) Signet Jewelers, Ulta Beauty and Victoria’s Secret & Co. and its retail affiliates, each accounted for 10% or more of our Total net interest and non-interest income for the year ended December 31, 2024. A decrease in business from, or the loss of, any of our significant partners for any reason, could have a material adverse effect on our business. We previously announced the non-renewal of our contract with BJ’s Wholesale Club (BJ’s) and the sale of the BJ’s portfolio, which closed in late February 2023. For the year ended December 31, 2022, BJ’s branded co-brand accounts generated approximately 10% of our Total net interest and non-interest income, and BJ’s branded co-brand accounts were responsible for approximately 11% of our Total credit card and other loans as of December 31, 2022. Our business is intensely competitive, and we cannot provide assurance that we will retain the business of all of our significant brand partners going forward.
Our business is heavily concentrated in U.S. consumer credit, and therefore our results are more susceptible to fluctuations in that market than a more diversified company.
Our business is heavily concentrated in U.S. consumer credit. As a result, we are more susceptible to fluctuations and risks particular to U.S. consumer credit than a more diversified company. For example, our business is particularly sensitive to macroeconomic conditions that affect the U.S. economy, consumer spending and consumer credit. We are also more susceptible to the risks of increased regulations and legal and other regulatory actions that are targeted at consumer credit or the specific consumer credit products that we offer, such as legislation and regulations relating to credit card late fees, finance charges and promotional financing. Our business concentration could have an adverse effect on our results of operations.
We expect growth to result, in part, from new and acquired credit card and other loan programs whose performance could result in increased portfolio losses and negatively impact our profitability.
We expect an important source of our growth to come from new and acquired credit card and other loan programs. We cannot be assured that the loss experience on new and acquired programs will be consistent with our more established programs, or that the cost to provide service to these new and acquired programs will not be higher than anticipated. The failure to successfully underwrite these new and acquired programs may result in defaults greater than our expectations and could have a material adverse impact on us and our profitability. See “Our risk management policies and procedures may not be effective, and the models we rely on may not be accurate or may be misinterpreted.”. Moreover, under the CECL accounting rules, the acquisition of an existing credit card or other loan portfolio typically has a negative impact on certain key financial metrics in the near-term, including Net income and Earnings per share, because we are required to include a reserve build in our Provision for credit losses for the estimated credit losses to be experienced over the life of the acquired portfolio. The amount of this reserve build (included in the reporting period in which the portfolio is obtained) is often large relative to the amount of revenue generated through such date by the newly-acquired portfolio. See also “–The amount of our Allowance for credit losses could adversely affect our business and may prove to be insufficient to cover actual losses on our loans.” below.
Our risk management policies and procedures may not be effective, and the models we rely on may not be accurate or may be misinterpreted.
Our risk management framework, which seeks to identify and mitigate current or future risks and appropriately balance risk and return, may not be comprehensive or fully effective. As regulations and competition continue to evolve, our risk management framework may not always keep sufficient pace with those changes. If our risk management framework does not effectively identify or mitigate our risks, we could suffer unexpected losses and could be materially adversely affected.
We rely extensively on models in managing many aspects of our business, including liquidity and capital planning (including stress testing), customer selection, underwriting and line management, credit and other risk management, pricing, reserving and collections management. The models may prove in practice to be less predictive than we expect for a variety of reasons, including as a result of errors in constructing, interpreting or using the models or the use of inaccurate assumptions (including models being calibrated on historical cycles and correlations which may not be predictive of the future, or failures to update assumptions appropriately or in a timely manner). Our assumptions may be inaccurate for many reasons including that they often involve matters that are inherently difficult to predict and beyond our control (e.g., macroeconomic conditions, including continued elevated inflation, low unemployment, increasing consumer debt levels and weakening in macroeconomic indicators, and their impact on partner and customer behaviors) and they often involve complex interactions between a number of dependent and independent variables, factors and other assumptions. In particular, in recent years, we have observed rates and correlations among several key macroeconomic variables, such as unemployment and interest rates, perform outside of observed historical norms, which could impact the reliability of certain models in the current economic environment. The errors or inaccuracies in our models may be material, and could lead us to make poor or sub-optimal decisions in managing our business, and this could have a material adverse effect on our business, results of operations and financial condition.
Fraudulent activity associated with our products and services could negatively impact our operating results, brand and reputation and cause the use of our products and services to decrease and our fraud losses to increase.
We are subject to the risk of fraudulent activity associated with our products and services, as well as retailers, partners, other merchant parties or third-party service providers handling consumer information. Our products are susceptible to application fraud because, among other things, we provide immediate access to credit at the time of approval. In addition, digital sales on the internet and through mobile channels continue to be a larger part of our business, and fraudulent activity is higher as a percentage of sales in those channels than in brick-and-mortar store transactions. The different financial products we offer, including deposit products, are susceptible to different types of fraud, and, depending on our product mix and channel mix, we may continue to experience variations in, or levels of, fraud-related expenses that are different from or higher than those experienced by some of our competitors or the industry generally. The risk of fraud continues to increase for the financial services industry, and credit card and deposit fraud, identity theft and related crimes are likely to continue to be prevalent, with increasingly sophisticated perpetrators. More recently, emerging generative AI capabilities, such as synthetic voice and conversation generation, introduced new fraud risks, especially in the form of identity fraud. Our resources, technologies and fraud prevention tools may be insufficient to accurately detect and prevent fraud.
Our fraud-related operational losses were $65 million, $127 million and $73 million for the years ended December 31, 2024, 2023 and 2022, respectively. During 2023, we believe the financial services industry generally experienced an uptick in both the volume and sophistication of fraud attacks, and we also experienced that trend in our business, with fraud-related operational losses increasing significantly from 2022 levels. While we were successful in decreasing fraud-related losses in 2024, the perpetrators of fraud attacks remain persistent and we cannot provide assurance that fraud-related losses will remain at these lower levels going forward. In addition to direct financial impacts, high profile fraudulent activity could also negatively affect our brand and reputation, which could negatively impact the use of our services, leading to a material adverse effect on our results of operations. In addition, significant increases in fraudulent activity could lead to regulatory intervention, including, but not limited to, additional consumer notification requirements, increasing our costs and negatively impacting our operating results, net income and profitability. Regulators and consumer activists have also sought to expand financial institutions’ responsibility to hold customers harmless for fraudulent transactions on their accounts, which increases our exposure to fraud-related losses.
The amount of our Allowance for credit losses could adversely affect our business and may prove to be insufficient to cover actual losses on our loans.
The Financial Accounting Standards Board’s CECL accounting standard became effective for us on January 1, 2020 and requires us to determine periodic estimates of the lifetime expected credit losses on loans, and reserve for those expected
credit losses through an allowance for credit losses against the loans. In addition, as referenced above, for loan portfolios we acquire, we are required to establish at the time of acquisition such an allowance for credit losses. Any subsequent deterioration in the performance of a purchased portfolio after acquisition results in incremental credit loss reserves. Growth in our loan portfolio generally would also lead to an increase in our Allowance for credit losses.
The process for establishing an allowance for credit losses is critical to our results of operations and financial condition, and requires complex modeling and judgments, including forecasts of economic conditions. The ongoing impact of CECL will be significantly influenced by the composition, characteristics and quality of our Credit card and other loans, as well as the prevailing economic conditions and forecasts utilized. For additional information regarding our Allowance for credit losses, see Note 3, “Allowance for Credit Losses” to our audited Consolidated Financial Statements included as part of this Annual Report on Form 10-K.
The CECL model may create more volatility in the level of our Allowance for credit losses. If we are required (as a result of any review, update, regulatory guidance or otherwise) to materially increase our level of the Allowance for credit losses, such increase could adversely affect our business, financial condition, results of operations and opportunity to pursue new business. Moreover, we may underestimate our expected credit losses, and we cannot assure that our Allowance for credit losses will be sufficient to cover actual losses.
We may not be successful in realizing the benefits associated with our acquisitions, dispositions and strategic investments, and our business and reputation could be materially adversely affected.
Historically, we have acquired a number of businesses, as well as made strategic investments in businesses, products, technologies, platforms or other ventures, and we expect to continue to evaluate potential acquisitions, investments and other transactions in the future. There is no assurance that we will be able to successfully identify suitable candidates for any such opportunities, value any such opportunities accurately, negotiate favorable terms for any such opportunities, or successfully complete any such proposed transactions. If we are unable to identify attractive acquisition candidates or accretive new business opportunities, our growth could be limited.
Similarly, we may evaluate the potential disposition of, or elect to divest, assets or portfolios that no longer complement our long-term strategic objectives, as we did in November 2021, when we completed the spinoff of our LoyaltyOne segment. See also “Risks Related to the LoyaltyOne Spinoff.” below.
In addition, there are numerous risks associated with acquisitions, dispositions and the implementation of new business opportunities, including, but not limited to: the diversion of management’s attention from other business concerns; continued financial responsibility with respect to a divested business, including required equity ownership, guarantees, indemnities or other financial obligations; the assumption of unknown liabilities of the acquired company; the uncertainty of achieving expected benefits of an acquisition or disposition, including revenue, human resources, technological or other cost savings, operating efficiencies or synergies; the inability to integrate systems, personnel or technologies from our acquisitions and strategic investments; unforeseen legal, regulatory or other challenges that we may not be able to manage effectively; and the reduction of cash available for operations, payment of dividends, stock repurchase programs or other uses and potentially dilutive issuances of equity securities or incurrence of additional debt.
Furthermore, if the operations of an acquired or new business do not meet expectations, our profitability may decline and we may seek to restructure the acquired business or to impair the value of some or all of the assets of the acquired or new business.
Competition in our industry is intense, and the markets for the services that we offer may contract or fail to expand, each of which could negatively impact our growth and profitability.
The markets for our products and services are highly competitive, and we expect this competition to intensify. Our growth and continued profitability depend on continued acceptance or adoption of the products and services we offer. We compete with a wide range of businesses, and some of our current competitors have longer operating histories, stronger brand names and greater financial, technical, marketing and other resources than we do. Moreover, the consumer credit and payments industry is highly competitive and we face an increasingly dynamic industry as emerging technologies enter the marketplace. For a more detailed discussion regarding how we compete with respect to each of our product categories, see “Item 1. Business—Competition” of this Form 10-K above. Additionally, downturns in the economy or the performance of our retail or other partners, including as a result of macroeconomic conditions, geopolitical events or global health events or other pandemic or endemic diseases, may result in a decrease in the demand for our products and services. Our ability to
generate significant revenue from partners and customers will depend on our ability to differentiate ourselves through the products and services we provide and the attractiveness of our programs to consumers. If we are not able to differentiate our products and services from those of our competitors, drive value for our partners and their customers, or effectively and efficiently align our resources with our goals and objectives, we may not be able to compete effectively in the market. Any decrease in the demand for our products and services for the reasons discussed above or any other reasons could have a material adverse effect on our growth, revenue and operating results.
Our results of operations and growth depend on our ability to retain existing partners and attract new partners.
The majority of our revenue is generated from the credit products we provide to customers of our partners pursuant to program agreements that we enter into with our partners. As a result, our results of operations and growth depend on our ability to retain existing partners and attract new partners. Historically, there has been turnover in our partners, and we expect this will continue in the future. See also, “A significant percentage of our Total net interest and non-interest income, or revenue, is generated through our relationships with a limited number of partners, and a decrease in business from, or the loss of, any of these partners could cause a significant drop in our revenue.”.
There is significant competition for our existing partners, and our failure to retain our existing larger partner relationships upon the expiration of a contractual arrangement or our earlier loss of a relationship upon the exercise of a partner’s early termination rights, or the expiration or termination of a substantial number of smaller partner contracts or relationships, could have a material adverse effect on our results of operations (including growth rates) and financial condition to the extent we do not acquire new partners of similar size and profitability or otherwise grow our business. In addition, existing relationships may be renewed with less favorable terms to us in response to increased competition for such relationships.
The competition for new partners is also significant, and our failure to attract new partners could adversely affect our ability to grow.
Our results depend, to a significant extent, on the active and effective promotion and support of our products by our brand partners.
Our partners generally accept most major credit cards and various other forms of payment; therefore our success depends, in part, on their active and effective promotion of our products to their customers. We depend on our partners to integrate the use of our credit products into their operations, including into their in-store and online shopping experiences and loyalty programs. We rely on our partners to train their sales and call center associates about our products and to have their associates encourage customers to apply for, and use, our products and otherwise effectively market our products. If our partners do not effectively promote and support our products, or if they make changes in their business models that negatively impact card usage, these actions could have a material adverse effect on our business and results of operations. Partners may also implement or fail to implement changes in their systems and technologies that may disrupt the integration between their systems and technologies and ours, any of which could disrupt the use of our products. In addition, if our partners engage in improper business practices, do not adhere to the terms of our program agreements or other contractual arrangements or standards, or otherwise diminish the value of our brand, we may suffer reputational damage and customers may be less likely to use our products, which could have a material adverse effect on our business and results of operations.
Our results are impacted, to a significant extent, by the financial performance of our partners.
Our ability to originate new credit card accounts, generate new loans, and earn interest and fees and other income is dependent, in part, upon sales of merchandise and services by our partners. The retail and other industries in which our partners operate are intensely competitive. Our partners’ sales may decrease or may not increase as we anticipate for various reasons, some of which are in the partners’ control and some of which are not. For example, partner sales have been, and in the future may be adversely affected by pandemic or endemic diseases or other macroeconomic conditions having a national, regional or more local effect on consumer spending, business conditions affecting the general retail environment, such as supply chain distributions or the ability to maintain sufficient staffing levels or a particular partner or industry, or natural disasters or other catastrophes affecting broad or more discrete geographic areas. If our partners’ sales decline for any reason, it generally results in lower credit sales, and therefore lower loan volumes and associated interest and fees and other income for us from our customers. In addition, if a partner closes some or all of its stores or becomes subject to a voluntary or involuntary bankruptcy proceeding (or if there is a perception that such an event may occur), its customers who have used our financing products may have less incentive to pay their outstanding balances to us, which could result in higher charge-off rates than anticipated and our costs for servicing its customers’ accounts may increase. This risk is particularly acute with respect to our largest partners that account for a significant amount of our Total net
interest and non-interest income. See “A significant percentage of our Total net interest and non-interest income, or revenue, is generated through our relationships with a limited number of partners, and a decrease in business from, or the loss of, any of these partners could cause a significant drop in our revenue.”. Moreover, if the financial condition of a partner deteriorates significantly or a partner becomes subject to a bankruptcy proceeding, we may not be able to recover customer returns, customer payments made in partner stores or other amounts due to us from the partner. A decrease in sales by our partners for any reason, or a bankruptcy proceeding involving any of them could have a material adverse impact on our business and results of operations.
We may not be successful in our efforts to promote usage of our DTC credit cards, or to effectively control the costs associated with such promotion, both of which may materially impact our profitability.
We have been investing in promoting the use of our DTC credit cards, including our Bread Cashback American Express Credit Card and our Bread Rewards American Express Credit Card, but there can be no assurance that our investments to acquire cardholders, provide differentiated features and services and increase the use of our DTC credit cards will be effective, particularly with increasing competition from other card issuers and fintechs, as well as changing consumer and business behaviors. In addition, if we develop new products or offers that attract customers looking for short-term incentives rather than incentivizing long-term loyalty, cardholder attrition and costs could increase. Moreover, we may not be able to cost-effectively manage and expand cardholder benefits, including controlling the growth of marketing, promotion, rewards and cardholder services expenses in the future.
Reductions in interchange fees, or changes in the laws and regulations governing such fees, could have various adverse impacts on our business and results of operations.
Interchange is a fee merchants pay to the payment networks in exchange for using the network’s infrastructure and payment facilitation, some of which is paid to credit card issuers. We earn interchange fees on co-brand and general purpose credit card transactions, but we typically do not charge or earn interchange fees from our partners or customers on our private label credit card products.
Certain merchants, in an effort to decrease their operating expenses, have with some success sought to lower interchange fees, including through promoting alternative payment platforms with lower processing costs and lobbying for legislative or regulatory changes. Several recent events and actions indicate a continuing focus on interchange by legislators, regulators and merchants. In 2023, for example, legislation was reintroduced in the U.S. House of Representatives and Senate, which, among other things, would require large issuing banks (over $100 billion) to offer a choice of at least two unaffiliated networks over which electronic transactions may be processed. At the state level, the Illinois legislature passed a bill that would, beginning in July 2025, prohibit the charging of interchange fees on sales tax and gratuities and restrict use of electronic payment transaction data except to facilitate or process the transaction or as required by law. This Illinois legislation is being challenged in federal court. Similar legislation has been introduced in other states and, absent a successful legal challenge, these bills would have a number of adverse impacts on us, including negatively impacting our interchange revenue and creating operational challenges.
Furthermore, to the extent interchange fees are reduced, one of our current competitive advantages with our partners—that we typically do not charge interchange fees when our private label credit card products are used to purchase our partners’ goods and services—may be reduced. In addition, for our co-brand and general purpose credit cards, we are subject to the operating regulations and procedures set forth by the payment networks. Our failure to comply with these operating regulations, which may change from time to time, could subject us to various penalties or fees, or the termination of our license to use the applicable payment network, all of which could have a material adverse effect on our business and results of operations.
We may not be able to retain and/or attract and hire a highly qualified and diverse workforce or maintain our corporate culture, and having a large segment of our workforce working from home may exacerbate these risks and cause new risks.
Our performance largely depends on the talents and efforts of our employees, particularly our key personnel and senior management. We may be unable to retain or to attract highly qualified employees. The market for key personnel is highly competitive, particularly in technology and other skill areas significant to our business. Failure to attract, hire, develop, motivate and retain highly qualified and diverse employee talent, or to maintain a corporate culture that fosters innovation, creativity and teamwork could harm our overall business and results of operations. We rely on key personnel to lead with
integrity and decency. To the extent our leaders behave in a manner that is not consistent with our values, we could experience significant impacts to our brand and reputation, as well as to our corporate culture.
Moreover, in connection with the COVID-19 pandemic, we transitioned nearly all of our workforce to work remotely, and nearly all of our workforce continues to work on a hybrid office/remote schedule. Remote work by a majority of our employee population may impact our culture and employee engagement with our company, which could affect productivity and our ability to retain employees who are critical to our operations and may increase our costs and impact our results of operations. Moreover, work from home policies by other companies may create more job opportunities for employees and make it more difficult for us to attract and retain key talent, especially in light of changing worker expectations and talent marketplace variability regarding flexible work models. In addition, employees who work from home rely on residential communication networks and internet providers that may not be as resilient as commercial networks and providers, and therefore may be more susceptible to service interruptions and cyberattacks than commercial systems. Our business continuity and disaster recovery plans, which have been historically developed and tested with a focus on centralized delivery locations, may not work as effectively in a distributed work from home model, where weather impacts, network and power grid downtime may be difficult to manage. If we are unable to manage the work from home environment effectively to address these and other risks, our reputation and results of operations may be impacted.
Our operations and financial performance could be adversely affected by severe weather and natural disasters, as well as by climate change and ESG-related regulations and actions.
Severe weather events and natural disasters could have a material adverse effect on our financial position and results of operations, and the timing and effects of any such event cannot accurately be predicted. The frequency and severity of some types of weather events and natural disasters, including wildfires, tornadoes, severe storms and hurricanes, have increased in recent years, which further reduces our ability to predict their effects accurately. These such events could affect us directly (for example, by interrupting our systems, impacting the power grid, damaging our facilities or otherwise preventing us from conducting our business in the ordinary course) or indirectly (for example, by damaging or destroying brand partner businesses or customers’ homes, impacting our service providers or otherwise impairing customers’ ability to repay their loans). Many of our customers were affected by the particularly intense 2024 hurricane season in the U.S. As a result of these hurricanes, we froze delinquency progression for cardholders in Federal Emergency Management Agency (FEMA) identified impact zones for one billing cycle, which resulted in modestly lower Net principal losses and Net loss rate in the fourth quarter of 2024, and consequently these actions will negatively impact Net principal losses and the Net loss rate in the second quarter of 2025.
In addition, many governments, investors and other stakeholders are under pressure to accelerate actions to address climate change and other environmental, social and governance topics. This has led to new regulations and expectations, which may be conveyed to us in the form of stockholder proposals, public campaigns, proxy solicitations or otherwise, that may cause significant shifts in disclosure, commerce and consumption behaviors. Any of these developments may impact our operating costs and our business.
For example, in March 2024, the SEC issued final rules relating to the disclosure of a range of climate-related risks and other information. Multiple lawsuits were filed against the SEC, and the SEC issued a voluntary stay of the rules, pending review by the U.S. Court of Appeals for the Eighth Circuit, where the litigation had been consolidated. To the extent these rules become effective as issued, we and/or our partners could incur increased costs related to the assessment and disclosure of climate-related information. Our failure to comply with these requirements, if adopted, or any future regulatory requirements or disclosure standards, may expose us to government enforcement actions or private litigation and otherwise damage our reputation, any of which could adversely impact our business.
Conversely, other stakeholders hold differing views on sustainability-related goals and initiatives. Certain state governments and activist groups, and most recently the new Presidential Administration through a series of executive orders and other actions, have pursued measures that appear designed to discourage companies from engaging in ESG practices or adhering to certain ESG principles.
These circumstances, among others, may result in pressure from investors, unfavorable reputational impacts, including inaccurate perceptions or misrepresentation of our actual business practices, diversion of management’s attention and resources, and potential proxy fights, among other adverse impacts. Any failure, or perceived failure, by us to adhere to our public statements, comply fully with developing interpretations of sustainability-related laws and regulations, or meet evolving and varied stakeholder expectations and standards could negatively impact our business, reputation, financial condition and operating results.
Our Board-approved sustainability strategy, which focuses on opportunities to create value for all our stakeholders, while advancing our long-term financial and reputational goals, is intended to drive additional progress on initiatives that promote sustainability, responsible business practices and increased transparency in our disclosures. We continue to advance the integration of sustainability into our overall governance and risk management practices. Statements in this and other filings we make with the SEC and other public statements, including in our annual sustainability reports, related to these initiatives reflect our current plans and expectations and are not a guarantee that these initiatives will be achieved or achieved on the currently anticipated timeline. Our ability to execute on our sustainability strategy or achieve sustainability initiatives is subject to numerous factors and conditions, some of which are outside of our control.
Damage to our reputation could damage our business.
In recent years, financial services companies have experienced increased reputational risk as consumers protest and regulators scrutinize business and compliance practices of such companies. Maintaining a positive reputation is critical to attracting and retaining partners, customers, investors and employees. Damage to our reputation can therefore cause significant harm to our business and prospects. Harm to our reputation can arise from numerous sources, including, among others, employee misconduct; a breach of our or our service providers’ cybersecurity defenses; service outages, such as those many of our customers experienced in 2022 in connection with the transition of our credit card processing services to strategic outsourcing providers; litigation or regulatory outcomes; stockholder activism; failing to deliver minimum standards of service and quality; compliance failures; the use of our, or our partners’ products to facilitate legal, but controversial, products and services, including adult content, cryptocurrencies, firearms and gambling activity; and the activities of customers, business partners and counterparties. Social media also can cause harm to our reputation. By its very nature, social media can reach a wide audience in a very short amount of time, which presents unique challenges for corporate communications. Negative or otherwise undesirable publicity generated through unexpected social media coverage can damage our reputation and brand. Negative publicity regarding us, whether or not true, may result in customer attrition and other harm to our business prospects. There has also been increased focus on topics related to environmental, social and governance policies, and criticism of our policies in these areas could also harm our reputation and/or potentially limit our access to some forms of capital or liquidity.
Liquidity, Market and Credit Risks
Adverse financial market conditions or our inability to effectively manage our funding and liquidity risk could have a material adverse effect on our business, liquidity and ability to meet our debt service requirements and other obligations.
We need to effectively manage our funding and liquidity in order to meet our cash requirements such as day-to-day operating expenses, extensions of credit to our customers, investments to grow our business, payments of principal and interest on our borrowings and payments on our other obligations. Our primary sources of funding and liquidity are collections from our customers, deposits, funds from securitized financings and proceeds from unsecured borrowings, including our credit facility and outstanding senior notes. If we do not have sufficient liquidity, we may not be able to meet our debt service requirements and other obligations, particularly during a liquidity stress event. If we maintain or are required to maintain too much liquidity, it could be costly and reduce our financial flexibility.
We will need additional financing in the future to repay or refinance our existing debt at maturity, or otherwise, and to fund our growth. As of the date of this Annual Report on Form 10-K, we had outstanding $10 million of 4.25% convertible senior notes due in June 2028 and $900 million of 9.750% senior notes due in March 2029. The availability of additional financing will depend on a variety of factors such as financial market conditions generally, including the availability of credit to the financial services industry and our lender counterparties’ willingness to lend to us, consumers’ willingness to place money on deposit with us, our performance and credit ratings and the performance of our securitized portfolios. As an example of circumstances impacting our lenders’ willingness to lend, U.S. federal banking regulators proposed new rules in July 2023, commonly referred to as the Basel III “Endgame” or B3E, which would significantly revise the capital requirements applicable for large banking organizations with total assets of $100 billion or more. While the proposed B3E rules would not directly apply to us because we are under the $100 billion asset threshold, most of our institutional lenders would be subject to the enhanced capital requirements under B3E, which could limit their lending capacity available to lend to us and other borrowers. Disruptions, uncertainty or volatility in the capital, credit or deposit markets, such as the uncertainty and volatility experienced in the capital and credit markets during recessions and periods of financial stress, may limit our ability to obtain additional financing or refinance maturing liabilities on desired terms (including funding costs) in a timely manner, or at all. As a result, we may be forced to delay obtaining funding or be forced to issue or raise funding on undesirable terms, which could significantly reduce our financial flexibility and cause us to contract or not grow our business, all of which could have a material adverse effect on our results of operations and financial condition.
Given potential changes in the interest rate environment and other recessionary pressures, the debt markets may be volatile, and there can be no assurance that significant disruptions, uncertainties and volatility will not occur in the future. Specifically, availability of capital from the non-investment grade debt markets may be subject to significant volatility, and there can be no assurance that we will be able to access those markets at attractive rates, or at all. It is possible that we will be required to repay or refinance some or all of our maturing debt in volatile and/or unfavorable markets. If we are unable to continue to fund our business operations, access capital markets for debt refinancings and otherwise, and attract deposits on favorable terms and in a timely manner, or if we experience an increase in our borrowing costs or otherwise fail to manage our liquidity effectively, our results of operations and financial condition may be materially adversely affected.
If we are unable to securitize our credit card loans due to changes in the market or other circumstances or events, we may not be able to fund new credit card loans, which would have a material adverse effect on our operations and profitability.
A significant source of funding is our securitization of credit card loans, which involves the transfer of credit card loans to a trust, and the issuance by the trust of notes to third-party investors collateralized by the beneficial interest in the transferred credit card loans. A number of factors affect our ability to fund our credit card loans in the securitization market, some of which are beyond our control, including:
•conditions in the securities markets in general and the asset-backed securitization market in particular;
•availability of loans for securitization;
•conformity in the quality of our credit card loans to rating agency requirements and changes in that quality or those requirements;
•costs of securitizing our credit card loans;
•ability to fund required over-collateralization or credit enhancements, which are routinely used to achieve better credit ratings to lower borrowing cost; and
•the legal, regulatory, accounting or tax rules affecting securitization transactions and asset-backed securities, generally.
Moreover, as a result of Basel III, which refers generally to a set of regulatory reforms adopted in the U.S. and internationally that are meant to address issues that arose in the banking sector during the 2008-2010 financial crisis, banks have become subject to more stringent capital, liquidity and leverage requirements. In response to Basel III, certain lenders of private placement commitments within our securitization trusts have sought and obtained amendments to their respective transaction documents permitting them to delay disbursement of funding increases by up to 35 days. Although funding may be requested from other lenders who have not delayed their funding, access to financing could be disrupted if all of the lenders implement such delays or if the lending capacities of those who did not do so were insufficient to make up the shortfall. Furthermore, if adopted in its current form, the B3E rules would generally require large U.S. banking organizations to maintain higher levels of capital than under the current Basel III requirements. These higher capital requirements could cause our institutional lenders to reduce their lending activities and increase our securitization trusts’ borrowing costs. For example, excess spread may be affected if a securitization trust’s borrowing costs increase as a result of the proposed B3E changes to existing capital requirements. Such cost increases may result, for example, because the investors are entitled to indemnification for increased costs resulting from such regulatory changes, such as increased capital requirements.
The inability to securitize credit card loans due to changes in the market, regulatory proposals, the unavailability of credit enhancements, or any other circumstance or event would have a material adverse effect on our operations, cost of funds and overall financial condition.
The occurrence of events that result in the early amortization of our existing credit card securitization transactions or an inability to delay the accumulation of principal collections for our existing credit card securitization transactions would materially adversely affect our liquidity.
Our liquidity and cost of funds would be materially adversely affected by the occurrence of events that could result in the early amortization of our existing credit card securitization transactions. Early amortization events may occur as a result of certain adverse events specified for each asset-backed securitization transaction, including, among others, deteriorating asset performance or material servicing defaults. In addition, certain series of funding securities issued by our securitization trusts are subject to early amortization based on triggers relating to the bankruptcy of one or more retailers or other partners. Deteriorating economic conditions and increased competition in the retail industry, among other factors, may lead to an increase in bankruptcies among retailers who have entered into credit card programs with us. The bankruptcy of one
or more retailers or other partners could lead to a decline in the amount of new loans and could lead to increased delinquencies and defaults on the associated loans. Any of these effects of a partner bankruptcy could result in the commencement of an early amortization for one or more series of such funding securities, particularly if such an event were to occur with respect to a retailer or other partner relating to a large percentage of such securitization trust’s assets. The occurrence of an early amortization event may significantly limit our ability to securitize additional loans and materially adversely affect our liquidity.
Lower payment rates on our securitized credit card loans could materially adversely affect our liquidity and financial condition.
Certain collections from our securitized credit card loans come back to us through our subsidiaries, and we use these collections to fund our purchase of newly originated loans to collateralize our securitized financings. If payment rates on our securitized credit card loans are lower than they have historically been, fewer collections will be remitted to us on an ongoing basis. Further, certain series of our asset-backed securities include a requirement that we accumulate principal collections in a restricted account for a specified number of months prior to the applicable security’s maturity date. We are required under the program documents to lengthen this accumulation period to the extent we expect the payment rates to be low enough that the current length of the accumulation period is inadequate to fully fund the restricted account by the applicable security’s maturity date. Lower payment rates, and in particular payment rates that are low enough that we are required to lengthen our accumulation periods, could materially adversely affect our liquidity and financial condition.
Inability to grow or maintain our deposit levels in the future could have a material adverse effect on our liquidity, ability to grow our business and profitability.
A significant source of our funds is customer deposits, primarily in the form of certificates of deposit and other savings products. We obtain deposits directly from retail and commercial customers or through brokerage firms that offer our deposit products to their customers. In recent years, deposits have become an increasingly important source of funds for us, with, for example, our DTC deposits growing 19% from $6.5 billion as of December 31, 2023 to $7.7 billion as of December 31, 2024, and average DTC deposits representing 43% of our total funding sources. Our funding strategy includes continued growth of our liquidity through deposits. The deposit business continues to experience intense competition in attracting and retaining deposits. We compete on the basis of the rates we pay on deposits, the quality of our customer service and the competitiveness of our digital banking capabilities. Our ability to attract and maintain retail deposits remains highly dependent on the products we offer, the strength of our Banks, the reputability of our business practices and our financial health. Adverse perceptions regarding our lending practices, regulatory compliance, protection of customer information or sales and marketing practices, or actions taken by regulators or others with respect to our Banks, could impede our competitive position in the deposits market. Furthermore, the failures of other financial institutions (such as those of Silicon Valley Bank and Signature Bank in early 2023) or broader concerns about the financial services industry may cause deposit outflows as customers spread deposits among several different banks so as to maximize their amount of FDIC insurance, move deposits to banks deemed “too big to fail” or remove deposits from the banking system entirely.
The demand for the deposit products we offer may also be reduced due to a variety of factors, including macroeconomic events, changes in interest rates, changes in consumers’ preferences, demographics or discretionary income, regulatory actions that decrease consumer access to particular products or the development or availability of competing products. Competition from other financial services firms and others that use deposit funding products may affect deposit renewal rates, costs or availability. Conversely, any adjustments we make to the rates offered on our deposit products to remain competitive may adversely affect our liquidity or our profitability.
The FDIA prohibits an insured bank from offering interest rates on any deposits that significantly exceed rates in its prevailing market, unless it is “well capitalized”. A bank that is less than “well capitalized” may not pay an interest rate on any deposit in excess of 75 basis points over certain prevailing market rates. There are no such restrictions under the FDIA on a bank that is “well capitalized” and as of December 31, 2024, each of our Banks met or exceeded all applicable requirements to be deemed “well capitalized” for purposes of the FDIA. However, there can be no assurance that our Banks will continue to meet those requirements. Any limitation on the interest rates our Banks can pay on deposits may competitively disadvantage us in attracting and retaining deposits, resulting in a material adverse effect on our business.
The FDIA also prohibits an insured bank from accepting brokered deposits, unless it is “well capitalized” or it is “adequately capitalized” and receives a waiver from the FDIC. Limitations on our Banks’ ability to accept brokered deposits for any reason (including regulatory limitations on the volume of brokered deposits in total or as a percentage of
total assets) in the future could materially adversely impact our liquidity, funding costs and profitability. In December 2020, the FDIC updated its regulations that implement Section 29 of the FDIA to establish a new framework for analyzing whether certain deposit arrangements qualify as brokered deposits. This brokered deposit rule establishes bright-line standards for determining whether an entity meets the statutory definition of “deposit broker” and a consistent process for application of the primary purpose exception. All deposits on the Consolidated Balance Sheets of our Banks categorized as non-brokered in accordance with the current regulations mentioned above comply with all application requirements of those regulations. However, in the third quarter of 2024, the FDIC issued a proposed rule that, if finalized as proposed, would expand the scope of deposits that constitute “brokered deposits” and therefore could potentially cause certain of our present or prospective deposits to be treated as brokered. While we cannot speculate on whether this proposed rule will be implemented or on what terms, limitations on the ability of our Banks to participate in the gathering of deposits may competitively disadvantage us, impede our ability to meet our funding goals and result in a material adverse effect on our business.
As of December 31, 2024, we had $13.1 billion in deposits, with approximately $6.8 billion in non-maturity savings deposits and approximately $6.2 billion in certificates of deposit. If, for whatever reason, we are unable to grow or maintain our deposit levels, our liquidity, ability to grow our business and profitability could be materially adversely affected.
Our level of indebtedness could materially adversely affect our ability to generate sufficient cash to repay our outstanding debt, and our ability to react to changes in our business and our incurrence of additional indebtedness to fund future needs could exacerbate these risks.
Our level of indebtedness requires a high level of interest and principal payments. Subject to the limits contained in our credit agreement, the indenture governing our senior notes and our other debt instruments, we may be able to incur substantial additional indebtedness from time to time to finance working capital, capital expenditures, investments or acquisitions, or for other purposes. If we do so, the risks related to our level of indebtedness could intensify. Our level of indebtedness increases the possibility that we may be unable to generate cash sufficient to pay, when due, the principal of, interest on or other amounts due in respect of our indebtedness. Our level of indebtedness, combined with our other financial obligations and contractual commitments, could:
•make it more difficult for us to satisfy our obligations with respect to our indebtedness, and any failure to comply with the obligations under any of our debt instruments, including restrictive covenants, could result in an event of default under our credit agreement, the indenture governing our senior notes and the agreements governing our other indebtedness;
•require us to dedicate a substantial portion of our cash flow from operations to payments on our indebtedness, thereby reducing funds available for working capital, capital expenditures, acquisitions or other new business and other corporate purposes;
•increase our vulnerability to adverse economic and industry conditions, which could place us at a competitive disadvantage or require us to dispose of assets to raise funds if needed for working capital or to pay, when due, the principal of, interest on or other amounts due in respect of our indebtedness;
•limit our flexibility in planning for, or reacting to, changes in our business and the industries in which we and our brand partners operate;
•limit our ability to borrow additional funds, or to dispose of assets to raise funds, if needed, for working capital, capital expenditures, acquisitions or other new business and other corporate purposes;
•delay or abandon investments and capital expenditures;
•cause any refinancing of our indebtedness to be at higher interest rates and require us to comply with more onerous covenants, which could further restrict our business operations; and
•prevent us from raising the funds necessary to repurchase all senior notes tendered to us upon the occurrence of certain changes of control.
Restrictions imposed by the indenture governing our senior notes, our credit agreement and our other outstanding or future indebtedness may limit our ability to operate our business and to finance our future operations or capital needs or to engage in other business activities.
The terms of the indenture governing our senior notes, our credit agreement and agreements governing our other debt instruments limit us and our subsidiaries from engaging in specified types of transactions. These covenants limit our and our subsidiaries’ ability, among other things, to:
•incur additional debt;
•declare or pay dividends, redeem stock or make other distributions to stockholders;
•make investments;
•create liens or use assets as security in other transactions;
•merge or consolidate, or sell, transfer, lease or dispose of substantially all of our assets;
•enter into transactions with affiliates;
•sell or transfer certain assets; and
•enter into any consensual encumbrance or restriction on the ability of certain of our subsidiaries to pay dividends or make loans or sell assets to us.
As a result of these covenants and restrictions, we may be limited in how we conduct our business, and we may be unable to raise additional indebtedness to compete effectively or to take advantage of new business opportunities. The terms of any future indebtedness we may incur could include more restrictive covenants. We cannot assure that we will be able to maintain compliance with these covenants in the future. If we fail to comply with such covenants, we may not be able to obtain waivers of non-compliance from the lenders and/or amend the covenants so that we are in compliance therewith.
Any reduction in our credit ratings could increase the cost of our funding from, and restrict our access to, the capital markets and have a material adverse effect on our results of operations and financial condition.
Ratings of our debt are based on a number of factors, including financial strength, as well as factors not within our control, including conditions affecting the financial services industry, and the macroeconomic environment. Our ratings could be downgraded at any time and without any notice by any of the rating agencies, which could, among other things, adversely limit our access to the capital markets and adversely affect the cost and other terms upon which we are able to obtain funding. Our ability to raise funding through the securitization market also depends, in part, on the credit ratings of the securities we issue from our securitization trusts. If we are not able to satisfy rating agency requirements to confirm the ratings of our asset-backed securities, it could limit our ability to access the securitization markets.
Changes in market interest rates could negatively affect our profitability.
Changes in market interest rates cause our finance charges and our interest expense to increase or decrease, as certain of our assets and liabilities carry interest rates that fluctuate with market rates. We fund Credit card and other loans with a combination of fixed rate and floating rate funding sources that include deposits and securitized financings. We also have unsecured debt that is subject to variable interest rates, and we may in the future incur additional debt or issue preferred equity that may rely on variable interest rates.
The interest rate benchmark for most of our floating rate assets is the Prime rate, and the interest rate benchmark for our floating rate liabilities is generally either the Secured Overnight Financing Rate (SOFR) or the Federal funds rate. The Prime rate and SOFR or the Federal funds rate could reset at different times or could diverge, leading to mismatches in the interest rates on our floating rate assets and floating rate liabilities. Interest rates are highly sensitive to many factors that are beyond our control, including general economic conditions, the competitive environment within our markets, consumer preferences for specific loan and deposit products, and policies of various governmental and regulatory agencies, in particular the Federal Reserve. Changes in monetary policy, including changes in interest rates being applied by the Federal Reserve, could influence the amount of interest we receive on our Credit card and other loans and the amount of interest we pay on deposits and borrowings. As a result, the amount of interest we pay on our credit facilities may be difficult to predict.
If the interest we pay on deposits and other borrowings increases at a faster rate than the interest we receive on our Credit card and other loans, our profitability would be adversely affected. Conversely, our profitability could also be adversely affected if the interest we receive on our Credit card and other loans falls more quickly than the interest we pay on deposits and other borrowings.
Future sales of our common stock, or the perception that future sales could occur, may adversely affect our common stock price.
As of February 7, 2025, we had an aggregate of 141,999,154 shares of our common stock authorized but unissued and not reserved for specific purposes. In general, we may issue all of these shares without any action or approval by our stockholders. We have reserved 9,348,807 shares of our common stock for issuance under our employee stock purchase plan and our long-term incentive plans, of which 921,166 shares have been issued and 2,762,717 shares are issuable upon vesting of restricted stock awards and restricted stock units. Under the terms of the applicable indenture, we also reserved 337,216 shares in connection with the issuance of our 4.25% convertible senior notes due in June 2028. We have reserved for issuance 1,500,000 shares of our common stock, 143,633 of which remain issuable, under our 401(k) Plan as of December 31, 2024. In addition, we may issue shares of our common stock in connection with acquisitions. Sales or issuances of a substantial number of shares of common stock, or the perception that such transactions could occur, could adversely affect prevailing market prices of our common stock, and any sale or issuance of our common stock will dilute the ownership interests of existing stockholders.
The market price and trading volume of our common stock may be volatile and our stock price could decline.
The trading price of shares of our common stock has from time to time fluctuated widely and, in the future, may be subject to similar fluctuations. The trading price of our common stock may be affected by a number of factors, including our operating results, changes in our earnings estimates, additions or departures of key personnel, our financial condition, legislative and regulatory changes, general conditions in the industries in which we and our brand partners operate, general economic conditions, and general conditions in the securities markets. Other risks described in this Annual Report on Form 10-K could also materially adversely affect our share price.
There is no guarantee that we will pay future dividends or repurchase shares of our common stock at a level anticipated by stockholders, which could reduce returns to our stockholders. Decisions to declare future dividends on or repurchase our common stock will be at the discretion of our Board of Directors based upon a review of relevant considerations.
Since October 2016, our Board of Directors has declared quarterly cash dividend payments on our outstanding common stock. Future declarations of quarterly dividends and the establishment of future record and payment dates are subject to approval by our Board of Directors. The Board’s determination to declare dividends on, or repurchase shares of, our common stock will depend upon our profitability and financial condition, contractual restrictions, restrictions imposed by applicable laws and regulations, including those governing our Banks’ ability to pay dividends and make distributions or other payments to us, and other factors that the Board of Directors deems relevant. For example, beginning with the second quarter of 2020, our Board of Directors reduced our quarterly dividend payment by 67% from $0.63 to $0.21 per quarter. Based on an evaluation of these factors, the Board of Directors may determine in the future not to declare dividends at all, to declare dividends at a reduced amount, not to repurchase shares or to repurchase shares at reduced levels compared to historical levels, any or all of which could reduce returns to our stockholders. Additionally, we may be unable to obtain
regulatory approvals, if required, to repurchase shares.
We are a holding company and depend on payments from our subsidiaries.
Although not a bank holding company as defined under the Bank Holding Company Act, Bread Financial Holdings, Inc. is our parent holding company and, as such, depends on dividends, distributions and other payments from subsidiaries, particularly our Banks, to fund dividend payments, any potential share repurchases, payment obligations, including debt obligations, and to provide funding and capital, as needed, to our other operating subsidiaries. Banking laws and regulations and our banking regulators may limit or prohibit our transfer of funds freely, either to or from our subsidiaries, at any time. These laws, regulations and rules may hinder our ability to access funds that we may need to make payments on our obligations or otherwise achieve strategic objectives. For more information, see “Business — Supervision and Regulation”.
In preparing our financial statements we make certain assumptions, judgments and estimates that affect amounts reported in our audited Consolidated Financial Statements, which, if not accurate, may significantly impact our financial results.
We make assumptions, judgments and estimates in determining the Allowance for credit losses, accruals for employee-related liabilities, accruals for uncertain tax positions, valuation allowances on deferred tax assets and legal contingencies. We also make assumptions, judgments and estimates for items such as the fair value of financial instruments, any
impairment of goodwill, long-lived assets and other prepaid or intangible assets, the fair value of stock awards, as well as the recognition of revenue. These assumptions, judgments and estimates are drawn from historical experience and various other factors that we believe are reasonable under the circumstances as of the date of the audited Consolidated Financial Statements. Actual results could differ materially from our estimates as a result of adverse impacts from various factors, including regulatory or legislative changes, or if future macroeconomic conditions or future operating results differ significantly from our current assumptions, and such differences could significantly impact our financial results.
Legal, Regulatory and Compliance Risks
Our business is subject to extensive and evolving government regulation and supervision, which could materially adversely affect our results of operations and financial condition.
We, primarily through our Banks and certain non-bank subsidiaries, are subject to extensive federal and state regulation, supervision and examination by regulators, including the FDIC, the Delaware Office of the State Bank Commissioner,
the Utah Department of Financial Institutions, and the CFPB. Banking and consumer financial protection laws and regulations are intended to protect consumers, depositors’ funds, the DIF, and the safety and soundness of the banking system as a whole, not stockholders and non-deposit creditors. These laws and regulations affect our lending practices, capital structure, investment practices, dividend policy and growth, among other things. Federal and state legislative bodies and regulatory agencies continually review banking laws, regulations and policies for possible changes. Compliance with laws and regulations can be difficult and costly, and changes to laws and regulations, as well as increased intensity in supervision, often impose additional compliance costs. The scope of the laws and regulations and the intensity of the supervision to which we are subject have increased in recent years, initially in response to the 2008-2010 financial crisis, and more recently in light of other factors such as technological and market changes and the high-profile bank failures in the first half of 2023. We believe that regulatory enforcement and fines have also increased across the banking and financial services sector.
Further, while the new Presidential Administration and the congressional majorities in the U.S. Senate and House of Representatives support reducing the regulatory burden, the scope of legislation, executive action and regulation and the intensity of supervision will likely remain uncertain in the current regulatory and political environments at both the federal and state levels, including with respect to late fees, finance charges, interchange fees, credit card reward programs and other matters. Such changes could subject us to additional costs, limit the types of financial services and products we may offer, and/or limit what we may charge for certain banking services, among other things. For example, in March 2024, the CFPB published a final rule that would significantly reduce the amount of late fees that we are authorized to charge under the CARD Act safe harbor. The CFPB’s late fee rule, which is currently subject to a preliminary injunction, is discussed in more detail in the subsequent risk factor below. Other examples of federal and state legislation we are tracking include legislation intended to place caps on the interest rates that we and other financial institutions are permitted to charge. For example, in 2023, Colorado passed a law (initially effective July 2024) to opt out of the Depository Institutions Deregulation and Monetary Control Act (DIDMCA), a federal law addressing interstate loans by state-chartered banks. Colorado contends that, by opting out of DIDMCA, Colorado would have the ability to impose its interest rate limits (generally capped at 21%) and fee terms (e.g., $15 late fee and 10-day grace period) on any loan made by a state-chartered bank to a resident of Colorado located in Colorado at the time of the loan. This Colorado law is currently subject to a preliminary injunction, but we cannot provide any assurance as to the outcome of this or other similar pending or future legislation in other states, any of which would have an adverse effect on our business and results of operations. President Trump and various federal legislators have also recently made public statements regarding potential efforts to place caps on credit card interest rates, and a bill was introduced in the U.S. Senate in February 2025 proposing to cap credit card interest rates at 10% for a period of five years.
In connection with their continuous supervision and examinations of us, the FDIC, CFPB and/or other regulatory agencies may require changes in our business or operations. Any such changes may be judicially enforceable and in some cases, regardless of fault, it may be less time-consuming or costly to settle these matters, which may require us to implement certain changes to our business practices, provide remediation to certain individuals or make a settlement payment to a given party or regulatory body. We may also become subject to formal or informal enforcement and other supervisory actions, including memoranda of understanding, written agreements, cease-and-desist orders, and prompt-corrective-action or safety-and-soundness directives. For example, in late November 2023, the FDIC issued a consent order to one of our subsidiaries, arising out of the June 2022 transition of our credit card processing services to strategic outsourcing partners, and in August 2024 each of our Banks entered into an agreement with the FDIC to pay civil money penalties (CMPs) of $1 million per Bank, also related to the June 2022 transition. For additional information regarding these matters, see “Management’s Discussion and Analysis of Financial Condition and Results of Operations (MD&A) — Legislative and
Regulatory Matters” below. Regulatory authorities have extensive discretion in their supervisory and enforcement actions. Supervisory actions could entail significant restrictions on our existing business, our ability to develop new business, our flexibility in conducting operations, and our ability to pay dividends or utilize capital. Enforcement and other supervisory actions also can result in the imposition of civil monetary penalties or injunctions, related litigation by private plaintiffs, damage to our reputation, and a loss of customer or investor confidence. We could be required, as well, to dispose of specified assets and liabilities within a prescribed time-frame. As a result, any enforcement or other supervisory action could have an adverse effect on our business, results of operations, financial condition and prospects.
In addition, changes in the regulatory and supervisory environments could adversely affect us in substantial and unpredictable ways, including by limiting the types of financial services and products we may offer, enhancing the ability of others to offer more competitive financial services and products, restricting our ability to make acquisitions or pursue other profitable opportunities, and negatively impacting our results of operations and financial condition. Changes in the prevailing interpretations of federal or state laws and related regulations could also invalidate or call into question the legality of certain of our services and business practices.
Our failure to comply with the laws, executive actions, regulations, and supervisory actions to which we are subject, even if the failure is inadvertent or reflects a difference in interpretation, could subject us to fines, other penalties, and restrictions on our business activities, any of which could adversely affect our business, results of operations, financial condition, cash flows, capital base, and the price of our securities.
See “Item 1. Business — Supervision and Regulation” for more information about certain laws and regulations to which we are subject and their impacts on us.
The CFPB has issued a final rule regarding credit card late fees, which represents a significant departure from the rules that are currently in effect. Absent a successful legal challenge or other invalidation of the rule, we expect the rule will have a significant adverse impact on our business, results of operations and financial condition for at least the short term and, depending on the effectiveness of our actions taken in response to the rule, potentially over the long term.
In March 2024 the CFPB published a final rule that would significantly reduce the safe harbor amount for late fees that credit card issuers are authorized to charge. Absent a successful legal challenge or other invalidation of the rule, the rule will: (i) decrease the safe harbor amount for credit card late fees to $8 and eliminate a higher safe harbor dollar amount for subsequent late payments; and (ii) eliminate the annual inflation adjustments that currently exist for the late fee safe harbor dollar amounts. The “safe harbor” dollar amounts referenced in the CFPB’s rulemaking refer to the amounts that credit card issuers may charge as late fees under the Credit Card Accountability Responsibility and Disclosure Act of 2009 (CARD Act) without reference to the issuer’s cost to collect. Under the CARD Act, these safe harbor amounts, since their initial implementation, have been subject to annual adjustment based on changes in the Consumer Price Index, and the safe harbor amounts are currently set at $30 for an initial late fee and $41 for subsequent late fees incurred in one of the next six billing cycles. Accordingly, the $8 safe harbor amount on late fees (and the elimination of the annual inflation-based adjustment thereto) would represent a significant decrease from the current safe harbor amounts.
Shortly after the final rule was published, a lawsuit was filed in U.S. District Court for the Northern District of Texas (Ft. Worth Division) by the U.S. Chamber of Commerce, the American Bankers Association and various other parties, challenging the rule and seeking a preliminary injunction enjoining the rule from becoming effective during the pendency of the litigation. The lawsuit asserts that the rule would ultimately harm those consumers the CFPB is charged with protecting and seeks to have the rule vacated on various grounds, including that the CFPB (i) violated the CARD Act by preventing issuers from collecting reasonable and proportional late fees when cardholders do not pay their bills on time, (ii) violated the Administrative Procedure Act by promulgating a final rule that is arbitrary and capricious, relying on inappropriate, incomplete and non-public data; and (iii) issued the rulemaking with funds drawn in violation of the U.S. Constitution’s Appropriations Clause. While we are not a plaintiff in these actions, the presidents of our two subsidiary banks did each submit a declaration in connection with the plaintiffs’ motion for a preliminary injunction, and we support the positions taken by the plaintiffs in these matters. The final rule had an original effective date of May 14, 2024; however, on May 10, 2024, the United States District Court for the Northern District of Texas granted an injunction and stay of the final rule, and the injunction granted remains in effect as of the date of this report. The outcome of this legal challenge, including the impact on the final rule, remains uncertain.
Assuming these legal challenges are not successful and the CFPB’s final rule becomes effective, this rule will represent an approximately 75% reduction in the amount of late fees that may be charged under the CARD Act safe harbor, which we
expect will have a significant adverse impact on our revenue, results of operations and other financial metrics for at least the short term and, depending on the effectiveness of the mitigating actions that we take in response to the rule, potentially over the long term. We have already executed on a number of strategies designed to limit the impact of the final rule on us and we continue to evaluate various other mitigating strategies, but it may not be feasible for us to fully implement these strategies in the short term, and we cannot guarantee that these efforts will ultimately be successful even if and when fully implemented. Moreover, the final rule (and certain of our mitigating strategies) may present other risks and adverse impacts to our business, results of operations and financial condition, which could include, without limitation, the loss of customers due to tightened underwriting standards or negative customer response to higher rates and fees, impacts to customer payment behavior due to decreased incentives to pay, further regulatory action in response to mitigating strategies that may be employed by us or other credit card issuers, adverse impacts to or disputes with our brand partners, strategic non-renewals of certain brand partner relationships that cease to be profitable, and balance sheet impairments, including of goodwill, long-lived assets and other prepaid or intangible assets.
Additional discussion regarding the CFPB’s final rule can be found in “Management’s Discussion & Analysis – Business Environment” below. See also “Business — Supervision and Regulation — Consumer Protection Regulation and Supervision” above for additional discussion regarding recent developments at the CFPB. The extent to which these recent or other future developments will ultimately impact the CFPB’s regulation of our business, including the CFPB’s credit card late fee rule and the associated litigation, remains uncertain.
Litigation and other actions and disputes could subject us to significant fines, penalties, judgments and/or requirements resulting in significantly increased expenses, damage to our reputation and/or a material adverse effect on our business.
Businesses in the financial services and payments industry have historically been, and continue to be, subject to significant legal actions, including class action lawsuits. Many of these actions have included claims for substantial compensatory or punitive damages. While we have historically relied on our arbitration clause (which includes a class action waiver) in agreements with customers to limit our exposure to class action litigation, there can be no assurance that we will always be successful in enforcing our arbitration clause in the future. There may also be legislative, regulatory or other efforts to limit or eliminate the use of arbitration clauses or class action waivers, and if our arbitration provisions are found to be unenforceable or are otherwise limited or eliminated, our exposure to class action litigation could increase significantly. Further, even if our arbitration clause remains enforceable, we may be subject to mass arbitrations in which large groups of consumers bring arbitrations against us simultaneously. The continued focus of merchants on issues relating to the acceptance of various forms of payment may lead to additional litigation and other legal actions. Given the inherent uncertainties involved in litigation, and the very large or indeterminate damages sought in some matters asserted against us, there is significant uncertainty as to the ultimate liability we may incur from litigation. Claims and legal actions could involve significant defense costs and reputational damage, and the time-consuming nature of legal proceedings can divert senior management attention from the business.
In addition to litigation and regulatory matters, from time to time, through our operational and compliance controls, we identify compliance issues that require us to make operational changes and, depending on the nature of the issue, result in financial remediation to impacted cardholders. These self-identified issues and voluntary remediation payments could be significant depending on the issue and the number of cardholders impacted. They also could generate litigation or regulatory investigations that subject us to additional adverse effects on our business, results of operations and financial condition.
Our Banks are subject to extensive federal and state regulation that may restrict their ability to make cash available to us and may require us to make capital contributions to them.
Federal and state laws and regulations extensively regulate the operations of our Banks, including to limit the ability of the Banks to pay dividends or make other distributions to us. Many of these laws and regulations are intended to maintain the safety and soundness of our Banks, and they impose significant restraints on them to which other non-regulated entities are not subject.
Our Banks must maintain minimum amounts of regulatory capital. If the Banks do not meet these capital requirements, their respective regulators have broad discretion to institute a number of corrective actions that could have a direct material effect on our liquidity, ability to grow our business and financial condition. To pay any dividend, the Banks must each maintain adequate capital above regulatory guidelines. Accordingly, neither CB nor CCB may be able to make any of their cash or other assets available to us, including to service our indebtedness. If either of our Banks were to fail to meet any of
the capital requirements to which it is subject, we may be required to provide them with additional capital, which could also impair our ability to service our indebtedness.
In addition, under the “Source of Strength” doctrine, we are required to serve as a source of financial strength to our Banks and may not conduct our operations in an unsafe or unsound manner. Under these requirements, in the future, we could be required to provide financial assistance to our Banks if the Banks experience financial distress. This support may be required at times when we might otherwise have determined not to provide it or when doing so is not otherwise in our interests or the interests of our stockholders or creditors.
If legislative attempts to amend the BHC Act to eliminate the exclusion of credit card banks or industrial loan companies from the definition of “bank” are successful, or if we voluntarily take such action that results in the Parent Company becoming a federally-regulated BHC, we would become subject to additional regulation applicable to BHCs, which could increase our compliance and regulatory costs and have other effects that could be materially adverse to our business.
The Dodd-Frank Act mandates multiple studies, which could result in future legislative or regulatory action. In particular, the Government Accountability Office issued its study on whether it is necessary, in order to strengthen the safety and soundness of institutions or the stability of the financial system of the United States, to eliminate the exemptions to the definition of “bank” under the BHC Act for certain institutions including limited purpose credit card banks and industrial loan companies. The study did not recommend the elimination of these exemptions. However, legislation is periodically introduced that would eliminate this exception for industrial loan companies and other “non-bank banks”. If such legislation were enacted without any grandfathering of or accommodations for existing institutions, we could be required to become a BHC.
If we were required to become a BHC, or if we voluntarily take such action that results in the Parent Company becoming a federally-regulated BHC, we and our non-bank subsidiaries would be subject to supervision, regulation and examination by the Federal Reserve Board. We would be required to provide annual reports and such additional information as the Federal Reserve Board may require pursuant to the BHC Act, and applicable regulations. In addition, we would be subject to consolidated regulatory capital requirements.
Pursuant to provisions of the BHC Act and regulations promulgated by the Federal Reserve Board thereunder, a BHC may only engage in, or own companies that engage in, activities deemed by the Federal Reserve Board to be permissible for BHCs. Activities permissible for BHCs are those that are so closely related to the business of banking or managing or controlling banks as to be a proper incident thereto. If a BHC and its subsidiary insured depository institutions are well capitalized, well managed, and have satisfactory CRA ratings, it may submit an election to the Federal Reserve Board to become an FHC. Permissible activities for FHCs include those “so closely related to banking as to be a proper incident thereto” as well as certain additional activities deemed “financial in nature or incidental to such financial activity” or complementary to a financial activity and that do not pose a substantial risk to the safety and soundness of the depository institution or the financial system. If we were required to become a BHC, we may be required to modify or discontinue certain of our business activities, which may materially adversely affect our results of operations and financial condition.
Increases in FDIC insurance premiums may have a material adverse effect on our results of operations.
We are generally unable to control the amount of premiums that are required to be paid for FDIC insurance. If there are bank or financial institution failures, or changes in the method for calculating premiums, we may be required to pay significantly higher premiums than the levels currently imposed or additional special assessments or taxes that could adversely affect our earnings. Any future increases or required prepayments in FDIC insurance premiums may materially adversely affect our results of operations.
Noncompliance with the Bank Secrecy Act and other anti-money laundering statutes and regulations could cause us material financial loss.
The Bank Secrecy Act and the PATRIOT Act contain anti-money laundering and financial transparency provisions intended to detect and prevent the use of the U.S. financial system for money laundering and terrorist financing activities. The Bank Secrecy Act, as amended by the PATRIOT Act, requires depository institutions and their holding companies to undertake activities including maintaining an anti-money laundering program, verifying the identity of partners and customers, monitoring for and reporting suspicious transactions, reporting on cash transactions exceeding specified thresholds, and responding to requests for information by regulatory authorities and law enforcement agencies. The
Financial Crimes Enforcement Network (FinCEN), a unit of the Treasury Department that administers the Bank Secrecy Act, is authorized to impose significant civil money penalties for violations of those requirements and has recently engaged in coordinated enforcement efforts with the Federal Banking Agencies, as well as the U.S. Department of Justice, Drug Enforcement Administration, and Internal Revenue Service (IRS). We are also subject to scrutiny of compliance with the
rules enforced by the OFAC, which may require sanctions for dealing with certain persons or countries. We cannot provide assurance that our programs and controls will be effective to ensure our compliance with all applicable anti-money laundering and anti-terrorism financing laws and regulations, and our failure to comply could subject us to significant sanctions, fines, penalties and reputational harm, all of which could have a material adverse effect on our business, results of operations and financial condition.
Regulation in the areas of privacy, data protection, data governance, account access and information and cyber security could increase our costs and affect or limit our business opportunities and how we collect and/or use Personal Information, and any actual or perceived failure to comply with any of these new or existing laws could adversely affect our business, results of operations, or financial condition.
In connection with running our business, we receive, store, use and otherwise process information that relates to individuals and/or constitutes “personal data,” “personal information,” “personally identifiable information,” “nonpublic personal information” or similar terms under applicable data privacy laws (collectively, Personal Information), including from and about actual and prospective customers, as well as our employees and business contacts. We are therefore subject to a variety of federal and state laws, regulations and other requirements relating to the privacy, security and handling of Personal Information. For example, the CCPA and related laws in other jurisdictions require us to adhere to certain disclosure restrictions and deletion obligations with respect to the Personal Information of their residents, and allow for penalties for violations and, in some cases, a private right of action. The GLBA includes both a “Privacy Rule,” which imposes obligations on financial institutions relating to the use or disclosure of nonpublic personal information, and a “Safeguards Rule,” which imposes obligations on financial institutions to implement and maintain physical, administrative and technological measures to protect the security of non-public personal financial information. Failure to comply with the GLBA could result in substantial financial penalties. These laws also impose transparency and other obligations with respect to Personal Information and provide individuals with rights with respect to their Personal Information.
Legislators and regulators in the United States are increasingly adopting or revising privacy, data protection, data governance, account access, and information and cyber security laws, including data localization, authentication and notification laws. As such laws are interpreted and applied (in some cases, with significant differences or conflicting requirements across jurisdictions), compliance and technology costs will continue to increase, particularly in the context of ensuring that adequate data governance, data protection, data transfer and account access mechanisms are in place.
Compliance with current or future privacy, data protection, data governance, account access, and information and cyber security laws could significantly impact our collection, use, sharing, retention and safeguarding of Personal Information and could restrict our ability to provide certain products and services, which could materially and adversely affect our profitability. In addition, any failure or perceived failure to comply with such laws, regulations and other requirements relating to the privacy, security and handling of information could result in potentially significant regulatory and/or governmental investigations and/or claims, actions or litigation (including class actions). We could incur significant costs in investigating and defending such claims and, if found liable, pay significant damages or fines, be required to change our business, or face sanctions or ongoing regulatory monitoring. These proceedings and any subsequent adverse outcomes could subject us to significant customer attrition, decreases in the use or acceptance of our cards and damage to our reputation and our brand. If any of these events were to occur, our business, results of operations, and financial condition could be materially adversely affected.
For more information on regulatory and legislative activity in this area, see “Privacy, Information Security and Data Protection” above.
Our failure to protect our intellectual property rights and use of open source software may harm our competitive position, and litigation to protect our intellectual property rights or defend against third-party allegations of infringement may be costly, any of which could negatively impact our business, results of operations and profitability.
Third parties may infringe or misappropriate our trademarks or other intellectual property rights, which could adversely impact our business, operating results or financial condition. The actions we take to protect our patents, copyrights, trademarks and other proprietary rights may not be adequate. Litigation may be necessary to enforce our intellectual property rights, protect our patents, copyrights, trademarks or trade secrets or determine the validity and scope of the
proprietary rights of others. Any infringement or misappropriation could harm any competitive advantage we currently derive or may derive from our intellectual property or other proprietary rights. Third parties may also assert infringement claims against us. Any claims and an adverse determination in any resulting litigation could subject us to significant liability for damages and require us to either design around a third-party’s intellectual property or license alternative technology from another party. Moreover, it has become common in recent years for individuals and groups to purchase intellectual property assets for the sole purpose of making claims of infringement and attempting to extract settlements from companies like ours. Even in instances where we believe that claims and allegations of intellectual property infringement against us are without merit, litigation is time consuming and expensive to defend and could result in the diversion of our time and resources. Further, our competitors or other third parties may independently design around or develop similar technology, or otherwise duplicate our services or products in a way that would preclude us from asserting our intellectual property rights against them. In addition, our contractual arrangements may not effectively prevent disclosure of our intellectual property or confidential and proprietary information or provide an adequate remedy in the event of an unauthorized disclosure.
Our platform utilizes software covered by open source licenses. The use of open source software involves a number of risks, many of which cannot be eliminated and could negatively affect our business. For example, United States courts have not interpreted the terms of various open source licenses and there is a risk that some open source licenses to which we are subject could be interpreted in a manner that could impose unanticipated conditions or restrictions on our ability to use or to commercialize our platform. By the terms of certain open source licenses, if we combine our proprietary software with open source software in a certain manner, we could be required to, under certain circumstances, release the source code of our proprietary software and to make our proprietary software available under open source licenses.
We may face claims alleging noncompliance with open source licenses or misappropriation, infringement, or other violation of third-party rights resulting from our use of open source software. These claims could result in litigation, damage our reputation in the open-source community, or require us to purchase costly software licenses, devote additional research or development resources to reengineer our platform, discontinue use of our platform if reengineering could not be accomplished on a timely or cost-effective basis, and/or make the source code of our proprietary software generally available, any of which could result in liability to us and negatively impact our business, results of operations, profitability and financial condition. In addition to risks related to license requirements, usage of open source software can lead to greater risks than use of third-party commercial software because open source software licensors generally do not provide
any warranties or other contractual protections for the open source software, including contractual protections regarding infringement, misappropriation, security vulnerabilities, or defects or errors in the code, any of which could result in liability to us and negatively impact our business, results of operations, profitability and financial condition.
We have international operations that subject us to various international risks as well as increased compliance and regulatory risks and costs.
We have international operations, primarily in India, and some of our third-party service providers provide services to us from other countries, all of which subject us to a number of international risks, including, among other things, sovereign volatility and sociopolitical instability. In recent years, we have taken initiatives to move a greater percentage of our call center and servicing personnel offshore, which may increase our reliance on these international operations and the risk associated therewith. Any future social or political instability in the countries in which we operate could have a material adverse effect on our business. U.S. regulations also govern various aspects of the international activities of domestic corporations and increase our compliance and regulatory risks and costs. Any failure on our part or the part of our service providers to comply with applicable U.S. regulations, as well as the regulations in the countries and markets in which we or they operate, could result in fines, penalties, injunctions or other similar restrictions, any of which could have a material adverse effect on our business, results of operations and financial condition.
Tax legislation initiatives or challenges to our tax positions could adversely affect our results of operations and financial condition.
We are subject to tax laws and regulations in U.S. federal, state, local and foreign jurisdictions. From time to time legislative initiatives may be proposed, which, if enacted, may impact our effective tax rate and could adversely affect our deferred tax assets, tax positions and/or our tax liabilities. In addition, U.S. federal, state, local, and foreign tax laws and regulations are extremely complex and subject to varying interpretations. There can be no assurance that our historical tax positions will not be challenged by the relevant taxing authorities, or that we would be successful in defending our positions in connection with any such challenge.
Anti-takeover provisions in our organizational documents and Delaware law may discourage or prevent a change of control, even if an acquisition would be beneficial to our stockholders, which could affect our stock price adversely and prevent or delay change of control transactions or attempts by our stockholders to replace or remove our current management.
Delaware law, as well as provisions of our certificate of incorporation, including those relating to our Board’s authority to issue series of preferred stock without further stockholder approval, our bylaws and our existing and future debt instruments, could discourage unsolicited proposals to acquire us, even though such proposals may be beneficial to our stockholders.
In addition, we are subject to the provisions of Section 203 of the Delaware General Corporation Law, which may prohibit certain business combinations with stockholders owning 15% or more of our outstanding voting stock. These and other provisions in our certificate of incorporation, bylaws and Delaware law could make it more difficult for stockholders or potential acquirers to obtain control of our Board of Directors or initiate actions that are opposed by our then-current Board of Directors, including a merger, tender offer or proxy contest involving us. Any delay or prevention of a change of control transaction or changes in our Board of Directors could cause the market price of our common stock to decline or delay or prevent our stockholders from receiving a premium over the market price of our common stock that they might otherwise receive.
Cybersecurity, Technology and Vendor Risks
We rely on third-party vendors to provide various products and services that are important to our operations, and our business could be adversely impacted if our vendors fail to fulfill their obligations.
Some services important to our business are outsourced to third-party vendors, and we contract with numerous other third-party vendors for a range of products and services. The inability or failure of these vendors to deliver products and services at contracted service levels or standards and in a timely manner could adversely affect our business. In addition, if a third-party vendor fails to meet other contractual requirements, such as compliance with applicable laws and regulations, or suffers a cyberattack or other security breach, our business operations could suffer economic or reputational harm that could have a material adverse impact on our business and results of operations. Further, if our significant vendors are unable or unwilling to fulfill or renew our existing contracts on current terms, we might not be able to replace the related product or service at the same cost, in a timely fashion, or at all, any of which could negatively impact our profitability, business and operations, in some cases materially.
Our 2022 transition of our credit card processing services to strategic outsourcing partners was a significant and complex undertaking, which resulted in unanticipated platform stability issues and related impacts that have adversely impacted, and may continue to adversely impact, our business, results of operations, reputation and brand.
In late June 2022, we completed the transition of our credit card processing services to strategic outsourcing partners, including Fiserv for our core processing services and Microsoft for related cloud infrastructure services. As we described previously, transitioning these services from our legacy platforms to strategic partners with established systems and functionality presented significant risks, including, but not limited to, potential losses or corruption of data, changes in security processes, implementation delays and cost overruns, resistance from current partners and account holders, disruption to operations, loss of customization or functionality, reliability issues with legacy systems prior to cutover and incurrence of outsized consulting costs to complete the transition. In addition, as previously disclosed, the pursuit of multiple new product integrations and outsourcing transitions simultaneously increased the complexity and risk, as well as magnified the potential for the unintended consequences, including an inability to retain or replace key personnel during the transition as well as the incurrence of unexpected expenses as we adopted new processes for managing these service providers and established controls and procedures to ensure regulatory compliance. In connection with the transition, we experienced unanticipated issues with platform stability, which resulted in outages and interruptions in our call center operations and online customer service platforms. These outages and interruptions resulted in a number of adverse impacts, including customer complaints, negative social media postings, reputational damage, regulatory scrutiny, lost potential revenue, remediation costs, timing-related impacts to our Delinquency rate and Net loss rate data, and increased consulting and professional fees. Furthermore, in late November 2023, the FDIC issued a consent order to one of our subsidiaries arising out of the transition, and in August 2024 each of our Banks entered into an agreement with the FDIC to pay CMPs of $1 million per Bank, also related to the transition. For additional information regarding the consent order and the CMPs, see “Item 1. Business – Supervision and Regulation” above. These challenges associated with the transition have adversely impacted, and may continue to adversely impact, our business, results of operations, financial condition, and result in
damage to our reputation and our brand. Moreover, now that we have completed this transition, it would be difficult and disruptive for us to replace certain of these third-party vendors, particularly Fiserv, in a timely or seamless manner if they were unwilling or unable to continue to provide us with these services in the future (as a result of their financial or business conditions or otherwise), which could materially impact our business and operations.
If we, our third-party providers, or brand partners fail to safeguard our confidential information and/or experience a data security incident, there may be damage to our brand and reputation, material financial penalties and legal claims, which could materially adversely affect our business, results of operations, and financial condition.
We rely on computer systems, hardware, software, technology infrastructure and online sites and networks for both internal and external operations that are critical to our business (collectively, IT Systems). We own and manage some of these IT Systems but also rely on third parties for a range of IT Systems and related products and services, including but not limited to cloud computing services. We and certain of our third-party providers collect, maintain and process data about customers, employees, business partners, brand partners, and others, including Personal Information, as well as proprietary information belonging to our business such as trade secrets (collectively, Confidential Information).
Information security risks for large financial institutions have increased with the adoption of new technologies, including those used on mobile devices, to conduct financial and other business transactions, and the increased sophistication and activity level of threat actors. These threat actors employ advanced techniques and tools, including AI, to circumvent security controls, evade detection and remove forensic evidence. Consequently, we may face challenges in detecting, investigating, remediating or recovering from future attacks or incidents, which could lead to a material adverse impact on our IT Systems, Confidential Information or business. There can also be no assurance that our cybersecurity risk management program and processes, including our policies, controls or procedures, will be fully implemented, complied with or effective in protecting our IT Systems and Confidential Information. Furthermore, given the nature of complex systems, software and services like ours, and the scanning tools that we deploy across our networks and products, we regularly identify and track security vulnerabilities. We are unable to comprehensively apply patches or confirm that measures are in place to mitigate all such vulnerabilities, or that patches will be applied before vulnerabilities are exploited by a threat actor.
We and certain of our third-party providers have in the past been, and in the future may be, subject to cyberattacks and we expect such attacks and incidents to continue in varying degrees. For example, we have suffered cyberattacks relating to unauthorized access to customer accounts, and in such instances, we have notified impacted customers and regulators as required by law. While to date no incidents have had a material impact on our operations or financial results, we cannot guarantee that material incidents will not occur in the future.
In such instances of an adverse impact on our IT Systems or Confidential Information, we may have data loss that could harm our customers and brand partners. This in turn could lead to reputational risk as concerns with security and privacy of data may result in consumers and future and existing brand partners not wanting to use our product offerings. We also have arrangements in place with our partners and other third parties through which we share and receive Confidential Information about their customers who are or may become our customers, which magnifies certain information security issues. The use of our products and services could decline if any compromise of physical or cyber security occurred. In addition, any unauthorized release of Confidential Information or any public perception that we released Confidential Information without authorization, could subject us to legal claims (including class actions) from our partners or their customers, consumers or regulatory enforcement actions (including fines and penalties), which may adversely affect our partner relationships and result in damage to our reputation and our brand, and/or cause us to incur significant incident response, system restoration or remediation and future compliance costs. Any or all of the foregoing could materially adversely affect our business, results of operations, and financial condition. We cannot be certain that our cybersecurity insurance coverage will be adequate for cybersecurity liabilities actually incurred, that insurance will continue to be available to us on economically reasonable terms, or at all, or that our insurer will not deny coverage as to any future claim.
Business interruptions, including loss of data center capacity, interruption due to cyber-attacks, loss of network connectivity or inability to utilize proprietary software of third-party vendors, could affect our ability to timely meet the needs of our partners and customers and harm our business.
We face numerous and evolving cybersecurity risks that threaten the confidentiality, integrity and availability of our IT Systems and Confidential Information. Our ability, and that of our third-party service providers and brand partners, to protect our IT Systems and Confidential Information against damage, loss or performance degradation from power loss,
network failure, cyber-attacks, including ransomware or denial of service attacks, insider threats, state-sponsored threats, hardware and software defects or malfunctions, human error, computer viruses or other malware, public health crises, disruptions in telecommunications services, fraud, fires and other disasters and other events is critical.
To provide many of our services, we must be able to store, retrieve, process and manage large amounts of data, as well as periodically expand and upgrade our IT Systems. Any damage to our IT Systems, including those of our third-party service providers or brand partners, any failure of our network links that interrupts our operations or any impairment of our ability to use our software or the proprietary software of third-party vendors, including impairments due to cyber-attacks, could adversely affect our ability to meet our partners’ and customers’ needs and their confidence in utilizing us for future services. In addition, any failure to successfully implement new IT Systems, or improvements or upgrades to existing IT Systems in a timely manner could have an adverse impact on our business if we are not able to be competitive with other financial services companies and could also adversely impact our internal controls (including internal controls over financial reporting), results of operations, and financial condition.
If we are not able to invest successfully in, and compete at the leading edge of, technological developments in our industry, our revenue and profitability could be materially adversely affected.
Our industry is subject to rapid and significant technological changes. In order to compete in our industry, we need to continue to invest in advanced digital and other technology across all areas of our business, including in access management, vulnerability management, transaction processing, data management and analytics, AI technology, customer interactions and communications, alternative payment and financing mechanisms, authentication technologies and digital identification, tokenization, real-time settlement, and risk management and compliance systems. Incorporating new technologies into our products and services, including developing the appropriate governance and controls consistent with statutory and regulatory expectations, requires substantial expenditures and takes considerable time, and ultimately may not be successful. We expect that new technologies in the payments industry will continue to emerge, and these new technologies may be superior to, or render obsolete, our existing technology.
The process of developing new products and services, enhancing existing products and services and adapting to technological changes and evolving industry standards is complex, costly and uncertain, and any failure by us to anticipate partners’ and customers’ changing needs and emerging technological trends accurately could significantly impede our ability to compete effectively. Partner and customer adoption is a key competitive factor, and our competitors may develop products, platforms or technologies that become more widely adopted than ours. In addition, we may underestimate the time and expense we must invest in new products and services before they generate significant revenues, if at all.
Our ability to develop, acquire or access competitive technologies or business processes on acceptable terms may also be limited by intellectual property rights that third parties, including those that current and potential competitors, may assert. In addition, our ability to adopt new technologies may be inhibited by the emergence of industry-wide standards, a changing legislative and regulatory environment, an inability to develop appropriate governance and controls, a lack of internal product and engineering expertise, resistance to change from partners or consumers, lack of appropriate change management processes or the complexity of our systems.
The development and use of AI present risks and challenges that may adversely impact our business or customers.
We or our third-party vendors, clients or counterparties have developed or incorporated, or may in the future develop or incorporate, AI technology in certain business processes, services or products. The development and use of AI presents a number of risks and challenges to our business. The legal and regulatory environment relating to AI is uncertain and rapidly evolving, both in the United States and internationally, and includes regulatory schemes targeted specifically at AI as well as provisions in intellectual property, privacy, consumer protection, employment and other laws applicable to the use of AI. These evolving laws and regulations could require changes in our implementation of AI technology and increase our compliance costs and the risk of non-compliance. AI models, particularly generative AI models, may produce output or take action that is incorrect, that result in the release of private, confidential or proprietary information, that reflect biases included in the data on which they are trained, infringe on the intellectual property rights of others or that is otherwise harmful. In addition, certain uses of AI technology may be subject to regulation, such as requirements to explain how the AI model works and why it generates a particular output, eliminate biases built into the AI model, reduce erroneous outputs, and comply with regulations requiring watermarking AI-generated content and disclosures when consumers are interacting with AI or when decisions are made by AI, as well as requiring documentation or explanation of the basis on which decisions are made. These additional requirements may impose increased costs on our technology and compliance functions, which could have an adverse effect on our results of operations and financial condition.
Further, we may rely on AI models developed by third parties, and would be dependent in part on the manner in which those third parties develop, train and deploy their models, including risks arising from the inclusion of any unauthorized material in the training data for their models, the effectiveness of the steps these third parties have taken to limit the risks associated with the output of their models and other matters over which we may have limited visibility. Any of these risks could expose us to liability or adverse legal or regulatory consequences and harm our reputation and the public perception of our business or the effectiveness of our security measures.
We are also exposed to risks arising from the use of AI technology by bad actors to commit fraud and misappropriate funds and to facilitate cyberattacks (including sophisticated social engineering attacks and AI-powered hacking). Malicious actors could use AI to create deepfakes of our leadership or other personnel, contributing to loss of customer trust and significant reputational damage in addition to financial harm.
Risks Related to the LoyaltyOne Spinoff
The LoyaltyOne spinoff could result in substantial tax liability to us and our stockholders, and more generally, we may be adversely affected by LVI’s ongoing bankruptcy proceedings or pending or future litigation or other disputes involving or relating to LVI.
In November 2021, we completed the spinoff of our former LoyaltyOne segment, consisting of the Canadian AIR MILES® Reward Program and the Netherlands-based BrandLoyalty businesses, into an independent, publicly traded company, LVI. As part of the spinoff, we retained 19% of the outstanding shares of common stock of LVI.
We received a private letter ruling, or PLR, from the IRS and an opinion from our tax advisor to the effect that the spinoff of our former LoyaltyOne segment qualified as tax-free for U.S. federal income tax purposes for us and our stockholders (except for cash received in lieu of fractional shares). However, if the factual assumptions or representations made by us in connection with the delivery of the PLR and opinion are inaccurate or incomplete in any material respect, including those relating to the past and future conduct of our business, we may not be able to rely on the PLR or opinion. Furthermore, the PLR does not address all the issues that are relevant to determining whether the spinoff qualified for tax-free treatment, and the opinion from our tax advisor is not binding on the IRS or the courts. If, notwithstanding receipt of the PLR and the opinion from our tax advisor, the spinoff transaction and certain related transactions are determined to be taxable, we would be subject to a substantial tax liability. In addition, if the spinoff transaction is taxable, each holder of our common stock who received shares of LVI in connection with the spinoff would generally be treated as receiving a taxable distribution of property in an amount equal to the fair market value of the shares received.
Even if the spinoff otherwise qualifies as a tax-free transaction, the distribution would be taxable to us (but not to our stockholders) in certain circumstances if post-spinoff significant acquisitions of our stock or the stock of LVI are deemed to be part of a plan or series of related transactions that included the spinoff. In this event, the resulting tax liability could be substantial, and could discourage, delay or prevent a change of control of us. In connection with the spinoff, we entered into a tax matters agreement with LVI, pursuant to which LVI agreed to not enter into any transaction that could cause any portion of the spinoff to be taxable to us without our consent and to indemnify us for any tax liability resulting from any such transaction. On March 1, 2023, LVI announced that it had entered into an agreement to sell its BrandLoyalty business. At LVI’s request to accommodate the sale, we agreed to not take action under the tax matters agreement to attempt to prevent the BrandLoyalty sale and, upon the closing, agreed to certain mutual releases with the buyer in the sale. Subsequently, on March 10, 2023, LVI and certain of its subsidiaries filed voluntary petitions for relief under Chapter 11 of the United States Bankruptcy Code and in Canada under the Companies’ Creditors Arrangement Act (Canada) (collectively, the LVI Bankruptcy Proceedings). In the Canadian proceedings, LVI conducted an auction process and subsequently sold its AIR MILES business to Bank of Montreal in June 2023. While we believe these transactions should not affect the qualification of the spinoff as a tax-free transaction, it is possible the IRS could disagree and successfully assert that the spinoff should be taxable to us and our stockholders that received LVI shares in the spinoff. In addition, it is possible the IRS could view this disposition as inconsistent with the PLR and, as a result, the IRS could take the position that we cannot rely on the PLR.
Furthermore, though we believe that our process and decision-making with respect to the spinoff transaction were entirely appropriate, we and certain members of our Board of Directors and executive management team have been named as defendants in various litigation matters relating to the spinoff. LoyaltyOne, Co. (the LVI subsidiary that operated its Canadian AIR MILES business) filed suit against us and our general counsel in the Ontario Superior Court of Justice in Canada in October 2023. The lawsuit asserts that our general counsel, in his capacity as a pre-spinoff director of LoyaltyOne, Co., breached various fiduciary duties owed to LoyaltyOne, Co. in connection with the LVI spinoff and
certain other transactions, and that Bread Financial assisted in and benefited from those breaches. The lawsuit seeks damages in the amount of $775 million. Pursuant to LVI’s Chapter 11 Plan, LVI and a liquidating trustee also established a liquidating trust to pursue claims, including against individuals and entities in respect of the spinoff transaction, and in February 2024 that liquidating trustee commenced certain actions against us. Specifically: (i) in LVI’s U.S. Chapter 11 case in the Bankruptcy Court for the Southern District of Texas, the liquidating trustee filed an adversary proceeding against us and our general counsel alleging actual and constructive fraudulent transfers, among other claims, in connection with the spinoff; and (ii) in Delaware Chancery Court, the liquidating trustee filed an action against us, each of the members of our Board of Directors at the time of the spinoff, and certain members of our executive management team alleging breaches of fiduciary duties (and aiding and abetting breaches of fiduciary duties) in connection with the spinoff. Among other things, in each of these actions the liquidating trustee seeks damages in the amount of approximately $750 million plus interest, fees and expenses. LoyaltyOne, Co. is also contesting our entitlement to certain potential tax refunds under the tax matters agreement, and we may also become involved in other disputes with respect to the spinoff agreements with LVI or incur other liabilities or obligations under contractual arrangements with LVI. Finally, a putative federal securities class action complaint was filed in April 2023 against us and current and former members of our management team concerning disclosures made about LVI’s business. For additional detail regarding these pending litigation matters, see Note 16 “Commitments and Contingencies” to our audited Consolidated Financial Statements. While we believe that each of these suits and any other claims in connection with the spinoff are without merit and we will defend ourselves vigorously, litigation is complex and the outcomes are inherently uncertain. Any litigation or dispute arising out of or relating to the spinoff could distract management, result in significant legal and other costs, and otherwise adversely impact our financial position, results of operations and financial condition.
RISK MANAGEMENT
Our Enterprise Risk Management (ERM) program is designed to ensure that all significant risks are identified, measured, monitored and addressed. Our ERM program reflects our risk appetite, governance, culture and reporting. We manage enterprise risk using our Board-approved Enterprise Risk Management Framework, which includes Board-level oversight, risk management committees, and a dedicated risk management team led by our Chief Risk Officer (CRO). Our Board and executive management determine the level of risk we are willing to accept in pursuit of our objectives, through the ERM program and the well-defined risk appetite statements developed thereunder. We utilize the “three lines of defense” risk management model to assign roles, responsibilities and accountabilities for taking and managing risk.
Governance and Accountability
Board and Board Committees
Our Board of Directors, as a whole and through its committees, maintains responsibilities for the oversight of risk management, including monitoring the “tone at the top,” and our risk culture, and overseeing emerging and strategic risks. While our Board’s Risk & Technology Committee has primary responsibility for oversight of enterprise risk management, the Audit, Compensation & Human Capital and Nominating & Corporate Governance Committees also oversee risks within their respective areas of responsibilities. Each of these Board Committees consists entirely of independent directors and provides regular reports to the full Board regarding matters reviewed at their Committee meetings. Each of our Banks also has a comprehensive Enterprise Risk Management Framework, approved by the board of directors of the respective Bank, which includes governance, compliance, reporting and other requirements.
Risk Management Roles and Responsibilities
In addition to our Board and Board Committees, responsibility for risk management also flows to other individuals and legal entities throughout the Company, including, the Board of Directors of each of our Banks and committees thereof, various management committees and executive management. Our “three lines of defense” risk management model is defined within our ERM Framework and includes the following:
•The “first line of defense” is comprised of the business areas that engage in activities that generate revenue or provide operational support or services that introduce risk to us. As the business owner, the first line of defense is responsible for, among other things, identifying, owning, managing and controlling key risks associated with their activities, timely addressing issues and remediation, and implementing processes and procedures to strengthen the risk and control environment. The first line of defense identifies and manages key risk indicators and risks and controls consistent with our risk appetite. The executive officers who serve as leaders in the “first line of defense,” are responsible for ensuring that their respective functions operate within established risk limits, in accordance
with our risk appetite. These leaders are also responsible for identifying risks, considering risk when developing strategic plans, budgets and new products, and implementing appropriate risk controls when pursuing business strategies and objectives. In addition, these leaders are responsible for deploying sufficient financial resources and qualified personnel to manage the risks inherent in our business activities.
•The “second line of defense” consists of an independent risk management team charged with oversight and monitoring of risk within the business. The second line of defense is responsible for, among other things, formulating and overseeing our ERM Framework and related policies and procedures, effectively challenging the first line of defense and identifying, monitoring and reporting on aggregate risks of the business and support functions.
Our risk management team, which is led by our CRO and includes compliance, provides oversight of our risk profile and is responsible for maintaining a compliance program that includes compliance risk assessment, policy development, testing and reporting activities.
The CRO manages our risk management team and is responsible for establishing and implementing standards for the identification, management, measurement, monitoring and reporting of risk on an Enterprise-wide basis. The CRO is responsible for developing an appropriate risk appetite with corresponding limits that aligns with supervisory expectations, along with proposing our risk appetite to the Board of Directors. The CRO regularly reports to the Risk & Technology Committee as well as the Banks’ Risk and Compliance Committees on risk management matters.
•The “third line of defense” is comprised of our Global Audit organization. The third line of defense provides an independent review and objective assessment of the design and operating effectiveness of the first and second lines of defense, governance, policies, procedures, processes and internal controls, and reports its findings to executive management and the Board, through the Audit Committee. Global Audit is responsible for performing periodic, independent reviews and testing compliance with our and the Banks’ risk management policies and standards, as well as with regulatory guidance and industry best practices. Global Audit also assesses the design of our and the Banks’ policies and standards and validates the effectiveness of risk management controls, and reports the results of such reviews to the Audit Committee.
Management Committees
We operate several internal management committees, including at each of our Banks, a Bank Risk Management Committee (BRMC). The BRMCs are the highest-level management committees at the Banks to oversee risks and are responsible for risk governance, risk oversight and making recommendations on the Banks’ risk appetite. The BRMCs monitor compliance with limits and related escalation requirements, and oversee implementation of risk policies.
In addition to the BRMCs, we maintain the following risk management committees at each of our Banks to oversee the risks listed below: the Credit Risk Management Committee; Compliance Risk Management Committee; Operational Risk Management Committee; Model Risk Management Committee; and the Asset & Liability Management Committee; we also maintain a Parent Company Asset & Liability Management Committee and a Capital Management Committee. Each of these Committees is responsible for one or more of the eight risk categories, which are described in detail below under the heading “Risk Categories”. For its risk category(ies) of responsibility, each Committee provides risk governance, risk oversight and monitoring. Each Committee reviews key risk exposures, trends and significant compliance matters, and provides guidance on steps to monitor, control and escalate significant risks. We include the risk information provided by the BRMCs and these risk management committees, along with additional risk information that is identified at the Parent Company level, in our determination and assessment of the risks that are presented to and discussed with our Board and Board Committees.
Risk Categories
We evaluate the potential impact of a risk event on us (including our subsidiaries) by assessing the customer, partner, financial, reputational and legal and regulatory impacts, and have divided risk into the following categories. During 2024, we made various enhancements to our risk management practices, particularly within the Market, Liquidity and Capital risk categories, and we will continue to evaluate the structure of risk pillars and other potential enhancements going forward.
Credit Risk
Credit Risk is the risk arising from an obligor’s failure to meet the terms of any contract or otherwise perform as agreed. Credit Risk is found in all activities in which settlement or repayment depends on counterparty, issuer or borrower performance.
We are exposed to credit risk primarily relating to the credit card and other loans we make to our customers. Our credit risk relates to the risk that consumers using the private label, co-brand, general purpose or DTC credit cards, or other loans that we issue will not repay their loan balances. As part of our efforts to minimize our risk of credit card or other loan write-offs, we have developed automated proprietary scoring technology and verification procedures to make risk-based origination decisions when approving new account holders, establishing or adjusting account holder credit limits and applying our risk-based pricing. The credit risk on our Credit card and other loans balances is quantified through our Allowance for credit losses which is recorded net with Credit card and other loans on our Consolidated Balance Sheets. Credit risk is overseen and monitored by the Credit Risk Management Committee at each Bank.
Market Risk
Market risk is the risk to current or anticipated earnings, capital or economic value arising from changes in the market
value of portfolios, securities or other financial instruments. Market Risk includes interest rate risk which is the risk arising from movements in interest rates. Interest rate risk results from:
•Repricing risk – differences between the timing of rate changes and the timing of cash flows;
•Basis risk – changing rate relationships among different yield curves affecting an organization’s activities;
•Yield curve risk – changing rate relationships across the spectrum of maturities; and
•Options risk – interest-related options embedded in certain products.
Our principal market risk exposures arise from volatility in interest rates and their impact on economic value, capitalization levels and earnings. Historically, we have not used interest rate derivative contracts to manage interest rate risk; however, as part of our ongoing evolution of interest rate risk mitigation tools, we established interest rate risk hedging capabilities in 2024, employing interest rate swaps on our credit card loans portfolio to reduce interest rate risk sensitivity.
To the extent we are unable to effectively match the interest rate sensitivity of our assets and liabilities, our net earnings could be materially adversely affected. We use various industry standard market risk measurement techniques and sensitivity analyses to estimate, assess and manage the impact of positive or negative changes in interest rates on our Net interest income and economic value of equity under various interest rate scenarios. We believe these approaches provide useful insights into the interest rate risk inherent in our business, and how to effectively manage such risk. As of December 31, 2024, based on the composition of our fixed rate and floating rate assets and liabilities on our Consolidated Balance Sheets, our net interest income and economic value of equity are expected to increase in higher rate scenarios and decrease in lower rate scenarios.
One standard sensitivity measure we use calculates the impact on net interest income from a hypothetical instantaneous and sustained 100 basis point increase or decrease in interest rates. Due to the mix of fixed and floating rate assets and liabilities on our Consolidated Balance Sheet as of December 31, 2024, this hypothetical instantaneous 100 basis point increase or decrease in interest rates would have an insignificant impact on our annual net interest income. Actual changes in our net interest income will depend on many factors, and therefore may differ from our estimated risk to changes in interest rates. In addition to this industry standard measure, we also consider the potential impact of alternative interest rate scenarios in our internal interest rate risk management decisions, such as larger rate shocks (higher than +/- 100 basis points), or steepening and flattening yield curve scenarios. We also regularly review the sensitivity of our interest rate risk metrics to changes in our key modeling assumptions.
In 2023 and 2024, we implemented a new and improved asset liability management model that is capable of assessing a broader array of interest rate risk scenarios, including a wider range of interest rate and balance sheet assumptions. The interest rate risk model that we use in deriving these measures incorporates contractual information, behavioral assumptions and modeling methodologies, which project borrower and deposit behavior patterns. Other market inputs, such as interest rates, market prices and interest rate volatility, are also critical components of our interest rate risk measures. We regularly update and enhance these assumptions, scenarios and model as we believe appropriate to reflect our best assessment of the market environment and the expected behavior patterns of our existing assets and liabilities. There are inherent limitations, however, in any methodology used to estimate the exposure to changes in market interest rates. The
sensitivity analysis described above contemplates only certain movements in interest rates and is performed at a particular point in time based on our existing Consolidated Balance Sheet. Accordingly, changes in customer behavior and strategic actions that management may take in the future may cause the composition of our assets and liabilities to change from the assumptions and projections previously used in scenarios considered, and could cause our actual Net interest income and economic value of equity to differ from previous sensitivity analysis outcomes.
The Board of Directors of the Parent Company and each Bank approve our market risk management policies, risk appetites, and associated risk limits which guide our market risk management activities. The Asset & Liability Management Committee of the Parent Company and each of the Banks assists the Board of Directors of the Parent Company and each of the Banks, as well as management, in overseeing, reviewing, and monitoring market risk.
Capital Risk
Capital risk refers to the potential threat to an institution's financial stability or safety due to inadequate capital resources to support business operations and safeguard against unexpected losses. These risks can arise from various stressed operating conditions, including macroeconomic, credit, liquidity, market, and regulatory factors.
We manage capital in alignment with the risk characteristics of our business, the economic environment, and the expectations of regulators and shareholders. This includes considering the impact of capital stress testing in our assessment of capital adequacy. Capital risk is managed by balancing stakeholder interests, such as safety and soundness, profit, growth, value, and operational and non-financial factors, while reasonably considering both near-term and long-term impacts. Our policies, risk appetite limits, and capital ratio operating targets ensure that we and the Banks maintain sufficient capital to withstand capital stress events over a specified period. The Capital Planning Committee and Asset & Liability Management Committees of the Parent Company and each of the Banks assist the Board of Directors and management in overseeing, reviewing, and monitoring capital risk.
Liquidity Risk
Liquidity Risk is the risk arising from an inability to meet obligations when they come due. Liquidity Risk includes the inability to access funding sources or manage fluctuations in funding levels. Liquidity Risk also results from an organization’s failure to recognize or address changes in market conditions.
Our primary liquidity objective is to maintain a liquidity profile that will enable us, even in times of stress or market disruption, to fund our existing assets and meet liabilities in a timely manner and at an acceptable cost. Policy and risk appetite limits require us and the Banks to ensure that sufficient liquid assets are available to survive liquidity stresses over a specified time period. The Asset & Liability Management Committee of the Parent Company and each of the Banks assists the Board of Directors of the Parent Company and each of the Banks, as well as management, in overseeing, reviewing, and monitoring liquidity risk.
Operational Risk
Operational Risk is the risk arising from inadequate or failed internal processes or systems, human errors or misconduct, or adverse external events. Operational losses result from internal or external fraud, inadequate or inappropriate employment practices and workplace safety, failure to meet obligations involving customers, partners, products and business practices, damage to physical assets, business disruption and systems failures, and/or failures in execution, delivery and process management.
Operational risk is inherent in all business activities and can impact us through direct or indirect financial loss, brand damage, customer dissatisfaction and legal and regulatory penalties. We have implemented an operational risk framework that is defined in our Operational Risk Management Policy. The Operational Risk Management Committee of each Bank, chaired by our Chief Operational Risk Officer (CORO), oversees and monitors operational risk exposures, including escalating issues and recommending policies, procedures and practices to manage operational risks.
As part of our Operational Risk Program, we maintain an information and cybersecurity risk management program, which is led by our Chief Information Security Officer (CISO) and is designed to protect the confidentiality, integrity, and availability of critical information and information systems from unauthorized access, use, disclosure, disruption, modification, or destruction. The Program leverages security technology, a team of internal and external experts, and operations based on the National Institute of Standards and Technology Cybersecurity Framework (NIST CSF) consisting
of controls designed to govern, protect, detect, identify, respond and recover from cybersecurity incidents. We continue to invest in enhancements to cybersecurity capabilities and engage in industry and government forums to promote advancements to the broader financial services cybersecurity ecosystem. For further discussion of our cybersecurity risk management program, see “Item IC.—Cybersecurity”.
Compliance Risk
Compliance Risk is the risk arising from violations of laws or regulations, or from nonconformance with prescribed practices, internal policies and procedures, or ethical standards. This risk exposes organizations to a variety of adverse impacts, including enforcement or other supervisory actions, fines, penalties, payment of damages, restrictions on business activities and the voiding of contracts.
Our Compliance organization is responsible for establishing and maintaining our Compliance Risk Management Program. Pursuant to this Program, we seek to manage and mitigate compliance risk by assessing, controlling, monitoring, measuring and reporting the legal and regulatory risks to which we are exposed. The Compliance Risk Management Committee of each Bank, chaired by the Chief Compliance Officer, oversees the implementation and execution of the Compliance Management System and monitors compliance exposures to manage compliance risks.
Model Risk
Model Risk is the risk arising from decisions based on incorrect or misused model outputs and reports. Model risk occurs primarily for three reasons:
•a model may have fundamental errors, including with respect to the model’s construction, or interpretation, and produce inaccurate outputs when viewed against its design objective and intended business uses;
•a model may be used incorrectly or inappropriately, or there may be a misunderstanding about its limitations and assumptions, including models being calibrated on historical cycles and correlations which may not be predictive of the future, or failures to update assumptions appropriately or in a timely manner; or
•the model produces results that are not compliant with fair lending or other laws and regulations.
We manage model risk through a comprehensive model governance framework, including policies and procedures for model development, maintenance and performance monitoring activities, independent model testing and validation and change management capabilities. We also assess model performance on an ongoing basis. Model Risk oversight and monitoring is conducted by the Model Risk Management Committee of each Bank.
Strategic Risk
Strategic Risk is the risk arising from adverse business decisions, poor implementation of business decisions or lack of responsiveness to changes in the industry and operating environment. This risk is a function of an organization’s strategic goals, business strategies, resources and quality of implementation.
Strategic decisions are reviewed and approved by business leaders and various committees and must be aligned with our policies. We seek to manage strategic and business risks through risk controls embedded in these processes, as well as overall risk management oversight over business goals. Existing product performance is reviewed periodically by various of our Committees and executive management.
Reputational Risk
Reputational Risk is the risk arising from negative public opinion. This risk may impair competitiveness by affecting the ability to establish new relationships or services or continue servicing existing relationships.
Reputational Risk is inherent in all activities and requires us to exercise caution in dealing with stakeholders, such as customers, brand partners, other contractual counterparties, investors, regulators, employees and the community. Executive management is responsible for considering the reputational risk implications of business activities and strategies and ensuring the relevant subject matter experts are engaged as needed.
Item 1B. Unresolved Staff Comments.
None.
Item 1C. Cybersecurity.
Cybersecurity Risk Management and Strategy
As noted above under “Risk Management”, we maintain an information and cybersecurity risk management program, which is led by our CISO and is designed to protect the confidentiality, integrity and availability of critical information and information systems. The program is designed based on the NIST CSF; provided that this does not imply that we meet any particular technical standards, specifications or requirements, only that we use the NIST CSF as a guide to help us identify, assess and manage cybersecurity risks relevant to our business.
Our cybersecurity risk management program is integrated into our overall ERM program, and shares common methodologies, reporting channels and governance processes that apply across the ERM program to other legal, compliance, strategic, operational, and financial risk areas.
Our cybersecurity risk management program includes:
•risk assessments designed to help identify material cybersecurity risks to our critical systems, information, products, services, and our broader enterprise IT environment;
•a security team principally responsible for managing (1) our cybersecurity risk assessment processes, (2) our security controls, and (3) our response to cybersecurity incidents;
•the use of external service providers, where appropriate, to assess, test, train or otherwise assist with aspects of our security controls;
•security tools deployed in the IT environment for protection against and monitoring for suspicious activity;
•cybersecurity awareness training of our employees, including incident response personnel, and senior management;
•a cybersecurity incident response plan that includes procedures for responding to cybersecurity incidents; and
•a third-party risk management process for service providers, suppliers, and vendors.
We have not identified risks from known cybersecurity threats, including as a result of any prior cybersecurity incidents, that have materially affected or are reasonably likely to materially affect us, including our operations, business strategy, results of operations or financial condition. We face certain ongoing risks from cybersecurity threats such as loss or theft of data, ransomware or other disruptive attacks from financially motivated bad actors, and third-party supply chain issues that, if realized, are reasonably likely to materially affect us, including our operations, business strategy, results of operations, and financial condition. For further discussion, see “Item 1A. Risk Factors – Risk Management” and “Item 1A. Risk Factors – Cybersecurity, Technology and Vendor Risks”.
Cybersecurity Governance
Our Board of Directors considers cybersecurity risk to be a critical part of its risk oversight function and has delegated to the Risk & Technology Committee primary oversight of cybersecurity and other information technology risks. The Audit Committee also reviews cybersecurity matters as part of its oversight of major financial risk exposures. The Risk & Technology Committee oversees management’s implementation of our cybersecurity risk management program, and receives regular reports from management on our cybersecurity risks. In addition, management updates the Risk & Technology Committee, as necessary, regarding any material cybersecurity incidents, as well as any incidents with lesser impact potential.
The Risk & Technology Committee periodically reports to the Board of Directors regarding its activities, including those related to cybersecurity. As part of its oversight of major financial risk exposures, the Audit Committee also reviews with management and our internal and independent auditors our risk assessments and risk management program, including with respect to cybersecurity. Board members receive presentations on cybersecurity topics from our CISO or external experts as part of the Board’s continuing education on topics that impact public companies.
Our management team, including our CISO, CRO and CORO, is responsible for assessing and managing our material risks from cybersecurity threats. Our management team has primary responsibility for our overall cybersecurity risk
management program and supervises both our internal cybersecurity personnel and our retained external cybersecurity consultants. Our CISO works closely with our CRO and CORO, who are responsible for providing effective oversight and challenge to the activities of our CISO.
Our CISO, who reports to our Executive Vice President and Chief Technology Officer, has 25 years of cybersecurity and information security experience across a number of regulated industries, including financial services, healthcare and defense and national security. Our CISO has been a Certified Information System Security Professional (CISSP) for over 20 years and serves on the governing body of various organizations focused on technology and cybersecurity, including as an Advisory Council Member to the Harvard Business Review and a Governing Board Member of Evanta, an organization of peer-CISOs. Each of our CRO (who reports to our Chief Executive Officer) and CORO (who reports to our CRO) has over 20 years of financial services experience in operations and risk management.
Our management team supervises efforts to prevent, detect, mitigate, and remediate cybersecurity risks and incidents through various means, and, as appropriate, provides briefings from internal security personnel, threat intelligence and other information obtained from governmental, public or private sources, including external consultants engaged by us, and alerts and reports produced by security tools deployed in the IT environment.
Item 2. Properties.
As of December 31, 2024, we leased 12 general office properties, comprised of approximately 1.3 million square feet, of which approximately 0.8 million square feet are subleased or on the sublease market. Our principal facilities used to carry out our operational, sales and administrative functions are as follows (in alphabetical order, by city):
| | | | | | | | | | | | | | |
| Location | | Approximate
Square Footage | | Lease Expiration Date |
| Bangalore, Karnataka, India | | 87,400 | | January 31, 2029 |
| Chadds Ford, Pennsylvania | | 9,900 | | April 30, 2027 |
| Coeur D'Alene, Idaho | | 23,500 | (1) | July 31, 2038 |
| Columbus, Ohio | | 326,400 | | September 12, 2032 |
| Draper, Utah | | 22,900 | (1) | August 31, 2031 |
| New York, New York | | 18,500 | | January 31, 2026 |
| Plano, Texas | | 28,000 | (1) | June 30, 2026 |
| Wilmington, Delaware | | 5,200 | | July 31, 2027 |
______________________________(1)Excludes square footage of subleased portion.
We believe our current facilities are suitable to our businesses and that we will be able to lease, purchase or newly construct additional facilities as needed.
Item 3. Legal Proceedings.
Refer to Part I, Item 1A, “Risk Factors—Legal, Regulatory and Compliance Risks”, “Risk Factors—Risks Related to the LoyaltyOne Spinoff” and Note 16 “Commitments and Contingencies” to our audited Consolidated Financial Statements, which are incorporated herein by reference.
Item 4. Mine Safety Disclosures.
Not applicable.
PART II
Item 5. Market for Registrant’s Common Equity, Related Stockholder Matters and Issuer Purchases of Equity Securities.
Market Information
Our common stock is listed on the NYSE and trades under the symbol “BFH”.
Holders
As of February 7, 2025, the closing price of our common stock was $62.03 per share, there were 49,092,356 shares of our common stock outstanding, and there were 92 holders of record of our common stock.
Dividends
Payment of future dividends is subject to declaration by our Board of Directors. Factors considered in determining dividends include, but are not limited to, our profitability, expected capital needs and legal, regulatory and contractual restrictions. See also “Risk Factors—There is no guarantee that we will pay future dividends or repurchase shares of our common stock at a level anticipated by stockholders, which could reduce returns to our stockholders.”. Subject to these qualifications, we presently expect to continue to pay dividends on a quarterly basis.
On January 30, 2025, our Board of Directors declared a quarterly cash dividend of $0.21 per share on our common stock, payable on March 21, 2025, to stockholders of record at the close of business on February 14, 2025.
Issuer Purchases of Equity Securities
The following table presents information with respect to purchases of our common stock made by or on behalf of us during the three months ended December 31, 2024:
| | | | | | | | | | | | | | | | | | | | | | | | | | |
| Period | | Total Number of Shares Purchased (1) | | Average Price Paid
per Share | | Total Number of
Shares Purchased as
Part of Publicly
Announced Plans or
Programs | | Approximate Dollar
Value of Shares that
May Yet Be
Purchased Under the
Plans or Programs |
| | | | | | | | ( Millions) |
| October 1-31 | | 1,969 | | $ | 48.98 | | | — | | $ | 19 | |
| November 1-30 | | 1,286 | | 54.74 | | | — | | 44 | |
| December 1-31 | | 686,292 | | 64.35 | | | 683,728 | | — | |
| Total | | 689,547 | | $ | 64.29 | | | 683,728 | | $ | — | |
______________________________
(1)During the periods presented, (i) 5,819 shares of our common stock were purchased by the administrator of our Bread Financial 401(k) Plan for the benefit of the employees who participated in that portion of the Plan and (ii) 683,728 shares of our common stock were repurchased by the Company, pursuant to a Rule 10b5-1 trading plan previously adopted by the Company, during an open trading window.
Stock Performance Graph
The following Stock Performance Graph shows the cumulative total stockholder return on our common stock compared to an overall stock market index, the S&P Composite 500 Stock Index (S&P 500 Index), and a published industry index, the S&P Financial Composite Index (S&P Financials Index), over the five-year period commencing December 31, 2019 and ended December 31, 2024.
The Stock Performance Graph assumes that $100 was invested in our common stock and each index, and that all dividends were reinvested. For the purpose of this Stock Performance Graph, historical stock prices have been adjusted to reflect the impact of the spinoff of LVI on November 5, 2021. The stock price performance on the graph below is not necessarily indicative of future performance.
*$100 invested on December 31, 2019 in stock or index, including reinvestment of dividends.
Fiscal year end December 31.
Copyright© 2025 Standard & Poor’s, a division of S&P Global. All rights reserved.
| | | | | | | | | | | | | | | | | |
| Bread Financial Holdings, Inc. | | S&P 500 Index | | S&P Financials Index |
| December 31, 2019 | $ | 100.00 | | | $ | 100.00 | | | $ | 100.00 | |
| December 31, 2020 | 67.68 | | | 118.40 | | | 98.31 | |
| December 31, 2021 | 77.06 | | | 152.39 | | | 132.75 | |
| December 31, 2022 | 44.35 | | | 124.79 | | | 118.77 | |
| December 31, 2023 | 39.81 | | | 157.59 | | | 133.20 | |
| December 31, 2024 | 75.19 | | | 197.02 | | | 173.90 | |
Our future filings with the SEC may “incorporate information by reference,” including this Annual Report on Form 10-K. Unless we specifically state otherwise, this Stock Performance Graph shall not be deemed to be incorporated by reference and shall not constitute soliciting material or otherwise be considered filed under the Securities Act of 1933, as amended, or the Securities Exchange Act of 1934, as amended.
Item 6. [Reserved]
Item 7. Management’s Discussion and Analysis of Financial Condition and Results of Operations (MD&A).
The following discussion and analysis of our results of operations and financial condition should be read in conjunction with our audited Consolidated Financial Statements and related Notes included elsewhere in this Annual Report on Form 10-K. Some of the information contained in this discussion and analysis constitutes forward-looking statements that involve risks and uncertainties. Actual results could differ materially from those discussed in these forward-looking statements. Factors that could cause or contribute to these differences include, but are not limited to, those discussed below and elsewhere in this Annual Report on Form 10-K, particularly under “Risk Factors” and “Cautionary Note Regarding Forward-Looking Statements”. Unless otherwise specified, references to Notes to our audited Consolidated Financial Statements are to the Notes to our audited Consolidated Financial Statements as of December 31, 2024 and 2023 and for years ended December 31, 2024, 2023 and 2022.
OVERVIEW
We are a tech-forward financial services company that provides simple, personalized payment, lending, and saving solutions to millions of U.S. consumers. Our payment solutions, including Bread Financial general purpose credit cards and savings products, empower our customers and their passions for a better life. Additionally, we deliver growth for some of the most recognized brands in travel & entertainment, health & beauty, jewelry and specialty apparel through our private label and co-brand credit cards and pay-over-time products providing choice and value to our shared customers.
Our partner base consists of large consumer-based businesses, including well-known brands such as (alphabetically) AAA, Academy Sports + Outdoors, Caesars, Dell Technologies, Hard Rock International, the NFL, Saks Fifth Avenue, Signet, Ulta and Victoria’s Secret, as well as small- and medium-sized businesses (SMBs). Our partner base is well diversified across a broad range of industries and retail verticals, including travel and entertainment, health and beauty, jewelry, sporting goods, technology and electronics, home goods and the industry in which we first began, specialty apparel. We believe our comprehensive suite of payment, lending and saving solutions, along with our related marketing and data and analytics, offers us a significant competitive advantage with products relevant across all customer segments (Gen Z, Millennial, Gen X and Baby Boomers). The breadth and quality of our product and service offerings, coupled with our customer-centric approach, have enabled us to establish and maintain long-standing partner relationships. We operate our business through a single reportable segment, with our primary source of revenue being from Interest and fees on loans from our various credit card and other loan products, and to a lesser extent from contractual relationships with our brand partners.
Throughout this report, unless stated or the context implies otherwise, the terms “Bread Financial”, “BFH”, the “Company”, “we”, “our” or “us” refer to Bread Financial Holdings, Inc. and its subsidiaries on a consolidated basis. References to “Parent Company” refer to Bread Financial Holdings, Inc. on a parent-only standalone basis. In addition, in this report we may refer to the retailers and other companies with whom we do business as our “partners”, “brand partners”, or “clients”, provided that the use of the term “partner”, “partnering” or any similar term does not mean or imply a formal legal partnership, and is not meant in any way to alter the terms of Bread Financial’s relationship with any third parties. We offer our credit products through our insured depository institution subsidiaries, Comenity Bank and Comenity Capital Bank, which together are referred to herein as the “Banks”. Bread Financial or other of the terms listed above are also used in this report to include references to transactions and arrangements occurring prior to our name change from Alliance Data Systems Corporation to Bread Financial Holdings, Inc. in March 2022.
NON-GAAP FINANCIAL MEASURES
We prepare our audited Consolidated Financial Statements in accordance with accounting principles generally accepted in the United States of America (GAAP). However, certain information included herein constitutes Non-GAAP Financial Measures. Our calculations of Non-GAAP Financial Measures may differ from the calculations of similarly titled measures by other companies. In particular:
•In August 2024 we entered into separate, privately-negotiated repurchase agreements with a limited number of Convertible Note holders to repurchase a portion of our outstanding $316 million aggregate principal amount of 4.25% Convertible Senior Notes due 2028 (the Convertible Notes). Subsequently, in September and November of 2024, certain holders of Convertible Notes separately approached us to repurchase Convertible Notes, and we entered into additional separate, privately-negotiated repurchase agreements with such holders of Convertible Notes. From a GAAP perspective, we paid a premium to induce these repurchases which resulted in an impact to Total non-interest expenses, with a corresponding favorable tax impact, also reflected in Net income and
consequently our Earnings per diluted share. We have shown adjustments to these three financial statement line items, for total Company as well as for continuing operations, to exclude the impact from our repurchased Convertible Notes. We use Adjusted total non-interest expenses, Adjusted net income, and Adjusted earnings per diluted share to evaluate the ongoing operations of the Company excluding the volatility that can occur from the impact of our repurchased Convertible Notes.
•Pretax pre-provision earnings (PPNR) represents Income from continuing operations before income taxes and the Provision for credit losses. PPNR excluding gain on portfolio sale and impact from repurchased Convertible Notes then excludes from PPNR the gain on any portfolio sale in the period, as well as the inducement expense from our repurchased Convertible Notes in the period. We use PPNR and PPNR excluding gain on portfolio sale and impact from repurchased Convertible Notes as metrics to evaluate our results of operations before income taxes, excluding the volatility that can occur within Provision for credit losses and the one-time nature of a gain on the sale of a portfolio and/or the impact from repurchased Convertible Notes.
•Return on average tangible common equity (ROTCE) represents annualized Income from continuing operations divided by average Tangible common equity. Tangible common equity (TCE) represents Total stockholders' equity reduced by Goodwill and intangible assets, net. We use ROTCE as a metric to evaluate the Company's performance.
•Tangible common equity over Tangible assets (TCE/TA) represents TCE divided by Tangible assets (TA), which is Total assets reduced by Goodwill and intangible assets, net. We use TCE/TA as a metric to evaluate the Company’s capital adequacy and estimate its ability to absorb losses.
•Tangible book value per common share represents TCE divided by shares outstanding. We use Tangible book value per common share, a metric used across the industry, to estimate liquidation value.
We believe the use of these Non-GAAP financial measures provide additional clarity in understanding our results of operations and trends. For a reconciliation of these Non-GAAP financial measures to the most directly comparable GAAP measures, please see “Table 6: Reconciliation of GAAP to Non-GAAP Financial Measures” that follows.
BUSINESS ENVIRONMENT
This Business Environment section provides an overview of our results of operations and financial position for the year ended December 31, 2024, as well as our related outlook for 2025 and certain of the uncertainties associated with achieving that outlook. This section should be read in conjunction with the other information appearing in this Annual Report on Form 10-K, including “Consolidated Results of Operations”, “Risk Factors”, and “Cautionary Note Regarding Forward-Looking Statements”, which provide further discussion of variances in our results of operations over the periods of comparison, along with other factors that could impact future results and the Company achieving its outlook.
Credit sales of $27.0 billion were down 7% when compared with 2023, reflecting self-moderated consumer spending and strategic credit tightening, partially offset by new brand partner growth. Average credit card and other loans of $18.1 billion decreased 1% while End-of-period credit card and other loans of $18.9 billion were down 2%; both declines were driven by the same factors affecting Credit sales, as well as elevated net principal losses. Total interest income decreased 2% primarily as a result of lower Interest and fees on loans which was driven by lower late fees from lower early-state delinquency volumes, our gradual shift in product mix to a lower proportion of private label accounts which tend to have
higher late fees, as well as higher reversals of interest and fees resulting from higher gross credit losses. Net interest margin was 18.3% in 2024 compared to 19.5% in 2023, primarily due to decreased late fees and higher funding costs, particularly with DTC deposits. Non-interest income decreased $249 million, primarily related to the $230 million gain on the BJ’s portfolio sale in 2023, as well as decreased merchant discount fees from lower “big ticket” credit sales, and interchange revenue earned, partially offset by a reduction in costs associated with brand partner retailer share arrangements. Overall, Total net interest and non-interest income was $3.8 billion, down 11% versus 2023.
Provision for credit losses increased relative to 2023 driven by a $92 million reserve release in the current year compared with a $136 million reserve release in the prior year, with the release in the prior year primarily related to the sale of the BJ’s portfolio. The reserve releases in both years were offset by net principal losses of $1.5 billion and $1.4 billion during those same respective periods.
Our Allowance for credit losses decreased as of December 31, 2024 relative to December 31, 2023, due primarily to lower Credit card and other loans, as well as a modest decrease in the reserve rate over the period. Overall, our reserve rate is nominally lower, 11.9% as of December 31, 2024 compared with 12.0% as of December 31, 2023, reflecting conservative weightings on the economic scenarios in our credit reserve modeling given the wide range of potential 2025 macroeconomic outcomes, which we intend to maintain until we see sustained improvement in delinquencies and an
improved macroeconomic outlook. From an overall credit quality perspective, our percentage of Vantage 660+ cardholders remains above pre-pandemic levels due to prudent credit tightening and a more diversified product mix, with co-brand and proprietary cards representing a larger proportion of our portfolio.
Total non-interest expenses decreased 2% when compared with 2023. Excluding the $107 million impact from our repurchased Convertible Notes, Adjusted total non-interest expenses, a Non-GAAP financial measure, decreased 7% from 2023, driven by a decrease in Card and processing expenses, including fraud, partially offset by an increase in Employee compensation and benefits expense due primarily to higher short-term and long-term incentive compensation. See “Non-GAAP Financial Measures” and Table 6: Reconciliation of GAAP to Non-GAAP Financial Measures included in this report.
We continued strengthening our balance sheet throughout 2024. We reduced debt and dilution risk through repurchasing $306 million aggregate principal amount of our outstanding Convertible Notes, while growing our Common equity tier 1 capital ratio to 12.4%, a 20 basis points year-over-year improvement. During the year ended December 31, 2024, under the authorized stock repurchase program, we acquired a total of 1.0 million shares of our common stock for $55 million. Additionally, DTC deposits increased to $7.7 billion as of December 31, 2024, with average DTC deposits now representing 43% of our total funding, up from 35% a year ago. Further, in January 2025, with cash on hand we redeemed the remaining $100 million in aggregate principal amount of our Senior Notes due 2026.
Throughout 2024 we made further progress with the implementation of our mitigation strategy in response to the final rule on credit card late fees published by the CFPB. Industry organizations have challenged the final rule in court, and the ultimate outcome of such challenge, including the impact on the final rule, is uncertain. The final rule had an original effective date of May 14, 2024; however, on May 10, 2024, the United States District Court for the Northern District of Texas granted an injunction and stay of the final rule, and the injunction granted remains in effect as of the date of this report. We are closely monitoring the ongoing litigation related to the rule and recent developments involving the CFPB’s operations, but also continue to execute on our mitigation strategy given the uncertainty surrounding the timing and outcome. Because of that uncertainty, our full year 2025 financial outlook assumes the final rule does not take effect in 2025.
Our 2025 financial outlook assumes economic stability, yet is subject to changing conditions as the impacts from key legislative and monetary policies are still unknown. Our current baseline forecast includes continued improvements in real wages in a stable, albeit cooling labor market, while also assuming interest rate decreases by the Federal Reserve Board, which will slightly decrease Total net interest income.
Based on our current economic outlook, strategic credit tightening actions, higher gross credit losses, and visibility into our new business pipeline along with existing partners, we expect 2025 Average credit card and other loans to be relatively flat to 2024. We expect End-of-period credit card and other loans to be higher as of year-end 2025 relative to 2024, as a result of new business growth and higher Credit sales during the year. Total net interest and non-interest income, excluding any gains on portfolio sales, a Non-GAAP financial measure, is anticipated to be up in the low-single digits on a percentage point basis from 2024. Full year Net interest margin is expected to be modestly higher than 2024 as a result of our mitigation actions taken in response to the CFPB late fee rule, partially offset by factors such as: (i) interest rate decreases by the Federal Reserve Board, which impact us due to our slight asset sensitivity and lagged cost of funds impacts, (ii) our continued shift in risk mix, from improving credit quality, and therefore lower delinquencies and consequently lower late fees, and (iii) product mix, to co-brand, proprietary, and installment lending products, leading to lower finance charges and late fees.
As a result of efficiencies gained from our ongoing operational excellence initiatives, along with disciplined investment and expense management, in 2025 we expect to generate full year positive operating leverage excluding any gains on portfolio sales and the $107 million impact from our repurchased Convertible Notes.
Our 2025 financial outlook also assumes a Net principal loss rate ranging from 8.0% to 8.2%. As a result of hurricanes Helene and Milton we froze delinquency progression for cardholders in FEMA identified impact zones for one billing cycle, which resulted in a modestly lower Net principal loss rate in the fourth quarter of 2024, and consequently these actions will negatively impact the Net principal loss rate in the second quarter of 2025.
In our 2025 financial outlook we also expect our full year normalized effective tax rate to be in the range of 25% to 26%, with quarter-over-quarter variability due to the timing of certain discrete items,
We expect our resilient business model, prudent capital allocation, and operational excellence initiatives to deliver responsible growth and achieve strong financial results in 2025.
CONSOLIDATED RESULTS OF OPERATIONS
The following discussion provides commentary on the variances in our results of operations for the year ended December 31, 2024, compared with the year ended December 31, 2023, as presented in the accompanying tables. This discussion should be read in conjunction with the discussion under “Business Environment”, above. For a discussion of the financial condition and results of operations for 2023 compared with 2022, please refer to Part II, Item 7. “Management's Discussion and Analysis of Financial Condition and Results of Operations (MD&A)” in our Annual Report on Form 10-K for the year ended December 31, 2023, filed with the SEC on February 20, 2024, which discussion is incorporated herein by reference from such prior report on Form 10-K.
Table 1: Summary of Our Financial Performance
| | | | | | | | | | | | | | | | | | | | | | | | | | | | | | | | | | | | | | | | | |
| Years Ended December 31, | | $ Change | | % Change |
| 2024 | | 2023 | | 2022 | | 2024
to 2023 | | 2023
to 2022 | | 2024
to 2023 | | 2023
to 2022 |
| (Millions, except per share amounts and percentages) |
| Total net interest and non-interest income | $ | 3,838 | | | $ | 4,289 | | | $ | 3,826 | | | $ | (451) | | | $ | 463 | | | (11) | | | 12 | |
| Provision for credit losses | 1,397 | | | 1,229 | | | 1,594 | | | 168 | | | (365) | | | 14 | | | (23) | |
| Total non-interest expenses | 2,060 | | | 2,092 | | | 1,932 | | | (32) | | | 160 | | | (2) | | | 8 | |
| Income from continuing operations before income taxes | 381 | | | 968 | | | 300 | | | (587) | | | 668 | | | (61) | | | 223 | |
| Provision for income taxes | 102 | | | 231 | | | 76 | | | (129) | | | 155 | | | (56) | | | 203 | |
| Income from continuing operations | 279 | | | 737 | | | 224 | | | (458) | | | 513 | | | (62) | | | 230 | |
Loss from discontinued operations, net of income taxes (1) | (2) | | | (19) | | | (1) | | | 17 | | | (18) | | | (87) | | | nm |
| Net income | 277 | | | 718 | | | 223 | | | (441) | | | 495 | | | (61) | | | 222 | |
Adjusted net income (2) | $ | 381 | | | $ | 718 | | | $ | 223 | | | $ | (337) | | | $ | 495 | | | (47) | | | 222 | |
| | | | | | | | | | | | | |
| Net income per diluted share | $ | 5.49 | | | $ | 14.34 | | | $ | 4.46 | | | $ | (8.85) | | | $ | 9.88 | | | (62) | | | 222 | |
Adjusted net income per diluted share (2) | $ | 7.55 | | | $ | 14.34 | | | $ | 4.46 | | | $ | (6.79) | | | $ | 9.88 | | | (47) | | | 222 | |
| Income from continuing operations per diluted share | $ | 5.54 | | | $ | 14.74 | | | $ | 4.47 | | | $ | (9.20) | | | $ | 10.27 | | | (62) | | | 230 | |
Adjusted income from continuing operations per diluted share (2) | $ | 7.60 | | | $ | 14.74 | | | $ | 4.47 | | | $ | (7.14) | | | $ | 10.27 | | | (48) | | | 230 | |
Net interest margin (3) | 18.3 | % | | 19.5 | % | | 19.2 | % | | | | | | (1.2) | | | 0.3 | |
Return on average tangible common equity (4) | 11.4 | % | | 38.0 | % | | 14.2 | % | | | | | | (26.6) | | | 23.8 | |
| Effective income tax rate – continuing operations | 26.7 | % | | 23.8 | % | | 25.4 | % | | | | | | 2.9 | | | (1.6) | |
______________________________
(1)Includes amounts that related to the previously disclosed discontinued operations associated with the spinoff of our former LoyaltyOne segment in 2021 and the sale of our former Epsilon segment in 2019. For additional information refer to Note 1, “Description of Business, Basis of Presentation and Significant Accounting Policies” to the audited Consolidated Financial Statements.
(2)Adjusted for the impact from our repurchased Convertible Notes, and therefore represent Non-GAAP financial measures. See “Non-GAAP Financial Measures” and Table 6: Reconciliation of GAAP to Non-GAAP Financial Measures.
(3)Net interest margin represents annualized Net interest income divided by average Total interest-earning assets. See also Table 5: Net Interest Margin.
(4)Return on average tangible common equity (ROTCE) represents annualized Income from continuing operations divided by average Tangible common equity. Tangible common equity (TCE) represents Total stockholders' equity reduced by Goodwill and intangible assets, net. ROTCE is a Non-GAAP financial measure. See “Non-GAAP Financial Measures” and Table 6: Reconciliation of GAAP to Non-GAAP Financial Measures.
(nm) Not meaningful, denoting a variance of 1,000 percent or more.
Table 2: Summary of Total Net Interest and Non-interest Income, After Provision for Credit Losses
| | | | | | | | | | | | | | | | | | | | | | | | | | | | | | | | | | | | | | | | | |
| Years Ended December 31, | | $ Change | | % Change |
| 2024 | | 2023 | | 2022 | | 2024
to 2023 | | 2023
to 2022 | | 2024
to 2023 | | 2023
to 2022 |
| (Millions, except percentages) | |
| Interest income | | | | | | | | | | | | | |
| Interest and fees on loans | $ | 4,820 | | | $ | 4,961 | | | $ | 4,615 | | | $ | (141) | | | $ | 346 | | | (3) | | | 8 | |
| Interest on cash and investment securities | 204 | | | 184 | | | 69 | | | 20 | | | 115 | | | 11 | | | 165 | |
| Total interest income | 5,024 | | | 5,145 | | | 4,684 | | | (121) | | | 461 | | | (2) | | | 10 | |
| Interest expense | | | | | | | | | | | | | |
| Interest on deposits | 608 | | | 541 | | | 243 | | | 67 | | | 298 | | | 12 | | | 122 | |
| Interest on borrowings | 352 | | | 338 | | | 260 | | | 14 | | | 78 | | | 4 | | | 30 | |
| Total interest expense | 960 | | | 879 | | | 503 | | | 81 | | | 376 | | | 9 | | | 75 | |
| Net interest income | 4,064 | | | 4,266 | | | 4,181 | | | (202) | | | 85 | | | (5) | | | 2 | |
| Non-interest income | | | | | | | | | | | | | |
| Interchange revenue, net of retailer share arrangements | (381) | | | (335) | | | (469) | | | (46) | | | 134 | | | 14 | | | (28) | |
| Gain on portfolio sale | 11 | | 230 | | — | | (219) | | | 230 | | | (95) | | | nm |
| Other | 144 | | | 128 | | | 114 | | | 16 | | | 14 | | | 12 | | | 13 | |
| Total non-interest income | (226) | | | 23 | | | (355) | | | (249) | | | 378 | | | nm | | (107) | |
| Total net interest and non-interest income | 3,838 | | | 4,289 | | | 3,826 | | | (451) | | | 463 | | | (11) | | | 12 | |
| Provision for credit losses | 1,397 | | | 1,229 | | | 1,594 | | | 168 | | | (365) | | | 14 | | | (23) | |
| Total net interest and non-interest income, after provision for credit losses | $ | 2,441 | | | $ | 3,060 | | | $ | 2,232 | | | $ | (619) | | | $ | 828 | | | (20) | | | 37 | |
______________________________
(nm) Not meaningful, denoting a variance of 1,000 percent or more.
Total Net Interest and Non-interest Income, After Provision for Credit Losses
Interest income: Total interest income decreased for the year ended December 31, 2024, due to the following:
•Interest and fees on loans decreased for the year ended December 31, 2024 due primarily to lower late fees driven by lower early-state delinquency volumes and from our gradual shift in product mix to a lower proportion of private label accounts, as well as higher reversals of interest and fees resulting from higher gross credit losses; collectively decreasing finance charge and late fee yields by approximately 58 basis points.
•Interest on cash and investment securities increased for the year ended December 31, 2024, partially offsetting the decrease in Interest and fees on loans, due to higher average balances which increased interest income by $16 million, as well as, higher average interest rates which increased interest income by $4 million.
Interest expense: Total interest expense increased for the year ended December 31, 2024, due to the following:
•Interest on deposits increased $67 million primarily due to higher DTC funding costs driven by higher average balances and higher average interest rates, contributing $52 million and $46 million, respectively, partially offset by lower wholesale funding costs, which decreased $56 million due to lower average balances, offset in part by $25 million due to higher average interest rates.
•Interest on borrowings increased due to higher average interest rates which increased funding costs $39 million, partially offset by lower average borrowings which decreased funding costs by approximately $25 million.
Non-interest income: Total non-interest income decreased for the year ended December 31, 2024, due to the following:
•Interchange revenue, net of retailer share arrangements, typically a contra-revenue item for us, increased during the period, driven by a decrease in merchant discount fees from lower “big ticket” credit sales, and interchange revenue earned, partially offset by a reduction in costs associated with brand partner retailer share arrangements.
•Gain on portfolio sale reflects the gain we recognized from the sale of a credit card loan portfolio in April 2024, that was then subsequently adjusted throughout the remainder of 2024 to recognize an incremental amount due
under the purchase and sale agreement. For 2023, we recognized a gain from the sale of the BJ's Wholesale Club (BJ’s) portfolio in late February 2023.
Provision for credit losses increased for the year ended December 31, 2024, driven by a $92 million reserve release in the current year compared with a $136 million reserve release in the prior year, with the release in the prior year primarily related to the sale of the BJ’s portfolio. The reserve releases in both years were offset by net principal losses of $1.5 billion and $1.4 billion during those same respective periods. Overall, our reserve rate is nominally lower, 11.9% as of December 31, 2024 compared with 12.0% as of December 31, 2023, reflecting conservative weightings on the economic scenarios in our credit reserve modeling given the wide range of potential 2025 macroeconomic outcomes, which we intend to maintain until we see sustained improvement in delinquencies and an improved macroeconomic outlook.
Table 3: Summary of Total Non-interest Expenses
| | | | | | | | | | | | | | | | | | | | | | | | | | | | | | | | | | | | | | | | | |
| Years Ended December 31, | | $ Change | | % Change |
| 2024 | | 2023 | | 2022 | | 2024
to 2023 | | 2023
to 2022 | | 2024
to 2023 | | 2023
to 2022 |
| (Millions, except percentages) | |
| Non-interest expenses | | | | | | | | | | | | | |
| Employee compensation and benefits | $ | 897 | | | $ | 867 | | | $ | 779 | | | $ | 30 | | | $ | 88 | | | 3 | | | 11 | |
| Card and processing expenses | 326 | | | 428 | | | 359 | | | (102) | | | 69 | | | (24) | | | 19 | |
| Information processing and communication | 300 | | | 301 | | | 274 | | | (1) | | | 27 | | | — | | | 10 | |
| Marketing expenses | 147 | | | 161 | | | 180 | | | (14) | | | (19) | | | (9) | | | (10) | |
| Depreciation and amortization | 90 | | | 116 | | | 113 | | | (26) | | | 3 | | | (22) | | | 2 | |
| Other | 300 | | | 219 | | | 227 | | | 81 | | | (8) | | | 36 | | | (3) | |
| Total non-interest expenses | $ | 2,060 | | | $ | 2,092 | | | $ | 1,932 | | | $ | (32) | | | $ | 160 | | | (2) | | | 8 | |
| | | | | | | | | | | | | |
Adjusted total non-interest expenses (1) | $ | 1,953 | | | $ | 2,092 | | | $ | 1,932 | | | $ | (139) | | | $ | 160 | | | (7) | | | 8 | |
__________________________________
(1)Adjusts Total non-interest expenses for the $107 million impact from our repurchased Convertible Notes, included in Other, and therefore represents a Non-GAAP financial measure. See “Non-GAAP Financial Measures” and Table 6: Reconciliation of GAAP to Non-GAAP Financial Measures.
Total Non-interest Expenses
Non-interest expenses: Total non-interest expenses decreased for the year ended December 31, 2024. Adjusted total non-interest expenses, which represents a Non-GAAP financial measure and has been adjusted for the $107 million impact from our repurchased Convertible Notes, decreased for the current year.
•Employee compensation and benefits increased due to higher short-term and long-term incentive compensation, partially offset by ongoing strategic adjustments in customer care staffing, as well as a reduction in demand-based outsourced and contract labor.
•Card and processing expenses decreased due primarily to lower fraud losses, as well as reduced volume-related card and statement costs.
•Marketing expenses decreased due to decreased spending associated with brand partner and BFH joint marketing campaigns, partially offset by higher spending associated with DTC product offerings.
•Depreciation and amortization decreased due to lower amortization for developed technology associated with an acquisition completed in late 2020.
•Other increased primarily related to the impact from our repurchased Convertible Notes; excluding that impact Other expenses decreased due to decreased legal and other business activity costs.
Income Taxes
The Provision for income taxes decreased for the year ended December 31, 2024, primarily driven by a $587 million decrease in Income from continuing operations before income taxes in 2024. The effective tax rate was 26.7% and 23.8% for the years ended December 31, 2024 and 2023, respectively. The increase in the effective tax rate resulted from an
increase in non-deductible items in the current year period related to the non-deductible portion of our repurchased Convertible Notes transactions, offset in part by discrete tax benefits, primarily related to favorable audit resolutions.
Discontinued Operations
The Loss from discontinued operations, net of income taxes includes amounts that relate to the previously disclosed discontinued operations associated with the spinoff of our former LoyaltyOne segment in 2021 and the sale of our former Epsilon segment in 2019, and primarily relate to contractual indemnification and tax-related matters. For additional information refer to Note 22, “Discontinued Operations and Bank Holding Company Financial Presentation” to the Consolidated Financial Statements included in our Annual Report on Form 10-K for the year ended December 31, 2021.
Table 4: Summary Financial Highlights – Continuing Operations
| | | | | | | | | | | | | | | | | | | | | | | | | | | | | |
| As of or for the Years Ended December 31, | | % Change |
| 2024 | | 2023 | | 2022 | | 2024
to 2023 | | 2023
to 2022 |
| (Millions, except per share amounts and percentages) | |
| Credit sales | $ | 26,962 | | | $ | 28,900 | | | $ | 32,883 | | | (7) | | | (12) | |
PPNR (1) | 1,778 | | | 2,197 | | | 1,894 | | | (19) | | | 16 | |
PPNR excluding gain on portfolio sale and impact from repurchased Convertible Notes (1) | 1,874 | | | 1,967 | | | 1,894 | | | (5) | | | 4 | |
| Average credit card and other loans | 18,084 | | | 18,216 | | | 17,768 | | | (1) | | | 3 | |
| End-of-period credit card and other loans | 18,896 | | | 19,333 | | | 21,365 | | | (2) | | | (10) | |
| End-of-period direct-to-consumer deposits | 7,687 | | | 6,454 | | | 5,466 | | | 19 | | | 18 | |
| | | | | | | | | |
Return on average assets (2) | 1.3 | % | | 3.3 | % | | 1.0 | % | | (2.0) | | | 2.3 | |
Return on average equity (3) | 8.7 | % | | 27.1 | % | | 9.8 | % | | (18.4) | | | 17.3 | |
Return on average tangible common equity (4) | 11.4 | % | | 38.0 | % | | 14.2 | % | | (26.6) | | | 23.8 | |
| | | | | | | | | |
Net interest margin (5) | 18.3 | % | | 19.5 | % | | 19.2 | % | | (1.2) | | | 0.3 | |
Loan yield (6) | 26.7 | % | | 27.2 | % | | 26.0 | % | | (0.5) | | | 1.2 | |
| | | | | | | | | |
Efficiency ratio (7) | 53.7 | % | | 48.8 | % | | 50.5 | % | | 4.9 | | | (1.7) | |
| | | | | | | | | |
Double leverage ratio (8) | 104.7 | % | | 123.9 | % | | 183.6 | % | | (19.2) | | | (59.7) | |
Common equity tier 1 capital ratio (9) | 12.4 | % | | 12.2 | % | | 8.7 | % | | 0.2 | | | 3.5 | |
Total risk-based capital ratio (10) | 13.8 | % | | 13.6 | % | | 10.1 | % | | 0.2 | | | 3.5 | |
Total risk-weighted assets (11) | $ | 19,928 | | | $ | 20,140 | | | $ | 22,065 | | | (1.1) | | | (8.7) | |
Tangible common equity / Tangible assets ratio (TCE/TA) (12) | 10.4 | % | | 9.6 | % | | 6.0 | % | | 0.8 | | | 3.6 | |
Tangible book value per common share (13) | $ | 46.97 | | | $ | 43.70 | | | $ | 29.42 | | | 7.5 | | | 48.5 | |
| | | | | | | | | |
Payment rate (14) | 15.0 | % | | 14.5 | % | | 16.4 | % | | 0.5 | | | (1.9) | |
| | | | | | | | | |
Delinquency rate (15) | 5.9 | % | | 6.5 | % | | 5.5 | % | | (0.6) | | | 1.0 | |
Net loss rate (16) | 8.2 | % | | 7.5 | % | | 5.4 | % | | 0.7 | | | 2.1 | |
Reserve rate (17) | 11.9 | % | | 12.0 | % | | 11.5 | % | | (0.1) | | | 0.5 | |
______________________________
Note: Beginning in 2024, we revised the calculation of average balances to more closely align with industry practice by incorporating an average daily balance. Prior to 2024, average balances represent the average balance at the beginning and end of each month, averaged over the periods indicated.
(1)PPNR represents Income from continuing operations before income taxes and the Provision for credit losses. PPNR is a Non-GAAP financial measure. PPNR excluding gain on portfolio sale and impact from repurchased Convertible Notes excludes from PPNR the gain on any portfolio sale in the period, as well as the impact from our repurchased Convertible Notes in the period, and is also a Non-GAAP financial measure. See “Non-GAAP Financial Measures” and Table 6: Reconciliation of GAAP to Non-GAAP Financial Measures.
(2)Return on average assets represents annualized Income from continuing operations divided by average Total assets.
(3)Return on average equity represents annualized Income from continuing operations divided by average Total stockholders’ equity.
(4)Return on average tangible common equity (ROTCE) represents annualized Income from continuing operations divided by average Tangible common equity. Tangible common equity (TCE) represents Total stockholders' equity reduced by Goodwill and intangible assets, net. ROTCE is a Non-GAAP financial measure. See “Non-GAAP Financial Measures” and Table 6: Reconciliation of GAAP to Non-GAAP Financial Measures.
(5)Net interest margin represents annualized Net interest income divided by average Total interest-earning assets. See also Table 5: Net Interest Margin.
(6)Loan yield represents annualized Interest and fees on loans divided by Average credit card and other loans.
(7)Efficiency ratio represents Total non-interest expenses divided by Total net interest and non-interest income.
(8)Double leverage ratio represents Parent Company investment in subsidiaries divided by BFH consolidated equity.
(9)Common equity tier 1 capital ratio represents tier 1 capital divided by total risk-weighted assets. In the calculation of tier 1 capital, we follow the Basel III Standardized Approach and therefore Total stockholders' equity has been reduced, primarily by Goodwill and intangible assets, net. For additional information, see “Legislative, Regulatory Matters and Capital Adequacy” included elsewhere in this report.
(10)Total risk-based capital ratio represents total capital divided by total risk-weighted assets. In the calculation of total capital, we follow the Basel III Standardized Approach and therefore tier 1 capital has been increased by tier 2 capital, which for us is the allowable portion of the Allowance for credit losses. For additional information, see “Legislative, Regulatory Matters and Capital Adequacy” included elsewhere in this report.
(11)Total risk-weighted assets are generally measured by allocating assets, and specified off-balance sheet exposures, to various risk categories as defined by the Basel III Standardized Approach. For additional information, see “Legislative, Regulatory Matters and Capital Adequacy” included elsewhere in this report.
(12)Tangible common equity over tangible assets (TCE/TA) represents TCE divided by Tangible assets (TA), which is Total assets reduced by Goodwill and intangible assets, net. TCE/TA is a Non-GAAP financial measure. See “Non-GAAP Financial Measures” and Table 6: Reconciliation of GAAP to Non-GAAP Financial Measures.
(13) Tangible book value per common share represents TCE divided by shares outstanding and is a Non-GAAP financial measure. See “Non-GAAP Financial Measures” and Table 6: Reconciliation of GAAP to Non-GAAP Financial Measures.
(14)Payment rate represents consumer payments during the last month of the period, divided by the beginning-of-month Credit card and other loans, including held for sale in applicable periods.
(15)Delinquency rate represents outstanding balances that are contractually delinquent (i.e., principal balances greater than 30 days past due) as of the end of the period, divided by the outstanding principal amount of Credit card and other loans as of the same period-end.
(16)Net loss rate, an annualized rate, represents net principal losses for the period divided by Average credit card and other loans for the same period. Net loss rate for the years ended December 31, 2023 and 2022 were impacted by the transition of our credit card processing services in June 2022.
(17)Reserve rate represents the Allowance for credit losses divided by End-of-period credit card and other loans.
Table 5: Net Interest Margin
| | | | | | | | | | | | | | | | | |
| Year Ended December 31, 2024 |
| Average Balance(1) | | Interest Income / Expense | | Average Yield / Rate |
| (Millions, except percentages) | |
| Cash and investment securities | $ | 4,116 | | | $ | 204 | | | 4.96 | % |
| Credit card and other loans | 18,084 | | | 4,820 | | | 26.65 | % |
| Total interest-earning assets | 22,200 | | | 5,024 | | | 22.63 | % |
| | | | | |
| Direct-to-consumer (retail) deposits | 7,174 | | | 349 | | | 4.86 | % |
| Wholesale deposits | 5,919 | | | 259 | | | 4.38 | % |
| Interest-bearing deposits | 13,093 | | | 608 | | | 4.64 | % |
| | | | | |
| Secured borrowings | 3,576 | | | 236 | | | 6.58 | % |
| Unsecured borrowings | 1,247 | | | 116 | | | 9.33 | % |
| Interest-bearing borrowings | 4,823 | | | 352 | | | 7.29 | % |
| Total interest-bearing liabilities | 17,916 | | | 960 | | | 5.36 | % |
| | | | | |
| Net interest income | | | $ | 4,064 | | | |
| | | | | |
Net interest margin (2) | | | 18.3 | % | | |
| | | | | | | | | | | | | | | | | |
| Year Ended December 31, 2023 |
| Average Balance (1) | | Interest Income / Expense | | Average Yield / Rate |
| (Millions, except percentages) | |
| Cash and investment securities | $ | 3,707 | | | $ | 184 | | | 4.95 | % |
| Credit card and other loans | 18,216 | | | 4,961 | | | 27.23 | % |
| Total interest-earning assets | 21,923 | | | 5,145 | | | 23.47 | % |
| | | | | |
| Direct-to-consumer (retail) deposits | 5,936 | | | 251 | | | 4.23 | % |
| Wholesale deposits | 7,332 | | | 290 | | | 3.96 | % |
| Interest-bearing deposits | 13,268 | | | 541 | | | 4.08 | % |
| | | | | |
| Secured borrowings | 3,440 | | | 227 | | | 6.61 | % |
| Unsecured borrowings | 1,629 | | | 111 | | | 6.80 | % |
| Interest-bearing borrowings | 5,069 | | | 338 | | | 6.67 | % |
| Total interest-bearing liabilities | 18,337 | | | 879 | | | 4.79 | % |
| | | | | |
| Net interest income | | | $ | 4,266 | | | |
| | | | | |
Net interest margin (2) | | | 19.5 | % | | |
______________________________
(1)Beginning in 2024, we revised the calculation of average balances to more closely align with industry practice by incorporating an average daily balance. Prior to 2024, average balances represent the average balance at the beginning and end of each month, averaged over the periods indicated.
(2)Net interest margin represents annualized Net interest income divided by average Total interest-earning assets.
Table 6: Reconciliation of GAAP to Non-GAAP Financial Measures
| | | | | | | | | | | | | | | | | | | | | | | | | | | | | |
| Years Ended December 31, | | % Change |
| 2024 | | 2023 | | 2022 | | 2024
to 2023 | | 2023
to 2022 |
| (Millions, except per share amounts and percentages) | |
| Adjusted net income | | | | | | | | | |
| Net income | $ | 277 | | | $ | 718 | | | $ | 223 | | | (61) | | | 222 | |
| Impact from repurchased Convertible Notes | 104 | | | — | | | — | | | nm | | — | |
| Adjusted net income | $ | 381 | | | $ | 718 | | | $ | 223 | | | (47) | | | 222 | |
| | | | | | | | | |
| Adjusted net income per diluted share | | | | | | | | | |
| Net income per diluted share | $ | 5.49 | | | $ | 14.34 | | | $ | 4.46 | | | (62) | | | 222 | |
| Impact from repurchased Convertible Notes | $ | 2.06 | | | $ | — | | | $ | — | | | nm | | — | |
| Adjusted net income per diluted share | $ | 7.55 | | | $ | 14.34 | | | $ | 4.46 | | | (47) | | | 222 | |
| | | | | | | | | |
| Adjusted income from continuing operations per diluted share | | | | | | | | | |
| Income from continuing operations per diluted share | $ | 5.54 | | | $ | 14.74 | | | $ | 4.47 | | | (62) | | | 230 | |
| Impact from repurchased Convertible Notes | $ | 2.06 | | | $ | — | | | $ | — | | | nm | | — | |
| Adjusted income from continuing operations per diluted share | $ | 7.60 | | | $ | 14.74 | | | $ | 4.47 | | | (48) | | | 230 | |
| | | | | | | | | |
| Adjusted total non-interest expenses | | | | | | | | | |
| Total non-interest expenses | $ | 2,060 | | | $ | 2,092 | | | $ | 1,932 | | | (2) | | | 8 | |
| Impact from repurchased Convertible Notes | 107 | | | — | | | — | | | nm | | — | |
| Adjusted total non-interest expenses | 1,953 | | | 2,092 | | | 1,932 | | | (7) | | | 8 | |
| | | | | | | | | |
| Pretax pre-provision earnings (PPNR) | | | | | | | | | |
| Income from continuing operations before income taxes | 381 | | | 968 | | | 300 | | | (61) | | | 223 | |
| Provision for credit losses | 1,397 | | | 1,229 | | | 1,594 | | | 14 | | | (23) | |
| Pretax pre-provision earnings (PPNR) | 1,778 | | | 2,197 | | | 1,894 | | | (19) | | | 16 | |
| Less: Gain on portfolio sale | (11) | | | (230) | | | — | | | (95) | | | nm |
| Add: Impact from repurchased Convertible Notes | 107 | | | — | | | — | | | nm | | — | |
| PPNR excluding gain on portfolio sale and impact from repurchased Convertible Notes | 1,874 | | | 1,967 | | | 1,894 | | | (5) | | | 4 | |
| | | | | | | | | |
| Average tangible common equity | | | | | | | | | |
| Average total stockholders’ equity | 3,214 | | | 2,722 | | | 2,286 | | | 18 | | | 19 | |
| Less: Average goodwill and intangible assets, net | (753) | | | (780) | | | (716) | | | (4) | | | 9 | |
| Average tangible common equity | 2,461 | | | 1,942 | | | 1,570 | | | 27 | | | 24 | |
| | | | | | | | | |
| Tangible common equity (TCE) | | | | | | | | | |
| Total stockholders’ equity | 3,051 | | | 2,918 | | | 2,265 | | | 5 | | | 29 | |
| Less: Goodwill and intangible assets, net | (746) | | | (762) | | | (799) | | | (2) | | | (5) | |
| Tangible common equity (TCE) | $ | 2,305 | | | $ | 2,156 | | | $ | 1,466 | | | 7 | | | 47 | |
| | | | | | | | | |
| | | | | | | | | | | | | | | | | | | | | | | | | | | | | |
| Years Ended December 31, | | % Change |
| 2024 | | 2023 | | 2022 | | 2024
to 2023 | | 2023
to 2022 |
| Tangible assets (TA) | | | | | | | | | |
| Total assets | $ | 22,891 | | | $ | 23,141 | | | $ | 25,407 | | | (1) | | | (9) | |
| Less: Goodwill and intangible assets, net | (746) | | | (762) | | | (799) | | | (2) | | | (5) | |
| Tangible assets (TA) | $ | 22,145 | | | $ | 22,379 | | | $ | 24,608 | | | (1) | | | (9) | |
______________________________(nm) Not meaningful, denoting a variance of 1,000 percent or more.
ASSET QUALITY
Given the nature of our business, the credit quality of our assets, in particular our Credit card and other loans, is a key determinant underlying our ongoing financial performance and overall financial condition. When it comes to our Credit card and other loans portfolio, we closely monitor Delinquency rates and Net principal loss rates, which reflect, among other factors, our underwriting, the inherent credit risk in our portfolio and the success of our collection and recovery efforts. These rates also reflect, more broadly, the general macroeconomic conditions, including the compounding effect of persistent inflation relative to wage growth, and higher interest rates. Our Delinquency and Net principal loss rates are also impacted by the size of our Credit card and other loans portfolio, which serves as the denominator in the calculation of these rates. Accordingly, changes in the size of our portfolio (whether due to credit tightening, acquisitions or dispositions of portfolios or otherwise) may cause movements in our Delinquency and Net principal loss rates that are not necessarily indicative of the underlying credit quality of the overall portfolio.
Delinquencies: An account is contractually delinquent if we do not receive the minimum payment due by the specified due date. Our policy is to continue to accrue interest and fee income on all accounts, except in limited circumstances, until the balance and all related interest and fees are paid or charged-off. After an account becomes 30 days past due, a proprietary collection scoring algorithm automatically scores the risk of the account becoming further delinquent; based upon the level of risk indicated, a collection strategy is deployed. If after exhausting all in-house collection efforts we are unable to collect on the account, we may engage collection agencies or outside attorneys to continue those efforts, or sell the charged-off balances.
The Delinquency rate is calculated by dividing outstanding principal balances that are contractually delinquent (i.e., principal balances greater than 30 days past due) as of the end of the period, by the outstanding principal amount of Credit card and other loans as of the same period-end.
The following table provides the delinquency trends on our Credit card and other loans portfolio based on the principal balances outstanding as of December 31:
Table 7: Delinquency Trends on Credit Card and Other Loans
| | | | | | | | | | | | | | | | | | | | | | | |
| 2024 | | % of
Total | | 2023 | | % of
Total |
| (Millions, except percentages) | |
| Credit card and other loans outstanding ─ principal | $ | 17,418 | | | 100.0 | % | | $ | 17,906 | | | 100.0 | % |
| Outstanding balances contractually delinquent: | | | | | | | |
| 31 to 60 days | $ | 299 | | | 1.7 | % | | $ | 346 | | | 1.9 | % |
| 61 to 90 days | $ | 223 | | | 1.3 | % | | $ | 250 | | | 1.4 | % |
| 91 or more days | $ | 512 | | | 2.9 | % | | $ | 567 | | | 3.2 | % |
| Total | $ | 1,034 | | | 5.9 | % | | $ | 1,163 | | | 6.5 | % |
______________________________
As part of our collections strategy, we may offer temporary and short term programs in order to improve the likelihood of collections and meet the needs of our customers. For example, as a result of hurricanes Helene and Milton in 2024 we froze delinquency progression for cardholders in FEMA identified impact zones for one billing cycle. Our modifications, for customers who have requested assistance and meet certain qualifying requirements, come in the form of reduced payment
requirements, interest rate reductions and late fee waivers. We do not offer programs involving the forgiveness of principal. These temporary loan modifications may assist in cases where we believe the customer will recover from the short-term hardship and resume scheduled payments. Under these consumer relief programs, those accounts receiving relief may not advance to the next delinquency cycle, including charge-off, in the same time frame that would have occurred had the relief not been granted. We evaluate our consumer relief programs to determine if they represent a more than insignificant delay in payment granted to borrowers experiencing financial difficulty, in which case they would then be considered a Loan Modification. For additional information, see Note 2 “Credit Card and Other Loans – Modified Credit Card Loans” to our audited Consolidated Financial Statements.
Net Principal Losses: Our net principal losses include the principal amount of losses that are deemed uncollectible, less recoveries, and exclude charged-off interest, fees and third-party fraud losses (including synthetic fraud). Charged-off interest and fees reduce Interest and fees on loans, while third-party fraud losses are recorded in Card and processing expenses. Our credit card loans, including unpaid interest and fees, are generally charged-off in the month during which an account becomes 180 days past due. Our pay-over-time products, which include installment loans and “split-pay” offerings, including unpaid interest, are generally charged-off when a loan becomes 120 days past due. However, in the case of a customer bankruptcy or death, Credit card and other loans, including unpaid interest and fees, as applicable, are charged-off 60 days after receipt of the notification of the bankruptcy or death, but in any case no later than 180 days past due for credit card loans and 120 days past due for installment loans and “split-pay” offerings.
The Net principal loss rate is calculated by dividing net principal losses for the period by the Average credit card and other loans for the same period. Beginning in January 2024, we revised the calculation of Average credit card and other loans to more closely align with industry practice by incorporating an average daily balance. Prior to 2024, Average credit card and other loans represent the average balance of the loans at the beginning and end of each month, averaged over the periods indicated. The following table provides our net principal losses for the periods presented:
Table 8: Net Principal Losses on Credit Card and Other Loans
| | | | | | | | | | | | | | | | | |
| 2024 | | 2023 | | 2022 |
| (Millions, except percentages) | |
Average credit card and other loans | $ | 18,084 | | | $ | 18,216 | | | $ | 17,768 | |
Net principal losses (1)(2) | 1,489 | | | 1,365 | | | 968 | |
Net principal losses as a percentage of average credit card and other loans (1)(2) | 8.2 | % | | 7.5 | % | | 5.4 | % |
______________________________
(1)As a result of hurricanes Helene and Milton we froze delinquency progression for cardholders in FEMA identified impact zones for one billing cycle, which resulted in modestly lower Net principal losses and Net principal losses as a percentage of average credit card and other loans in the fourth quarter of 2024, and consequently these actions will negatively impact Net principal losses and Net principal losses as a percentage of average credit card and other loans in the second quarter of 2025.
(2)Net principal losses and Net principal losses as a percentage of average credit card and other loans for December 31, 2023 and 2022 were impacted by the transition of our credit card processing services in June 2022.
CONSOLIDATED LIQUIDITY AND CAPITAL RESOURCES
Overview
We maintain a strong focus on liquidity and capital. Our funding, liquidity and capital policies are designed to ensure that our business has sufficient liquidity and capital resources necessary to support our daily operations, our business growth, and our credit ratings related to our Parent Company’s senior unsecured notes and our public secured financings, and meet our regulatory and policy requirements, including capital and leverage ratio requirements applicable to Comenity Bank (CB) and Comenity Capital Bank (CCB) under FDIC regulations, in a cost effective and prudent manner through both expected and unexpected market environments. We also monitor our Double Leverage Ratio, which reflects our Parent Company’s investment in its subsidiaries relative to its consolidated equity, and is often used by regulators and other stakeholders as a measure of the use of debt by a parent entity to fund its subsidiaries.
Our primary sources of liquidity include cash generated from operating activities, our bank credit facility, issuances of senior unsecured or convertible debt securities by our Parent Company, financings through our securitization programs, and deposits with the Banks. More broadly, we continuously evaluate opportunities to renew and expand our various sources of liquidity. We aim to satisfy our financing needs with a diverse set of funding sources, and we seek to maintain
diversity of funding sources by type of instrument, by tenor and by investor base, among other factors, which we believe will mitigate the impact of disruptions in any one type of instrument, tenor or investor.
Our primary uses of liquidity are for underwriting Credit card and other loans, scheduled payments of principal and interest on our debt, operational expenses, capital expenditures, including digital and product innovation and technology enhancements, stock repurchases and dividends.
We may from time to time retire or purchase our outstanding debt or convertible debt securities through redemptions, cash purchases or exchanges for other securities, in open market purchases, tender offers, privately negotiated transactions or otherwise. Such repurchases or exchanges would depend on prevailing market conditions, our liquidity requirements, contractual restrictions and other factors, and may be funded through cash on hand, borrowings under our revolving credit facility, the issuance of debt or convertible debt securities or other sources of liquidity. The amounts involved may be material.
We will also need additional financing in the future to repay or refinance our existing debt at or prior to maturity, and to fund our growth, which may include issuance of additional debt, equity or convertible securities or engaging in other capital markets or financing transactions. As part of our financing strategy, we will continue to seek to optimize our capital structure, which may include one or more offerings of subordinated debt or other instruments that may allow for a more efficient use of capital while maintaining appropriate amounts of regulatory capital. Given the maturities of certain of our outstanding debt instruments and the macroeconomic outlook, it is possible that we will be required to repay, extend or refinance some or all of our maturing debt in volatile and/or unfavorable markets.
Because of the alternatives available to us, as discussed above, we believe our short-term and long-term sources of liquidity are adequate to fund not only our current operations, but also our near-term and long-term funding requirements including dividend payments, debt service obligations and repayment of debt maturities and other amounts that may ultimately be paid in connection with contingencies. However, the adequacy of our liquidity could be impacted by various factors, including pending or future legislation, regulation or litigation, macroeconomic conditions and volatility in the financial and capital markets, limiting our access to or increasing our cost of capital, which could make capital unavailable, or available but on terms that are unfavorable to us. These factors could significantly reduce our financial flexibility and cause us to contract or not grow our business, which could have a material adverse effect on our results of operations and financial condition.
We have a robust liquidity risk management framework in place which includes ongoing monitoring of our liquidity and funding positions against our risk appetite metrics and key risk indicators. During times where there may be potential risks from adverse developments in the banking industry and/or increased financial sector volatility, we may invoke our contingency funding plan to enhance daily monitoring of our liquidity and funding positions, determine potential mitigating actions if necessary and provide enhanced reporting to our Boards of Directors, at both the Bread Financial and Bank-levels, and regulators.
We maintain a significant majority of our liquidity portfolio on deposit within the Federal Reserve banking system, and we also have a small investment securities portfolio, classified as available-for-sale, which we hold in relation to the Community Reinvestment Act. We do not have any investment securities classified as held-to-maturity.
Credit Ratings
In November 2023, we obtained credit ratings for our Parent Company from the major credit rating agencies, Moody’s Investor Services (Moody’s), Standard & Poor’s (S&P) and Fitch Ratings (Fitch), in order to facilitate debt financings and broaden the investor base for our Parent Company debt securities.
Our management approach is designed, among other things, to maintain appropriate and stable Parent Company senior unsecured debt ratings from the credit rating agencies which help support our access to cost-effective unsecured funding as a component of our overall liquidity and capital resources.
The table below provides a summary of the credit ratings for the senior unsecured long-term debt of Bread Financial Holdings, Inc. as of December 31, 2024:
| | | | | | | | | | | | | | | | | |
| Bread Financial Holdings, Inc. | Moody’s | | S&P | | Fitch |
| Senior unsecured debt | Ba3 | | BB- | | BB- |
| Outlook | Positive | | Stable | | Positive |
During the fourth quarter of 2024 both Moody’s and Fitch upgraded their credit ratings outlook from “Stable” to “Positive”.
We also seek to maintain appropriate and stable credit ratings for our credit card securitizations issued through World Financial Network Credit Card Master Note Trust (WFNMNT) from the rating agencies (DBRS, S&P and Fitch). The table below provides a summary of the structured finance credit ratings for certain of the asset-backed securities, specifically the Class A notes of WFNMNT as of December 31, 2024:
| | | | | | | | | | | | | | | | | |
| WFNMNT | DBRS | | S&P | | Fitch |
| Class A notes | AAA | | AAA | | AAA |
Credit ratings are not a recommendation to buy or hold any securities and they may be revised or revoked at any time at the sole discretion of the rating agency. Downgrades in the ratings of our unsecured or secured debt could result in higher funding costs, as well as reductions in our borrowing capacity in the unsecured or secured debt markets. We believe our mix of funding, including the proportion of our DTC and wholesale deposits, to total funding, reduces the impact that a credit rating downgrade could have on our funding costs and capacity.
Funding Sources
As referenced above, our primary sources of liquidity include cash generated from operating activities, our bank credit facility, issuances of senior unsecured or convertible debt securities by our Parent Company, financings through our securitization programs, and deposits with the Banks.
Throughout 2024, we engaged in a number of financing-related transactions, including offering additional 9.750% Senior Notes due 2029, reducing our Parent Company debt, amending our Revolving Credit Facility to extend the maturity date, entering into separate privately negotiated repurchase agreements with a limited number of holders of our 4.25% Convertible Senior Notes Due 2028, and offering asset-backed term notes through one of our securitization trusts. Each of these transactions, as well as other matters relating to our liquidity and capital resources during the year, are described in more detail below. Further, in January 2025, with cash on hand we redeemed the remaining $100 million in aggregate principal amount of our Senior Notes due 2026.
Certain of our long-term debt agreements include various restrictive financial and non-financial covenants. If we do not comply with certain of these covenants and an event of default occurs and remains uncured, the maturity of amounts outstanding may be accelerated and become payable, and, with respect to our credit agreement, the associated commitments may be terminated. As of December 31, 2024, we were in compliance with all such covenants.
Credit Agreement
In June 2023, we entered into our credit agreement with Parent Company, as borrower, certain of our domestic subsidiaries, as guarantors, JPMorgan Chase Bank, N.A., as administrative agent and lender, and various other financial institutions, as lenders, which provides for a $700 million senior unsecured revolving credit facility (the Revolving Credit Facility). In October 2024, we amended our Revolving Credit Facility to extend the maturity date to October 2028, as well as to delete the provisions relating to our prior term loan facility (which was repaid in full and terminated in December 2023) and make certain other amendments. As of December 31, 2024, our Revolving Credit Facility was undrawn and all $700 million remained available for future borrowings under the Revolving Credit Facility.
4.25% Convertible Senior Notes Due 2028
In June 2023, we issued and sold $316 million aggregate principal amount of 4.25% Convertible Senior Notes due 2028 (the Convertible Notes). The Convertible Notes bear interest at an annual rate of 4.25%, payable semi-annually in arrears on June 15 and December 15 of each year. The Convertible Notes mature on June 15, 2028, unless earlier repurchased, redeemed or converted.
In connection with the issuance of the Convertible Notes, we entered into privately negotiated capped call (Capped Call) transactions with certain financial institution counterparties. These transactions are expected generally to reduce potential dilution to our common stock upon any conversion of Convertible Notes and/or offset any cash payments we are required to make in excess of the principal amount of the Convertible Notes, with such reduction and/or offset subject to a cap, based on the cap price. For additional information on the issuance of Convertible Notes and Capped Call transactions, see Note 10, “Borrowings of Long-Term and Other Debt,” to the audited Consolidated Financial Statements.
In August 2024 we entered into separate, privately-negotiated repurchase agreements with a limited number of Convertible Note holders to repurchase $238 million aggregate principal amount of outstanding Convertible Notes (the August Repurchases). Subsequently, in September and November of 2024, certain holders of Convertible Notes separately approached us to repurchase Convertible Notes, and we entered into additional separate, privately-negotiated repurchase agreements with such holders of Convertible Notes, repurchasing $68 million aggregate principal amount of outstanding Convertible Notes (the Subsequent Repurchases and, together with the August Repurchases, the Repurchases). The final aggregate purchase price, or settlement value, for the Repurchases was $486 million, which was funded with cash on hand. In connection with the Repurchases, we recognized a $107 million inducement expense in Other non-interest expenses representing the total settlement value, inclusive of transaction fees, in excess of the total conversion value (calculated in accordance with the indenture governing the Convertible Notes), as well as an $88 million reduction in Additional paid-in capital (APIC) related to the total conversion value paid in excess of the carrying value of the Convertible Notes repurchased and a deferred tax impact.
Following the settlement of these repurchases, $10 million of Convertible Notes remained outstanding as of December 31, 2024. We may, from time to time, seek to retire or repurchase our remaining outstanding Convertible Notes through cash purchases or exchanges for other securities, in open market purchases, tender offers, privately negotiated transactions or otherwise.
During the fourth quarter of 2024, the Convertible Notes became convertible at the option of the holders (and the Convertible Notes have remained convertible during the first quarter of 2025) due to the last reported sales price per share of Parent Company’s common stock having exceeded 130% of the conversion price for each of at least 20 trading days, whether or not consecutive, during the 30 consecutive trading days ending on, and including, the last trading day of the immediately preceding quarter (i.e., the quarters ended September 30, 2024 and December 31, 2024) (the Common Stock Sale Price Condition). The Common Stock Sale Price Condition is remeasured each quarter, so the Convertible Notes may continue or cease to be convertible in future quarters depending on the performance of our stock price. Upon any such conversion, we will pay cash up to the aggregate principal amount of the Convertible Notes to be converted and pay or deliver, as the case may be, cash, shares of our common stock, or a combination of cash and shares of our common stock (at our election), in respect of the remainder, if any, of our conversion obligation in excess of the aggregate principal amount of the Convertible Notes being converted. As of the date of this report, we have not received any conversion requests.
All of the Capped Call transactions continue to remain outstanding, notwithstanding the repurchases noted above. Although we do not trade or speculate in derivatives, we may seek to opportunistically terminate the Capped Call transactions (in full or in part from time to time) or leave the Capped Call transactions outstanding, possibly until maturity, in any such case with the objective of optimizing the shareholder value we receive under these transactions.
9.750% Senior Notes due 2029
In January 2024, we issued and sold an additional $300 million aggregate principal amount of 9.750% Senior Notes due 2029 (Senior Notes due 2029) at an issue price of 101.00% of principal plus accrued interest from December 22, 2023. The Senior Notes due 2029 issued in January 2024 were issued as additional notes under the same indenture pursuant to which the initial $600 million of Senior Notes due 2029 were issued in December 2023. The Senior Notes due 2029 that were issued in both December 2023 and January 2024 constitute a single series of notes and have the same terms, other than the issue date and issue price. We used the proceeds of the January 2024 offering of Senior Notes due 2029, together with
$100 million of cash on hand, to fund the redemption of $400 million in aggregate principal amount of our outstanding 7.000% Senior Notes due 2026.
Deposits
We utilize a variety of deposit products to finance our operating activities, including funding for our non-securitized credit card and other loans, and to fund the securitization enhancement requirements of the Banks. We offer DTC retail deposit products, including Individual Retirement Accounts that we began offering in June 2024, as well as deposits sourced through contractual arrangements with various financial counterparties (often referred to as wholesale deposits, and includes brokered deposits). Across both our retail and wholesale deposits, the Banks offer various non-maturity deposit products that are generally redeemable on demand by the customer, and as such have no scheduled maturity date. The Banks also issue certificates of deposit with scheduled maturity dates ranging between January 2025 and December 2029, in denominations of at least $1,000, on which interest is paid either monthly or at maturity. The following table summarizes our retail and wholesale deposit products by type and associated attributes as of December 31:
Table 9: Deposits
| | | | | | | | | | | |
| 2024 | | 2023 |
| (Millions, except percentages) | |
| Deposits | | | |
| Direct-to-consumer (retail) | $ | 7,687 | | | $ | 6,454 | |
| Wholesale | 5,368 | | | 7,140 | |
| Total deposits | $ | 13,055 | | | $ | 13,594 | |
| | | |
| Non-maturity deposit products | | | |
| Non-maturity deposits | $ | 6,827 | | | $ | 6,597 | |
| Interest rate range | 0.70% - 4.75% | | 0.70% - 5.64% |
| Weighted-average interest rate | 4.16 | % | | 4.78 | % |
| | | |
| Certificates of deposit | | | |
| Certificates of deposit | $ | 6,228 | | | $ | 6,997 | |
| Interest rate range | 0.80% - 5.7% | | 0.50% - 5.70% |
| Weighted-average interest rate | 4.64 | % | | 4.50 | % |
As of December 31, 2024 and 2023, deposits that exceeded applicable FDIC insurance limits, which are generally $250,000 per depositor, per insured bank, per ownership category, were estimated to be $574 million (4% of Total deposits) and $509 million (4% of Total deposits), respectively. The measurement of estimated uninsured deposits aligns with regulatory guidelines.
Overall, we continue to improve our funding mix through actions taken to grow our DTC deposits and reduce our Parent Company unsecured borrowings, while maintaining the flexibility of secured, unsecured, and wholesale funding. Efforts undertaken in 2024 to reduce our long-term unsecured debt, along with typical seasonality of credit card and other loan balance pay downs in the first quarter of each year, lowered our funding requirements by approximately $0.3 billion from year-end 2023. As a result, we opportunistically reduced our wholesale and brokered deposits, repurchased a portion of our outstanding Convertible Notes and paid down a portion of our secured conduit line balances, shown further below.
Securitization Programs Including Conduit Facilities
We sell the majority of the credit card loans originated by the Banks to certain of our master trusts (the Trusts). These securitization programs are a principal vehicle through which we finance the Banks’ credit card loans. For this purpose, we use a combination of public term asset-backed notes and private conduit facilities (the Conduit Facilities) with a consortium of lenders, including domestic money center, regional and international banks. Both our public term asset-backed notes and borrowings under the Conduit Facilities are included in Debt issued by consolidated VIEs in the Consolidated Balance Sheets.
The table below summarizes our conduit capacities, borrowings and maturities for the periods presented:
Table 10: Conduit Borrowing Capacity Rollforward and Maturities
| | | | | | | | | | | | | | | | | | | | | | | | | | | | | | | | | | | | | | |
| (Millions) | | December 31, 2023 | | Commitment | | December 31, 2024 | | |
| Conduit Facilities | | Capacity | | Drawn (6) | | Change | | Capacity | | Drawn (6) | | Maturity Date (7) |
| Comenity Bank | | | | | | | | | | | | |
WFNMNT 2009-VFN (1) | | $ | 2,650 | | | $ | 2,015 | | | $ | — | | | $ | 2,650 | | | $ | 1,955 | | | October 2025 |
WFNMT 2009-VFC1 (2) | | 275 | | | 260 | | | (275) | | | — | | | 141 | | | — | |
| Comenity Capital Bank | | | | | | | | | | | | |
WFCMNT 2009-VFN (3) | | 2,250 | | | 1,025 | | | — | | | 2,250 | | | 867 | | | February 2025 |
CCAST 2023-VFN1 (4) | | 250 | | | 250 | | | — | | | 250 | | | 250 | | | September 2025 |
CCAST 2024-VFN1 (5) | | — | | | — | | | 200 | | | 200 | | | — | | | February 2025 |
| Total | | $ | 5,425 | | | $ | 3,550 | | | $ | (75) | | | $ | 5,350 | | | $ | 3,213 | | | |
__________________________________
(1)2009-VFN Conduit issued under World Financial Network Credit Card Master Note Trust (WFNMNT).
(2)2009-VFC1 Conduit issued under World Financial Network Credit Card Master Trust III (WFNMT). In October 2024, the revolving period of the 2009-VFC1 Conduit expired and the Conduit Facility entered controlled amortization, meaning the period in which principal collections are accumulated to pay down the outstanding principal amount of the notes issued under the Conduit Facility.
(3)2009-VFN Conduit issued under World Financial Capital Master Note Trust (WFCMNT). In February 2025, the 2009-VFN Conduit commitment will be reduced by $250 million to $2 billion, and the Maturity Date will be extended to February 2026.
(4)2023-VFN1 Conduit issued under Comenity Capital Asset Securitization Trust (CCAST).
(5)2024-VFN1 Conduit issued under CCAST. In February 2025, the 2024-VFN1 Conduit will be retired pursuant to the terms of a termination, consent and waiver agreement.
(6)Amounts drawn do not include $1.1 billion and $1.2 billion of debt issued by the Trusts as of December 31, 2024 and 2023, respectively, which were not sold, but were retained by us as a credit enhancement and therefore have been eliminated from the Total.
(7)Maturity Date with respect to conduit borrowings means the date on which the revolving period for the applicable Conduit Facility expires. The revolving period may be extended or renewed (unless an early amortization event occurs prior to the Maturity Date). Absent the extension or renewal of the revolving period, the Conduit Facility shall enter controlled amortization on the Maturity Date and may no longer be drawn upon.
In May 2024, WFNMNT issued $570 million of Series 2024-A public term asset-backed notes, which mature in April 2027. The offering consisted of $500 million of Class A notes with a fixed interest rate of 5.47% per year, $44 million of zero coupon Class M notes, and $26 million of zero coupon Class B notes. The Class M and B notes were retained by us and eliminated from the Consolidated Balance Sheet. In addition, in August 2024 WFNMNT issued $500 million of Series 2024-B public term asset-backed notes, which mature in July 2027. The offering consisted of $500 million of Class A notes with a fixed interest rate of 4.62% per year.
As of December 31, 2024, we had approximately $12.4 billion of securitized credit card loans. Securitizations require credit enhancements in the form of cash, spread deposits, additional loans and subordinated classes. The credit enhancement is principally based on the outstanding balances of the series issued by the Trusts and by the performance of the credit card loans in the Trusts.
Early amortization events as defined within each asset-backed securitization transaction are generally driven by asset performance. We do not believe it is reasonably likely that an early amortization event will occur due to asset performance. However, if an early amortization event were declared for a Trust, the trustee of the particular Trust would retain the interest in the loans along with the excess spread that would otherwise be paid to our Bank subsidiary until the investors were fully repaid. The occurrence of an early amortization event would significantly limit or negate our ability to securitize additional credit card loans.
We have secured and continue to secure the necessary commitments to fund our credit card and other loans. However, certain of these commitments are short-term in nature and subject to renewal. There is no guarantee that these funding sources, when they mature, will be renewed on similar terms, or at all, as they are dependent on the availability of the asset-backed securitization and deposit markets at the time.
Regulation RR (Credit Risk Retention) adopted by the FDIC, the SEC, the Federal Reserve Board and certain other federal regulators mandates a minimum five percent risk retention requirement for securitizations. Such risk retention requirements may limit our liquidity by restricting the amount of asset-backed securities we are able to issue or affecting the timing of future issuances of asset-backed securities. We satisfy such risk retention requirements by maintaining a seller’s interest calculated in accordance with Regulation RR.
Stock Repurchase Programs
On February 21, 2024, our Board of Directors approved a stock repurchase program to acquire up to $30 million in shares of our outstanding common stock in the open market during the period ended December 31, 2024. On December 2, 2024, our Board of Directors approved a $25 million increase to this stock repurchase program, increasing the total authorized amount of shares to be repurchased from $30 million to $55 million during the period ended December 31, 2024. The rationale for this repurchase program, and the amount thereof, was to offset a portion of the impact of dilution associated with issuances of employee restricted stock units.
During the year ended December 31, 2024, under the authorized stock repurchase program, we acquired a total of 1.0 million shares of our common stock for $55 million. Following their repurchase, these 1.0 million shares ceased to be outstanding shares of common stock and are now treated as authorized but unissued shares of common stock.
Dividends
For the years ended December 31, 2024, 2023 and 2022, we paid $43 million, $42 million and $43 million, respectively, in dividends to holders of our common stock. On January 30, 2025, our Board of Directors declared a quarterly cash dividend of $0.21 per share on our common stock, payable on March 21, 2025, to stockholders of record at the close of business on February 14, 2025.
Contractual Obligations
In the normal course of business, we enter into various contractual obligations that may require future cash payments, the vast majority of which relate to deposits, debt issued by consolidated VIEs, long-term and other debt and operating contracts and leases.
We believe that we will have access to sufficient resources to meet these commitments.
Cash Flows
The table below summarizes our cash flow activity for the periods indicated, followed by a discussion of the variance drivers impacting our Operating, Investing and Financing activities:
Table 11: Cash Flows
| | | | | | | | | | | | | | | | | |
| 2024 | | 2023 | | 2022 |
| (Millions) | |
| Total cash provided by (used in): | | | | | |
| Operating activities | $ | 1,859 | | | $ | 1,987 | | | $ | 1,848 | |
| Investing activities | (1,169) | | | 788 | | | (5,111) | |
| Financing activities | (592) | | | (3,086) | | | 3,267 | |
| Net increase (decrease) in cash, cash equivalents and restricted cash | $ | 98 | | | $ | (311) | | | $ | 4 | |
Cash Flows from Operating Activities primarily include net income adjusted for (i) non-cash items included in net income, such as provision for credit losses, depreciation and amortization, deferred taxes and other non-cash items, and (ii) changes in the balances of operating assets and liabilities, which can fluctuate in the normal course of business due to the amount and timing of payments. We generated cash flows from operating activities of $1,859 million and $1,987 million for the years ended December 31, 2024 and 2023, respectively. The net cash provided by operating activities during these periods was primarily driven by cash generated from net income for the periods after adjusting for the Provision for credit losses in
both periods of comparison, and for the year ended December 31, 2024 the Loss on debt extinguishment and repurchased Convertible Notes and for the year ended December 31, 2023, the Gain on portfolio sale.
Cash Flows from Investing Activities primarily include changes in Credit card and other loans. Cash used in investing activities was $1,169 million for the year ended December 31, 2024, and cash provided by investing activities was $788 million for the year ended December 31, 2023. For the year ended December 31, 2024, the net cash used in investing activities was primarily due to Net principal losses and the purchase of a credit card loan portfolio, partially offset by the paydown of Credit card and other loans and the sale of a credit card loan portfolio. For the year ended December 31, 2023, the net cash provided by investing activities was primarily due to the sale of the BJ’s portfolio, partially offset by the growth of Credit card and other loans, as well as the acquisition of a credit card loan portfolio.
Cash Flows from Financing Activities primarily include changes in deposits and long-term debt. Cash used in financing activities was $592 million and $3,086 million for the years ended December 31, 2024 and 2023, respectively. For the year ended December 31, 2024, the net cash used in financing activities was primarily driven by net repayments of unsecured borrowings, including our repurchased Convertible Notes, and a net decrease in wholesale deposits, partially offset by the net borrowings of debt issued by consolidated variable interest entities (securitizations). For the year ended December 31, 2023, the net cash used in financing activities was primarily driven by net repayments of both securitizations and unsecured borrowings, as well as a net decrease in deposits.
INFLATION AND SEASONALITY
Although we cannot precisely determine the impact of inflation on our operations, we have generally sought to rely on operating efficiencies from scale, technology modernization and digital advancement along with other operational excellence initiatives, as well as expansion in lower cost jurisdictions (in select circumstances) to offset increased costs of employee compensation and other operating expenses impacted by inflation. We also recognize that a customer’s ability and willingness to repay us has been negatively impacted by factors such as recent inflation and higher interest rates, and the persistent effects therefrom, which results in higher delinquencies and increased credit losses, as reflected in our elevated Reserve rate. If the efforts to control inflation in the U.S. and globally are not successful and inflationary pressures continue to persist, they could further increase repayment pressure on consumers as well as the risk of a recessionary environment, which may adversely impact our business, results of operations and financial condition.
With respect to seasonality, our revenues, earnings and cash flows are affected by increased consumer spending patterns leading up to and including the holiday shopping season in the fourth quarter of each year and, to a lesser extent, during the first quarter of each year as Credit card and other loans are paid down. Net loss rates for our Credit card and other loans portfolio also have historically exhibited seasonal patterns and generally tend to be the highest in the first quarter of the year. While the effects of the seasonal trends discussed above remain evident, macroeconomic trends, such as those discussed within the Business Environment sections of our quarterly and annual reports on Forms 10-Q and Form 10-K generally have a more significant impact on our key financial metrics and can outweigh any seasonal impacts that we may experience.
LEGISLATIVE, REGULATORY MATTERS AND CAPITAL ADEQUACY
Our business is subject to extensive federal and state laws and regulations, as well as related regulation and supervision, including by the FDIC, CFPB and other federal and state authorities. Pending and future laws and regulations (federal and state) may adversely impact our business. Without limiting the foregoing, CB is subject to various regulatory capital requirements administered by the State of Delaware and the FDIC. CCB is also subject to various regulatory capital requirements administered by the State of Utah and the FDIC. Failure to meet minimum capital requirements can trigger certain mandatory and possibly additional discretionary actions by our regulators. Under capital adequacy guidelines and the regulatory framework for prompt corrective action, both Banks must meet specific capital guidelines that involve quantitative measures of their assets and liabilities as calculated under regulatory accounting practices. The capital amounts and classification are also subject to qualitative judgments by these regulators about components, risk weightings and other factors. In addition, both Banks are limited in the amounts they can pay as dividends to the Parent Company. For additional information about legislative and regulatory matters impacting us, see “Business–Supervision and Regulation” under Part I of this Annual Report on Form 10-K, as well as “Management’s Discussion and Analysis of Financial Condition and Results of Operations (MD&A) — Business Environment” and “Risk Factors — Legal, Regulatory and Compliance Risks”.
Quantitative measures, established by regulations to ensure capital adequacy, require the Banks to maintain minimum amounts and ratios of Tier 1 capital to average assets, and Common equity tier 1, Tier 1 capital and Total capital, all to risk weighted assets. Failure to meet these minimum capital requirements can result in certain mandatory, and possibly additional discretionary actions by the Banks’ regulators that if undertaken, could have a direct material effect on CB’s and/or CCB’s operating activities, as well as our operating activities. Based on these regulations, as of December 31, 2024 and 2023, each Bank met all capital requirements to which it was subject, and maintained capital ratios in excess of the minimums required to qualify as well capitalized. The Banks seek to maintain capital levels and ratios in excess of the minimum regulatory requirements inclusive of the 2.5% Capital Conservation Buffer. Although Bread Financial is not a bank holding company as defined under the Bank Holding Company Act, we seek to maintain capital levels and ratios in excess of the minimums required for bank holding companies.
The Banks adopted the option provided by the interim final rule issued by joint federal bank regulatory agencies, which largely delayed the effects of the current expected credit loss (CECL) model on their regulatory capital for two years, until January 1, 2022, after which the effects are phased-in over a three-year period through December 31, 2024. Under the interim final rule, the amount of adjustments to regulatory capital deferred until the phase-in period includes both the initial impact of our adoption of CECL as of January 1, 2020, and 25% of subsequent changes in our Allowance for credit losses during each quarter of the two-year period ended December 31, 2021. In accordance with the interim final rule, we began to ratably phase-in these effects on January 1, 2022.
As of December 31, 2024 the actual capital ratios and minimum ratios for each Bank, as well as Bread Financial, are as follows:
Table 12: Capital Ratios
| | | | | | | | | | | | | | | | | |
| Actual Ratio | | Minimum Ratio for
Capital Adequacy
Purposes | | Minimum Ratio to be
Well Capitalized under
Prompt Corrective
Action Provisions |
| Total Company | | | | | |
Common equity tier 1 capital ratio (1) | 12.4 | % | | 4.5 | % | | 6.5 | % |
Tier 1 capital ratio (2) | 12.4 | | | 6.0 | | | 8.0 | |
Total risk-based capital ratio (3) | 13.8 | | | 8.0 | | | 10.0 | |
Tier 1 leverage capital ratio (4) | 11.5 | | | 4.0 | | | 5.0 | |
Total risk-weighted assets (5) | $ | 19,928 | | | | | |
| | | | | |
| Comenity Bank | | | | | |
Common equity tier 1 capital ratio (1) | 16.5 | % | | 4.5 | % | | 6.5 | % |
Tier 1 capital ratio (2) | 16.5 | | | 6.0 | | | 8.0 | |
Total risk-based capital ratio (3) | 17.9 | | | 8.0 | | | 10.0 | |
Tier 1 leverage capital ratio (4) | 15.3 | | | 4.0 | | | 5.0 | |
| | | | | |
| Comenity Capital Bank | | | | | |
Common equity tier 1 capital ratio (1) | 15.4 | % | | 4.5 | % | | 6.5 | % |
Tier 1 capital ratio (2) | 15.4 | | | 6.0 | | | 8.0 | |
Total risk-based capital ratio (3) | 16.7 | | | 8.0 | | | 10.0 | |
Tier 1 leverage capital ratio (4) | 14.3 | | | 4.0 | | | 5.0 | |
______________________________
(1)Common equity tier 1 capital ratio represents tier 1 capital divided by total risk-weighted assets. In the calculation of tier 1 capital, we follow the Basel III Standardized Approach and therefore Total stockholders' equity has been reduced, primarily by Goodwill and intangible assets, net. See below for a reconciliation of our Total stockholders’ equity under GAAP to tier 1 and tier 2 capital under the Basel III Standardized Approach.
(2)Tier 1 capital ratio represents tier 1 capital divided by total risk-weighted assets. In the calculation of tier 1 capital, we follow the Basel III Standardized Approach and therefore Total stockholders' equity has been reduced, primarily by
Goodwill and intangible assets, net.See below for a reconciliation of our Total stockholders’ equity under GAAP to tier 1 and tier 2 capital under the Basel III Standardized Approach.
(3)Total risk-based capital ratio represents total capital divided by total risk-weighted assets. In the calculation of total capital, we follow the Basel III Standardized Approach and therefore tier 1 capital has been increased by tier 2 capital, which for us is the allowable portion of the Allowance for credit losses. See below for a reconciliation of our Total stockholders’ equity under GAAP to tier 1 and tier 2 capital under the Basel III Standardized Approach.
(4)Tier 1 leverage capital ratio represents tier 1 capital divided by total average assets, after certain adjustments.
(5)Total risk-weighted assets are generally measured by allocating assets, and specified off-balance sheet exposures, to various risk categories as defined by the Basel III Standardized Approach.
The following table provides a reconciliation of our Total stockholders’ equity under GAAP to Basel III Standardized
Approach Common equity tier 1 capital, Tier 1 capital, Tier 2 capital and Total capital, as of December 31:
| | | | | |
| 2024 |
| (Millions) | |
| Total stockholders' equity | $ | 3,051 | |
| CECL phase-in adjustment | 139 | |
| Total stockholders' equity, net of CECL phase-in | 3,190 | |
| Less: | |
Goodwill (1) | 594 | |
| Other intangible assets | 113 | |
| Other | 9 | |
| Common equity tier 1 capital | 2,474 | |
| |
| Tier 1 capital | 2,474 | |
| |
Qualifying allowance for credit losses (2) | 272 | |
| Tier 2 capital | 272 | |
| |
| Total capital | $ | 2,746 | |
__________________________________
(1)Goodwill, net of the related $40 million deferred tax liability.
(2)The allowable portion of the Allowance for credit losses, which is a maximum of 1.25% of RWA and is net of applicable CECL phase-in adjustments.
The following table provides the changes in our Basel III Standardized Approach Common equity tier 1 capital, Tier 1
capital and Tier 2 capital as of December 31:
| | | | | |
| 2024 |
| (Millions) | |
| Common equity tier 1 capital beginning balance | $ | 2,466 | |
| Net income applicable to common equity | 277 | |
| Dividends declared on common stock | (44) | |
| Changes in additional paid-in capital | (96) | |
| |
| |
| Changes in intangible assets | 16 | |
Other (1) | (145) | |
| Common equity tier 1 capital | 2,474 | |
| |
| Tier 1 capital | 2,474 | |
| |
| Tier 2 capital beginning balance | 273 | |
| Change in qualifying allowance for credit losses | (1) | |
| Tier 2 capital | 272 | |
| |
| Total capital | $ | 2,746 | |
__________________________________
(1)Includes the impact of the CECL phase-in adjustment and the cumulative effect, net of tax, of adopting the proportional amortization method of accounting for our tax credit investment.
Further information about each Bank’s capital components and calculations can be found in each Bank’s Consolidated Reports of Condition and Income Form FFIEC 041 (Call Reports) as filed with the FDIC.
We are also involved, from time to time, in reviews, investigations, subpoenas, supervisory actions and other proceedings (both formal and informal) by governmental agencies regarding our business, which could subject us to significant fines, penalties, obligations to change our business practices, significant restrictions on our existing business or ability to develop new business, cease-and-desist orders, safety-and-soundness directives or other requirements resulting in increased expenses, diminished income and damage to our reputation.
On November 20, 2023, following the consent of the Board of Managers of Comenity Servicing LLC (the Servicer), the FDIC issued a consent order to the Servicer. The Servicer is not one of our Bank subsidiaries, but is our wholly-owned subsidiary that services substantially all of our loans. The consent order arose out of the June 2022 transition of our credit card processing services to strategic outsourcing partners and addresses certain shortcomings in the Servicer’s information technology (IT) systems development, project management, business continuity management, cloud operations, and third-party oversight. The Servicer entered into the consent order for the purpose of resolving these matters without admitting or denying any violations of law or regulation set forth in the order. The consent order does not contain any monetary penalties or fines.
The Servicer continues to take significant steps to strengthen the organization’s IT governance and address the other issues identified in the consent order, working diligently to ensure that all requirements of the consent order are satisfied. Without limiting the generality of the foregoing, the Servicer has taken steps to address each provision within the consent order and continues to comply with each ongoing requirement. The Servicer is committed to complying with the longer-term requirements of the consent order, including the enhancement of its compliance management processes and related corporate governance, compliance with the applicable system conversion requirements, and enhanced risk management and reporting. The Servicer has submitted nearly all of the required deliverables under the consent order to the FDIC for its review and consideration. The Board of Directors of each of the Banks continue to oversee the Servicer’s compliance with the requirements of the consent order and provide effective challenge to the Servicer’s management toward that end.
On August 22, 2024, each Bank entered into an agreement with the FDIC to pay civil money penalties (CMPs) of $1 million per Bank. The CMPs, which have been paid in full, arose out of the June 2022 transition of our credit card processing services to strategic outsourcing partners and were related to disruptions to the Banks’ customer reward programs and automatic payments following the transition. These issues were self-identified and remediated timely, and
the Banks provided full cooperation with the regulators throughout their examination. The Banks’ agreements to pay the CMPs did not require admission of wrongdoing, and there are no operational limitations on the Banks or our business associated with the CMPs.
CRITICAL ACCOUNTING POLICIES AND ESTIMATES
Our discussion and analysis of our results of operations and overall financial condition is based upon our audited Consolidated Financial Statements, which have been prepared in accordance with the accounting policies described in Note 1, “Description of Business, Basis of Presentation and Significant Accounting Policies,” to our audited Consolidated Financial Statements included as part of this Annual Report on Form 10-K. The preparation of the audited Consolidated Financial Statements requires management to make estimates and judgments that affect the reported amounts of assets, liabilities, revenues and expenses, and related disclosure of contingent assets and liabilities. We continually evaluate our estimates and judgments in determination of our financial position and operating results. Estimates are based on information available as of the date of the audited Consolidated Financial Statements and, accordingly, actual results could differ from these estimates, sometimes materially. Critical accounting estimates are defined as those that are both most important to the portrayal of our financial position and operating results, and require management’s most subjective judgments, which for us is our Allowance for credit losses, Provision for income taxes and Goodwill impairment.
Allowance for Credit Losses
The Allowance for credit losses represents our estimate of expected credit losses over the estimated life of our Credit card and other loans, incorporating future macroeconomic forecasts in addition to information about past events and current conditions. Our estimate under the Current Expected Credit Loss (CECL) approach involves significant judgments from a modeling and forecasting perspective, and is significantly influenced by the composition, characteristics and quality of our Credit card and other loans portfolio, as well as the prevailing economic conditions and forecasts utilized.
In estimating our Allowance for credit losses, for each identified segment of loans sharing similar risk characteristics, management uses modeling and estimation techniques that leverage historical data and behavioral relationships, together with third-party projections of certain macroeconomic variables, to estimate expected credit losses based on historical correlation of realized losses to macroeconomic conditions. We consider the macroeconomic forecast used to be reasonable and supportable over the estimated life of the Credit card and other loans portfolio, with no reversion period. Since our implementation of the CECL guidance, we have maintained a consistent approach to modeling the life of loan losses in establishing our Allowance for credit losses.
In addition to the quantitative estimate of expected credit losses, we also incorporate qualitative adjustments to the modeled output in order to address risks not inherently captured by that modeled output, such as Company-specific risks, changes in current macroeconomic conditions, or other relevant factors to ensure the Allowance for credit losses reflects our best estimate of current expected credit losses.
If we used different assumptions in estimating our current expected credit losses, the impact on the Allowance for credit losses could have a material effect on our consolidated financial position and results of operations. For example, a 100 basis point increase in the Allowance for credit losses as a percentage of the amortized cost of our Credit card and other loans could have resulted in a change of approximately $185 million in the Allowance for credit losses as of December 31, 2024, with a corresponding change in the Provision for credit losses.
Income Taxes
The income tax laws of the United States, as well as its states and municipalities in which we operate, are inherently complex; the manners in which they apply to our facts is often open to interpretation, and consequentially requires us to make judgments in establishing our Provision for income taxes.
Differences between the audited Consolidated Financial Statements and tax bases of assets and liabilities give rise to deferred tax assets and liabilities, which measure the future tax effects of items recognized in the audited Consolidated Financial Statements and require certain estimates and judgments, in particular with deferred tax assets, in order to determine whether it is more likely than not that all or a portion of the benefit of a deferred tax asset will not be realized. In evaluating our deferred tax assets on a quarterly basis, as new facts and circumstances emerge we analyze and estimate the impact of future taxable income, reversing temporary differences and available tax planning strategies. Uncertainties can lead to changes in the ultimate realization of our deferred tax assets.
A liability for unrecognized tax benefits, representing the difference between a tax position taken or expected to be taken in a tax return and the benefit recognized in the audited Consolidated Financial Statements, inherently requires estimates and judgments. A tax position is recognized only when it is more likely than not to be sustained, based purely on its technical merits after examination by the relevant taxing authority, and the amount recognized is the benefit we believe is more likely than not to be realized upon ultimate settlement. We evaluate our tax positions as new facts and circumstances become available, making adjustments to our unrecognized tax benefits as appropriate. Uncertainties can mean the tax benefits ultimately realized differ from amounts previously recognized, with any differences recorded in Provision for income taxes.
Our assessment of the technical merits and measurement of tax benefits associated with uncertain tax positions is subject to a high degree of judgment and estimation. Actual results may differ from our current judgments due to a variety of factors, including interpretations of law by the relevant taxing authorities that differ from our assessments and results of tax examinations. We believe we have adequately provided for any reasonably foreseeable outcome related to these matters. However, our future results may include favorable or unfavorable adjustments to our estimated tax liabilities in the period the assessments are made or resolved, or when statutes of limitation on potential assessments expire. As of December 31, 2024, we had $229 million in unrecognized tax benefits, including interest and penalties, recorded in Other liabilities on the Consolidated Balance Sheet.
Goodwill Impairment
Goodwill is recognized for business acquisitions when the purchase price is higher than the fair value of acquired net assets. As required by GAAP, goodwill is not amortized but is tested for impairment at least annually or when events or circumstances arise that would more likely than not reduce the fair value of our single reporting unit below its carrying value.
We have the option to first assess qualitative factors to determine whether it is more likely than not that the fair value of our reporting unit is less than its carrying value. Alternatively, we can perform a more detailed quantitative assessment of goodwill impairment. Qualitative factors considered in evaluating goodwill impairment include macroeconomic conditions, industry and market considerations, our overall financial performance and other relevant entity-specific factors, and/or a sustained decrease in our share price. If, after assessing these qualitative factors we conclude that it is not more likely than not that the fair value of our reporting unit is less than its carrying amount, then the quantitative goodwill impairment test is not necessary. However, if the qualitative factors indicate it is more likely than not that the fair value of our reporting unit is less than its carrying amount, or we elect to skip the qualitative assessment, we would perform a quantitative impairment test.
We apply significant judgment when testing goodwill for impairment, especially when performing the quantitative test
where we perform a valuation of our reporting unit leveraging a combination of the income approach based on discounted cash flows and the market approach based on valuation multiples. The key assumptions used to determine the fair value are primarily unobservable inputs (i.e., Level 3 inputs as defined under GAAP) including internally developed forecasts to estimate future cash flows, growth rates and discount rates, as well as market valuation multiples (for the market approach). Estimated cash flows are based on internal forecasts grounded in historical performance and future expectations. To discount the estimated cash flows, we use the expected cost of equity taking into account a combination of industry and Company-specific factors we believe a third-party market participant would incorporate. We believe the discount rate applied appropriately reflects the risks and uncertainties in the financial markets generally and specifically in our internally developed forecasts. When using valuation multiples under the market approach, we apply comparable publicly traded companies’ multiples (e.g., price to tangible book value or return on tangible equity) to our reporting unit’s operating results.
Given the inherent uncertainty in the judgments involved, we could be exposed to goodwill impairment as a result of adverse impacts from various factors including regulatory or legislative changes, or if future macroeconomic conditions or future operating results differ significantly from our current assumptions.
RECENTLY ADOPTED AND RECENTLY ISSUED ACCOUNTING STANDARDS
See “Recently Adopted and Recently Issued Accounting Standards” in Note 1, “Description of Business, Basis of Presentation and Significant Accounting Policies” to the audited Consolidated Financial Statements.
Item 7A. Quantitative and Qualitative Disclosures About Market Risk.
See “Risk Management” within Item 1A.
Item 8. Financial Statements and Supplementary Data.
Our audited Consolidated Financial Statements begin on page F-1 of this Annual Report on Form 10-K.
Item 9. Changes in and Disagreements with Accountants on Accounting and Financial Disclosure.
None.
Item 9A. Controls and Procedures.
Conclusion Regarding the Effectiveness of Disclosure Controls and Procedures
Our management, with the participation of our Chief Executive Officer and Chief Financial Officer, has evaluated the effectiveness of the design and operation of our disclosure controls and procedures (as defined in Rules 13a-15(e) and 15d-15(e) under the Securities Exchange Act of 1934, as amended (the Exchange Act)) as of the end of the period covered by this Report. Based upon that evaluation, our Chief Executive Officer and Chief Financial Officer have concluded that, as of the end of such period, our disclosure controls and procedures are effective and designed to ensure that the information required to be disclosed in our reports filed or submitted under the Exchange Act is recorded, processed, summarized and reported within the requisite time periods specified in the applicable rules and forms, and that it is accumulated and communicated to our management, including our Chief Executive Officer and Chief Financial Officer, as appropriate, to allow timely decisions regarding required disclosure.
There have not been any changes in our internal control over financial reporting (as such term is defined in Rules 13a-15(f) and 15d-15(f) under the Exchange Act) during the fourth quarter of 2024 that have materially affected, or are reasonably likely to materially affect, our internal control over financial reporting.
Management’s Report on Internal Control Over Financial Reporting
Our management is responsible for establishing and maintaining adequate internal control over financial reporting. Our internal control over financial reporting is a process designed to provide reasonable assurance regarding the reliability of financial reporting and the preparation of financial statements for external purposes in accordance with accounting principles generally accepted in the United States of America (GAAP), and includes those policies and procedures that:
•Pertain to the maintenance of records that, in reasonable detail, accurately and fairly reflect our transactions and dispositions of assets;
•Provide reasonable assurance that transactions are recorded as necessary to permit preparation of financial statements in accordance with GAAP, and that our receipts and expenditures are being made only in accordance with authorizations of our management and directors; and
•Provide reasonable assurance regarding prevention or timely detection of unauthorized acquisition, use or disposition of our assets that could have a material effect on the financial statements.
Because of its inherent limitations, internal control over financial reporting may not prevent or detect misstatements. Also, projections of any evaluation of effectiveness to future periods are subject to the risk that controls may become inadequate because of changes in conditions, or that the degree of compliance with the policies or procedures may deteriorate.
Our management, with the participation of our Chief Executive Officer and Chief Financial Officer, assessed the effectiveness of our internal control over financial reporting as of December 31, 2024. In making this assessment, our management used the criteria set forth by the Committee of Sponsoring Organizations of the Treadway Commission (COSO) in Internal Control—Integrated Framework (2013). Based on those criteria and management’s assessment, with the participation of our Chief Executive Officer and Chief Financial Officer, we conclude that, as of December 31, 2024, our internal control over financial reporting was effective.
The effectiveness of our internal control over financial reporting as of December 31, 2024, has been audited by Deloitte & Touche LLP, our independent registered public accounting firm who also audited our Consolidated Financial Statements; their attestation report on the effectiveness of our internal control over financial reporting appears on page F-4.
Item 9B. Other Information.
None.
Item 9C. Disclosure Regarding Foreign Jurisdictions that Prevent Inspections.
Not applicable.
PART III
Item 10. Directors, Executive Officers and Corporate Governance.
Incorporated by reference to the Proxy Statement for the 2025 Annual Meeting of our stockholders, which will be filed with the SEC not later than 120 days after December 31, 2024.
Item 11. Executive Compensation.
Incorporated by reference to the Proxy Statement for the 2025 Annual Meeting of our stockholders, which will be filed with the SEC not later than 120 days after December 31, 2024.
Item 12. Security Ownership of Certain Beneficial Owners and Management and Related Stockholder Matters.
Incorporated by reference to the Proxy Statement for the 2025 Annual Meeting of our stockholders, which will be filed with the SEC not later than 120 days after December 31, 2024.
Item 13. Certain Relationships and Related Transactions, and Director Independence.
Incorporated by reference to the Proxy Statement for the 2025 Annual Meeting of our stockholders, which will be filed with the SEC not later than 120 days after December 31, 2024.
Item 14. Principal Accounting Fees and Services.
Incorporated by reference to the Proxy Statement for the 2025 Annual Meeting of our stockholders, which will be filed with the SEC not later than 120 days after December 31, 2024.
PART IV
Item 15. Exhibits and Financial Statement Schedules.
a)The following documents are filed as part of this Annual Report on Form 10-K:
(1)Financial Statements
(2)Financial Statement Schedules.
Separate financial statement schedules have been omitted either because they are not applicable or because the required information is included in the audited Consolidated Financial Statements.
(3)Exhibits.
The following exhibits are filed as part of this Annual Report on Form 10-K or, where indicated, were previously filed and are hereby incorporated by reference.
| | | | | | | | | | | | | | | | | | | | | | | | | | | | | | | | | | | |
| | | | | | Incorporated by Reference | |
| Exhibit No. | | Filer | | Description | | Form | | Exhibit | | Filing Date | |
| 3.1 | | (a) | | | | 8-K | | 3.2 | | 6/10/16 | |
| | | | | | | | | | | |
| 3.2 | | (a) | | | | 8-K | | 3.1 | | 3/24/22 | |
| | | | | | | | | | | |
| 3.3 | | (a) | | | | 8-K | | 3.1 | | 4/29/19 | |
| | | | | | | | | | | |
| 3.4 | | (a) | | | | 8-K | | 3.2 | | 3/24/22 | |
| | | | | | | | | | | |
| 4.1 | | (a) | | | | 10-Q | | 4.0 | | 8/8/03 | |
| | | | | | | | | | | |
| 4.2 | | (a) | | | | 10-K | | 4.2 | | 2/28/23 | |
| | | | | | | | | | | |
| +10.1 | | (a) | | | | 8-K | | 10.1 | | 11/24/17 | |
| | | | | | | | | | | |
| +10.2 | | (a) | | | | 10-K | | 10.2 | | 2/20/24 | |
| | | | | | | | | | | |
| +10.3 | | (a) | | | | DEF 14A | | A | | 4/20/10 | |
| | | | | | | | | | | |
| +10.4 | | (a) | | | | DEF 14A | | B | | 4/20/15 | |
| | | | | | | | | | | |
| +10.5 | | (a) | | | | DEF 14A | | A | | 4/23/20 | |
| | | | | | | | | | | |
| +10.6 | | (a) | | | | DEF 14A | | A | | 4/13/22 | |
| | | | | | | | | | | |
| +10.7 | | (a) | | | | DEF 14A | | B | | 4/3/24 | |
| | | | | | | | | | | |
| +10.8 | | (a) | | | | 8-K | | 10.1 | | 2/18/21 | |
| | | | | | | | | | | | | | | | | | | | | | | | | | | | | | | | | | | |
| | | | | | Incorporated by Reference | |
| Exhibit No. | | Filer | | Description | | Form | | Exhibit | | Filing Date | |
| | | | | | | | | | | |
| ^+10.9 | | (a) | | | | 8-K | | 10.2 | | 2/18/21 | |
| | | | | | | | | | | |
| +10.10 | | (a) | | | | 10-K | | 10.9 | | 2/20/24 | |
| | | | | | | | | | | |
| ^+10.11 | | (a) | | | | 10-K | | 10.10 | | 2/20/24 | |
| | | | | | | | | | | |
| +10.12 | | (a) | | | | 10-Q | | 10.11 | | 8/1/24 | |
| | | | | | | | | | | |
| +10.13 | | (a) | | | | 10-Q | | 10.12 | | 8/1/24 | |
| | | | | | | | | | | |
| +10.14 | | (a) | | | | 10-K | | 10.52 | | 2/28/13 | |
| | | | | | | | | | | |
| +10.15 | | (a) | | | | 10-Q | | 10.6 | | 8/7/17 | |
| | | | | | | | | | | |
| +10.16 | | (a) | | | | 8-K | | 10.1 | | 6/15/21 | |
| | | | | | | | | | | |
| +10.17 | | (a) | | | | 10-K | | 10.14 | | 2/20/24 | |
| | | | | | | | | | | |
| +10.18 | | (a) | | | | 10-Q | | 10.13 | | 8/1/24 | |
| | | | | | | | | | | |
| +10.19 | | (a) | | | | 8-K | | 10.1 | | 6/9/06 | |
| | | | | | | | | | | |
| +10.20 | | (a) | | | | 10-K | | 10.18 | | 2/27/17 | |
| | | | | | | | | | | |
| +10.21 | | (a) | | | | 8-K | | 10.1 | | 6/5/15 | |
| | | | | | | | | | | |
| +10.22 | | (a) | | | | DEF 14A | | C | | 4/20/15 | |
| | | | | | | | | | | |
| 10.23 | | (b)
(c) | | | | 8-K | | 4.6 | | 8/31/01 | |
| | | | | | | | | | | |
| | | | | | | | | | | | | | | | | | | | | | | | | | | | | | | | | | | |
| | | | | | Incorporated by Reference | |
| Exhibit No. | | Filer | | Description | | Form | | Exhibit | | Filing Date | |
| 10.24 | | (b)
(c)
(d) | | | | 8-K | | 4.1 | | 8/4/04 | |
| | | | | | | | | | | |
| 10.25 | | (b)
(c)
(d) | | | | 8-K | | 4.1 | | 4/5/05 | |
| | | | | | | | | | | |
| 10.26 | | (b)
(d) | | | | 8-K | | 4.1 | | 6/15/07 | |
| | | | | | | | | | | |
| 10.27 | | (b)
(c)
(d) | | | | 8-K | | 4.1 | | 10/31/07 | |
| | | | | | | | | | | |
| 10.28 | | (b)
(d) | | | | 8-K | | 4.1 | | 5/29/08 | |
| | | | | | | | | | | |
| 10.29 | | (b)
(d) | | | | 8-K | | 4.2 | | 6/30/10 | |
| | | | | | | | | | | |
| 10.30 | | (b)
(d) | | | | 8-K | | 4.1 | | 8/12/10 | |
| | | | | | | | | | | |
| 10.31 | | (b)
(c)
(d) | | | | 8-K | | 4.1 | | 11/14/11 | |
| | | | | | | | | | | |
| 10.32 | | (b)
(c)
(d) | | | | 8-K | | 4.1 | | 12/2/16 | |
| | | | | | | | | | | |
| 10.33 | | (b)
(c)
(d) | | | | 8-K | | 4.1 | | 8/20/18 | |
| | | | | | | | | | | |
| 10.34 | | (b)
(c)
(d) | | | | 8-K | | 4.2 | | 6/16/20 | |
| | | | | | | | | | | |
| | | | | | | | | | | | | | | | | | | | | | | | | | | | | | | | | | | |
| | | | | | Incorporated by Reference | |
| Exhibit No. | | Filer | | Description | | Form | | Exhibit | | Filing Date | |
| 10.35 | | (b)
(c) | | Twelfth Amendment to Second Amended and Restated Pooling and Servicing Agreement, dated as of October 27, 2020, among WFN Credit Company, LLC, as transferor, Comenity Bank, as servicer, and MUFG Union Bank, N.A., as trustee. | | 8-K | | 4.1 | | 10/30/20 | |
| | | | | | | | | | | |
| 10.36 | | (b) (c) (d) | | | | 8-K | | 4.3 | | 4/30/24 | |
| | | | | | | | | | | |
| 10.37 | | (b)
(c)
| | | | 8-K | | 4.7 | | 8/31/01 | |
| | | | | | | | | | | |
| 10.38 | | (b)
(c) | | | | 8-K | | 4.3 | | 11/20/02 | |
| | | | | | | | | | | |
| 10.39 | | (b)
(c)
(d) | | | | 8-K | | 4.1 | | 7/8/16 | |
| | | | | | | | | | | |
| 10.40 | | (b)
(c) | | | | 8-K | | 4.3 | | 8/31/01 | |
| | | | | | | | | | | |
| 10.41 | | (b)
(c) | | | | 8-K | | 4.2 | | 11/20/02 | |
| | | | | | | | | | | |
| 10.42 | | (b)
(c)
(d) | | | | 8-K | | 4.2 | | 8/4/04 | |
| | | | | | | | | | | |
| 10.43 | | (b)
(c)
(d) | | | | 8-K | | 4.2 | | 4/5/05 | |
| | | | | | | | | | | |
| 10.44 | | (b)
(d) | | | | 8-K | | 4.2 | | 6/15/07 | |
| | | | | | | | | | | |
| 10.45 | | (b)
(c)
(d) | | | | 8-K | | 4.2 | | 10/31/07 | |
| | | | | | | | | | | |
| | | | | | | | | | | | | | | | | | | | | | | | | | | | | | | | | | | |
| | | | | | Incorporated by Reference | |
| Exhibit No. | | Filer | | Description | | Form | | Exhibit | | Filing Date | |
| 10.46 | | (b)
(d) | | | | 8-K | | 4.4 | | 6/30/10 | |
| | | | | | | | | | | |
| 10.47 | | (b)
(d) | | | | 8-K | | 4.3 | | 8/12/10 | |
| | | | | | | | | | | |
| 10.48 | | (b)
(c)
(d) | | | | 8-K | | 4.1 | | 6/15/11 | |
| | | | | | | | | | | |
| 10.49 | | (b)
(c)
(d) | | | | 8-K | | 4.3 | | 11/14/11 | |
| | | | | | | | | | | |
| 10.50 | | (b)
(c)
(d) | | | | 8-K | | 4.4 | | 7/8/16 | |
| | | | | | | | | | | |
| 10.51 | | (b)
(c)
(d) | | | | 8-K | | 4.5 | | 4/30/24 | |
| | | | | | | | | | | |
| 10.52 | | (b)
(d) | | | | 8-K | | 4.8 | | 8/31/01 | |
| | | | | | | | | | | |
| 10.53 | | (b)
(d) | | | | 8-K | | 4.3 | | 6/30/10 | |
| | | | | | | | | | | |
| 10.54 | | (b)
(d) | | | | 8-K | | 4.2 | | 8/12/10 | |
| | | | | | | | | | | |
| 10.55 | | (b)
(c)
(d) | | | | 8-K | | 4.2 | | 11/14/11 | |
| | | | | | | | | | | |
| 10.56 | | (b)
(c)
(d) | | | | 8-K | | 4.2 | | 7/8/16 | |
| | | | | | | | | | | |
| 10.57 | | (b)
(c)
(d) | | | | 8-K | | 4.3 | | 6/16/20 | |
| | | | | | | | | | | |
| | | | | | | | | | | | | | | | | | | | | | | | | | | | | | | | | | | |
| | | | | | Incorporated by Reference | |
| Exhibit No. | | Filer | | Description | | Form | | Exhibit | | Filing Date | |
| 10.58 | | (b)
(c)
(d) | | | | 8-K | | 4.4 | | 4/30/24 | |
| | | | | | | | | | | |
| 10.59 | | (b)
(c) | | | | 8-K | | 4.1 | | 8/31/01 | |
| | | | | | | | | | | |
| 10.60 | | (b)
(c) | | | | 8-K | | 4 | | 4/22/03 | |
| | | | | | | | | | | |
| 10.61 | | (b)
(d) | | | | 8-K | | 4.2 | | 8/28/03 | |
| | | | | | | | | | | |
| 10.62 | | (b)
(d) | | | | 8-K | | 4.3 | | 6/15/07 | |
| | | | | | | | | | | |
| 10.63 | | (b
(d) | | | | 8-K | | 4.2 | | 5/29/08 | |
| | | | | | | | | | | |
| 10.64 | | (b
(d) | | | | 8-K | | 4.1 | | 6/30/10 | |
| | | | | | | | | | | |
| 10.65 | | (b)
(c)
(d) | | | | 8-K | | 4.2 | | 2/22/13 | |
| | | | | | | | | | | |
| 10.66 | | (b)
(c)
(d) | | | | 8-K | | 4.3 | | 7/8/16 | |
| | | | | | | | | | | |
| 10.67 | | (b)
(c)
(d) | | | | 8-K | | 4.1 | | 6/16/20 | |
| | | | | | | | | | | |
| 10.68 | | (b)
(c)
(d) | | | | 8-K | | 4.1 | | 4/30/24 | |
| | | | | | | | | | | |
| 10.69 | | (b)
(c)
(d) | | | | 8-K | | 4.1 | | 5/28/21 | |
| | | | | | | | | | | |
| | | | | | | | | | | | | | | | | | | | | | | | | | | | | | | | | | | |
| | | | | | Incorporated by Reference | |
| Exhibit No. | | Filer | | Description | | Form | | Exhibit | | Filing Date | |
| 10.70 | | (b)
(c)
(d) | | | | 8-K | | 4.1 | | 6/24/21 | |
| | | | | | | | | | | |
| 10.71 | | (b)
(c)
(d) | | | | 8-K | | 4.2 | | 6/24/21 | |
| | | | | | | | | | | |
| 10.72 | | (b) (c) (d)
| | | | 8-K | | 4.1 | | 5/19/23 | |
| | | | | | | | | | | |
| 10.73 | | (b) (c) (d)
| | | | 8-K | | 4.1 | | 12/26/23 | |
| | | | | | | | | | | |
| 10.74 | | (b) (c) (d)
| | | | 8-K | | 4.2 | | 4/30/24 | |
| | | | | | | | | | | |
| 10.75 | | (b) (c) (d)
| | | | 8-K | | 4.1 | | 5/21/24 | |
| | | | | | | | | | | |
| 10.76 | | (b) (c) (d)
| | | | 8-K | | 4.1 | | 8/14/24 | |
| | | | | | | | | | | |
| 10.77 | | (b
(d) | | | | 8-K | | 4.4 | | 8/31/01 | |
| | | | | | | | | | | |
| 10.78 | | (b)
(c)
(d) | | | | 8-K | | 4.2 | | 5/28/21 | |
| | | | | | | | | | | |
| 10.79 | | (b
(d) | | | | 8-K | | 4.5 | | 8/31/01 | |
| | | | | | | | | | | |
| 10.80 | | (b
(d) | | | | 8-K | | 4.1 | | 7/31/09 | |
| | | | | | | | | | | |
| 10.81 | | (b)
(c)
(d) | | | | 8-K | | 99.1 | | 1/2/25 | |
| | | | | | | | | | | | | | | | | | | | | | | | | | | | | | | | | | | |
| | | | | | Incorporated by Reference | |
| Exhibit No. | | Filer | | Description | | Form | | Exhibit | | Filing Date | |
| | | | | | | | | | | |
| 10.82 | | (b)
(c)
(d) | | | | 8-K | | 10.1 | | 7/8/16 | |
| | | | | | | | | | | |
| 10.83 | | (a) | | | | 10-Q | | 10.5 | | 11/7/08 | |
| | | | | | | | | | | |
| 10.84 | | (a) | | | | 10-K | | 10.94 | | 3/2/09 | |
| | | | | | | | | | | |
| 10.85 | | (a) | | | | 10-K | | 10.127 | | 2/28/11 | |
| | | | | | | | | | | |
| 10.86 | | (a) | | | | 10-K | | 10.128 | | 2/28/11 | |
| | | | | | | | | | | |
| 10.87 | | (a) | | | | 10-Q | | 10.4 | | 11/7/11 | |
| | | | | | | | | | | |
| 10.88 | | (a) | | | | 10-Q | | 10.6 | | 11/7/08 | |
| | | | | | | | | | | |
| 10.89 | | (a) | | | | 10-Q | | 10.7 | | 11/7/08 | |
| | | | | | | | | | | |
| 10.90 | | (a) | | | | 10-Q | | 10.8 | | 11/7/08 | |
| | | | | | | | | | | |
| 10.91 | | (a) | | | | 10-Q | | 10.9 | | 11/7/08 | |
| | | | | | | | | | | |
| 10.92 | | (a) | | | | 10-Q | | 10.9 | | 5/7/10 | |
| | | | | | | | | | | |
| | | | | | | | | | | | | | | | | | | | | | | | | | | | | | | | | | | |
| | | | | | Incorporated by Reference | |
| Exhibit No. | | Filer | | Description | | Form | | Exhibit | | Filing Date | |
| 10.93 | | (a) | | | | 10-Q | | 10.3 | | 11/7/11 | |
| | | | | | | | | | | |
| 10.94 | | (a) | | | | 10-K | | 10.94 | | 2/27/17 | |
| | | | | | | | | | | |
| 10.95 | | (a) | | | | 10-K | | 10.96 | | 2/27/18 | |
| | | | | | | | | | | |
| 10.96 | | (a) | | | | 10-K | | 10.105 | | 2/26/21 | |
| | | | | | | | | | | |
| 10.97 | | (a) | | | | 10-K | | 10.134 | | 2/28/11 | |
| | | | | | | | | | | |
| 10.98 | | (a) | | | | 10-Q | | 10.3 | | 11/7/08 | |
| | | | | | | | | | | |
| 10.99 | | (a) | | | | 10-Q | | 10.11 | | 8/9/10 | |
| | | | | | | | | | | |
| *10.100 | | (a) | | | | | | | | | |
| | | | | | | | | | | |
| 10.101 | | (a) | | | | 10-Q | | 10.4 | | 11/7/08 | |
| | | | | | | | | | | |
| 10.102 | | (a) | | | | 10-Q | | 10.12 | | 8/9/10 | |
| | | | | | | | | | | |
| *10.103 | | (a) | | | | | | | | | |
| | | | | | | | | | | |
| 10.104 | | (a) | | | | 10-K | | 10.104 | | 2/27/18 | |
| | | | | | | | | | | |
| | | | | | | | | | | | | | | | | | | | | | | | | | | | | | | | | | | |
| | | | | | Incorporated by Reference | |
| Exhibit No. | | Filer | | Description | | Form | | Exhibit | | Filing Date | |
| *10.105 | | (a) | | | | | | | | | |
| | | | | | | | | | | |
| 10.106 | | (a) | | | | 10-K | | 10.98 | | 2/28/23 | |
| | | | | | | | | | | |
| *10.107 | | (a) | | | | | | | | | |
| | | | | | | | | | | |
| 10.108 | | (a) | | | | 10-K | | 10.99 | | 2/28/23 | |
| | | | | | | | | | | |
| *10.109 | | (a) | | | | | | | | | |
| | | | | | | | | | | |
| 10.110 | | (a) | | | | 10-K | | 10.1 | | 2/28/23 | |
| | | | | | | | | | | |
| 10.111 | | (a) | | | | 10-K | | 10.101 | | 2/28/23 | |
| | | | | | | | | | | |
| *10.112 | | (a) | | | | | | | | | |
| | | | | | | | | | | |
| 10.113 | | (a) | | | | 10-K | | 10.129 | | 2/27/15 | |
| | | | | | | | | | | |
| 10.114 | | (a) | | | | 10-Q | | 10.8 | | 8/7/17 | |
| | | | | | | | | | | |
| 10.115 | | (a) | | | | 10-K | | 10.109 | | 2/27/18 | |
| | | | | | | | | | | |
| 10.116 | | (a) | | | | 10-K | | 10.110 | | 2/26/19 | |
| | | | | | | | | | | |
| | | | | | | | | | | | | | | | | | | | | | | | | | | | | | | | | | | |
| | | | | | Incorporated by Reference | |
| Exhibit No. | | Filer | | Description | | Form | | Exhibit | | Filing Date | |
| 10.117 | | (a) | | | | 10-K | | 10.111 | | 2/26/19 | |
| | | | | | | | | | | |
| 10.118 | | (a) | | | | 10-K | | 10.112 | | 2/26/19 | |
| | | | | | | | | | | |
| 10.119 | | (a) | | | | 10-K | | 10.118 | | 2/26/21 | |
| | | | | | | | | | | |
| 10.120 | | (a) | | | | 10-K | | 10.119 | | 2/26/21 | |
| | | | | | | | | | | |
| 10.121 | | (a) | | | | 10-K | | 10.11 | | 2/28/23 | |
| | | | | | | | | | | |
| 10.122 | | (a) | | | | 10-K | | 10.127 | | 2/20/24 | |
| | | | | | | | | | | |
| 10.123 | | (a) | | | | 10-K | | 10.128 | | 2/20/24 | |
| | | | | | | | | | | |
| *10.124 | | (a) | | | | | | | | | |
| | | | | | | | | | | |
| 10.125 | | (a) | | | | 10-Q | | 10.7 | | 8/7/17 | |
| | | | | | | | | | | |
| 10.126 | | (a) | | | | 10-Q | | 10.4 | | 11/8/17 | |
| | | | | | | | | | | |
| 10.127 | | (a) | | | | 10-K | | 10.115 | | 2/26/19 | |
| | | | | | | | | | | |
| | | | | | | | | | | | | | | | | | | | | | | | | | | | | | | | | | | |
| | | | | | Incorporated by Reference | |
| Exhibit No. | | Filer | | Description | | Form | | Exhibit | | Filing Date | |
| 10.128 | | (a) | | | | 10-K | | 10.123 | | 2/26/21 | |
| | | | | | | | | | | |
| 10.129 | | (a) | | | | 10-K | | 10.124 | | 2/26/21 | |
| | | | | | | | | | | |
| *10.130 | | (a) | | | | | | | | | |
| | | | | | | | | | | |
| 10.131 | | (a) | | | | 10-K | | 10.138 | | 2/20/24 | |
| | | | | | | | | | | |
| *10.132 | | (a) | | | | | | | | | |
| | | | | | | | | | | |
| *10.133 | | (a) | | | | | | | | | |
| | | | | | | | | | | |
| *10.134 | | (a) | | | | | | | | | |
| | | | | | | | | | | |
| *10.135 | | (a) | | | | | | | | | |
| | | | | | | | | | | |
| 10.136 | | (a) | | | | 8-K | | 10.2 | | 6/13/23 | |
| | | | | | | | | | | |
| ^10.137 | | (a) | | | | 8-K | | 10.1 | | 10/21/24 | |
| | | | | | | | | | | |
| 10.138 | | (a) | | | | 8-K | | 4.1 | | 6/13/23 | |
| | | | | | | | | | | |
| 10.139 | | (a) | | | | 8-K | | 4.1 | | 12/22/23 | |
| | | | | | | | | | | |
| | | | | | | | | | | | | | | | | | | | | | | | | | | | | | | | | | | |
| | | | | | Incorporated by Reference | |
| Exhibit No. | | Filer | | Description | | Form | | Exhibit | | Filing Date | |
| *19 | | (a) | | | | | | | | | |
| | | | | | | | | | | |
| *21 | | (a) | | | | | | | | | |
| | | | | | | | | | | |
| *23.1 | | (a) | | | | | | | | | |
| | | | | | | | | | | |
| *31.1 | | (a) | | | | | | | | | |
| | | | | | | | | | | |
| *31.2 | | (a) | | | | | | | | | |
| | | | | | | | | | | |
| **32.1 | | (a) | | | | | | | | | |
| | | | | | | | | | | |
| **32.2 | | (a) | | | | | | | | | |
| | | | | | | | | | | |
| *97 | | (a) | | | | | | | | | |
| | | | | | | | | | | |
| *101 | | (a) | | The following financial information from Bread Financial Holdings, Inc.’s Annual Report on Form 10-K for the fiscal year ended December 31, 2024, formatted in Inline XBRL: (i) Consolidated Statements of Income, (ii) Consolidated Statements of Comprehensive Income, (iii) Consolidated Balance Sheets, (iv) Consolidated Statements of Stockholders’ Equity, (v) Consolidated Statements of Cash Flows and (vi) Notes to the Audited Consolidated Financial Statements. | | | | | | | |
| | | | | | | | | | | |
| *104 | | (a) | | Cover Page Interactive Data File (formatted as Inline XBRL and contained in Exhibit 101) | | | | | | | |
______________________________
*Filed herewith
** Furnished herewith
+ Management contract, compensatory plan or arrangement
∧ Certain exhibits have been omitted pursuant to Item 601(a)(5) of Regulation S-K. Bread Financial Holdings, Inc. hereby undertakes to furnish supplementally copies of any of the omitted exhibits upon request by the U.S. Securities and Exchange Commission.
(a)Bread Financial Holdings, Inc.
(b)WFN Credit Company, LLC
(c)World Financial Network Credit Card Master Trust
(d)World Financial Network Credit Card Master Note Trust
Item 16. Form 10-K Summary.
None.
INDEX TO THE AUDITED CONSOLIDATED FINANCIAL STATEMENTS
BREAD FINANCIAL HOLDINGS, INC.
| | | | | |
| Page |
| Bread Financial Holdings, Inc. and Subsidiaries | |
| |
| |
| |
| |
| |
| |
| |
REPORT OF INDEPENDENT REGISTERED PUBLIC ACCOUNTING FIRM
To the Stockholders and the Board of Directors of Bread Financial Holdings, Inc.
Opinion on the Financial Statements
We have audited the accompanying Consolidated Balance Sheets of Bread Financial Holdings, Inc. and subsidiaries (the “Company”) as of December 31, 2024 and 2023, the related Consolidated Statements of Income, Comprehensive Income, Stockholders’ Equity, and Cash Flows for each of the three years in the period ended December 31, 2024, and the related notes (collectively referred to as the “financial statements”). In our opinion, the financial statements present fairly, in all material respects, the financial position of the Company as of December 31, 2024 and 2023, and the results of its operations and its cash flows for each of the three years in the period ended December 31, 2024, in conformity with accounting principles generally accepted in the United States of America.
We have also audited, in accordance with the standards of the Public Company Accounting Oversight Board (United States) (PCAOB), the Company’s internal control over financial reporting as of December 31, 2024, based on criteria established in Internal Control — Integrated Framework (2013) issued by the Committee of Sponsoring Organizations of the Treadway Commission and our report dated February 14, 2025, expressed an unqualified opinion on the Company’s internal control over financial reporting.
Basis for Opinion
These financial statements are the responsibility of the Company’s management. Our responsibility is to express an opinion on the Company’s financial statements based on our audits. We are a public accounting firm registered with the PCAOB and are required to be independent with respect to the Company in accordance with the U.S. federal securities laws and the applicable rules and regulations of the Securities and Exchange Commission and the PCAOB.
We conducted our audits in accordance with the standards of the PCAOB. Those standards require that we plan and perform the audit to obtain reasonable assurance about whether the financial statements are free of material misstatement, whether due to error or fraud. Our audits included performing procedures to assess the risks of material misstatement of the financial statements, whether due to error or fraud, and performing procedures that respond to those risks. Such procedures included examining, on a test basis, evidence regarding the amounts and disclosures in the financial statements. Our audits also included evaluating the accounting principles used and significant estimates made by management, as well as evaluating the overall presentation of the financial statements. We believe that our audits provide a reasonable basis for our opinion.
Critical Audit Matter
The critical audit matter communicated below is a matter arising from the current-period audit of the financial statements that was communicated or required to be communicated to the audit committee and that (1) relates to accounts or disclosures that are material to the financial statements and (2) involved our especially challenging, subjective, or complex judgments. The communication of critical audit matters does not alter in any way our opinion on the financial statements, taken as a whole, and we are not, by communicating the critical audit matter below, providing a separate opinion on the critical audit matter or on the accounts or disclosures to which it relates.
Allowance for Credit Losses for credit card loans — Refer to Notes 1 and 3 to the financial statements
Critical Audit Matter Description
The Allowance for credit losses is an estimate of expected credit losses, measured over the estimated life of its credit card loans, that considers forecasts of future economic conditions in addition to information about past events and current conditions. The estimate under the credit reserving methodology referred to as the Current Expected Credit Loss (CECL) model is significantly influenced by the composition, characteristics and quality of the Company’s credit card portfolio, as well as the prevailing economic conditions and forecasts utilized. The estimate of the Allowance for credit losses for credit card loans includes an estimate for uncollectible principal as well as unpaid interest and fees. Principal losses, net of recoveries are deducted from the Allowance for credit losses. Losses for unpaid interest and fees, as well as any adjustments to the Allowance for credit losses associated with unpaid interest and fees are recorded as a reduction to
Interest and fees on loans. The Allowance for credit losses is maintained through an adjustment to the Provision for credit losses and is evaluated for appropriateness.
In estimating its Allowance for credit losses for credit card loans, management uses modeling and estimation techniques based on historical loss experience, current conditions, reasonable and supportable forecasts and other relevant factors. These models utilize historical data and applicable macroeconomic variables with statistical analysis and behavioral relationships, to determine expected credit performance. The Company’s quantitative estimate of expected credit losses under CECL is impacted by certain forecasted economic factors. The Company considers the forecast used to be reasonable and supportable over the estimated life of the credit card loans, with no reversion period. In addition to the quantitative estimate of expected credit losses, the Company also incorporates qualitative adjustments for certain factors such as Company-specific risks, changes in current economic conditions that may not be captured in the quantitatively derived results, or other relevant factors to ensure the Allowance for credit losses reflects the Company’s best estimate of current expected credit losses within the credit card loans balance.
Given the significant judgments made by management in estimating its Allowance for credit losses related to credit card loans, performing audit procedures to evaluate the reasonableness of the estimated Allowance for credit losses, including procedures to evaluate the qualitative adjustments, required a high degree of auditor judgment and an increased extent of effort, including the need to involve our credit modeling specialists.
How the Critical Audit Matter Was Addressed in the Audit
•We tested the design and operating effectiveness of management’s controls over the determination and review of model methodology, significant assumptions and qualitative adjustments.
•We evaluated whether the method (including the model), data, and significant assumptions are appropriate in the context of the applicable financial reporting framework.
•We tested the completeness and accuracy of the historical data used in management’s models.
•With assistance from credit modeling specialists, we evaluated whether the model is suitable for determining the estimate, which included understanding the model methodology and logic, whether the selected method for estimating credit losses is appropriate and whether the significant assumptions were reasonable.
•We evaluated the reasonableness of the selection of forecasted macroeconomic variables, considered alternative forecasted scenarios and evaluated any contradictory evidence.
•We evaluated whether judgments have been applied consistently to the model and that any qualitative adjustments to the output of the model are consistent with the measurement objective of the applicable financial reporting framework and are appropriate in the circumstances.
•We considered any contradictory evidence that arose while performing our procedures, and whether or not this evidence was indicative of management bias.
/s/ Deloitte & Touche LLP
Columbus, Ohio
February 14, 2025
We have served as the Company’s auditor since 1998.
REPORT OF INDEPENDENT REGISTERED PUBLIC ACCOUNTING FIRM
To the Stockholders and the Board of Directors of Bread Financial Holdings, Inc.
Opinion on Internal Control over Financial Reporting
We have audited the internal control over financial reporting of Bread Financial Holdings, Inc. and subsidiaries (the “Company”) as of December 31, 2024, based on criteria established in Internal Control — Integrated Framework (2013) issued by the Committee of Sponsoring Organizations of the Treadway Commission (COSO). In our opinion, the Company maintained, in all material respects, effective internal control over financial reporting as of December 31, 2024, based on criteria established in Internal Control — Integrated Framework (2013) issued by COSO.
We have also audited, in accordance with the standards of the Public Company Accounting Oversight Board (United States) (PCAOB), the Consolidated Financial Statements as of and for the year ended December 31, 2024, of the Company and our report dated February 14, 2025, expressed an unqualified opinion on those financial statements.
Basis for Opinion
The Company’s management is responsible for maintaining effective internal control over financial reporting and for its assessment of the effectiveness of internal control over financial reporting, included in the accompanying Management’s Report on Internal Control over Financial Reporting. Our responsibility is to express an opinion on the Company’s internal control over financial reporting based on our audit. We are a public accounting firm registered with the PCAOB and are required to be independent with respect to the Company in accordance with the U.S. federal securities laws and the applicable rules and regulations of the Securities and Exchange Commission and the PCAOB.
We conducted our audit in accordance with the standards of the PCAOB. Those standards require that we plan and perform the audit to obtain reasonable assurance about whether effective internal control over financial reporting was maintained in all material respects. Our audit included obtaining an understanding of internal control over financial reporting, assessing the risk that a material weakness exists, testing and evaluating the design and operating effectiveness of internal control based on the assessed risk, and performing such other procedures as we considered necessary in the circumstances. We believe that our audit provides a reasonable basis for our opinion.
Definition and Limitations of Internal Control over Financial Reporting
A company’s internal control over financial reporting is a process designed to provide reasonable assurance regarding the reliability of financial reporting and the preparation of financial statements for external purposes in accordance with generally accepted accounting principles. A company’s internal control over financial reporting includes those policies and procedures that (1) pertain to the maintenance of records that, in reasonable detail, accurately and fairly reflect the transactions and dispositions of the assets of the company; (2) provide reasonable assurance that transactions are recorded as necessary to permit preparation of financial statements in accordance with generally accepted accounting principles, and that receipts and expenditures of the company are being made only in accordance with authorizations of management and directors of the company; and (3) provide reasonable assurance regarding prevention or timely detection of unauthorized acquisition, use, or disposition of the company’s assets that could have a material effect on the financial statements.
Because of its inherent limitations, internal control over financial reporting may not prevent or detect misstatements. Also, projections of any evaluation of effectiveness to future periods are subject to the risk that controls may become inadequate because of changes in conditions, or that the degree of compliance with the policies or procedures may deteriorate.
/s/ Deloitte & Touche LLP
Columbus, Ohio
February 14, 2025
BREAD FINANCIAL HOLDINGS, INC.
CONSOLIDATED STATEMENTS OF INCOME
| | | | | | | | | | | | | | | | | |
| Years Ended December 31, |
| 2024 | | 2023 | | 2022 |
| (Millions, except per share amounts) | |
| Interest income | | | | | |
| Interest and fees on loans | $ | 4,820 | | | $ | 4,961 | | | $ | 4,615 | |
| Interest on cash and investment securities | 204 | | | 184 | | | 69 | |
| Total interest income | 5,024 | | | 5,145 | | | 4,684 | |
| Interest expense | | | | | |
| Interest on deposits | 608 | | | 541 | | | 243 | |
| Interest on borrowings | 352 | | | 338 | | | 260 | |
| Total interest expense | 960 | | | 879 | | | 503 | |
| Net interest income | 4,064 | | | 4,266 | | | 4,181 | |
| Non-interest income | | | | | |
| Interchange revenue, net of retailer share arrangements | (381) | | | (335) | | | (469) | |
| Gain on portfolio sale | 11 | | | 230 | | | — | |
| Other | 144 | | | 128 | | | 114 | |
| Total non-interest income | (226) | | | 23 | | | (355) | |
| Total net interest and non-interest income | 3,838 | | | 4,289 | | | 3,826 | |
| Provision for credit losses | 1,397 | | | 1,229 | | | 1,594 | |
| Total net interest and non-interest income, after provision for credit losses | 2,441 | | | 3,060 | | | 2,232 | |
| Non-interest expenses | | | | | |
| Employee compensation and benefits | 897 | | | 867 | | | 779 | |
| Card and processing expenses | 326 | | | 428 | | | 359 | |
| Information processing and communication | 300 | | | 301 | | | 274 | |
| Marketing expenses | 147 | | | 161 | | | 180 | |
| Depreciation and amortization | 90 | | | 116 | | | 113 | |
| Other | 300 | | | 219 | | | 227 | |
| Total non-interest expenses | 2,060 | | | 2,092 | | | 1,932 | |
| Income from continuing operations before income taxes | 381 | | | 968 | | | 300 | |
| Provision for income taxes | 102 | | | 231 | | | 76 | |
| Income from continuing operations | 279 | | | 737 | | | 224 | |
Loss from discontinued operations, net of income taxes (1) | (2) | | | (19) | | | (1) | |
| Net income | $ | 277 | | | $ | 718 | | | $ | 223 | |
| | | | | |
| Basic income per share (Note 21) | | | | | |
| Income from continuing operations | $ | 5.63 | | | $ | 14.79 | | | $ | 4.48 | |
| Loss from discontinued operations | $ | (0.05) | | | $ | (0.40) | | | $ | (0.01) | |
| Net income per share | $ | 5.58 | | | $ | 14.39 | | | $ | 4.47 | |
| | | | | |
| Diluted income per share (Note 21) | | | | | |
| Income from continuing operations | $ | 5.54 | | | $ | 14.74 | | | $ | 4.47 | |
| Loss from discontinued operations | $ | (0.05) | | | $ | (0.40) | | | $ | (0.01) | |
| Net income per share | $ | 5.49 | | | $ | 14.34 | | | $ | 4.46 | |
| | | | | |
| Weighted average common shares outstanding (Note 21) | | | | | |
| Basic | 49.6 | | 49.8 | | 49.9 |
| Diluted | 50.4 | | 50.0 | | 50.0 |
___________________________________________________________
(1) Includes amounts that related to the previously disclosed discontinued operations associated with the spinoff of our former LoyaltyOne segment in 2021 and the sale of our former Epsilon segment in 2019. For additional information refer to Note 1, “Description of Business, Basis of Presentation and Significant Accounting Policies” to the audited Consolidated Financial Statements.
See Notes to the audited Consolidated Financial Statements.
BREAD FINANCIAL HOLDINGS, INC.
CONSOLIDATED STATEMENTS OF COMPREHENSIVE INCOME
| | | | | | | | | | | | | | | | | |
| Years Ended December 31, |
| 2024 | | 2023 | | 2022 |
| (Millions) | |
| Net income | $ | 277 | | | $ | 718 | | | $ | 223 | |
| | | | | |
| Other comprehensive (loss) income | | | | | |
| Unrealized (loss) gain on available-for-sale debt securities | (4) | | | 2 | | | (25) | |
| Tax benefit | 1 | | | — | | | 6 | |
| Unrealized (loss) gain on available-for-sale debt securities, net of tax | (3) | | | 2 | | | (19) | |
| | | | | |
| | | | | |
| | | | | |
| | | | | |
| | | | | |
| | | | | |
| | | | | |
| | | | | |
| | | | | |
| | | | | |
| | | | | |
| Other comprehensive (loss) income, net of tax | (3) | | | 2 | | | (19) | |
| | | | | |
| Total comprehensive income, net of tax | $ | 274 | | | $ | 720 | | | $ | 204 | |
See Notes to the audited Consolidated Financial Statements.
BREAD FINANCIAL HOLDINGS, INC.
CONSOLIDATED BALANCE SHEETS
| | | | | | | | | | | |
| December 31, |
| 2024 | | 2023 |
| (Millions, except per share amounts) | |
| ASSETS | | | |
| Cash and cash equivalents | $ | 3,679 | | | $ | 3,590 | |
| Credit card and other loans | | | |
| Total credit card and other loans (includes loans available to settle obligations of consolidated variable interest entities: 2024, $12,408; 2023, $12,844) | 18,896 | | | 19,333 | |
| Allowance for credit losses | (2,241) | | | (2,328) | |
| Credit card and other loans, net | 16,655 | | | 17,005 | |
| Investments (Fair value: 2024 and 2023, $217) | 266 | | | 253 | |
| Property and equipment, net | 142 | | | 167 | |
| Goodwill and intangible assets, net | 746 | | | 762 | |
| Other assets | 1,403 | | | 1,364 | |
| Total assets | $ | 22,891 | | | $ | 23,141 | |
| LIABILITIES AND STOCKHOLDERS' EQUITY | | | |
| Deposits | $ | 13,082 | | | $ | 13,620 | |
| Debt issued by consolidated variable interest entities | 4,558 | | | 3,898 | |
| Long-term and other debt | 999 | | | 1,394 | |
| Other liabilities | 1,201 | | | 1,311 | |
| Total liabilities | 19,840 | | | 20,223 | |
| Commitments and contingencies (Note 16) | | | |
| Stockholders’ equity | | | |
| Common stock, $0.01 par value; authorized, 200.0 million shares; issued: 2024, 49.1 million shares; 2023, 49.3 million shares | 1 | | | 1 | |
| Additional paid-in capital | 2,073 | | | 2,169 | |
| Retained earnings | 999 | | | 767 | |
| Accumulated other comprehensive loss | (22) | | | (19) | |
| Total stockholders’ equity | 3,051 | | | 2,918 | |
| Total liabilities and stockholders’ equity | $ | 22,891 | | | $ | 23,141 | |
See Notes to the audited Consolidated Financial Statements.
BREAD FINANCIAL HOLDINGS, INC.
CONSOLIDATED STATEMENTS OF STOCKHOLDERS’ EQUITY
| | | | | | | | | | | | | | | | | | | | | | | | | | | | | | | | | | | | | |
| Common Stock | | Additional
Paid-In
Capital | | | | Retained Earnings (Accumulated
Deficit) | | Accumulated
Other
Comprehensive
Loss | | Total
Stockholders’
Equity |
| Shares | | Amount | | | | | |
| (Millions) | | | | | | | | | | | | | |
| Balance as of December 31, 2021 | 49.8 | | $ | 1 | | | $ | 2,174 | | | | | $ | (87) | | | $ | (2) | | | $ | 2,086 | |
| Net income | — | | — | | | — | | | | | 223 | | | — | | | 223 | |
| Other comprehensive loss | — | | — | | | — | | | | | — | | | (19) | | | (19) | |
| Stock-based compensation | — | | — | | | 33 | | | | | — | | | — | | | 33 | |
| Repurchase of common stock | (0.2) | | — | | | (12) | | | | | — | | | — | | | (12) | |
| Dividends and dividend equivalent rights declared ($0.84 per common share) | — | | — | | | — | | | | | (43) | | | — | | | (43) | |
| Issuance of shares to employees, net of shares withheld for employee taxes | 0.3 | | — | | | (3) | | | | | — | | | — | | | (3) | |
| Balance as of December 31, 2022 | 49.9 | | $ | 1 | | | $ | 2,192 | | | | | $ | 93 | | | $ | (21) | | | $ | 2,265 | |
| Net income | — | | — | | | — | | | | | 718 | | | — | | | 718 | |
| Other comprehensive income | — | | — | | | — | | | | | — | | | 2 | | | 2 | |
| Stock-based compensation | — | | — | | | 44 | | | | | — | | | — | | | 44 | |
| Capped call transactions for convertible senior notes due 2028, net of tax | — | | — | | | (30) | | | | | — | | | — | | | (30) | |
| Repurchase of common stock | (0.9) | | — | | | (35) | | | | | — | | | — | | | (35) | |
| Dividends and dividend equivalent rights declared ($0.84 per common share) | — | | — | | | — | | | | | (44) | | | — | | | (44) | |
| Issuance of shares to employees, net of shares withheld for employee taxes | 0.3 | | — | | | (2) | | | | | — | | | — | | | (2) | |
| Balance as of December 31, 2023 | 49.3 | | $ | 1 | | | $ | 2,169 | | | | | $ | 767 | | | $ | (19) | | | $ | 2,918 | |
Cumulative effect of change in accounting principle (1) | — | | — | | | — | | | | | (1) | | | — | | | — | |
| Net income | — | | — | | | — | | | | | 277 | | | — | | | 277 | |
| Other comprehensive loss | — | | — | | | — | | | | | — | | | (3) | | | (3) | |
| Stock-based compensation | — | | — | | | 54 | | | | | — | | | — | | | 54 | |
| | | | | | | | | | | | | |
| Repurchases of common stock | (1.0) | | — | | | (55) | | | | | — | | | — | | | (55) | |
| Repurchases of Convertible Notes | — | | — | | | (88) | | | | | — | | | — | | | (88) | |
| Dividends and dividend equivalent rights declared ($0.84 per common share) | — | | — | | | — | | | | | (44) | | | — | | | (44) | |
| Issuance of shares to employees, net of shares withheld for employee taxes | 0.8 | | — | | | (7) | | | | | — | | | — | | | (7) | |
| Balance as of December 31, 2024 | 49.1 | | $ | 1 | | | $ | 2,073 | | | | | $ | 999 | | | $ | (22) | | | $ | 3,051 | |
__________________________________
(1)Represents the cumulative effect, net of tax, of adopting the proportional amortization method of accounting for our tax credit investment. For additional information refer to Note 1, “Description of Business, Basis of Presentation and Significant Accounting Policies” to the audited Consolidated Financial Statements.
See Notes to the audited Consolidated Financial Statements
BREAD FINANCIAL HOLDINGS, INC.
CONSOLIDATED STATEMENTS OF CASH FLOWS
| | | | | | | | | | | | | | | | | |
| Years Ended December 31, |
| 2024 | | 2023 | | 2022 |
| (Millions) | |
| CASH FLOWS FROM OPERATING ACTIVITIES | | | | | |
| Net income | $ | 277 | | | $ | 718 | | | $ | 223 | |
| Adjustments to reconcile net income to net cash provided by operating activities | | | | | |
| Provision for credit losses | 1,397 | | | 1,229 | | | 1,594 | |
| Depreciation and amortization | 90 | | | 116 | | | 113 | |
| Deferred income taxes | (85) | | | (68) | | | (245) | |
| Non-cash stock compensation | 54 | | | 44 | | | 33 | |
| Amortization of deferred financing costs | 21 | | | 26 | | | 24 | |
| Amortization of deferred origination costs | 92 | | | 92 | | | 86 | |
| Gain on portfolio sale | (11) | | | (230) | | | — | |
| Loss on debt extinguishment and repurchased Convertible Notes | 117 | | | 7 | | | — | |
| Change in other operating assets and liabilities | | | | | |
| Change in other assets | 42 | | | 28 | | | (134) | |
| Change in other liabilities | (109) | | | — | | | 87 | |
| Other | (26) | | | 25 | | | 67 | |
| Net cash provided by operating activities | 1,859 | | | 1,987 | | | 1,848 | |
| CASH FLOWS FROM INVESTING ACTIVITIES | | | | | |
| Change in credit card and other loans | (840) | | | (1,154) | | | (3,222) | |
| Proceeds from sale of credit card loan portfolios | 101 | | | 2,499 | | | — | |
| Purchases of credit card loan portfolios | (377) | | | (473) | | | (1,804) | |
| Purchases of investments | (31) | | | (50) | | | (43) | |
| Maturities of investments | 14 | | | 14 | | | 30 | |
| Other, including capital expenditures | (36) | | | (48) | | | (72) | |
| Net cash (used in) provided by investing activities | (1,169) | | | 788 | | | (5,111) | |
| CASH FLOWS FROM FINANCING ACTIVITIES | | | | | |
| Unsecured borrowings under debt agreements | 300 | | | 1,401 | | | 218 | |
| Repayments/maturities of unsecured borrowings under debt agreements | (894) | | | (1,882) | | | (319) | |
| Debt issued by consolidated variable interest entities | 2,390 | | | 2,592 | | | 4,248 | |
| Repayments/maturities of debt issued by consolidated variable interest entities | (1,727) | | | (4,807) | | | (3,587) | |
| Net (decrease) increase in deposits | (541) | | | (209) | | | 2,778 | |
| Payment of deferred financing costs | (15) | | | (63) | | | (13) | |
| Payment of capped call transactions | — | | | (39) | | | — | |
| Dividends paid | (43) | | | (42) | | | (43) | |
| Repurchase of common stock | (55) | | | (35) | | | (12) | |
| Other | (7) | | | (2) | | | (3) | |
| Net cash (used in) provided by financing activities | (592) | | | (3,086) | | | 3,267 | |
| Change in cash, cash equivalents and restricted cash | 98 | | | (311) | | | 4 | |
| Cash, cash equivalents and restricted cash at beginning of period | 3,616 | | | 3,927 | | | 3,923 | |
| Cash, cash equivalents and restricted cash at end of period | $ | 3,714 | | | $ | 3,616 | | | $ | 3,927 | |
| SUPPLEMENTAL CASH FLOW INFORMATION | | | | | |
| Cash paid during the year for interest | $ | 922 | | | $ | 861 | | | $ | 466 | |
| Cash paid during the year for income taxes, net | $ | 227 | | | $ | 292 | | | $ | 338 | |
| Cash and cash equivalents reconciliation | | | | | |
| Cash and cash equivalents | $ | 3,679 | | | $ | 3,590 | | | $ | 3,891 | |
| Restricted cash included within Other Assets | 35 | | | 26 | | | 36 | |
| Total cash, cash equivalents and restricted cash | $ | 3,714 | | | $ | 3,616 | | | $ | 3,927 | |
The Consolidated Statements of Cash Flows are presented with the combined cash flows from continuing and discontinued operations.
See Notes to the audited Consolidated Financial Statements.
BREAD FINANCIAL HOLDINGS, INC.
NOTES TO THE AUDITED CONSOLIDATED FINANCIAL STATEMENTS
1. DESCRIPTION OF BUSINESS, BASIS OF PRESENTATION AND SIGNIFICANT ACCOUNTING POLICIES
DESCRIPTION OF THE BUSINESS
We are a tech-forward financial services company that provides simple, personalized payment, lending, and saving solutions to millions of U.S. consumers. Our payment solutions, including Bread Financial general purpose credit cards and savings products, empower our customers and their passions for a better life. Additionally, we deliver growth for some of the most recognized brands in travel & entertainment, health & beauty, jewelry and specialty apparel through our private label and co-brand credit cards and pay-over-time products providing choice and value to our shared customers.
Our partner base consists of large consumer-based businesses, including well-known brands such as (alphabetically) AAA, Academy Sports + Outdoors, Caesars, Dell Technologies, Hard Rock International, the NFL, Saks Fifth Avenue, Signet, Ulta and Victoria’s Secret, as well as small- and medium-sized businesses (SMBs). Our partner base is well diversified across a broad range of industries and retail verticals, including travel and entertainment, health and beauty, jewelry, sporting goods, home goods, technology and electronics and the industry in which we first began, specialty apparel. We believe our comprehensive suite of payment, lending and saving solutions, along with our related marketing and data and analytics, allows us to offer products relevant across all customer segments (Gen Z, Millennial, Gen X and Baby Boomers). The breadth and quality of our product and service offerings, coupled with our customer-centric approach, have enabled us to establish and maintain long-standing partner relationships. We operate our business through a single reportable segment, with our primary source of revenue being from Interest and fees on loans from our various credit card and other loan products, and to a lesser extent from contractual relationships with our brand partners.
Throughout this report, unless stated or the context implies otherwise, the terms “Bread Financial”, “BFH”, the “Company”, “we”, “our” or “us” refer to Bread Financial Holdings, Inc. and its subsidiaries on a consolidated basis. References to “Parent Company” refer to Bread Financial Holdings, Inc. on a parent-only standalone basis. In addition, in this report we may refer to the retailers and other companies with whom we do business as our “partners”, “brand partners”, or “clients”, provided that the use of the term “partner”, “partnering” or any similar term does not mean or imply a formal legal partnership, and is not meant in any way to alter the terms of Bread Financial’s relationship with any third parties. We offer our credit products through our insured depository institution subsidiaries, Comenity Bank and Comenity Capital Bank, which together are referred to herein as the “Banks”.
BASIS OF PRESENTATION
These audited Consolidated Financial Statements have been prepared in accordance with accounting principles generally accepted in the United States of America (GAAP). The audited Consolidated Financial Statements also include amounts that relate to the previously disclosed discontinued operations associated with the spinoff of our former LoyaltyOne segment in 2021 and the sale of our former Epsilon segment in 2019. Such amounts have been classified within Discontinued operations and primarily relate to the after-tax impact of contractual indemnification and tax-related matters. For additional information about our previously disclosed discontinued operations please refer to Note 22, “Discontinued Operations and Bank Holding Company Financial Presentation” to the audited Consolidated Financial Statements included in our Annual Report on Form 10-K for the year ended December 31, 2021.
BREAD FINANCIAL HOLDINGS, INC.
NOTES TO THE AUDITED CONSOLIDATED FINANCIAL STATEMENTS – (CONTINUED)
SIGNIFICANT ACCOUNTING POLICIES
We present our accounting policies within the Notes to the audited Consolidated Financial Statements to which they relate; the table below lists such accounting policies and the related Notes. The remaining significant accounting policies applied are included following the table.
| | | | | | | | | | | | | | |
| Significant Accounting Policy | | Note Number | | Note Title |
| Credit Card and Other Loans | | Note 2 | | Credit Card and Other Loans |
| Allowance for Credit Losses | | Note 3 | | Allowance for Credit Losses |
| Transfers of Financial Assets | | Note 4 | | Securitizations |
| Investments | | Note 5 | | Investments |
| Goodwill | | Note 6 | | Goodwill and Intangible Assets, Net |
| Intangible Assets, Net | | Note 6 | | Goodwill and Intangible Assets, Net |
| Leases | | Note 8 | | Leases |
| Derivatives | | Note 12 | | Derivatives and Hedging Activities |
| Stock Compensation Expense | | Note 19 | | Stockholders' Equity |
| Income Taxes | | Note 20 | | Income Taxes |
| Earnings Per Share | | Note 21 | | Earnings Per Share |
Principles of Consolidation
The accompanying audited Consolidated Financial Statements include the accounts of BFH and all subsidiaries in which we have a controlling financial interest. For voting interest entities, a controlling financial interest is determined when we are able to exercise control over the operating and financial decisions of the investee. For variable interest entities (VIEs), which are themselves determined based on the amount and characteristics of the equity in the entity, we have a controlling financial interest when we are determined to be the primary beneficiary. The primary beneficiary is the party having both the power to exercise control over the activities that most significantly impact the VIE’s financial performance, as well as the obligation to absorb the losses of, or the right to receive the benefits from, the VIE that could potentially be significant to that VIE. We are the primary beneficiary of our master securitization trusts and therefore consolidate these securitization trusts within our audited Consolidated Financial Statements.
In cases where we do not have a controlling financial interest, but we are able to exert significant influence over the operating and financial decisions of the entity, we account for such investments under the equity method.
All intercompany transactions have been eliminated.
Segment Reporting
We operate as a single reportable segment, where we manage our business and assess financial performance on a consolidated basis. Our single reportable segment's primary source of revenue is from Interest and fees on loans from our various credit card and other loan products, and to a lesser extent from contractual relationships with our brand partners. Our primary expense is Provision for credit losses driven by Net principal losses from our various credit card and other loan products. Our key metrics include the growth in and yield on our credit card and other loan portfolios, Net interest margin, operating leverage and Efficiency ratio, our various capital ratios, and credit-related ratios such as our Delinquency rate, Net principal loss rate and Reserve rate. Our Chief Operating Decision Maker (CODM) regularly receives and reviews consolidated operating results and uses our key metrics to evaluate the performance of the Company, focusing primarily on Income from continuing operations before income taxes from the Consolidated Statements of Income, to make decisions regarding the allocation of resources and assessment of performance. The function of CODM is performed by our President and Chief Executive Officer.
BREAD FINANCIAL HOLDINGS, INC.
NOTES TO THE AUDITED CONSOLIDATED FINANCIAL STATEMENTS – (CONTINUED)
Amounts Based on Estimates and Judgments
The preparation of financial statements in conformity with GAAP requires management to make estimates and judgments about future events that affect the reported amounts of assets and liabilities, and disclosure of contingent assets and liabilities at the date of the audited Consolidated Financial Statements, as well as the reported amounts of income and expenses during the reporting periods. The most significant of those estimates and judgments relate to our Allowance for credit losses, Provision for income taxes and Goodwill; actual results could differ.
Consolidated Statements of Income
Our primary source of revenue is from Interest and fees on loans from our various credit card and other loan products, and to a lesser extent from contractual relationships with our brand partners. The following describes our recognition policies across the various sources of revenue we earn.
Interest and fees on loans: Represents revenue earned on customer accounts owned by us, and is recognized in the period earned in accordance with the contractual provisions of the credit agreements. Interest and fees continue to accrue on all accounts, except in limited circumstances, until the account balance and all related interest and fees are paid or charged-off, which happens in the month during which an account becomes 180 days past due for credit card loans or 120 days past due for other loans, which consist primarily of our pay-over-time products, which include installment loans and “split-pay” offerings. Charge-offs for unpaid interest and fees, as well as any adjustments to the Allowance for credit losses associated with unpaid interest and fees, are recorded as a reduction of Interest and fees on loans. Direct loan origination costs on Credit card and other loans are deferred and amortized on a straight-line basis over a one-year period for credit card loans, or for other loans, over the life of the loan; and are recorded as a reduction of Interest and fees on loans. As of December 31, 2024 and 2023, the remaining unamortized deferred direct loan origination costs were $45 million and $60 million, respectively, and included in Total credit card and other loans.
Interest on cash and investment securities: Represents revenue earned on cash and cash equivalents as well as investments
in debt securities, and is recognized in the period earned.
Interchange revenue, net of retailer share arrangements: Represents revenue earned from merchants, including our brand partners, and cardholders from processing and servicing accounts, and is recognized as such services are performed. Revenue earned from merchants, including our brand partners, primarily consists of merchant and interchange fees, which are transaction fees charged to the merchant for the processing of credit card transactions and are recognized at the time the cardholder transaction occurs. Costs of cardholder reward arrangements are recognized when the rewards are earned by the cardholders and are generally classified as a reduction of revenue with the related liability included in Other liabilities on the Consolidated Balance Sheets. Our credit card program agreements may also provide for royalty payments, or retailer share arrangements, to our brand partners based on purchase volume or if certain contractual incentives are met, such as if the economic performance of the program exceeds a contractually defined threshold, or for new accounts acquired. These amounts are recorded as a reduction of revenue in the period incurred.
Other non-interest income: Represents ancillary revenues earned from cardholders, consisting primarily of monthly fees from the purchase of certain payment protection products, which are recognized based on the average cardholder account balance over time and can be cancelled at any point by the cardholder, as well as gains or losses on the sales of loan portfolios, and losses from our equity method investment in Loyalty Ventures Inc. (LVI).
Contract costs: We recognize as an asset contract costs, such as up-front payments made pursuant to contractual agreements with brand partners. Such costs are deferred and recognized on a straight-line basis over the term of the related agreement. Depending on the nature of the contract costs, the amortization is recorded as a reduction to Non-interest income, or as a charge to Non-interest expenses, in the Consolidated Statements of Income. Amortization of contract costs recorded as a reduction of Interchange revenue, net of retailer share arrangements, was $51 million, $59 million and $72 million for the years ended December 31, 2024, 2023 and 2022, respectively; amortization of contract costs recorded across various Non-interest expense categories totaled $12 million in each of those same years. As of December 31, 2024 and 2023, the remaining unamortized contract costs were $228 million and $285 million, respectively, and are included in Other assets on the Consolidated Balance Sheets.
We perform an impairment assessment when events or changes in circumstances indicate that the carrying amount of our contract costs may not be recoverable. No impairment charges were recognized during either of the years ended
BREAD FINANCIAL HOLDINGS, INC.
NOTES TO THE AUDITED CONSOLIDATED FINANCIAL STATEMENTS – (CONTINUED)
December 31, 2024 or 2022. However, for the year ended December 31, 2023 we recognized a $7 million impairment charge in Other non-interest expenses in our Consolidated Statements of Income for certain of our deferred contract costs.
Interest expense: Represents interest incurred primarily to fund Credit card and other loans, general corporate purposes and liquidity needs, and is recognized as incurred. Interest expense is divided between Interest on deposits, which relates to interest expense on Deposits taken from customers, and Interest on borrowings, which relates to interest expense on our Long-term and other debt.
Card and processing expenses: Primarily represents costs incurred in relation to customer service activities, including embossing, and postage and mailing, as well as fraud and credit bureau inquiries. These costs are expensed as incurred.
Information processing and communication expenses: Represents costs incurred in relation to data processing, and software license and maintenance charges. These costs are expensed as incurred.
Marketing expenses: Represents costs incurred in campaign development and initial placement of advertising, which are expensed in the period in which the advertising first takes place. Other marketing expenses are expensed as incurred.
Consolidated Balance Sheets
Cash and cash equivalents: Includes cash and due from banks, interest-bearing cash balances such as those invested in money market funds, as well as other highly liquid short-term investments with an original maturity of three months or less, along with restricted cash. As of December 31, 2024 and 2023, respectively, cash and due from banks was $330 million and $410 million, interest-bearing cash balances were $3.1 billion and $2.9 billion, and short-term investments were $272 million and $250 million. Restricted cash primarily includes cash restricted for principal and interest repayments of debt issued by our consolidated VIEs, as well as other restricted amounts including cash pledged to collateralize our derivative contracts. Restricted cash is recorded in Other assets on the Consolidated Balance Sheets and totaled $35 million and $26 million as of December 31, 2024 and 2023, respectively.
Property and equipment: Furniture, equipment, buildings and leasehold improvements are carried at cost less accumulated depreciation, and depreciation is recognized on a straight-line basis. Costs incurred during construction are capitalized; depreciation begins once the asset is placed in service and is also recognized on a straight-line basis. Our furniture and equipment is depreciated over the estimated useful lives of the assets, which range from less than one year to 10 years, while leasehold improvements are depreciated over the lesser of the remaining terms of the respective leases, or the useful lives of the improvements, and range from less than one year to 20 years. Depreciation expense, including purchased software, totaled $20 million, $19 million and $19 million for the years ended December 31, 2024, 2023 and 2022, respectively.
Costs associated with the acquisition or development of internal-use software are also capitalized and recorded in Property and equipment. Once the internal-use software is ready for its intended use, the cost is amortized on a straight-line basis over the software’s estimated useful life. As of December 31, 2024, our internal-use software has estimated useful lives ranging from one year to 10 years. As of December 31, 2024 and 2023, the net amount of unamortized capitalized internal-use software costs included in Property and equipment on the Consolidated Balance Sheets was $71 million and $78 million, respectively. Amortization expense on capitalized internal-use software costs totaled $35 million, $60 million and $68 million for the years ended December 31, 2024, 2023 and 2022, respectively.
We review long-lived assets and asset groups for impairment whenever events or circumstances indicate their carrying amounts may not be recoverable. An impairment is recognized if the carrying amount is not recoverable and exceeds the asset or asset group’s fair value. No impairment was recognized during the years ended December 31, 2024, 2023 and 2022.
CONCENTRATIONS
We depend on a limited number of large partner relationships for a significant portion of our revenue. As of and for the year ended December 31, 2024, our five largest credit card programs (based on Total net interest and non-interest income) accounted for approximately 48% of our Total net interest and non-interest income excluding the gain on sale and 38% of our End-of-period credit card and other loans. In particular, our programs with (alphabetically) Signet Jewelers, Ulta Beauty and Victoria’s Secret & Co. and its retail affiliates, each accounted for 10% or more of our Total net interest and
BREAD FINANCIAL HOLDINGS, INC.
NOTES TO THE AUDITED CONSOLIDATED FINANCIAL STATEMENTS – (CONTINUED)
non-interest income for the year ended December 31, 2024. A decrease in business from, or the loss of, any of our significant partners for any reason, could have a material adverse effect on our business.
RECENTLY ADOPTED AND RECENTLY ISSUED ACCOUNTING STANDARDS
| | | | | | | | |
| Accounting Standards Recently Adopted |
| Standard | Guidance | Timing and Financial Statement Impact |
Investments – Equity Method and Joint Ventures: Accounting for Investments in Tax Credit Structures Using the Proportional Amortization Method
Issued March 2023 | Expands the election to apply the proportional amortization method of accounting to tax credit investments beyond low-income-housing tax credit investments, when certain conditions are met. | Adopted under the modified retrospective method on January 1, 2024, which resulted in an insignificant decrease to retained earnings.
Adoption did not have a significant impact on our results of operations, financial position, regulatory risk-based capital, or on our operational processes, controls and governance in support of the new guidance. |
Segment Reporting: Improvements to Reportable Segment Disclosures
Issued November 2023 | Requires interim and annual disclosure of significant segment expense categories and amounts that are regularly provided to the CODM, as well as disclosure of the aggregate amount and description of other segment items beyond significant segment expenses. | Adopted effective with this report.
Adoption did not significantly impact our disclosures for our single reportable segment, our financial reporting, or our operational processes, controls, and governance in support of the new guidance. |
| Accounting Standards Recently Issued but Not Yet Adopted |
| Standard | Guidance | Timing and Financial Statement Impact |
Income Taxes: Improvements to Income Tax Disclosures
Issued December 2023 | Requires greater disaggregation of rate reconciliation and income taxes paid information, as well as other changes intended to enhance the transparency and decision-usefulness of income tax disclosures. | Effective beginning with our Annual Report on Form 10-K for the year ending December 31, 2025. Early adoption is permitted, although we did not early adopt.
Adoption will require enhancements to our income tax disclosures but is not expected to have a significant impact on our financial reporting, or on our operational processes, controls and governance in support of the new guidance. |
Debt – Debt with Conversion and Other Options: Induced Conversions of Convertible Debt Instruments
Issued November 2024 | Improves the relevance and consistency in application of the induced conversion guidance for (a) convertible debt instruments with cash conversion features and (b) debt instruments that are not currently convertible. | Effective January 1, 2026. Early adoption is permitted, although we do not plan to early adopt.
Adoption is not expected to have a significant impact on our financial reporting as the new guidance aligns with our recent accounting for the repurchases of certain of our Convertible Senior Notes due 2028. Additionally, adoption is not expected to have a significant impact on our operational processes, controls and governance in support of the new guidance. |
Income Statement – Reporting Comprehensive Income – Expense Disaggregation Disclosures: Disaggregation of Income Statement Expenses
Issued November 2024 | Requires disaggregated disclosure of certain income statement expenses on the face of the Consolidated Statements of Income, and further disaggregation of certain expense captions into specified categories in disclosures within the notes to the Consolidated Financial Statements. | Effective beginning with our Annual Report on Form 10-K for the year ending December 31, 2027, and effective for interim reporting periods beginning in 2028. Early adoption is permitted, although we do not plan to early adopt.
Adoption is not expected to have a significant impact on our financial reporting, or on our operational processes, controls and governance in support of the new guidance. |
2. CREDIT CARD AND OTHER LOANS
Our payment and lending solutions result in the origination of Credit card and other loans, which are recorded at the time a borrower enters into a point-of-sale transaction with a merchant. Credit card loans represent revolving lines of credit and
BREAD FINANCIAL HOLDINGS, INC.
NOTES TO THE AUDITED CONSOLIDATED FINANCIAL STATEMENTS – (CONTINUED)
have a range of terms that include credit limits, interest rates and fees, which can be revised over time based on new information about the cardholder, in accordance with applicable regulations and the governing terms and conditions. Cardholders choosing to make a payment of less than the full balance due, instead of paying in full, are subject to finance charges and are required to make monthly payments based on pre-established amounts. Other loans, which consist primarily of our pay-over-time products, which include installment loans and “split-pay” offerings, have a range of fixed terms such as interest rates, fees and repayment periods, and borrowers are required to make pre-established monthly payments over the term of the loan in accordance with the applicable terms and conditions. Credit card and other loans include principal and any related accrued interest and fees and are presented on the Consolidated Balance Sheets net of the Allowance for credit losses. We continue to accrue interest and fee income on all accounts, except in limited circumstances, until the related balance and all related interest and fees are paid or charged-off.
We generally classify our Credit card and other loans as held for investment. We sell a majority of our credit card loans originated by Comenity Bank (CB) and by Comenity Capital Bank (CCB), to certain of our master securitization trusts (the Trusts), which are consolidated VIEs, and therefore these loans are restricted for securitization investors. All new originations of Credit card and other loans are determined to be held for investment at origination because we have the intent and ability to hold them for the foreseeable future. In determining what constitutes the foreseeable future, we consider the average life and homogenous nature of our Credit card and other loans. In assessing whether our Credit card and other loans continue to be held for investment, we also consider capital levels and scheduled maturities of funding instruments used. The assertion regarding the intent and ability to hold Credit card and other loans for the foreseeable future can be made with a high degree of certainty given the maturity distribution of our direct-to-consumer (DTC or retail) deposits and other funding instruments; the demonstrated ability to replace maturing time-based deposits and other borrowings with new deposits or borrowings; and historic payment activity on Credit card and other loans. Due to the homogenous nature of our credit card loans, amounts are classified as held for investment on a brand partner portfolio basis. From time to time certain credit card loans are classified as held for sale, as determined on a brand partner portfolio basis. We carry held for sale loans at the lower of aggregate cost or fair value and continue to recognize finance charges on an accrual basis. Cash flows associated with Credit card and other loans originated or purchased for investment are classified as Cash flows from investing activities, regardless of any subsequent change in intent and ability.
The following table provides Credit card and other loans, as of December 31:
| | | | | | | | | | | |
| 2024 | | 2023 |
| (Millions) | |
| Credit card loans | $ | 18,586 | | | $ | 18,999 | |
| Other loans | 310 | | | 334 | |
Total credit card and other loans (1)(2) | 18,896 | | | 19,333 | |
| Less: Allowance for credit losses | (2,241) | | | (2,328) | |
| Credit card and other loans, net | $ | 16,655 | | | $ | 17,005 | |
__________________________________(1)Includes $12.4 billion and $12.8 billion of Credit card and other loans available to settle obligations of consolidated VIEs as of December 31, 2024 and 2023, respectively.
(2)Includes $378 million and $371 million of accrued interest and fees that have not yet been billed to cardholders as of December 31, 2024 and 2023, respectively.
BREAD FINANCIAL HOLDINGS, INC.
NOTES TO THE AUDITED CONSOLIDATED FINANCIAL STATEMENTS – (CONTINUED)
Credit Card and Other Loans Aging
The following table provides the delinquency trends of our Credit card and other loans portfolio, based on the amortized cost, as of the dates presented:
| | | | | | | | | | | | | | | | | | | | | | | | | | | | | | | | | | | |
| Aging Analysis of Delinquent Amortized Cost Credit Card and Other Loans (1) | | | | |
| 31 to 60 Days Past Due | | 61 to 90 Days Past Due | | 91 or more Days Past Due | | Total | | Total
Current | | Total |
| (Millions) | |
| December 31, 2024 | $ | 369 | | | $ | 288 | | | $ | 730 | | | $ | 1,387 | | | $ | 17,105 | | | $ | 18,492 | |
| | | | | | | | | | | |
| December 31, 2023 | $ | 422 | | | $ | 323 | | | $ | 809 | | | $ | 1,554 | | | $ | 17,373 | | | $ | 18,927 | |
______________________________
(1)Other loans delinquencies have been included with credit card loan delinquencies in the table above, as amounts were insignificant as of each period presented. As permitted by GAAP, the primary difference between the amortized cost basis included in the table above and the carrying value of our Credit card and other loans relates to the exclusion of unbilled finance charges and fees from the amortized cost basis. As of December 31, 2024 and 2023, accrued interest and fees that have not yet been billed to cardholders were $378 million and $371 million, respectively, included in Credit card and other loans on the Consolidated Balance Sheets.
From time to time we may re-age cardholders’ accounts, with the intent of assisting delinquent cardholders who have experienced financial difficulties but who demonstrate both an ability and willingness to repay the amounts due, this practice affects credit card loan delinquencies and principal losses. Accounts meeting specific defined criteria are re-aged when the cardholder makes one or more consecutive payments aggregating to a certain pre-defined amount of their account balance. Upon re-aging, the outstanding balance of a delinquent account is returned to current status. Our re-aged accounts as a percentage of Total credit card and other loans represented 4.1%, 2.6% and 1.4%, for the years ended December 31, 2024, 2023, and 2022 respectively. Our re-aging practices comply with regulatory guidelines.
Credit Quality Indicators for Our Credit Card and Other Loans
Given the nature of our business, the credit quality of our assets, in particular our Credit card and other loans, is a key determinant underlying our ongoing financial performance and overall financial condition. When it comes to our Credit card and other loans portfolio, we closely monitor Delinquency rates and Net principal loss rates, which reflect, among other factors, our underwriting, the inherent credit risk in our portfolio and the success of our collection and recovery efforts. These rates also reflect, more broadly, the general macroeconomic conditions, including the compounding effect of persistent inflation relative to wage growth, and higher interest rates. Our Delinquency and Net principal loss rates are also impacted by the size of our Credit card and other loans portfolio, which serves as the denominator in the calculation of these rates. Accordingly, changes in the size of our portfolio (whether due to credit tightening, acquisitions or dispositions of portfolios or otherwise) may cause movements in our Delinquency and Net principal loss rates that are not necessarily indicative of the underlying credit quality of the overall portfolio.
Delinquencies: An account is contractually delinquent if we do not receive the minimum payment due by the specified due date. Our policy is to continue to accrue interest and fee income on all accounts, except in limited circumstances, until the balance and all related interest and fees are paid or charged-off. After an account becomes 30 days past due, a proprietary collection scoring algorithm automatically scores the risk of the account becoming further delinquent; based upon the level of risk indicated, a collection strategy is deployed. If after exhausting all in-house collection efforts we are unable to collect on the account, we may engage collection agencies or outside attorneys to continue those efforts, or sell the charged-off balances.
The Delinquency rate is calculated by dividing outstanding principal balances that are contractually delinquent (i.e., principal balances greater than 30 days past due) as of the end of the period, by the outstanding principal amount of Credit card and other loans as of the same period-end. As of December 31, 2024 and 2023, our Delinquency rates were 5.9% and 6.5%, respectively.
Net Principal Losses: Our net principal losses include the principal amount of losses that are deemed uncollectible, less recoveries, and exclude charged-off interest, fees and third-party fraud losses (including synthetic fraud). Charged-off interest and fees reduce Interest and fees on loans, while third-party fraud losses are recorded in Card and processing
BREAD FINANCIAL HOLDINGS, INC.
NOTES TO THE AUDITED CONSOLIDATED FINANCIAL STATEMENTS – (CONTINUED)
expenses. Our credit card loans, including unpaid interest and fees, are generally charged-off in the month during which an account becomes 180 days past due. Our pay-over-time products, which include installment loans and “split-pay” offerings, including unpaid interest, are generally charged-off when a loan becomes 120 days past due. However, in the case of a customer bankruptcy or death, Credit card and other loans, including unpaid interest and fees, as applicable, are charged-off 60 days after receipt of the notification of the bankruptcy or death, but in any case no later than 180 days past due for credit card loans and 120 days past due for installment loans and “split-pay” offerings. We record the actual losses for unpaid interest and fees as a reduction to Interest and fees on loans, which were $1,027 million, $954 million and $651 million for the years ended December 31, 2024, 2023 and 2022, respectively.
The Net principal loss rate is calculated by dividing net principal losses for the period by the Average credit card and other loans for the same period. Beginning in January 2024, we revised the calculation of Average credit card and other loans to more closely align with industry practice by incorporating an average daily balance. Prior to 2024, Average credit card and other loans represent the average balance of the loans at the beginning and end of each month, averaged over the periods indicated. For the years ended December 31, 2024 and 2023, our Net principal loss rates were 8.2% and 7.5%, respectively.
Overall Credit Quality: As part of our credit risk management activities for our credit card loans portfolio, we assess overall credit quality by reviewing information from credit bureaus and other sources relating to our cardholders’ broader credit performance. We utilize VantageScore (Vantage) credit scores to assist in our assessment of credit quality. Vantage credit scores are obtained at origination of the account and are refreshed monthly thereafter to assist in predicting customer behavior. We categorize these Vantage credit scores into the following three credit score categories: (i) 661 or higher, which are considered the strongest credits and therefore have the lowest credit risk; (ii) 601 to 660, considered to have moderate credit risk; and (iii) 600 or less, which are considered weaker credits and therefore have the highest credit risk. In certain limited circumstances there are customer accounts for which a Vantage score is not available and we use alternative sources to assess credit risk and predict behavior. The table below excludes less than 0.1% of the total credit card loans balance as of both December 31, 2024 and 2023, representing those customer accounts for which a Vantage credit score is not available. The following table reflects the distribution of credit card loans by Vantage score as of December 31:
| | | | | | | | | | | | | | | | | | | | | | | | | | | | | | | | | | | |
| Vantage |
| 2024 | | 2023 |
| 661 or
Higher | | 601 to
660 | | 600 or
Less | | 661 or
Higher | | 601 to
660 | | 600 or
Less |
| Credit card loans | 58 | % | | 27 | % | | 15 | % | | 57 | % | | 27 | % | | 16 | % |
As part of our credit risk management activities for our Other loans portfolio, we also assess overall credit quality by reviewing information from credit bureaus. We have historically utilized Fair Isaac Corporation (FICO) credit scores to assist in our assessment of the credit quality for our Other loans portfolio, but in early 2024 we completed a transition to Vantage scoring. The scoring scale produced by both FICO and Vantage is similar in that scores of 600 or less are considered weaker scores and as per our categorization method would have the highest credit risk. The amortized cost basis of Other loans totaled $298 million and $317 million as of December 31, 2024 and 2023, respectively. As of December 31, 2024, approximately 84% of these loans were originated with customers with scores of 661 or above, and correspondingly approximately 16% of these loans were originated with customers with scores below 661. Similarly, as of December 31, 2023, approximately 82% and 18% of these loans were originated with customers with FICO scores of 661 or above, and below 661, respectively.
Modified Credit Card Loans
Consumer Relief Programs
As part of our collections strategy, we may offer temporary and short term programs in order to improve the likelihood of collections and meet the needs of our customers. For example, as a result of hurricanes Helene and Milton in 2024 we froze delinquency progression for cardholders in Federal Emergency Management Agency identified impact zones for one billing cycle. Our modifications, for customers who have requested assistance and meet certain qualifying requirements, come in the form of reduced payment requirements, interest rate reductions and late fee waivers. We do not offer programs involving the forgiveness of principal. These temporary loan modifications may assist in cases where we believe the customer will recover from the short-term hardship and resume scheduled payments. Under these consumer relief programs, those accounts receiving relief may not advance to the next delinquency cycle, including charge-off, in the same time frame that would have occurred had the relief not been granted. We evaluate our consumer relief programs to
BREAD FINANCIAL HOLDINGS, INC.
NOTES TO THE AUDITED CONSOLIDATED FINANCIAL STATEMENTS – (CONTINUED)
determine if they represent a more than insignificant delay in payment granted to borrowers experiencing financial difficulty, in which case they would then be considered a Loan Modification. Loans in these short term programs that are determined to be Loan Modifications, will be included as such in the disclosure below.
Credit Card Loans – Modifications for Borrowers Experiencing Financial Difficulty (Loan Modifications)
In instances where cardholders are experiencing financial difficulty, we may modify our credit card loans with the intention of minimizing losses and improving collectability, while providing cardholders with financial relief; such credit card loans are classified as Loan Modifications, exclusive of the temporary, short-term consumer relief programs described above. Loan Modifications include concessions consisting primarily of a reduced minimum payment, late fee waiver, and/or an interest rate reduction. The majority of concessions remain in place for a period no longer than 12 months; however, for certain modifications the concessions remain in place through the payoff of the credit card loans if the cardholder complies with the terms of the program.
Loan Modification concessions do not include the forgiveness of unpaid principal, but may involve the reversal of certain unpaid interest or fee assessments, and the cardholder’s ability to make future purchases is either limited, or suspended until the cardholder successfully exits from the modification program. In accordance with the terms of our workout programs, the credit agreement reverts back to its original contractual terms (including the contractual interest rate) when the customer exits the program, which is either when all payments have been made in accordance with the program, or when the customer defaults out of the program.
Loan Modifications are collectively evaluated for impairment on a pooled basis in measuring the appropriate Allowance for credit losses. The following table provides information relating to credit card loans to borrowers experiencing financial difficulty that were granted a concession under a Loan Modification program during the years ended December 31:
| | | | | | | | | | | | | | | | | | | | | | | | | | | | | | | | | | | |
| 2024 | | 2023 |
| Account Balances (1) | | % of Total Credit Card Loans | | Weighted Average Interest Rate Reduction (% points) | | Account Balances (1) | | % of Total Credit Card Loans | | Weighted Average Interest Rate Reduction (% points) |
| (Millions, except percentages) | | | | | | | | | | | |
| Credit card loans | $ | 303 | | | 1.7 | % | | 22.0 | % | | $ | 269 | | | 1.4 | % | | 19.2 | % |
__________________________________
(1)Represents the outstanding balances as of December 31, 2024 and 2023, respectively, of all Loan Modifications undertaken in the past twelve months, for credit card loans that remain in modification programs on December 31, 2024 and 2023, respectively. The outstanding balances include principal, accrued interest and fees.
Interest income on these impaired credit card loans is accounted for in the same manner as non-impaired credit card loans, and cash collections are allocated according to the same payment hierarchy methodology applied for credit card loans not in Loan Modification programs.
The following table provides the performance of our credit card loans that were modified within the 12 months prior to the dates presented and remain in a Loan Modification program as of the dates presented:
| | | | | | | | | | | | | | | | | | | | | | | | | | | | | | | | | | | |
| Aging Analysis of Delinquent Amortized Cost Loan Modifications – Credit Card Loans | | | | |
| 31 to 60 Days Past Due | | 61 to 90 Days Past Due | | 91 or more Days Past Due | | Total | | Total
Current | | Total |
| (Millions) | | | | | | | | | | | |
| December 31, 2024 | $ | 21 | | | $ | 18 | | | $ | 22 | | | $ | 61 | | | $ | 242 | | | $ | 303 | |
| | | | | | | | | | | |
| December 31, 2023 | $ | 17 | | | $ | 16 | | | $ | 22 | | | $ | 55 | | | $ | 214 | | | $ | 269 | |
BREAD FINANCIAL HOLDINGS, INC.
NOTES TO THE AUDITED CONSOLIDATED FINANCIAL STATEMENTS – (CONTINUED)
The following table provides additional information regarding credit card Loan Modifications that have subsequently defaulted within 12 months of their modification dates for the years ended December 31; the probability of default is factored into the Allowance for credit losses:
| | | | | | | | | | | | | | | | | | | | | | | |
| 2024 | | 2023 |
| Number of
Modifications | | Outstanding
Balance | | Number of
Modifications | | Outstanding
Balance |
| (Millions, except for Number of modifications) | | | | | | | |
| Loan Modifications that subsequently defaulted | 15,663 | | $ | 29 | | | 14,196 | | $ | 23 | |
Unfunded Lending Commitments
We manage potential credit risk in unfunded lending commitments by reviewing each potential customer’s credit application and evaluating the applicant’s financial history and ability and perceived willingness to repay. Credit card loans are made primarily on an unsecured basis, and our Cardholders reside throughout the U.S. and are not significantly concentrated in any one geographic area.
We manage our potential risk in credit commitments by limiting the total amount of credit, both by individual customer and across our credit card loan portfolio, by monitoring the size and maturity of our loan portfolio and applying consistent risk-based underwriting standards reflective of current and anticipated macroeconomic conditions. We have the unilateral ability to cancel or reduce unused credit card lines at any time. Unused credit card lines available to cardholders totaled approximately $103 billion and $113 billion as of December 31, 2024 and 2023, respectively. While this amount represented the total available unused credit card lines, we have not experienced and do not anticipate that all cardholders will access their entire available line at any given point in time.
Portfolio Sales
As of December 31, 2024 and 2023, there were no credit card loans held for sale.
In late April 2024 we sold a credit card loan portfolio for cash consideration of $102 million. We recognized a gain on sale in April 2024 that was subsequently adjusted during the second half of 2024 to recognize an incremental amount due to us under the purchase and sale agreement.
We previously announced the non-renewal of our contract with BJ’s Wholesale Club (BJ’s) and the sale of the BJ’s portfolio, which closed in late February 2023, for a total purchase price of $2.5 billion on a loan portfolio of $2.3 billion, resulting in a $230 million Gain on portfolio sale.
Portfolio Acquisitions
In August 2024, we acquired a credit card loan portfolio for cash consideration of $378 million.
In October 2023, we acquired a credit card loan portfolio for cash consideration of $388 million.
3. ALLOWANCE FOR CREDIT LOSSES
The Allowance for credit losses represents our estimate of expected credit losses over the estimated life of our Credit card and other loans, incorporating future macroeconomic forecasts in addition to information about past events and current conditions. Our estimate under the Current Expected Credit Loss (CECL) approach is significantly influenced by the composition, characteristics and quality of our portfolio of Credit card and other loans, as well as the prevailing economic conditions and forecasts utilized. The Allowance for credit losses includes an estimate for uncollectible principal as well as unpaid interest and fees. Principal losses, net of recoveries are deducted from the Allowance for credit losses. Losses of unpaid interest and fees as well as any adjustments to the Allowance for credit losses associated with unpaid interest and fees are recorded as a reduction to Interest and fees on loans. The Allowance for credit losses is maintained through an adjustment to the Provision for credit losses and is evaluated for appropriateness on a quarterly basis.
In estimating our Allowance for credit losses, for each identified segment of loans sharing similar risk characteristics, management uses modeling and estimation techniques based on historical loss experience, current conditions, reasonable
BREAD FINANCIAL HOLDINGS, INC.
NOTES TO THE AUDITED CONSOLIDATED FINANCIAL STATEMENTS – (CONTINUED)
and supportable forecasts and other relevant factors. This modeling uses historical data and applicable macroeconomic variables with statistical analysis and behavioral relationships, to determine expected credit performance. Our quantitative estimate of expected credit losses under CECL is impacted by certain forecasted macroeconomic variables. We consider the macroeconomic forecast used to be reasonable and supportable over the estimated life of the Credit card and other loans portfolio, with no reversion period. In addition to the quantitative estimate of expected credit losses, we also incorporate qualitative adjustments for certain factors such as Company-specific risks, changes in current macroeconomic conditions that may not be captured in the quantitatively derived results, or other relevant factors to ensure the Allowance for credit losses reflects our best estimate of current expected credit losses.
Credit Card Loans
We use a “pooled” approach to estimate expected credit losses for financial assets with similar risk characteristics. We have evaluated multiple risk characteristics across our credit card loans portfolio, and determined delinquency status and overall credit quality to be the most significant characteristics for estimating expected credit losses. To estimate our Allowance for credit losses, we segment our credit card loans on the basis of delinquency status, credit quality risk score and product. These risk characteristics are evaluated on at least an annual basis, or more frequently as facts and circumstances warrant. In determining the estimated life of our credit card loans, payments were applied to the measurement date balance with no payments allocated to future purchase activity. We use a combination of First In First Out and the Credit Card Accountability, Responsibility, and Disclosure Act of 2009 (CARD Act) methodologies to model balance paydown.
Other Loans
We measure our Allowance for credit losses on Other loans, consisting primarily of our installment loans and “split-pay” offerings, using a statistical model to estimate projected losses over the remaining terms of the loans, inclusive of an assumption for prepayments. The model is based on the historical statistical relationship between loan loss performance and certain macroeconomic data pooled based on credit quality risk score, term of the underlying loans, vintage and geographic location. As of December 31, 2024 and 2023, the Allowance for credit losses on Other loans was $30 million and $32 million, respectively.
Allowance for Credit Losses Rollforward
The following table provides our Allowance for credit losses for our Credit card and other loans. The amount of the related Allowance for credit losses on Other loans is insignificant and therefore has been included in the table below for the periods presented:
| | | | | | | | | | | | | | | | | |
| 2024 | | 2023 | | 2022 |
| (Millions) | |
| Beginning balance | $ | 2,328 | | | $ | 2,464 | | | $ | 1,832 | |
| | | | | |
Provision for credit losses (1) | 1,397 | | | 1,229 | | | 1,594 | |
| Change in the estimate for uncollectible unpaid interest and fees | 5 | | | 10 | | | 10 | |
Net principal losses (2) | (1,489) | | | (1,375) | | | (972) | |
| Ending balance | $ | 2,241 | | | $ | 2,328 | | | $ | 2,464 | |
______________________________
(1)Provision for credit losses includes a build/release for the Allowance for credit losses, as well as replenishment of Net principal losses.
(2)Net principal losses are presented net of recoveries of $367 million, $332 million and $187 million for the years ended December 31, 2024, 2023 and 2022, respectively. Net principal losses for the years ended December 31, 2023 and 2022 include an adjustment of $10 million and $5 million, respectively, related to the effects of the purchase of previously written-off accounts that were sold to a third-party debt collection agency; no such adjustment was made in the current period.
For the year ended December 31, 2024, the factors that influenced the decrease in the Allowance for credit losses are lower Credit card and other loans, as well as a modest decrease in the reserve rate over the period. Overall, our reserve rate is nominally lower, 11.9% as of December 31, 2024 compared with 12.0% as of December 31, 2023, reflecting conservative weightings on the economic scenarios in our credit reserve modeling given the wide range of potential 2025
BREAD FINANCIAL HOLDINGS, INC.
NOTES TO THE AUDITED CONSOLIDATED FINANCIAL STATEMENTS – (CONTINUED)
macroeconomic outcomes, which we intend to maintain until we see sustained improvement in delinquencies and an improved macroeconomic outlook.
4. SECURITIZATIONS
We account for transfers of financial assets as either sales or financings. Transfers of financial assets that are accounted for as a sale are removed from the Consolidated Balance Sheets with any realized gain or loss reflected in the Consolidated Statements of Income during the period in which the sale occurs. Transfers of financial assets that are not accounted for as a sale are treated as a financing.
We regularly securitize the majority of our credit card loans through the transfer of those loans to one of our Trusts. We perform the decision making for the Trusts, as well as servicing the cardholder accounts that generate the credit card loans held by the Trusts. In our capacity as a servicer, we administer the loans, collect payments and charge-off uncollectible balances. Servicing fees are earned by a subsidiary, which are eliminated in consolidation.
The Trusts are consolidated VIEs because they have insufficient equity at risk to finance their activities – the issuance of debt securities and notes, collateralized by the underlying credit card loans. Because we perform the decision making and servicing for the Trusts, we have the power to direct the activities that most significantly impact the Trusts’ economic performance (the collection of the underlying credit card loans). In addition, we hold all of the variable interests in the Trusts, with the exception of the liabilities held by third-parties. These variable interests provide us with the right to receive benefits and the obligation to absorb losses, which could be significant to the Trusts. As a result of these considerations, we are deemed to be the primary beneficiary of the Trusts and therefore consolidate the Trusts.
The Trusts issue debt securities and notes, which are non-recourse to us. The collections on the securitized credit card loans held by the Trusts are available only for payment of those debt securities and notes, or other obligations arising in the securitization transactions. For our securitized credit card loans, during the initial phase of a securitization reinvestment period, we generally retain principal collections in exchange for the transfer of additional credit card loans into the securitized pool of assets. During the amortization or accumulation period of a securitization, the investors’ share of principal collections (in certain cases, up to a maximum specified amount each month) is either distributed to the investors or held in an account until it accumulates to the total amount due, at which time it is paid to the investors in a lump sum.
Under the Indentures of each Trust and their Indenture Supplements, we are required to maintain minimum interests in our Trusts ranging from 4% to 10% of the securitized credit card loans. This requirement is met through a transferor’s interest and is supplemented through excess funding deposits which represent cash amounts deposited with the trustee of the securitizations. Cash collateral, restricted deposits are generally released proportionately as investors are repaid. Under the terms of the Trusts, the occurrence of certain triggering events associated with the performance of the securitized credit card loans in each Trust could result in certain required actions, including payment of Trust expenses, the establishment of reserve funds, or early amortization of the debt securities and/or notes, in a worst-case scenario. During the years ended December 31, 2024, 2023 and 2022, no such triggering events occurred.
The following tables provide the total securitized credit card loans, and related delinquencies, and net principal losses of securitized credit card loans for the periods presented:
| | | | | | | | | | | |
| December 31, 2024 | | December 31, 2023 |
| (Millions) | |
| Total credit card loans – available to settle obligations of consolidated VIEs | $ | 12,408 | | | $ | 12,844 | |
| Of which: principal amount of credit card loans 91 days or more past due | $ | 305 | | | $ | 323 | |
| | | | | | | | | | | | | | | | | |
| Year Ended December 31, 2024 | | Year Ended December 31, 2023 | | Year Ended December 31, 2022 |
| (Millions) | |
| Net principal losses of securitized credit card loans | $ | 852 | | | $ | 801 | | | $ | 554 | |
BREAD FINANCIAL HOLDINGS, INC.
NOTES TO THE AUDITED CONSOLIDATED FINANCIAL STATEMENTS – (CONTINUED)
5. INVESTMENTS
Investments include investment securities and various other investments primarily held by the Banks for Community Reinvestment Act (CRA) purposes. Investment securities consist of available-for-sale (AFS) debt securities, which are mortgage-backed securities and municipal bonds, and equity securities, which are mutual funds. Investment securities are carried at fair value on the Consolidated Balance Sheets. We also have other investments, which primarily include a portfolio of investments in certain limited partnerships and limited liability companies accounted for under the equity method, and therefore are recorded at cost and adjusted each period for our share of the investee’s earnings or losses, less any impairment. Other investments also include an insignificant tax credit investment where we elected to apply the proportional amortization method of accounting, for which the impacts of both the amortization of the investment and income tax benefits are fully recognized in the Provision for income taxes.
The following table provides a summary of our Investments as of December 31:
| | | | | | | | | | | |
| 2024 | | 2023 |
| (Millions) | |
| Investment securities | | | |
| Available-for-sale debt securities | $ | 170 | | | $ | 171 | |
| Equity securities | 47 | | | 46 | |
| Total investment securities | 217 | | | 217 | |
| Equity method and other investments | 49 | | | 36 | |
| Total Investments | $ | 266 | | | $ | 253 | |
For AFS debt securities in an unrealized loss position, any estimated credit losses are recognized in the Consolidated Statements of Income by establishing or adjusting an existing Allowance for credit losses for such losses. We typically invest in highly-rated securities with low probabilities of default; therefore, we did not have an Allowance for credit losses as of either December 31, 2024 or 2023, and did not recognize any credit losses for the periods presented. Any unrealized gains, or any portion of an AFS debt security’s non-credit-related unrealized losses are recorded in the Consolidated Statements of Comprehensive Income, net of tax. Realized gains and losses are recorded in Other non-interest expenses in the Consolidated Statements of Income upon disposition of the AFS debt security, using the specific identification method. Gains and losses on investments in equity securities and CRA-related equity method investments are recorded in Other non-interest expenses in the Consolidated Statements of Income.
The table below provides unrealized gains and losses on AFS debt securities as of December 31:
| | | | | | | | | | | | | | | | | | | | | | | | | | | | | | | | | | | | | | | | | | | | | | | |
| 2024 | | 2023 |
| Amortized
Cost | | Unrealized
Gains | | Unrealized
Losses | | Fair Value | | Amortized
Cost | | Unrealized
Gains | | Unrealized
Losses | | Fair Value |
| (Millions) | |
| Available-for-sale securities | $ | 195 | | | $ | — | | | $ | (25) | | | $ | 170 | | | $ | 192 | | | $ | — | | | $ | (21) | | | $ | 171 | |
| Total | $ | 195 | | | $ | — | | | $ | (25) | | | $ | 170 | | | $ | 192 | | | $ | — | | | $ | (21) | | | $ | 171 | |
The following tables provide information about AFS debt securities in a gross unrealized loss position and the length of time that individual securities have been in a continuous unrealized loss position, as of December 31:
| | | | | | | | | | | | | | | | | | | | | | | | | | | | | | | | | | | |
| 2024 |
| Less than 12 months | | 12 Months or Greater | | Total |
| Fair Value | | Unrealized
Losses | | Fair Value | | Unrealized
Losses | | Fair Value | | Unrealized
Losses |
| (Millions) | |
| Available-for-sale securities | $ | 27 | | | $ | — | | | $ | 140 | | | $ | (25) | | | $ | 167 | | | $ | (25) | |
| Total | $ | 27 | | | $ | — | | | $ | 140 | | | $ | (25) | | | $ | 167 | | | $ | (25) | |
BREAD FINANCIAL HOLDINGS, INC.
NOTES TO THE AUDITED CONSOLIDATED FINANCIAL STATEMENTS – (CONTINUED)
| | | | | | | | | | | | | | | | | | | | | | | | | | | | | | | | | | | |
| 2023 |
| Less than 12 months | | 12 Months or Greater | | Total |
| Fair Value | | Unrealized
Losses | | Fair Value | | Unrealized
Losses | | Fair Value | | Unrealized
Losses |
| (Millions) | |
| Available-for-sale securities | $ | 23 | | | $ | — | | | $ | 141 | | | $ | (21) | | | $ | 164 | | | $ | (21) | |
| Total | $ | 23 | | | $ | — | | | $ | 141 | | | $ | (21) | | | $ | 164 | | | $ | (21) | |
As of December 31, 2024, our AFS debt securities included mortgage-backed securities, which do not have a single maturity date, with an amortized cost and estimated fair value of $167 million and $145 million, respectively, and municipal bonds, all of which have a maturity date greater than ten years, with an amortized cost and estimated fair value of $28 million and $25 million, respectively.
There were no realized gains or losses from the sale of any investment securities for the years ended December 31, 2024, 2023 and 2022.
6. GOODWILL AND INTANGIBLE ASSETS, NET
Goodwill
Goodwill is recognized for business acquisitions when the purchase price is higher than the fair value of acquired net assets. Goodwill is not amortized but is tested for impairment at least annually.
We evaluate goodwill for impairment annually as of July 1, or more frequently if events or circumstances arise that would more likely than not reduce the fair value of our single reporting unit below its carrying value. We have the option to first assess qualitative factors to determine whether it is more likely than not that the fair value of our reporting unit is less than its carrying value. Alternatively, we can perform a more detailed quantitative assessment of goodwill impairment.
Qualitative factors considered in evaluating goodwill impairment include macroeconomic conditions, industry and market considerations, our overall financial performance and other relevant entity-specific factors, and/or a sustained decrease in our share price. If, after assessing these qualitative factors we conclude that it is not more likely than not that the fair value of our reporting unit is less than its carrying amount, then the quantitative goodwill impairment test is not necessary. However, if the qualitative factors indicate it is more likely than not that the fair value of our reporting unit is less than its carrying amount, or we elect to skip the qualitative assessment, we would perform a quantitative impairment test.
The quantitative test compares the fair value of our reporting unit with its current carrying amount, including goodwill. When measuring the fair value we use widely accepted valuation techniques, leveraging a combination of the income approach based on discounted cash flows and the market approach based on valuation multiples. The key assumptions used to determine the fair value are primarily unobservable inputs (i.e., Level 3 inputs as defined under GAAP) including internally developed forecasts to estimate future cash flows, growth rates and discount rates, as well as market valuation multiples (for the market approach). Estimated cash flows are based on internal forecasts grounded in historical performance and future expectations. To discount the estimated cash flows, we use the expected cost of equity taking into account a combination of industry and Company-specific factors we believe a third-party market participant would incorporate. We believe the discount rate applied appropriately reflects the risks and uncertainties in the financial markets generally and specifically in our internally developed forecasts. When using valuation multiples under the market approach, we apply comparable publicly traded companies’ multiples (e.g., price to tangible book value or return on tangible equity) to our reporting unit’s operating results. For the years ended December 31, 2024 and 2023, we performed a quantitative assessment in connection with our annual goodwill impairment evaluation and concluded that the fair value of our reporting unit was in excess of its carrying value. For the year ended December 31, 2022, we performed a qualitative assessment and determined that it was more likely than not that the fair value of our reporting unit exceeded its carrying value.
Goodwill was $634 million as of December 31, 2024, 2023 and 2022. No goodwill impairment was recognized during any of those years, and there were no accumulated goodwill impairment losses as of December 31, 2024.
BREAD FINANCIAL HOLDINGS, INC.
NOTES TO THE AUDITED CONSOLIDATED FINANCIAL STATEMENTS – (CONTINUED)
Intangible Assets, net
Our identifiable intangible assets consist of both amortizable and non-amortizable intangible assets. Definite-lived intangible assets are subject to amortization and are amortized on a straight-line basis over their estimated useful lives; indefinite-lived intangible assets are not amortized. We review long-lived assets and asset groups, including intangible assets, for impairment whenever events and circumstances indicate their carrying amounts may not be recoverable; recognizing an impairment if the carrying amount is not recoverable and exceeds the fair value of the asset or asset group.
Intangible assets consisted of the following as of December 31:
| | | | | | | | | | | | | | | | | | | | | | | |
| 2024 |
| Gross
Assets | | Accumulated Amortization | | Net | | Useful Life |
| (Millions) | | | |
| Definite-Lived Assets | | | | | | | |
| Premium on purchased credit card loan portfolios | $ | 221 | | | $ | (113) | | | $ | 108 | | | 3-13 years |
| Non-compete agreements | 2 | | | (2) | | | — | | | 5 years |
| 223 | | | (115) | | | 108 | | | |
| Indefinite-Lived Assets | | | | | | | |
| Tradename | 4 | | | — | | | 4 | | | Indefinite life |
| Total intangible assets | $ | 227 | | | $ | (115) | | | $ | 112 | | | |
| | | | | | | | | | | | | | | | | | | | | | | |
| 2023 |
| Gross
Assets | | Accumulated Amortization | | Net | | Useful Life |
| (Millions) | | | |
| Definite-Lived Assets | | | | | | | |
| | | | | | | |
| Premium on purchased credit card loan portfolios | $ | 231 | | | $ | (108) | | | $ | 123 | | | 5-13 years |
| Non-compete agreements | 2 | | | (1) | | | 1 | | | 5 years |
| $ | 233 | | | $ | (109) | | | $ | 124 | | | |
| Indefinite-Lived Assets | | | | | | | |
| Tradename | 4 | | | — | | | 4 | | | Indefinite life |
| Total intangible assets | $ | 237 | | | $ | (109) | | | $ | 128 | | | |
Amortization expense related to intangible assets was approximately $35 million, $37 million and $26 million for the years ended December 31, 2024, 2023 and 2022, respectively.
The estimated amortization expense related to intangible assets for the next five years and thereafter is as follows for the years ending December 31:
| | | | | |
| (Millions) | |
| 2025 | 30 |
| 2026 | 29 |
| 2027 | 24 |
| 2028 | 7 |
| 2029 | 7 |
| Thereafter | 11 |
| 108 |
BREAD FINANCIAL HOLDINGS, INC.
NOTES TO THE AUDITED CONSOLIDATED FINANCIAL STATEMENTS – (CONTINUED)
7. OTHER ASSETS
The following provides a summary of Other assets as of December 31:
| | | | | | | | | | | |
| 2024 | | 2023 |
| (Millions) | | | |
| Deferred tax asset, net | $ | 708 | | | $ | 629 | |
Deferred contract costs (1) | 228 | | | 285 | |
Accounts receivable, net (2) | 145 | | | 144 | |
| Right-of-use assets – operating leases | 87 | | | 98 | |
Restricted cash (3) | 35 | | | 26 | |
| | | |
Other (4) | 200 | | | 182 | |
| Total other assets | $ | 1,403 | | | $ | 1,364 | |
______________________________
(1)See Note 1, “Description of Business, Basis of Presentation and Significant Accounting Policies” for discussion of impairment of certain deferred contract costs.
(2)Primarily related to federal, state and foreign income tax receivables (including a tax-related receivable in the amount of approximately $50 million, net, which we are entitled to receive through LVI), and amounts receivable from various brand partners.
(3)Restricted cash primarily includes cash restricted for principal and interest repayments of debt issued by our consolidated VIEs, as well as other restricted amounts including cash pledged to collateralize our derivative contracts.
(4)Primarily comprised of prepaid expenses and non-income-based tax receivables.
8. LEASES
We have various operating leases for facilities and equipment which are recorded as lease-related assets (i.e., right-of-use assets) and liabilities for those leases with terms greater than 12 months. We do not have any finance leases. We determine if an arrangement is a lease or contains a lease at inception, and we do not separate lease and non-lease components. Right-of-use assets are recognized as of the lease commencement date at amounts equal to the respective lease liabilities, adjusted for any prepaid lease payments, initial direct costs and lease incentives. Our lease liabilities are recognized as of the lease commencement date, or upon modification of the lease, at the present value of the contractual fixed lease payments, discounted using our incremental borrowing rate (as the rate implicit in the lease is typically not readily determinable). Operating lease expense is recognized on a straight-line basis over the lease term, while variable lease payments are expensed as incurred.
As of December 31, 2024 and 2023, the weighted average discount rate applied was 7.0% and 6.9%, respectively. As of December 31, 2024, our leases have remaining lease terms ranging from one year, to up to 14 years, some of which may include renewal options; the weighted average remaining lease term was 7.5 years and 8.4 years as of December 31, 2024 and 2023, respectively. Leases with an initial term of 12 months or less are not recognized on the Consolidated Balance Sheets; lease expense for these leases is recognized on a straight-line basis over the lease terms.
As with other long-lived assets, right-of-use assets are reviewed for impairment whenever events and circumstances indicate their carrying amounts may not be recoverable.
Total lease expense for the years ended December 31, 2024, 2023 and 2022 was $14 million, $25 million, and $13 million, respectively, including variable lease costs and sublease income, which were insignificant.
Supplemental lease-related cash flow information was as follows for the years ended December 31:
| | | | | | | | | | | | | | | | | |
| 2024 | | 2023 | | 2022 |
| (Millions) | |
| Cash paid for amounts included in the measurement of lease liabilities – operating cash flows | $ | 29 | | | $ | 27 | | | $ | 23 | |
| Right-of-use assets obtained in exchange for operating leases – non-cash | $ | 9 | | | $ | 37 | | | $ | — | |
BREAD FINANCIAL HOLDINGS, INC.
NOTES TO THE AUDITED CONSOLIDATED FINANCIAL STATEMENTS – (CONTINUED)
Future maturities of our operating lease liabilities, by year, were as follows as of December 31, 2024:
| | | | | |
| (Millions) | |
| 2025 | $ | 24 | |
| 2026 | 24 | |
| 2027 | 22 | |
| 2028 | 20 | |
| 2029 | 19 | |
| Thereafter | 61 | |
| Total undiscounted lease liabilities | 170 | |
| Less: Amount representing interest | (42) | |
| Total present value of minimum lease payments | $ | 128 | |
9. DEPOSITS
Deposits were categorized as interest-bearing or non-interest-bearing as follows, as of December 31:
| | | | | | | | | | | |
| 2024 | | 2023 |
| (Millions) | | | |
| Interest-bearing | $ | 13,055 | | | $ | 13,594 | |
| Non-interest-bearing (including cardholder credit balances) | 27 | | | 26 | |
| Total deposits | $ | 13,082 | | | $ | 13,620 | |
Deposits by deposit type were as follows as of December 31:
| | | | | | | | | | | |
| 2024 | | 2023 |
| (Millions) | | | |
| Savings accounts | | | |
| Direct-to-consumer (retail) | $ | 3,226 | | | $ | 2,863 | |
| Wholesale | 3,601 | | | 3,734 | |
| Certificates of deposit | | | |
| Direct-to-consumer (retail) | 4,461 | | | 3,591 | |
| Wholesale | 1,767 | | | 3,406 | |
| Cardholder credit balances | 27 | | | 26 | |
| Total deposits | $ | 13,082 | | | $ | 13,620 | |
The scheduled maturities of certificates of deposit were as follows as of December 31, 2024:
| | | | | |
| (Millions) | |
2025 (1) | $ | 4,769 | |
| 2026 | 581 | |
| 2027 | 660 | |
| 2028 | 187 | |
| 2029 | 31 | |
| Thereafter | — | |
| Total certificates of deposit | $ | 6,228 | |
______________________________
(1)The 2025 balance includes $3 million in unamortized debt issuance costs, which are associated with the entire portfolio of certificates of deposit.
BREAD FINANCIAL HOLDINGS, INC.
NOTES TO THE AUDITED CONSOLIDATED FINANCIAL STATEMENTS – (CONTINUED)
As of December 31, 2024 and 2023, deposits that exceeded applicable Federal Deposit Insurance Corporation (FDIC) insurance limits, which are generally $250,000 per depositor, per insured bank, per ownership category, were estimated to be $574 million (4% of Total deposits) and $509 million (4% of Total deposits), respectively. The measurement of estimated uninsured deposits aligns with regulatory guidelines.
10. BORROWINGS OF LONG-TERM AND OTHER DEBT
Long-term and other debt consisted of the following as of December 31:
| | | | | | | | | | | | | | | | | | | | | | | | | | |
| Description | | 2024 | | 2023 | | Contractual Maturities | | Interest Rates |
| (Millions, except percentages) | | | | | | | | |
| Long-term and other debt: | | | | | | | | |
| Revolving line of credit | | $ | — | | | $ | — | | | October 2028 | | (1) |
| | | | | | | | |
| | | | | | | | |
| | | | | | | | |
| Senior notes due 2026 | | 100 | | | 500 | | | January 2026 | | 7.00% |
| Convertible senior notes due 2028 | | 10 | | | 316 | | | June 2028 | | 4.25% |
| Senior notes due 2029 | | 900 | | | 600 | | | March 2029 | | 9.75% |
| Subtotal | | 1,010 | | | 1,416 | | | | | |
| Less: Unamortized debt issuance costs | | 11 | | | 22 | | | | | |
| Total long-term and other debt | | $ | 999 | | | $ | 1,394 | | | | | |
| | | | | | | | |
| Debt issued by consolidated VIEs: | | | | | | | | |
| Fixed rate asset-backed term note securities | | $ | 1,350 | | | $ | 350 | | | Various – May 2026 to Jul. 2027 | | 4.62% to 5.47% |
| Conduit asset-backed securities | | 3,213 | | | 3,550 | | | Various – Feb. 2025 to Oct. 2025 | | (2) |
| Subtotal | | 4,563 | | | 3,900 | | | | | |
| Less: Unamortized debt issuance costs | | 5 | | | 2 | | | | | |
| Total debt issued by consolidated VIEs | | $ | 4,558 | | | $ | 3,898 | | | | | |
| | | | | | | | |
| Total borrowings of long-term and other debt | | $ | 5,557 | | | $ | 5,292 | | | | | |
______________________________
(1)The interest rate is based upon the Secured Overnight Financing Rate (SOFR) plus an applicable margin.
(2)The interest rate is based upon SOFR, or the asset-backed commercial paper costs of each individual conduit provider plus an applicable margin. As of December 31, 2024, the interest rates ranged from 5.48% to 5.60% with a weighted average rate of 5.54%. As of December 31, 2023, the interest rates ranged from 6.36% to 6.59% with a weighted average rate of 6.48%.
Certain of our long-term debt agreements include various restrictive financial and non-financial covenants. If we do not comply with certain of these covenants and an event of default occurs and remains uncured, the maturity of amounts outstanding may be accelerated and become payable, and, with respect to our credit agreement, the associated commitments may be terminated. As of December 31, 2024, we were in compliance with all such covenants.
Long-term and Other Debt
Throughout 2024, we engaged in a number of financing-related transactions, including offering additional 9.750% Senior Notes due 2029, reducing our Parent Company debt, amending our Revolving Credit Facility to extend the maturity date, entering into separate privately negotiated repurchase agreements with a limited number of holders of our 4.25% Convertible Senior Notes Due 2028, and offering asset-backed term notes through one of our securitization trusts. Each of these transactions, as well as other matters relating to our liquidity and capital resources during the year, are described in more detail below.
Credit Agreement
In June 2023, we entered into our credit agreement with Parent Company, as borrower, certain of our domestic subsidiaries, as guarantors, JPMorgan Chase Bank, N.A., as administrative agent and lender, and various other financial institutions, as lenders, which provides for a $700 million senior unsecured revolving credit facility (the Revolving Credit Facility). In October 2024, we amended our Revolving Credit Facility to extend the maturity date to October 2028, as well as to delete the provisions relating to our prior term loan facility (which was repaid in full and terminated in December
BREAD FINANCIAL HOLDINGS, INC.
NOTES TO THE AUDITED CONSOLIDATED FINANCIAL STATEMENTS – (CONTINUED)
2023) and make certain other amendments. As of December 31, 2024, our Revolving Credit Facility was undrawn and all $700 million remained available for future borrowings under the Revolving Credit Facility.
Senior Notes Due 2026, 2028 and 2029
The Senior Notes set forth below are each governed by their respective indenture that include usual and customary negative covenants and events of default. These Senior Notes are unsecured and are guaranteed on a senior unsecured basis by certain of our existing and future domestic restricted subsidiaries that incur or in any other manner become liable for any debt under our domestic credit facilities, including the Revolving Credit Facility.
7.000% Senior Notes due 2026
In September 2020, we issued and sold $500 million aggregate principal amount of 7.000% Senior Notes due January 15, 2026 (the Senior Notes due 2026). The Senior Notes due 2026 accrue interest on the outstanding principal amount at the rate of 7.000% per annum from September 22, 2020, payable semi-annually in arrears, on March 15 and September 15 of each year, beginning on March 15, 2021. The Senior Notes due 2026 will mature on January 15, 2026, subject to earlier repurchase or redemption. In January 2024, we redeemed $400 million in aggregate principal amount of the Senior Notes due 2026 with the net proceeds from the January 2024 offering of Senior Notes due 2029, together with $100 million of cash on hand. See “—9.750% Senior Notes due 2029” below. Further, in January 2025, with cash on hand we redeemed the remaining $100 million in aggregate principal amount of our Senior Notes due 2026.
4.25% Convertible Senior Notes Due 2028
In June 2023, we issued and sold $316 million aggregate principal amount of 4.25% Convertible Senior Notes due 2028 (the Convertible Notes). The Convertible Notes bear interest at an annual rate of 4.25%, payable semi-annually in arrears on June 15 and December 15 of each year. The Convertible Notes mature on June 15, 2028, unless earlier repurchased, redeemed or converted.
The Convertible Notes are convertible, under certain conditions, until March 15, 2028, and on or after such date without condition, at an initial conversion rate of 26.0247 shares of our common stock per $1,000 principal amount of Convertible Notes, subject to adjustment, which represents a 25% conversion premium based on the last reported sale price of our common stock of $30.74 on June 8, 2023 prior to issuing the Convertible Notes. Upon any such conversion, we will pay cash up to the aggregate principal amount of the Convertible Notes to be converted and pay or deliver, as the case may be, cash, shares of our common stock, or a combination of cash and shares of our common stock (at our election), in respect of the remainder, if any, of our conversion obligation in excess of the aggregate principal amount of the Convertible Notes being converted.
At our option, we may redeem for cash, all or a portion of the Convertible Notes on or after June 21, 2026, and before the 51st scheduled trading day before the maturity date, but only if the closing price of our common stock reaches specified targets as defined in the indenture governing the Convertible Notes. The redemption price will equal 100% of the principal amount of the redeemed Convertible Notes plus accrued interest, if any.
If we experience a fundamental change, as defined in the indenture governing the Convertible Notes, the note holders may require us to purchase for cash all or a portion of their notes, subject to specified exceptions, at a price equal to 100% of the principal amount of the Convertible Notes plus any accrued and unpaid interest.
In connection with the issuance of the Convertible Notes, we entered into privately negotiated capped call (Capped Call) transactions with certain financial institution counterparties. These transactions are expected generally to reduce potential dilution to our common stock upon any conversion of Convertible Notes and/or offset any cash payments we are required to make in excess of the principal amount of the Convertible Notes, with such reduction and/or offset subject to a cap, based on the cap price. The base price of the Capped Call transactions is $38.43, representing a premium of 25% over the last reported sale price of our common stock of $30.74 on June 8, 2023, while the cap price is initially $61.48, which represents a premium of 100% over that same sale price on June 8, 2023. Within the share price range of $38.43 to $61.48 the Capped Call transactions provide economic value to us from the counterparties, upon maturity or earlier conversion. The Capped Call transactions met the conditions under the related accounting guidance for equity classification and are not measured at fair value on a recurring basis; the price paid of $39 million was recorded in Additional paid-in capital, net of tax, in the Consolidated Balance Sheet.
BREAD FINANCIAL HOLDINGS, INC.
NOTES TO THE AUDITED CONSOLIDATED FINANCIAL STATEMENTS – (CONTINUED)
In August 2024 we entered into separate, privately-negotiated repurchase agreements with a limited number of Convertible Note holders to repurchase $238 million aggregate principal amount of outstanding Convertible Notes (the August Repurchases). Subsequently, in September and November of 2024, certain holders of Convertible Notes separately approached us to repurchase Convertible Notes, and we entered into additional separate, privately-negotiated repurchase agreements with such holders of Convertible Notes, repurchasing $68 million aggregate principal amount of outstanding Convertible Notes (the Subsequent Repurchases and, together with the August Repurchases, the Repurchases). The final aggregate purchase price, or settlement value, for the Repurchases was $486 million, which was funded with cash on hand. In connection with the Repurchases, we recognized a $107 million inducement expense in Other non-interest expenses representing the total settlement value, inclusive of transaction fees, in excess of the total conversion value (calculated in accordance with the indenture governing the Convertible Notes), as well as an $88 million reduction in Additional paid-in capital (APIC) related to the total conversion value paid in excess of the carrying value of the Convertible Notes repurchased and a deferred tax impact.
Prior to the repurchases of Convertible Notes described above, the embedded conversion feature within the Convertible Notes was both, considered indexed to the Company’s own equity, and met the equity classification conditions; therefore it did not require accounting as a derivative under GAAP. Upon entering into the repurchase agreements that themselves required cash settlement of our conversion obligation in excess of the aggregate principal amount of the Convertible Notes, the embedded conversion feature for those particular Convertible Notes no longer met the equity classification conditions; therefore requiring bifurcation and derivative accounting. Of the total $107 million recognized in Other non-interest expenses, $53 million represented the mark-to-market on the embedded conversion features over the measurement period from the date the repurchase agreements were executed until settlement thereof. These fair value adjustments were determined using the daily volume-weighted average price per share of Parent Company’s common stock over the measurement period. As all of the repurchases were negotiated and settled during the second half of 2024, there were no embedded conversion features requiring bifurcation and derivative accounting as of December 31, 2024.
Following the settlement of these repurchases, $10 million of Convertible Notes remained outstanding as of December 31, 2024. For these Convertible Notes, the embedded conversion feature is both, considered indexed to the Company’s own equity, and meets the equity classification conditions; therefore not requiring derivative accounting. We may, from time to time, seek to retire or repurchase our remaining outstanding Convertible Notes through cash purchases or exchanges for other securities, in open market purchases, tender offers, privately negotiated transactions or otherwise.
During the fourth quarter of 2024, the Convertible Notes became convertible at the option of the holders (and the Convertible Notes have remained convertible during the first quarter of 2025) due to the last reported sales price per share of Parent Company’s common stock having exceeded 130% of the conversion price for each of at least 20 trading days, whether or not consecutive, during the 30 consecutive trading days ending on, and including, the last trading day of the immediately preceding quarter (i.e., the quarters ended September 30, 2024 and December 31, 2024) (the Common Stock Sale Price Condition). The Common Stock Sale Price Condition is remeasured each quarter, so the Convertible Notes may continue or cease to be convertible in future quarters depending on the performance of our stock price. Upon any such conversion, we will pay cash up to the aggregate principal amount of the Convertible Notes to be converted and pay or deliver, as the case may be, cash, shares of our common stock, or a combination of cash and shares of our common stock (at our election), in respect of the remainder, if any, of our conversion obligation in excess of the aggregate principal amount of the Convertible Notes being converted. As of the date of this report, we have not received any conversion requests.
All of the Capped Call transactions continue to remain outstanding, notwithstanding the repurchases noted above. Although we do not trade or speculate in derivatives, we may seek to opportunistically terminate the Capped Call transactions (in full or in part from time to time) or leave the Capped Call transactions outstanding, possibly until maturity, in any such case with the objective of optimizing the shareholder value we receive under these transactions.
9.750% Senior Notes due 2029
In January 2024, we issued and sold an additional $300 million aggregate principal amount of 9.750% Senior Notes due 2029 (Senior Notes due 2029) at an issue price of 101.00% of principal plus accrued interest from December 22, 2023. The Senior Notes due 2029 issued in January 2024 were issued as additional notes under the same indenture pursuant to which the initial $600 million of Senior Notes due 2029 were issued in December 2023. The Senior Notes due 2029 that were issued in both December 2023 and January 2024 constitute a single series of notes and have the same terms, other than the issue date and issue price. The Senior Notes due 2029 accrue interest on the outstanding principal amount at the rate of
BREAD FINANCIAL HOLDINGS, INC.
NOTES TO THE AUDITED CONSOLIDATED FINANCIAL STATEMENTS – (CONTINUED)
9.750% per annum from December 22, 2023, payable semi-annually in arrears, on March 15 and September 15 of each year, beginning on March 15, 2024. The Senior Notes due 2029 will mature on March 15, 2029, unless subject to earlier repurchase or redemption. We used the proceeds of the January 2024 offering of Senior Notes due 2029, together with $100 million of cash on hand, to fund the redemption of $400 million in aggregate principal amount of our outstanding 7.000% Senior Notes due 2026.
Debt Issued by Consolidated VIEs
An asset-backed security is a security whose value and income payments are derived from and collateralized by a specified pool of underlying assets – in our case, our credit card loans. The sale of the pool of underlying assets to general investors is accomplished through a securitization process. We regularly sell our credit card loans to our Trusts, which are consolidated. The liabilities of these consolidated VIEs include asset-backed securities for which creditors, or beneficial interest holders, do not have recourse to our general credit.
Conduit Facilities
We maintained committed syndicated bank Conduit Facilities to support the funding of our credit card loans for our Trusts. Borrowings outstanding under each private Conduit Facility bear interest at a margin above SOFR, or the asset-backed commercial paper costs of each individual conduit provider.
The table below summarizes our conduit capacities, borrowings and maturities for the periods presented:
| | | | | | | | | | | | | | | | | | | | | | | | | | | | | | | | | | | | | | |
| (Millions) | | December 31, 2023 | | Commitment | | December 31, 2024 | | |
| Conduit Facilities | | Capacity | | Drawn (6) | | Change | | Capacity | | Drawn (6) | | Maturity Date (7) |
| Comenity Bank | | | | | | | | | | | | |
WFNMNT 2009-VFN (1) | | $ | 2,650 | | | $ | 2,015 | | | $ | — | | | $ | 2,650 | | | $ | 1,955 | | | October 2025 |
WFNMT 2009-VFC1 (2) | | 275 | | | 260 | | | (275) | | | — | | | 141 | | | — | |
| Comenity Capital Bank | | | | | | | | | | | | |
WFCMNT 2009-VFN (3) | | 2,250 | | | 1,025 | | | — | | | 2,250 | | | 867 | | | February 2025 |
CCAST 2023-VFN1 (4) | | 250 | | | 250 | | | — | | | 250 | | | 250 | | | September 2025 |
CCAST 2024-VFN1 (5) | | — | | | — | | | 200 | | | 200 | | | — | | | February 2025 |
| Total | | $ | 5,425 | | | $ | 3,550 | | | $ | (75) | | | $ | 5,350 | | | $ | 3,213 | | | |
______________________________
(1)2009-VFN Conduit issued under World Financial Network Credit Card Master Note Trust (WFNMNT).
(2)2009-VFC1 Conduit issued under World Financial Network Credit Card Master Trust III (WFNMT). In October 2024, the revolving period of the 2009-VFC1 Conduit expired and the Conduit Facility entered controlled amortization, meaning the period in which principal collections are accumulated to pay down the outstanding principal amount of the notes issued under the Conduit Facility.
(3)2009-VFN Conduit issued under World Financial Capital Master Note Trust (WFCMNT). In February 2025, the 2009-VFN Conduit commitment will be reduced by $250 million to $2 billion, and the Maturity Date will be extended to February 2026.
(4)2023-VFN1 Conduit issued under Comenity Capital Asset Securitization Trust (CCAST).
(5)2024-VFN1 Conduit issued under CCAST. In February 2025, the 2024-VFN1 Conduit will be retired pursuant to the terms of a termination, consent and waiver agreement.
(6)Amounts drawn do not include $1.1 billion and $1.2 billion of debt issued by the Trusts as of December 31, 2024 and 2023, respectively, which were not sold, but were retained by us as a credit enhancement and therefore have been eliminated from the Total.
(7)Maturity Date with respect to conduit borrowings means the date on which the revolving period for the applicable Conduit Facility expires. The revolving period may be extended or renewed (unless an early amortization event occurs prior to the Maturity Date). Absent the extension or renewal of the revolving period, the Conduit Facility shall enter controlled amortization on the Maturity Date and may no longer be drawn upon.
Fixed Rate Asset-Backed Term Notes
In May 2024, WFNMNT issued $570 million of Series 2024-A public term asset-backed notes, which mature in April 2027. The offering consisted of $500 million of Class A notes with a fixed interest rate of 5.47% per year, $44 million of zero coupon Class M notes, and $26 million of zero coupon Class B notes. The Class M and B notes were retained by us
BREAD FINANCIAL HOLDINGS, INC.
NOTES TO THE AUDITED CONSOLIDATED FINANCIAL STATEMENTS – (CONTINUED)
and eliminated from the Consolidated Balance Sheet. In addition, in August 2024 WFNMNT issued $500 million of Series 2024-B public term asset-backed notes, which mature in July 2027. The offering consisted of $500 million of Class A notes with a fixed interest rate of 4.62% per year.
Maturities
The future principal payments for our Long-term and other debt are as follows, as of December 31, 2024:
| | | | | | | | | | | | | | | | | | | | |
| Year | | Long-Term and Other Debt | | Debt Issued by Consolidated VIEs | | Total |
| (Millions) | | | | |
| 2025 | | $ | — | | | $ | 3,213 | | | $ | 3,213 | |
| 2026 | | 100 | | | 350 | | | 450 | |
| 2027 | | — | | | 1,000 | | | 1,000 | |
| 2028 | | 10 | | | — | | | 10 | |
| 2029 | | 900 | | | — | | | 900 | |
| Thereafter | | — | | | — | | | — | |
| Total maturities | | 1,010 | | | 4,563 | | | 5,573 | |
| Unamortized debt issuance costs | | (11) | | | (5) | | | (16) | |
| | $ | 999 | | | $ | 4,558 | | | $ | 5,557 | |
11. OTHER LIABILITIES
The following provides a summary of Other liabilities as of December 31:
| | | | | | | | | | | |
| 2024 | | 2023 |
| (Millions) | |
| Accounts payable and other brand partner liabilities | $ | 326 | | | $ | 422 | |
Accrued liabilities (1) | 295 | | | 273 | |
| Long-term tax reserves | 250 | | | 286 | |
| Operating lease liabilities | 128 | | | 148 | |
Other (2) | 202 | | | 182 | |
| Total other liabilities | $ | 1,201 | | | $ | 1,311 | |
______________________________
(1)Primarily related to accrued payroll and benefits, marketing, taxes and professional services expenses.
(2)Primarily comprised of cardholder rewards liabilities and long-term unearned revenue.
12. DERIVATIVES AND HEDGING ACTIVITIES
From time to time, we use derivative financial instruments to manage our exposure to various financial risks; we do not trade or speculate in derivatives. Subject to the criteria set forth in GAAP, we will either designate our derivatives in qualifying hedging relationships, or as economic hedges should the criteria in GAAP not be met. All derivatives that we enter into are recognized at fair value in our Consolidated Balance Sheets, where our derivative receivables are included in Other assets and our derivative payables are included in Other liabilities. As permitted by GAAP, when a legally enforceable master netting agreement exists between us and the derivative counterparty, we present derivative receivables and derivative payables with the same counterparty on a net basis in the Consolidated Balance Sheets, including any related cash collateral receivables and payables.
Risk Management Objectives of Using Derivatives
We enter into derivative transactions to support our overall risk management activities. Our primary risks stem from the impact on our earnings and economic value of equity due to changes in interest rates, and to a lesser extent, changes in foreign exchange rates. Beginning in October 2024, we manage our interest rate sensitivity in part by changing the duration
BREAD FINANCIAL HOLDINGS, INC.
NOTES TO THE AUDITED CONSOLIDATED FINANCIAL STATEMENTS – (CONTINUED)
and re-pricing characteristics of a portion of our variable rate credit card loan portfolio by using interest rate swaps. We also use foreign currency forwards to limit our earnings and capital exposures to foreign exchange risk by hedging our limited exposures denominated in foreign currencies, in particular, Canadian dollars. We designate our interest rate swaps as qualifying accounting cash flow hedges, and account for our foreign currency forwards as economic hedges (as the criteria under GAAP for designation have not been met).
See below for additional information on our use of derivatives and how we account for them:
•Cash flow hedges: We designate derivatives as cash flow hedges when they are used to manage our exposure to variability in cash flows attributable to changes in contractually specified interest rates on our variable-rate credit card loans.
Changes in the fair value of derivatives designated as cash flow hedges are recorded as a component of Accumulated other comprehensive loss. Those amounts are reclassified into our Consolidated Statements of Income in the same period during which the hedged forecasted interest accruals impact earnings, and are presented in the same line item as the earnings effect of the hedged items (i.e., Interest and fees on loans).
Specifically, we entered into receive-fixed, pay-floating interest rate swaps to modify the interest rate characteristics of designated credit card loans from a floating rate to a fixed rate in order to reduce the impact of changes in forecasted future cash flows due to fluctuations in market interest rates. As of December 31, 2024, we had outstanding interest rate swaps with a total notional amount of $1.5 billion and the maximum period over which forecasted interest accruals were hedged with these interest rate swaps was approximately 1.8 years. The impacts of our cash flow hedges were insignificant to the Consolidated Financial Statements for the periods presented on both a gross basis and, where applicable, a net basis.
Additionally, within the next 12 months, we expect to reclassify an insignificant loss recognized in Accumulated other comprehensive loss as of December 31, 2024 into our Consolidated Statements of Income. The actual amount reclassified into earnings may vary due to market conditions and adjustments made as part of our ongoing risk management strategy.
•Economic hedges: Our economic hedges use derivatives to hedge the risk of changes in foreign currency exchange rates. Changes in the fair value of derivatives used in economic hedges are recognized in Other non-interest expense in our Consolidated Statements of Income.
As of December 31, 2024 and 2023, we had outstanding foreign currency forwards with a total notional amount of $73 million and $79 million, respectively. The impacts of our economic hedges were insignificant to the Consolidated Financial Statements for the periods presented.
The notional amounts disclosed above are not exchanged on our derivatives. While these notional amounts provide an indication of the volume of our derivative activity, they significantly exceed, in our view, the possible losses that could arise from the associated transactions.
13. OTHER NON-INTEREST INCOME AND OTHER NON-INTEREST EXPENSES
The following table provides the components of Other non-interest income for the years ended December 31:
| | | | | | | | | | | | | | | | | |
| 2024 | | 2023 | | 2022 |
| (Millions) | |
| Payment protection products | $ | 120 | | | $ | 132 | | | $ | 154 | |
| Loss from equity method investment | — | | | (6) | | | (44) | |
| Other | 24 | | | 2 | | | 4 | |
| Total other non-interest income | $ | 144 | | | $ | 128 | | | $ | 114 | |
BREAD FINANCIAL HOLDINGS, INC.
NOTES TO THE AUDITED CONSOLIDATED FINANCIAL STATEMENTS – (CONTINUED)
The following table provides the components of Other non-interest expenses for the years ended December 31:
| | | | | | | | | | | | | | | | | |
| 2024 | | 2023 | | 2022 |
| (Millions) | |
| Professional services and regulatory fees | $ | 112 | | | $ | 128 | | | $ | 142 | |
| Repurchased Convertible Notes | 107 | | | — | | | — | |
| Occupancy expense | 22 | | | 22 | | | 23 | |
Other (1) | 59 | | | 69 | | | 62 | |
| Total other non-interest expense | $ | 300 | | | $ | 219 | | | $ | 227 | |
______________________________
(1)Primarily related to costs associated with various other individually insignificant operating activities.
14. FAIR VALUES OF FINANCIAL INSTRUMENTS
Fair value is defined under GAAP as the price that would be required to sell an asset or paid to transfer a liability in an orderly transaction between market participants at the measurement date; with such a transaction based on the principal market, or in the absence of a principal market the most advantageous market for the specific instrument. GAAP provides for a three-level fair value hierarchy that classifies the inputs to valuation techniques used to measure fair value, defined as follows:
Level 1: Inputs that are unadjusted quoted prices for identical assets or liabilities in active markets that the entity can access.
Level 2: Inputs, other than those included within Level 1, that are observable for the asset or liability, either directly or indirectly, for substantially the full term of the asset or liability, including quoted prices for similar assets or liabilities in active markets, quoted prices for identical or similar assets or liabilities in inactive markets, or inputs other than quoted prices that are observable for the asset or liability.
Level 3: Inputs that are unobservable (e.g., internally derived assumptions) and reflect an entity’s assumptions about estimates market participants would use in pricing the asset or liability based on the best information available under the circumstances. In particular, Level 3 inputs and valuation techniques involve judgment and as a result are not necessarily indicative of amounts we would realize in a current market exchange. The use of different assumptions or estimation techniques may have a material effect on the estimated fair value amounts.
We monitor the market conditions and evaluate the fair value hierarchy levels at least quarterly. For the years ended December 31, 2024 and 2023, there were no transfers into or out of Level 3, and no transfers between Levels 1 and 2.
The following table summarizes the carrying values and fair values of our financial assets and financial liabilities as of December 31:
| | | | | | | | | | | | | | | | | | | | | | | |
| 2024 | | 2023 |
| Carrying
Amount | | Fair
Value | | Carrying
Amount | | Fair
Value |
| (Millions) | |
| Financial assets | | | | | | | |
| Credit card and other loans, net | $ | 16,655 | | | $ | 19,011 | | | $ | 17,005 | | | $ | 19,802 | |
| Investment securities | 217 | | | 217 | | | 217 | | | 217 | |
| Financial liabilities | | | | | | | |
| Deposits | 13,082 | | | 13,087 | | | 13,620 | | | 13,583 | |
| Debt issued by consolidated VIEs | 4,558 | | | 4,572 | | | 3,898 | | | 3,900 | |
| Long-term and other debt | 999 | | | 1,085 | | | 1,394 | | | 1,457 | |
BREAD FINANCIAL HOLDINGS, INC.
NOTES TO THE AUDITED CONSOLIDATED FINANCIAL STATEMENTS – (CONTINUED)
Valuation Techniques Used in the Fair Value Measurement of Financial Assets and Financial Liabilities
Credit card and other loans, net: Our Credit card and other loans are recorded at amortized cost, less the Allowance for credit losses, on the Consolidated Balance Sheets. In estimating the fair values, we use a discounted cash flow model (i.e., Level 3 inputs), primarily because a comparable whole loan sales market for similar loans does not exist, and therefore there is a lack of observable pricing inputs. We use various internally derived inputs, including projected income, discount rates and forecasted write-offs. Economic value attributable to future loans generated by the cardholder accounts is not included in the fair values.
Investment securities: Investment securities consist of AFS debt securities, including both mortgage-backed securities and municipal bonds, as well as equity securities, which are mutual funds, and are recorded at fair value on the Consolidated Balance Sheets. Quoted prices of identical or similar investment securities in active markets are used to estimate the fair values (i.e., Level 1 or Level 2 inputs).
Derivative assets and liabilities: We use derivatives to manage our interest rate and foreign currency risk exposures. When quoted market prices are available and used to value our derivatives, we classify them as Level 1. However, the majority of our derivatives do not have readily available quoted market prices. Therefore, we value most of our derivatives using vendor-based models. We primarily rely on market observable inputs for these models, including, for example, interest rate yield curves and currency rates. These inputs can vary depending on the type of derivatives and nature of the underlying rate, price or index upon which the value of the derivative is based. We typically classify derivatives as Level 2 as significant inputs can be observed in a liquid market and the model itself does not require significant judgment. Our derivatives are included in Other assets or Other liabilities on the Consolidated Balance Sheets. The fair value impacts of our derivative assets and liabilities were insignificant to the Consolidated Financial Statements for the periods presented on both a gross basis and, where applicable, a net basis.
Deposits: Money market and other non-maturity deposits carrying values approximate their fair values because they are short-term in duration and have no defined maturity. GAAP requires that the fair values of deposit liabilities with no stated maturities equal their carrying values and does not permit recognition of the inherent funding value of the instruments. Certificates of deposit are recorded at their historical issuance cost on the Consolidated Balance Sheets, adjusted for unamortized fees, with the fair value being estimated based on the currently observable market rates available to us for similar deposits with similar remaining maturities (i.e., Level 2 inputs). Interest payable is included within Other liabilities on the Consolidated Balance Sheets.
Debt issued by consolidated VIEs: We record Debt issued by our consolidated VIEs at amortized cost (including unamortized fees, issuance costs, premiums and discounts, where applicable) on the Consolidated Balance Sheets. Fair value is estimated based on the currently observable market rates available to us for similar debt instruments with similar remaining maturities or quoted market prices for the same transaction (i.e., Level 2 inputs). Interest payable is included within Other liabilities on the Consolidated Balance Sheets.
Long-term and other debt: We record Long-term and other debt at amortized cost (including unamortized fees, issuance costs, premiums and discounts, where applicable) on the Consolidated Balance Sheets. The fair value is estimated based on the currently observable market rates available to us for similar debt instruments with similar remaining maturities, or quoted market prices for the same transaction (i.e., Level 2 inputs). Interest payable is included within Other liabilities on the Consolidated Balance Sheets.
Financial Instruments Measured at Fair Value on a Recurring Basis
The following tables summarize our financial instruments measured at fair value on a recurring basis, categorized by the fair value hierarchy described in the preceding paragraphs, as of December 31:
| | | | | | | | | | | | | | | | | | | | | | | |
| 2024 |
| Total | | Level 1 | | Level 2 | | Level 3 |
| (Millions) | |
| Investment securities | $ | 217 | | | $ | 47 | | | $ | 170 | | | $ | — | |
| Total assets measured at fair value | $ | 217 | | | $ | 47 | | | $ | 170 | | | $ | — | |
BREAD FINANCIAL HOLDINGS, INC.
NOTES TO THE AUDITED CONSOLIDATED FINANCIAL STATEMENTS – (CONTINUED)
| | | | | | | | | | | | | | | | | | | | | | | |
| 2023 |
| Total | | Level 1 | | Level 2 | | Level 3 |
| (Millions) | |
| Investment securities | $ | 217 | | | $ | 46 | | | $ | 171 | | | $ | — | |
| Total assets measured at fair value | $ | 217 | | | $ | 46 | | | $ | 171 | | | $ | — | |
Assets and Liabilities Measured at Fair Value on a Nonrecurring Basis
Certain assets and liabilities are recognized or disclosed at fair value on a nonrecurring basis, including equity method investments, property and equipment, right-of-use assets, deferred contract costs, goodwill and intangible assets. These assets are not measured at fair value on a recurring basis but are subject to fair value adjustments in certain circumstances, such as upon impairment. We did not have any impairments for the year ended December 31, 2024. For the year ended December 31, 2022, we wrote off $44 million of our equity method investment in LVI, with the remaining $6 million of our investment written off during the year ended December 31, 2023.
Financial Instruments Disclosed but Not Carried at Fair Value
The fair values of financial instruments that are measured at amortized cost are estimates, and require management’s judgment; therefore, these fair value estimates may not be indicative of future fair values, nor can our fair value be estimated by aggregating all of the amounts presented. The following tables summarize our financial assets and financial liabilities that are measured at amortized cost, and not required to be carried at fair value on a recurring basis, as of December 31:
| | | | | | | | | | | | | | | | | | | | | | | |
| 2024 |
| Fair Value | | Level 1 | | Level 2 | | Level 3 |
| (Millions) | |
| Financial assets | | | | | | | |
| Credit card and other loans, net | $ | 19,011 | | | $ | — | | | $ | — | | | $ | 19,011 | |
| Total | $ | 19,011 | | | $ | — | | | $ | — | | | $ | 19,011 | |
| | | | | | | |
| Financial liabilities | | | | | | | |
| Deposits | $ | 13,087 | | | $ | — | | | $ | 13,087 | | | $ | — | |
| Debt issued by consolidated VIEs | 4,572 | | | — | | | 4,572 | | | — | |
| Long-term and other debt | 1,085 | | | — | | | 1,085 | | | — | |
| Total | $ | 18,744 | | | $ | — | | | $ | 18,744 | | | $ | — | |
| | | | | | | | | | | | | | | | | | | | | | | |
| 2023 |
| Fair Value | | Level 1 | | Level 2 | | Level 3 |
| (Millions) | |
| Financial assets | | | | | | | |
| Credit card and other loans, net | $ | 19,802 | | | $ | — | | | $ | — | | | $ | 19,802 | |
| Total | $ | 19,802 | | | $ | — | | | $ | — | | | $ | 19,802 | |
| | | | | | | |
| Financial liabilities | | | | | | | |
| Deposits | $ | 13,583 | | | $ | — | | | $ | 13,583 | | | $ | — | |
| Debt issued by consolidated VIEs | 3,900 | | | — | | | 3,900 | | | — | |
| Long-term and other debt | 1,457 | | | — | | | 1,457 | | | — | |
| Total | $ | 18,940 | | | $ | — | | | $ | 18,940 | | | $ | — | |
BREAD FINANCIAL HOLDINGS, INC.
NOTES TO THE AUDITED CONSOLIDATED FINANCIAL STATEMENTS – (CONTINUED)
15. REGULATORY MATTERS AND CAPITAL ADEQUACY
Regulatory Matters
Our business is subject to extensive federal and state laws and regulations, as well as related regulation and supervision, including by the FDIC, CFPB and other federal and state authorities. Pending and future laws and regulations (federal and state) may adversely impact our business. Without limiting the foregoing, CB is subject to various regulatory capital requirements administered by the State of Delaware and the FDIC. CCB is also subject to various regulatory capital requirements administered by the State of Utah and the FDIC. Failure to meet minimum capital requirements can trigger certain mandatory and possibly additional discretionary actions by our regulators. Under capital adequacy guidelines and the regulatory framework for prompt corrective action, both Banks must meet specific capital guidelines that involve quantitative measures of their assets and liabilities as calculated under regulatory accounting practices. The capital amounts and classification are also subject to qualitative judgments by these regulators about components, risk weightings and other factors. In addition, both Banks are limited in the amounts they can pay as dividends to the Parent Company.
Quantitative measures, established by regulations to ensure capital adequacy, require the Banks to maintain minimum amounts and ratios of Tier 1 capital to average assets, and Common equity tier 1, Tier 1 capital and Total capital, all to risk weighted assets. Failure to meet these minimum capital requirements can result in certain mandatory, and possibly additional discretionary actions by the Banks’ regulators that if undertaken, could have a direct material effect on CB’s and/or CCB’s operating activities, as well as our operating activities. Based on these regulations, as of December 31, 2024 and 2023, each Bank met all capital requirements to which it was subject, and maintained capital ratios in excess of the minimums required to qualify as well capitalized. The Banks seek to maintain capital levels and ratios in excess of the minimum regulatory requirements inclusive of the 2.5% Capital Conservation Buffer. Although Bread Financial is not a bank holding company as defined under the Bank Holding Company Act, we seek to maintain capital levels and ratios in excess of the minimums required for bank holding companies.
BREAD FINANCIAL HOLDINGS, INC.
NOTES TO THE AUDITED CONSOLIDATED FINANCIAL STATEMENTS – (CONTINUED)
As of December 31, 2024 the actual capital ratios and minimum ratios for each Bank, as well as Bread Financial, are as follows:
| | | | | | | | | | | | | | | | | |
| Actual Ratio | | Minimum Ratio for
Capital Adequacy
Purposes | | Minimum Ratio to be
Well Capitalized under
Prompt Corrective
Action Provisions |
| Total Company | | | | | |
Common equity tier 1 capital ratio (1) | 12.4 | % | | 4.5 | % | | 6.5 | % |
Tier 1 capital ratio (2) | 12.4 | | | 6.0 | | | 8.0 | |
Total risk-based capital ratio (3) | 13.8 | | | 8.0 | | | 10.0 | |
Tier 1 leverage capital ratio (4) | 11.5 | | | 4.0 | | | 5.0 | |
Total risk-weighted assets (5) | $ | 19,928 | | | | | |
| | | | | |
| Comenity Bank | | | | | |
Common equity tier 1 capital ratio (1) | 16.5 | % | | 4.5 | % | | 6.5 | % |
Tier 1 capital ratio (2) | 16.5 | | | 6.0 | | | 8.0 | |
Total risk-based capital ratio (3) | 17.9 | | | 8.0 | | | 10.0 | |
Tier 1 leverage capital ratio (4) | 15.3 | | | 4.0 | | | 5.0 | |
| | | | | |
| Comenity Capital Bank | | | | | |
Common equity tier 1 capital ratio (1) | 15.4 | % | | 4.5 | % | | 6.5 | % |
Tier 1 capital ratio (2) | 15.4 | | | 6.0 | | | 8.0 | |
Total risk-based capital ratio (3) | 16.7 | | | 8.0 | | | 10.0 | |
Tier 1 leverage capital ratio (4) | 14.3 | | | 4.0 | | | 5.0 | |
__________________________________
(1)Common equity tier 1 capital ratio represents tier 1 capital divided by total risk-weighted assets. In the calculation of tier 1 capital, we follow the Basel III Standardized Approach and therefore Total stockholders' equity has been reduced, primarily by Goodwill and intangible assets, net.
(2)Tier 1 capital ratio represents tier 1 capital divided by total risk-weighted assets. In the calculation of tier 1 capital, we follow the Basel III Standardized Approach and therefore Total stockholders' equity has been reduced, primarily by Goodwill and intangible assets, net.
(3)Total risk-based capital ratio represents total capital divided by total risk-weighted assets. In the calculation of total capital, we follow the Basel III Standardized Approach and therefore tier 1 capital has been increased by tier 2 capital, which for us is the allowable portion of the Allowance for credit losses.
(4)Tier 1 leverage capital ratio represents tier 1 capital divided by total average assets, after certain adjustments.
(5)Total risk-weighted assets are generally measured by allocating assets, and specified off-balance sheet exposures, to various risk categories as defined by the Basel III Standardized Approach.
We are also involved, from time to time, in reviews, investigations, subpoenas, supervisory actions and other proceedings (both formal and informal) by governmental agencies regarding our business, which could subject us to significant fines, penalties, obligations to change our business practices, significant restrictions on our existing business or ability to develop new business, cease-and-desist orders, safety-and-soundness directives or other requirements resulting in increased expenses, diminished income and damage to our reputation.
On November 20, 2023, following the consent of the Board of Managers of Comenity Servicing LLC (the Servicer), the FDIC issued a consent order to the Servicer. The Servicer is not one of our Bank subsidiaries, but is our wholly-owned subsidiary that services substantially all of our loans. The consent order arose out of the June 2022 transition of our credit card processing services to strategic outsourcing partners and addresses certain shortcomings in the Servicer’s information technology (IT) systems development, project management, business continuity management, cloud operations, and third-party oversight. The Servicer entered into the consent order for the purpose of resolving these matters without admitting or denying any violations of law or regulation set forth in the order. The consent order does not contain any monetary penalties or fines.
BREAD FINANCIAL HOLDINGS, INC.
NOTES TO THE AUDITED CONSOLIDATED FINANCIAL STATEMENTS – (CONTINUED)
The Servicer continues to take significant steps to strengthen the organization’s IT governance and address the other issues identified in the consent order, working diligently to ensure that all requirements of the consent order are satisfied. Without limiting the generality of the foregoing, the Servicer has taken steps to address each provision within the consent order and continues to comply with each ongoing requirement. The Servicer is committed to complying with the longer-term requirements of the consent order, including the enhancement of its compliance management processes and related corporate governance, compliance with the applicable system conversion requirements, and enhanced risk management and reporting. The Servicer has submitted nearly all of the required deliverables under the consent order to the FDIC for its review and consideration. The Board of Directors of each of the Banks continue to oversee the Servicer’s compliance with the requirements of the consent order and provide effective challenge to the Servicer’s management toward that end.
On August 22, 2024, each Bank entered into an agreement with the FDIC to pay civil money penalties (CMPs) of $1 million per Bank. The CMPs, which have been paid in full, arose out of the June 2022 transition of our credit card processing services to strategic outsourcing partners and were related to disruptions to the Banks’ customer reward programs and automatic payments following the transition. These issues were self-identified and remediated timely, and the Banks provided full cooperation with the regulators throughout their examination. The Banks’ agreements to pay the CMPs did not require admission of wrongdoing, and there are no operational limitations on the Banks or our business associated with the CMPs.
16. COMMITMENTS AND CONTINGENCIES
Legal Proceedings
From time to time we are subject to various lawsuits, claims, disputes, or potential claims or disputes, and other proceedings, arising in the ordinary course of business that we believe, based on our current knowledge, will not have a material adverse effect on our business, consolidated financial condition or liquidity, including claims and lawsuits alleging breaches of our contractual obligations, arbitrations, class actions and other litigation, arising in connection with our business activities. However, in light of the uncertainties involved in such matters, including the fact that some pending legal proceedings are at preliminary stages or seek an indeterminate amount of damages, penalties or fines, it is possible that the outcome of legal proceedings could have a material impact on our results of operations. Certain legal proceedings involving us or our subsidiaries are described further below.
On February 20, 2024, we and our general counsel were named as defendants in an adversary proceeding filed by the liquidating trustee in LVI’s Chapter 11 bankruptcy case in the United States Bankruptcy Court for the Southern District of Texas, captioned Pirinate Consulting Group, LLC v. Bread Financial Holdings, Inc., Case No. 24-03027 (Bankr. S.D. Tex.), alleging actual and constructive fraudulent transfers, among other claims, in connection with our spinoff of LVI. Also on February 20, 2024, the liquidating trustee filed an action in the United States District Court for the District of Delaware against us, each of the members of our Board of Directors at the time of the spinoff, and certain members of our management team, captioned Pirinate Consulting Group, LLC v. Bread Financial Holdings, Inc., Case No. 24-cv-00226-RGA (D. Del.), alleging certain breaches of fiduciary duties (and aiding and abetting breaches of fiduciary duties) in connection with the spinoff. Subsequently, the liquidating trustee voluntarily dismissed without prejudice the complaint in the District of Delaware and commenced on March 20, 2024 a substantially similar action in Delaware Chancery Court, captioned Pirinate Consulting Group, LLC v. Bread Financial Holdings, Inc., Case No. 2024-0277-MTZ (Del. Ch.), against the same parties and asserting the same claims. Among other things, in each of the Texas and Delaware actions, the liquidating trustee seeks damages in the amount of approximately $750 million plus interest, fees and expenses.
We and certain current and former members of our management team have also been named as defendants in other litigation matters relating to the LVI spinoff. LoyaltyOne, Co. (the LVI subsidiary that operated its Canadian AIR MILES business) filed suit against us and our general counsel in the Ontario Superior Court of Justice in Canada on October 18, 2023, in an action captioned LoyaltyOne, Co. v. Bread Financial Holdings, Inc. et al. The lawsuit asserts that our general counsel, in his capacity as a pre-spinoff director of LoyaltyOne, Co., breached various fiduciary duties owed to LoyaltyOne, Co. in connection with the LVI spinoff and certain other transactions, and that Bread Financial assisted in and benefited from those breaches. The lawsuit seeks damages in the amount of $775 million. LoyaltyOne, Co. is also contesting our entitlement to certain potential tax refunds under the tax matters agreement, in proceedings pursuant to the Canadian Companies’ Creditors Arrangement Act in the Commercial List of the Ontario Superior Court of Justice, captioned In re Matter of a Plan of Compromise or Arrangement of LoyaltyOne, Co., Case No. CV-23-00696017-00CL (the Tax Matters Dispute). In July 2024, the judge presiding over the Tax Matters Dispute issued an order in our favor, and
BREAD FINANCIAL HOLDINGS, INC.
NOTES TO THE AUDITED CONSOLIDATED FINANCIAL STATEMENTS – (CONTINUED)
LoyaltyOne, Co. has filed a motion for leave to appeal that order, which is pending with Court of Appeal for Ontario as of the date of this report. Finally, on April 27, 2023, we and certain current and former members of our management team were named as defendants in a putative federal securities class action filed in the United States District Court for the Southern District of Ohio, captioned Newtyn Partners, LP v. Alliance Data Systems n/k/a Bread Financial Holdings, Inc., Case No. 23-cv-1451-EAS (S.D. Ohio), concerning disclosures made about LVI’s business prior to the spinoff. The lead plaintiff in this matter filed an amended complaint on March 21, 2024 and is seeking, among other things, a class action designation and an award of damages in an amount to be proven at trial, plus fees and expenses.
In all these actions related to the spinoff, we believe the allegations contained in the complaints are without merit and intend to defend the cases. We cannot predict at this point the length of time that these actions will be ongoing or the liability, if any, which may arise therefrom.
Some matters pending against us specify the damages sought, others seek an unspecified amount of damages or are at very early stages of the legal process. In matters where the amount of damages claimed against us are stated, the claimed amount may be exaggerated and/or unsupported. While some matters have not yet progressed sufficiently through discovery or have had development of important factual information and legal issues to enable us to estimate an amount of loss or a range of possible loss, other matters may have progressed sufficiently to enable an estimate of an amount of loss, or a range of possible loss. We accrue for a loss contingency when it is both probable that a loss has occurred, and the amount of loss can be reasonably estimated; however, there may be instances in which an exposure to a loss contingency exceeds our accrual. On a quarterly basis we evaluate developments in the legal proceedings against us that could cause an increase or decrease in the amount of the accrual that has been previously recorded.
17. EMPLOYEE BENEFIT PLANS
Employee Stock Purchase Plan
In March 2015, our Board of Directors adopted the 2015 Employee Stock Purchase Plan (the 2015 ESPP), which was subsequently approved by our stockholders on June 3, 2015. The 2015 ESPP became effective July 1, 2015 with no definitive expiration date; however, our Board of Directors may at any time and for any reason terminate or amend the 2015 ESPP. No employee may purchase more than $25,000 worth of stock under the 2015 ESPP in any calendar year, and no employee may purchase stock under the 2015 ESPP if such purchase would cause the employee to own more than 5% of the voting rights or value of our common stock. The 2015 ESPP provides for six-month offering periods, commencing on the first trading day of the first and third calendar quarter of each year and ending on the last trading day of each subsequent calendar quarter. The purchase price of the common stock upon exercise is 85% of the fair market value of shares on the applicable purchase date as determined by averaging the high and low trading prices of the last trading day of each six-month period as defined above. An employee elects to participate and have contributions deducted through payroll deductions. The 2015 ESPP also provides for the issuance of any remaining shares available for issuance under our 2005 Employee Stock Purchase Plan, which were 441,327 shares as of June 30, 2015. The 2015 ESPP reserved an additional 1,000,000 shares of our common stock for issuance under the 2015 Plan, bringing the maximum number of shares reserved for issuance under the 2015 ESPP to 1,441,327 shares, subject to adjustment as provided in the 2015 ESPP.
During the year ended December 31, 2024, we issued 107,590 shares of common stock under the 2015 ESPP at a weighted-average issue price of $43.69. Since the 2015 ESPP became effective on July 1, 2015, 920,999 shares of common stock have been issued, with 520,328 shares therefore available for issuance.
401(k) Retirement Savings Plan
The Bread Financial 401(k) Plan (the Plan), as amended, is a defined contribution plan that is qualified under Section 401(k) of the Internal Revenue Code of 1986. The Plan is an IRS-approved safe harbor plan design that eliminates the need for most discrimination testing. Eligible employees can participate in the Plan immediately upon joining BFH and begin receiving Company matching contributions and safe-harbor non-elective contributions. The Plan covers U.S. employees of BFH who are at least 18 years old, employees of one of our wholly-owned subsidiaries and any other subsidiary or affiliated organization that adopts the Plan; employees of BFH and all of its U.S. subsidiaries are currently covered.
The Plan permits eligible employees to make Roth elective deferrals, which are included in the employee’s taxable income at the time of contribution, but not when distributed. Regular, or Non-Roth elective deferrals made by employees, together with our contributions to the Plan, and income earned on these contributions, are not taxable until withdrawn from the Plan.
BREAD FINANCIAL HOLDINGS, INC.
NOTES TO THE AUDITED CONSOLIDATED FINANCIAL STATEMENTS – (CONTINUED)
In 2023, we expanded our contributions to the Plan with an automatic annual deposit for eligible employees. We now automatically deposit three percent of an employee’s eligible annual pay in their 401(k) account on an annual basis, regardless of their contributions. In addition, we match an employee’s contribution fifty cents-per-dollar, up to six percent of the employee’s eligible annual compensation. For the years ended December 31, 2024, 2023 and 2022, our matching contributions were $29 million, $30 million and $17 million, respectively.
Participants in the Plan can direct their contributions and our matching contribution to numerous investment options, including our common stock. On July 20, 2001, we registered 1,500,000 shares of our common stock for issuance in accordance with the Plan pursuant to a Registration Statement on Form S-8, File No. 333-65556. As of December 31, 2024, 143,633 of such shares remain available for issuance.
Executive Deferred Compensation Plan
We also maintain an Executive Deferred Compensation Plan (EDCP). The EDCP permits a defined group of management and highly compensated employees to defer on a pre-tax basis a portion of their base salary and incentive compensation (as defined in the EDCP) payable for services rendered. Deferrals under the EDCP are unfunded and subject to the claims of our creditors. Each participant in the EDCP is 100% vested in their account, and account balances accrue interest at a rate established and adjusted periodically by the Compensation & Human Capital committee of our Board of Directors. As of December 31, 2024 and 2023, our outstanding liability related to the EDCP, which was included in Other liabilities on the Consolidated Balance Sheets, was $25 million and $24 million, respectively.
18. CHANGES IN ACCUMULATED OTHER COMPREHENSIVE LOSS
The changes in each component of Accumulated other comprehensive loss, net of tax effects, are as follows for the periods presented:
| | | | | | | | | | | | | | | | | | | | | |
| Net Unrealized Gains (Losses) on AFS Securities | | | | | | Foreign Currency Translation Losses | | Accumulated other comprehensive loss |
| (Millions) | |
| Balance as of December 31, 2021 | $ | 1 | | | | | | | $ | (3) | | | $ | (2) | |
| Changes in other comprehensive loss | (19) | | | | | | | — | | | (19) | |
| Balance as of December 31, 2022 | $ | (18) | | | | | | | $ | (3) | | | $ | (21) | |
| Changes in other comprehensive income | 2 | | | | | | | — | | | 2 | |
| Balance as of December 31, 2023 | $ | (16) | | | | | | | $ | (3) | | | $ | (19) | |
| Changes in other comprehensive loss | (3) | | | | | | | — | | | (3) | |
| Balance as of December 31, 2024 | $ | (19) | | | | | | | $ | (3) | | | $ | (22) | |
19. STOCKHOLDERS’ EQUITY
Stock Repurchase Programs
On February 21, 2024, our Board of Directors approved a stock repurchase program to acquire up to $30 million in shares of our outstanding common stock in the open market during the period ended December 31, 2024. On December 2, 2024, our Board of Directors approved a $25 million increase to this stock repurchase program, increasing the total authorized amount of shares to be repurchased from $30 million to $55 million during the period ended December 31, 2024. The rationale for this repurchase program, and the amount thereof, was to offset a portion of the impact of dilution associated with issuances of employee restricted stock units.
During the year ended December 31, 2024, under the authorized stock repurchase program, we acquired a total of 1.0 million shares of our common stock for $55 million. Following their repurchase, these 1.0 million shares ceased to be outstanding shares of common stock and are now treated as authorized but unissued shares of common stock.
BREAD FINANCIAL HOLDINGS, INC.
NOTES TO THE AUDITED CONSOLIDATED FINANCIAL STATEMENTS – (CONTINUED)
Stock Compensation Plans
We have adopted equity compensation plans to advance the interests of BFH by rewarding certain employees for their contributions to the financial success of BFH and thereby motivating them to continue to make such contributions in the future.
The 2020 Omnibus Incentive Plan (the 2020 Plan) became effective July 1, 2020 and reserved 2,400,000 shares of common stock for grants of nonqualified stock options, incentive stock options, stock appreciation rights, restricted stock, restricted stock unit awards (RSUs), performance share awards, cash incentive awards, deferred stock units, and other stock-based and cash-based awards to selected officers, employees, non-employee directors and consultants performing services for us or our affiliates, with only employees being eligible to receive incentive stock options. The 2020 Plan expires on June 30, 2030; provided that, pursuant to the terms of the 2022 Omnibus Incentive Plan (as defined below), no new grants are permitted to be made under the 2020 Plan.
The 2022 Omnibus Incentive Plan (the 2022 Plan) became effective July 1, 2022 and reserved 3,075,000 shares of common stock for grants of nonqualified stock options, incentive stock options, stock appreciation rights, restricted stock, RSUs, performance share awards, cash incentive awards, deferred stock units, and other stock-based and cash-based awards to selected officers, employees, non-employee directors and consultants performing services for us or our affiliates, with only employees being eligible to receive incentive stock options. The 2022 Plan expires on June 30, 2032; provided that, pursuant to the terms of the 2024 Omnibus Incentive Plan (as defined below), no new grants are permitted to be made under the 2022 Plan, and all of the shares that remained available for grant under the 2022 Plan (203,687 shares) were rolled over into the 2024 Plan under the terms thereof, together with any shares that may be forfeited under the outstanding
equity awards under the 2022 Plan, as discussed in more detail below.
In April 2024, our Board of Directors adopted the 2024 Omnibus Incentive Plan (the 2024 Plan), which was subsequently approved by our stockholders on May 14, 2024. The 2024 Plan became effective May 14, 2024 and expires on May 13, 2034. The 2024 Plan reserves 5,000,000 new shares of common stock for grants of nonqualified stock options, incentive stock options, stock appreciation rights, restricted stock, RSUs, performance share awards, cash incentive awards, deferred stock units, and other stock-based and cash-based awards to selected officers, employees, non-employee directors and consultants performing services for us or our affiliates, with only employees being eligible to receive incentive stock options. In addition, the 2024 Plan (i) permitted us to roll over the shares that remained available for grant under the 2022 Plan at the time the 2024 Plan was approved (203,687 shares as of May 14, 2024) and (ii) permits us to roll over and re-issue shares that are forfeited under outstanding equity awards under the 2022 Plan (a total of 2,463,907 shares were subject to outstanding equity awards as of May 14, 2024). The maximum amount that may be awarded to any independent member of our Board of Directors in any one calendar year may not exceed $1 million. On May 14, 2024 we registered up to an aggregate of 7,667,594 shares of our common stock authorized for issuance in accordance with the 2024 Plan pursuant to a Registration Statement on Form S-8, File No. 333-279495. Terms of all awards under the 2024 Plan are determined by the Board of Directors or the Compensation & Human Capital Committee of the Board of Directors or its designee at the time of award.
Stock Compensation Expense
Stock-based compensation expense is measured at the grant date of the award, based on the fair value of the award, and is recognized ratably over the requisite service period. Stock-based compensation expense recognized in Employee compensation and benefits expense in the Consolidated Statements of Income for the years ended December 31, 2024, 2023 and 2022 was $54 million, $44 million and $33 million, respectively, with corresponding income tax benefits of $9 million, $8 million and $5 million, respectively.
As the amount of stock-based compensation expense recognized is based on awards ultimately expected to vest, the amount recognized in the Consolidated Statements of Income has been reduced for estimated forfeitures. We estimate forfeitures at each grant date based on historical experience, with forfeiture estimates to be revised, if necessary, in subsequent periods should actual forfeitures differ from those estimates; forfeitures were estimated at 5% for each of the years ended December 31, 2024, 2023 and 2022.
As of December 31, 2024, there was approximately $56 million of unrecognized expense, adjusted for estimated forfeitures, related to non-vested, stock-based equity awards granted to employees, which is expected to be recognized over a weighted average remaining period of approximately 1.9 years.
BREAD FINANCIAL HOLDINGS, INC.
NOTES TO THE AUDITED CONSOLIDATED FINANCIAL STATEMENTS – (CONTINUED)
Restricted Stock Unit Awards
The following table summarizes RSUs activity for our equity compensation plans:
| | | | | | | | | | | | | | | | | | | | | | | | | | | | | |
| Market- Based(1) | | Performance- Based(1) | | Service-
Based | | Total | | Weighted
Average
Fair Value |
| Balance as of December 31, 2021 | 19,067 | | 91,416 | | 648,952 | | 759,435 | | $ | 89.14 | |
| Shares granted | — | | 82,513 | | 766,178 | | 848,691 | | 63.22 | |
| Shares vested | — | | (8,983) | | (218,077) | | (227,060) | | 78.23 | |
| Shares forfeited | (19,067) | | — | | (89,390) | | (108,457) | | 65.83 | |
| Balance as of December 31, 2022 | — | | 164,946 | | 1,107,663 | | 1,272,609 | | $ | 68.86 | |
| Shares granted | — | | 175,587 | | 1,172,465 | | 1,348,052 | | 38.02 | |
| Shares vested | — | | (9,254) | | (434,049) | | (443,303) | | 67.49 | |
| Shares forfeited | — | | — | | (87,527) | | (87,527) | | 53.82 | |
| Balance as of December 31, 2023 | — | | 331,279 | | 1,758,552 | | 2,089,831 | | $ | 49.89 | |
| Shares granted | — | | 243,312 | | 1,307,833 | | 1,551,145 | | 37.78 | |
| Shares vested | — | | (95,133) | | (730,635) | | (825,768) | | 56.58 | |
| Shares forfeited | — | | — | | (68,012) | | (68,012) | | 43.39 | |
| Balance as of December 31, 2024 | — | | 479,458 | | 2,267,738 | | 2,747,196 | | $ | 41.54 | |
| Outstanding and Expected to Vest | | | | | | | 2,648,763 | | $ | 41.80 | |
______________________________
(1) Shares granted reflect a 100% target attainment of the respective market-based or performance-based metric. Shares forfeited include those RSUs forfeited as a result of BFH not meeting the respective market-based or performance-based metric conditions.
For Service-based and Performance-based awards, the fair value of the RSUs was estimated using our closing share price on the date of grant. Service-based RSUs typically vest ratably over a three-year period. Performance-based RSUs typically cliff vest at the end of three years, if specified performance measures tied to our financial performance are met, which are measured annually over the three-year period. The predefined vesting criteria typically permit a range from 0% to 150% to be earned. Accruals of compensation cost for an award with a performance condition are based on the probable outcome of that performance condition.
For RSUs vested during the years ended December 31, 2024, 2023 and 2022, the total fair value, based upon our stock price at the date the RSUs vested, was $47 million, $30 million and $18 million, respectively. As of December 31, 2024, the aggregate intrinsic value of RSUs outstanding and expected to vest was $162 million.
Dividends
For the years ended December 31, 2024, 2023 and 2022, we paid $43 million, $42 million and $43 million, respectively, in dividends to holders of our common stock. On January 30, 2025, our Board of Directors declared a quarterly cash dividend of $0.21 per share on our common stock, payable on March 21, 2025, to stockholders of record at the close of business on February 14, 2025.
20. INCOME TAXES
We file income tax returns in federal, state, local and foreign jurisdictions, as applicable. Provisions for current income tax liabilities are calculated and accrued on income and expense amounts expected to be included in the income tax returns for the current year. Income taxes reported in earnings also include deferred income tax provisions and provisions for uncertain tax positions.
Differences between the audited Consolidated Financial Statements and tax bases of assets and liabilities give rise to deferred tax assets and liabilities, which measure the future tax effects of items recognized in the audited Consolidated Financial Statements. Changes in deferred income tax assets and liabilities associated with components of Stockholders’ equity are charged or credited directly to Stockholders’ equity. Otherwise, changes in deferred income tax assets and
BREAD FINANCIAL HOLDINGS, INC.
NOTES TO THE AUDITED CONSOLIDATED FINANCIAL STATEMENTS – (CONTINUED)
liabilities are included as a component of Provision for income taxes. The effect on deferred income tax assets and liabilities attributable to changes in enacted tax rates is charged or credited to Provision for income taxes in the period of enactment.
Deferred tax assets require certain estimates and judgments in order to determine whether it is more likely than not that all or a portion of the benefit of a deferred tax asset will not be realized. In evaluating our deferred tax assets on a quarterly basis as new facts and circumstances emerge, we analyze and estimate the impact of future taxable income, reversing temporary differences and available tax planning strategies. Uncertainties can lead to changes in the ultimate realization of deferred tax assets. A liability for unrecognized tax benefits, representing the difference between a tax position taken or expected to be taken in a tax return and the benefit recognized in the audited Consolidated Financial Statements, inherently requires estimates and judgments. A tax position is recognized only when it is more likely than not to be sustained, based purely on its technical merits after examination by the relevant taxing authority, and the amount recognized is the benefit we believe is more likely than not to be realized upon ultimate settlement. We evaluate our tax positions as new facts and circumstances become available, making adjustments to unrecognized tax benefits as appropriate. Uncertainties can mean the tax benefits ultimately realized differ from amounts previously recognized, with any differences recorded in Provision for income taxes, along with amounts for estimated interest and penalties.
The components of our Income from continuing operations before income taxes and Provision for income taxes included in the Consolidated Statements of Income were as follows for the years ended December 31:
| | | | | | | | | | | | | | | | | |
| 2024 | | 2023 | | 2022 |
| (Millions) | |
| Components of Income from continuing operations before income taxes | | | | | |
| Domestic | $ | 375 | | | $ | 964 | | | $ | 297 | |
| Foreign | 6 | | | 4 | | | 3 | |
| Total Income from continuing operations before income taxes | $ | 381 | | | $ | 968 | | | $ | 300 | |
| | | | | |
| Components of Provision for income taxes | | | | | |
| Current | | | | | |
| Federal | $ | 156 | | | $ | 261 | | | $ | 279 | |
| State | 29 | | | 37 | | | 41 | |
| Foreign | 2 | | | 1 | | | 1 | |
| Total current income tax expense | 187 | | | 299 | | | 321 | |
| Deferred | | | | | |
| Federal | (73) | | | (65) | | | (200) | |
| State | (10) | | | (2) | | | (44) | |
| Foreign | (2) | | | (1) | | | (1) | |
| Total deferred income tax benefit | (85) | | | (68) | | | (245) | |
| Total Provision for income taxes | $ | 102 | | | $ | 231 | | | $ | 76 | |
BREAD FINANCIAL HOLDINGS, INC.
NOTES TO THE AUDITED CONSOLIDATED FINANCIAL STATEMENTS – (CONTINUED)
A reconciliation of our expected income tax expense computed by applying the federal statutory rate to Income from continuing operations before income taxes, to the recorded Provision for income taxes, is as follows for the years ended December 31:
| | | | | | | | | | | | | | | | | |
| 2024 | | 2023 | | 2022 |
| (Millions) | |
| Expected expense at statutory rate | $ | 80 | | | $ | 203 | | | $ | 63 | |
| Increase (decrease) in income taxes resulting from: | | | | | |
| State and local income taxes, net of federal benefit | 15 | | | 27 | | | (2) | |
| Non-deductible expenses | 29 | | | 8 | | | 6 | |
| IRC Section 199, net of tax reserves | — | | | — | | | 4 | |
| Basis difference in unconsolidated subsidiaries | — | | | — | | | (8) | |
| Valuation allowance | (1) | | | (5) | | | 16 | |
| Audit Resolutions | (20) | | | — | | | — | |
| Other | (1) | | | (2) | | | (3) | |
| Total | $ | 102 | | | $ | 231 | | | $ | 76 | |
For the year ended December 31, 2024, the increase in the non-deductible expenses from prior periods is primarily related to the non-deductible portion of our repurchased Convertible Notes transactions. We also utilized a portion of our capital loss, and therefore released the associated portion of valuation allowance against it. In addition, our tax expense decreased by approximately $20 million as a result of favorable audit resolutions.
For the year ended December 31, 2023, we utilized a portion of our capital loss, and therefore released the associated portion of the valuation allowance against it.
For the year ended December 31, 2022, we increased our reserve for Internal Revenue Code (IRC) Section 199 deductions by approximately $4 million as a result of an unfavorable court ruling. In addition, we recorded an income tax benefit (deferred tax asset) of approximately $8 million related to the initial recognition of the basis difference in an unconsolidated subsidiary, against which we recorded a $16 million valuation allowance as of December 31, 2022.
BREAD FINANCIAL HOLDINGS, INC.
NOTES TO THE AUDITED CONSOLIDATED FINANCIAL STATEMENTS – (CONTINUED)
The following table provides the significant components of Deferred tax assets and liabilities as of December 31:
| | | | | | | | | | | |
| 2024 | | 2023 |
| (Millions) | |
| Deferred tax assets | | | |
| Deferred revenue | $ | 12 | | | $ | 14 | |
| Allowance for credit losses | 534 | | | 554 | |
| Net operating loss carryforwards and other carryforwards | 48 | | | 51 | |
| Operating lease liabilities | 29 | | | 34 | |
| Research & development expenses | 53 | | | 36 | |
| Accrued expenses and other | 87 | | | 79 | |
| Total deferred tax assets | 763 | | | 768 | |
| Valuation allowance | (19) | | | (21) | |
| Deferred tax assets, net of valuation allowance | 744 | | | 747 | |
| Deferred tax liabilities | | | |
| Deferred income | $ | 2 | | | $ | 73 | |
| Depreciation | — | | | 12 | |
| Right of use assets | 19 | | | 22 | |
| Intangible assets | 15 | | | 11 | |
| Total deferred tax liabilities | 36 | | | 118 | |
| | | |
| Net deferred tax assets | $ | 708 | | | $ | 629 | |
| | | |
| Amounts recognized on the Consolidated Balance Sheets: | | | |
| Other assets | $ | 708 | | | $ | 629 | |
As of December 31, 2024, included in our U.S. tax returns are approximately $113 million of U.S. federal net operating loss carryovers (NOLs) and federal capital losses of approximately $48 million to offset capital gains. With the exception of NOLs generated after December 31, 2017, these attributes expire at various times through the year 2033. As of December 31, 2024, we have state NOLs of approximately $233 million and state credits of approximately $1 million, both available to offset future state taxable income, as well as state capital losses of approximately $15 million to offset capital gains. With the exception of some state NOLs generated after December 31, 2017, these NOLs, credits and capital losses will expire at various times through the year 2042. As of December 31, 2024, we have tax credits in foreign jurisdictions of approximately $4 million available to offset future tax liabilities. These credits expire at various times through the year 2039.
As well, in 2024 we recorded a tax expense of approximately $7 million in Additional paid-in capital related to the tax impact of the repurchased Convertible Notes, specifically, the write-off of the associated deferred tax asset. In addition, in 2023 we recorded a tax benefit of approximately $9 million in Additional paid-in capital to establish the deferred tax asset associated with the Capped Call transactions, which continue to remain outstanding.
We use the portfolio approach relating to the release of stranded tax effects recorded in Accumulated other comprehensive loss.
BREAD FINANCIAL HOLDINGS, INC.
NOTES TO THE AUDITED CONSOLIDATED FINANCIAL STATEMENTS – (CONTINUED)
The following table presents changes in unrecognized tax benefits:
| | | | | |
| (Millions) | |
| Balance as of December 31, 2021 | $ | 247 | |
| Increases related to prior years’ tax positions | 8 | |
| Decreases related to prior years’ tax positions | (25) | |
| Increases related to current year tax positions | 14 | |
| Settlements during the period | (2) | |
| |
| Balance as of December 31, 2022 | $ | 242 | |
| Increases related to prior years’ tax positions | 1 | |
| Decreases related to prior years’ tax positions | (11) | |
| Increases related to current year tax positions | 13 | |
| Settlements during the period | (10) | |
| Lapses of applicable statutes of limitations | (20) | |
| Balance as of December 31, 2023 | $ | 215 | |
| Increases related to prior years’ tax positions | 1 | |
| Decreases related to prior years’ tax positions | (40) | |
| Increases related to current year tax positions | 9 | |
| Settlements during the period | (21) | |
| Lapses of applicable statutes of limitations | (10) | |
| Balance as of December 31, 2024 | $ | 154 | |
We recognize potential accrued interest and penalties related to unrecognized tax benefits in Provision for income taxes. We have potential cumulative interest and penalties with respect to unrecognized tax benefits of approximately $86 million, $84 million and $74 million as of December 31, 2024, 2023 and 2022, respectively. For those same years we recorded approximately a $2 million expense, $9 million expense and $1 million benefit, respectively, in Provision for income taxes for potential interest and penalties for unrecognized tax benefits.
As of December 31, 2024, 2023 and 2022, we had unrecognized tax benefits of approximately $200 million, $226 million and $238 million, respectively, that, if recognized, would impact the effective tax rate. We do not anticipate a significant change to the total amount of unrecognized tax benefits over the next twelve months.
We file income tax returns in U.S. federal, state and foreign jurisdictions, as applicable. U.S. federal income tax returns are no longer subject to examination for years before 2015, and with a few exceptions, state and local income tax returns are no longer subject to examination for years before 2015. Foreign income tax returns are no longer subject to examination for years before 2018.
21. EARNINGS PER SHARE
Basic earnings (losses) per share (EPS) is based only on the weighted average number of common shares outstanding, excluding any dilutive effects of unvested restricted stock awards or other dilutive securities. Diluted EPS is based on (i) the weighted average number of common and potentially dilutive common shares (unvested restricted stock awards outstanding during the year), pursuant to the Treasury Stock method, and (ii) the potential conversion of the Convertible Notes, pursuant to the If-converted method.
BREAD FINANCIAL HOLDINGS, INC.
NOTES TO THE AUDITED CONSOLIDATED FINANCIAL STATEMENTS – (CONTINUED)
The following table sets forth the computation of basic and diluted EPS attributable to common stockholders for the years ended December 31:
| | | | | | | | | | | | | | | | | |
| 2024 | | 2023 | | 2022 |
| (Millions, except per share amounts) | |
| Numerator | | | | | |
| Income from continuing operations | $ | 279 | | | $ | 737 | | | $ | 224 | |
Loss from discontinued operations, net of income taxes (1) | (2) | | | (19) | | | (1) | |
| Net income | $ | 277 | | | $ | 718 | | | $ | 223 | |
| | | | | |
| Denominator | | | | | |
| Weighted average common stock outstanding – basic | 49.6 | | 49.8 | | 49.9 |
| Weighted average effect of dilutive securities | | | | | |
Add: net effect of dilutive unvested restricted stock awards (2) | 0.7 | | 0.2 | | 0.1 |
Add: dilutive effect of Convertible Notes (3)(4) | 0.1 | | 0.0 | | 0.0 |
| Weighted average common stock outstanding – diluted | 50.4 | | 50.0 | | 50.0 |
| | | | | |
| Basic EPS | | | | | |
| Income from continuing operations | $ | 5.63 | | | $ | 14.79 | | | $ | 4.48 | |
| Loss from discontinued operations | $ | (0.05) | | | $ | (0.40) | | | $ | (0.01) | |
| Net income per share | $ | 5.58 | | | $ | 14.39 | | | $ | 4.47 | |
| | | | | |
| Diluted EPS | | | | | |
| Income from continuing operations | $ | 5.54 | | $ | 14.74 | | $ | 4.47 |
| Loss from discontinued operations | $ | (0.05) | | $ | (0.40) | | $ | (0.01) | |
| Net income per share | $ | 5.49 | | $ | 14.34 | | $ | 4.46 |
______________________________
(1)Includes amounts that related to the previously disclosed discontinued operations associated with the spinoff of our former LoyaltyOne segment in 2021 and the sale of our former Epsilon segment in 2019. For additional information refer to Note 1, “Description of Business, Basis of Presentation and Significant Accounting Policies” to the audited Consolidated Financial Statements.
(2)As the effect would have been anti-dilutive, for the years ended December 31, 2024, 2023 and 2022, approximately 0.6 million, 1.2 million, and 0.9 million, respectively, restricted stock awards were excluded from each calculation of weighted average dilutive common shares.
(3)Holders of the Convertible Notes may convert their notes under certain conditions until March 15, 2028, and on or after such date without condition. Upon any such conversion, we will repay the aggregate principal amount of the Convertible Notes in cash, and pay or deliver, as the case may be, cash, shares of our common stock or a combination of both (at our election), in respect of the remainder, if any, of our conversion obligation in excess of the aggregate principal amount of the Convertible Notes. At our option, we may redeem for cash, all or a portion of the Convertible Notes on or after June 21, 2026, and before the 51st scheduled trading day before the maturity date, but only if the closing price of our common stock reaches specified targets as defined in the indenture governing the Convertible Notes. We may also, from time to time, retire or purchase all or a portion of the outstanding Convertible Notes through cash purchases or exchanges for other securities, in open market purchases, tender offers, privately negotiated transactions or otherwise.
The conversion feature of the Convertible Notes has a dilutive impact on EPS when the average market price of our common stock for the period exceeds the conversion price of $38.43 per share. With the three months ended June 30, 2024 being the first period in which the average market price of our common stock exceeded the conversion price, a weighted average of the quarterly results from the Dilutive effect of Convertible Notes is computed, and has been reflected in the table above for the year ended December 31, 2024.
(4)In connection with the issuance of the Convertible Notes, we entered into privately negotiated Capped Calls with certain financial institution counterparties. These transactions are expected generally to reduce potential dilution to our common stock upon any conversion of Convertible Notes and/or offset certain cash payments we may be required to make in excess of the principal amount of the Convertible Notes upon conversion, redemption or repurchase thereof, with such reduction and/or offset subject to a cap of $61.48 per share. Diluted weighted average common stock does not include the impact of the Capped Calls we entered into
BREAD FINANCIAL HOLDINGS, INC.
NOTES TO THE AUDITED CONSOLIDATED FINANCIAL STATEMENTS – (CONTINUED)
concurrently with the issuance of the Convertible Notes, as the effect would have been anti-dilutive. If shares were delivered to us under the Capped Calls, those shares would offset, up to the cap, the dilutive effect of the shares that we would issue upon conversion of the Convertible Notes.
22. PARENT COMPANY FINANCIAL STATEMENTS
The following Parent Company financial statements are provided in accordance with the rules of the SEC, which require such disclosure when the restricted net assets of consolidated subsidiaries exceed 25 percent of consolidated net assets. Certain of our subsidiaries may be restricted in distributing cash or other assets to the Parent Company, which could be utilized to service our indebtedness. The stand-alone parent-only financial statements are presented below.
Parent Company – Condensed Balance Sheets
| | | | | | | | | | | |
| December 31, |
| 2024 | | 2023 |
| (Millions) | |
| Assets | | | |
| Cash and cash equivalents | $ | 21 | | | $ | 2 | |
| Investment in subsidiaries | 3,195 | | | 3,615 | |
| Intercompany receivables, net | 773 | | | 612 | |
| | | |
| Other assets | 123 | | | 147 | |
| Total assets | $ | 4,112 | | | $ | 4,376 | |
| Liabilities | | | |
| Long-term and other debt | $ | 999 | | | $ | 1,394 | |
| | | |
| Other liabilities | 62 | | | 64 | |
| Total liabilities | 1,061 | | | 1,458 | |
| Stockholders’ equity | 3,051 | | | 2,918 | |
| Total liabilities and stockholders’ equity | $ | 4,112 | | | $ | 4,376 | |
Parent Company – Condensed Statements of Income
| | | | | | | | | | | | | | | | | |
| Years Ended December 31, |
| 2024 | | 2023 | | 2022 |
| (Millions) | |
| Total interest income | $ | 11 | | | $ | 12 | | | $ | 11 | |
| Total interest expense | 116 | | | 111 | | | 107 | |
| Net interest expense | (105) | | | (99) | | | (96) | |
| Dividends from subsidiaries | 910 | | | 1,063 | | | 382 | |
| Loss from equity method investment | — | | | (6) | | | (44) | |
| Total net interest and non-interest income | 805 | | | 958 | | | 242 | |
| Total non-interest expenses | 121 | | | 12 | | | 1 | |
| Income before income taxes and equity in undistributed net income of subsidiaries | 684 | | | 946 | | | 241 | |
| Benefit for income taxes | 38 | | | 31 | | | 22 | |
| Income before equity in undistributed net income of subsidiaries | 722 | | | 977 | | | 263 | |
| Equity in undistributed net loss of subsidiaries | (445) | | | (259) | | | (40) | |
| Net income | $ | 277 | | | $ | 718 | | | $ | 223 | |
BREAD FINANCIAL HOLDINGS, INC.
NOTES TO THE AUDITED CONSOLIDATED FINANCIAL STATEMENTS – (CONTINUED)
Parent Company – Condensed Statements of Comprehensive Income
| | | | | | | | | | | | | | | | | |
| Years Ended December 31, |
| 2024 | | 2023 | | 2022 |
| (Millions) | |
| Net income | $ | 277 | | | $ | 718 | | | $ | 223 | |
| Other comprehensive loss, net of tax | — | | | — | | | (3) | |
| Total comprehensive income, net of tax | $ | 277 | | | $ | 718 | | | $ | 220 | |
Parent Company – Condensed Statements of Cash Flows
| | | | | | | | | | | | | | | | | |
| Years Ended December 31, |
| 2024 | | 2023 | | 2022 |
| (Millions) | |
| Net cash used in operating activities | $ | (182) | | | $ | (422) | | | $ | (219) | |
| Cash flows from investing activities: | | | | | |
| | | | | |
| Dividends received | 910 | | | 1,063 | | | 383 | |
| | | | | |
| Net cash provided by investing activities | 910 | | | 1,063 | | | 383 | |
| Cash flows from financing activities: | | | | | |
| Borrowings under debt agreements | 300 | | | 1,401 | | | 218 | |
| Repayments of borrowings under debt agreements | (894) | | | (1,882) | | | (319) | |
| Payment of deferred financing costs | (10) | | | (45) | | | — | |
| Payment of capped call transactions | — | | | (39) | | | — | |
| Dividends paid | (43) | | | (42) | | | (43) | |
| Repurchase of common stock | (55) | | | (35) | | | (12) | |
| Other | (7) | | | (2) | | | (3) | |
| Net cash used in financing activities | (709) | | | (644) | | | (159) | |
| Change in cash, cash equivalents and restricted cash | 19 | | | (3) | | | 5 | |
| Cash, cash equivalents and restricted cash at beginning of year | 2 | | | 5 | | | — | |
| Cash, cash equivalents and restricted cash at end of year | $ | 21 | | | $ | 2 | | | $ | 5 | |
Non-cash financing activities related to the Parent Company – Condensed Statements of Cash Flows for the year ended December 31, 2024 include the impact to Additional paid-in capital related to the debt issuance costs from the repurchased Convertible Notes.
Non-cash investing activities related to the Parent Company – Condensed Statements of Cash Flows for the year ended December 31, 2023 include a $318 million non-cash dividend in the form of an intercompany return of capital from Bread Financial Payments, Inc. to the Parent Company.
Non-cash investing and financing activities related to the Parent Company – Condensed Statements of Cash Flows for the year ended December 31, 2022 included the dissolution of a subsidiary, ADS Foreign Holdings, Inc.
SIGNATURES
Pursuant to the requirements of Section 13 or 15(d) of the Securities Exchange Act of 1934, Bread Financial Holdings, Inc. has duly caused this Annual Report on Form 10-K to be signed on its behalf by the undersigned, thereunto duly authorized.
| | | | | | | | |
| Bread Financial Holdings, Inc. |
| | |
| By: | /S/ RALPH J. ANDRETTA |
| | Ralph J. Andretta |
| | President and Chief Executive Officer |
DATE: February 14, 2025
Pursuant to the requirements of the Securities Exchange Act of 1934, this report has been signed below by the following persons on behalf of Bread Financial Holdings, Inc. and in the capacities and on the dates indicated.
| | | | | | | | | | | | | | |
| Name | | Title | | Date |
| | | | |
| /S/ RALPH J. ANDRETTA | | President, Chief Executive Officer and Director | | February 14, 2025 |
| Ralph J. Andretta | | | |
| | | | |
| /S/ PERRY S. BEBERMAN | | Executive Vice President and Chief Financial Officer | | February 14, 2025 |
| Perry S. Beberman | | | |
| | | | |
| /S/ J. BRYAN CAMPBELL | | Senior Vice President and Chief Accounting Officer | | February 14, 2025 |
| J. Bryan Campbell | | | |
| | | | |
| /S/ ROGER H. BALLOU | | Chairman of the Board, Director | | February 14, 2025 |
| Roger H. Ballou | | | | |
| | | | |
| /S/ JOHN J. FAWCETT | | Director | | February 14, 2025 |
| John J. Fawcett | | | | |
| | | | |
| /S/ JOHN C. GERSPACH, JR. | | Director | | February 14, 2025 |
| John C. Gerspach, Jr. | | | | |
| | | | |
| /S/ PRANITI LAKHWARA | | Director | | February 14, 2025 |
| Praniti Lakhwara | | | | |
| | | | |
| /S/ RAJESH NATARAJAN | | Director | | February 14, 2025 |
| Rajesh Natarajan | | | | |
| | | | |
| /S/ JOYCE ST. CLAIR | | Director | | February 14, 2025 |
| Joyce St. Clair | | | | |
| | | | |
| /S/ TIMOTHY J. THERIAULT | | Director | | February 14, 2025 |
| Timothy J. Theriault | | | | |
| | | | |
| /S/ LAURIE A. TUCKER | | Director | | February 14, 2025 |
| Laurie A. Tucker | | | | |
| | | | |
| /S/ SHAREN J. TURNEY | | Director | | February 14, 2025 |
| Sharen J. Turney | | | | |