Alliance Data Systems
NYSE : ADS
January 2002
Safe Harbor Statement/Forward Looking Statement
Statements contained in this presentation which are not historical facts may be forward-looking statements, as the term is defined in the Private Litigation Reform Act of 1995. In some cases, you can identify forward- looking statements by terminology such as “anticipate”, “estimate”, “expect”, “project”, “intend”, “plan”, “believe” and other words and terms of similar meaning in connection with any discussion of future operating or financial performance. In particular, these include, among other things, statements relating to growth strategy, global expansion, use of proceeds, dividend policy, projected capital expenditures, sales and marketing expenses, research and development expenditures, other costs and expenses, revenue, profitability, liquidity and capital resources, and development. These statements are based on certain assumptions made by Alliance Data Systems based on its experience and perception of historical trends, current conditions, expected future developments, and other factors it believes are appropriate under the circumstances. Any and all of the forward- looking statements can be affected by inaccurate assumptions we might make or by known or unknown risks and uncertainties. Many factors, including the risks outlined in the company’s Registration Statement on Form S-1 filed with the Securities and Exchange Commission, will be important in determining future results. Actual results may vary materially.
Alliance Data: Integration of Transaction
Processing and Marketing Services
•Build and Strengthen Loyal Relationships for Our Clients
•Focus on 300 Specialized Relationships, not "Commodity" Items
•Offer Full Suite of Services
•Transaction Processing Services
•Credit Services
•Loyalty and Marketing Services
•Capitalize on Strong Growth Trends
•Electronic Transactions
•One-to-One Marketing
•Outsourcing.
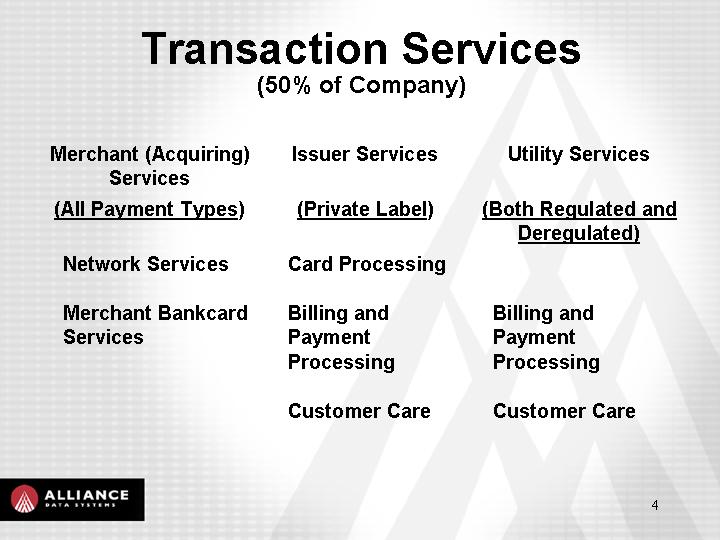
Transaction Services
(50% of Company)
Merchant (Acquiring) |
| Issuer Services |
| Utility Services |
(All Payment Types) |
| (Private Label) |
| (Both Regulated and |
|
|
|
|
|
Network Services |
| Card Processing |
|
|
|
|
|
|
|
Merchant Bankcard |
| Billing and |
| Billing and |
|
|
|
|
|
|
| Customer Care |
| Customer Care |
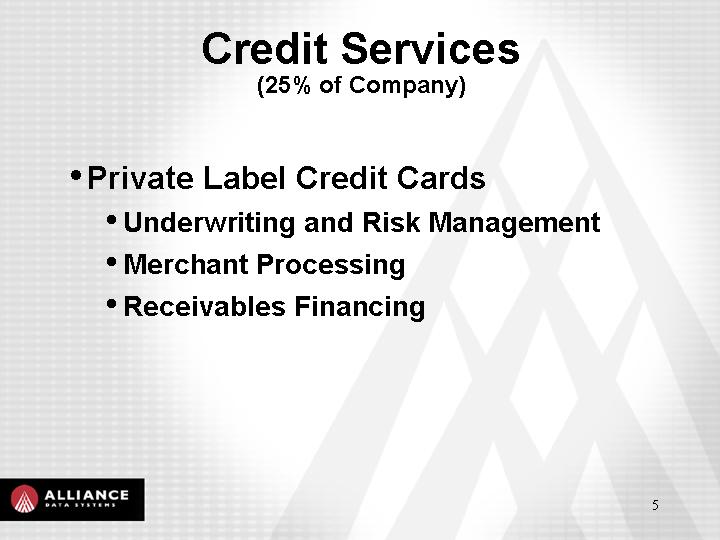
Credit Services
(25% of Company)
•Private Label Credit Cards
•Underwriting and Risk Management
•Merchant Processing
•Receivables Financing
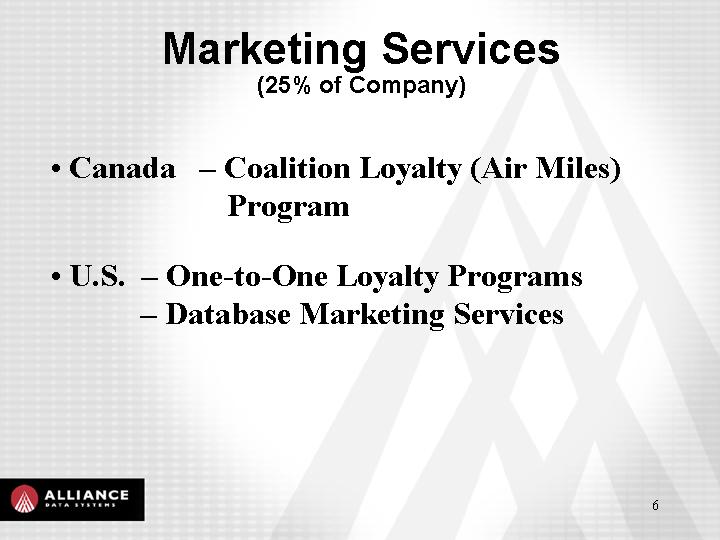
Marketing Services
(25% of Company)
•Canada — Coalition Loyalty (Air Miles) Program
•U. S. — One- to- One Loyalty Programs
— Database Marketing Services

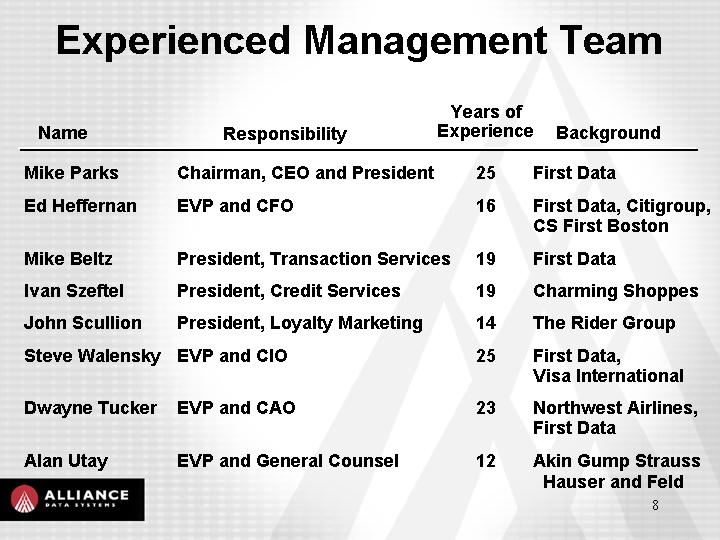
Experienced Management Team | ||||||
Name |
| Responsibility |
| Years of |
| Background |
Mike Parks |
| Chairman, CEO and President |
| 25 |
| First Data |
Ed Heffernan |
| EVP and CFO |
| 16 |
| First Data, Citigroup, |
Mike Beltz |
| President, Transaction Services |
| 19 |
| First Data |
Ivan Szeftel |
| President, Credit Services |
| 19 |
| Charming Shoppes |
John Scullion |
| President, Loyalty Marketing |
| 14 |
| The Rider Group |
Steve Walensky |
| EVP and CIO |
| 25 |
| First Data, |
Dwayne Tucker |
| EVP and CAO |
| 23 |
| Northwest Airlines, |
Alan Utay |
| EVP and General Counsel |
| 12 |
| Akin Gump Strauss |
Financial Themes
- Growth
- Visibility & Predictability
- Operating Leverage
- Liquidity
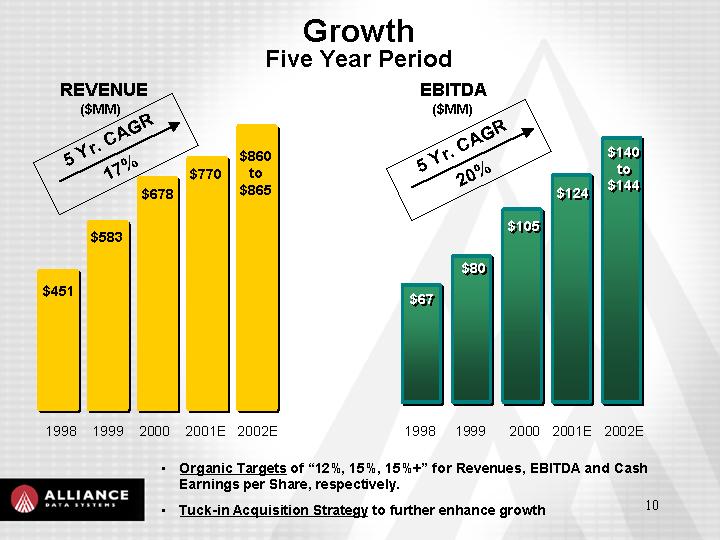
Growth
Five Year Period

• Organic Targets of "12%, 15%, 15%+" for Revenues, EBITDA and Cash Earnings per Share, respectively.
• Tuck-in Acquisition Strategy to further enhance growth
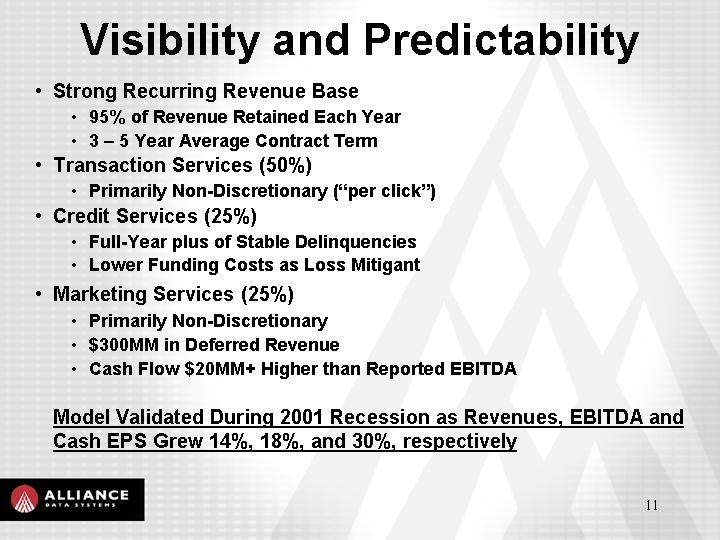
Visibility and Predictability
•Strong Recurring Revenue Base
•95% of Revenue Retained Each Year
•3 - 5 Year Average Contract Term
•Transaction Services (50%)
•Primarily Non-Discretionary ("per click")
•Credit Services (25%)
•Full-Year plus of Stable Delinquencies
•Lower Funding Costs as Loss Mitigant
•Marketing Services (25%)
•Primarily Non-Discretionary
•$300MM in Deferred Revenue
•Cash Flow $20MM+ Higher than Reported EBITDA
• Model Validated During 2001 Recession as Revenues, EBITDA and Cash EPS Grew 14%, 18%, and 30%, respectively.
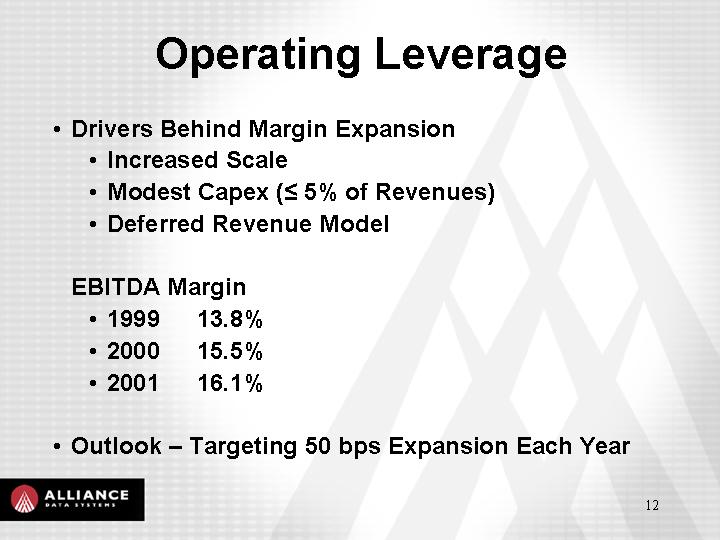
Operating Leverage
•Drivers Behind Margin Expansion
•Increased Scale
•Modest Capex (£ 5% of Revenues)
•Deferred Revenue Model
•EBITDA Margin
•1999 13.8%
•2000 15.5%
•2001 16.1%
•Outlook - Targeting 50 bps Expansion Each Year
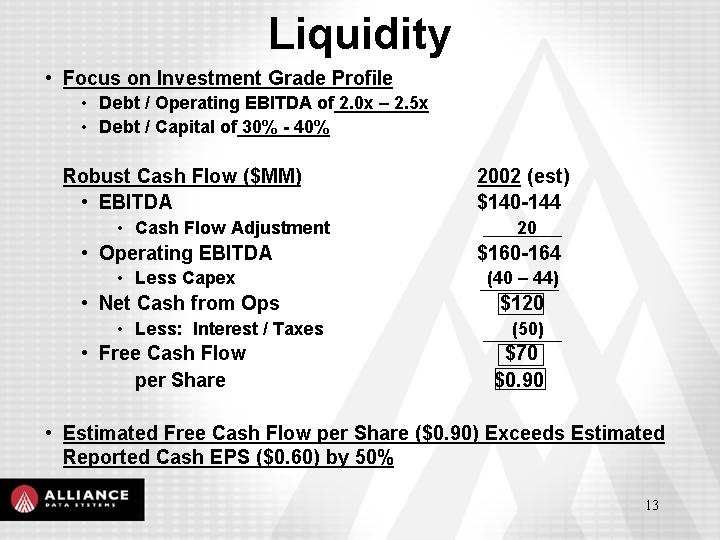
Liquidity
•Focus on Investment Grade Profile
•Debt / Operating EBITDA of 2.0x - 2.5x
•Debt / Capital of 30% - 40%
•Robust Cash Flow ($MM) |
| 2002 (est) |
|
•EBITDA |
| $140-144 |
|
•Cash Flow Adjustment |
| 20 |
|
•Operating EBITDA |
| $160-164 |
|
•Less Capex |
| (40 - 44 | ) |
•Net Cash from Ops |
| $120 |
|
•Less: Interest / Taxes |
| (50 | ) |
•Free Cash Flow |
| $70 |
|
per Share |
| $0.90 |
|
•Estimated Free Cash Flow per Share ($0.90) Exceeds Estimated Reported Cash EPS ($0.60) by 50%.
Investment Highlights
•Track Record of Growth
•Compelling Growth Characteristics
•Experienced Management Team
•Strong Financial Performance
•Growth
•Visibility / Predictability
•Operating Leverage
• Liquidity