EXHIBIT 99.2 Earnings Summary Fourth Quarter 2018 February 5, 2019

SAFE HARBOR This presentation contains, and management may make, forward-looking statements within the meaning of the Private Securities Litigation Reform Act of 1995. The words “believe,” “expect,” “anticipate,” “intends,” “estimate,” “forecast,” “project,” “should,” “may,” “will,” “would” or the negative thereof and similar expressions are intended to identify such forward-looking statements. These forward-looking statements include statements related to future period guidance; future sales, net income, net income per diluted share, non-GAAP EPS, non-GAAP net income, expenses and other financial metrics; our performance relative to our markets; market and technology trends, including the duration and drivers of any growth trends; the development of new products and the success of their introductions; Company's capital allocation strategy, which may be modified at any time for any reason, including share repurchases, dividends, debt repayments and potential acquisitions; the effect of the Tax Cuts and Jobs Act on our capital allocation strategy; the impact of the acquisitions we have made and commercial partnerships we have established; our ability to execute on our strategies; and other matters. These statements involve risks and uncertainties, and actual results may differ. These risks and uncertainties include, but are not limited to, weakening of global and/or regional economic conditions, generally or specifically in the semiconductor industry, which could decrease the demand for our products and solutions; our ability to meet rapid demand shifts; our ability to continue technological innovation and introduce new products to meet our customers' rapidly changing requirements; our concentrated customer base; our ability to identify, effect and integrate acquisitions, joint ventures or other transactions; our ability to protect and enforce intellectual property rights; operational, political and legal risks of our international operations; our dependence on sole source and limited source suppliers; the increasing complexity of certain manufacturing processes; raw material shortages and price increases; changes in government regulations of the countries in which we operate; fluctuation of currency exchange rates; fluctuations in the market price of Entegris’ stock; the level of, and obligations associated with, our indebtedness; and other risk factors and additional information described in our filings with the Securities and Exchange Commission, including under the heading “Risks Factors" in Item 1A of our Annual Report on Form 10-K for the fiscal year ended December 31, 2017, filed on February 15, 2018, and in our other periodic filings. The Company assumes no obligation to update any forward-looking statements or information, which speak as of their respective dates. This presentation contains references to “Adjusted EBITDA,” “Adjusted EBITDA Margin,” “Adjusted Operating Income,” “Adjusted Operating Income Margin” and “Non-GAAP Earnings per Share” that are not presented in accordance GAAP. The non-GAAP financial measures should not be considered in isolation or as a substitute for GAAP financial measures but should instead be read in conjunction with the GAAP financial measures. Further information with respect to and reconciliations of such measures to the most directly comparable GAAP financial measure can be found attached to this presentation. 2
LEGAL DISCLOSURES Additional Information about the Merger and Where to Find It This communication does not constitute an offer to buy or sell or the solicitation of an offer to buy or sell any securities or a solicitation of any vote or approval. This communication relates to a proposed business combination between Entegris and Versum Materials. In connection with the proposed transaction, Entegris intends to file with the Securities and Exchange Commission (the “SEC”) a registration statement on Form S-4 that will include a joint proxy statement of Entegris and Versum Materials that also constitutes a prospectus of Entegris. Each of Entegris and Versum Materials also plan to file other relevant documents with the SEC regarding the proposed transaction. No offering of securities shall be made, except by means of a prospectus meeting the requirements of Section 10 of the U.S. Securities Act of 1933, as amended. Any definitive joint proxy statement/prospectus (if and when available) will be mailed to stockholders of Entegris and Versum Materials. INVESTORS AND SECURITY HOLDERS ARE URGED TO READ THE REGISTRATION STATEMENT, JOINT PROXY STATEMENT/PROSPECTUS AND OTHER DOCUMENTS THAT MAY BE FILED WITH THE SEC CAREFULLY AND IN THEIR ENTIRETY IF AND WHEN THEY BECOME AVAILABLE BECAUSE THEY WILL CONTAIN IMPORTANT INFORMATION ABOUT THE PROPOSED TRANSACTION. Investors and security holders will be able to obtain free copies of these documents (if and when available) and other documents containing important information about Entegris and Versum Materials, once such documents are filed with the SEC through the website maintained by the SEC at http://www.sec.gov. Copies of the documents filed with the SEC by Entegris will be available free of charge on Entegris’ website at http://www.entegris.com or by contacting Entegris’ Investor Relations Department by email at irelations@entegris.com or by phone at 978-436-6500. Copies of the documents filed with the SEC by Versum Materials will be available free of charge on Versum Materials’ website at investors.versummaterials.com or by phone at 484-275-5907. Participants in the Solicitation Entegris, Versum Materials and certain of their respective directors and executive officers may be deemed to be participants in the solicitation of proxies in respect of the proposed transaction. Information about the directors and executive officers of Entegris is set forth in Entegris’ proxy statement for its 2018 annual meeting of shareholders, which was filed with the SEC on March 28, 2018, and Entegris’ Annual Report on Form 10-K for the fiscal year ended December 31, 2017, which was filed with the SEC on February 15, 2018. Information about the directors and executive officers of Versum Materials is set forth in its proxy statement for its 2019 annual meeting of shareholders, which was filed with the SEC on December 20, 2018, and Versum Materials’ Annual Report on Form 10-K for the fiscal year ended September 30, 2018, which was filed with the SEC on November 21, 2018. Other information regarding the participants in the proxy solicitations and a description of their direct and indirect interests, by security holdings or otherwise, will be contained in the joint proxy statement/prospectus and other relevant materials to be filed with the SEC regarding the proposed transaction when such materials become available. Investors should read the joint proxy statement/prospectus carefully when it becomes available before making any voting or investment decisions. You may obtain free copies of these documents from Entegris or Versum Materials using the sources indicated above. 3

4Q18 AND FY2018 HIGHLIGHTS ◦ Fourth-quarter revenue of $402 million grew 15 percent from prior year ◦ Fourth-quarter GAAP EPS of $0.57; Non-GAAP EPS of $0.47 increased 12% from a year ago ◦ Fiscal 2018 revenue of $1.6 billion increased 15 percent ◦ Fiscal 2018 GAAP EPS of $1.69; Non-GAAP EPS of $1.89 increased 31% from a year ago ◦ During 2018 acquired three companies: PSS, SAES Pure Gas and Flex Concepts ◦ Fourth-quarter and through the end of January (2019) repurchased a total of 6.6 million shares for approximately $179 million 4

SUMMARY – CONSOLIDATED STATEMENT OF OPERATIONS (GAAP) 4Q18 over 4Q18 over $ in millions, except per share data 4Q18 4Q18 Guidance 3Q18 4Q17 4Q17 3Q18 Net Revenue $401.6 $380 to $400 $398.6 $350.6 14.6% 0.8% Gross Margin 44.8% 45.6% 46.7% Operating Expenses $108.4 $111 to $114 $113.7 $92.5 17.2% (4.7%) Operating Income $71.3 $68.0 $71.2 0.2% 4.9% Operating Margin 17.8% 17.1% 20.3% Tax Rate (35.3%) 19.2% 167.6% Net Income (Loss) $80.8 $43 to $53 $48.1 ($28.3) NM 68% Earnings (loss) per diluted share $0.57 $0.30 to $0.37 $0.34 ($0.20) NM 68% 5
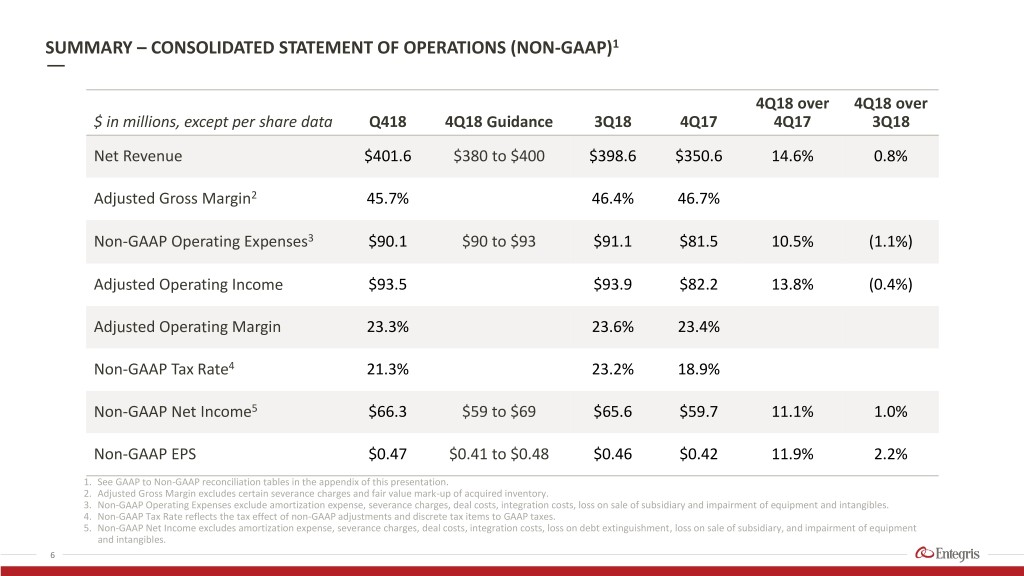
SUMMARY – CONSOLIDATED STATEMENT OF OPERATIONS (NON-GAAP)1 4Q18 over 4Q18 over $ in millions, except per share data Q418 4Q18 Guidance 3Q18 4Q17 4Q17 3Q18 Net Revenue $401.6 $380 to $400 $398.6 $350.6 14.6% 0.8% Adjusted Gross Margin2 45.7% 46.4% 46.7% Non-GAAP Operating Expenses3 $90.1 $90 to $93 $91.1 $81.5 10.5% (1.1%) Adjusted Operating Income $93.5 $93.9 $82.2 13.8% (0.4%) Adjusted Operating Margin 23.3% 23.6% 23.4% Non-GAAP Tax Rate4 21.3% 23.2% 18.9% Non-GAAP Net Income5 $66.3 $59 to $69 $65.6 $59.7 11.1% 1.0% Non-GAAP EPS $0.47 $0.41 to $0.48 $0.46 $0.42 11.9% 2.2% 1. See GAAP to Non-GAAP reconciliation tables in the appendix of this presentation. 2. Adjusted Gross Margin excludes certain severance charges and fair value mark-up of acquired inventory. 3. Non-GAAP Operating Expenses exclude amortization expense, severance charges, deal costs, integration costs, loss on sale of subsidiary and impairment of equipment and intangibles. 4. Non-GAAP Tax Rate reflects the tax effect of non-GAAP adjustments and discrete tax items to GAAP taxes. 5. Non-GAAP Net Income excludes amortization expense, severance charges, deal costs, integration costs, loss on debt extinguishment, loss on sale of subsidiary, and impairment of equipment and intangibles. 6
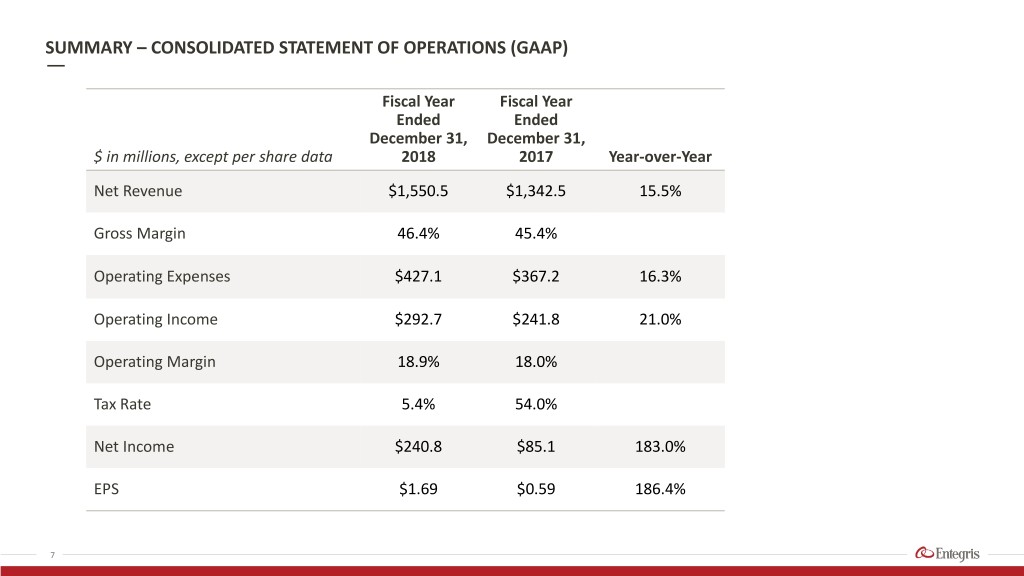
SUMMARY – CONSOLIDATED STATEMENT OF OPERATIONS (GAAP) Fiscal Year Fiscal Year Ended Ended December 31, December 31, $ in millions, except per share data 2018 2017 Year-over-Year Net Revenue $1,550.5 $1,342.5 15.5% Gross Margin 46.4% 45.4% Operating Expenses $427.1 $367.2 16.3% Operating Income $292.7 $241.8 21.0% Operating Margin 18.9% 18.0% Tax Rate 5.4% 54.0% Net Income $240.8 $85.1 183.0% EPS $1.69 $0.59 186.4% 7

SUMMARY – CONSOLIDATED STATEMENT OF OPERATIONS (NON-GAAP)1 – YEAR TO DATE Fiscal Year Ended Fiscal Year Ended $ in millions, except per share data December 31, 2018 December 31, 2017 Year-over-Year Net Revenue $1,550.5 $1,342.5 15.5% Adjusted Gross Margin2 46.9% 45.8% Non-GAAP Operating Expenses3 $356.2 $316.1 12.7% Adjusted Operating Income $371.0 $298.9 24.1% Adjusted Operating Margin 23.9% 22.3% Non-GAAP Tax Rate4 19.5% 22.2% Non-GAAP Net Income5 $269.8 $206.3 30.8% Non-GAAP EPS $1.89 $1.44 31.3% 1. See GAAP to Non-GAAP reconciliation tables in the appendix of this presentation. 2. Adjusted Gross Margin excludes certain impairment of equipment and severance charges and fair value mark-up of acquired inventory. 3. Non-GAAP Operating Expense Exclude amortization expense, severance charges, deal costs, integration costs, loss on sale of subsidiary and impairment of equipment and intangibles. 4. Non-GAAP Tax Rate reflects the tax effect of non-GAAP adjustments and discrete tax items to GAAP taxes. 5. Non-GAAP Net Income excludes amortization expense, severance charges, deal costs, integration costs, loss on debt extinguishment, loss on sale of subsidiary, and impairment of equipment and intangibles. 8

(LOSS) EARNINGS PER SHARE1 EPS: 4Q18 vs. 4Q17 FY2018 vs. FY2017 $2.00 $1.89 $0.70 $1.80 $1.69 $0.60 $0.57 $1.60 $1.44 $0.50 $0.47 $1.40 $0.42 $0.40 $1.20 $0.30 $1.00 $0.20 $0.80 $0.59 $0.10 $0.60 $0.00 $0.40 4Q17 4Q18 -$0.10 $0.20 -$0.20 $0.00 -$0.20 FY17 FY18 -$0.30 GAAP Non-GAAP GAAP Non-GAAP 1. Represents diluted (loss) earnings per share. See Reconciliation of GAAP Net Income to Non-GAAP Earnings per Share in the appendix of this presentation. 9

RESULTS BY SEGMENT1 Specialty Chemicals and Microcontamination Advanced Materials Engineered Materials Control Segment2 Handling Segment3 Segment $ in millions 40% $120 40% $120 40% $120 $100 $100 $100 30% 30% 30% $80 $80 $80 $60 20% $60 20% $60 20% $40 $40 $40 10% 10% 10% $20 $20 $20 $0 0% $0 0% 4Q17 1Q18 2Q18 3Q18 4Q18 $0 0% 4Q17 1Q18 2Q18 3Q18 4Q18 4Q17 1Q18 2Q18 3Q18 4Q18 Sales Adj. Op. margin Sales Adj. Op. margin Sales Adj. Op. margin 1. Adjusted segment operating margin excludes amortization of intangibles and unallocated expenses. 2. Segment profit for MC includes a charge for fair value write-up of inventory of $208K, $3,281K, and $3,379K for 2Q18, 3Q18, and 4Q18, respectively. 3. Segment profit for AMH for 3Q18 includes charges for loss on sale of subsidiary of $466K. Segment profit for AMH for 4Q18 includes severance and restructuring charges of $460K 10

REVENUE BY GEOGRAPHY: STRONG GROWTH IN SOUTH KOREA AND CHINA FY2018 Revenue by Geography FY2018 vs. FY2017 Growth Rate Revenue = $ million Taiwan 0% Taiwan N. America 21% N. America $289.9M $347.0M South Korea 12% Southeast Japan 24% Asia $118.0M $138.0M Europe China 37% $242.4M Europe 15% $210.8M Japan Southeast Asia 7% South Korea $204.4M China -5% 5% 15% 25% 35% 45% 55% 11
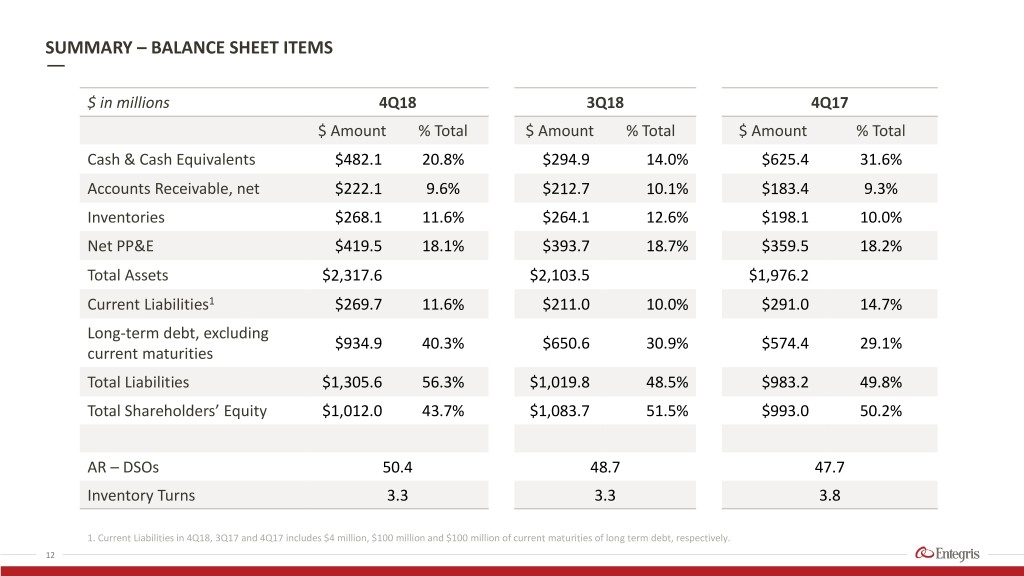
SUMMARY – BALANCE SHEET ITEMS $ in millions 4Q18 3Q18 4Q17 $ Amount % Total $ Amount % Total $ Amount % Total Cash & Cash Equivalents $482.1 20.8% $294.9 14.0% $625.4 31.6% Accounts Receivable, net $222.1 9.6% $212.7 10.1% $183.4 9.3% Inventories $268.1 11.6% $264.1 12.6% $198.1 10.0% Net PP&E $419.5 18.1% $393.7 18.7% $359.5 18.2% Total Assets $2,317.6 $2,103.5 $1,976.2 Current Liabilities1 $269.7 11.6% $211.0 10.0% $291.0 14.7% Long-term debt, excluding $934.9 40.3% $650.6 30.9% $574.4 29.1% current maturities Total Liabilities $1,305.6 56.3% $1,019.8 48.5% $983.2 49.8% Total Shareholders’ Equity $1,012.0 43.7% $1,083.7 51.5% $993.0 50.2% AR – DSOs 50.4 48.7 47.7 Inventory Turns 3.3 3.3 3.8 1. Current Liabilities in 4Q18, 3Q17 and 4Q17 includes $4 million, $100 million and $100 million of current maturities of long term debt, respectively. 12

ADJUSTED EBITDA MARGIN1 Adjusted Annual EBITDA Adjusted EBITDA and EBITDA Margin 28.1% 26.6% 28.9% 28.5% 27.7% 27.7% 27.5% 350 $436 $109 $110 $110 $357 $106 300 $97 80 250 200 150 40 100 50 0 0 4Q17 1Q18 2Q18 3Q18 4Q18 2017 2018 Adj. EBITDA in $M Adj. EBITDA as % of Sales Adj. EBITDA in $M Adj. EBITDA as % of Sales 1. See Reconciliation of GAAP Income to Adjusted Operating Income and Adjusted EBITDA in the appendix of this presentation. 13
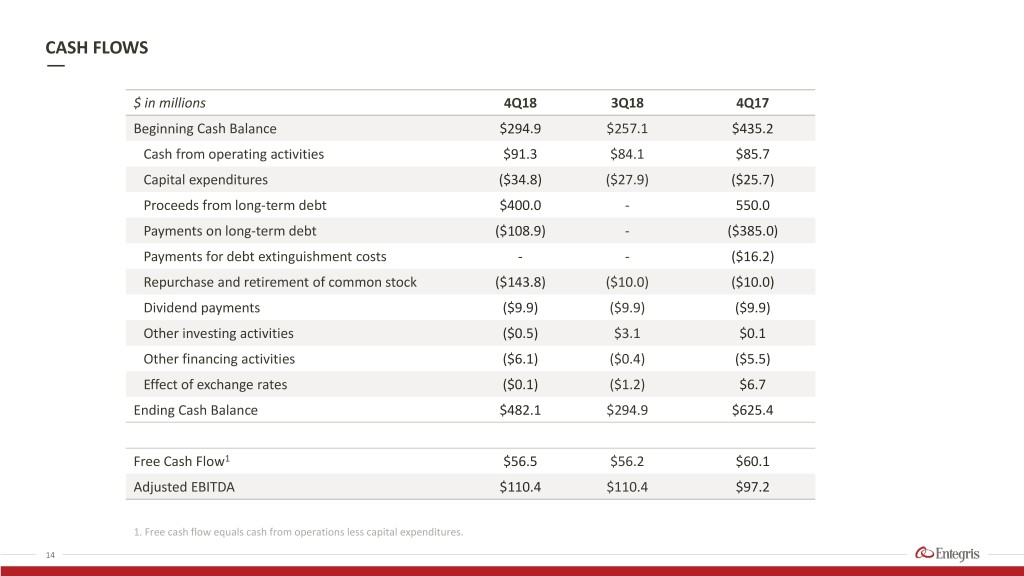
CASH FLOWS $ in millions 4Q18 3Q18 4Q17 Beginning Cash Balance $294.9 $257.1 $435.2 Cash from operating activities $91.3 $84.1 $85.7 Capital expenditures ($34.8) ($27.9) ($25.7) Proceeds from long-term debt $400.0 - 550.0 Payments on long-term debt ($108.9) - ($385.0) Payments for debt extinguishment costs - - ($16.2) Repurchase and retirement of common stock ($143.8) ($10.0) ($10.0) Dividend payments ($9.9) ($9.9) ($9.9) Other investing activities ($0.5) $3.1 $0.1 Other financing activities ($6.1) ($0.4) ($5.5) Effect of exchange rates ($0.1) ($1.2) $6.7 Ending Cash Balance $482.1 $294.9 $625.4 Free Cash Flow1 $56.5 $56.2 $60.1 Adjusted EBITDA $110.4 $110.4 $97.2 1. Free cash flow equals cash from operations less capital expenditures. 14
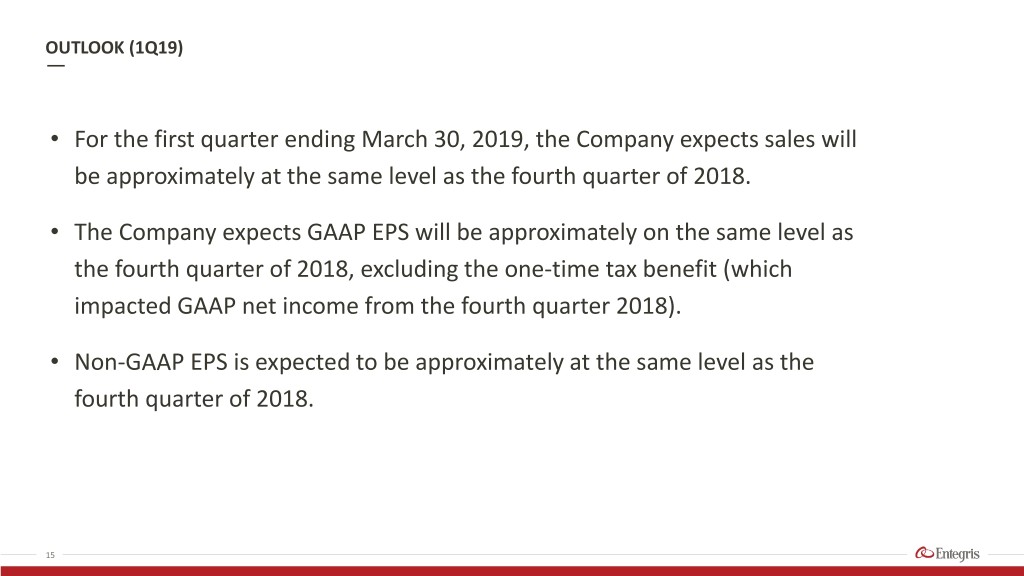
OUTLOOK (1Q19) • For the first quarter ending March 30, 2019, the Company expects sales will be approximately at the same level as the fourth quarter of 2018. • The Company expects GAAP EPS will be approximately on the same level as the fourth quarter of 2018, excluding the one-time tax benefit (which impacted GAAP net income from the fourth quarter 2018). • Non-GAAP EPS is expected to be approximately at the same level as the fourth quarter of 2018. 15
Entegris®, the Entegris Rings Design™ and Pure Advantage™ are trademarks of Entegris, Inc. ©2016 Entegris, Inc. All rights reserved. 16

NON-GAAP RECONCILIATION TABLE RECONCILIATION OF GAAP GROSS PROFIT TO ADJUSTED GROSS PROFIT In thousands Three months ended Twelve months ended December 31, December 31, September 29, December 31, December 31, 2018 2017 2018 2017 2018 Net Sales $401,642 $350,562 $398,597 $1,550,497 $1,342,532 Gross profit-GAAP $179,740 $163,679 $181,716 $719,831 $608,985 Adjustments to gross profit: Charge for fair value mark-up of acquired inventory sold 3,379 - 3,281 6,868 - Severance related to organizational realignment 460 - - 460 740 Impairment of equipment - - - 5,330 Adjusted gross profit $183,579 $163,679 $184,997 $727,159 $615,055 Gross margin - as a % of net sales 44.8 % 46.7% 45.6% 46.4% 45.4% Adjusted gross margin - as a % of net sales 45.7% 46.7% 46.4% 46.9% 45.8% 17

NON-GAAP RECONCILIATION TABLE RECONCILIATION OF GAAP SEGMENT PROFIT TO ADJUSTED OPERATING INCOME $ in thousands Three months ended Twelve months ended Segment profit-GAAP December 31, 2018 December 31, 2017 September 29, 2018 December 31, 2018 December 31, 2017 Specialty Chemicals and Engineered Materials $29,016 $30,075 $31,860 $129,754 $111,802 Microcontamination Control 48,389 39,328 44,530 179,964 141,413 Advanced Materials Handling 16,791 18,226 19,494 82,541 59,838 Total segment profit 94,196 87,629 95,884 386,259 313,053 Amortization of intangible assets 17,050 11,020 21,419 62,152 44,023 Unallocated expenses 5,838 5,457 6,490 31,418 85,705 Total operating income $71,308 $71,152 $67,975 $292,689 $241,817 Three months ended Twelve months ended Adjusted segment profit December 31, 2018 December 31, 2017 September 29, 2018 December 31, 2018 December 31, 2017 Specialty Chemicals and Engineered Materials1 $29,016 $30,075 $31,860 $129,754 $111,802 Microcontamination Control2 51,768 39,328 47,811 180,832 1430,52 Advanced Materials Handling3 17,251 18,226 19,960 83,467 67,345 Total segment profit 98,035 87,629 99,631 394,053 322,213 Amortization of intangible assets4 - - - - - Unallocated expenses5 4,550 5,457 5,738 23,060 23,273 Total adjusted operating income $93,485 $82,172 $93,893 $370,993 $298,940 1. Adjusted segment profit for Specialty Chemicals and Engineered Materials for the twelve months ended December 31, 2017 excludes charges for severance related to organizational realignment of $14. 2. Adjusted segment profit for Microcontamination Control excludes charges for fair value mark-up of acquired inventory sold of $3,379 and$3,281 for the three months ended December 31, 2018 and September 29, 2018, respectively, and $6,868 for the twelve months ended December 31, 2018. Adjusted segment profit for Microcontamination Control excludes impairment of equipment and charges for severance related to organizational realignment of $1,639 for the twelve months ended December 31, 2017. 3. Adjusted segment profit for Advanced Material Handling excludes loss on sale of subsidiary $466 for the three months ended September 29, 2018, Adjusted segment profit for Advanced Material Handling excludes charges for impairment of equipment and severance related to organizational realignment of $460 for the three and twelve months ended December 31, 2018 and $7,507 for the twelve months ended December 31, 2017, respectively. 4. Adjusted amortization of intangible assets excludes amortization expense of $17,050, $11,020, and $21,419 for the three months ended December 31, 2018, December 31, 2017, and September 29, 2018, respectively, and $62,152 and $44,023 for the twelve months ended December 31, 2018 and December 31, 2017, respectively. 5. Adjusted unallocated expenses excludes integration expenses of $1,288, $752 and $3,237 for the three months ended December 31, 2018 and September 29, 2018 and the twelve months ended December 31, 2018, respectively. Adjusted unallocated expenses excludes deal costs of $5,121 for the twelve months ended December 31, 2018. Adjusted unallocated expenses excludes charges for impairment of intangibles and severance related to organizational realignment of $3,940 for the twelve months ended December 31, 2017. 18

NON-GAAP RECONCILIATION TABLE RECONCILIATION OF GAAP TO ADJUSTED OPERATING INCOME AND ADJUSTED EBITDA Three months ended Twelve months ended $ in thousands December 31, 2018 December 31, 2017 September 29, 2018 December 31, 2018 December 31, 2017 Net sales $401,642 $350,562 $398,597 $1,550,497 $1,342,532 Net income (loss) $80,784 ($28,341) $48,060 $240,755 $85,066 Adjustments to net (loss) income: Income tax (benefit) expense (21,078) 70,264 11,427 13,677 99,665 Interest expense, net 8,426 7,533 7,678 30,255 31,628 Other expense (income), net 3,176 21,696 810 8,002 25,458 GAAP - Operating income 71,308 71,152 67,975 292,689 241,817 Charge for fair value write-up of acquired inventory sold 3,379 - 3,281 6,868 - Deal costs - - - 5,121 Integration costs 1,288 - 752 3,237 - Severance 460 - - 460 2,700 Impairment of equipment and intangibles1 - - - - 10,400 Loss on sale of subsidiary - - 466 466 - Amortization of intangible assets 17,050 11,020 21,419 62,152 44,023 Adjusted operating income 93,485 82,172 93,893 370,993 298,940 Depreciation 16,468 15,035 16,537 65,116 58,208 Adjusted EBITDA $109,953 $97,207 $110,430 436,109 $357,148 Adjusted operating margin 23.3% 23.4% 23.6% 23.9% 22.3% Adjusted EBITDA - as a % of net sales 27.4% 27.7% 27.7% 28.1% 26.6% 1. Includes product line impairment charges of $5,330 classified as cost of sales for the twelve months ended December 31, 2017. Includes intangible impairment charge of $3,866 classified as selling general and administrative expense for the twelve months ended December 31, 2017. Includes product line impairment charge of $320 classified as selling general and administrative expense for the twelve months ended December 31, 2017. Includes product line impairment charge of $884 classified as engineering, research and development expense for the twelve months ended December 31, 2017. 19
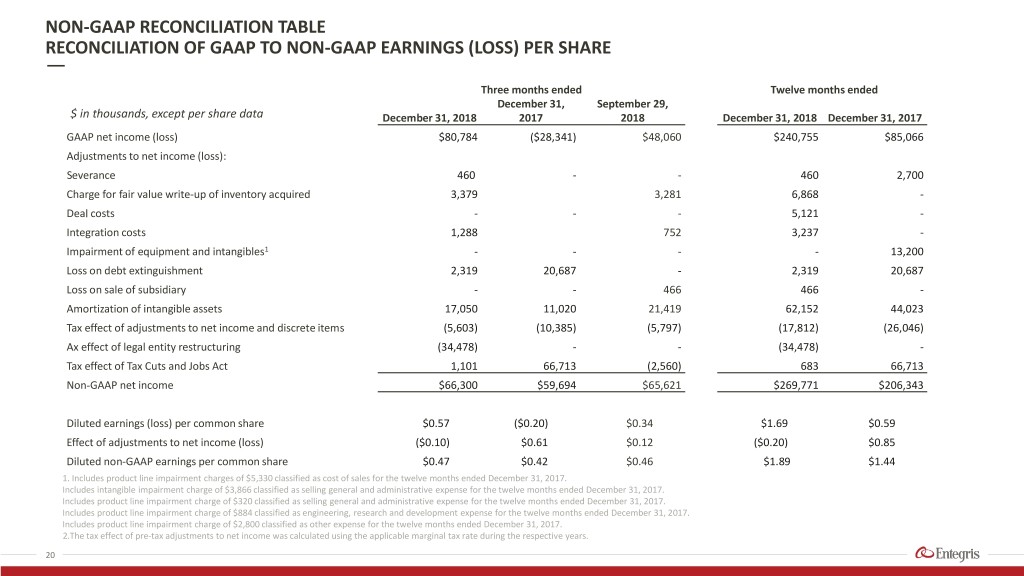
NON-GAAP RECONCILIATION TABLE RECONCILIATION OF GAAP TO NON-GAAP EARNINGS (LOSS) PER SHARE Three months ended Twelve months ended December 31, September 29, $ in thousands, except per share data December 31, 2018 2017 2018 December 31, 2018 December 31, 2017 GAAP net income (loss) $80,784 ($28,341) $48,060 $240,755 $85,066 Adjustments to net income (loss): Severance 460 - - 460 2,700 Charge for fair value write-up of inventory acquired 3,379 3,281 6,868 - Deal costs - - - 5,121 - Integration costs 1,288 752 3,237 - Impairment of equipment and intangibles1 - - - - 13,200 Loss on debt extinguishment 2,319 20,687 - 2,319 20,687 Loss on sale of subsidiary - - 466 466 - Amortization of intangible assets 17,050 11,020 21,419 62,152 44,023 Tax effect of adjustments to net income and discrete items (5,603) (10,385) (5,797) (17,812) (26,046) Ax effect of legal entity restructuring (34,478) - - (34,478) - Tax effect of Tax Cuts and Jobs Act 1,101 66,713 (2,560) 683 66,713 Non-GAAP net income $66,300 $59,694 $65,621 $269,771 $206,343 Diluted earnings (loss) per common share $0.57 ($0.20) $0.34 $1.69 $0.59 Effect of adjustments to net income (loss) ($0.10) $0.61 $0.12 ($0.20) $0.85 Diluted non-GAAP earnings per common share $0.47 $0.42 $0.46 $1.89 $1.44 1. Includes product line impairment charges of $5,330 classified as cost of sales for the twelve months ended December 31, 2017. Includes intangible impairment charge of $3,866 classified as selling general and administrative expense for the twelve months ended December 31, 2017. Includes product line impairment charge of $320 classified as selling general and administrative expense for the twelve months ended December 31, 2017. Includes product line impairment charge of $884 classified as engineering, research and development expense for the twelve months ended December 31, 2017. Includes product line impairment charge of $2,800 classified as other expense for the twelve months ended December 31, 2017. 2.The tax effect of pre-tax adjustments to net income was calculated using the applicable marginal tax rate during the respective years. 20
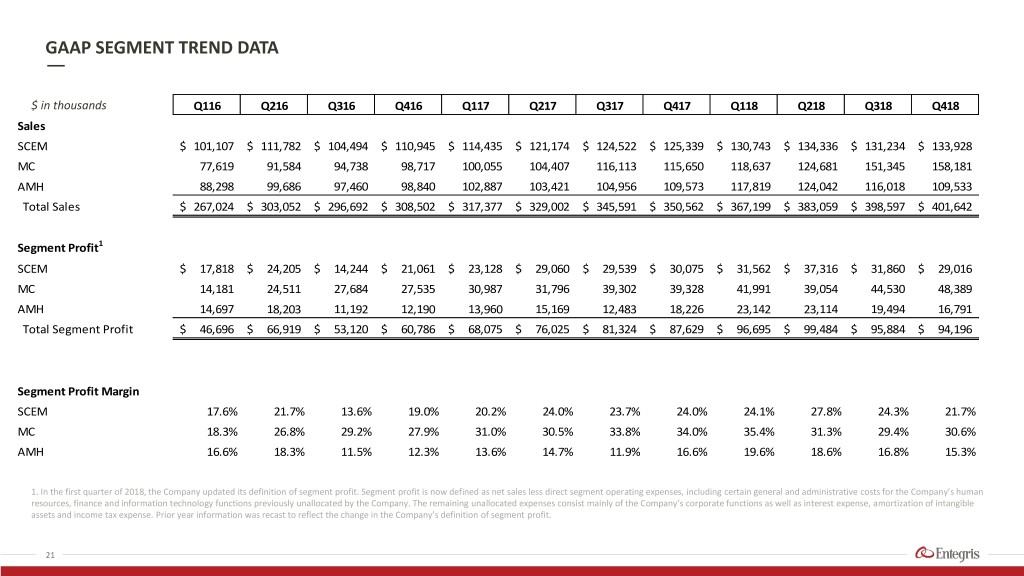
GAAP SEGMENT TREND DATA $ in thousands Q116 Q216 Q316 Q416 Q117 Q217 Q317 Q417 Q118 Q218 Q318 Q418 Sales SCEM $ 101,107 $ 111,782 $ 104,494 $ 110,945 $ 114,435 $ 121,174 $ 124,522 $ 125,339 $ 130,743 $ 134,336 $ 131,234 $ 133,928 MC 77,619 91,584 94,738 98,717 100,055 104,407 116,113 115,650 118,637 124,681 151,345 158,181 AMH 88,298 99,686 97,460 98,840 102,887 103,421 104,956 109,573 117,819 124,042 116,018 109,533 Total Sales $ 267,024 $ 303,052 $ 296,692 $ 308,502 $ 317,377 $ 329,002 $ 345,591 $ 350,562 $ 367,199 $ 383,059 $ 398,597 $ 401,642 Segment Profit1 SCEM $ 17,818 $ 24,205 $ 14,244 $ 21,061 $ 23,128 $ 29,060 $ 29,539 $ 30,075 $ 31,562 $ 37,316 $ 31,860 $ 29,016 MC 14,181 24,511 27,684 27,535 30,987 31,796 39,302 39,328 41,991 39,054 44,530 48,389 AMH 14,697 18,203 11,192 12,190 13,960 15,169 12,483 18,226 23,142 23,114 19,494 16,791 Total Segment Profit $ 46,696 $ 66,919 $ 53,120 $ 60,786 $ 68,075 $ 76,025 $ 81,324 $ 87,629 $ 96,695 $ 99,484 $ 95,884 $ 94,196 Segment Profit Margin SCEM 17.6% 21.7% 13.6% 19.0% 20.2% 24.0% 23.7% 24.0% 24.1% 27.8% 24.3% 21.7% MC 18.3% 26.8% 29.2% 27.9% 31.0% 30.5% 33.8% 34.0% 35.4% 31.3% 29.4% 30.6% AMH 16.6% 18.3% 11.5% 12.3% 13.6% 14.7% 11.9% 16.6% 19.6% 18.6% 16.8% 15.3% 1. In the first quarter of 2018, the Company updated its definition of segment profit. Segment profit is now defined as net sales less direct segment operating expenses, including certain general and administrative costs for the Company’s human resources, finance and information technology functions previously unallocated by the Company. The remaining unallocated expenses consist mainly of the Company’s corporate functions as well as interest expense, amortization of intangible assets and income tax expense. Prior year information was recast to reflect the change in the Company’s definition of segment profit. 21
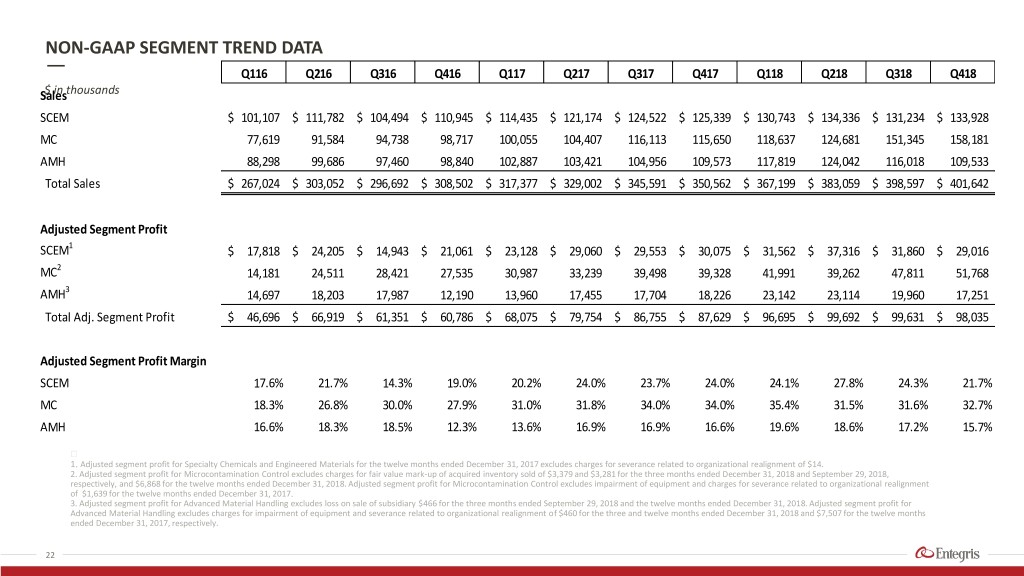
NON-GAAP SEGMENT TREND DATA Q116 Q216 Q316 Q416 Q117 Q217 Q317 Q417 Q118 Q218 Q318 Q418 Sales$ in thousands SCEM $ 101,107 $ 111,782 $ 104,494 $ 110,945 $ 114,435 $ 121,174 $ 124,522 $ 125,339 $ 130,743 $ 134,336 $ 131,234 $ 133,928 MC 77,619 91,584 94,738 98,717 100,055 104,407 116,113 115,650 118,637 124,681 151,345 158,181 AMH 88,298 99,686 97,460 98,840 102,887 103,421 104,956 109,573 117,819 124,042 116,018 109,533 Total Sales $ 267,024 $ 303,052 $ 296,692 $ 308,502 $ 317,377 $ 329,002 $ 345,591 $ 350,562 $ 367,199 $ 383,059 $ 398,597 $ 401,642 Adjusted Segment Profit SCEM1 $ 17,818 $ 24,205 $ 14,943 $ 21,061 $ 23,128 $ 29,060 $ 29,553 $ 30,075 $ 31,562 $ 37,316 $ 31,860 $ 29,016 MC2 14,181 24,511 28,421 27,535 30,987 33,239 39,498 39,328 41,991 39,262 47,811 51,768 AMH3 14,697 18,203 17,987 12,190 13,960 17,455 17,704 18,226 23,142 23,114 19,960 17,251 Total Adj. Segment Profit $ 46,696 $ 66,919 $ 61,351 $ 60,786 $ 68,075 $ 79,754 $ 86,755 $ 87,629 $ 96,695 $ 99,692 $ 99,631 $ 98,035 Adjusted Segment Profit Margin SCEM 17.6% 21.7% 14.3% 19.0% 20.2% 24.0% 23.7% 24.0% 24.1% 27.8% 24.3% 21.7% MC 18.3% 26.8% 30.0% 27.9% 31.0% 31.8% 34.0% 34.0% 35.4% 31.5% 31.6% 32.7% AMH 16.6% 18.3% 18.5% 12.3% 13.6% 16.9% 16.9% 16.6% 19.6% 18.6% 17.2% 15.7% 1. Adjusted segment profit for Specialty Chemicals and Engineered Materials for the twelve months ended December 31, 2017 excludes charges for severance related to organizational realignment of $14. 2. Adjusted segment profit for Microcontamination Control excludes charges for fair value mark-up of acquired inventory sold of $3,379 and $3,281 for the three months ended December 31, 2018 and September 29, 2018, respectively, and $6,868 for the twelve months ended December 31, 2018. Adjusted segment profit for Microcontamination Control excludes impairment of equipment and charges for severance related to organizational realignment of $1,639 for the twelve months ended December 31, 2017. 3. Adjusted segment profit for Advanced Material Handling excludes loss on sale of subsidiary $466 for the three months ended September 29, 2018 and the twelve months ended December 31, 2018. Adjusted segment profit for Advanced Material Handling excludes charges for impairment of equipment and severance related to organizational realignment of $460 for the three and twelve months ended December 31, 2018 and $7,507 for the twelve months ended December 31, 2017, respectively. 22


