Exhibit 99.2 Earnings Summary Third Quarter 2019 October 24, 2019

SAFE HARBOR This presentation contains forward-looking statements within the meaning of the Private Securities Litigation Reform Act of 1995. The words “believe,” “expect,” “anticipate,” “intend,” “estimate,” “forecast,” “project,” “should,” “may,” “will,” “would” or the negative thereof and similar expressions are intended to identify such forward-looking statements. These forward-looking statements include statements related to future period guidance; future sales, net income, net income per diluted share, non-GAAP EPS, non-GAAP net income, expenses and other financial metrics; the Company’s performance relative to its markets; the impact, financial or otherwise, of any organizational changes; market and technology trends; the development of new products and the success of their introductions; the Company's capital allocation strategy, which may be modified at any time for any reason, including share repurchases, dividends, debt repayments and potential acquisitions; the effect of the Tax Cuts and Jobs Act on the Company’s capital allocation strategy; the impact of the acquisitions the Company has made and commercial partnerships the Company has established; the Company’s ability to execute on its strategies; and other matters. These statements involve risks and uncertainties, and actual results may differ materially from those projected in the forward-looking statements. These risks and uncertainties include, but are not limited to, weakening of global and/or regional economic conditions, generally or specifically in the semiconductor industry, which could decrease the demand for the Company’s products and solutions; the Company’s ability to meet rapid demand shifts; the Company’s ability to continue technological innovation and introduce new products to meet customers' rapidly changing requirements; the Company’s concentrated customer base; the Company’s ability to identify, effect and integrate acquisitions, joint ventures or other transactions; the Company’s ability to effectively implement any organizational changes; the Company’s ability to protect and enforce intellectual property rights; operational, political and legal risks of the Company’s international operations; the Company’s dependence on sole source and limited source suppliers; the increasing complexity of certain manufacturing processes; raw material shortages, supply constraints and price increases; changes in government regulations of the countries in which the Company operates; fluctuation of currency exchange rates; fluctuations in the market price of the Company’s stock; the level of, and obligations associated with, the Company’s indebtedness; and other risk factors and additional information described in the Company’s filings with the Securities and Exchange Commission, including under the heading “Risks Factors" in Item 1A of the Company’s Annual Report on Form 10-K for the fiscal year ended December 31, 2018, filed on February 11, 2019, and in the Company’s other periodic filings. The Company assumes no obligation to update any forward-looking statements or information, which speak as of their respective dates. This presentation contains references to “Adjusted EBITDA,” “Adjusted EBITDA Margin,” “Adjusted Operating Income,” “Adjusted Gross Profit,” “Adjusted Operating Margin” and “Non-GAAP Earnings per Share” that are not presented in accordance GAAP. The non-GAAP financial measures should not be considered in isolation or as a substitute for GAAP financial measures but should instead be read in conjunction with the GAAP financial measures. Further information with respect to and reconciliations of such measures to the most directly comparable GAAP financial measure can be found attached to this presentation. 2

3Q19 SUMMARY o Third-quarter revenue of $394.1 million, decreased 1% from prior year o GAAP net income per diluted share of $0.30, decreased 12% from prior year o Non-GAAP net income per diluted share of $0.50, increased 9% from prior year o Acquired Hangzhou Anow Microfiltration in September 3

Summary – Consolidated Statement of Operations (GAAP) 3Q19 over 3Q19 over $ in millions, except per share data 3Q19 3Q19 Guidance 2Q19 3Q18 3Q18 2Q19 Net Revenue $394.1 $385 -$400 $378.9 $398.6 (1.1%) 4.0% Gross Margin 43.2% 43.9% 45.6% Operating Expenses $117.6 $115 - $117 $111.4 $113.7 3.4% 5.6% Operating Income $52.8 $54.9 $68.0 (22.4%) (3.8%) Operating Margin 13.4% 14.5% 17.1% Tax Rate 2.1% 25.9% 19.2% Net Income $40.8 $40 - $46 $124.0 $48.1 (15.2%) (67.1%) Earnings per diluted share $0.30 $0.29 - $0.34 $0.91 $0.34 (11.8%) (67.0%) 4

Summary – Consolidated Statement of Operations (Non-GAAP)1 3Q19 over 3Q19 over $ in millions, except per share data 3Q19 3Q19 Guidance 2Q19 3Q18 3Q18 2Q19 Net Revenue $394.1 $385 - $400 $378.9 $398.6 (1.1%) 4.0% Adjusted Gross Margin2 44.6% 44.1% 46.4% Non-GAAP Operating $87.6 $92 - $94 $90.2 $91.1 (3.8%) (2.9%) Expenses3 Adjusted Operating Income $88.2 $76.8 $93.9 (6.1%) 14.8% Adjusted Operating Margin 22.4% 20.3% 23.6% Non-GAAP Tax Rate4 11.5% 20.4% 23.2% Non-GAAP Net Income5 $68.2 $57 - $64 $53.4 $65.6 4.0% 27.7% Non-GAAP EPS $0.50 $0.42 - $0.47 $0.39 $0.46 8.7% 28.2% 1. See GAAP to Non-GAAP reconciliation tables in the appendix of this presentation. 2. Adjusted Gross Margin excludes charge for fair value write-up of acquired inventory sold and severance and restructuring costs. 3. Non-GAAP Operating Expenses exclude amortization expense, deal costs, integration costs, loss on sale of subsidiary, and severance and restructuring costs. 4. Non-GAAP Tax Rate reflects the tax effect of non-GAAP adjustments and discrete tax items to GAAP taxes. 5. Non-GAAP Net Income excludes amortization expense, the tax effect of non-GAAP adjustments and discrete tax items to GAAP taxes. 5

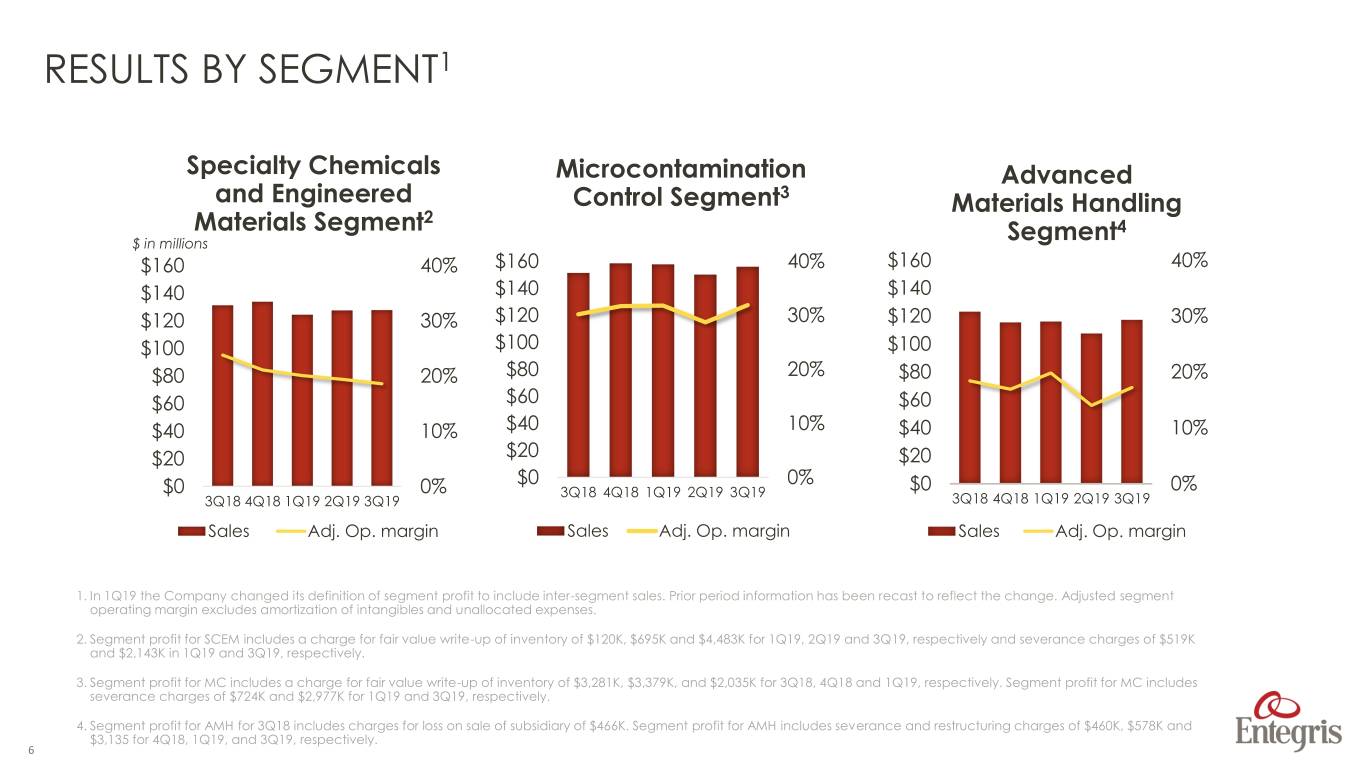
RESULTS BY SEGMENT1 Specialty Chemicals Microcontamination Advanced and Engineered Control Segment3 Materials Handling 2 Materials Segment 4 $ in millions Segment $160 40% $160 40% $160 40% $140 $140 $140 $120 30% $120 30% $120 30% $100 $100 $100 $80 20% $80 20% $80 20% $60 $60 $60 $40 10% $40 10% $40 10% $20 $20 $20 $0 0% $0 0% 3Q18 4Q18 1Q19 2Q19 3Q19 $0 0% 3Q18 4Q18 1Q19 2Q19 3Q19 3Q18 4Q18 1Q19 2Q19 3Q19 Sales Adj. Op. margin Sales Adj. Op. margin Sales Adj. Op. margin 1. In 1Q19 the Company changed its definition of segment profit to include inter-segment sales. Prior period information has been recast to reflect the change. Adjusted segment operating margin excludes amortization of intangibles and unallocated expenses. 2. Segment profit for SCEM includes a charge for fair value write-up of inventory of $120K, $695K and $4,483K for 1Q19, 2Q19 and 3Q19, respectively and severance charges of $519K and $2,143K in 1Q19 and 3Q19, respectively. 3. Segment profit for MC includes a charge for fair value write-up of inventory of $3,281K, $3,379K, and $2,035K for 3Q18, 4Q18 and 1Q19, respectively. Segment profit for MC includes severance charges of $724K and $2,977K for 1Q19 and 3Q19, respectively. 4. Segment profit for AMH for 3Q18 includes charges for loss on sale of subsidiary of $466K. Segment profit for AMH includes severance and restructuring charges of $460K, $578K and $3,135 for 4Q18, 1Q19, and 3Q19, respectively. 6

REVENUE BY GEOGRAPHY: Strong growth in Taiwan and N. America YTD19 Revenue by Geography YTD19 vs. YTD18 Growth Rate Revenue = $ million Taiwan 5% Taiwan N. America 10% N. America $222.2M $280.3M South Korea 1% Southeast Japan -6% Asia $74.2M $98.9M Europe China 3% $190.0M Europe -5% $148.1M Japan Southeast Asia -15% South Korea $150.4M China -20% -10% 0% 10% 20% 7

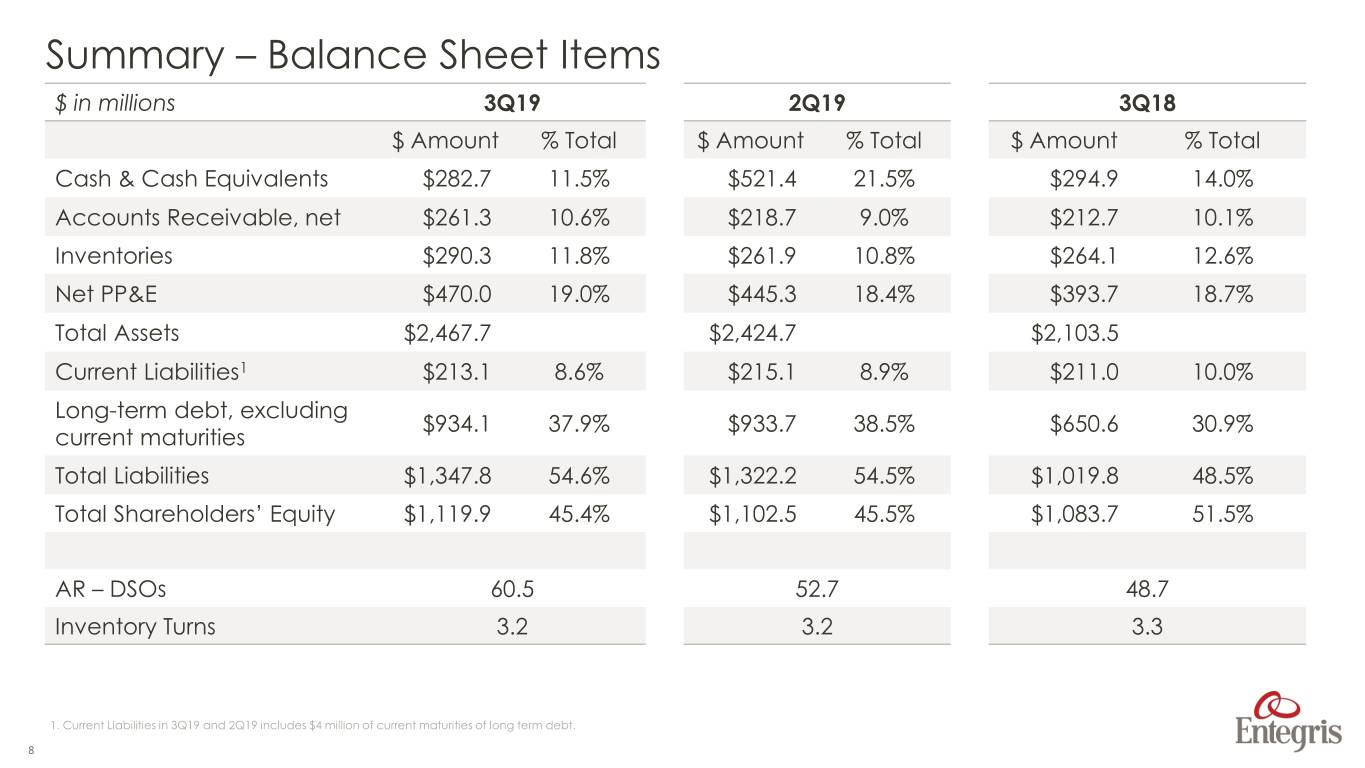
Summary – Balance Sheet Items $ in millions 3Q19 2Q19 3Q18 $ Amount % Total $ Amount % Total $ Amount % Total Cash & Cash Equivalents $282.7 11.5% $521.4 21.5% $294.9 14.0% Accounts Receivable, net $261.3 10.6% $218.7 9.0% $212.7 10.1% Inventories $290.3 11.8% $261.9 10.8% $264.1 12.6% Net PP&E $470.0 19.0% $445.3 18.4% $393.7 18.7% Total Assets $2,467.7 $2,424.7 $2,103.5 Current Liabilities1 $213.1 8.6% $215.1 8.9% $211.0 10.0% Long-term debt, excluding $934.1 37.9% $933.7 38.5% $650.6 30.9% current maturities Total Liabilities $1,347.8 54.6% $1,322.2 54.5% $1,019.8 48.5% Total Shareholders’ Equity $1,119.9 45.4% $1,102.5 45.5% $1,083.7 51.5% AR – DSOs 60.5 52.7 48.7 Inventory Turns 3.2 3.2 3.3 1. Current Liabilities in 3Q19 and 2Q19 includes $4 million of current maturities of long term debt. 8

ADJUSTED EBITDA MARGIN1 Adjusted EBITDA and EBITDA Margin 28.9% 27.7% 27.7% 27.7% 28.5% 27.5% 27.8% 26.8% 27.3% $109 $106 $110 25.2% 23.9% $110 $109 $108 $96 $97 $95 80 $88 $76 40 0 1Q17 2Q17 3Q17 4Q17 1Q18 2Q18 3Q18 4Q18 1Q19 2Q19 3Q19 Adj. EBITDA in $M Adj. EBITDA as % of Sales 1. See Reconciliation of GAAP Income to Adjusted Operating Income and Adjusted EBITDA in the appendix of this presentation. 9

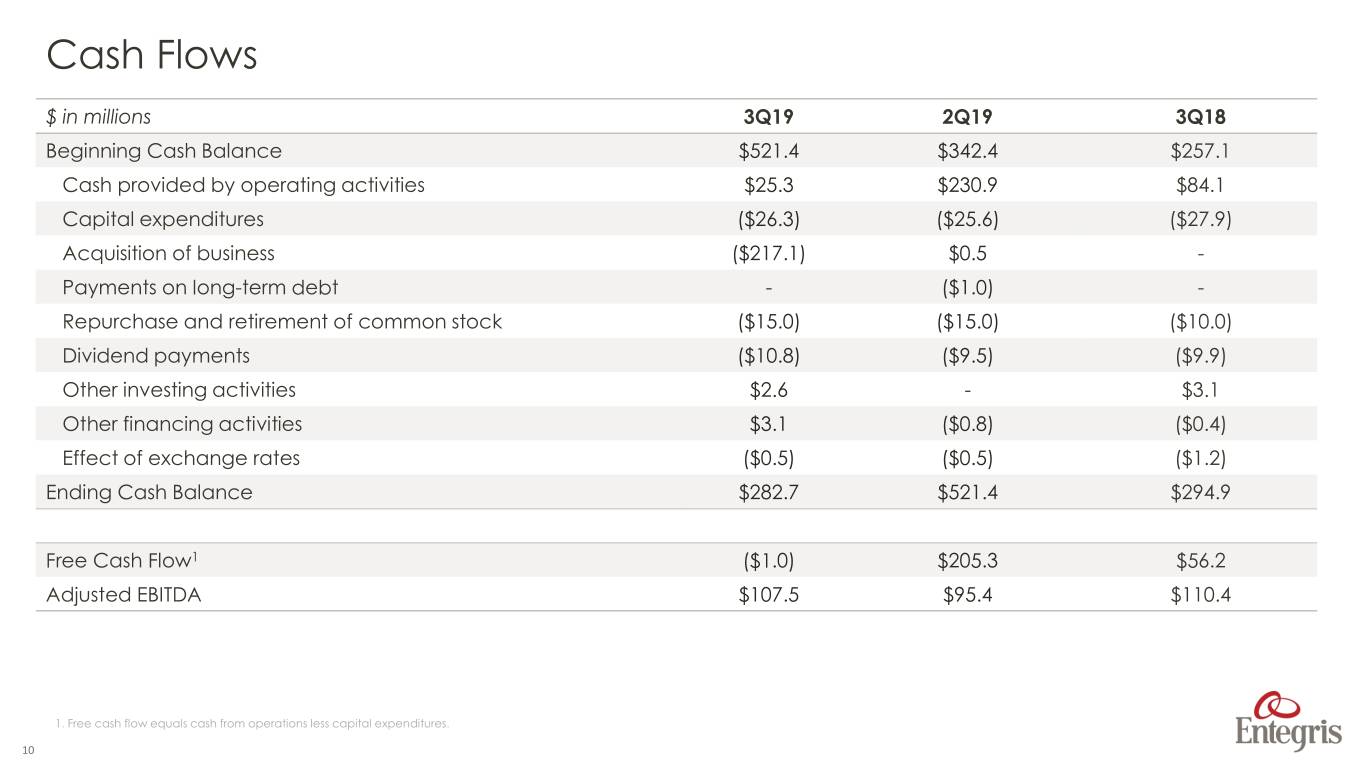
Cash Flows $ in millions 3Q19 2Q19 3Q18 Beginning Cash Balance $521.4 $342.4 $257.1 Cash provided by operating activities $25.3 $230.9 $84.1 Capital expenditures ($26.3) ($25.6) ($27.9) Acquisition of business ($217.1) $0.5 - Payments on long-term debt - ($1.0) - Repurchase and retirement of common stock ($15.0) ($15.0) ($10.0) Dividend payments ($10.8) ($9.5) ($9.9) Other investing activities $2.6 - $3.1 Other financing activities $3.1 ($0.8) ($0.4) Effect of exchange rates ($0.5) ($0.5) ($1.2) Ending Cash Balance $282.7 $521.4 $294.9 Free Cash Flow1 ($1.0) $205.3 $56.2 Adjusted EBITDA $107.5 $95.4 $110.4 1. Free cash flow equals cash from operations less capital expenditures. 10

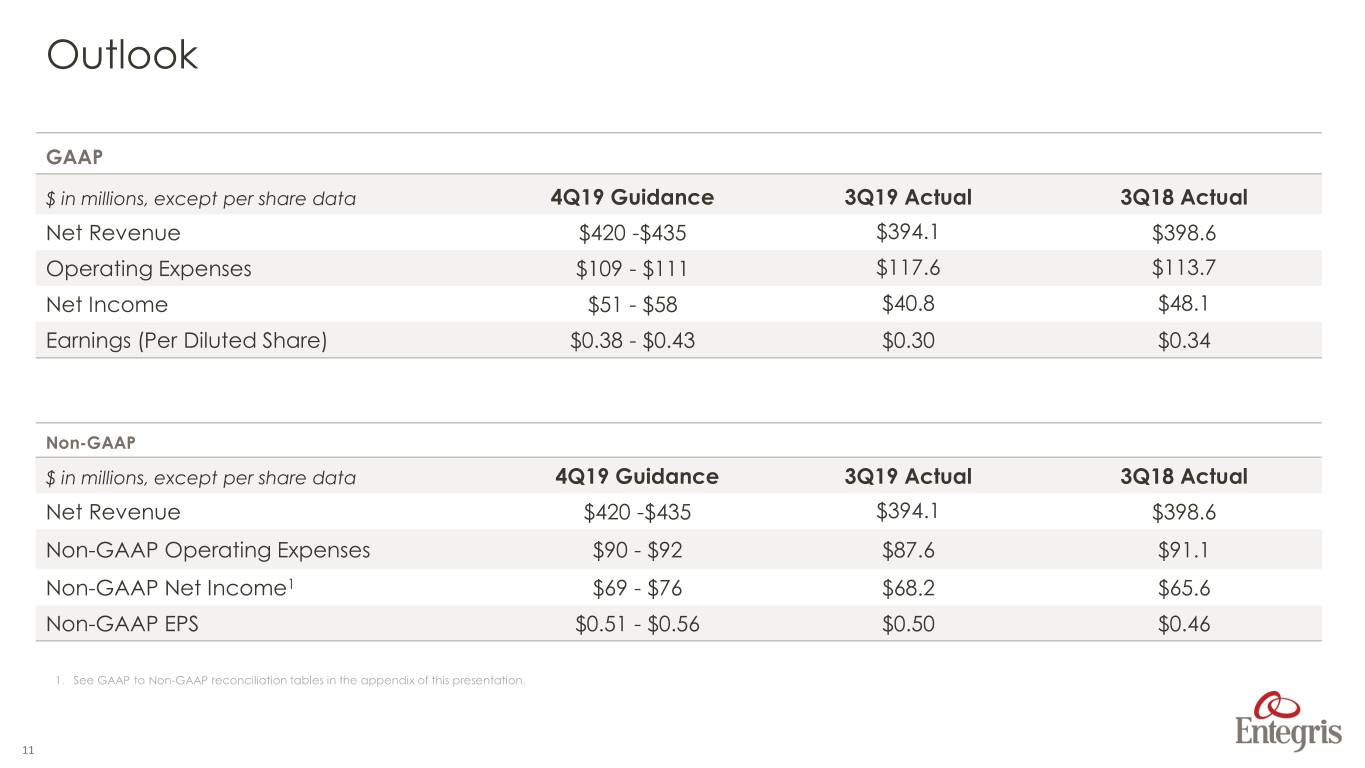
Outlook GAAP $ in millions, except per share data 4Q19 Guidance 3Q19 Actual 3Q18 Actual Net Revenue $420 -$435 $394.1 $398.6 Operating Expenses $109 - $111 $117.6 $113.7 Net Income $51 - $58 $40.8 $48.1 Earnings (Per Diluted Share) $0.38 - $0.43 $0.30 $0.34 Non-GAAP $ in millions, except per share data 4Q19 Guidance 3Q19 Actual 3Q18 Actual Net Revenue $420 -$435 $394.1 $398.6 Non-GAAP Operating Expenses $90 - $92 $87.6 $91.1 Non-GAAP Net Income1 $69 - $76 $68.2 $65.6 Non-GAAP EPS $0.51 - $0.56 $0.50 $0.46 1. See GAAP to Non-GAAP reconciliation tables in the appendix of this presentation. 11

Entegris®, the Entegris Rings Design™ and Pure Advantage™ are trademarks of Entegris, Inc. ©2016 Entegris, Inc. All rights reserved.

NON-GAAP RECONCILIATION TABLE RECONCILIATION OF GAAP GROSS PROFIT TO ADJUSTED GROSS PROFIT Three months ended Nine months ended September 28, September 29, September 28, September 29, 2019 2018 June 29, 2019 2019 2018 Net Sales $394,147 $398,597 $378,874 $1,164,068 $1,148,855 Gross profit-GAAP $170,350 $181,716 $166,274 $514,017 $540,091 Adjustments to gross profit: Severance and restructuring costs 990 - - 1,348 - Charge for fair value mark-up of acquired inventory sold 4,483 3,281 695 7,333 3,489 Adjusted gross profit $175,823 $184,997 $166,969 $522,698 $543,580 Gross margin - as a % of net sales 43.2% 45.6% 43.9% 44.2% 47.0% Adjusted gross margin - as a % of net sales 44.6% 46.4% 44.1% 44.9% 47.3% 13

NON-GAAP RECONCILIATION TABLE RECONCILIATION OF GAAP SEGMENT PROFIT TO ADJUSTED OPERATING INCOME in thousands Three months ended Nine months ended September 28, September 29, September 28, September 29, Segment profit-GAAP1 2019 2018 June 29, 2019 2019 2018 Specialty Chemicals and Engineered Materials $17,074 $31,210 $24,000 $65,505 $98,859 Microcontamination Control 46,792 42,448 43,126 137,241 119,973 Advanced Materials Handling 17,077 22,226 15,043 54,487 73,231 Total segment profit 80,943 95,884 82,169 257,233 292,063 Amortization of intangible assets 15,152 21,419 16,591 50,400 45,102 Unallocated expenses 12,998 6,490 10,669 51,640 25,580 Total operating income $52,793 $67,975 $54,909 $155,193 $221,381 Three months ended Nine months ended September 28, September 29, September 28, September 29, Adjusted segment profit 2019 2018 June 29, 2019 2019 2018 Specialty Chemicals and Engineered Materials $23,700 $31,210 $24,695 $73,465 $98,859 Microcontamination Control2 49,769 45,729 43,126 142,977 123,462 Advanced Materials Handling3 20,212 22,692 15,043 58,200 73,697 Total adjusted segment profit 93,681 99,631 82,864 274,642 296,018 Adjusted amortization of intangible assets4 - - - - - Adjusted unallocated expenses5 5,461 5,738 6,071 17,449 18,510 Total adjusted operating income $88,220 $93,893 $76,793 $257,193 $277,508 1. In 1Q19 the Company changed its definition of segment profit to include inter-segment sales. Prior period information has been recast to reflect the change. 2. Adjusted segment profit for Specialty Chemicals and Engineered Materials for the three months ended September 28, 2019 and June 29, 2019, and for the nine months ended September 28, 2019 excludes charges for fair value mark-up of acquired inventory sold of $4,483, $695 and $5,298, respectively. Adjusted segment profit for the three and nine months ended September 28, 2019 also excludes charges for severance and restructuring of $2,143 and $2,662, respectively. 3 .Adjusted segment profit for Microcontamination Control for the three and nine months ended September 28, 2019 excludes charges for severance and restructuring of $2,977 and $3,701, respectively. Adjusted segment profit for the three months ended September 29, 2018 and the nine months ended September 28, 2019 and September 29, 2018 excludes charges for fair value mark-up of acquired inventory sold of $3,281, $2,035 and $3,489, respectively. 4. Adjusted segment profit for Advanced Materials Handling for the three and nine months ended September 28, 2019 excludes charges for severance and restructuring of $3,135 and $3,713, respectively. Adjusted segment profit for the three and nine months ended September 29, 2018 excludes loss on the sale of subsidiary of $466. 5. Adjusted amortization of intangible assets excludes amortization expense of $15,152, $21,419 and $16,591 for the three months ended September 28, 2019, September 29, 2018 and June 29, 2019, respectively, and $50,400 and $45,102 for the nine months ended September 28, 2019 and September 29, 2018, respectively. 6. Adjusted unallocated expenses for the three months ended September 28, 2019, September 29, 2018, and June 29, 2019 and the nine months ended September 28, 2019 and September 29, 2018 excludes deal and integration expenses of $7,289, $752, $2,428, $31,773, and $7,070, respectively. Adjusted unallocated expenses for the three months ended September 28, 2019, and June 29, 2019 and the nine months ended September 28, 2019 excludes charges for severance and 14 restructuring of $248, $2,170, and $2,418, respectively.

NON-GAAP RECONCILIATION TABLE RECONCILIATION OF GAAP TO ADJUSTED OPERATING INCOME AND ADJUSTED EBITDA Three months ended Nine months ended September 28, September 29, September 28, September 29, $ in thousands 2019 2018 June 29, 2019 2019 2018 Net sales $394,147 $398,597 $378,874 $1,164,068 $1,148,855 Net income $40,767 $48,060 $123,997 $197,422 $159,971 Adjustments to net income: Income tax expense 876 11,427 43,235 49,533 34,755 Interest expense, net 10,216 7,678 9,692 29,567 21,892 Other expense (income), net 934 810 (122,015) (121,328) 4,826 GAAP - Operating income 52,793 67,975 54,909 155,193 221,381 Charge for fair value write-up of acquired inventory sold 4,483 3,281 695 7,333 3,489 Deal Costs 4,891 - 1,164 25,191 5,121 Integration Costs 2,398 752 1,264 6,582 1,949 Severance and restructuring costs 8,503 - 2,170 12,494 - Loss on sale of subsidiary - 466 - - 466 Amortization of intangible assets 15,152 21,419 16,591 50,400 45,102 Adjusted operating income 88,220 93,893 76,793 257,193 277,508 Depreciation 19,306 16,537 18,596 54,623 48,236 Adjusted EBITDA $107,526 $110,430 $95,389 $311,816 $325,744 Net income – as a % of net sales 10.3% 12.1% 32.7% 17.0% 13.9% Adjusted operating margin 22.4% 23.6% 20.3% 22.1% 24.2% Adjusted EBITDA - as a % of net sales 27.3% 27.7% 25.2% 26.8% 28.4% 15

NON-GAAP RECONCILIATION TABLE RECONCILIATION OF GAAP NET INCOME AND EARNINGS PER SHARE TO NON-GAAP NET INCOME AND EARNINGS PER SHARE Three months ended Nine months ended September 28, September 29, September 28, September 29, $ in thousands, except per share data 2019 2018 June 29, 2019 2019 2018 GAAP net income $40,767 $48,060 $123,997 $197,422 $159,971 Adjustments to net income: Charge for fair value write-up of acquired inventory sold 4,483 3,281 695 7,333 3,489 Deal Costs 4,891 - 1,164 25,602 5,121 Integration Costs 2,398 752 1,264 6,582 1,949 Severance and restructuring costs 8,503 - 2,170 12,494 - Versum termination fee, net - - (122,000) (122,000) - Loss on sale of subsidiary - 466 - - 466 Amortization of intangible assets 15,152 21,419 16,591 50,400 45,102 Tax effect of legal entity restructuring - - 9,398 9,398 - Tax effect of adjustments to net income and discrete items1 (8,015) (5,797) 20,153 2,274 (12,209) Tax effect of Tax Cuts and Jobs Act - (2,560) - - (418) Non-GAAP net income $68,179 $65,621 $53,432 $189,505 $203,471 Diluted earnings per common share $0.30 $0.34 $0.91 $1.45 $1.12 Effect of adjustments to net income $0.20 $0.12 ($0.52) ($0.06) $0.30 Diluted non-GAAP earnings per common share $0.50 $0.46 $0.39 $1.39 $1.42 16

NON-GAAP RECONCILIATION TABLE RECONCILIATION OF GAAP OUTLOOK TO NON-GAAP OUTLOOK (In millions, except per share data) Fourth-Quarter Outlook Reconciliation GAAP net income to non-GAAP net income December 31, 2019 GAAP net income $51 - $58 Adjustments to net income: Charge for fair value write-up of acquired inventory sold 5 Restructuring and integration costs 2 Amortization of intangible assets 17 Income tax effect (6) Non-GAAP net income $69 - $76 Fourth-Quarter Outlook Reconciliation GAAP diluted earnings per share to non-GAAP diluted earnings per share December 31, 2019 Diluted earnings per common share $0.38 - $0.43 Adjustments to diluted earnings per common share: Charge for fair value write-up of acquired inventory sold 0.03 Restructuring and integration costs 0.01 Amortization of intangible assets 0.13 Income tax effect (0.04) Diluted non-GAAP earnings per common share $0.51 to $0.56 17

GAAP Segment Trend Data1 Q117 Q217 Q317 Q417 Q118 Q218 Q318 Q418 Q119 Q219 Q319 $ in thousands Sales SCEM $ 114,435 $ 121,174 $ 124,522 $ 125,339 $ 130,743 $ 134,336 $ 131,234 $ 133,928 $ 124,470 $ 127,552 $ 127,750 MC 100,195 104,587 116,229 115,801 118,923 124,937 151,478 158,500 157,706 150,185 155,979 AMH 108,371 109,658 111,278 115,436 124,078 130,572 123,227 115,527 116,064 107,515 117,256 Inter-segment elimination (5,624) (6,417) (6,438) (6,014) (6,545) (6,786) (7,342) (6,313) (7,193) (6,378) (6,838) Total Sales $ 317,377 $ 329,002 $ 345,591 $ 350,562 $ 367,199 $ 383,059 $ 398,597 $ 401,642 $ 391,047 $ 378,874 $ 394,147 Segment Profit SCEM $ 22,563 $ 28,493 $ 28,981 $ 29,534 $ 30,921 $ 36,728 $ 31,210 $ 28,221 $ 24,431 $ 24,000 $ 17,074 MC 29,380 29,944 37,429 37,686 40,311 37,214 42,448 46,879 47,323 43,126 46,792 AMH 16,132 17,588 14,914 20,409 25,463 25,542 22,226 19,096 22,367 15,043 17,077 Total Segment Profit $ 68,075 $ 76,025 $ 81,324 $ 87,629 $ 96,695 $ 99,484 $ 95,884 $ 94,196 $ 94,121 $ 82,169 $ 80,943 1. In 1Q19 the Company changed its definition of segment profit to include inter-segment sales. Prior period information has been recast to reflect the change. 18

NON-GAAP Segment Trend Data1 $ in thousands Q117 Q217 Q317 Q417 Q118 Q218 Q318 Q418 Q119 Q219 Q319 Sales SCEM $ 114,435 $ 121,174 $ 124,522 $ 125,339 $ 130,743 $ 134,336 $ 131,234 $ 133,928 $ 124,470 $ 127,552 $ 127,750 MC 100,195 104,587 116,229 115,801 118,923 124,937 151,478 158,500 157,706 150,185 155,979 AMH 108,371 109,658 111,278 115,436 124,078 130,572 123,227 115,527 116,064 107,515 117,256 Inter-segment elimination (5,624) (6,417) (6,438) (6,014) (6,545) (6,786) (7,342) (6,313) (7,193) (6,378) (6,838) Total Sales $ 317,377 $ 329,002 $ 345,591 $ 350,562 $ 367,199 $ 383,059 $ 398,597 $ 401,642 $ 391,047 $ 378,874 $ 394,147 Adjusted Segment Profit SCEM2 $ 22,563 $ 28,493 $ 28,995 $ 29,534 $ 30,921 $ 36,728 $ 31,210 $ 28,221 $ 25,070 $ 24,695 $ 23,700 3 MC 29,380 31,387 37,625 37,686 40,311 37,422 45,729 50,258 50,082 43,126 49,769 4 AMH 16,132 19,874 20,135 20,409 25,463 25,542 22,692 19,556 22,945 15,043 20,212 Total Adj. Segment Profit $ 68,075 $ 79,754 $ 86,755 $ 87,629 $ 96,695 $ 99,692 $ 99,631 $ 98,035 $ 98,097 $ 82,864 $ 93,681 Adjusted Segment Profit Margin SCEM 19.7% 23.5% 23.3% 23.6% 23.7% 27.3% 23.8% 21.1% 20.1% 19.4% 18.6% MC 29.3% 30.0% 32.4% 32.5% 33.9% 30.0% 30.2% 31.7% 31.8% 28.7% 31.9% AMH 14.9% 18.1% 18.1% 17.7% 20.5% 19.6% 18.4% 16.9% 19.8% 14.0% 17.2% 1. In 1Q19 the Company changed its definition of segment profit to include inter-segment sales. Prior period information has been recast to reflect the change. Segment profit excludes amortization of intangibles and unallocated expenses. 2. Adjusted segment profit for SCEM for 3Q17, 1Q19,and 3Q19 excludes charges for severance and restructuring of $14, $519 and $2,143. Adjusted segment profit for SCEM for 1Q19, 2Q19 and 3Q19 excludes fair value mark-up of inventory and severance charges of $120, $695 and $4,483, respectively. 3. Adjusted segment profit for MC for 2Q17 excludes charges for impairment of equipment and severance of $884 and $559, respectively. Adjusted segment profit for MC for 3Q17, 1Q19 and 3Q19 excludes charges for severance of $196, $724, and $2,977, respectively. Adjusted segment profit for MC for 2Q18, 3Q18, 4Q18 and 1Q19 excludes charges for fair value mark-up of acquired inventory sold of $208, $3,281, $3,379, and $2,035 respectively. 4. Adjusted segment profit for AMH for 2Q17 excludes charges for impairment of equipment of $2,286. Adjusted segment profit for AMH for 3Q17 excludes impairment of equipment and severance and restructuring of $3,364 and $1,857 respectively. Adjusted segment profit for AMH for 3Q18 excludes loss on sale of subsidiary of $466. Adjusted segment profit for 19 AMH for 4Q18, 1Q19, and 3Q19 excludes severance and restructuring of $460, $578, and $3,135, respectively.


