Exhibit 99.1
Our Company
Entegris, Inc. is a worldwide developer, manufacturer and supplier of products and materials used in processing and manufacturing in the microelectronics and other high-technology industries. For the semiconductor industry, a subset of the microelectronics industry that constitutes the majority of our sales, our products maintain the purity and integrity of critical materials used in the semiconductor manufacturing process. For other high-technology applications, our products and materials are used in the manufacture of flat panel displays, light emitting diodes or “LEDs”, high-purity chemicals, such as photoresists, solar cells, gas lasers, optical and magnetic storage devices, and critical components for aerospace, glass manufacturing and biomedical applications. We sell our products worldwide through a direct sales force and through selected distributors.
Our Business
Semiconductors, or integrated circuits, are the building blocks of today’s electronics and the backbone of the information age. The market for semiconductors has grown significantly over past decades. This trend is expected to continue due to increased usage of, and reliance on, the Internet through expanding channels, and the continuing demand for applications in data processing, wireless communications, broadband infrastructure, personal computers, handheld electronic devices and other consumer electronics. The manufacture of semiconductors is a highly complex process that begins with the delivery of raw silicon wafers from wafer manufacturers to semiconductor manufacturers and requires hundreds of highly complex and sensitive manufacturing steps, during which a variety of materials, including chemicals, gases and metals are repeatedly applied to the silicon wafer to build the integrated circuits on the wafer surface. We offer products, such as liquid and gas filters and purifiers, fluid and gas handling components and wafer shippers and process carriers, to purify these materials and to support each of these primary process steps, as well as products to transport in-process wafers between each of these steps.
Overview of Our Business Segments
We design, manufacture and market our products through three business segments: (i) our contamination control solutions segment, which offers a wide range of products, including liquid
1
filtration and other consumable products, that purify, monitor and deliver critical liquids and gases to the semiconductor manufacturing process and similar manufacturing processes, (ii) our microenvironments segment, which offers products to preserve the integrity of wafers, reticles and electronic components at various stages of transport, processing and storage, and (iii) our specialty materials segment, which offers materials, components and services to a wide range of customers in the semiconductor industry and in adjacent and unrelated industries. For the year ended December 31, 2013, we generated 64%, 26% and 10% of our net sales, respectively, from these segments. Following the completion of the Merger we expect to reevaluate our financial reporting and business segments, which may result in a change to how we report our financial results in the future.
Diversity of Our Customers and Products
Within the semiconductor market, our major customer groups include integrated circuit device manufacturers, original equipment manufacturers (“OEMs”) that provide equipment to integrated circuit device manufacturers, gas and chemical manufacturing companies and manufacturers of high-precision electronics. We offer a diverse product portfolio that includes approximately 17,000 standard and customized products that we believe provide the most comprehensive offering of products and services to maintain the purity and integrity of critical materials used by the semiconductor and other high-technology industries. In 2013, 2012 and 2011, sales to our top ten customers accounted for approximately 35%, 36% and 29%, respectively, of our net sales. During those same periods no single customer accounted for more than 10% of our net sales. Additionally, in 2013 our largest customer purchased products from 20 of our different product lines. Over 2,400 customers purchased products from us during 2013.
Acquisition of ATMI
On February 4, 2014, we entered into an Agreement and Plan of Merger (the “Merger Agreement”) with ATMI, Inc. and Atomic Merger Corporation, a Delaware corporation and wholly-owned subsidiary of Entegris, Inc. (“Merger Sub”). The Merger Agreement provides that, upon the terms and subject to the conditions thereof, Merger Sub will be merged with and into ATMI (the “Merger”). Upon the closing of the Merger, ATMI will become a wholly-owned subsidiary of us.
Pursuant to the terms and subject to the conditions of the Merger Agreement, at the effective time of the Merger (the “Effective Time”), each share of ATMI’s common stock (“ATMI Common Stock”) issued and outstanding immediately prior to the Effective Time will be cancelled and extinguished and converted into the right to receive $34.00 in cash, without interest or dividends, other than shares of ATMI Common Stock: (i) owned directly by Entegris, or any of its subsidiaries; (ii) owned by ATMI as treasury stock, or by any of its subsidiaries, (iii) subject to time and/or performance vesting conditions; or (iv) as to which dissenters’ rights have been properly exercised.
The Merger is expected to be financed through:
| | • | | a $545,000,000 senior secured credit facilities (the “Senior Credit Facilities”) consisting of: |
| | • | | a $460,000,000 term loan facility (the “Term Facility”); and |
| | • | | a $85,000,000 senior secured asset-based revolving credit facility, which is expected to be undrawn at closing (the “ABL Facility”). |
| | • | | $360,000,000 of senior unsecured notes; and |
| | • | | approximately $379,000,000 of cash on hand. |
2
We refer to the Merger and the related transactions, including the offer and sale of the Notes and the borrowings under our Senior Credit Facilities, as the “Transactions.”
ATMI’s Business
ATMI is among the leading suppliers of high performance materials, materials packaging and materials delivery systems used worldwide in the manufacture of microelectronics devices. Its products consist of semiconductor performance materials, sub-atmospheric pressure gas delivery systems for safe handling and delivery of toxic and hazardous gases to semiconductor process equipment, and high-purity materials packaging and dispensing systems that allow for the reliable introduction of low volatility liquids and solids to microelectronics processes. ATMI targets semiconductor and flat-panel display manufacturers, whose products form the foundation of microelectronics technology rapidly proliferating through the consumer products, information technology, automotive, and communications industries. The market for microelectronics devices is continually changing, which drives demand for new products and technologies that have improved performance at lower cost. ATMI’s customers include many of the leading semiconductor manufacturers in the world who target leading-edge technologies. ATMI’s objective is to meet the demands of its customers with solutions that maximize the efficiency and safety of their manufacturing processes, reduce capital or operating costs, and minimize the time to develop new products and integrate them into their processes.
ATMI believes it is among the most innovative suppliers of high-purity materials and related delivery systems and technologies. Products serving the integrated circuit (“IC”) fabrication market represent the largest portion of ATMI’s business and development activities. The principal drivers for this market are cost, yield, speed, utilization of capital, and risk reduction. The success of an electronic component or device is driven by the increased functionality it can deliver at a lower cost. Yield and capital utilization are significant drivers for the integrated circuit industry due to the implications on throughput and financial return, and the challenge is compounded by the requirement to manufacture devices for increasingly complex advanced technology generations. In an industry where the capital infrastructure is significant and product life cycles are short, the ability to bring the latest technology rapidly to market can make a significant difference in its customers’ success. ATMI’s ability to shorten deployment of production-ready solutions is critical to its success.
ATMI markets and sells its materials products to end-use customers, chemical suppliers, and OEMs through its direct sales force. High-purity materials packaging containers are generally sold to chemical suppliers, who sell their high-purity chemicals in these containers at the request of end-users.
ATMI’s History
ATMI’s predecessor was incorporated in Delaware in 1987. Since then, ATMI has established itself as a leader in the supply of performance materials and advanced packaging used by today’s leading semiconductor manufacturers. ATMI completed its initial public offering in 1993, trading on the NASDAQ stock exchange under the symbol “ATMI”. On February 20, 2014, ATMI, Inc. and certain of its subsidiaries consummated the previously announced transaction to sell its LifeSciences business to Pall Corporation pursuant to the Share and Asset Purchase Agreement dated December 22, 2013, in exchange for cash proceeds of $185 million, subject to customary working capital adjustments (the “LS Sale”). For the year ended December 31, 2013, ATMI accounted for the LifeSciences business as a discontinued operation and ATMI’s revenues from discontinued operations were approximately $49.4 million.
3
Our Combined Competitive Strengths
Following the completion of the Merger we believe that our competitive strengths, on a combined basis, will include the following:
Industry-Leading Platform that Provides Critical Defect Management and Yield Improvement Solutions
The semiconductor industry is in the midst of a significant period of technology investment to develop the manufacturing processes needed to make the next generations of semiconductor chips. The cost and complexity of these processes are resulting in new manufacturing challenges that have semiconductor makers increasingly focused on cost, yield, speed, utilization of capital and risk reduction. We and ATMI are leading providers of technologies and products that seek to reduce manufacturing defects and enable semiconductor makers to maximize their yields. Since there is essentially no overlap in the respective product offerings of us and ATMI, the combined company will have broader technology expertise related to the development, handling, delivery, and integrity of critical process materials used in key parts of the semiconductor fabrication process. The ability to provide cleaner materials and more controlled shipment and delivery of those materials is expected to have a meaningful impact on manufacturing yields as the semiconductor industry adopts new technologies, which we believe will provide additional opportunities for us in the future.
Positive Underlying Market Dynamics
The markets for our and ATMI’s products are in large part driven by demand for new types of semiconductor devices and other microelectronics, which has grown over the past two decades. This growth is expected to continue as the focus of the global electronics market transitions from fast and efficient computing and communications technologies that connect people to each other to technologies that connect equipment to a broader network. This next generation of electronics products and services has been termed the “Internet of Things.” We expect to continue to benefit from both the continued growth in semiconductor demand and the manufacturing challenges that arise with generations of new and more complex devices.
A More Stable Unit-Driven Model Linked to Increasing Semiconductor Production
Approximately 66% of Entegris’ net sales in 2013 are considered to be “unit-driven”, meaning that they are replaced or consumed within a period of 18 months or less, and therefore are directly or indirectly related to production levels of semiconductor devices or microelectronics products. With nearly all of ATMI’s revenues driven by its customers’ production output, following the Merger we expect that approximately 78% of our net sales will be considered to be “unit-driven.” We expect that this higher proportion of net sales related to unit production will provide for growth opportunities as unit production in the semiconductor industry continues to grow, and will provide us with a more stable revenue stream than those tied to semiconductor capital spending cycles.
Diversity of Customers
On a combined basis we expect that our customer base will include virtually all significant customers across the supply chain in the semiconductor and microelectronics industries as well in other high technology markets. These customers include materials companies, suppliers of OEM manufacturing equipment and tools, and semiconductor device manufacturers. We believe that this breadth of customers and the minimal product overlap between us and ATMI will provide for opportunities to increase our penetration at some customers. In addition, we believe that our relatively
4
low customer concentration levels can provide us with additional opportunities to increase sales at our largest customers. In 2013 more than 2,400 customers purchased products from us, no customer accounted for more than 10% of our net sales and our top ten customers accounted for approximately 35% of our net sales. We estimate that, on a combined basis, our and ATMI’s top 10 customers in 2013 would have accounted for approximately 41% of our and ATMI’s combined net sales and revenues, after giving effect to the LS Sale.
Trusted Partner of Leading Semiconductor Manufacturers and OEMs
Both Entegris and ATMI have served leading companies across the semiconductor supply chain for many years. We believe that both companies are viewed as trusted partners by customers providing solutions from early stage development to finished product and are often called upon to provide technology solutions in close collaboration with companies and industry consortia throughout the semiconductor industry. In addition, we believe that the “built in” nature of some of our products in our customers’ production tools provides us with a relatively stable stream of revenue because, once implemented with a customer, our technology solutions cannot be easily replaced by the customer without incurring switching costs and potential delays in production. As a result, we believe that our customers are likely to buy from us throughout the life cycle of a specific product to avoid the switching costs, repetition of the development and qualification process and potential production delays that are inherent in such a change.
Experienced Management Team with Previous Integration Expertise
Entegris is led by an experienced management team with deep industry experience. Our management team has successful previous integration experience from the 2005 merger of equals transaction between Entegris and Mykrolis. We believe that the similarity of products, markets and end-customers between Entegris and ATMI further enhances our ability to successfully integrate the two businesses. In addition, we expect that certain members of ATMI’s existing management team will continue to participate in the management of the ATMI business following the Merger.
Our Combined Business Strategy
Our vision is to be the leader in advanced contamination control, process materials, and materials handling for the semiconductor industry and for other very demanding manufacturing environments. Our objective is to grow faster than the rate of the markets we serve and to be among the most profitable companies in our industry. Key elements of our strategy to achieve this objective include:
Increasing Collaboration with Key Customers
We believe that the addition of ATMI’s technology capabilities will allow us to increase our technology alignment with the industry’s technology leaders through greater and earlier involvement of our research and development, or R&D, process implementation and application development teams with our customers. These relationships provide us with opportunities for significant collaboration with our customers at the product design stage, which has facilitated our ability to introduce on a timely basis new products and applications that meet our customers’ needs. For example, we work with our key customers at the pre-design and design stages to identify and respond to their requests for current and future generations of products, which allows us to shorten the deployment of production-ready solutions and, as a result, the duration of the product development period. In an industry where the capital requirements are significant and product life cycles can be short, our ability to assist our
5
customers in bringing their latest technology to market rapidly can make a significant difference in our customers’ success and can make us a supplier of choice for our customers.
Sustaining Critical Investments in Research and Development
We expect that the increased scale of our combined business platform and the expected increased stability provided by the higher proportion of unit-driven sales will enable us to make research and development investments that we believe are critical to our growth. These investments include expanding our access to the most advanced metrology, will allow us to correlate our technology to our customers’ on-wafer performance and will increase our manufacturing process capabilities. In addition, we believe that by making these investments we will be able to attract and retain key engineering talent and create a robust research and development infrastructure that is close to our customers in Asia.
Driving an Aggressive Manufacturing Roadmap
As our customers develop and implement their new manufacturing processes they are raising their expectations for their suppliers in terms of manufacturing reliability, predictability, and sourcing. We believe that our expanded platform will allow us to make more relevant investments in Asia and provide our customers with dual sourcing options for the products that are most critical to them. Our larger platform is also expected to enable us to cost effectively upgrade our manufacturing capabilities, such as adopting Statistical Process Control, which is a method of quality control which uses real-time systems and statistical methods to precisely monitor and control a process.
Creating a Platform to Explore New Opportunities in Adjacent Markets
We will have an expanded platform from which to leverage our technologies to explore new applications both in the semiconductor market and in adjacent markets. We believe that the greater stability that we expect to achieve with our combined platform will enable us to address these opportunities both through internal development and through strategic acquisitions.
Our Corporate Information
We were incorporated in Delaware in March 2005 under the name Eagle DE, Inc. in connection with the merger of equals transaction among Entegris, Inc., a Minnesota corporation (“Entegris Minnesota”), and Mykrolis Corporation, the former microelectronics business unit of Millipore Corporation. Effective August 6, 2005 Entegris Minnesota merged with and into us in a reincorporation merger and, immediately following that merger, Mykrolis Corporation merged with and into us and our name was changed to Entegris, Inc. On August 11, 2008, we acquired Poco Graphite, Inc., a privately-held company based in Decatur, Texas, which augmented our base of business in the semiconductor industry and expanded our materials science capabilities to include graphite and silicon carbide. On April 1, 2013, we acquired the business and assets of Jetalon Solutions, Inc., a privately-held California corporation, to add metrology and refractive index concentration sensing technology to our technology portfolio. Our stock is traded on the NASDAQ Global Select Market under the symbol “ENTG”.
Our principal executive offices are located at 129 Concord Road, Billerica, MA 01821 and our telephone number at that address is (978) 436-6500. Our website iswww.Entegris.com.
6
Our Corporate Structure
Following the consummation of the Merger, our corporate structure will be as follows:
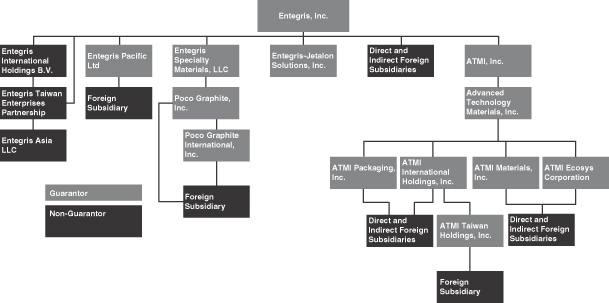
| (1) | On the closing date, every subsidiary of Entegris, Inc. will be a restricted subsidiary. |
| (2) | Every material domestic subsidiary, including ATMI, Inc. following the completion of the merger, will provide a guarantee of the Notes and our Senior Credit Facilities (subject to certain customary exceptions). |
7
SUMMARY HISTORICAL AND UNAUDITED PRO FORMA CONSOLIDATED FINANCIAL AND OTHER DATA
The following table sets forth our summary historical and unaudited pro forma consolidated financial and other data at the dates and for the periods indicated as well as certain ATMI credit statistics. The summary historical consolidated statement of operations and consolidated statement of cash flows data for the fiscal years ended December 31, 2011, 2012 and 2013 and the summary historical consolidated balance sheet data as of December 31, 2012 and 2013 have been derived from our and ATMI’s historical audited consolidated financial statements.
The summary unaudited pro forma consolidated statement of operations data for year ended December 31, 2013 gives effect to the Transactions as if such Transactions had occurred on January 1, 2013. The summary unaudited pro forma consolidated balance sheet data at December 31, 2013 gives effect to the Transactions as if such Transactions had occurred on December 31, 2013. The Merger will be accounted for using the purchase method of accounting. The pro forma information presented is subject to change based upon the final purchase price allocation and other calculations related to the Merger. The pro forma adjustments are based upon available information and certain assumptions that we believe are reasonable, including the ATMI historical audited consolidated financial statements. The actual adjustments will be based on information only available as of the closing date of the Merger when consummated and may differ from those reflected in the summary unaudited pro forma consolidated financial data presented below. Such differences may be material.
The unaudited pro forma consolidated financial information is provided for informational purposes only and does not purport to represent what our results of operations and financial condition would have been had the Transactions actually occurred as of the dates indicated, nor does it project our results of operations for any future period or our financial condition at any future date.
The summary information in the following tables should be read in conjunction with “Use of Proceeds,” “Capitalization,” “Unaudited Pro Forma Condensed Combined Financial Information,” “Selected Historical Consolidated Financial and Other Data,” “Risk Factors,” “Management’s Discussion and Analysis of Financial Condition and Results of Operations” for each of Entegris and ATMI and our and ATMI’s historical consolidated financial statements and related notes.
| | | | | | | | | | | | | | | | |
| | | Fiscal Year Ended | | | Pro Forma
Combined
Year Ended
December 31,
2013 | |
| | | December 31,
2011 | | | December 31,
2012 | | | December 31,
2013 | | |
| | | ($ in thousands) | |
Statement of Operations Data: | | | | | | | | | | | | | | | | |
Net sales | | $ | 749,259 | | | $ | 715,903 | | | $ | 693,459 | | | $ | 1,051,175 | |
Cost of sales | | | 423,329 | | | | 408,520 | | | | 399,245 | | | | 581,015 | |
| | | | | | | | | | | | | | | | |
Gross Profit | | | 325,930 | | | | 307,383 | | | | 294,214 | | | | 470,160 | |
Costs and expenses: | | | | | | | | | | | | | | | | |
Selling, general and administrative expenses | | | 140,847 | | | | 147,405 | | | | 137,123 | | | | 205,205 | |
Engineering, research and development expenses | | | 47,980 | | | | 50,940 | | | | 55,320 | | | | 110,587 | |
Amortization of intangible assets | | | 10,225 | | | | 9,594 | | | | 9,347 | | | | 34,214 | |
Contingent consideration fair value adjustment | | | — | | | | — | | | | (1,813 | ) | | | (1,813 | ) |
| | | | | | | | | | | | | | | | |
Operating income | | | 126,878 | | | | 99,444 | | | | 94,237 | | | | 121,967 | |
Interest expense | | | 886 | | | | 271 | | | | 72 | | | | 44,479 | |
Interest income | | | (227 | ) | | | (281 | ) | | | (236 | ) | | | (1,180 | ) |
Other income, net | | | (1,745 | ) | | | (249 | ) | | | (1,794 | ) | | | (4,410 | ) |
| | | | | | | | | | | | | | | | |
Income (loss) before income taxes | | | 127,964 | | | | 99,703 | | | | 96,195 | | | | 83,078 | |
Income tax expense | | | 4,217 | | | | 30,881 | | | | 21,669 | | | | 11,161 | |
Equity in net income of affiliate | | | (499 | ) | | | (3 | ) | | | — | | | | — | |
| | | | | | | | | | | | | | | | |
Net income | | | 124,246 | | | | 68,825 | | | | 74,526 | | | | 71,918 | |
Less net income attributable to the noncontrolling interest | | | 400 | | | | — | | | | — | | | | — | |
| | | | | | | | | | | | | | | | |
Net income attributable to Entegris, Inc. | | $ | 123,846 | | | $ | 68,825 | | | $ | 74,526 | | | $ | 71,918 | |
| | | | | | | | | | | | | | | | |
8
| | | | | | | | | | | | | | | | |
| | | Fiscal Year Ended | | | Pro Forma
Combined
Year Ended
December 31,
2013 | |
| | | December 31,
2011 | | | December 31,
2012 | | | December 31,
2013 | | |
| | | ($ in thousands) | |
Balance Sheet Data (at period end): | | | | | | | | | | | | | | | | |
Cash and cash equivalents | | $ | 273,593 | | | $ | 330,419 | | | $ | 384,426 | | | $ | 271,580 | |
Total assets | | | 724,663 | | | | 811,544 | | | | 875,294 | | | | 1,784,987 | |
Total debt(1) | | | — | | | | — | | | | — | | | | 815,400 | |
Total equity | | | 608,238 | | | | 694,799 | | | | 756,843 | | | | 716,737 | |
Cash Flows: | | | | | | | | | | | | | | | | |
Net cash provided by operating activities | | $ | 157,286 | | | $ | 115,162 | | | $ | 109,402 | | | | | |
Net cash used in investing activities | | | (28,431 | ) | | | (72,467 | ) | | | (47,029 | ) | | | | |
Net cash provided by (used in) financing activities | | | 10,864 | | | | 10,890 | | | | (3,895 | ) | | | | |
Credit Statistics: | | | | | | | | | | | | | | | | |
Entegris Adjusted EBITDA(2) | | $ | 163,216 | | | $ | 140,979 | | | $ | 132,212 | | | | | |
ATMI Adjusted EBITDA(5) | | | 76,993 | | | | 89,730 | | | | 86,119 | | | | | |
Pro Forma Adjusted EBITDA(2) | | | | | | | | | | | | | | $ | 218,353 | |
Net debt(3) | | | | | | | | | | | | | | | 543,820 | |
Cash interest expense(4) | | | | | | | | | | | | | | | 40,305 | |
Ratio of net debt to Pro Forma Adjusted EBITDA | | | | | | | | | | | | | | | 2.49 | |
Ratio of Pro Forma Adjusted EBITDA to cash interest expense | | | | | | | | | | | | | | | 5.42 | |
| (1) | After giving effect to the Transactions, our pro forma total debt at December 31, 2013 would have been $820.0 million, which consisted of the $460 million term loan and the $360 million of notes. We would have also had $85.0 million of availability under our ABL Facility, which is expected to be undrawn at closing. |
| (2) | Entegris defines Adjusted EBITDA as net income attributable to Entegris, Inc. before (1) net income attributable to noncontrolling interest, (2) equity in net income of affiliates, (3) income tax expense, (4) interest expense, (5) interest income, (6) other expense (income), net, (7) amortization of intangible assets, (8) contingent consideration fair value adjustment, (9) gain associated with pension curtailment, (10) transaction related costs, (11) charge associated with CEO succession and transition plan and (11) depreciation (collectively, “EBITDA Adjustments”), and defines Pro Forma Adjusted EBITDA as Adjusted EBITDA further adjusted to give effect to the Merger and the other items identified as permitted adjustments pursuant to the terms of the notes or the proposed terms of our Senior Credit Facilities. |
| | Management uses Adjusted EBITDA to assist in the evaluation of the performance of its business segments and to make operating decisions. Management believes that these non-GAAP measures help indicate our historical and combined baseline performance before certain gains, losses or other charges that may not be indicative of our business or future outlook and offer a useful view of business performance in that the measures provide a more consistent means of comparing performance. We believe these non-GAAP measures aid investors’ overall understanding of our results by providing a higher degree of transparency for such items and providing a level of disclosure that will help investors understand how management plans, measures and evaluates our business performance. Management believes that the inclusion of these non-GAAP measures provides consistency in its financial reporting among periods and facilitates investors’ understanding of our historical operating trends by providing an additional basis for comparisons to prior periods. |
| | Management uses Adjusted EBITDA to assist it in evaluations of our operating performance by excluding items that management does not consider as relevant in the results of its ongoing operations. Internally, these non-GAAP measures are used by management for planning and forecasting purposes, including the preparation of internal budgets; for allocating resources to enhance financial performance; for evaluating the effectiveness of operational strategies; and for evaluating our capacity to fund capital expenditures, secure financing and expand our business. |
In addition, and as a consequence of the importance of these non-GAAP financial measures in managing our business, our Board of Directors uses these non-GAAP financial measures in the evaluation process to determine management compensation.
Despite the importance of these measures in analyzing our business, measuring and determining incentive compensation and evaluating our operating performance, as well as the use of adjusted EBITDA measures by securities analysts, lenders and others in their evaluation of companies, Adjusted EBITDA and Pro Forma Adjusted EBITDA have limitations as analytical tools, and you should not consider them in isolation, or as a substitute for analysis of our or ATMI’s results as reported under GAAP; nor is Adjusted EBITDA or Pro Forma Adjusted EBITDA intended to be a measure of liquidity or free cash flow for our discretionary use. Some of the limitations of Adjusted EBITDA and Pro Forma Adjusted EBITDA are:
| | • | | They do not reflect our cash expenditures or future requirements for capital expenditures or contractual commitments; |
| | • | | They do not reflect changes in, or cash requirements for, our working capital needs; |
| | • | | They do not reflect the interest expense, or the cash requirements to service interest or principal payments on our debt; |
9
| | • | | They do not reflect income tax payments we are required to make; and |
| | • | | Although depreciation and amortization are non-cash charges, the assets being depreciated and amortized often will have to be replaced in the future, and neither Adjusted EBITDA nor Pro Forma Adjusted EBITDA reflect any cash requirements for such replacements. |
To properly and prudently evaluate our business, we encourage you to review the Company’s financial statements, and not rely on any single financial measure to evaluate our business. We also strongly urge you to review the reconciliation of net income attributable to Entegris, Inc. and the pro forma combined net income attributable to Entegris, Inc. to Adjusted EBITDA and Pro Forma Adjusted EBITDA set forth below. The Adjusted EBITDA and Pro Forma Adjusted EBITDA, as presented herein, may differ from and may not be comparable to similarly titled measures used by other companies, because Adjusted EBITDA and Pro Forma Adjusted EBITDA are not measures of financial performance under GAAP and are susceptible to varying calculations.
The following tables set forth a reconciliation of net income attributable to Entegris, Inc. to Adjusted EBITDA and Pro Forma Adjusted EBITDA. All of the items included in the reconciliation from net income attributable to Entegris, Inc. to Adjusted EBITDA and Pro Forma Adjusted EBITDA are either (i) non-cash items (such as depreciation and amortization) or (ii) items that management does not consider in assessing our on-going operating performance (such as income taxes, acquisition costs and interest expense). In the case of the non-cash items, management believes that investors can better assess our comparative operating performance because the measures without such items are less susceptible to variances in actual performance resulting from depreciation, amortization and other non-cash charges and more reflective of other factors that affect operating performance. In the case of the other items, management believes that investors can better assess our operating performance if the measures are presented without these items because their financial impact does not reflect ongoing operating performance.
Reconciliation of Net income attributable to Entegris, Inc. to Adjusted EBITDA and Pro Forma Adjusted EBITDA:
| | | | | | | | | | | | | | | | |
| | | Fiscal Year Ended | | | | |
| | | December 31,
2011 | | | December 31,
2012 | | | December 31,
2013 | | | Pro Forma
Fiscal Year Ended
December 31,
2013 | |
| | | ($ in thousands) | | | | |
Net income attributable to Entegris, Inc. | | $ | 123,846 | | | $ | 68,825 | | | $ | 74,526 | | | $ | 71,918 | |
Adjustments to net income attributable to Entegris, Inc.: | | | | | | | | |
Net income attributable to noncontrolling interest | | | 400 | | | | — | | | | — | | | | — | |
Equity in net income of affiliates | | | (499 | ) | | | (3 | ) | | | — | | | | — | |
Income tax expense(a) | | | 4,217 | | | | 30,881 | | | | 21,669 | | | | 11,161 | |
Interest expense(b) | | | 886 | | | | 271 | | | | 72 | | | | 44,479 | |
Interest income | | | (227 | ) | | | (281 | ) | | | (236 | ) | | | (1,180 | ) |
Other income, net | | | (1,745 | ) | | | (249 | ) | | | (1,794 | ) | | | (4,410 | ) |
| | | | | | | | | | | | | | | | |
GAAP-Operating income | | | 126,878 | | | | 99,444 | | | | 94,237 | | | | 121,967 | |
Amortization of intangible assets(c) | | | 10,225 | | | | 9,594 | | | | 9,347 | | | | 34,214 | |
ATMI EBITDA Adjustments(d) | | | — | | | | — | | | | — | | | | 14,081 | |
Contingent consideration fair value adjustment | | | — | | | | — | | | | (1,813 | ) | | | (1,813 | ) |
Gain associated with pension curtailment | | | (726 | ) | | | — | | | | — | | | | — | |
Transaction related costs | | | | | | | | | | | 973 | | | | | |
Charge associated with CEO succession and transition plan | | | — | | | | 3,928 | | | | — | | | | — | |
| | | | | | | | | | | | | | | | |
Adjusted operating income | | | 136,377 | | | | 112,966 | | | | 102,744 | | | | 168,449 | |
Depreciation | | | 26,839 | | | | 28,013 | | | | 29,468 | | | | 49,904 | |
| | | | | | | | | | | | | | | | |
Entegris Adjusted EBITDA(e) | | $ | 163,216 | | | $ | 140,979 | | | $ | 132,212 | | | $ | 218,353 | |
| | | | | | | | | | | | | | | | |
| | (a) | The pro forma adjustment represents the tax expense we would have incurred had the Transactions occurred on January 1, 2013. |
| | (b) | The pro forma adjustment represents the interest expense that would have been paid had the Transactions occurred on January 1, 2013 |
| | (c) | The pro forma adjustment represents the amount of amortization we would have recorded if the Transactions had occurred on January 1, 2013. |
10
UNAUDITED PRO FORMA CONDENSED COMBINED FINANCIAL INFORMATION
The following unaudited pro forma condensed combined financial information is based on and derived from the separate historical financial statements of Entegris and ATMI, after giving effect to the LS Sale, the Merger and related financing transactions (collectively, the “Transactions”) and gives effect to the assumptions and preliminary pro forma adjustments described in the accompanying notes to the unaudited pro forma condensed combined financial statements. The unaudited pro forma condensed combined balance sheet gives effect to the Transactions as if they had occurred on December 31, 2013. The unaudited pro forma condensed combined statement of operations gives effect to the Transactions as if they had occurred on January 1, 2013. The historical consolidated financial information has been adjusted to give pro forma effect to events that are directly attributable to the Merger, and factually supportable. The unaudited pro forma condensed combined statement of operations has also been adjusted to give pro forma effect to events that are expected to have a continuing impact on our combined results.
The unaudited pro forma condensed combined financial information was prepared using the acquisition method of accounting with Entegris as the acquirer of ATMI. Accordingly, consideration given by Entegris to complete the merger with ATMI will be allocated to the assets and liabilities of ATMI based upon their estimated fair values as of the date of completion of the Merger. Any excess of the consideration over the fair value of assets acquired and liabilities assumed is allocated to goodwill. As of the date hereof, Entegris has not completed the detailed valuation studies necessary to arrive at the required estimates of the fair value of the ATMI assets to be acquired and the liabilities to be assumed and the related allocations of purchase price, nor has it identified all adjustments necessary to conform ATMI’s accounting policies to Entegris’ accounting policies. A final determination of the fair value of ATMI’s assets and liabilities will be based on the actual net tangible and intangible assets and liabilities of ATMI that exist as of the date of completion of the merger and, therefore, cannot be made prior to the completion of the transaction. Accordingly, the unaudited pro forma purchase price adjustments are preliminary and are subject to further adjustments as additional information becomes available and as additional analyses are performed, and such further adjustments from purchase price or conforming accounting adjustments may be material. The preliminary unaudited pro forma purchase price adjustments have been made solely for the purpose of providing the unaudited pro forma condensed combined financial information presented below. Entegris estimated the fair value of ATMI’s assets and liabilities based on discussions with ATMI’s management, preliminary valuation studies, due diligence and information presented in public filings.
The unaudited pro forma condensed combined financial information is provided for informational purposes only. The unaudited pro forma condensed combined financial information is not necessarily, and should not be assumed to be, an indication of the results that would have been achieved had the Transactions been completed as of the dates indicated or that may be achieved in the future and should not be taken as representative of future consolidated results of operations or financial condition of Entegris. Furthermore, no effect has been given in the unaudited pro forma condensed combined statement of operations to synergies and potential cost savings, if any, that may be realized through the combination of the two companies or the costs that may be incurred in integrating their operations.
The unaudited pro forma condensed combined financial information should be read in conjunction with “Risk Factors,” “Selected Historical Consolidated Financial and Other Data,” “Management’s Discussion and Analysis of Financial Condition and Results of Operations” of Entegris and ATMI and our and ATMI’s historical consolidated financial statements and related notes.
11
UNAUDITED PRO FORMA CONDENSED COMBINED BALANCE SHEET
AS OF DECEMBER 31, 2013
| | | | | | | | | | | | | | | | |
| | | Historical
Entegris | | | Historical ATMI | | | Pro Forma
Adjustments | | | Pro Forma
Combined | |
| | | (in thousands) | |
ASSETS | | | | | | | | | | | | | | | | |
Current assets: | | | | | | | | | | | | | | | | |
Cash and cash equivalents | | $ | 384,426 | | | $ | 82,646 | | | $ | 183,632 | (a) | | $ | 271,580 | |
| | | | | | | | | | | (379,124 | )(b) | | | | |
Short-term investments | | | — | | | | 46,201 | | | | — | | | | 46,201 | |
Trade accounts and notes receivable, net | | | 101,873 | | | | 58,009 | | | | — | | | | 159,882 | |
Inventories, net | | | 94,074 | | | | 76,485 | | | | 42,000 | (c) | | | 212,559 | |
Deferred tax assets, deferred tax charges and refundable income taxes | | | 20,844 | | | | 17,592 | | | | (8,453 | )(d) | | | 29,983 | |
Assets held for sale | | | — | | | | 120,618 | | | | (120,618 | )(e) | | | — | |
Other current assets | | | 11,088 | | | | 21,786 | | | | 2,922 | (f) | | | 35,796 | |
| | | | | | | | | | | | | | | | |
Total current assets | | | 612,305 | | | | 423,337 | | | | (279,642 | ) | | | 756,000 | |
Property, plant, and equipment | | | 186,440 | | | | 120,462 | | | | — | | | | 306,902 | |
Other assets: | | | | | | | | | | | | | | | | |
Goodwill | | | 12,274 | | | | 13,657 | | | | 347,459 | (g) | | | 373,390 | |
Intangible assets, net | | | 43,509 | | | | 18,386 | | | | 248,614 | (g) | | | 310,509 | |
Deferred tax assets and other noncurrent tax assets | | | 12,039 | | | | 1,433 | | | | (14,217 | )(d) | | | (745 | ) |
Other | | | 8,727 | | | | 18,945 | | | | 11,259 | (f) | | | 38,931 | |
| | | | | | | | | | | | | | | | |
Total assets | | $ | 875,294 | | | $ | 596,220 | | | $ | 313,473 | | | $ | 1,784,987 | |
| | | | | | | | | | | | | | | | |
LIABILITIES AND EQUITY | | | | | | | | | | | | | | | | |
Current liabilities: | | | | | | | | | | | | | | | | |
Current portion of long-term debt | | $ | — | | | $ | — | | | $ | 4,600 | (h) | | $ | 4,600 | |
Accounts payable | | | 38,396 | | | | 27,087 | | | | — | | | | 65,483 | |
Accrued payroll and related benefits | | | 30,116 | | | | 3,793 | | | | — | | | | 33,909 | |
Other accrued liabilities | | | 18,700 | | | | 10,050 | | | | — | | | | 28,750 | |
Deferred tax liabilities and income taxes payable | | | 10,373 | | | | 1,668 | | | | (6,707 | )(i) | | | 5,334 | |
Liabilities held for sale | | | — | | | | 13,108 | | | | (13,108 | )(e) | | | — | |
| | | | | | | | | | | | | | | | |
Total current liabilities | | | 97,585 | | | | 55,706 | | | | (15,215 | ) | | | 138,076 | |
Long-term debt | | | — | | | | — | | | | 810,800 | (h) | | | 810,800 | |
Pension benefit obligations and other liabilities | | | 15,411 | | | | 9,107 | | | | — | | | | 24,518 | |
Deferred tax liabilities and other noncurrent tax liabilities | | | 5,455 | | | | 2,247 | | | | 87,154 | (j) | | | 94,856 | |
Equity: | | | | | | | — | | | | | | | | | |
Preferred stock | | | — | | | | — | | | | — | | | | — | |
Common stock | | | 1,387 | | | | 411 | | | | (411 | )(k) | | | 1,387 | |
Additional paid-in capital | | | 819,632 | | | | 470,886 | | | | (470,886 | )(k) | | | 819,632 | |
Treasury stock (at cost) | | | — | | | | (251,577 | ) | | | 251,577 | (k) | | | — | |
Retained earnings (deficit) | | | (88,599 | ) | | | 300,909 | | | | 69,399 | (l) | | | (128,705 | ) |
| | | | | | | | | | | (40,106 | )(m) | | | | |
| | | | | | | | | | | (370,308 | )(k),(l) | | | | |
Accumulated other comprehensive income | | | 24,423 | | | | 8,531 | | | | (8,531 | )(k) | | | 24,423 | |
| | | | | | | | | | | | | | | | |
Total equity | | | 756,843 | | | | 529,160 | | | | (569,266 | ) | | | 716,737 | |
| | | | | | | | | | | | | | | | |
Total liabilities and equity | | $ | 875,294 | | | $ | 596,220 | | | $ | 313,473 | | | $ | 1,784,987 | |
| | | | | | | | | | | | | | | | |
See accompanying notes to unaudited pro forma condensed combined financial information.
12
UNAUDITED PRO FORMA CONDENSED COMBINED STATEMENT OF OPERATIONS
FOR THE YEAR ENDED DECEMBER 31, 2013
| | | | | | | | | | | | | | | | |
| | | Historical
Entegris | | | Historical
ATMI | | | Pro Forma
Adjustments | | | Pro Forma
Combined | |
| | | (in thousands, except per share data) | |
Net sales | | $ | 693,459 | | | $ | 360,959 | | | $ | (3,243 | )(n) | | $ | 1,051,175 | |
Cost of sales | | | 399,245 | | | | 185,013 | | | | (3,243 | )(n) | | | 581,015 | |
| | | | | | | | | | | | | | | | |
Gross profit | | | 294,214 | | | | 175,946 | | | | — | | | | 470,160 | |
Selling, general, and administrative | | | 137,123 | | | | 70,455 | | | | (2,373 | )(o) | | | 205,205 | |
Engineering, research and development expenses | | | 55,320 | | | | 55,267 | | | | — | | | | 110,587 | |
Amortization of intangible assets | | | 9,347 | | | | 2,828 | | | | 22,039 | (p) | | | 34,214 | |
Contingent consideration fair value adjustment | | | (1,813 | ) | | | — | | | | — | | | | (1,813 | ) |
| | | | | | | | | | | | | | | | |
Operating income | | | 94,237 | | | | 47,396 | | | | (19,666 | ) | | | 121,967 | |
Interest expense | | | 72 | | | | — | | | | 44,407 | (q) | | | 44,479 | |
Interest income | | | (236 | ) | | | (944 | ) | | | — | | | | (1,180 | ) |
Other income, net | | | (1,794 | ) | | | (2,616 | ) | | | — | | | | (4,410 | ) |
| | | | | | | | | | | | | | | | |
Income before income taxes | | | 96,195 | | | | 50,956 | | | | (64,073 | ) | | | 83,078 | |
Income tax expense | | | 21,669 | | | | 12,197 | | | | (22,705 | )(r) | | | 11,161 | |
| | | | | | | | | | | | | | | | |
Income from continuing operations | | $ | 74,526 | | | $ | 38,759 | | | $ | (41,367 | ) | | $ | 71,918 | |
| | | | | | | | | | | | | | | | |
Earnings per share | | | | | | | | | | | | | | | | |
Basic net income per common share | | $ | 0.54 | | | | | | | | | | | $ | 0.52 | |
Diluted net income per common share | | $ | 0.53 | | | | | | | | | | | $ | 0.52 | |
See accompanying notes to unaudited pro forma condensed combined financial information.
13
NOTES TO UNAUDITED PRO FORMA CONDENSED COMBINED
FINANCIAL STATEMENTS
Basis of Pro Forma Presentation
Pursuant to the Merger Agreement, upon consummation of the Merger, ATMI’s stock option awards, restricted stock, and total shareholder return performance restricted stock units (“TSR PRSUs”) will fully vest. Entegris will acquire 100% of the outstanding shares, stock options, restricted stock, TSR PRSUs, and director deferred units of ATMI for total cash consideration of $1.1 billion. Additionally, certain ATMI employees are entitled to payments upon a change in control and their subsequent termination. These payments are expected to consist of $15.0 million plus a gross-up for payroll taxes of $2.0 million. Of the total cash consideration expected to be paid, $1.1 billion will be considered purchase price and $37.7 million associated with the acceleration of vesting and change in control payments will be recorded by the combined company as post-acquisition compensation expense. Merger-related transaction costs are not included as a component of consideration transferred, but are accounted for as an expense in the period in which the costs are incurred.
The Merger is reflected in the unaudited pro forma condensed combined financial information as an acquisition of ATMI by Entegris in accordance with Accounting Standards Codification Topic 805, “Business Combinations,” using the acquisition method of accounting. Under these accounting standards, the total estimated purchase price is calculated as described below, and the assets acquired and the liabilities assumed have been measured at their estimated fair values. The fair value measurements utilize estimates based on key assumptions of the Merger, including historical and current market data. The unaudited pro forma adjustments included herein are preliminary and will be revised at the time of the Merger as additional information becomes available and as additional analyses are performed. The final purchase price allocation will be determined at the time that the Merger is completed, and the final amounts recorded for the Merger may differ materially from the information presented herein.
Under the acquisition method of accounting, the total estimated acquisition consideration is allocated to the acquired tangible and intangible assets and assumed liabilities of ATMI based on their estimated fair values as of the acquisition date. Any excess of the acquisition consideration over the fair value of assets acquired and liabilities assumed is allocated to goodwill. The Company expects that all such goodwill will not be deductible for tax purposes. For the purposes of the unaudited pro forma condensed combined financial statements, Entegris has made a preliminary allocation of the acquisition consideration as follows (in thousands):
| | | | |
Cash and current portion of marketable securities | | $ | 312,479 | |
Inventories | | | 118,485 | |
Other current assets | | | 88,934 | |
Property, plant and equipment | | | 120,462 | |
Amortizable intangible assets: | | | | |
Trade name and technology | | | 136,000 | |
ATMI corporate trade name | | | 5,000 | |
Customer relationships | | | 126,000 | |
Other noncurrent assets | | | 6,161 | |
Deferred tax liabilities and income taxes payable | | | (102,662 | ) |
Other current and noncurrent liabilities | | | (50,037 | ) |
| | | | |
Fair value of assets acquired and liabilities assumed | | | 760,822 | |
Goodwill | | | 361,116 | |
| | | | |
Total preliminary Merger consideration | | $ | 1,121,938 | |
| | | | |
14
Entegris expects to finance the Merger and pay related fees and expenses with a senior secured term loan facility of $460.0 million, a senior secured asset-backed revolving credit facility of $85.0 million, and this offering of $360.0 million of senior unsecured notes, together with cash on hand. If the timing or amount of this offering differs from our expectations, Entegris has obtained a commitment for a $360.0 million bridge loan facility.
The senior secured term loan facility has a term of 7 years. The Company is required to pay 1.00% of the initial principal balance annually, which will be paid, together with interest, on a quarterly basis, with the balance due at maturity. A 0.125% increase in the assumed blended interest rate on the Senior Credit Facilities and Notes would increase our assumed annual interest expense by approximately $1.1 million for the fiscal year ended December 31, 2013.
The senior secured asset-backed revolving credit facility has a term of 5 years. An administrative fee of $0.1 million is payable annually and a commitment fee ranging from 0.25% to 0.33% is payable on the unused portion.
The senior unsecured notes have a term of 8 years, and interest is payable on a semi-annual basis.
For a more complete description of the credit facilities and notes, see “Description of Other Indebtedness” and “Description of Notes.”
ATMI’s LifeSciences business (“LS”) is classified as assets and liabilities held for sale in the “Historical ATMI” column in the unaudited pro forma condensed combined balance sheet and reported as a discontinued operation in the “Historical ATMI” column in the unaudited pro forma condensed combined statement of operations. Additionally, financial information presented in the “Historical ATMI” column in the unaudited pro forma condensed combined balance sheet and statement of operations has been reclassified to conform to the historical presentation in Entegris’ consolidated financial statements.
Pro Forma Adjustments
Unaudited Pro Forma Condensed Combined Balance Sheet
| | (a) | Reflects the gross cash proceeds of $190.8 million, including a post-close working capital adjustment, from the LS Sale, less $7.2 million of transaction costs related to the disposition. |
| | (b) | The following table summarizes the estimated sources and uses of proceeds in connection with the Merger. The amounts set forth in the table and in the accompanying footnotes are subject to adjustment and may differ at the time of the consummation of the Merger depending on several factors, including differences from our estimation of fees and expenses. |
| | | | |
| | | (in thousands) | |
Sources: | | | | |
Cash on hand | | $ | 379,124 | |
Senior secured term loan facility | | | 460,000 | |
Notes | | | 360,000 | |
| | | | |
| | $ | 1,199,124 | |
| | | | |
15
| | | | |
| | | (in thousands) | |
Uses: | | | | |
Aggregate consideration for ATMI shares | | $ | 1,091,860 | |
Aggregate consideration for stock options | | | 13,315 | |
Aggregate consideration for restricted shares | | | 29,419 | |
Aggregate consideration for TSR PRSUs | | | 5,450 | |
Aggregate consideration for director deferred units | | | 2,574 | |
Estimated financing fees (i) | | | 22,481 | |
Estimated Merger costs (ii) | | | 34,025 | |
| | | | |
| | $ | 1,199,124 | |
| | | | |
| | (i) | Includes $5.7 million of issuance costs and $4.6 million of original issue discount related to the senior secured term loan facility and $7.6 million of issuance costs related to the notes. Also reflects the payment of debt issuance costs of $0.8 million for the asset-backed revolving credit facility and the commitment fee for the bridge financing of $3.7 million. |
| | (ii) | Includes Merger-related costs of $17.0 million as well as payments expected to be made to certain ATMI employees upon a change in control and their subsequent termination. These payments are expected to consist of $15.0 million plus a gross-up for payroll taxes of $2.0 million. |
| | (c) | Reflects an adjustment of the historical ATMI inventories to estimated fair value. This inventory adjustment will be fully recognized in cost of sales in the first two quarters following consummation of the Merger. We expect this step up in basis and amortization of this amount to have a negative effect on margins. |
| | (d) | Includes $0.5 million of current deferred tax assets reclassified to current income tax payable as part of the LS Sale, $7.9 million of current deferred tax assets reclassified to current income tax payable related to share-based payments that will be settled at the Merger date, and the elimination of $14.2 million of non-current deferred tax assets related to existing intangible assets. |
| | (e) | Reflects the elimination of assets and liabilities held for sale as a result of the LS Sale, which closed on February 20, 2014. |
| | (f) | Reflects the capitalization of debt issuance costs of $5.7 million related to the senior secured term loan, $0.8 million related to the asset-backed revolving credit facility and $7.6 million related to the notes. |
| | (g) | Reflects the preliminary estimated identifiable intangible assets and goodwill as described in “—Basis of Pro Forma Presentation”. |
| | (h) | Reflects the borrowing of $460.0 million under the senior secured term loan, net of an original issue discount of 1.00%, and the issuance of $360.0 million of notes. |
| | (i) | Includes $7.8 million of income taxes payable resulting from the LS Sale, assuming a tax rate of 9.1%. Also includes a reduction of income taxes payable of $19.6 million related toshare-based payments that will be settled at the Merger date and $7.5 million related toMerger-related costs and bridge loan fees, based on a combined federal and state statutory rate of 36.125% and a deferred tax liability of $12.6 million resulting from the fair value adjustment to inventory acquired, based on a combined federal, state and foreign statutory rate of 30.0%. |
| | (j) | Reflects the reclassification of $1.6 million of non-current deferred tax liabilities to current income taxes payable as a result of the LS Sale and $88.7 million of deferred tax liabilities resulting from fair value adjustments to identifiable intangible assets acquired based primarily on a combined federal and state statutory rate of 36.125%. |
| | (k) | Reflects the elimination of ATMI’s historical stockholders’ equity. |
| | (l) | Reflects the estimated gain on the disposition of LS, net of estimated transaction costs and income taxes. |
16
| | (m) | Reflects the recognition of Merger-related costs of $17.0 million, $3.7 million of commitment fees related to bridge financing, $20.7 million related to acceleration of vesting of stock options and restricted stock and $17.0 million of change in control payments, net of related tax effects of $18.3 million. |
Unaudited Pro Forma Condensed Combined Statement of Operations
| | (n) | To eliminate net sales and cost of sales attributable to sales from Entegris to ATMI of $3.2 million. |
| | (o) | Reflects the elimination of non-recurring Merger-related costs that have been recorded in Entegris’ and ATMI’s historical results. |
| | (p) | Reflects the incremental amortization based on the preliminary fair values of the intangible assets acquired as follows (in thousands): |
| | | | | | | | | | | | |
| | | Intangible
Assets | | | Estimated
Useful Lives
(yrs) | | | Pro Forma
Amortization | |
Trade name and technology | | $ | 136,000 | | | | 8.5 | | | $ | 16,000 | |
Customer relationships | | | 126,000 | | | | 17.5 | | | | 7,200 | |
ATMI corporate trade name | | | 5,000 | | | | 3.0 | | | | 1,667 | |
| | | | | | | | | | | | |
| | $ | 267,000 | | | | | | | | 24,867 | |
| | | | | | | | | | | | |
Less: historical amortization | | | | | | | | | | | 2,828 | |
| | | | | | | | | | | | |
Pro forma incremental amortization | | | | | | | | | | $ | 22,039 | |
| | | | | | | | | | | | |
| | (q) | Reflects the incremental interest expense related to the Company’s debt structure after the Merger, comprised of the notes and borrowings under the senior secured term loan facility (and assumes no borrowings under the ABL facility or the bridge loan facility on the closing date of the Merger), as follows: |
| | | | |
Interest expense on senior secured term loan facility | | $ | 17,185 | |
Interest expense on senior unsecured notes | | | 24,300 | |
Amortization of debt issue costs and original issue discount | | | 2,922 | |
| | | | |
Total adjustment | | $ | 44,407 | |
| | | | |
If the interest rate on Entegris’ senior secured term loan facility were to change by 0.125%, Entegris’ pro forma cash interest expense would change by $0.6 million. If the interest rate on Entegris’ senior unsecured notes were to change by 0.125%, Entegris’ pro forma cash interest expense would change by $0.5 million.
| | (r) | Reflects the tax effects of the adjustments described in notes (o) and (p) at a combined federal, state and foreign statutory rate of 30.0% and (q) at a combined federal and state statutory rate of 36.125%. |
17