Exhibit 99.1
| Enabling the Hyper-Connected World
|


Q4 2020 & Full Year 2020
Stockholder Report
Q4 2020 & Full Year 2020 Stockholder Report
|
|
|
|
|
|
|
|
|
|
|
|
03 |
| |
|
|
|
03 |
| |
|
|
|
05 |
| |
|
|
|
07 |
| |
|
|
|
08 |
| |
|
|
|
09 |
| |
|
|
|
10 |
| |
|
|
|
13 |
| |
|
|
|
16 |
| |
|
|
|
17 |
| |
|
|
|
18 |
| |
|
|
|
18 |
| |
|
|
|
18 |
| |
|
|
|
19 |
| |
|
|
|
19 |
| |
|
|
|
19 |
| |
|
|
|
21 |
| Unaudited Condensed Consolidated Statements of Comprehensive Income (Loss) |
|
|
|
22 |
| |
|
|
|
23 |
| |
|
|
|
25 |
| |


 | 2
| 2
Q4 2020 & Full Year 2020 Stockholder Report
| 3
Q4 2020 & Full Year 2020 Stockholder Report
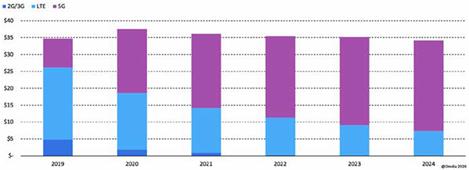
During this time of transition, we have continued to execute as well as foster the growth of a rapidly emerging area of business—mobile transport. Our record revenues in the second half of 2020 were appreciably influenced by the growth of our mobile edge access transport business. Two of our largest customers during this period were primarily consuming our leading mobile transport products. An additional proof point of our accelerated traction in this market segment was announced on Feb. 2, 2021, when DZS eclipsed 1.5 million mobile access ports shipped globally. With six of the world’s top 20 mobile service providers deploying our xHaul solutions, and DZS fronthaul and backhaul technology at the heart of the industry’s first commercial Open Radio Access Network (O-RAN) deployment at Rakuten that has already scaled to over 2 million subscribers, our mobile transport portfolio is continuing to gain traction and points to a promising new growth vector for the company.
Open vRAN Market Grows Rapidly Through 2024: Omdia Mobile Infrastructure 3Q20
|
|
| DZS eclipsed 1.5 million mobile access ports shipped globally. |
|
|
|
...mobile revenue grew approximately 150% year- over-year... |
|
|
| |
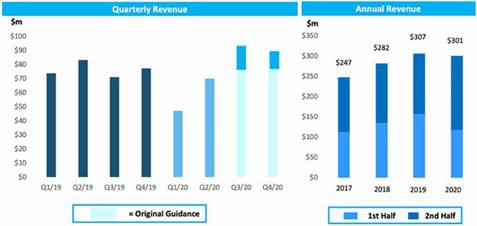
DZS revenue for full year 2020 of $300.6 million was relatively flat compared with 2019, although our mobile revenue grew approximately 150% year-over-year, delivering $78 million, or 26%, of full year 2020 revenue. Total revenue in the second half of 2020 increased 22% over the same period in 2019.
For DZS, 2H20 Was Disproportionately Strong Relative to Historical Comparisons
|
|
| |
|
|
|

| 4
Q4 2020 & Full Year 2020 Stockholder Report

| 5
Q4 2020 & Full Year 2020 Stockholder Report
| 6
Q4 2020 & Full Year 2020 Stockholder Report
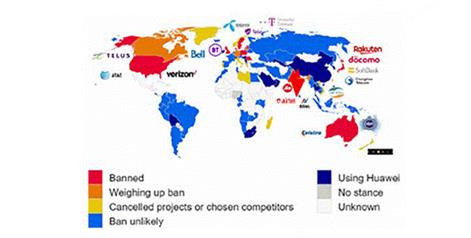
| The United States, countries within Western Europe, Japan, India, and Australia lead a growing list of countries that have instituted China OEM supplier bans, representing a significant portion of the world’s mobile and fixed broadband access equipment capital spend. The Chinese bans and deemphasis have become a catalyst for DZS to coexist, cap & grow, and/or replace Chinese OEM equipment. | |||
|
|
|
Bill Ko: Executive Vice President Sales—Asia
Jay Hilbert: Executive Vice President Sales—AEMEA | |
| Sales Leadership Appointments To maximize our total sales potential across Asia, DZS recently appointed Bill Ko to lead Asia sales. Prior to joining DZS, Bill led Asia sales for Arris Group and ADC Telecommunications. DZS added seven new customers during the fourth quarter, bringing the total number of new customers to 35 for the full year 2020. With more than 20 million products in service and with customers spanning more than 100 countries, DZS is a trusted supplier recognized for its market-leading innovation across a wide global footprint with areas of deep market penetration. In North America, DZS is leveraging a newly enhanced sales force to actively engage with mobile and fixed broadband service providers, utility providers, fiber overbuilders, and a diverse range of enterprises. Among the opportunities we see in the United States, RDOF is offering a particularly promising opportunity, with over $20 billion being allocated via reverse auction over the next 10 years. During Q4 2020, RDOF phase one reverse auction was executed, resulting in the allocation of $9.2 billion to ~180 service provider recipients supporting rural regions. We estimate approximately 15-20% of these funds to be invested in mobile and fixed broadband access equipment and aligned with the DZS market-leading broadband access portfolio. A number of existing DZS customers were award winners of RDOF. To lead our market expansion initiatives inclusive of the Americas (North America and Latin America) and EMEA (Europe, Middle East, and Africa), we promoted previous Americas region sales leader Jay Hilbert to lead AEMEA (Americas and EMEA). Prior to joining DZS in August of 2020, Jay led global sales at Airvana, which was acquired by CommScope, global sales with Cambium Networks, and Alcatel (acquired by Nokia).
| |||
| ||||
| ||||
| ||||


| 7
Q4 2020 & Full Year 2020 Stockholder Report


| 8
Q4 2020 & Full Year 2020 Stockholder Report


| 9
Q4 2020 & Full Year 2020 Stockholder Report


| 10
Q4 2020 & Full Year 2020 Stockholder Report
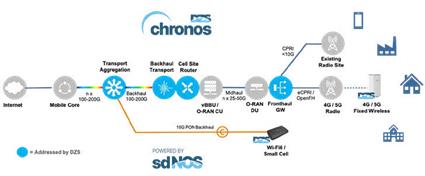
On Feb. 22, DZS announced the DZS Chronos mobile transport solutions portfolio. Open, software defined, and proven, our Fronthaul, Midhaul, and Backhaul solutions feature flexible topologies and architectures, including O-RAN, across packet and optical transport technologies.
This portfolio was recently enhanced by the addition of the O-series coherent optics products for high capacity backhaul transport. With the rise of 5G-based networks, success depends on meeting new demands for extreme low latency and high performance synchronization; DZS meets these requirements with specialized mobile-oriented capabilities including Time Sensitive Networking (TSN), preemption, Grand Master and GPS / GNSS receiver functions. The DZS Chronos portfolio draws from a wide array of fiber-enabled systems and is powered by the fully SDN-enabled sdNOS (Network Operating System).
The DZS Chronos Intelligent Converged Edge Mobile Transport Portfolio Provides a Comprehensive Range of Fronthaul/Midhaul/Backhaul Solutions
On Feb. 22, DZS also announced the DZS Velocity Broadband Access solutions portfolio, providing carriers with extraordinary flexibility through the latest fiber access technologies and SDN-enabled operational models. In today’s hyper-connected world where the volume of connected devices is exploding, applications demand more bandwidth, and connectivity is increasingly judged by an always-on standard measured in gigabits per second, the DZS Velocity broadband access portfolio will address these challenges head-on with software-enabled agility, high performance, and deployment flexibility to enable carrier network transformation and success.
With a broad array of products powered by sdNOS – a modern SDN-enabled Network Operating System that will support a wide range of DZS fiber-based broadband access systems, switches and routers – service providers can leverage the DZS Velocity broadband access portfolio to find the right fit for their network requirements from the regional datacenter to head end, central office or edge cloud sites to the far edge of the network.
In a dynamic and everchanging consumer and enterprise world, we believe success will be achieved by enabling network agility, flexibility, interoperability, and open standards to ensure that our customers are able to deliver cost effective new services, on-time and with flawless performance.
|
|
|
On Feb. 22, DZS announced the DZS Chronos Intelligent Converged Edge Mobile Transport portfolio…
…and the DZS Velocity Broadband Access portfolio.
|
|
| ||
|
|
|
|


| 11
Q4 2020 & Full Year 2020 Stockholder Report
Both DZS Chronos and DZS Velocity portfolios are integrated with and complemented by a wide array of customer premises equipment products. These offerings range from optimized network interface devices to high-end home gateways supporting features such as Easy-Mesh Wi-Fi. Already representing millions of unit shipments for DZS each year, our customer premises portfolio will continue to expand, extending our value into intelligent and smart homes, cities, and enterprises, with Wi-Fi 6 and Fixed Wireless Access technologies.
DZS Chronos & Velocity Portfolios, Complemented by an Array of Customer Premises Solutions, Provide a Powerful Intelligent Converged Edge
|
|
|
Already representing millions of unit shipments for DZS each year, our customer premises portfolio will continue to expand. |
|
| ||
|
|
|
|

| 12
Q4 2020 & Full Year 2020 Stockholder Report
Fourth Quarter and Full-Year Financial Results
|
| Three Months Ended |
|
| Twelve Months Ended |
| ||||||||||||||
|
| December 31, |
|
| September 30, |
|
| December 31, |
|
| December 31, |
|
| December 31, |
| |||||
Key Financial Results |
| 2020 |
|
| 2020 |
|
| 2019 |
|
| 2020 |
|
| 2019 |
| |||||
|
| ($ in millions, except per share amounts) |
| |||||||||||||||||
Net revenue |
| $ | 88.7 |
|
| $ | 93.9 |
|
| $ | 77.6 |
|
| $ | 300.6 |
|
| $ | 306.9 |
|
GAAP Net income (loss) attributable to DZS |
|
| (14.0 | ) |
|
| (0.1 | ) |
| (10.2) |
|
|
| (23.1 | ) |
|
| (13.5 | ) | |
Non-GAAP Net income (loss) attributable to DZS(1) |
|
| (1.2 | ) |
|
| 4.3 |
|
| (2.3) |
|
| (0.3) |
|
|
| 2.0 |
| ||
GAAP Net income (loss) per share |
|
| (0.65 | ) |
|
| (0.01 | ) |
|
| (0.48 | ) |
|
| (1.07 | ) |
|
| (0.69 | ) |
Adjusted Net income (loss) per share(1) |
|
| (0.06 | ) |
|
| 0.20 |
|
|
| (0.11 | ) |
|
| (0.01 | ) |
|
| 0.10 |
|
Adjusted EBITDA(1) |
|
| 0.4 |
|
|
| 6.4 |
|
|
| 1.0 |
|
|
| 5.2 |
|
|
| 9.3 |
|
Cash, cash equivalents and restricted cash |
|
| 54.4 |
|
|
| 40.4 |
|
|
| 33.4 |
|
|
| 54.4 |
|
|
| 33.4 |
|
Quarterly data may not sum to full year data due to rounding.
(1) Item represents a non-GAAP financial measure; see discussion below, as well as a reconciliation to the comparable GAAP measure in the financial tables attached to this shareholder latter.
Following record revenue in the third quarter of 2020, DZS delivered the second-best revenue quarter in company history with revenue of $88.7 million in the fourth quarter of 2020, exceeding the high-end of our $75-80 million guidance range and achieving a 14% increase year-over-year. The same trends that we experienced during the third quarter persisted into the fourth quarter including strong growth, particularly for our market-first mobile edge access transport products and fiber-based broadband access solutions. The emergence of 5G continued to fuel growth across our mobile transport portfolio, which represented 31% of revenue in the fourth quarter, increasing nearly 250% year-over-year. During the fourth quarter, one customer represented greater than 10% of total revenue.
Revenue for the full year of 2020 was $300.6 million compared with $306.9 million for 2019. While overall revenue in 2020 was relatively flat, mobile broadband (4G/5G) design wins, new projects, and the timing of such projects and design wins delivered an approximate 150% year-over-year increase to mobile revenue, which represented 26% of total revenue. Mobile growth in 2020 offset declines in fixed broadband access. For 2020, we had two customers that each represented greater than 10% of total revenue.
DZS Mobile Transport Revenues Grew Substantially in 2020, Especially in the Second Half of the Year
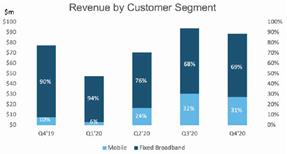
*Fixed Broadband includes Broadband Access, Connected Premises, Software and Services and Raw Materials revenues. Mobile includes Fronthaul, Midhaul, and Backhaul equipment revenues.
| 13
Q4 2020 & Full Year 2020 Stockholder Report
| As a result of continued momentum in South Korea, Japan, Vietnam, and Taiwan for our next generation mobile edge access transport and fixed broadband access solutions, sales to customers in Asia represented 61% of revenue in the fourth quarter, or $53.7 million. By comparison, revenue from Asia was $57.0 million in the third quarter of 2020 and $44.6 million in the fourth quarter of 2019. The sequential decline was the result of project timing of various mobile transport and fixed broadband projects following the record third quarter revenue. For the full year, revenue from Asia increased 6.4% to $174.2 million, representing 57.9% of total revenue with the growth primarily driven by strong sales of mobile transport solutions. Sales to customers in the Americas region were $18.2 million in the fourth quarter of 2020, representing 20% of revenue and increasing 7.4% from $16.9 million in the third quarter of 2020 and 29.0% from $14.1 million in the fourth quarter of 2019. For the full year, revenue from the Americas decreased 4.5% to $61.9 million. Despite the full year decline, revenue during the second half of 2020 increased 12.8% compared with the comparable period of 2019, aligned with new management and improved alignment with customers and partners. From a product line perspective, we recognized increasing sales of fiber access products in the Americas region in the second half of 2020. Sales to customers in the EMEA region were $16.8 million, or 19% of total revenue in the fourth quarter of 2020, a decline of 15.7% from $19.9 million in the third quarter of 2020 and lower by 11.1% from $18.9 million in the fourth quarter of 2019. The decline in both periods was the result of lower sales of copper-based broadband access solutions as the industry shifts to fiber-based broadband solutions as well as the DZS exit from a lower margin contract manufacturing agreement. For the full year, EMEA revenue declined 17.6%.
Overcoming tight supply chain conditions, adjusted gross margin for the fourth quarter of 2020, which excludes depreciation and amortization, and stock-based compensation was 33.1%. Adjusted gross margin benefited from a mix shift within our customer base compared with an adjusted gross margin of 30.6% in the third quarter of 2020. For the full year, adjusted gross margin was 32.9% compared with 33.5% in 2019 with the decline influenced by sales into new customer projects in the second half of 2020 in addition to certain constraints within the semiconductor supply chain.
|


| 14
Q4 2020 & Full Year 2020 Stockholder Report
|
| GAAP operating expense was $37.6 million, compared to $26.2 million in the third quarter of 2020 and $30.5 million in the fourth quarter of 2019. GAAP operating expense was impacted by a $6.5 million non-cash intangible asset impairment charge. GAAP operating expense also was adversely impacted by a non-cash $3.1 million reserve for bad debt expense for a customer in India. GAAP operating expense for the full year increased by $2.3 million to $109.4 million, attributed to one-time expenses associated with the build-out of the company’s new headquarters facility in Plano, Texas, including a new Center of Excellence, state-of-the-art engineering lab facilities as well as executive transition costs. Adjusted operating expense, which excludes depreciation and amortization, stock- based compensation, executive transition costs, headquarter relocation costs, and the intangible asset impairment, was $25.2 million compared with $22.3 million in the third quarter of 2020 and $23.3 million in the fourth quarter of 2019. The increase on both a sequential and year-over-year basis was the result of adjusting sales compensation to a more variable compensation model and adding sales, product, and research and development resources. Adjusted operating expense for the full year of 2020 declined 4.7% to $89.9 million due to cost-saving initiatives taken during the second half of 2019 as well as cost containment efforts undertaken in response to COVID-19. Adjusted operating income was $4.2 million in the fourth quarter, or 4.7% of sales which compares with $6.4 million, or 6.9% of sales, in the third quarter of 2020 and $2.4 million, or 3.0% of sales, in the fourth quarter of 2019. The sequential decline was the result of the increase in adjusted operating expenses while adjusted operating profit dollars only increased marginally due to slightly lower sequential sales volumes. The increase compared with the fourth quarter of 2019 was due to an increase in year-over-year sales volumes, offset by the increase in adjusted operating expenses. For the full year 2020, adjusted operating income increased modestly to $8.9 million, representing 3.0% of revenue as our lower adjusted operating expense was partially offset by a slight decline in full year revenue and slightly lower adjusted gross margin. Our GAAP net loss was ($14.0) million, or ($0.65) loss per diluted share. This compares to a GAAP net loss of ($0.1) million, or ($0.01) per share, in the third quarter of 2020 and a loss of ($10.2) million, or ($0.48) per share, in the fourth quarter of 2019. Our GAAP net loss for the full year was ($23.1) million, or ($1.07) per share compared with a loss of ($13.5) million, or ($0.69) per share for 2019. After removing depreciation and amortization, stock-based compensation, costs associated with our headquarters relocation from California to Texas, our executive transitions, asset impairment, and a reserve for accounts receivable in India, we recognized an adjusted net loss in the fourth quarter of 2020 of ($1.2) million, or ($0.06) per share. By comparison, adjusted net income was $4.3 million, or $0.20 per share, in the third quarter of 2020 while we recognized an adjusted net loss of ($2.3) million, or ($0.11) per share in the fourth quarter of 2019. During the fourth quarter of 2020, we recognized ($3.7) million of realized and unrealized foreign currency exchange losses largely in connection with our Korean Won denominated shareholder loans. Our shareholder loans were extinguished in February 2021, and the vast majority of remaining debt is expected to be paid down by March 31, 2021.
|

| 15
Q4 2020 & Full Year 2020 Stockholder Report
For 2020, our adjusted net loss was ($0.3) million, or ($0.01) per share compared with an adjusted net income of $2.0 million, or $0.10 per share, in 2019. In addition to the reasons cited in adjusted operating income, our adjusted net loss for 2020 was influenced by the ($3.7) million foreign currency expense recognized during the fourth quarter of 2020.
Adjusted EBITDA for the fourth quarter of 2020 was $0.4 million, or 0.4% of revenue. This compares to an adjusted EBITDA of $6.4 million in the prior quarter and $1.0 million in the fourth quarter of 2019. Adjusted EBITDA during the fourth quarter includes the aforementioned ($3.7) million of realized and unrealized foreign currency exchange losses largely in connection with our now extinguished Korean Won denominated shareholder loans.
($ In millions) |
| December 31, 2019 |
|
| March 31, 2020 |
|
| June 30, 2020 |
|
| September 30, 2020 |
|
| December 31, 2020 |
| |||||
Cash, cash equivalents and restricted cash |
| $ | 33.4 |
|
| $ | 35.7 |
|
| $ | 47.2 |
|
| $ | 40.4 |
|
| $ | 54.4 |
|
Debt |
| $ | 36.5 |
|
| $ | 39.7 |
|
| $ | 56.8 |
|
| $ | 51.5 |
|
| $ | 43.5 |
|
DSO |
|
| 132 |
|
|
| 169 |
|
|
| 129 |
|
|
| 105 |
|
|
| 105 |
|
Inventory |
| $ | 35.4 |
|
| $ | 39.9 |
|
| $ | 48.2 |
|
| $ | 43.9 |
|
| $ | 39.6 |
|
Inventory Turns |
| 5.2x |
|
| 3.2x |
|
| 4.2x |
|
| 5.6x |
|
| 5.6x |
| |||||
We recognized strong cash flow during the fourth quarter of 2020 as cash increased by $14.0 million bringing our total cash balance at the end of 2020 to $54.4 million despite the paydown of $8.0 million of debt. Following record revenue in the third quarter of 2020, we had a strong collections quarter while our integration initiatives have enabled continued improved inventory management, with inventory turns improving throughout 2020 to 5.6x in the fourth quarter. DSOs also were maintained at significantly lower levels in the fourth quarter relative to the first half of 2020 and the year ago period.
Due to these factors, we improved our net cash position by approximately $22 million in the quarter from a $11.1 million net debt position as of Sept. 30, 2020, to a net cash position of $10.9 million at the end of 2020. After the quarter, we issued 4.6 million shares in a $64 million follow-on equity offering raising net proceeds of $60.2 million. Following the equity offering, we paid down $29.2 million of debt.
| 16
Q4 2020 & Full Year 2020 Stockholder Report

First Quarter 2021 and Full Year 2021 Guidance
Looking forward to our first quarter 2021 financial outlook, our backlog as of Jan. 1, 2021 was approximately $71 million, relatively flat compared with backlog at the end of the third quarter of 2020. For the full year 2021, we remain optimistic that our technology vision and growth strategy aligned with the current market trends coupled with the company’s newly adopted cost management and supply chain workstreams will lead to favorable on-going results throughout 2021 and beyond. We anticipate that trends and outcomes resulting from the pandemic over the past 12 months will yield an increase in mobile and fixed broadband investments by communications service providers due to the surge in network usage and internet traffic derived from employees working and students learning from home, and an increase in e-gaming and streaming video.
While the broader market for 2021 remains positive and favorable for DZS, Q1 is a seasonally softer quarter due to regional sales mix, rollout schedules, and timing of service provider budget approvals. Operationally, DZS is committed to making the necessary product and sales investments to accelerate growth, capture market share, and to secure the necessary semiconductor chips aligned with our robust sales pipeline.
Business and market risks in 2021 include sourcing and availability challenges due to abnormally extended lead times with our semiconductor and EMS suppliers, and the uncertainty surrounding a potential third wave of COVID, which may delay our ability to meet shipment dates, potentially impacting revenue and margins.
With that backdrop, we are providing revenue and adjusted EBITDA guidance for the first quarter of 2021 and full year 2021 as follows and reflects our outlook as of the date of this stockholder report:
|
| Q1 2021 |
|
| Full Year 2021 |
| ||||||||||
|
| Low |
|
| High |
|
| Low |
|
| High |
| ||||
|
| ($ in millions) |
| |||||||||||||
Net revenue |
| $ | 70.0 |
|
| $ | 75.0 |
|
| $ | 310.0 |
|
| $ | 330.0 |
|
Adjusted Gross margin %(1) |
|
| 30.5 | % |
|
| 32.0 | % |
|
| 33.5 | % |
|
| 35.0 | % |
Adjusted Operating expenses(1) |
|
| 27.5 |
|
|
| 26.5 |
|
|
| 100.5 |
|
|
| 96.5 |
|
Adjusted EBITDA(1) |
|
| (5.3 | ) |
|
| (1.7 | ) |
|
| 1.4 |
|
|
| 17.0 |
|
(1) Item represents a non-GAAP financial Measure; see discussion below, as well as a reconciliation to the comparable GAAP measure in the financial tables attached to this shareholder letter.
| 17
Q4 2020 & Full Year 2020 Stockholder Report
|
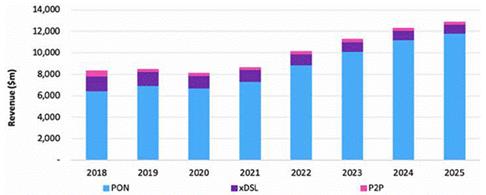
| The forecasted sum value of equipment sold in the Fiber Mobile Transport and Fixed Broadband Access markets over the next five years (2020-2024) is $85 billion in aggregate, growing at an 8.4% compound annual rate (source: Omdia Macrocell Mobile Backhaul Equipment Tracker 2H20, Mobile Fronthaul Equipment Report – 2020, and Wireline Broadband Access Equipment Forecast - 2019-2025). With a growing number of countries (United States, United Kingdom, Australia, Finland, Japan, and India) already formally banning Chinese OEMs and dozens of other countries assessing security concerns, combined with emerging 5G O-RAN networks, and the $9.2 billion phase I RDOF, near- to long-term market conditions are favorable. In addition to these market conditions and Chinese security bans noted above, competitive intensity in the mobile and fixed broadband access market globally is trending favorably. DZS transformation initiatives and workstreams have been thorough and swift, extending across all corporate functions including our recent Optelian acquisition. Optelian complements our existing mobile edge access portfolio and catalyzes our expansion into the North America Tier I/II customer footprint. In unison, these initiatives are designed to drive sales growth and margin expansion over the coming years. Further enhancing our transformation, DZS successfully executed a $64 million follow-on equity offering, which has strengthened our balance sheet, eliminated our debt, and improved financial flexibility for future growth opportunities. During the fourth quarter, DZS appointed Matt Bross and Barbara Carbone to our Board of Directors, strengthening our corporate oversight and board diversification. On May 13, 2021, DZS will host its inaugural Horizons investor day featuring insights from CEO Charlie Vogt, CTO Andrew Bender, product leader Miguel Alonso, and CFO Tom Cancro. | |
We value our customers and our stockholders for their loyalty and continued support. Sincerely, | |||
Charlie Vogt |
Tom Cancro Chief Financial Officer | ||
DZS will host a conference call to discuss its fourth quarter financial results on Monday, February 22, 2021 at 4:30 p.m. (ET). | |||
Conference call details: Date: Monday, February 22, 2021 Time: 4:30 p.m. Eastern time zone U.S. dial-in number: 877-742-9182 International number: +1-602-563-8857 |
Conference ID: 3391564 Webcast link: https://edge.media-server. com/mmc/p/zqjk42dw | ||
Ted Moreau Vice President, Investor Relations ir@dzsi.com | |||


| 18
Q4 2020 & Full Year 2020 Stockholder Report
DZS Inc. (NSDQ: DZSI) is a global leader of intelligent, packet-based mobile transport and broadband access converged edge solutions with more than 20 million products in-service with customers and alliance partners spanning more than 100 countries.
DZS, the DZS logo, and all DZS product names are trademarks of DZS Inc. Other brand and product names are trademarks of their respective holders. Specifications, products, and/or product names are all subject to change
Statements made in this stockholder letter and the earnings call contains forward-looking statements regarding future events and our future results that are subject to the safe harbors created under the Private Securities Litigation Reform Act of 1995. These statements reflect the beliefs and assumptions of the Company’s management as of the date hereof. Words such as “anticipate,” “believe,” “continue,” “could,” “estimate,” “expect,” “forecast,” “goal,” “intend,” “may,” “plan,” “project,” “seek,” “should,” “target,” “will,” “would,” variations of such words, and similar expressions are intended to identify forward-looking statements. In addition, statements that refer to projections of earnings, revenue, operating expenses, gross profit, costs or other financial items (including non-GAAP measures) in future periods are forward-looking statements. Readers are cautioned that these forward-looking statements are only predictions and are subject to risks, uncertainties and assumptions that are difficult to predict. The Company’s actual results could differ materially and adversely from those expressed in or contemplated by the forward-looking statements. In addition to the factors discussed in this stockholder letter, factors that could cause actual results to differ include, but are not limited to, those risk factors contained in the Company’s SEC filings available at www.sec. gov, including without limitation, the Company’s annual report on Form 10-K, quarterly reports on Form 10-Q and subsequent filings. In addition, additional or unforeseen affects from the COVID-19 pandemic and global economic climate may give rise to, or amplify, many of these risks. Readers are cautioned not to place undue reliance on any forward-looking statements, which speak only as of the date on which they are made. The Company undertakes no obligation to update or revise any forward-looking statements for any reason.
Use of Non-GAAP Financial Information
To supplement DZS’s consolidated financial statements presented in accordance with GAAP, DZS reports Adjusted Cost of Revenue, Adjusted Gross Margin, Adjusted Operating Expenses, Adjusted Operating Income (Loss), Adjusted (Non-GAAP) Net Income attributable to DZS (including on a per share basis), EBITDA, and Adjusted EBITDA, which are non-GAAP measures DZS believes are appropriate to provide meaningful comparison with, and to enhance an overall understanding of DZS’s past financial performance and prospects for the future. DZS believes these non-GAAP financial measures provide useful information to both management and investors by excluding specific expenses and gains that DZS believes are not indicative of core operating results. Further, each of these are non-GAAP measures of operating performance used by management, as well as industry analysts, to evaluate operations and operating performance and is widely used in the telecommunications and manufacturing industries. Other companies in the telecommunications and manufacturing industries may calculate these metrics differently than DZS does. The presentation of this additional information is not meant to be considered in isolation or as a substitute for measures of financial performance prepared in accordance with GAAP.
DZS defines Adjusted Cost of Revenue as GAAP Cost of Revenue less (i) depreciation and amortization, (ii) stock based compensation, and (iii) the impact of material transactions or events that we believe are not indicative of our core product cost, such as, inventory step-up amortization, any of which may or may not be recurring in nature.
We believe Adjusted Cost of Revenue provides the investor more accurate information regarding the actual cost of our products and services, excluding the impact of costs of revenue that are not routine components of our core product cost, for better comparability of our costs of revenue between periods and to other companies.
DZS defines Adjusted Gross Margin as GAAP Gross Margin less (i) depreciation and amortization, (ii) stock based compensation, and (iii) the impact of material transactions or events that we believe are not indicative of our core operating performance, such as, inventory step-up amortization, any of which may or may not be recurring in nature. We believe Adjusted Gross Margin provides the investor more accurate information regarding our core profit margin on sales, excluding the impact of cost of revenue that are not routine components of our core product cost, for better comparability of gross margin between periods and to other companies.
DZS defines Adjusted Operating Expenses as GAAP operating expenses plus or minus (as applicable) (i) depreciation and amortization, (ii) stock based compensation, and (iii) the impact of material transactions or events that we believe are not indicative of our core operating performance, such as merger and acquisition costs, purchase price adjustment, goodwill impairment, impairment of long-lived assets or loss on debt
| 19
Q4 2020 & Full Year 2020 Stockholder Report
extinguishment, restructuring and other charges, any of which may or may not be recurring in nature. We believe Adjusted Operating Expenses provides the investor more accurate information regarding our core operating expenses, which include research and development costs, selling, general and administrative costs, and amortization of intangible assets, excluding the impact of charges that are not routine components of our core operating expenses, for better comparability between periods and to other companies.
DZS defines Adjusted Operating Income (Loss) as GAAP Operating Income (Loss) plus or minus (as applicable)
(i) depreciation and amortization, (ii) stock based compensation, and (iii) the impact of material transactions or events that we believe are not indicative of our core operating performance, such as merger and acquisition costs, purchase price adjustment, goodwill impairment, impairment of long-lived assets or loss on debt extinguishment, restructuring and other charges, any of which may or may not be recurring in nature. We believe Adjusted Operating Income (Loss) provides the investor more accurate information regarding our core operating Income (Loss), excluding the impact of charges that are not routine components of our core operating expenses, for better comparability between periods and to other companies.
DZS defines Non-GAAP net income (loss) attributable to DZS as GAAP Net Income plus or minus (as applicable)
(i) depreciation and amortization, (ii) stock based compensation, and (iii) the impact of material transactions or events that we believe are not indicative of our core operating performance, such as merger and acquisition costs, inventory step-up amortization, purchase price adjustment, goodwill impairment, impairment of long-lived assets or loss on debt extinguishment, restructuring and other charges, any of which may or may not be recurring in nature. We believe Non-GAAP net income (loss) attributable to DZS provides the investor more accurate information regarding our core income, excluding the impact of charges that are not routine components of our core product cost or core operating expenses, for better comparability between periods and to other companies.
DZS defines EBITDA as net income (loss) plus or minus (as applicable) (i) interest expense, net, (ii) income tax provision (benefit), and (iii) depreciation and amortization expense. DZS defines Adjusted EBITDA as EBITDA plus or minus (as applicable) (i) stock-based compensation expenses, and (ii) the impact of material transactions or events that we believe are not indicative of our core operating performance, such as merger and acquisition transaction costs, inventory step-up amortization, purchase price adjustment, goodwill impairment, gain or (loss) on sale of assets, impairment of long-lived assets or loss on debt extinguishment, any of which may or may not be recurring in nature. DZS believes that EBITDA and Adjusted EBITDA are useful measures because they provide supplemental information to assist investors in comparing the Company’s performance across reporting periods on a consistent basis by excluding items that the Company does not believe are indicative of its core operating performance, as well as in assessing the sustainable cash-generating ability of the business. In addition, DZS believes these measures are of importance to investors and lenders in assessing the Company’s overall capital structure and its ability to borrow additional funds.
A reconciliation of EBITDA and Adjusted EBITDA to each of their respective GAAP counterparts for the three months ended December 31, 2020, and December 31, 2019 is included at the end of the Unaudited Condensed Consolidated Statements of Comprehensive Income (Loss) below. Reconciliations of the other Non-GAAP measures included herein to their GAAP counterparts are provided in the section below entitled “Reconciliation of GAAP to Non-GAAP Results” and “Reconciliation of GAAP to Non-GAAP Financial Guidance”.
| 20
Q4 2020 & Full Year 2020 Stockholder Report
Unaudited Condensed Consolidated Statements of Comprehensive Income (Loss)
($ in thousands, except per share data)
| For the Quarters Ended |
|
| For the Twelve Months Ended |
| |||||||||||||||
|
| December 31, |
|
| September 30, |
|
| December 31, |
|
| December 31, |
|
| December 31, |
| |||||
|
| 2020 |
|
| 2020 |
|
| 2019 |
|
| 2020 |
|
| 2020 |
| |||||
Net revenue |
| $ | 88,681 |
|
| $ | 93,947 |
|
| $ | 77,605 |
|
| $ | 300,640 |
|
| $ | 306,882 |
|
Cost of revenue |
|
| 59,757 |
|
|
| 65,755 |
|
|
| 52,323 |
|
|
| 203,761 |
|
|
| 206,771 |
|
Gross profit |
|
| 28,924 |
|
|
| 28,192 |
|
|
| 25,282 |
|
|
| 96,879 |
|
|
| 100,111 |
|
Operating expenses: |
|
|
|
|
|
|
|
|
|
|
|
|
|
|
|
|
|
|
|
|
Research and product development |
|
| 10,594 |
|
|
| 8,903 |
|
|
| 9,004 |
|
|
| 37,459 |
|
|
| 38,516 |
|
Selling, general and administrative |
|
| 20,196 |
|
|
| 16,925 |
|
|
| 15,522 |
|
|
| 64,041 |
|
|
| 61,206 |
|
Intangibles impairment charge |
|
| 6,472 |
|
|
| - |
|
|
| - |
|
|
| 6,472 |
|
|
| - |
|
Restructuring and other charges |
|
| - |
|
|
| - |
|
|
| 4,908 |
|
|
| - |
|
|
| 4,908 |
|
Amortization of intangible assets |
|
| 302 |
|
|
| 387 |
|
|
| 101 |
|
|
| 1,432 |
|
|
| 1,507 |
|
Goodwill impairment charge |
|
| - |
|
|
| - |
|
|
| 1,003 |
|
|
| - |
|
|
| 1,003 |
|
Total operating expenses |
|
| 37,564 |
|
|
| 26,215 |
|
|
| 30,538 |
|
|
| 109,404 |
|
|
| 107,140 |
|
Operating income (loss) |
|
| (8,640 | ) |
|
| 1,977 |
|
|
| (5,256 | ) |
|
| (12,525 | ) |
|
| (7,029 | ) |
Interest income |
|
| (21 | ) |
|
| 14 |
|
|
| (68 | ) |
|
| 77 |
|
|
| 456 |
|
Interest expense |
|
| (532 | ) |
|
| (446 | ) |
|
| (742 | ) |
|
| (2,035 | ) |
|
| (3,981 | ) |
Loss on debt extinguishment |
|
| - |
|
|
| - |
|
|
| - |
|
|
| (1,369 | ) |
|
| – |
|
Other income (expense), net |
|
| (3,798 | ) |
|
| (41 | ) |
|
| (1,641 | ) |
|
| (3,729 | ) |
|
| 876 |
|
Income (loss) before income taxes |
|
| (12,991 | ) |
|
| 1,504 |
|
|
| (7,707 | ) |
|
| (19,581 | ) |
|
| (9,678 | ) |
Income tax (benefit) provision |
|
| 1,049 |
|
|
| 1,619 |
|
|
| 2,487 |
|
|
| 3,501 |
|
|
| 3,585 |
|
Net income (loss) |
|
| (14,040 | ) |
|
| (115 | ) |
|
| (10,194 | ) |
|
| (23,082 | ) |
|
| (13,263 | ) |
Net income (loss) attributable to non-controlling interest |
|
| - |
|
|
| - |
|
|
| - |
|
|
| - |
|
|
| 194 |
|
Net income (loss) attributable to DZS Inc. |
| $ | (14,040 | ) |
| $ | (115 | ) |
| $ | (10,194 | ) |
| $ | (23,082 | ) |
| $ | (13,457 | ) |
|
|
|
|
|
|
|
|
|
|
|
|
|
|
|
|
|
|
|
|
|
Earnings (loss) per share attributable to DZS Inc.: |
|
|
|
|
|
|
|
|
|
|
|
|
|
|
|
|
|
|
|
|
Basic |
| $ | (0.65 | ) |
| $ | (0.01 | ) |
| $ | (0.48 | ) |
| $ | (1.07 | ) |
| $ | (0.69 | ) |
Diluted |
| $ | (0.65 | ) |
| $ | (0.01 | ) |
| $ | (0.48 | ) |
| $ | (1.07 | ) |
| $ | (0.69 | ) |
Weighted average shares outstanding: |
|
|
|
|
|
|
|
|
|
|
|
|
|
|
|
|
|
|
|
|
Basic |
|
| 21,761 |
|
|
| 21,592 |
|
|
| 21,392 |
|
|
| 21,588 |
|
|
| 19,403 |
|
Diluted |
|
| 21,761 |
|
|
| 21,592 |
|
|
| 21,392 |
|
|
| 21,588 |
|
|
| 19,403 |
|
|
|
|
|
|
|
|
|
|
|
|
|
|
|
|
|
|
|
|
|
|
Reconciliation of net income (loss) to Adjusted EBITDA: |
|
|
|
|
|
|
|
|
|
|
|
|
|
|
|
|
|
|
|
|
Net income (loss) |
| $ | (14,040 | ) |
| $ | (115 | ) |
| $ | (10,194 | ) |
| $ | (23,082 | ) |
| $ | (13,263 | ) |
Interest expense, net |
|
| 553 |
|
|
| 432 |
|
|
| 810 |
|
|
| 1,958 |
|
|
| 3,525 |
|
Income tax (benefit) provision |
|
| 1,049 |
|
|
| 1,619 |
|
|
| 2,487 |
|
|
| 3,501 |
|
|
| 3,585 |
|
Depreciation and amortization |
|
| 1,208 |
|
|
| 1,386 |
|
|
| 1,005 |
|
|
| 5,143 |
|
|
| 5,115 |
|
EBITDA |
| $ | (11,230 | ) |
| $ | 3,322 |
|
| $ | (5,892 | ) |
| $ | (12,480 | ) |
| $ | (1,038 | ) |
Stock-based compensation |
|
| 1,303 |
|
|
| 1,660 |
|
|
| 690 |
|
|
| 4,613 |
|
|
| 3,508 |
|
Merger and acquisition costs |
|
| - |
|
|
| - |
|
|
| - |
|
|
| - |
|
|
| 337 |
|
loss on debt extinguishment |
|
| - |
|
|
| - |
|
|
| - |
|
|
| 1,369 |
|
|
| - |
|
Inventory step-up amortization |
|
| - |
|
|
| - |
|
|
| - |
|
|
| - |
|
|
| 577 |
|
Bargain purchase gain on acquisition |
|
| - |
|
|
| - |
|
|
| 334 |
|
|
| - |
|
|
| - |
|
Headquarters relocation |
|
| 26 |
|
|
| 35 |
|
|
| - |
|
|
| 61 |
|
|
| - |
|
Executive transition |
|
| 664 |
|
|
| 1,383 |
|
|
| - |
|
|
| 2,047 |
|
|
| - |
|
Intangibles impairment |
|
| 6,472 |
|
|
| - |
|
|
| - |
|
|
| 6,472 |
|
|
| - |
|
Bad debt expense |
|
| 3,119 |
|
|
| - |
|
|
| - |
|
|
| 3,119 |
|
|
| - |
|
Restructuring and other charges |
|
| - |
|
|
| - |
|
|
| 4,908 |
|
|
| - |
|
|
| 4,908 |
|
Goodwill impairment charge |
|
| - |
|
|
| - |
|
|
| 1,003 |
|
|
| - |
|
|
| 1,003 |
|
Adjusted EBITDA |
| $ | 354 |
|
| $ | 6,400 |
|
| $ | 1,043 |
|
| $ | 5,201 |
|
| $ | 9,295 |
|
| 21
Q4 2020 & Full Year 2020 Stockholder Report
Unaudited Condensed Consolidated Balance Sheets
($ in thousands)
| �� | December 30, |
|
| December 30, |
| ||
Assets |
| 2020 |
|
| 2019 |
| ||
Current assets |
|
|
|
|
|
|
|
|
Cash, cash equivalents and restricted cash |
| $ | 54,419 |
|
| $ | 33,393 |
|
Accounts receivable, net |
|
| 97,253 |
|
|
| 96,865 |
|
Other receivables |
|
| 9,165 |
|
|
| 8,124 |
|
Inventories |
|
| 39,572 |
|
|
| 35,439 |
|
Contract assets |
|
| 6,182 |
|
|
| 16,680 |
|
Prepaid expenses and other current assets |
|
| 5,332 |
|
|
| 4,185 |
|
Total current assets |
|
| 211,923 |
|
|
| 194,686 |
|
Property, plant and equipment, net |
|
| 7,146 |
|
|
| 6,769 |
|
Right-of-use assets from operating leases |
|
| 18,483 |
|
|
| 20,469 |
|
Goodwill |
|
| 3,977 |
|
|
| 3,977 |
|
Intangible assets, net |
|
| 3,377 |
|
|
| 12,381 |
|
Deferred tax assets |
|
| 1,405 |
|
|
| 1,622 |
|
Other assets |
|
| 5,919 |
|
|
| 6,243 |
|
Total assets |
| $ | 252,230 |
|
| $ | 246,147 |
|
Liabilities and Stockholders' Equity |
|
|
|
|
|
|
|
|
Current liabilities |
|
|
|
|
|
|
|
|
Accounts payable |
| $ | 49,250 |
|
| $ | 41,585 |
|
Short-term debt |
|
| 13,787 |
|
|
| 17,484 |
|
Contract liabilities |
|
| 4,400 |
|
|
| 3,567 |
|
Operating lease liabilities |
|
| 4,494 |
|
|
| 4,201 |
|
Accrued and other liabilities |
|
| 16,707 |
|
|
| 12,964 |
|
Total current liabilities |
|
| 88,638 |
|
|
| 79,801 |
|
Long-term debt |
|
| 29,754 |
|
|
| 19,033 |
|
Contract liabilities |
|
| 2,471 |
|
|
| 3,230 |
|
Operating lease liabilities |
|
| 15,959 |
|
|
| 18,154 |
|
Pension liabilities |
|
| 20,052 |
|
|
| 17,671 |
|
Other long-term liabilities |
|
| 1,777 |
|
|
| 1,710 |
|
Total liabilities |
|
| 158,651 |
|
|
| 139,599 |
|
Stockholders' equity |
|
|
|
|
|
|
|
|
Common stock |
|
| 22 |
|
|
| 21 |
|
Additional paid-in capital |
|
| 147,997 |
|
|
| 139,700 |
|
Accumulated other comprehensive loss |
|
| (2,124 | ) |
|
| (3,939 | ) |
Accumulated deficit |
|
| (52,316 | ) |
|
| (29,234 | ) |
Total stockholders' equity |
|
| 93,579 |
|
|
| 106,548 |
|
Total liabilities and stockholders' equity |
| $ | 252,230 |
|
| $ | 246,147 |
|
| 22
Q4 2020 & Full Year 2020 Stockholder Report
Unaudited Reconciliation of GAAP to Non-GAAP Results
($ in thousands, except per share data)
The reconciliation of EBITDA and Adjusted EBITDA to net income is included above in the Unaudited Condensed Consolidated Statements of Comprehensive Income (Loss). Set forth below are reconciliation of Non-GAAP Cost of Revenue, Non-GAAP Gross Profit, Non-GAAP Operating Expenses, Non-GAAP Operating Income (Loss), Non-GAAP Net Income (Loss) Attributable to DZS Inc, and Non-GAAP Net Income (Loss) per Diluted Share Attributable to DZS Inc, to GAAP Cost of Revenue, Gross Profit, Operating Expenses, Operating Income (Loss), Net Income (Loss) Attributable to DZS Inc, and Net Income (Loss) per Diluted Share Attributable to DZS Inc, respectively, which the Company considers to be the most directly comparable U.S. GAAP financial measures.
|
| Three Months Ended December 31, 2020 |
| |||||||||||||||||||||
|
|
|
|
|
|
|
|
|
|
|
|
|
|
|
|
|
|
|
|
|
| Net Income |
| |
|
|
|
|
|
|
|
|
|
|
|
|
|
|
|
|
|
| Nel Income |
|
| (Loss) per |
| ||
|
|
|
|
|
|
|
|
|
|
|
|
|
|
|
|
|
| (Loss) |
|
| Diluted Share |
| ||
|
| Cost of |
|
| Gross |
|
| Operating |
|
| Operating |
|
| Attributable |
|
| Attributable |
| ||||||
|
| Revenue |
|
| Profit |
|
| Expenses |
|
| Income (Loss) |
|
| to DZS Inc. |
|
| to DZS Inc. |
| ||||||
GAAP amount |
| $ | 59,757 |
|
| $ | 28,924 |
|
| $ | 37,564 |
|
| $ | (8,640 | ) |
| $ | (14,040 | ) |
| $ | (0.65 | ) |
Adjustments to GAAP amounts: |
|
|
|
|
|
|
|
|
|
|
|
|
|
|
|
|
|
|
|
|
|
|
|
|
Depreciation and amortization |
|
| (401 | ) |
|
| 401 |
|
|
| (807 | ) |
|
| 1,208 |
|
|
| 1,208 |
|
|
| 0.06 |
|
Stock-based compensation |
|
| (46 | ) |
|
| 46 |
|
|
| (1,257 | ) |
|
| 1,303 |
|
|
| 1,303 |
|
|
| 0.06 |
|
Headquarters relocation |
|
| - |
|
|
| - |
|
|
| (26 | ) |
|
| 26 |
|
|
| 26 |
|
|
| 0.00 |
|
Executive transition |
|
| - |
|
|
| - |
|
|
| (664 | ) |
|
| 664 |
|
|
| 664 |
|
|
| 0.03 |
|
Intangibles impairment |
|
| - |
|
|
| - |
|
|
| (6,472 | ) |
|
| 6,472 |
|
|
| 6,472 |
|
|
| 0.30 |
|
Bad debt expense |
|
| - |
|
|
| - |
|
|
| (3,119 | ) |
|
| 3,119 |
|
|
| 3,119 |
|
|
| 0.14 |
|
Adjusted (Non-GAAP) amount |
| $ | 59,310 |
|
| $ | 29,371 |
|
| $ | 25,219 |
|
| $ | 4,152 |
|
| $ | (1,248 | ) |
| $ | (0.06 | ) |
|
| Three Months Ended September 30, 2020 |
| |||||||||||||||||||||
|
|
|
|
|
|
|
|
|
|
|
|
|
|
|
|
|
|
|
|
|
| Net Income |
| |
|
|
|
|
|
|
|
|
|
|
|
|
|
|
|
|
|
| Net Income |
|
| (Loss) per |
| ||
|
|
|
|
|
|
|
|
|
|
|
|
|
|
|
|
|
| (Loss) |
|
| Diluted Share |
| ||
|
| Cost of |
|
| Gross |
|
| Operating |
|
| Operating |
|
| Attributable |
|
| Attributable |
| ||||||
|
| Revenue |
|
| Profit |
|
| Expenses |
|
| Income (Loss) |
|
| to DZS Inc. |
|
| to DZS Inc. |
| ||||||
GAAP amount |
| $ | 65,755 |
|
| $ | 28,192 |
|
| $ | 26,215 |
|
| $ | 1,977 |
|
| $ | (115 | ) |
| $ | (0.01 | ) |
Adjustments to GAAP amounts: |
|
|
|
|
|
|
|
|
|
|
|
|
|
|
|
|
|
|
|
|
|
|
|
|
Depreciation and amortization |
|
| (503 | ) |
|
| 503 |
|
|
| (863 | ) |
|
| 1,386 |
|
|
| 1,386 |
|
|
| 0.06 |
|
Stock-based compensation |
|
| (16 | ) |
|
| 16 |
|
|
| (1,644 | ) |
|
| 1,660 |
|
|
| 1,660 |
|
|
| 0.08 |
|
Headquarters relocation |
|
| - |
|
|
| - |
|
|
| (35 | ) |
|
| 35 |
|
|
| 35 |
|
|
| - |
|
Executive transition |
|
| - |
|
|
| - |
|
|
| (1.383 | ) |
|
| 1,383 |
|
|
| 1,383 |
|
|
| 0.06 |
|
Adjusted (Non-GAAP) amount |
| $ | 65,236 |
|
| $ | 28,711 |
|
| $ | 22,270 |
|
| $ | 6,441 |
|
| $ | 4,349 |
|
| $ | 0.20 |
|
| 23
Q4 2020 & Full Year 2020 Stockholder Report
| Three Months Ended December 31, 2019 |
| ||||||||||||||||||||||
|
|
|
|
|
|
|
|
|
|
|
|
|
|
|
|
|
|
|
|
|
| Net Income |
| |
|
|
|
|
|
|
|
|
|
|
|
|
|
|
|
|
|
| Net Income |
|
| (Loss) per |
| ||
|
|
|
|
|
|
|
|
|
|
|
|
|
|
|
|
|
| (Loss) |
|
| Diluted Share |
| ||
|
| Cost of |
|
| Gross |
|
| Operating |
|
| Operating |
|
| Attributable |
|
| Attributable |
| ||||||
|
| Revenue |
|
| Profit |
|
| Expenses |
|
| Income (Loss) |
|
| to DZS Inc. |
|
| to DZS inc. |
| ||||||
GAAP amount |
| $ | 52,323 |
|
| $ | 25,282 |
|
| $ | 30,538 |
|
| $ | (5,256 | ) |
| $ | (10,194 | ) |
| $ | (0.48 | ) |
Adjustments to GAAP amounts: |
|
|
|
|
|
|
|
|
|
|
|
|
|
|
|
|
|
|
|
|
|
|
|
|
Depreciation and amortization |
|
| (399 | ) |
|
| 399 |
|
|
| (606 | ) |
|
| 1,005 |
|
|
| 1,005 |
|
|
| 0.05 |
|
Stock-based compensation |
|
| (10 | ) |
|
| 10 |
|
|
| (680 | ) |
|
| 690 |
|
|
| 690 |
|
| 0 03 |
| |
Restructuring cost |
|
| - |
|
|
| - |
|
|
| (4,908 | ) |
|
| 4,908 |
|
|
| 4,908 |
|
|
| 0.23 |
|
Goodwill impairment |
|
| - |
|
|
| - |
|
|
| (1,003 | ) |
|
| 1,003 |
|
|
| 1,003 |
|
|
| 0.05 |
|
Bargain purchase gain on acquisition |
|
| - |
|
|
| - |
|
|
| - |
|
|
| - |
|
|
| 334 |
|
|
| 0.02 |
|
Adjusted (Non-GAAP) amount |
| $ | 51,914 |
|
| $ | 25,691 |
|
| $ | 23,341 |
|
| $ | 2,350 |
|
| $ | (2,254 | ) |
| $ | (0.11 | ) |
|
| Twelve Months Ended December 31, 2020 |
| |||||||||||||||||||||
|
|
|
|
|
|
|
|
|
|
|
|
|
|
|
|
|
|
|
|
|
| Net Income |
| |
|
|
|
|
|
|
|
|
|
|
|
|
|
|
|
|
|
| Net Income |
|
| (Loss) per |
| ||
|
|
|
|
|
|
|
|
|
|
|
|
|
|
|
|
|
| (Loss) |
|
| Diluted Share |
| ||
|
| Cost of |
|
| Gross |
|
| Operating |
|
| Operating |
|
| Attributable |
|
| Attributable |
| ||||||
|
| Revenue |
|
| Profit |
|
| Expenses |
|
| Income (Loss) |
|
| to DZS Inc. |
|
| to DZS inc. |
| ||||||
GAAP amount |
| $ | 203,761 |
|
| $ | 96,879 |
|
| $ | 109,404 |
|
| $ | (12,525 | ) |
| $ | (23,082 | ) |
| $ | (1.07 | ) |
Adjustments to GAAP amounts: |
|
|
|
|
|
|
|
|
|
|
|
|
|
|
|
|
|
|
|
|
|
|
|
|
Depreciation and amortization |
|
| (1,842 | ) |
|
| 1,842 |
|
|
| (3,301 | ) |
|
| 5,143 |
|
|
| 5,143 |
|
|
| 0.24 |
|
Stock-based compensation |
|
| (86 | ) |
|
| 86 |
|
|
| (4,527 | ) |
|
| 4,613 |
|
|
| 4,613 |
|
|
| 0.21 |
|
Loss on debt extinguishment |
|
| - |
|
|
| - |
|
|
| - |
|
|
| - |
|
|
| 1,369 |
|
|
| 0.06 |
|
Headquarters relocation |
|
| - |
|
|
| - |
|
|
| (61 | ) |
|
| 61 |
|
|
| 61 |
|
|
| - |
|
Executive transition |
|
| - |
|
|
| - |
|
|
| (2,047 | ) |
|
| 2,047 |
|
|
| 2,047 |
|
|
| 0.10 |
|
Intangibles impairment |
|
| - |
|
|
| - |
|
|
| (6,472 | ) |
|
| 6,472 |
|
|
| 6,472 |
|
|
| 0.30 |
|
Bad debt expenses |
|
| - |
|
|
| - |
|
|
| (3,119 | ) |
|
| 3,119 |
|
|
| 3,119 |
|
|
| 0.15 |
|
Adjusted (Non-GAAP) amount |
| $ | 201,833 |
|
| $ | 98,807 |
|
| $ | 89,877 |
|
| $ | 8,930 |
|
| $ | (258 | ) |
| $ | (0.01 | ) |
|
| Twelve Months Ended December 31, 2019 |
| |||||||||||||||||||||
|
|
|
|
|
|
|
|
|
|
|
|
|
|
|
|
|
|
|
|
|
| Net Income |
| |
|
|
|
|
|
|
|
|
|
|
|
|
|
|
|
|
|
| Net Income |
|
| (Loss) per |
| ||
|
|
|
|
|
|
|
|
|
|
|
|
|
|
|
|
|
| (Loss) |
|
| Diluted Share |
| ||
|
| Cost of |
|
| Gross |
|
| Operating |
|
| Operating |
|
| Attributable |
|
| Attributable |
| ||||||
|
| Revenue |
|
| Profit |
|
| Expenses |
|
| Income (Loss) |
|
| to DZS Inc. |
|
| to DZS Inc. |
| ||||||
GAAP amount |
| $ | 206,771 |
|
| $ | 100,111 |
|
| $ | 107,140 |
|
| $ | (7,029 | ) |
| $ | (13,457 | ) |
| $ | (0.69 | ) |
Adjustments to GAAP amounts: |
|
|
|
|
|
|
|
|
|
|
|
|
|
|
|
|
|
|
|
|
|
|
|
|
Depreciation and amortization |
|
| (2,012 | ) |
|
| 2,012 |
|
|
| (3,103 | ) |
|
| 5,115 |
|
|
| 5,115 |
|
|
| 0.26 |
|
Stock-based compensation |
|
| (41 | ) |
|
| 41 |
|
|
| (3,467 | ) |
|
| 3,508 |
|
|
| 3,508 |
|
|
| 0.18 |
|
Merger and acquisition costs |
|
| - |
|
|
| - |
|
|
| (337 | ) |
|
| 337 |
|
|
| 337 |
|
|
| 0.02 |
|
Inventory step-up amortization |
|
| (577 | ) |
|
| 577 |
|
|
| - |
|
|
| 577 |
|
|
| 577 |
|
|
| 0.03 |
|
Restructuring cost |
|
| - |
|
|
| - |
|
|
| (4,908 | ) |
|
| 4,908 |
|
|
| 4,908 |
|
|
| 0.25 |
|
Goodwill impairment |
|
| - |
|
|
| - |
|
|
| (1,003 | ) |
|
| 1,003 |
|
|
| 1,003 |
|
|
| 0.05 |
|
Adjusted (Non-GAAP) amount |
| $ | 204,141 |
|
| $ | 102,741 |
|
| $ | 94,322 |
|
| $ | 8,419 |
|
| $ | 1,991 |
|
| $ | 0.10 |
|
| 24
Q4 2020 & Full Year 2020 Stockholder Report
Unaudited Reconciliation of GAAP to Non-GAAP Guidance
($ in millions, except percentages)
The reconciliation of Adjusted EBITDA, Adjusted Gross margin and Adjusted Operating expenses to Net income (Loss), Gross margin and Operating expenses, respectively, which the Company considers to be the most directly comparable U.S. GAAP Measures.
|
| Q1 2021 |
|
| Full Year 2021 |
| ||||||||||
|
| Low |
|
| High |
|
| Low |
|
| High |
| ||||
Reconciliation of Net Income (Loss) to Adjusted EBITDA: |
|
|
|
|
|
|
|
|
|
|
|
|
|
|
|
|
Net income (loss) |
| $ | (8.2 | ) |
| $ | (5.1 | ) |
| $ | (24.6 | ) |
| $ | (10.4 | ) |
Interest expense, net |
|
| 0.1 |
|
|
| 0.1 |
|
|
| 1.5 |
|
|
| 1.5 |
|
Income tax expense |
|
| (0.1 | ) |
|
| 0.4 |
|
|
| 3.7 |
|
|
| 5.0 |
|
Depreciation and amortization |
|
| 1.4 |
|
|
| 1.4 |
|
|
| 5.8 |
|
|
| 5.8 |
|
EBITDA |
| (6.8) |
|
|
| (3.2 | ) |
|
| (13.6 | ) |
|
| 1.9 |
| |
Stock-based compensation |
|
| 1.1 |
|
|
| 1.1 |
|
|
| 4.2 |
|
|
| 4.2 |
|
Executive transition |
|
| 0.3 |
|
|
| 0.3 |
|
|
| 0.7 |
|
|
| 0.8 |
|
HQ Relocation |
|
| 0.1 |
|
|
| 0.1 |
|
|
| 0.1 |
|
|
| 0.1 |
|
Transformational initiatives |
|
| - |
|
|
| - |
|
|
| 10.0 |
|
|
| 10.0 |
|
Adjusted EBITDA |
| $ | (5.3 | ) |
| $ | (1.7 | ) |
| $ | 1.4 |
|
| $ | 17.0 |
|
|
|
|
|
|
|
|
|
|
|
|
|
|
|
|
|
|
Reconciliation of Gross Margin to Adjusted Gross Margin: |
|
|
|
|
|
|
|
|
|
|
|
|
|
|
|
|
Gross margin |
|
| 29.8 | % |
|
| 31.3 | % |
|
| 32.9 | % |
|
| 34.4 | % |
COGS Depreciation and amortization |
|
| 0.7 | % |
|
| 0.6 | % |
|
| 0.6 | % |
|
| 0.6 | % |
Adjusted Gross margin |
|
| 30.5 | % |
|
| 32.0 | % |
|
| 33.5 | % |
|
| 35.0 | % |
|
|
|
|
|
|
|
|
|
|
|
|
|
|
|
|
|
Reconciliation of Operating Expenses to Adjusted Operating Expenses: |
|
|
| |||||||||||||
Operating expenses |
| $ | 29.8 |
|
| $ | 28.8 |
|
| $ | 119.3 |
|
| $ | 115.3 |
|
Depreciation and amortization |
|
| 0.9 |
|
|
| 0.9 |
|
|
| 3.8 |
|
|
| 3.8 |
|
Stock-based compensation |
|
| 1.1 |
|
|
| 1.1 |
|
|
| 4.1 |
|
|
| 4.1 |
|
Executive transition |
|
| 0.2 |
|
|
| 0.2 |
|
|
| 0.8 |
|
|
| 0.8 |
|
HQ Relocation |
|
| 0.1 |
|
|
| 0.1 |
|
|
| 0.1 |
|
|
| 0.1 |
|
Transformational initiatives |
|
| - |
|
|
| - |
|
|
| 10.0 |
|
|
| 10.0 |
|
Adjusted Operating expenses |
| $ | 27.5 |
|
| $ | 26.5 |
|
| $ | 100.5 |
|
| $ | 96.5 |
|
| 25
| Enabling the Hyper-Connected World |
|

|
|
|


Thank You