As filed with the Securities and Exchange Commission on [date]
UNITED STATES
SECURITIES AND EXCHANGE COMMISSION
SECURITIES AND EXCHANGE COMMISSION
Washington, D.C. 20549
FORM N-CSR
CERTIFIED SHAREHOLDER REPORT OF REGISTERED
MANAGEMENT INVESTMENT COMPANIES
MANAGEMENT INVESTMENT COMPANIES
Investment Company Act file number 811-09761
Direxion Insurance Trust
(Exact name of registrant as specified in charter)
33 Whitehall Street, 10th Floor
New York, NY 10004
(Address of principal executive offices) (Zip code)
New York, NY 10004
(Address of principal executive offices) (Zip code)
Daniel D. O’Neill
33 Whitehall Street, 10th Floor
New York, NY 10004
(Name and address of agent for service)
33 Whitehall Street, 10th Floor
New York, NY 10004
(Name and address of agent for service)
1-646-572-3390
Registrant’s telephone number, including area code
Registrant’s telephone number, including area code
Date of fiscal year end: December 31, 2006
Date of reporting period: December 31, 2006
Item 1. Report to Stockholders
Letter to Shareholders
February 9, 2007
Dear Shareholders,
The U.S. equity markets enjoyed a volatile but ultimately good year in 2006 as the economy showed resiliency amidst geopolitical risk, appreciation in raw materials and increasing interest rates. Most of the major indexes advanced in the first four months of the year before selling off sharply in May. June and July saw volatility in a sideways market until the markets re-established direction in August and rallied through year-end. The markets shrugged off surging oil prices (which reached a high of $80.64 a barrel on July 14th), and the problems in Iraq and Lebanon and focused instead on the August 8th decision by the Federal Reserve to leave short-terms rates at 5.25%. The decision, the first after 17 consecutive increases since June of 2004, coupled with a decline in oil prices and strong corporate earnings, sparked a rally through year-end.
The S&P 500 reached a multi-year high in 2006, advancing 13.62% and providing a total return of 15.80%. The Dow Jones Industrial Average broke through its all-time high in October, and continued to climb to new all-time highs until the end of the year, and finished with a total return of 19.05%. Although the technology-heavy NASDAQ-100 Index was the laggard, providing a total return of only 6.79%, it was down over 10% in late July and finished the year strongly. The Russell 2000 Index gained 17.00% and provided a total return of 18.37%, besting the S&P 500 for the eighth consecutive year. The Evolution VP Managed All-Cap Fund provided a total return of 12.70% for the year. The Fund had a strong 1st quarter due to substantial exposure to international equities and energy stocks. The sharp sell-offs in May, however, hit these sectors the hardest and the Fund dropped more than the broader market. During the decline, the Fund increased its cash position and its allocation to value-oriented, and small to mid-cap issues. When the market recovered during the 3rd quarter, the Fund lagged a bit due to its defensive posture. However, the value and small-cap tilt of the All-Cap Fund served it well in the 4th quarter as it gained 8.33%.
Inflation concerns, coupled with 0.25% rate increases in January, March, May and June, led to a sell-off in the 10 Year Note and the 30 Year Bond in the first four months of the year and pushed yields higher. However, the Fed decision to leave rates alone and strong foreign buying pushed yields lower and produced an inverted yield curve for most of the second half of the year. The benchmark 10 Year Note finished the year with a yield 4.76%, well below its 2006 high of 5.24% but above where it began the year. The benchmark 30 Year Bond finished the year with a yield 4.81%, well below its 2006 high of 5.31% but above where it began the year. Long-term government bonds provided minimal gains during the year, with the Lehman Brothers 20+ Year Treasury Index gaining less than 1% while the Lehman Brothers US Treasury Inflation Notes Index barely budged. The high yield market generated solid returns in 2006 but experienced substantial volatility. The high yield market benefited as default rates remained near historic lows and debt issuance relative to balance sheet size remained reasonable. The Federal Reserve’s action pressured the market downward in the first part of the year while the Fed’s inaction helped performance in the second half. The Evolution VP Managed Bond Fund gained 2.23% for the year. After declining early in the year, the Fund increased its cash position to over 50%. As the markets rebounded after the Fed inaction in August, the Fund became fully invested, which resulted in a better second half of 2006.
The Dynamic VP HY Bond Fund posted an annual return of 6.21% for 2006. The Fund’s performance in the first half of the year was hindered by a lack of exposure to several sectors in the high yield market and was adversely affected by a period in which the Fund experienced redemptions that led to high transaction costs. Performance improved in the second half of the year as the markets improved and a new portfolio manager restructured the portfolio to improve diversity and liquidity. Additionally, the Fund added an overweight position in the debt of General Motors, which performed well.
As always, we thank you for using Direxion Funds and we look forward to our mutual success.
Best regards,

Daniel O’Neill
Chief Investment Officer
Direxion Insurance Trust
The performance data quoted represents past performance; past performance does not guarantee future results. The investment return and principal value of an investment will fluctuate and an investor’s shares, when redeemed, may be worth more or less than their original cost. Current performance may be higher or lower than the performance data quotes. To obtain performance data current to the most recent month-end, please call, toll-free, 1-800-851-0511.
An investment in any of the Direxion Funds is subject to a number of risks that could affect the value of its shares. It is important that investors closely review and understand these risks before making an investment. Investors considering an investment should consult with the Insurance Company that issued their Contracts, the accompanying variable contract prospectus or their plan sponsor. There may be other restrictions and costs for purchases, sales or exchanges. Investors should read the prospectus carefully for more complete information, including charges, expenses, and additional risks, before investing or sending money.
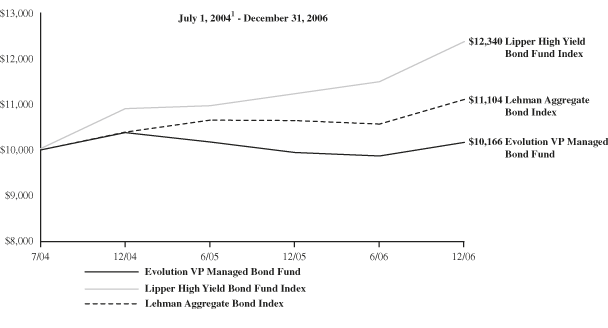
Evolution VP Managed Bond Fund
| Average Annual | ||||||||
| Total Return2 | ||||||||
| Since | ||||||||
| 1 Year | Inception | |||||||
Evolution VP Managed Bond Fund | 2.23% | 0.66% | ||||||
Lehman Aggregate Bond Index | 4.33% | 4.28% | ||||||
Lipper High Yield Bond Fund Index | 10.17% | 8.77% | ||||||
This chart illustrates the performance of a hypothetical $10,000 investment made on the Fund’s inception, and is not intended to imply any future performance. The returns shown do not reflect the deduction of taxes that a shareholder would pay on fund distributions of the redemption of fund shares. The performance of the Lehman Aggregate Bond Index and the Lipper High Yield Bond Fund Index does not reflect the deduction of fees associated with a mutual fund, such as investment management fees. Investors cannot invest directly in an index, although they can invest in its underlying securities. During the period shown, Rafferty Asset Management, LLC, reimbursed fees for various expenses. Had these reimbursements not been in effect, performance would have been lower.
The performance data shown represents past performance and does not guarantee future results.
| 1 | Commencement of operations. |
| 2 | As of December 31, 2006. |
2
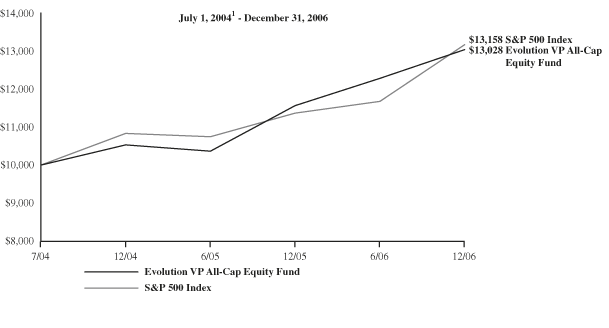
Evolution VP All-Cap Equity Fund
| Average Annual | ||||||||
| Total Return2 | ||||||||
| Since | ||||||||
| 1 Year | Inception | |||||||
Evolution VP All-Cap Equity Fund | 12.70% | 11.15% | ||||||
S&P 500 Index | 15.80% | 11.60% | ||||||
This chart illustrates the performance of a hypothetical $10,000 investment made on the Fund’s inception, and is not intended to imply any future performance. The returns shown do not reflect the deduction of taxes that a shareholder would pay on fund distributions of the redemption of fund shares. The performance of the S&P 500 Index does not reflect the deduction of fees associated with a mutual fund, such as investment management fees. Investors cannot invest directly in an index, although they can invest in its underlying securities. During the period shown, Rafferty Asset Management, LLC, reimbursed fees for various expenses. Had these reimbursements not been in effect, performance would have been lower.
The performance data shown represents past performance and does not guarantee future results.
| 1 | Commencement of operations. |
| 2 | As of December 31, 2006. |
3
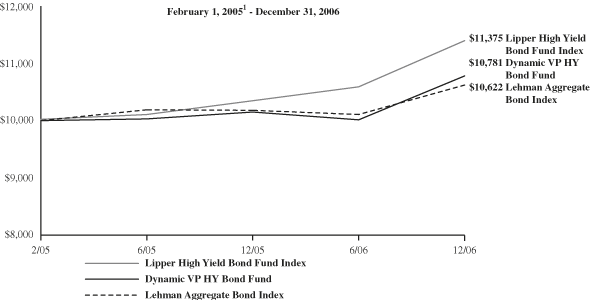
Dynamic VP HY Bond Fund
| Average Annual | ||||||||
| Total Return2 | ||||||||
| Since | ||||||||
| 1 Year | Inception | |||||||
Dynamic VP HY Bond Fund | 6.21% | 4.01% | ||||||
Lehman Aggregate Bond Index | 4.33% | 3.21% | ||||||
Lipper High Yield Bond Fund Index | 10.17% | 6.97% | ||||||
This chart illustrates the performance of a hypothetical $10,000 investment made on the Fund’s inception, and is not intended to imply any future performance. The returns shown do not reflect the deduction of taxes that a shareholder would pay on fund distributions of the redemption of fund shares. The performance of the Lehman Aggregate Bond Index and the Lipper High Yield Bond Fund Index does not reflect the deduction of fees associated with a mutual fund, such as investment management fees. Investors cannot invest directly in an index, although they can invest in its underlying securities. During the period shown, Rafferty Asset Management, LLC, waived and/or recouped fees for various expenses. Had these waivers and/or recoupments not been in effect, performance during the current period would have been lower.
The performance data shown represents past performance and does not guarantee future results.
| 1 | Commencement of operations. |
| 2 | As of December 31, 2006. |
4
Expense Example
December 31, 2006 (Unaudited)
As a shareholder of a mutual fund, you incur two types of costs: (1) transaction costs, including sales charges (loads) on purchase payments, reinvested dividends, or other distributions; redemption fees; and exchange fees; and (2) ongoing costs, including management fees; distribution and/or service fees; and other Fund expenses. This example is intended to help you understand your ongoing costs (in dollars) of investing in the Fund and to compare costs with the ongoing costs of investing in other mutual funds.
The Example is based on an investment of $1,000 invested at the beginning of the period and held the entire period (July 1, 2006 – December 31, 2006).
Actual Expenses
The first line of the table below provides information about actual account values and actual expenses. Although the Fund charges no sales load or transactions fees, you will be assessed fees for outgoing wire transfers, returned checks or stop payment orders at prevailing rates charged by U.S. Bancorp Fund Services, LLC, the Funds’ transfer agent. If you request a redemption be made by wire transfer, currently a $15.00 fee is charged by the Funds’ transfer agent. However, the example below does not include portfolio trading commissions and related expenses or other extraordinary expenses as determined under generally accepted accounting principles. You may use the information in this line, together with the amount you invested, to estimate the expenses that you paid over the period. Simply divide your account value by $1,000 (for example, an $8,600 account value divided by $1,000 = 8.6), then multiply the result by the number in the first line under the heading entitled “Expenses Paid During Period” to estimate the expenses you paid on your account during this period.
Hypothetical Example for Comparison Purposes
The second line of the table below provides information about hypothetical account values and hypothetical expenses based on the Funds’ actual expense ratios and an assumed rate of return of 5% per year before expenses, which is not the Funds’ actual return. The hypothetical account values and expenses may not be used to estimate the actual ending account balance or expenses you paid for the period. You may use this information to compare the ongoing costs of investing in the Funds and other funds. To do so, compare this 5% hypothetical example with the 5% hypothetical examples that appear in the shareholder reports of the other funds.
Please note that the expenses shown in the table are meant to highlight your ongoing costs only and do not reflect any transactional costs, such as wire transfers, returned checks or stop payment orders. Therefore, the second line of the table is useful in comparing ongoing costs only, and will not help you determine the relative costs of owning different funds. In addition, if these transactional costs were included, your costs would have been higher. The tables below do not reflect any fees and expenses imposed under variable annuity contracts and variable life insurance policies (“Contracts”) and certain qualified pension and retirement plans (“Plans”), which would increase overall fees and expenses. Please refer to your Contract or Plan Prospectus for a description of those fees and expenses.
5
Expense Example
December 31, 2006 (Unaudited)
| Evolution VP Managed Bond Fund | ||||||||||||
| Expenses Paid | ||||||||||||
| Beginning | Ending | During Period | ||||||||||
| Account Value | Account Value | July 1, 2006 – | ||||||||||
| July 1, 2006 | December 31, 2006 | December 31, 2006* | ||||||||||
| Actual | $ | 1,000.00 | $ | 1,030.20 | $ | 10.23 | ||||||
| Hypothetical (5% return before expenses) | 1,000.00 | 1,015.12 | 10.16 | |||||||||
| * | Expenses are equal to the Fund’s annualized expense ratio of 2.00%, multiplied by the average account value over the period, multiplied by 184/365 to reflect the one-half year period. |
| Evolution VP All-Cap Equity Fund | ||||||||||||
| Expenses Paid | ||||||||||||
| Beginning | Ending | During Period | ||||||||||
| Account Value | Account Value | July 1, 2006 – | ||||||||||
| July 1, 2006 | December 31, 2006 | December 31, 2006* | ||||||||||
| Actual | $ | 1,000.00 | $ | 1,061.30 | $ | 10.39 | ||||||
| Hypothetical (5% return before expenses) | 1,000.00 | 1,015.12 | 10.16 | |||||||||
| * | Expenses are equal to the Fund’s annualized expense ratio of 2.00%, multiplied by the average account value over the period, multiplied by 184/365 to reflect the one-half year period. |
| Dynamic VP HY Bond Fund | ||||||||||||
| Expenses Paid | ||||||||||||
| Beginning | Ending | During Period | ||||||||||
| Account Value | Account Value | July 1, 2006 – | ||||||||||
| July 1, 2006 | December 31, 2006 | December 31, 2006* | ||||||||||
| Actual | $ | 1,000.00 | $ | 1,076.60 | $ | 8.53 | ||||||
| Hypothetical (5% return before expenses) | 1,000.00 | 1,016.99 | 8.29 | |||||||||
| * | Expenses are equal to the Fund’s annualized expense ratio of 1.63%, multiplied by the average account value over the period, multiplied by 184/365 to reflect the one-half year period. |
6
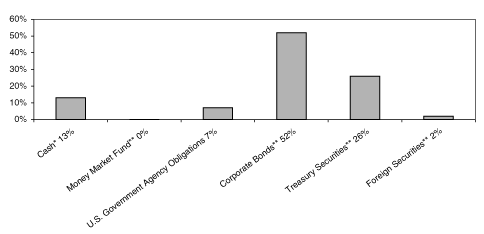
Evolution VP Managed Bond Fund
Allocation of Fund Holdings (Unaudited)
December 31, 2006
Evolution VP All-Cap Equity Fund
Allocation of Fund Holdings (Unaudited)
December 31, 2006
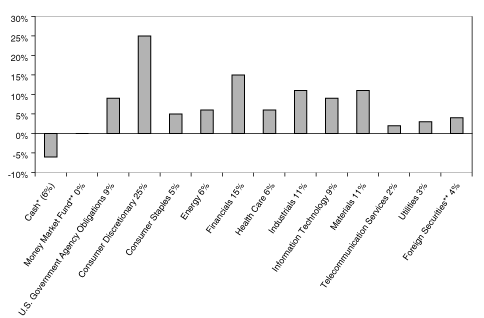
The percentages in these graphs are calculated based on net assets.
* Cash and other assets less liabilities.
** These are investment companies that primarily invest in this category of securities.
7
Dynamic VP HY Bond Fund
Allocation of Fund Holdings (Unaudited)
December 31, 2006
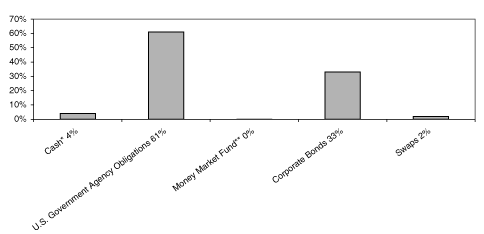
The percentages in these graphs are calculated based on net assets.
* Cash and other assets less liabilities.
** These are investment companies that primarily invest in this category of securities.
8
Evolution VP Managed Bond Fund
Schedule of Investments
December 31, 2006
| Shares | Value | |||||||||
| INVESTMENT COMPANIES - 79.4% | ||||||||||
| 7,806 | Alliance World Dollar Government Fund II | $ | 106,942 | |||||||
| 24,546 | BlackRock Corporate High Yield Fund | 205,450 | ||||||||
| 8,107 | BlackRock Corporate High Yield Fund VI | 106,769 | ||||||||
| 5,929 | BlackRock Floating Rate Income Strategies Fund | 107,137 | ||||||||
| 5,298 | BlackRock Preferred Income Strategies Fund | 107,179 | ||||||||
| 6,247 | Evergreen Managed Income Fund | 106,824 | ||||||||
| 5,005 | Flaherty & Crumrine/ Claymore Preferred Securities Income Fund | 107,157 | ||||||||
| 23,210 | iShares GS $ InvesTop Corporate Bond Fund | 2,476,739 | ||||||||
| 8,571 | iShares Lehman 1-3 Year Treasury Bond Fund | 684,909 | ||||||||
| 16,715 | iShares Lehman 7-10 Year Treasury Bond Fund | 1,378,319 | ||||||||
| 2,472 | iShares Lehman 20+ Year Treasury Bond Fund | 218,722 | ||||||||
| 21,141 | iShares Lehman Aggregate Bond Fund | 2,106,701 | ||||||||
| 10,386 | iShares Lehman Treasury Inflation Protected Securities Fund | 1,026,137 | ||||||||
| 12,502 | MFS Charter Income Trust | 107,017 | ||||||||
| 17,430 | MFS Intermediate Income Trust | 107,020 | ||||||||
| 11,673 | Neuberger Berman Income Opportunity Fund, Inc. | 207,196 | ||||||||
| 14,827 | Nuveen Floating Rate Income Opportunity Fund | 204,761 | ||||||||
| 10,654 | Pioneer Floating Rate Trust | 205,622 | ||||||||
| 32,014 | Putnam Premier Income Trust | 205,850 | ||||||||
| 7,851 | Templeton Emerging Markets Income Fund | 107,245 | ||||||||
| 23,426 | Van Kampen Senior Income Trust | 206,383 | ||||||||
| 5,995 | Western Asset Emerging Markets Debt Fund | 106,891 | ||||||||
| 18,537 | Western Asset High Income Fund II | 205,575 | ||||||||
| 9,241 | Western Asset/ Claymore US Treasury Inflation Protected Securities Fund 2 | 106,918 | ||||||||
| TOTAL INVESTMENT COMPANIES (Cost $10,394,017) | $ | 10,509,463 | ||||||||
| Face | ||||||||||
| Amount | ||||||||||
SHORT-TERM INVESTMENTS - 7.7% | ||||||||||
U.S. GOVERNMENT AGENCY OBLIGATIONS - 7.5% | ||||||||||
| $ | 1,000,000 | Federal Home Loan Bank Discount Note, 4.80%, 01/02/2007 (Cost $1,000,000) | $ | 1,000,000 | ||||||
| Shares | |||||||||||
| MONEY MARKET FUND - 0.2% | |||||||||||
| 24,894 | Federated Prime Obligations Fund - Class I (Cost $24,894) | $ | 24,894 | ||||||||
| TOTAL SHORT-TERM INVESTMENTS | |||||||||||
| (Cost $1,024,894) | $ | 1,024,894 | |||||||||
| TOTAL INVESTMENTS - 87.1% (Cost $11,418,911) | $ | 11,534,357 | |||||||||
| Other Assets in Excess of Liabilities - 12.9% | 1,705,841 | ||||||||||
| TOTAL NET ASSETS - 100.0% | $ | 13,240,198 | |||||||||
Percentages are calculated as a percent of net assets.
See notes to the financial statements.
9
Evolution VP All-Cap Equity Fund
Schedule of Investments
December 31, 2006
| Shares | Value | |||||||||
COMMON STOCKS - 92.8% | ||||||||||
Aerospace & Defense - 2.1% | ||||||||||
| 2,401 | AAR Corp.* | $ | 70,085 | |||||||
| 198 | Alliant Techsystems, Inc.* | 15,482 | ||||||||
| 2,805 | Armor Holdings, Inc.* | 153,854 | ||||||||
| 2,656 | Ceradyne, Inc.* | 150,064 | ||||||||
| 3,804 | Curtiss-Wright Corp. | 141,052 | ||||||||
| 580 | Precision Castparts Corp. | 45,402 | ||||||||
| 575,939 | ||||||||||
Air Freight & Logistics - 0.3% | ||||||||||
| 440 | C.H. Robinson Worldwide, Inc. | 17,992 | ||||||||
| 775 | Expeditors International of Washington, Inc. | 31,387 | ||||||||
| 443 | Ryder System, Inc. | 22,620 | ||||||||
| 71,999 | ||||||||||
Air Transportation, Scheduled - 0.0% | ||||||||||
| 104 | Ryanair Holdings PLC ADR* | 8,476 | ||||||||
Airlines - 0.6% | ||||||||||
| 139 | British Airways PLC ADR* | 14,354 | ||||||||
| 295 | Gol-Linhas Aereas Inteligentes SA ADR | 8,458 | ||||||||
| 16,554 | Mesa Air Group, Inc.* | 141,868 | ||||||||
| 164,680 | ||||||||||
Auto Components - 2.3% | ||||||||||
| 759 | Borg Warner, Inc. | 44,796 | ||||||||
| 17,574 | Cooper Tire & Rubber Co. | 251,308 | ||||||||
| 2,619 | Drew Industries, Inc.* | 68,120 | ||||||||
| 13,958 | Superior Industries International, Inc. | 268,971 | ||||||||
| 633,195 | ||||||||||
Automobiles - 0.7% | ||||||||||
| 5,415 | Ford Motor Co. | 40,667 | ||||||||
| 774 | General Motors Corp. | 23,777 | ||||||||
| 1,845 | Harley-Davidson, Inc. | 130,017 | ||||||||
| 226 | Thor Industries, Inc. | 9,942 | ||||||||
| 204,403 | ||||||||||
Beverages - 1.3% | ||||||||||
| 914 | Anheuser-Busch Companies, Inc. | 44,969 | ||||||||
| 230 | Companhia de Bebidas das Americas ADR | 11,224 | ||||||||
| 246 | Diageo PLC ADR | 19,510 | ||||||||
| 3,431 | Hansen Natural Corp.* | 115,556 | ||||||||
| 2,957 | Pepsi Bottling Group, Inc. | 91,401 | ||||||||
| 1,084 | PepsiCo, Inc. | 67,804 | ||||||||
| 350,464 | ||||||||||
Biotechnology - 1.2% | ||||||||||
| 2,943 | Biogen Idec, Inc.* | 144,766 | ||||||||
| 155 | Gilead Sciences, Inc.* | 10,064 | ||||||||
| 13,117 | Millennium Pharmaceuticals, Inc.* | 142,975 | ||||||||
| 560 | Vertex Pharmaceuticals, Inc.* | 20,955 | ||||||||
| 318,760 | ||||||||||
Building Products - 0.6% | ||||||||||
| 3,337 | Simpson Manufacturing Co., Inc. | 105,616 | ||||||||
| 961 | Universal Forest Products, Inc. | 44,802 | ||||||||
| 150,418 | ||||||||||
Capital Markets - 3.6% | ||||||||||
| 915 | The Bear Stearns Companies, Inc. | 148,944 | ||||||||
| 978 | Eaton Vance Corp. | 32,284 | ||||||||
| 958 | Federated Investors, Inc. | 32,361 | ||||||||
| 299 | Franklin Resources, Inc. | 32,941 | ||||||||
| 799 | The Goldman Sachs Group, Inc. | 159,281 | ||||||||
| 488 | Investment Technology Group, Inc.* | 20,925 | ||||||||
| 1,695 | Jefferies Group, Inc. | 45,460 | ||||||||
| 31,638 | LaBranche & Co., Inc.* | 311,002 | ||||||||
| 1,413 | Morgan Stanley | 115,061 | ||||||||
| 1,130 | SEI Investments Co. | 67,303 | ||||||||
| 965,562 | ||||||||||
Chemicals - 2.2% | ||||||||||
| 112 | Air Products & Chemicals, Inc. | 7,871 | ||||||||
| 1,339 | Arch Chemicals, Inc. | 44,602 | ||||||||
| 1,161 | Ashland, Inc. | 80,318 | ||||||||
See notes to the financial statements.
10
Evolution VP All-Cap Equity Fund
Schedule of Investments (continued)
December 31, 2006
| Shares | Value | |||||||||
COMMON STOCKS - 92.8% (Continued) | ||||||||||
Chemicals - 2.2% (Continued) | ||||||||||
| 2,377 | The Dow Chemical Co. | $ | 94,937 | |||||||
| 792 | E.I. du Pont de Nemours & Co. | 38,578 | ||||||||
| 422 | FMC Corp. | 32,304 | ||||||||
| 419 | Headwaters, Inc.* | 10,039 | ||||||||
| 1,527 | Lyondell Chemical Co. | 39,045 | ||||||||
| 5,306 | OM Group, Inc.* | 240,256 | ||||||||
| 155 | Rohm & Haas Co. | 7,924 | ||||||||
| 102 | Sigma-Aldrich Corp. | 7,927 | ||||||||
| 603,801 | ||||||||||
Commercial Banks - 3.6% | ||||||||||
| 785 | ABN AMRO Holding NV ADR | 25,159 | ||||||||
| 645 | Banco Bradesco SA ADR | 26,026 | ||||||||
| 456 | Bancolombia SA ADR | 14,204 | ||||||||
| 714 | Banco Itau Holding Financeira SA ADR | 25,811 | ||||||||
| 1,573 | Bank Of America Corp. | 83,982 | ||||||||
| 871 | BB&T Corp. | 38,263 | ||||||||
| 2,298 | Central Pacific Financial Corp. | 89,070 | ||||||||
| 134 | Comerica, Inc. | 7,863 | ||||||||
| 949 | Fifth Third Bancorp | 38,843 | ||||||||
| 88 | HSBC Holdings PLC ADR | 8,065 | ||||||||
| 1,032 | KeyCorp | 39,247 | ||||||||
| 631 | M&T Bank Corp. | 77,083 | ||||||||
| 164 | Marshall & Ilsley Corp. | 7,890 | ||||||||
| 1,909 | Mercantile Bankshares Corp. | 89,322 | ||||||||
| 1,632 | Nara Bancorp, Inc. | 34,141 | ||||||||
| 1,064 | National City Corp. | 38,900 | ||||||||
| 1,046 | Regions Financial Corp. | 39,120 | ||||||||
| 457 | SunTrust Banks, Inc. | 38,594 | ||||||||
| 813 | Susquehanna Bancshares, Inc. | 21,853 | ||||||||
| 257 | Synovus Financial Corp. | 7,923 | ||||||||
| 3,037 | Umpqua Holdings Corp. | 89,379 | ||||||||
| 156 | Unibanco - Uniao de Bancos Brasileiros SA ADR | 14,502 | ||||||||
| 1,076 | US Bancorp | 38,940 | ||||||||
| 676 | Wachovia Corp. | 38,498 | ||||||||
| 1,083 | Wells Fargo & Co. | 38,511 | ||||||||
| 971,189 | ||||||||||
Commercial Services & Supplies - 1.2% | ||||||||||
| 398 | Career Education Corp.* | 9,862 | ||||||||
| 1,892 | Gevity HR, Inc. | 44,821 | ||||||||
| 427 | H&R Block, Inc. | 9,838 | ||||||||
| 223 | ITT Educational Services, Inc.* | 14,801 | ||||||||
| 226 | John H. Harland Co. | 11,345 | ||||||||
| 2,292 | Kelly Services, Inc. - Class A | 66,330 | ||||||||
| 2,012 | Korn/ Ferry International* | 46,196 | ||||||||
| 3,637 | Labor Ready, Inc.* | 66,666 | ||||||||
| 1,460 | Sotheby’s | 45,289 | ||||||||
| 315,148 | ||||||||||
Communications Equipment - 0.8% | ||||||||||
| 234 | Black Box Corp. | 9,826 | ||||||||
| 450 | Comtech Telecommunications Corp.* | 17,132 | ||||||||
| 2,000 | Corning, Inc.* | 37,420 | ||||||||
| 322 | Motorola, Inc. | 6,620 | ||||||||
| 319 | Plantronics, Inc. | 6,763 | ||||||||
| 174 | QUALCOMM, Inc. | 6,575 | ||||||||
| 16,023 | UTStarcom, Inc.* | 140,201 | ||||||||
| 224,537 | ||||||||||
Computers & Peripherals - 0.8% | ||||||||||
| 384 | Dell, Inc.* | 9,635 | ||||||||
| 584 | Komag, Inc.* | 22,122 | ||||||||
| 532 | Lexmark International, Inc. - Class A* | 38,942 | ||||||||
| 2,184 | Logitech International SA*^ | 62,441 | ||||||||
| 152 | SanDisk Corp.* | 6,541 | ||||||||
| 247 | Synaptics, Inc.* | 7,333 | ||||||||
| 3,225 | Western Digital Corp.* | 65,984 | ||||||||
| 212,998 | ||||||||||
Construction & Engineering - 0.5% | ||||||||||
| 3,368 | URS Corp.* | 144,319 | ||||||||
Construction Materials - 0.5% | ||||||||||
| 763 | Cemex SAB de C.V. ADR* | 25,850 | ||||||||
| 907 | Florida Rock Industries, Inc. | 39,046 | ||||||||
| 1,081 | Texas Industries, Inc. | 69,433 | ||||||||
| 134,329 | ||||||||||
See notes to the financial statements.
11
Evolution VP All-Cap Equity Fund
Schedule of Investments (continued)
December 31, 2006
| Shares | Value | |||||||||
COMMON STOCKS - 92.8% (Continued) | ||||||||||
Consumer Finance - 0.2% | ||||||||||
| 960 | World Acceptance Corp.* | $ | 45,072 | |||||||
Containers & Packaging - 0.0% | ||||||||||
| 133 | Aptargroup, Inc. | 7,852 | ||||||||
Distributors - 0.5% | ||||||||||
| 3,496 | Building Materials Holding Corp. | 86,316 | ||||||||
| 821 | Genuine Parts Co. | 38,940 | ||||||||
| 125,256 | ||||||||||
Electric Utilities - 1.2% | ||||||||||
| 518 | Allegheny Energy, Inc. | 23,781 | ||||||||
| 528 | Companhia Energetica de Minas Gerais ADR | 25,450 | ||||||||
| 1,252 | Companhia Paranaense de Energia-Copel ADR | 13,747 | ||||||||
| 1,817 | E.ON AG ADR | 82,110 | ||||||||
| 377 | FirstEnergy Corp. | 22,733 | ||||||||
| 808 | Hawaiian Electric Industries, Inc. | 21,937 | ||||||||
| 625 | Korea Electric Power Corp. ADR | 14,194 | ||||||||
| 563 | OGE Energy Corp. | 22,520 | ||||||||
| 407 | TXU Corp. | 22,063 | ||||||||
| 1,500 | WPS Resources Corp. | 81,045 | ||||||||
| 329,580 | ||||||||||
Electrical Equipment - 0.3% | ||||||||||
| 3,590 | ABB Ltd. ADR | 64,548 | ||||||||
| 220 | Hubbell, Inc. - Class B | 9,946 | ||||||||
| 74,494 | ||||||||||
Electronic Equipment & Instruments - 3.0% | ||||||||||
| 12,107 | Aeroflex, Inc.* | 141,894 | ||||||||
| 2,102 | Arrow Electronics, Inc.* | 66,318 | ||||||||
| 2,598 | Avnet, Inc.* | 66,327 | ||||||||
| 151 | Canon, Inc. ADR | 8,545 | ||||||||
| 4,199 | CTS Corp. | 65,924 | ||||||||
| 274 | Daktronics, Inc. | 10,097 | ||||||||
| 218 | Flir Systems, Inc.* | 6,939 | ||||||||
| 6,821 | Newport Corp.* | 142,900 | ||||||||
| 21,872 | Vishay Intertechnology, Inc.* | 296,147 | ||||||||
| 805,091 | ||||||||||
Energy Equipment & Services - 3.4% | ||||||||||
| 860 | Cameron International Corp.* | 45,623 | ||||||||
| 789 | Dril-Quip, Inc.* | 30,897 | ||||||||
| 161 | Enel SpA ADR | 8,308 | ||||||||
| 1,524 | Helmerich & Payne, Inc. | 37,292 | ||||||||
| 609 | Hydril* | 45,791 | ||||||||
| 1,233 | Nabors Industries Ltd.^* | 36,719 | ||||||||
| 1,362 | Oceaneering International, Inc.* | 54,071 | ||||||||
| 5,977 | Patterson-UTI Energy, Inc. | 138,846 | ||||||||
| 1,441 | SEACOR Holdings, Inc.* | 142,861 | ||||||||
| 1,108 | Smith International, Inc. | 45,506 | ||||||||
| 802 | Tetra Technologies, Inc.* | 20,515 | ||||||||
| 1,472 | Tidewater, Inc. | 71,186 | ||||||||
| 2,936 | Unit Corp.* | 142,249 | ||||||||
| 848 | Veritas DGC, Inc.* | 72,614 | ||||||||
| 947 | W-H Energy Services, Inc.* | 46,109 | ||||||||
| 938,587 | ||||||||||
Financial Services - 0.8% | ||||||||||
| 699 | Citigroup, Inc. | 38,934 | ||||||||
| 509 | ING Groep NV ADR | 22,483 | ||||||||
| 805 | JPMorgan Chase & Co. | 38,882 | ||||||||
| 2,852 | Leucadia National Corp. | 80,426 | ||||||||
| 393 | Principal Financial Group, Inc. | 23,069 | ||||||||
| 203,794 | ||||||||||
Food & Staples Retailing - 0.9% | ||||||||||
| 9,023 | Nash Finch Co. | 246,328 | ||||||||
Food Products - 1.1% | ||||||||||
| 1,441 | ConAgra Foods, Inc. | 38,907 | ||||||||
| 390 | General Mills, Inc. | 22,464 | ||||||||
| 1,702 | H.J. Heinz Co. | 76,607 | ||||||||
| 1,634 | The J.M. Smucker Co. | 79,200 | ||||||||
| 1,201 | Ralcorp Holdings, Inc.* | 61,119 | ||||||||
| 242 | Tootsie Roll Industries, Inc. | 7,913 | ||||||||
| 286,210 | ||||||||||
See notes to the financial statements.
12
Evolution VP All-Cap Equity Fund
Schedule of Investments (continued)
December 31, 2006
| Shares | Value | |||||||||
COMMON STOCKS - 92.8% (Continued) | ||||||||||
Gas Utilities - 0.4% | ||||||||||
| 959 | Nicor, Inc. | $ | 44,881 | |||||||
| 2,366 | WGL Holdings, Inc. | 77,084 | ||||||||
| 121,965 | ||||||||||
Health Care Equipment & Supplies - 0.2% | ||||||||||
| 673 | ResMed, Inc.* | 33,125 | ||||||||
| 328 | Stryker Corp. | 18,076 | ||||||||
| 51,201 | ||||||||||
Health Care Providers & Services - 1.8% | ||||||||||
| 278 | AMERIGROUP Corp.* | 9,977 | ||||||||
| 455 | AmSurg Corp. - Class A* | 10,465 | ||||||||
| 197 | Coventry Health Care, Inc.* | 9,860 | ||||||||
| 211 | Health Net, Inc.* | 10,267 | ||||||||
| 319 | Laboratory Corp of America Holdings* | 23,437 | ||||||||
| 1,325 | Matria Healthcare, Inc.* | 38,067 | ||||||||
| 300 | McKesson Corp. | 15,210 | ||||||||
| 316 | Pharmaceutical Product Development, Inc. | 10,182 | ||||||||
| 864 | Quest Diagnostics, Inc. | 45,792 | ||||||||
| 646 | Sierra Health Services, Inc.* | 23,282 | ||||||||
| 4,700 | Sunrise Senior Living, Inc.* | 144,384 | ||||||||
| 1,954 | UnitedHealth Group, Inc. | 104,988 | ||||||||
| 1,021 | VCA Antech, Inc.* | 32,866 | ||||||||
| 478,777 | ||||||||||
Health Care Technology - 0.1% | ||||||||||
| 551 | IMS Health, Inc. | 15,141 | ||||||||
Hotels Restaurants & Leisure - 1.8% | ||||||||||
| 4,166 | Bob Evans Farms, Inc. | 142,561 | ||||||||
| 723 | Boyd Gaming Corp. | 32,759 | ||||||||
| 509 | Brinker International, Inc. | 15,351 | ||||||||
| 314 | Ctrip.com International Ltd. ADR | 19,619 | ||||||||
| 647 | IHOP Corp. | 34,097 | ||||||||
| 1,922 | Marriott International, Inc. - Class A | 91,718 | ||||||||
| 178 | McDonald’s Corp. | 7,891 | ||||||||
| 1,114 | Papa John’s International, Inc.* | 32,317 | ||||||||
| 2,501 | Ruby Tuesday, Inc. | 68,627 | ||||||||
| 557 | Yum! Brands, Inc. | 32,752 | ||||||||
| 477,692 | ||||||||||
Household Durables - 7.6% | ||||||||||
| 642 | American Greetings Corp. - Class A | 15,324 | ||||||||
| 3,062 | Beazer Homes USA, Inc. | 143,945 | ||||||||
| 269 | Centex Corp. | 15,137 | ||||||||
| 4,234 | D.R. Horton, Inc. | 112,159 | ||||||||
| 7,462 | Hovnanian Enterprises, Inc. - Class A* | 252,962 | ||||||||
| 2,191 | Lennar Corp. | 114,940 | ||||||||
| 20,818 | Libbey, Inc. | 256,894 | ||||||||
| 6,593 | M/ I Homes, Inc. | 251,787 | ||||||||
| 3,190 | Matsushita Electric Industrial Co. Ltd. ADR | 64,087 | ||||||||
| 3,734 | MDC Holdings, Inc. | 213,025 | ||||||||
| 217 | Meritage Homes Corp.* | 10,355 | ||||||||
| 75 | NVR, Inc.* | 48,375 | ||||||||
| 2,386 | Ryland Group, Inc. | 130,323 | ||||||||
| 13,788 | Standard-Pacific Corp. | 369,381 | ||||||||
| 2,089 | Toll Brothers, Inc.* | 67,328 | ||||||||
| 2,066,022 | ||||||||||
Household Products - 1.2% | ||||||||||
| 351 | Colgate-Palmolive Co. | 22,899 | ||||||||
| 223 | Energizer Holdings, Inc.* | 15,831 | ||||||||
| 576 | Kimberly-Clark Corp. | 39,139 | ||||||||
| 23,329 | Spectrum Brands, Inc.* | 254,286 | ||||||||
| 332,155 | ||||||||||
Insurance - 5.0% | ||||||||||
| 760 | Aegon NV ADR | 14,402 | ||||||||
| 697 | Allianz AG ADR | 14,233 | ||||||||
| 227 | China Life Insurance Company Ltd. ADR | 11,449 | ||||||||
| 1,692 | Chubb Corp. | 89,524 | ||||||||
| 1,018 | Cincinnati Financial Corp. | 46,126 | ||||||||
| 3,942 | LandAmerica Financial Group, Inc. | 248,780 | ||||||||
| 1,828 | Mercury General Corp. | 96,390 | ||||||||
| 660 | Old Republic International Corp. | 15,365 | ||||||||
See notes to the financial statements.
13
Evolution VP All-Cap Equity Fund
Schedule of Investments (continued)
December 31, 2006
| Shares | Value | |||||||||
COMMON STOCKS - 92.8% (Continued) | ||||||||||
Insurance - 5.0% (Continued) | ||||||||||
| 140 | RLI Corp. | $ | 7,899 | |||||||
| 2,376 | Safety Insurance Group, Inc. | 120,487 | ||||||||
| 783 | Selective Insurance Group, Inc. | 44,858 | ||||||||
| 1,665 | The St. Paul Travelers Companies, Inc. | 89,394 | ||||||||
| 5,848 | Stewart Information Services Corp. | 253,569 | ||||||||
| 348 | Torchmark Corp. | 22,188 | ||||||||
| 12,119 | UnumProvident Corp. | 251,833 | ||||||||
| 929 | W.R. Berkley Corp. | 32,060 | ||||||||
| 1,358,557 | ||||||||||
Internet & Catalog Retail - 0.0% | ||||||||||
| 763 | PetMed Express, Inc.* | 10,186 | ||||||||
Internet Software & Services - 0.7% | ||||||||||
| 68 | Baidu.com, Inc. ADR* | 7,665 | ||||||||
| 167 | Bankrate, Inc.* | 6,338 | ||||||||
| 14 | Google, Inc.* | 6,447 | ||||||||
| 245 | j2 Global Communications, Inc.* | 6,676 | ||||||||
| 11,410 | United Online, Inc. | 151,525 | ||||||||
| 187 | WebEx Communications, Inc.* | 6,524 | ||||||||
| 272 | Websense, Inc.* | 6,210 | ||||||||
| 258 | Yahoo!, Inc.* | 6,589 | ||||||||
| 197,974 | ||||||||||
IT Services - 0.8% | ||||||||||
| 131 | Cognizant Technology Solutions Corp. - Class A* | 10,108 | ||||||||
| 6,084 | Convergys Corp.* | 144,678 | ||||||||
| 1,382 | eFunds Corp.* | 38,005 | ||||||||
| 555 | Mantech International Corp. - Class A* | 20,441 | ||||||||
| 213,232 | ||||||||||
Leisure Equipment & Products - 1.4% | ||||||||||
| 3,004 | Brunswick Corp. | 95,828 | ||||||||
| 10,088 | Jakks Pacific, Inc.* | 220,322 | ||||||||
| 4,830 | Nautilus Group, Inc. | 67,620 | ||||||||
| 170 | Polaris Industries, Inc. | 7,961 | ||||||||
| 391,731 | ||||||||||
Life Science Tools & Services - 0.1% | ||||||||||
| 607 | Applera Corp - Applied Biosystems Group | 22,271 | ||||||||
Machinery - 3.9% | ||||||||||
| 470 | Albany International Corp. - Class A | 15,468 | ||||||||
| 727 | Barnes Group, Inc. | 15,812 | ||||||||
| 2,891 | Briggs & Stratton Corp. | 77,912 | ||||||||
| 1,057 | Crane Co. | 38,728 | ||||||||
| 400 | Cummins, Inc. | 47,272 | ||||||||
| 1,189 | Gardner Denver, Inc.* | 44,362 | ||||||||
| 804 | Graco, Inc. | 31,854 | ||||||||
| 880 | Illinois Tool Works, Inc. | 40,647 | ||||||||
| 3,448 | Ingersoll-Rand Company Ltd. - Class A^ | 134,920 | ||||||||
| 798 | Joy Global, Inc. | 38,575 | ||||||||
| 2,640 | Kaydon Corp. | 104,914 | ||||||||
| 2,487 | Lincoln Electric Holdings, Inc. | 150,265 | ||||||||
| 357 | The Manitowoc Company, Inc. | 21,217 | ||||||||
| 489 | Paccar, Inc. | 31,736 | ||||||||
| 872 | Parker Hannifin Corp. | 67,039 | ||||||||
| 1,805 | Reliance Steel & Aluminum Co. | 71,081 | ||||||||
| 249 | SPX Corp. | 15,229 | ||||||||
| 1,533 | Timken Co. | 44,733 | ||||||||
| 1,824 | Watts Water Technologies, Inc. - Class A | 74,985 | ||||||||
| 1,066,749 | ||||||||||
Manufacturing - 0.0% | ||||||||||
| 123 | The Procter & Gamble Co. | 7,905 | ||||||||
Media - 1.6% | ||||||||||
| 536 | Comcast Corp. - Class A* | 22,689 | ||||||||
| 2,891 | Entercom Communications Corp. - Class A | 81,468 | ||||||||
| 116 | Focus Media Holding Ltd. ADR* | 7,701 | ||||||||
| 1,315 | Gannett Co., Inc. | 79,505 | ||||||||
| 287 | Harte-Hanks, Inc. | 7,953 | ||||||||
See notes to the financial statements.
14
Evolution VP All-Cap Equity Fund
Schedule of Investments (continued)
December 31, 2006
| Shares | Value | |||||||||
COMMON STOCKS - 92.8% (Continued) | ||||||||||
Media - 1.6% (Continued) | ||||||||||
| 473 | The McGraw-Hill Companies, Inc. | $ | 32,173 | |||||||
| 212 | Media General, Inc. - Class A | 7,880 | ||||||||
| 431 | Omnicom Group, Inc. | 45,057 | ||||||||
| 6,561 | Time Warner, Inc. | 142,899 | ||||||||
| 603 | Valassis Communications, Inc.* | 8,744 | ||||||||
| 1,475 | Westwood One, Inc. | 10,414 | ||||||||
| 446,483 | ||||||||||
Medical Devices - 0.2% | ||||||||||
| 605 | Intuitive Surgical, Inc.* | 58,020 | ||||||||
Metals & Mining - 7.5% | ||||||||||
| 2,702 | A.M. Castle & Co. | 68,766 | ||||||||
| 1,061 | Allegheny Technologies, Inc. | 96,211 | ||||||||
| 900 | Carpenter Technology Corp. | 92,268 | ||||||||
| 1,638 | Century Aluminum Co.* | 73,137 | ||||||||
| 1,582 | Chaparral Steel Co. | 70,035 | ||||||||
| 2,472 | Commercial Metals Co. | 63,778 | ||||||||
| 473 | Companhia Siderurgica Nacional SA ADR | 14,181 | ||||||||
| 517 | Compania de Minas Buenaventura SA ADR | 14,507 | ||||||||
| 2,013 | Consol Energy, Inc. | 64,678 | ||||||||
| 896 | Freeport-McMoRan Copper & Gold, Inc. - Class B | 49,934 | ||||||||
| 889 | Gerdau SA ADR | 14,216 | ||||||||
| 448 | Gold Fields Ltd. ADR | 8,458 | ||||||||
| 520 | Harmony Gold Mining Co. Ltd. ADR* | 8,190 | ||||||||
| 3,933 | Nucor Corp. | 214,978 | ||||||||
| 520 | Peabody Energy Corp. | 21,013 | ||||||||
| 1,347 | Phelps Dodge Corp. | 161,263 | ||||||||
| 1,160 | POSCO ADR* | 95,897 | ||||||||
| 2,641 | Quanex Corp. | 91,352 | ||||||||
| 338 | Rio Tinto PLC ADR | 71,822 | ||||||||
| 506 | RTI International Metals, Inc.* | 39,579 | ||||||||
| 2,922 | Ryerson Tull, Inc. | 73,313 | ||||||||
| 5,643 | Steel Dynamics, Inc. | 183,115 | ||||||||
| 18,310 | Steel Technologies, Inc. | 321,341 | ||||||||
| 1,891 | United States Steel Corp. | 138,308 | ||||||||
| 2,050,340 | ||||||||||
Multiline Retail - 0.7% | ||||||||||
| 2,876 | Dillard’s, Inc. - Class A | 100,574 | ||||||||
| 492 | Dollar General Corp. | 7,902 | ||||||||
| 535 | Family Dollar Stores, Inc. | 15,692 | ||||||||
| 566 | J.C. Penney Co., Inc. | 43,786 | ||||||||
| 323 | Kohl’s Corp.* | 22,103 | ||||||||
| 138 | Target Corp. | 7,873 | ||||||||
| 197,930 | ||||||||||
Multi-Utilities & Unregulated Power - 1.6% | ||||||||||
| 1,975 | The AES Corp.* | 43,529 | ||||||||
| 852 | Avista Corp. | 21,564 | ||||||||
| 1,145 | Duke Energy Corp. | 38,025 | ||||||||
| 3,484 | MDU Resources Group, Inc. | 89,330 | ||||||||
| 1,811 | ONEOK, Inc. | 78,090 | ||||||||
| 2,210 | SCANA Corp. | 89,770 | ||||||||
| 1,430 | Sempra Energy | 80,137 | ||||||||
| 440,445 | ||||||||||
Oil & Gas - 2.7% | ||||||||||
| 919 | BG Group PLC ADR | 62,896 | ||||||||
| 754 | Cabot Oil & Gas Corp. | 45,730 | ||||||||
| 639 | Chevron Corp. | 46,986 | ||||||||
| 982 | China Petroleum & Chemical Corp. ADR | 90,972 | ||||||||
| 213 | ENI SpA ADR | 14,331 | ||||||||
| 153 | EOG Resources, Inc. | 9,555 | ||||||||
| 4,142 | Frontier Oil Corp. | 119,041 | ||||||||
| 427 | Hess Corp. | 21,166 | ||||||||
| 498 | Marathon Oil Corp. | 46,065 | ||||||||
| 2,066 | Norsk Hydro ASA ADR | 63,364 | ||||||||
| 311 | Occidental Petroleum Corp. | 15,186 | ||||||||
| 797 | Overseas Shipholding Group, Inc. | 44,871 | ||||||||
| 558 | PetroChina Company Ltd. ADR | 78,555 | ||||||||
| 624 | Petroleo Brasileiro SA ADR | 64,266 | ||||||||
| 114 | Royal Dutch Shell PLC ADR | 8,070 | ||||||||
| 199 | Total SA ADR | 14,312 | ||||||||
| 745,366 | ||||||||||
Paper & Forest Products - 0.2% | ||||||||||
| 233 | Aracruz Celulose SA ADR | 14,269 | ||||||||
| 729 | Votorantim Celulose e Papel SA ADR | 14,296 | ||||||||
See notes to the financial statements.
15
Evolution VP All-Cap Equity Fund
Schedule of Investments (continued)
December 31, 2006
| Shares | Value | |||||||||
COMMON STOCKS - 92.8% (Continued) | ||||||||||
Paper & Forest Products - 0.2% (Continued) | ||||||||||
| 551 | Weyerhaeuser Co. | $ | 38,928 | |||||||
| 67,493 | ||||||||||
Personal Products - 0.1% | ||||||||||
| 367 | Alberto-Culver Co. | 7,872 | ||||||||
| 369 | The Estee Lauder Companies, Inc. | 15,063 | ||||||||
| 22,935 | ||||||||||
Pharmaceuticals - 2.5% | ||||||||||
| 365 | AstraZeneca PLC ADR | 19,546 | ||||||||
| 449 | Bradley Pharmaceuticals, Inc.* | 9,240 | ||||||||
| 1,505 | Bristol-Myers Squibb Co. | 39,612 | ||||||||
| 1,339 | Elan Corp. PLC ADR* | 19,750 | ||||||||
| 299 | Forest Laboratories, Inc.* | 15,129 | ||||||||
| 1,266 | Genzyme Corp.* | 77,960 | ||||||||
| 161 | GlaxoSmithKline PLC ADR | 8,494 | ||||||||
| 3,069 | Johnson & Johnson | 202,615 | ||||||||
| 610 | King Pharmaceuticals, Inc.* | 9,711 | ||||||||
| 1,408 | Merck & Co., Inc. | 61,389 | ||||||||
| 741 | Mylan Laboratories | 14,790 | ||||||||
| 1,483 | Pfizer, Inc. | 38,410 | ||||||||
| 183 | Sanofi-Aventis ADR | 8,449 | ||||||||
| 6,330 | Sciele Pharma, Inc.* | 151,920 | ||||||||
| 677,015 | ||||||||||
Real Estate Investment Trusts - 0.5% | ||||||||||
| 1,191 | AMB Property Corp. | 69,805 | ||||||||
| 672 | Archstone-Smith Trust | 39,117 | ||||||||
| 479 | Equity Office Properties Trust | 23,073 | ||||||||
| 131,995 | ||||||||||
Road & Rail - 0.8% | ||||||||||
| 1,023 | Con-way, Inc. | 45,053 | ||||||||
| 1,550 | Kansas City Southern* | 44,919 | ||||||||
| 1,433 | Landstar System, Inc. | 54,712 | ||||||||
| 1,378 | Norfolk Southern Corp. | 69,300 | ||||||||
| 213,984 | ||||||||||
Semiconductor & Semiconductor Equipment - 1.9% | ||||||||||
| 2,095 | Advanced Energy Industries, Inc.* | 39,533 | ||||||||
| 350 | Altera Corp.* | 6,888 | ||||||||
| 3,374 | Atmel Corp.* | 20,413 | ||||||||
| 48,500 | Credence Systems Corp.* | 252,200 | ||||||||
| 133 | KLA-Tencor Corp. | 6,617 | ||||||||
| 129 | Lam Research Corp.* | 6,530 | ||||||||
| 219 | Linear Technology Corp. | 6,640 | ||||||||
| 219 | Maxim Integrated Products, Inc. | 6,706 | ||||||||
| 163 | MEMC Electronic Materials, Inc.* | 6,380 | ||||||||
| 3,584 | Micrel, Inc.* | 38,636 | ||||||||
| 520 | Microsemi Corp.* | 10,218 | ||||||||
| 1,442 | National Semiconductor Corp. | 32,733 | ||||||||
| 1,890 | Supertex, Inc.* | 74,183 | ||||||||
| 231 | Texas Instruments, Inc. | 6,653 | ||||||||
| 514,330 | ||||||||||
Software - 1.3% | ||||||||||
| 552 | Adobe Systems, Inc.* | 22,698 | ||||||||
| 159 | ANSYS, Inc.* | 6,915 | ||||||||
| 164 | Autodesk, Inc.* | 6,635 | ||||||||
| 1,457 | BMC Software, Inc.* | 46,915 | ||||||||
| 1,056 | Intuit, Inc.* | 32,219 | ||||||||
| 1,083 | Microsoft Corp. | 32,338 | ||||||||
| 2,326 | Oracle Corp.* | 39,868 | ||||||||
| 468 | Quality Systems, Inc. | 17,442 | ||||||||
| 1,078 | Secure Computing Corp.* | 7,072 | ||||||||
| 439 | Sonic Solutions, Inc.* | 7,156 | ||||||||
| 4,443 | THQ, Inc.* | 144,486 | ||||||||
| 363,744 | ||||||||||
Specialty Retail - 6.1% | ||||||||||
| 1,480 | American Eagle Outfitters, Inc. | 46,191 | ||||||||
| 671 | AnnTaylor Stores Corp.* | 22,036 | ||||||||
| 2,751 | Bed Bath & Beyond, Inc.* | 104,813 | ||||||||
| 656 | Best Buy Co, Inc. | 32,269 | ||||||||
| 1,280 | CarMax, Inc.* | 68,646 | ||||||||
| 5,064 | Chico’s FAS, Inc.* | 104,774 | ||||||||
| 2,717 | Claire’s Stores, Inc. | 90,041 | ||||||||
| 3,947 | Dress Barn, Inc.* | 92,084 | ||||||||
| 1,783 | Genesco, Inc.* | 66,506 | ||||||||
| 1,370 | Group 1 Automotive, Inc. | 70,856 | ||||||||
| 1,501 | Guitar Center, Inc.* | 68,235 | ||||||||
See notes to the financial statements.
16
Evolution VP All-Cap Equity Fund
Schedule of Investments (continued)
December 31, 2006
| Shares | Value | |||||||||
COMMON STOCKS - 92.8% (Continued) | ||||||||||
Specialty Retail - 6.1% (Continued) | ||||||||||
| 555 | Gymboree Corp.* | $ | 21,179 | |||||||
| 1,417 | Haverty Furniture Cos., Inc. | 20,972 | ||||||||
| 3,779 | The Home Depot, Inc. | 151,765 | ||||||||
| 10,379 | Jo-Ann Stores, Inc.* | 255,323 | ||||||||
| 3,377 | Lowe’s Companies, Inc. | 105,194 | ||||||||
| 1,775 | Men’s Wearhouse, Inc. | 67,912 | ||||||||
| 4,188 | Pacific Sunwear of California, Inc.* | 82,001 | ||||||||
| 158 | The Sherwin-Williams Co. | 10,046 | ||||||||
| 3,913 | Staples, Inc. | 104,477 | ||||||||
| 4,939 | Stein Mart, Inc. | 65,491 | ||||||||
| 1,650,811 | ||||||||||
Telecommunication Services - 1.9% | ||||||||||
| 1,111 | AT&T, Inc. | 39,718 | ||||||||
| 180 | CenturyTel, Inc. | 7,859 | ||||||||
| 241 | China Netcom Group Corporation Ltd. ADR | 12,898 | ||||||||
| 5,811 | China Unicom Ltd. ADR | 86,526 | ||||||||
| 0.12 | Chunghwa Telecom Company Ltd. ADR | 2 | ||||||||
| 554 | KT Corp. ADR | 14,044 | ||||||||
| 1,322 | Philippine Long Distance Telephone Co. ADR | 67,594 | ||||||||
| 5,340 | Qwest Communications International, Inc.* | 44,696 | ||||||||
| 4,168 | Tele Norte Leste Participacoes SA ADR | 62,187 | ||||||||
| 2,497 | Telecomunicacoes De Sao Paulo ADR | 63,998 | ||||||||
| 2,658 | Telefonos de Mexico SA de CV ADR | 75,115 | ||||||||
| 190 | Telekomunikasi Indonesia Tbk PT ADR | 8,664 | ||||||||
| 1,060 | Verizon Communications, Inc. | 39,474 | ||||||||
| 522,775 | ||||||||||
Textiles, Apparel & Luxury Goods - 1.8% | ||||||||||
| 3,190 | Coach, Inc.* | 137,042 | ||||||||
| 302 | Jones Apparel Group, Inc. | 10,096 | ||||||||
| 906 | Nike, Inc. - Class B | 89,721 | ||||||||
| 1,130 | Polo Ralph Lauren Corp. | 87,756 | ||||||||
| 2,210 | Skechers U.S.A., Inc. - Class A* | 73,615 | ||||||||
| 322 | Timberland Co.* | 10,169 | ||||||||
| 96 | VF Corp. | 7,880 | ||||||||
| 2,425 | Wolverine World Wide, Inc. | 69,161 | ||||||||
| 485,440 | ||||||||||
Thrifts & Mortgage Finance - 1.4% | ||||||||||
| 636 | Fannie Mae | 37,772 | ||||||||
| 13,894 | First Niagara Financial Group, Inc. | 206,465 | ||||||||
| 568 | Freddie Mac | 38,567 | ||||||||
| 490 | New York Community Bancorp, Inc. | 7,889 | ||||||||
| 835 | Radian Group, Inc. | 45,015 | ||||||||
| 857 | Washington Mutual, Inc. | 38,985 | ||||||||
| 374,693 | ||||||||||
Tobacco - 0.5% | ||||||||||
| 713 | Altria Group, Inc. | 61,190 | ||||||||
| 495 | Reynolds American, Inc. | 32,408 | ||||||||
| 956 | UST, Inc. | 55,639 | ||||||||
| 149,237 | ||||||||||
Trading Companies & Distributors - 0.6% | ||||||||||
| 5,993 | Applied Industrial Technologies, Inc. | 157,676 | ||||||||
Wireless Telecommunication Services - 0.2% | ||||||||||
| 437 | America Movil SA de CV ADR, Series L | 19,761 | ||||||||
| 107 | OAO Vimpel-Communications ADR* | 8,448 | ||||||||
| 418 | Tim Participacoes SA ADR | 14,471 | ||||||||
| 307 | Vodafone Group PLC ADR | 8,528 | ||||||||
| 51,208 | ||||||||||
| TOTAL COMMON STOCKS (Cost $23,836,835) | $ | 25,245,959 | ||||||||
INVESTMENT COMPANIES - 3.8% | ||||||||||
| 6,131 | iShares S&P Latin American 40 Index Fund (Cost $898,411) | $ | 1,041,841 | |||||||
See notes to the financial statements.
17
Evolution VP All-Cap Equity Fund
Schedule of Investments (continued)
December 31, 2006
| Face | ||||||||||
| Amount | Value | |||||||||
SHORT-TERM INVESTMENTS - 9.2% | ||||||||||
U.S. GOVERNMENT AGENCY OBLIGATIONS - 8.9% | ||||||||||
| $ | 2,401,000 | Federal Home Loan Bank Discount Note, 4.80%, 01/02/2007 (Cost $2,401,000) | $ | 2,401,000 | ||||||
| Shares | ||||||||||
MONEY MARKET FUND - 0.3% | ||||||||||
| 86,001 | Federated Prime Obligations Fund - Class I (Cost $86,001) | $ | 86,001 | |||||||
| TOTAL SHORT-TERM INVESTMENTS (Cost $2,487,001) | $ | 2,487,001 | ||||||||
| TOTAL INVESTMENTS - 105.8% (Cost $27,222,247) | $ | 28,774,801 | ||||||||
| Liabilities in Excess of Other Assets - (5.8)% | (1,570,914 | ) | ||||||||
| TOTAL NET ASSETS - 100.0% | $ | 27,203,887 | ||||||||
Percentages are calculated as a percent of net assets.
ADR American Depository Receipt
| * | Non-income producing security. |
| ^ | Foreign security trading on U.S. exchange. |
See notes to the financial statements.
18
Dynamic VP HY Bond Fund
Schedule of Investments
December 31, 2006
| Face | ||||||||||
| Amount | Value | |||||||||
CORPORATE BONDS — 33.4% | ||||||||||
Auto Components - 1.1% | ||||||||||
| $ | 500,000 | Goodyear Tire & Rubber Co., 9.14%, 12/01/2009 (Cost $495,138; Acquired 11/16/2006) (1)(2) | $ | 504,375 | ||||||
Automobiles - 9.4% | ||||||||||
| 1,500,000 | General Motors Corp. 7.125%, 07/15/2013 | 1,411,875 | ||||||||
| 3,000,000 | General Motors Corp. 8.375%, 07/15/2033 | 2,775,000 | ||||||||
| 4,186,875 | ||||||||||
Grantor Trust - 22.0% | ||||||||||
| 9,600,000 | TRAINS High Yield Note, 4.455%, 05/01/2016 (Cost $9,444,500; Acquired 06/30/2006, 07/06/2006 and 08/28/2006) (1)(2) | 9,804,000 | ||||||||
Health Care Providers & Services - 0.4% | ||||||||||
| 100,000 | HCA, Inc. 6.25%, 02/15/2013 | 88,750 | ||||||||
| 100,000 | Tenet Healthcare Corp. 7.375%, 02/01/2013 | 92,375 | ||||||||
| 181,125 | ||||||||||
IT Services - 0.2% | ||||||||||
| 100,000 | Sungard Data Systems, Inc. 9.125%, 08/15/2013 | 105,500 | ||||||||
Transportation Equipment - 0.3% | ||||||||||
| 2,742,000 | Dura Operating Corp. Series B 9.00%, 05/01/2009 (EUR) (Cost $146,611; Acquired 11/28/2006) (3) | 108,587 | ||||||||
| 390,000 | Dura Operating Corp. Series D 9.00%, 05/01/2009 (Cost $15,984; Acquired 11/28/2006) (3) | 17,550 | ||||||||
| 126,137 | ||||||||||
| TOTAL CORPORATE BONDS (Cost $14,336,450) | $ | 14,908,012 | ||||||||
SHORT-TERM INVESTMENTS - 60.7% U.S. GOVERNMENT AGENCY OBLIGATIONS - 60.4% | ||||||||||
| $ | 9,004,000 | Federal Farm Credit Discount Note, 4.925%, 01/02/2007 (Cost $9,004,000) | $ | 9,004,000 | ||||||
| 9,004,000 | Federal Home Loan Bank Discount Note, 4.80%, 01/02/2007 (Cost $9,004,000) | 9,004,000 | ||||||||
| 9,004,000 | Tennessee Valley Authority Discount Note, 4.722%, 01/02/2007 (Cost $9,004,000) | 9,004,000 | ||||||||
| TOTAL U.S. GOVERNMENT AGENCY OBLIGATIONS (Cost $27,012,000) | $ | 27,012,000 | ||||||||
| Shares | ||||||||||
MONEY MARKET FUND - 0.3% | ||||||||||
| 149,516 | Federated Prime Obligations Fund - Class I (Cost $149,516) | $ | 149,516 | |||||||
| TOTAL SHORT-TERM INVESTMENTS (Cost $27,161,516) | $ | 27,161,516 | ||||||||
| TOTAL INVESTMENTS - 94.1% (Cost $41,497,966) | $ | 42,069,528 | ||||||||
| Other Assets in Excess of Liabilities - 5.9% | 2,635,685 | |||||||||
| TOTAL NET ASSETS - 100.0% | $ | 44,705,213 | ||||||||
Percentages are Calculated as a percent of net assets
See notes to the financial statements.
19
Dynamic VP HY Bond Fund
Schedule of Investments (continued)
December 31, 2006
| (1) | 144A securities are those that are exempt from registration under Rule 144A of the Securities Act of 1933, as amended. These securities are generally issued to qualified institutional buyers (“QIBs”), such as the Fund. Any resale of these securities must generally be effected through a sale that is exempt from registration (e.g. a sale to another QIB), or the security must be registered for public sale. At December 31, 2006, the market value of 144A securities was $10,308,375 or 23.1% of net assets. |
| (2) | The coupon rate shown on variable rate securities represents rates on December 31, 2006. |
| (3) | Security in default. |
CURRENCY ABBREVIATION
EUR - European Euro
Schedule of Credit Default Swaps
December 31, 2006
| Buy/Sell | Pay/Receive | Notional | Expiration | Unrealized | ||||||||||||||||||
| Counterparty | Reference Entity | Protection | Fixed Rate | Amount | Date | Appreciation | ||||||||||||||||
| Bank of America | Dow Jones CDX: North American High Yield 100 6th Index, Effective: 03/28/2006 | Sell | 3.45% | $ | 7,920,000 | 6/20/2011 | $ | 207,587 | ||||||||||||||
| North American High Yield 100 7th Index, Effective: 09/28/2006 | Sell | 3.25% | 10,000,000 | 12/20/2011 | 34,930 | |||||||||||||||||
| Bear Stearns | Dow Jones CDX: North American High Yield 100 6th Index, Effective: 03/28/2006 | Sell | 3.45% | 990,000 | 6/20/2011 | 43,119 | ||||||||||||||||
| North American High Yield 100 7th Index, Effective: 09/28/2006 | Sell | 3.25% | 3,000,000 | 12/20/2011 | 14,229 | |||||||||||||||||
| Morgan Stanley | Dow Jones CDX: North American High Yield 100 6th Index, Effective: 03/28/2006 | Sell | 3.45% | 14,850,000 | 6/20/2011 | 569,435 | ||||||||||||||||
| $ | 36,760,000 | $ | 869,300 | |||||||||||||||||||
See notes to the financial statements.
20
Statements Of Assets and Liabilities
December 31, 2006
| Evolution VP Managed | Evolution VP All-Cap | Dynamic VP HY | ||||||||||||
| Bond Fund | Equity Fund | Bond Fund | ||||||||||||
Assets: | ||||||||||||||
| Investments, at market value (Note 2) | $ | 11,534,357 | $ | 28,774,801 | $ | 42,069,528 | ||||||||
| Receivable for investments sold | 3,137,350 | 1,484,548 | — | |||||||||||
| Receivable for Fund shares sold | 87,495 | 58,255 | 154,725 | |||||||||||
| Unrealized appreciation on swaps (includes up-front fees of $444,057 for Dynamic VP HY Bond Fund) | — | — | 1,313,357 | |||||||||||
| Deposit at broker for swaps | — | — | 810,000 | |||||||||||
| Dividends and interest receivable | 51,740 | 45,901 | 481,939 | |||||||||||
| Other assets | 1,447 | 1,580 | 1,278 | |||||||||||
| Total Assets | 14,812,389 | 30,365,085 | 44,830,827 | |||||||||||
| Liabilities: | ||||||||||||||
| Payable for investments purchased | 1,511,192 | 3,072,615 | — | |||||||||||
| Payable for Fund shares redeemed | 3,694 | 6,247 | 1,086 | |||||||||||
| Payable to Custodian | 525 | 1,935 | 36,532 | |||||||||||
| Payable to Adviser | 11,497 | 29,225 | 29,345 | |||||||||||
| Accrued distribution expense | 2,834 | 5,816 | 10,267 | |||||||||||
| Accrued expenses and other liabilities | 42,449 | 45,360 | 48,384 | |||||||||||
| Total Liabilities | 1,572,191 | 3,161,198 | 125,614 | |||||||||||
Net Assets | $ | 13,240,198 | $ | 27,203,887 | $ | 44,705,213 | ||||||||
Net Assets Consist Of: | ||||||||||||||
| Capital stock | $ | 13,124,566 | $ | 24,967,474 | $ | 44,047,503 | ||||||||
| Accumulated undistributed net investment income | 347,303 | 78,969 | 389,504 | |||||||||||
| Accumulated undistributed net realized gain (loss) | (347,117 | ) | 604,890 | (1,172,656 | ) | |||||||||
| Net unrealized appreciation | 115,446 | 1,552,554 | 1,440,862 | |||||||||||
| Total Net Assets | $ | 13,240,198 | $ | 27,203,887 | $ | 44,705,213 | ||||||||
Calculation of Net Asset Value Per Share: | ||||||||||||||
| Net assets | $ | 13,240,198 | $ | 27,203,887 | $ | 44,705,213 | ||||||||
| Shares outstanding (unlimited shares of beneficial interest authorized, no par value) | 662,033 | 1,058,061 | 2,187,966 | |||||||||||
| Net asset value, redemption price and offering price per share | $ | 20.00 | $ | 25.71 | $ | 20.43 | ||||||||
| Cost of Investments | $ | 11,418,911 | $ | 27,222,247 | $ | 41,497,966 | ||||||||
See notes to the financial statements.
21
Statements of Operations
For the Year Ended December 31, 2006
| Evolution VP Managed | Evolution VP All-Cap | |||||||||
| Bond Fund | Equity Fund | |||||||||
Investment income: | ||||||||||
| Dividend income (net of foreign withholding tax of $0 and $10,900, respectively) | $ | 383,259 | $ | 332,758 | ||||||
| Interest income | 85,686 | 111,474 | ||||||||
| Total investment income | 468,945 | 444,232 | ||||||||
Expenses: | ||||||||||
| Investment advisory fees | 90,395 | 181,984 | ||||||||
| Distribution expenses | 22,599 | 45,496 | ||||||||
| Administration fees | 17,636 | 17,586 | ||||||||
| Shareholder servicing fees | 28,083 | 46,246 | ||||||||
| Fund accounting fees | 21,659 | 32,279 | ||||||||
| Custody fees | 4,114 | 6,446 | ||||||||
| Professional fees | 31,800 | 34,399 | ||||||||
| Reports to shareholders | 11,206 | 11,491 | ||||||||
| Federal and state registration fees | 143 | 280 | ||||||||
| Directors’ fees and expenses | 477 | 477 | ||||||||
| Other | 2,312 | 4,098 | ||||||||
| Total expenses before reimbursement | 230,424 | 380,782 | ||||||||
| Less: Reimbursement of expenses by Adviser | (49,690 | ) | (16,813 | ) | ||||||
| Total expenses | 180,734 | 363,969 | ||||||||
Net investment income | 288,211 | 80,263 | ||||||||
Realized and unrealized gain (loss) on investments: | ||||||||||
| Net realized gain (loss) on: | ||||||||||
| Investments | (177,068 | ) | 810,725 | |||||||
| Swaps | 65,072 | — | ||||||||
| Securities sold short | — | 995 | ||||||||
| Capital gain distributions from investment companies | 1,522 | — | ||||||||
| (110,474 | ) | 811,720 | ||||||||
| Change in unrealized appreciation (depreciation) on: | ||||||||||
| Investments | 95,186 | 1,121,731 | ||||||||
| Net realized and unrealized gain (loss) on investments | (15,288 | ) | 1,933,451 | |||||||
Net increase in net assets resulting from operations | $ | 272,923 | $ | 2,013,714 | ||||||
See notes to the financial statements.
22
Statements of Operations
For the Year Ended December 31, 2006
| Dynamic VP HY | ||||||
| Bond Fund | ||||||
Investment income: | ||||||
| Interest income | $ | 2,251,021 | ||||
| Total investment income | 2,251,021 | |||||
Expenses: | ||||||
| Investment advisory fees | 262,732 | |||||
| Distribution expenses | 210,186 | |||||
| Administration fees | 17,586 | |||||
| Shareholder servicing fees | 11,308 | |||||
| Fund accounting fees | 20,444 | |||||
| Custody fees | 11,604 | |||||
| Professional fees | 38,784 | |||||
| Reports to shareholders | 12,052 | |||||
| Directors’ fees and expenses | 684 | |||||
| Other | 4,334 | |||||
| Total expenses before waiver/recoupment | 589,714 | |||||
| Less: Waiver of expenses by Distributor | (31,396 | ) | ||||
| Plus: Recoupment of expenses by Adviser | 28,879 | |||||
| Total expenses | 587,197 | |||||
Net investment income | 1,663,824 | |||||
Realized and unrealized gain (loss) on investments: | ||||||
| Net realized gain (loss) on: | ||||||
| Investments | (753,690 | ) | ||||
| Futures | 490,852 | |||||
| Swaps | 210,681 | |||||
| (52,157 | ) | |||||
| Change in unrealized appreciation (depreciation) on: | ||||||
| Investments | 328,192 | |||||
| Swaps | 869,300 | |||||
| 1,197,492 | ||||||
| Net realized and unrealized gain on investments | 1,145,335 | |||||
Net increase in net assets resulting from operations | $ | 2,809,159 | ||||
See notes to the financial statements.
23
Statements of Changes in Net Assets
| Evolution VP Managed Bond Fund | Evolution VP All-Cap Equity Fund | |||||||||||||||||
| Year Ended | Year Ended | Year Ended | Year Ended | |||||||||||||||
| December 31, 2006 | December 31, 2005 | December 31, 2006 | December 31, 2005 | |||||||||||||||
Operations: | ||||||||||||||||||
| Net investment income | $ | 288,211 | $ | 75,851 | $ | 80,263 | $ | 4,328 | ||||||||||
| Net realized gain (loss) on investments | (110,474 | ) | (177,509 | ) | 811,720 | 150,428 | ||||||||||||
| Change in unrealized appreciation (depreciation) on investments | 95,186 | 13,903 | 1,121,731 | 375,021 | ||||||||||||||
| Net increase (decrease) in net assets resulting from operations | 272,923 | (87,755 | ) | 2,013,714 | 529,777 | |||||||||||||
Distributions to shareholders: | ||||||||||||||||||
| Net investment income | (30,745 | ) | (52,933 | ) | (4,381 | ) | — | |||||||||||
| Net realized gains | — | (6,352 | ) | (358,497 | ) | — | ||||||||||||
| Total distributions | (30,745 | ) | (59,285 | ) | (362,878 | ) | — | |||||||||||
Capital share transactions: | ||||||||||||||||||
| Proceeds from shares sold | 10,112,920 | 3,759,605 | 19,734,601 | 6,819,351 | ||||||||||||||
| Proceeds from shares issued to holders in reinvestment of distributions | 30,745 | 59,285 | 362,878 | — | ||||||||||||||
| Cost of shares redeemed | (1,342,210 | ) | (228,836 | ) | (2,524,896 | ) | (412,583 | ) | ||||||||||
| Net increase in net assets resulting from capital share transactions | 8,801,455 | 3,590,054 | 17,572,583 | 6,406,768 | ||||||||||||||
Total increase in net assets | 9,043,633 | 3,443,014 | 19,223,419 | 6,936,545 | ||||||||||||||
Net assets: | ||||||||||||||||||
| Beginning of period | 4,196,565 | 753,551 | 7,980,468 | 1,043,923 | ||||||||||||||
| End of period | $ | 13,240,198 | $ | 4,196,565 | $ | 27,203,887 | $ | 7,980,468 | ||||||||||
Accumulated undistributed net investment income, end of period | $ | 347,303 | $ | 30,703 | $ | 78,969 | $ | 4,313 | ||||||||||
See notes to the financial statements.
24
Statements of Changes in Net Assets
| Dynamic VP HY Bond Fund | ||||||||||
| Year Ended | February 1, 20051 | |||||||||
| December 31, 2006 | to December 31, 2005 | |||||||||
Operations: | ||||||||||
| Net investment income | $ | 1,663,824 | $ | 730,025 | ||||||
| Net realized loss on investments | (52,157 | ) | (815,194 | ) | ||||||
| Change in unrealized appreciation (depreciation) on investments | 1,197,492 | 243,370 | ||||||||
| Net increase in net assets resulting from operations | 2,809,159 | 158,201 | ||||||||
Distributions to shareholders: | ||||||||||
| Net investment income | (1,883,085 | ) | (426,565 | ) | ||||||
| Total distributions | (1,883,085 | ) | (426,565 | ) | ||||||
Capital share transactions: | ||||||||||
| Proceeds from shares sold | 139,777,384 | 111,694,991 | ||||||||
| Proceeds from shares issued to holders in reinvestment of distributions | 1,883,085 | 426,565 | ||||||||
| Cost of shares redeemed | (133,025,705 | ) | (76,708,817 | ) | ||||||
| Net increase in net assets resulting from capital share transactions | 8,634,764 | 35,412,739 | ||||||||
Total increase in net assets | 9,560,838 | 35,144,375 | ||||||||
Net assets: | ||||||||||
| Beginning of period | 35,144,375 | — | ||||||||
| End of period | $ | 44,705,213 | $ | 35,144,375 | ||||||
Accumulated undistributed net investment income, end of period | $ | 389,504 | $ | 303,460 | ||||||
1 Commencement of operations.
See notes to the financial statements.
25
Financial Highlights
| Evolution VP Managed Bond Fund | ||||||||||||||
| Year Ended | Year Ended | July 1, 20041 | ||||||||||||
| December 31, 2006 | December 31, 2005 | to December 31, 2004 | ||||||||||||
Per share data: | ||||||||||||||
Net asset value, beginning of period | $ | 19.61 | $ | 20.76 | $ | 20.00 | ||||||||
Income (loss) from investment operations: | ||||||||||||||
Net investment income4 | 0.63 | 0.67 | 6 | 0.32 | ||||||||||
| Net realized and unrealized gain (loss) on investments | (0.19 | ) | (1.54 | ) | 0.44 | |||||||||
| Total from investment operations | 0.44 | (0.87 | ) | 0.76 | ||||||||||
Less distributions: | ||||||||||||||
| Dividends from net investment income | (0.05 | ) | (0.25 | ) | — | |||||||||
| Distributions from realized gains | — | (0.03 | ) | — | ||||||||||
| Total distributions | (0.05 | ) | (0.28 | ) | — | |||||||||
Net asset value, end of period | $ | 20.00 | $ | 19.61 | $ | 20.76 | ||||||||
Total return8 | 2.23% | (4.19)% | 3.80% | 2 | ||||||||||
Supplemental data and ratios: | ||||||||||||||
| Net assets, end of period | $ | 13,240,198 | $ | 4,196,565 | $ | 753,551 | ||||||||
| Ratio of net expenses to average net assets excluding short dividends: | ||||||||||||||
| Before expense reimbursement/recoupment | 2.55% | 4.69% | 23.17% | 3 | ||||||||||
| After expense reimbursement/recoupment | 2.00% | 2.00% | 2.00% | 3 | ||||||||||
| Ratio of net expenses to average net assets including short dividends: | ||||||||||||||
| Before expense reimbursement/recoupment | — | 4.93% | — | |||||||||||
| After expense reimbursement/recoupment | — | 2.24% | — | |||||||||||
| Ratio of net investment income (loss) to average net assets including short dividends: | ||||||||||||||
| Before expense reimbursement/recoupment | 2.64% | 0.68% | (17.98)% | 3 | ||||||||||
| After expense reimbursement/recoupment | 3.19% | 3.37% | 7 | 3.19% | 3 | |||||||||
Portfolio turnover rate5 | 954% | 978% | 7% | |||||||||||
| 1 | Commencement of operations. |
| 2 | Not annualized. |
| 3 | Annualized. |
| 4 | Net investment income (loss) per share represents net investment income (loss) divided by the daily average shares of beneficial interest outstanding throughout each period. |
| 5 | Portfolio turnover ratio is calculated without regard to short-term securities having a maturity of less than one year. Investments in options, swaps, futures contracts and repurchase agreements are deemed short-term securities. The Fund’s aggressive investment strategy may result in significant portfolio turnover to take advantage of anticipated changes in market conditions. |
| 6 | Net investment income (loss) before dividends on short positions for the year ended December 31, 2005 was $0.72 for the Evolution VP Managed Bond Fund. |
| 7 | The net investment income (loss) ratio included dividends on short positions. The ratio excluding dividends on short positions for the year ended December 31, 2005 was 3.60% for the Evolution VP Managed Bond Fund. |
| 8 | All returns reflect reinvested dividends, if any, but do not reflect the impact of taxes or any fees and expenses imposed under the Contracts and Plans, which would increase overall fees and expenses. Please refer to your Contract or Plan prospectus for a description of those fees and expenses. |
See notes to the financial statements.
26
Financial Highlights
| Evolution VP All-Cap Equity Fund | ||||||||||||||
| Year Ended | Year Ended | July 1, 20041 | ||||||||||||
| December 31, 2006 | December 31, 2005 | to December 31, 2004 | ||||||||||||
Per share data: | ||||||||||||||
Net asset value, beginning of period | $ | 23.12 | $ | 21.06 | $ | 20.00 | ||||||||
Income (loss) from investment operations: | ||||||||||||||
Net investment income (loss)4 | 0.11 | 0.03 | (0.15 | ) | ||||||||||
| Net realized and unrealized gain on investments | 2.83 | 2.03 | 1.21 | |||||||||||
| Total from investment operations | 2.94 | 2.06 | 1.06 | |||||||||||
Less distributions: | ||||||||||||||
| Dividends from net investment income | (0.00 | )6 | — | — | ||||||||||
| Distributions from realized gains | (0.35 | ) | — | — | ||||||||||
| Total distributions | (0.35 | ) | — | — | ||||||||||
Net asset value, end of period | $ | 25.71 | $ | 23.12 | $ | 21.06 | ||||||||
Total return7 | 12.70% | 9.78% | 5.30% | 2 | ||||||||||
Supplemental data and ratios: | ||||||||||||||
| Net assets, end of period | $ | 27,203,887 | $ | 7,980,468 | $ | 1,043,923 | ||||||||
| Ratio of net expenses to average net assets: | ||||||||||||||
| Before expense reimbursement/recoupment | 2.09% | 3.84% | 20.13% | 3 | ||||||||||
| After expense reimbursement/recoupment | 2.00% | 2.00% | 2.00% | 3 | ||||||||||
| Ratio of net investment income (loss) to average net assets: | ||||||||||||||
| Before expense reimbursement/recoupment | 0.35% | (1.72)% | (19.66)% | 3 | ||||||||||
| After expense reimbursement/recoupment | 0.44% | 0.12% | (1.53)% | 3 | ||||||||||
Portfolio turnover rate5 | 909% | 1,001% | 2% | |||||||||||
| 1 | Commencement of operations. |
| 2 | Not annualized. |
| 3 | Annualized. |
| 4 | Net investment income (loss) per share represents net investment income (loss) divided by the daily average shares of beneficial interest outstanding throughout each period. |
| 5 | Portfolio turnover ratio is calculated without regard to short-term securities having a maturity of less than one year. Investments in options, swaps, futures contracts and repurchase agreements are deemed short-term securities. The Fund’s aggressive investment strategy may result in significant portfolio turnover to take advantage of anticipated changes in market conditions. |
| 6 | Amount less than $0.005 per share. |
| 7 | All returns reflect reinvested dividends, if any, but do not reflect the impact of taxes or any fees and expenses imposed under the Contracts and Plans, which would increase overall fees and expenses. Please refer to your Contract or Plan prospectus for a description of those fees and expenses. |
See notes to the financial statements.
27
Financial Highlights
| Dynamic VP HY Bond Fund | ||||||||||
| Year Ended | February 1, 20051 | |||||||||
| December 31, 20067 | to December 31, 2005 | |||||||||
Per share data: | ||||||||||
Net asset value, beginning of period | $ | 20.05 | $ | 20.00 | ||||||
Income (loss) from investment operations: | ||||||||||
Net investment income (loss)4 | 0.96 | 0.90 | ||||||||
| Net realized and unrealized gain (loss) on investments | 0.27 | (0.60 | ) | |||||||
| Total from investment operations | 1.23 | 0.30 | ||||||||
Less distributions: | ||||||||||
| Dividends from net investment income | (0.85 | ) | (0.25 | ) | ||||||
| Total distributions | (0.85 | ) | (0.25 | ) | ||||||
Net asset value, end of period | $ | 20.43 | $ | 20.05 | ||||||
Total return6 | 6.21% | 1.50% | 2 | |||||||
Supplemental data and ratios: | ||||||||||
| Net assets, end of period | $ | 44,705,213 | $ | 35,144,375 | ||||||
| Ratio of net expenses to average net assets: | ||||||||||
| Before expense waiver/recoupment | 1.68% | 1.94% | 3 | |||||||
| After expense waiver/recoupment | 1.67% | 1.74% | 3 | |||||||
| Ratio of net investment income (loss) to average net assets: | ||||||||||
| Before expense waiver/recoupment | 4.74% | 4.78% | 3 | |||||||
| After expense waiver/recoupment | 4.75% | 4.98% | 3 | |||||||
Portfolio turnover rate5 | 538% | 654% | ||||||||
| 1 | Commencement of operations. |
| 2 | Not annualized. |
| 3 | Annualized. |
| 4 | Net investment income (loss) per share represents net investment income (loss) divided by the daily average shares of beneficial interest outstanding throughout each period. |
| 5 | Portfolio turnover ratio is calculated without regard to short-term securities having a maturity of less than one year. Investments in options, swaps, futures contracts and repurchase agreements are deemed short-term securities. The Fund’s aggressive investment strategy may result in significant portfolio turnover to take advantage of anticipated changes in market conditions. |
| 6 | All returns reflect reinvested dividends, if any, but do not reflect the impact of taxes or any fees and expenses imposed under the Contracts and Plans, which would increase overall fees and expenses. Please refer to your Contract or Plan prospectus for a description of those fees and expenses. |
| 7 | Dynamic VP HY Bond Fund’s sub-advisory agreement with Transamerica Investment Services, Inc. was terminated July 1, 2006. |
See notes to the financial statements.
28
Direxion Insurance Trust (Formerly Potomac Insurance Trust)
Notes to the Financial Statements
December 31, 2006
| 1. | ORGANIZATION |
Direxion Insurance Trust (the “Trust”) was organized as a Massachusetts business trust on December 28, 1999 and is registered under the Investment Company Act of 1940, as amended (the “1940 Act”), as an open-end management investment company issuing its shares in series, each series representing a distinct portfolio with its own investment objective and policies. The series presently in operation are the Evolution VP Managed Bond Fund, the Evolution VP All-Cap Equity Fund (formerly the Evolution VP Managed Equity Fund), and the Dynamic VP HY Bond Fund (each a “Fund” and collectively, the “Funds”). Each Fund is a “non-diversified” series of the Trust pursuant to the 1940 Act. The Trust offers shares to unaffiliated life insurance separate accounts (registered as unit investment trusts under the 1940 Act) to fund the benefits under variable annuity and variable life contracts. The Evolution VP Managed Bond Fund and Evolution VP All-Cap Equity Fund commenced operations on July 1, 2004. The Dynamic VP HY Bond Fund commenced operations on February 1, 2005.
The objective of the Evolution VP Managed Bond Fund is to seek the highest appreciation on an annual basis consistent with a high tolerance for risk by investing at least 80% of its assets (plus any borrowing for investment purposes) in fixed-income securities indirectly through securities that invest in or are a derivative of fixed-income securities, including exchange traded funds (“ETFs”) and closed-end investment companies (collectively, fixed-income securities). The objective of the Evolution VP All-Cap Equity Fund is to seek the highest appreciation on an annual basis consistent with a high tolerance for risk by investing at least 80% of its assets (plus any borrowing for investment purposes) in equity securities either directly through individual stocks and American Depository Receipts (“ADRs”) or indirectly through securities that invest in or are a derivative of equity securities. The objective of the Dynamic VP HY Bond Fund is to maximize total return (income plus capital appreciation) by investing primarily in debt instruments, including convertible securities, and derivatives of such instruments, with an emphasis on lower-quality debt instruments.
| 2. | SIGNIFICANT ACCOUNTING POLICIES |
The following is a summary of significant accounting policies consistently followed by the Funds in the preparation of their financial statements. These policies are in conformity with U.S. generally accepted accounting principles.
a) Investment Valuation – Equity securities, OTC securities, swap agreements, closed-end investment companies, options, futures, and options on futures are valued at their last sales price, or if not available, the average of the last bid and asked prices. Securities primarily traded on the NASDAQ National Market are valued using the NASDAQ Official Closing Price (“NOCP”). Short-term debt securities with a maturity of 60 days or less and money market securities are valued using the amortized cost method. Other debt securities are valued by using the closing bid and asked prices provided by the Funds’ pricing service or, if such services are unavailable, by a pricing matrix method. Securities for which reliable market quotations are not readily available, the Funds’ pricing service does not provide a valuation for such securities, the Funds’ pricing service provides valuation that in the judgment of Rafferty Asset Managements, LLC (the “Adviser”) does not represent fair value, or the Fund or Adviser believes the market price is stale will be fair valued as determined by the Adviser under the supervision of the Board of Trustees.
b) Repurchase Agreements – Each Fund may enter into repurchase agreements with institutions that are members of the Federal Reserve System or securities dealers who are members of a national securities exchange or are primary dealers in U.S. government securities. In connection with transactions in repurchase agreements, it is the Trust’s policy that the Fund receives, as collateral, cash and/or securities (primarily U.S. government securities) whose market value, including accrued interest, at all times will be at least equal to 100% of the amount invested by the Fund in each
29
repurchase agreement. If the seller defaults, and the value of the collateral declines, realization of the collateral by the Fund may be delayed or limited.
c) Swap Contracts – Each Fund may enter into equity swap contacts. Standard swap contracts are between two parties that agree to exchange the returns (or differentials in rates of return) earned or realized on particular predetermined investments or instruments. The gross amount to be exchanged is calculated with respect to a “notional amount” (i.e. the return on or increase in value of a particular dollar amount invested in a “basket” of securities representing a particular index or industry sector). The Fund’s obligations are accrued daily (offset by any amounts owed to the funds.)
In a “long” swap agreement, the counterparty will generally agree to pay the Funds the amount, if any, by which the notional amount of swap contract would have increased in value if the Funds had been invested in the particular securities, plus dividends that would have been received on those securities. The Funds will agree to pay the counterparty a floating rate of interest on the notional amount of the swap contract plus the amount, if any, by which the notional amount would have decreased in value had it been invested in such securities plus, in certain instances, commissions or trading spreads on the notional amounts. Thus, the return on the swap contract should be the gain or loss on the notional amount plus dividends on the securities less the interest paid by the Fund on the notional amount. Payments may be made at the conclusion of the contract or periodically during its term. Swap contracts do not include the delivery of securities or other underlying securities. The net amount of the excess, if any, of the Fund’s obligations over its entitlement with respect to each swap is accrued on a daily basis and an amount of cash or liquid assets, having an aggregate net asset value at least equal to such accrued excess is maintained in a segregated account by the Fund’s custodian. Until a swap contract is settled in cash, the gain or loss on the notional amount plus dividends on the securities less the interest paid by the Funds on the notional amount are recorded as “unrealized gains or losses on swaps and futures” and when cash is exchanged, the gain or loss is recorded as “realized gains or losses on swaps and futures.” Swap contracts are collateralized by the securities and cash of each particular Fund.
Each Fund may enter into swap contracts that provide the opposite return of the particular benchmark or security (“short” the index or security). The operations are similar to that of the swaps disclosed above except that the counterparty pays interest to the Fund on the notional amount outstanding and the dividends on the underlying securities reduce the value of the swap, plus, in certain instances, the Fund will agree to pay to the counterparty commissions or trading spreads on the notional amount. These amounts are netted with any unrealized appreciation or depreciation to determine the value of the swap.
The Dynamic VP HY Bond Fund may enter into credit default swaps. In a credit default swap, one party makes a stream of payments to another party in exchange for the right to receive a specified return in the event of a default by a referenced entity, typically corporate issues on its obligation. The stream of payments is recorded as an unrealized gain or loss and adjusted to include up-front payments recorded as a component of unrealized gain or loss on swaps, and/or interest associated with the agreement until the swap is sold or expires, at which point it is recognized as a component of realized gain or loss. The Fund may use the swaps to attempt to gain exposure to debt securities without actually purchasing those securities or to hedge a position. The Fund may purchase credit protection on the referenced entity of the credit default swap (“Buy Contract”) or provide credit protection on the referenced entity of the credit default swap (“Sale Contract”). If a credit event occurs, the maximum payout amount for a sale contract is limited to the notional amount of the swap contract (“Maximum Payout Amount”). At December 31, 2006, the Dynamic VP HY Bond Fund has Sale Credit Default Swap Contracts outstanding with Maximum Payout Amounts aggregating $36,760,000 with three counterparties, with net unrealized appreciation of $869,300, and terms of 5 years, as reflected in the Schedule of Credit Default Swaps, which is part of the schedule of investments. Maximum Payout Amounts could be offset by the subsequent sale, if any, of assets obtained via the execution of a payout event.
Swap contracts involve, to varying degrees, elements of market risk and exposure to loss in excess of the amount reflected in the Statements of Assets and Liabilities. The notional amounts reflect the extent of the total investment exposure that each Fund has under the swap contract. The primary risks associated with the use of swap agreements
30
are imperfect correlation between movements in the notional amount and the price of the underlying securities and the inability of counterparties to perform. A Fund bears the risk of loss of the amount expected to be received under a swap contract in the event of default or bankruptcy of a swap contract counterparty.
d) Concentration of Risk – Dynamic VP HY Bond Fund invests in TRAINS (Targeted Return Securities Trust) High Yield Notes (“TRAINS”), which represent trusts of pooled investments. The TRAINS invest in a portfolio of high-yield debt securities, rated below investment grade and therefore have greater credit and liquidity risk than investment grade obligations. The high yield debt securities are generally unsecured and may be subordinated to other obligations of the issuer thereof. Upon a downgrade of an underlying securities rating to a specified level, the TRAINS may distribute the respective security on a pro-rata basis to the respective holders. The TRAINS may also invest in one or more interest rate swap or other swap transactions.
Dynamic VP HY Bond Fund invests in credit default swaps that utilize the Dow Jones CDX High Yield Note (“CDX”) as the underlying investment. The CDX invests in a portfolio of credit default swap agreements and a repurchase agreement. Credit default swap agreements involve commitments to pay/receive a fixed interest rate in exchange for receipt/payment of the referenced obligation if a credit event affecting the referenced obligation occurs. The CDX is providing credit protection to the counterparties of the respective credit default swap agreements in exchange for a fixed interest rate payment, therefore there is credit risk with respect to the referenced entities of these credit default swap agreements. If a credit event occurs to a referenced entity, the Fund’s principal amount in the CDX will be reduced by its pro-rata interest in the respective credit default swap agreement. A credit event may include a failure to pay interest or principal, bankruptcy, or restructuring. Any recoverable amounts of the liquidation of the referenced obligation will be allocated pro rata to the holders of the CDX.
e) Short Positions – Each Fund may engage in short sale transactions. For financial statement purposes, an amount equal to the settlement amount is included in the Statement of Assets and Liabilities as an asset and an equivalent liability. The amount of the liability is subsequently marked-to-market to reflect the current value of the short position. Subsequent fluctuations in the market prices of short positions may require purchasing the securities at prices which may differ from the market value reflected on the Statement of Assets and Liabilities. The Fund is liable to the buyer for any dividends payable on securities while those securities are in a short position. As collateral for its short positions, the Fund is required under the 1940 Act to maintain assets consisting of cash, cash equivalents or liquid securities equal to the market value of the securities sold short. This collateral is required to be adjusted daily.
f) Risks of Options, Futures Contracts, Options on Futures Contracts and Short Positions – The risks inherent in the use of options, futures contracts, options on futures contracts and short positions include 1) adverse changes in the value of such instruments; 2) imperfect correlation between the price of options and futures contracts and options thereon and movements in the price of the underlying securities, index or futures contracts; 3) the possible absence of a liquid secondary market for any particular instrument at any time; 4) the possible need to defer closing out certain positions to avoid adverse tax consequences; and 5) the possible nonperformance by the counterparty under the terms of the contract. The Funds designate all cash, cash equivalents and liquid securities as collateral for written options, futures contracts and short positions.
g) Security Transactions – Investment transactions are recorded on trade date. The Funds determine the gain or loss realized from investment transactions by comparing the identified cost, which is the same basis used for federal income tax purposes, with the net sales proceeds.
h) Federal Income Taxes – Each Fund intends to comply with the requirements of Subchapter M of the Internal Revenue Code necessary to qualify as a regulated investment company and to make the requisite distributions of income and capital gains to its shareholders sufficient to relieve it from all or substantially all federal income and excise taxes.
31
i) Income and Expenses – Dividend income is recorded on the ex-dividend date. Interest income, including amortization of premium and discount, is recognized on an accrual basis. The Funds are charged for those expenses that are directly attributable to each series, such as Advisory fees and registration costs. Expenses that are not directly attributable to a series are generally allocated among the Trust’s series in proportion to their respective net assets.
j) Distributions to Shareholders – Each Fund generally pays dividends from net investment income and distributes net realized capital gains, if any, at least annually. Income and capital gain distributions are determined in accordance with income tax regulations, which may differ from U.S. generally accepted accounting principles. Distributions to shareholders are recorded on the ex-dividend date.
The tax character of distributions for the Funds during the years ended December 31, 2006 and December 31, 2005, were as follows:
| Evolution VP Managed Bond Fund | Evolution VP All-Cap Equity Fund | |||||||||||||||
| Year Ended | Year Ended | Year Ended | Year Ended | |||||||||||||
| December 31, | December 31, | December 31, | December 31, | |||||||||||||
| 2006 | 2005 | 2006 | 2005 | |||||||||||||
| Distributions paid from: | ||||||||||||||||
| Ordinary Income | $ | 30,745 | $ | 53,162 | $ | 362,670 | $ | — | ||||||||
| Long-term capital gain | — | 6,123 | 208 | — | ||||||||||||
| Total distributions paid | $ | 30,745 | $ | 59,285 | $ | 362,878 | $ | — | ||||||||
| Dynamic VP HY Bond Fund | ||||||||
| Year Ended | Period Ended | |||||||
| December 31, | December 31, | |||||||
| 2006 | 20051 | |||||||
| Distributions paid from: | ||||||||
| Ordinary Income | $ | 1,883,085 | $ | 426,565 | ||||
| Long-term capital gain | — | — | ||||||
| Total distributions paid | $ | 1,883,085 | $ | 426,565 | ||||
| 1 | Commenced operations on February 1, 2005. |
As of December 31, 2006, the components of distributable earnings of the Funds were as follows:
| Evolution VP | Evolution VP | Dynamic VP HY | |||||||||||
| Managed Bond Fund | All-Cap Equity Fund | Bond Fund | |||||||||||
| Cost basis of investments for federal income tax purposes | $ | 11,527,418 | $ | 27,936,261 | $ | 41,541,731 | |||||||
| Unrealized Appreciation | 144,871 | 1,787,632 | 584,899 | ||||||||||
| Unrealized Depreciation | (137,932 | ) | (949,092 | ) | (57,103 | ) | |||||||
| Net unrealized appreciation/(depreciation) | 6,939 | 838,540 | 527,796 | ||||||||||
| Undistributed ordinary income/(loss) | 347,303 | 1,326,522 | 1,258,805 | ||||||||||
| Undistributed long-term gain/(loss) | — | 71,837 | — | ||||||||||
| Distributable earnings | 347,303 | 1,398,359 | 1,258,805 | * | |||||||||
| Other Accumulated gain/(loss) | (238,610 | ) | (486 | ) | (1,128,891 | ) | |||||||
| Total Accumulated gain/(loss) | $ | 115,632 | $ | 2,236,413 | $ | 657,710 | |||||||
*Includes tax swap adjustments.
32
The difference between book cost of investments and tax cost of investments is attributable primarily to the tax deferral of losses on wash sales.
k) Use of Estimates – The preparation of financial statements in conformity with U.S. generally accepted accounting principles requires management to make estimates and assumptions that affect the reported amounts of assets and liabilities and disclosure of contingent assets and liabilities at the date of the financial statements and the reported amounts of revenues and expenses during the reporting period. Actual results could differ from those estimates.
| 3. | CAPITAL SHARE TRANSACTIONS |
Capital share transactions for the Funds during the periods ended December 31, 2006 and December 31, 2005 were as follows:
| Evolution VP Managed Bond Fund | Evolution VP All-Cap Equity Fund | |||||||||||||||
| Year Ended | Year Ended | Year Ended | Year Ended | |||||||||||||
| December 31, | December 31, | December 31, | December 31, | |||||||||||||
| 2006 | 2005 | 2006 | 2005 | |||||||||||||
| Shares sold | 514,029 | 185,956 | 798,745 | 314,849 | ||||||||||||
| Shares issued in reinvestment of distributions | 1,537 | 3,022 | 14,022 | — | ||||||||||||
| Shares redeemed | (67,489 | ) | (11,314 | ) | (99,872 | ) | (19,261 | ) | ||||||||
| Total net increase from capital share transactions | 448,077 | 177,664 | 712,895 | 295,588 | ||||||||||||
| Dynamic VP HY Bond Fund | ||||||||
| Year Ended | Period Ended | |||||||
| December 31, | December 31, | |||||||
| 2006 | 20051 | |||||||
| Shares sold | 6,997,498 | 5,572,131 | ||||||
| Shares issued in reinvestment of distributions | 92,387 | 21,339 | ||||||
| Shares redeemed | (6,654,494 | ) | (3,840,895 | ) | ||||
| Total net increase from capital share transactions | 435,391 | 1,752,575 | ||||||
| 1 | Commenced operations on February 1, 2005. |
| 4. | INVESTMENT TRANSACTIONS |
During the period ended December 31, 2006, the aggregate purchases and sales of investments (excluding short-term investments) for each Funds were as follows:
| Evolution VP Managed | Evolution VP All-Cap | Dynamic VP HY | ||||||||||
| Bond Fund | Equity Fund | Bond Fund | ||||||||||
| Purchases | $ | 72,089,381 | $ | 166,161,913 | $ | 111,485,177 | ||||||
| Sales | 65,247,461 | 149,566,410 | 127,143,387 | |||||||||
There were no purchases or sales of long-term U.S. Government Securities during the period ended December 31, 2006 for any of the Funds.
33
The Evolution VP Managed Bond Fund had post October losses (“POL”), capital losses incurred between October 31st and December 31st, of $56,830. The Evolution VP All-Cap Equity Fund had POL of $486. The Dynamic VP HY Bond Fund had POL of $68,355.
At December 31, 2006, the following funds had capital loss carryforwards on a tax basis of:
| Capital Loss | ||||||||
| Carryforwards | Expires | |||||||
| Evolution VP Managed Bond Fund | $ | (143,203 | ) | 12/31/13 | ||||
| (38,577 | ) | 12/31/14 | ||||||
| Evolution VP All-Cap Equity Fund | — | |||||||
| Dynamic VP HY Bond Fund | (756,247 | ) | 12/31/13 | |||||
| (304,289 | ) | 12/31/14 | ||||||
Net investment income and realized gains and losses for federal income tax purposes may differ from that reported on the financial statements because of permanent book-to-tax differences. U.S. generally accepted accounting principles require that permanent differences between financial reporting and tax reporting be reclassified between various components of net assets.
On the Statements of Assets and Liabilities, the following adjustments were made for permanent tax adjustments:
| Accumulated | ||||||||||||
| Net | Undistributed | |||||||||||
| Realized | Net Investment | Paid-in | ||||||||||
| Gain/(Loss) | Income/(Loss) | Capital | ||||||||||
| Evolution VP Managed Bond Fund | $ | (59,134 | ) | $ | 59,134 | $ | — | |||||
| Evolution VP All-Cap Equity Fund | 1,224 | (1,226 | ) | 2 | ||||||||
| Dynamic VP HY Bond Fund | (305,305 | ) | 305,305 | — | ||||||||
Differences are primarily due to income tax treatment of certain security investments.
| 5. | INVESTMENT ADVISORY AND OTHER AGREEMENTS |
The Funds have entered into an investment advisory agreement with the Adviser. The Adviser receives a fee, computed daily and payable monthly, at the annual rates presented below as applied to each Fund’s average daily net assets. In addition, the Adviser has entered into a sub-advisory agreement related to the Evolution VP Managed Bond Fund and the Evolution VP All-Cap Equity Fund with Flexible Plan Investments, Ltd., whereby the sub-adviser will direct investment activities of the Funds. The Adviser pays, out of the management fees it receives from the Funds, a fee for these sub-advisory services. Prior to July 1, 2006, the Adviser entered into a sub-advisory agreement related to the Dynamic VP HY Bond Fund. Effective July 1, 2006, the Adviser directed investment activities for the Fund and the sub-advisory agreement was terminated. For the period ended December 31, 2006, the Adviser has voluntarily agreed to pay all operating expenses (excluding dividends on short positions), in excess of the annual cap on expenses presented below as applied to each Fund’s average daily net assets. Because this is a voluntary waiver, the Adviser may change or end the waiver at any time. The Adviser may recover from the Funds the expenses paid in excess of the annual cap on
34
expenses for the three previous years, as long as the recovery does not cause the Fund to exceed such annual cap on expenses. For the period ended December 31, 2006, the Adviser paid or recouped the following expenses:
| Evolution VP Managed | Evolution VP All-Cap | Dynamic VP HY | ||||||||||
| Bond Fund | Equity Fund | Bond Fund | ||||||||||
| Annual Advisory rate | 1.00% | 1.00% | 0.75% | |||||||||
| Annual cap on expenses | 2.00% | 2.00% | 1.75% | |||||||||
| Expenses paid in excess of annual cap on expenses — 2006 | $ | 49,690 | $ | 16,813 | $ | — | ||||||
| Adviser expense recoupment — 2006 | $ | — | $ | — | $ | 28,879 | ||||||
Remaining expenses subject to potential recovery expiring in:
| Evolution VP Managed | Evolution VP All-Cap | Dynamic VP HY | |||||||||||
| Bond Fund | Equity Fund | Bond Fund | |||||||||||
| 2007 | $ | 53,095 | $ | 58,373 | — | ||||||||
| 2008 | 60,627 | 66,665 | — | ||||||||||
| 2009 | 49,690 | 16,813 | — | ||||||||||
| Total | $ | 163,412 | $ | 141,851 | $ | — | |||||||
Shares of the Evolution VP Managed Bond and the Evolution VP All-Cap Equity Funds are subject to an annual Rule 12b-1 fee of up to 0.25% of Fund’s average daily net assets. The shares of the Dynamic VP HY Bond Fund are subject to an annual Rule 12b-1 fee of up to 0.60% of Fund’s average daily net assets. The Rule 12b-1 fees are to pay the insurance company of the plan sponsor for its services for servicing shareholder accounts.
The Adviser paid directly all offering costs and organizational expenses associated with the registration and seeding of each Fund.
Rafferty Capital Markets, LLC (the “Distributor”) serves as principal underwriter of the Funds and acts as the Funds’ distributor in a continuous public offering of the Funds’ shares. During the year ended December 31, 2006, Dynamic VP HY Bond Fund incurred expenses of $210,186 under Rule 12b-1, of which $31,396 was waived by the Distributor. There were no 12b-1 fees retained by the Distributor for the period ended December 31, 2006. The fee is paid to the Distributor for expenses incurred for distribution-related activities. The Distributor is an affiliate of the Adviser.
In the ordinary course of business, the Funds enter into contracts that contain a variety of indemnification provisions pursuant to which the Funds agree to indemnify third parties upon occurrence of specified events. The Fund’s maximum exposure relating to these indemnification agreements is unknown. However, the Funds have not had prior claims or losses in connection with these provisions and believe the risk of loss is remote.
| 6. | NEW ACCOUNTING PRONOUNCEMENTS |
In July, 2006, the Financial Accounting Standards Board (“FASB”) released FASB Interpretation No. 48, Accounting for Uncertainty in Income Taxes (“FIN 48”). FIN 48 provides guidance for how uncertain tax positions should be recognized, measured, presented and disclosed in the financial statements. FIN 48 requires the evaluation of tax positions taken or expected to be taken in the course of preparing the Fund’s tax returns to determine whether the tax positions are “more-likely-than-not” of being sustained by the applicable tax authority. Tax positions not deemed to meet the more-likely-than-not threshold would be recorded as a tax benefit or expense in the current year. Adoption of FIN 48 is required for fiscal years beginning after December 15, 2006 and is to be applied to all open tax years as of the effective date. Recent SEC guidance allows implementing FIN 48 in fund NAV calculations as late as the fund’s last NAV
35
calculation in the first required financial statement reporting period. As a result, the Fund will incorporate FIN 48 in its semi-annual report on June 30, 2007.
In September 2006, FASB issued its new Standard No. 157, Fair Value Measurements (“FAS 157”). FAS 157 is designed to unify guidance for the measurement of fair value of all types of assets, including financial instruments, and certain liabilities, throughout a number of accounting standards. FAS 157 also establishes a hierarchy for measuring fair value in generally accepted accounting principles and expands financial statement disclosures about fair value measurements that are relevant to mutual funds. FAS 157 is effective for financial statements issued for fiscal years beginning after November 15, 2007, and earlier adoption is permitted. At this time, management is evaluating the implications of FAS 157 and its impact on the financial statements has not yet been determined.
36
Report of Independent Registered Public Accounting Firm
To the Shareholders and Board of Trustees of
Direxion Insurance Trust
Direxion Insurance Trust
We have audited the accompanying statements of assets and liabilities, including the schedules of investments, of Direxion Insurance Trust (comprising Evolution VP Managed Bond Fund, Evolution VP All-Cap Equity Fund, and Dynamic VP HY Bond Fund) (the “Funds”), as of December 31, 2006, and the related statements of operations, the statements of changes in net assets, and the financial highlights for each of the periods indicated therein. These financial statements and financial highlights are the responsibility of the Funds’ management. Our responsibility is to express an opinion on these financial statements and financial highlights based on our audits.
We conducted our audits in accordance with the standards of the Public Company Accounting Oversight Board (United States). Those standards require that we plan and perform the audit to obtain reasonable assurance about whether the financial statements and financial highlights are free of material misstatement. We were not engaged to perform an audit of the Funds’ internal control over financial reporting. Our audits included consideration of internal control over financial reporting as a basis for designing audit procedures that are appropriate in the circumstances, but not for the purpose of expressing an opinion on the effectiveness of the Funds’ internal control over financial reporting. Accordingly, we express no such opinion. An audit also includes examining, on a test basis, evidence supporting the amounts and disclosures in the financial statements and financial highlights, assessing the accounting principles used and significant estimates made by management, and evaluating the overall financial statement presentation. Our procedures included confirmation of securities owned as of December 31, 2006, by correspondence with the custodian and brokers or by other appropriate auditing procedures where replies from brokers were not received. We believe that our audits provide a reasonable basis for our opinion.
In our opinion, the financial statements and financial highlights referred to above present fairly, in all material respects, the financial position of Evolution VP Managed Bond Fund, Evolution VP All-Cap Equity Fund, and Dynamic VP HY Bond Fund comprising the Direxion Insurance Trust at December 31, 2006, the results of their operations, the changes in their net assets, and their financial highlights for each of the periods indicated therein in conformity with U.S. generally accepted accounting principles.
Chicago, Illinois
February 16, 2007
37
Additional Information (Unaudited)
DIVIDENDS RECEIVED DEDUCTION
For corporate shareholders, the percent of ordinary income distributions qualifying for the corporate dividends received deduction for the fiscal year ended December 31, 2006 was as follows:
| Evolution VP Managed Bond Fund | 0.20% | |||
| Evolution VP All-Cap Equity Fund | 12.60% | |||
| Dynamic VP HY Bond Fund | 0.00% |
38
Investment Advisory and Subadvisory Agreements Approvals (Unaudited)
Provided below is a summary of certain of the factors the Board considered at the August 22, 2006 Board meeting in approving: (1) the Advisory Agreement between Rafferty Asset Management (“Rafferty”) and the Direxion Insurance Trust (the “Trust”), on behalf of the Dynamic VP HY Bond Fund, Evolution VP Managed Bond Fund and Evolution VP All-Cap Equity Fund (each, a “Fund” and collectively, the “Funds”), each a series of the Trust; and (2) the Subadvisory Agreement between Rafferty and Flexible Plan Investments, Inc. (the “Subadviser” or “Flexible”) on behalf of the Evolution VP Managed Bond Fund and Evolution VP All-Cap Equity Fund (collectively, the “Evolution Funds”).
The Board did not identify any particular information that was most relevant to its consideration to approve the Advisory Agreement and Subadvisory Agreement (collectively, the “Agreements”) and each Trustee may have afforded different weight to the various factors.
In determining whether to approve the continuance of the Agreements, the Board considered the best interests of each Fund separately. In addition, while the Agreements for the Funds were considered at the same Board meeting, the Board considered each Fund’s investment advisory and subadvisory relationships separately. In each instance, the Board considered, among other things, the following factors: (1) the nature and quality of the services provided; (2) the investment performance of each Fund; (3) the cost to Rafferty or the Subadviser for providing services and the profitability of the advisory business to Rafferty or the Subadviser, if such information was provided; (4) the extent to which economies of scale have been taken into account in setting the fee schedule; (5) whether fee levels reflect these economies of scale for the benefit of Fund investors; and (6) other benefits derived or anticipated to be derived by Rafferty or the Subadviser from its relationship with the Funds.
Nature, Extent and Quality of Services Provided. The Board reviewed the nature, extent and quality of the services provided under the Advisory Agreement by Rafferty. The Board noted that Rafferty has provided services to the Funds since their inception and has significant investment experience. The Board also noted that Rafferty attempts to trade efficiently with low commission schedules, which helps improve performance results. The Board considered Rafferty’s representation that it has the financial resources and appropriate staffing to manage the Funds. The Board also considered Rafferty’s ability to adopt and implement compliance and control functions for the Funds and noted that information concerning portfolio management and a report from the chief compliance officer are provided on a periodic basis to the Board. The Board also considered Rafferty’s ability to increase assets of the Trust complex. The Board also considered that Rafferty oversees all aspects of the operation of the Funds, including oversight of the Subadviser.
Regarding the Subadvisory Agreement with Flexible, the Board noted that the primary role of Flexible is to provide an investment program for the Evolution Funds. The Board also noted that there would be no change in the services provided by Flexible.
Based on these and other considerations, the Board determined that, in the exercise of its business judgment, the nature, extent and quality of the services provided by Rafferty to the Funds under the Agreement and Flexible under the applicable Subadvisory Agreement were fair and reasonable.
Performance of the Funds. With respect to the Dynamic VP HY Bond Fund, the Board considered that the Fund underperformed for all relevant periods. The Board also noted that Rafferty began directly managing this Fund’s assets on July 1, 2006. With respect to the Evolution VP Managed Bond Fund, the Board considered that the Fund underperformed a market index for all relevant periods except the 6 month period. With respect to the Evolution VP All-Cap Equity Fund, the Board considered that the Fund outperformed a market index for the 9 month and 1 year periods but underperformed for all other relevant periods.
Costs of Services Provided to the Funds and Profits Realized. The Board considered the overall fees paid to Rafferty on an annual basis since each Fund’s commencement of operations, including any fee waivers and recoupment of fees previously waived. The Board also noted that Rafferty charges similar fees to other comparable client accounts. In considering the fees paid or to be paid by Rafferty to Flexible, the Board considered that the fees are higher than the
39
industry average. The Board also noted that Rafferty negotiated the lowest fee Flexible charges for comparable client accounts. In addition, Rafferty also negotiated breakpoints in subadvisory fees with Flexible. In considering the profitability of Rafferty, the Board considered the overall profitability of Rafferty’s investment business and its representation that it does not assess profitability with respect to its services to individual Funds. In considering the profitability of Flexible, the Board considered Flexible’s representation that it did not earn pre- or post-tax profits on its services to the Evolution Funds.
Based on these considerations, the Board determined that, in the exercise of its business judgment, the costs of the services provided and the profits realized under the Agreements were fair and reasonable.
Economies of Scale. The Board considered Rafferty’s representation that it believes that asset levels at this time are not sufficient to warrant a reduction in fee rates or the addition of breakpoints. Based on these and other considerations, the Board determined that, in the exercise of its business judgment, the reduction in fee rates or additions of breakpoints were not necessary at this time.
Other Benefits. The Board considered Rafferty’s representation that its relationship with the Funds has permitted Rafferty to attract business to its other client accounts. The Board also considered that Rafferty’s overall business with brokerage firms due to both the Funds and other client accounts help lower commission rates and provide better execution for Fund portfolio transactions. The Board also considered that Flexible has greater access to certain trust platforms due to its subadvisory services to the Evolution Funds. Based on these and other considerations, the Board determined that, in the exercise of its business judgment, the benefits to Rafferty and Flexible were fair and reasonable.
Conclusion. Based on, but not limited to, the above considerations and determinations, the Board determined that the Agreements for the Funds were fair and reasonable in light of the services to be performed, fees, expenses and such other matters as the Board considered relevant in the exercise of its business judgment. On this basis, the Board unanimously voted in favor of the continuance of the Agreements.
40
Direxion Funds
Trustees and Officers
(Unaudited)
The business affairs of each Fund are managed by or under the direction of the Board of Trustees. Information pertaining to the Trustees and Officers of the Funds is set forth below. The SAI includes additional information about the Funds’ Trustee and Officers and is available without charge, upon request by calling 1-800-851-0511.
| # of | Other | |||||||||
| Principal | Portfolios in | Trusteeships/ | ||||||||
| Position(s) | Term of Office and | Occupation(s) During | Direxion Complex | Directorships | ||||||
| Name, Address and Age | Held with Fund | Length of Time Served | Past Five Years | Overseen by Trustee3 | Held by Trustee | |||||
Interested Trustees | ||||||||||
| Lawrence C. Rafferty1 Age: 64 | Chairman of the Board of Trustees | Lifetime of Trust until removal or resignation; Since 1997 | Chairman and Chief Executive Officer of Rafferty, 1997 — present; Chief Executive Officer of Rafferty Companies, LLC, 1996 — present; Chief Executive Officer of Rafferty Capital Markets, Inc., 1995 — present. | 102 | Board of Trustees, Fairfield University; Board of Directors, St. Vincent’s Services; Executive Committee, Metropolitan Golf Association. | |||||
| Jay F. Higgins1 Age: 61 | Trustee | Lifetime of Trust until removal or resignation; Since 1997 | Chairman, Bengal Partners, LLC, 1998 — present (NASD Broker-Dealer). | 102 | None | |||||
| # of | Other | |||||||||
| Principal | Portfolios in | Trusteeships/ | ||||||||
| Position(s) | Term of Office and | Occupation(s) During | Fund Complex | Directorships | ||||||
| Name, Address and Age | Held with Fund | Length of Time Served | Past Five Years | Overseen by Trustee3 | Held by Trustee | |||||
Non-Interested Trustees | ||||||||||
| Daniel J. Byrne Age: 62 | Trustee | Lifetime of Trust until removal or resignation; Since 1997 | President and Chief Executive Officer of Byrne Securities Inc., 1992 — present; Trustee, The Opening Word Program, Wyandanch, New York. | 102 | None | |||||
Kevin G. Boyle2 Age: 66 | Trustee | Lifetime of Trust until removal or resignation; Since 2002 | President, Kevin G. Boyle Securities, Inc., 1981 — 2006. | 102 | None | |||||
| Gerald E. Shanley III Age: 63 | Trustee | Lifetime of Trust until removal or resignation; Since 1997 | Business Consultant, 1985 — present; Trustee of Trust Under Will of Charles S. Payson, 1987 — present; C.P.A., 1979 — present. | 102 | None | |||||
41
Direxion Funds
Trustees and Officers
(Unaudited)
| # of | ||||||||||
| Principal | Portfolios in | Other Trusteeships/ | ||||||||
| Position(s) | Term of Office and | Occupation(s) During | Fund Complex | Directorships | ||||||
| Name, Address and Age | Held with Fund | Length of Time Served | Past Five Years | Overseen by Trustee3 | Held by Trustee | |||||
Officers | ||||||||||
| Ron Fernandes Age: 48 | Chief Executive Officer | One Year; Since 2006 | Chief Executive Officer, Raven Holdings, 2003 — 2006; President, SunLife Distributors, Inc. and Executive Vice President, SunLife Retirement Products and Services, 1999 — 2002. | N/A | None | |||||
| Daniel D. O’Neill Age: 38 | President | One Year; Since 1999 | Managing Director of Rafferty, 1999 — present. | N/A | None | |||||
| Chief Operating Officer and Chief Investment Officer Chief Financial Officer | One Year; Since 2006 One Year; Since 2007 | |||||||||
| Karin Louie Age: 42 | Chief Compliance Officer | One Year; Since 2007 | Director of Compliance, Alaric Compliance, 2006 — present; Compliance Consultant, 2003 — 2005; MBA, Financial Management and International Business, 2002 — 2003; BBA, General Business and Finance, 2002; Assistant Vice President and Branch Compliance Officer of Gruntal & Co., LLC, 1998 — 2001 | N/A | None | |||||
| William Franca Age: 50 | Executive Vice President — Head of Distribution | One Year; Since 2006 | Senior Vice President — National Sales, Massachusetts Financial Services/ SunLife Financial Distributors, 2002 — 2004; Executive Vice President, Distribution, SunLife, 2001 — 2002. | N/A | None | |||||
| Stephen P. Sprague Age: 57 | Treasurer and Controller | One Year; Since 1999 | Chief Financial Officer of Rafferty for the past 5 years. | N/A | None | |||||
| Eric W. Falkeis 615 East Michigan Street Milwaukee, WI 53202 Age: 34 | Secretary | One Year; Since 2004 | Vice President, U.S. Bancorp Fund Services LLC, 1997 — present. | N/A | None | |||||
| 1 | Mr. Rafferty and Mr. Higgins are affiliated with Rafferty. Mr. Rafferty is the Chairman and Chief Executive Officer of Rafferty and Mr. Higgins own a beneficial interest in Rafferty. |
| 2 | Mr. Boyle was an Interested Trustee from May to September 2004 due to his daughter being employed by Rafferty Capital Markets, LLC during that time period. |
| 3 | The Direxion Complex consists of the Direxion Funds which currently offers for sale to the public 37 portfolios of the 57 currently registered with the SEC and the Direxion Insurance Trust which currently offers for sale 3 portfolios of the 45 currently registered with the SEC. |
The address for all the trustees and officers except Eric W. Falkeis is 33 Whitehall St., New York, NY 10004.
42
Advisor
| Rafferty Asset Management, LLC | |
| 33 Whitehall Street, 10th Floor | |
| New York, NY 10004 |
Sub-Advisor
| Flexible Plan Investments, Ltd. | |
| 3883 Telegraph Road | |
| Bloomfield Hills, MI 48302 |
Administrator, Transfer Agent, Dividend
Paying Agent & Shareholding Servicing Agent
| U.S. Bancorp Fund Services, LLC | |
| P.O. Box 1993 | |
| Milwaukee, WI 53201-1993 |
Custodian
| U.S. Bank, N.A. | |
| 1555 RiverCenter Dr., Suite 302 | |
| Milwaukee, WI 53212 |
Independent Registered Public Accounting Firm
| Ernst & Young LLP | |
| 233 S. Wacker Dr. | |
| Chicago, IL 60606 |
Distributor
| Rafferty Capital Markets, LLC | |
| 59 Hilton Avenue | |
| Garden City, NY 11530 |
The Fund’s Proxy Voting Policies are available without charge by calling 1-800-851-0511, or by accessing the SEC’s website, at www.sec.gov.
The actual voting records relating to portfolio securities during the most recent twelve month period ended June 30 (starting with the year ended June 30, 2005) is available without charge by calling 1-800-851-0511 or by accessing the SEC’s website at www.sec.gov.
The Funds files complete schedules of portfolio holdings with the SEC on Form N-Q. The Form N-Q is available without charge, upon request, by calling 1-800-851-0511, or by accessing the SEC’s website, at www.sec.gov.
This report has been prepared for shareholders and may be distributed to others only if preceded or accompanied by a current prospectus.
ANNUAL
REPORT
December 31, 2006

33 Whitehall Street, 10th Floor
New York, NY 10004
(800) 851-0511
Item 2. Code of Ethics.
The registrant has adopted a code of ethics that applies to the registrant’s principal executive officer and principal financial officer. The registrant has not made any amendments to its code of ethics during the period covered by this report. The registrant has not granted any waivers from any provisions of the code of ethics during the period covered by this report.
Undertake to provide a copy to any person without charge: The registrant undertakes to provide to any person without charge, upon request, a copy of its code of ethics by mail when they call the registrant at 1-800-851-0511.
Item 3. Audit Committee Financial Expert.
The registrant’s board of [trustees/directors] has determined that there is at least one audit committee financial expert serving on its audit committee. Gerald E. Shanley III is the “audit committee financial expert” and is considered to be “independent” as each term is defined in Item 3 of Form N-CSR.
Item 4. Principal Accountant Fees and Services.
The registrant has engaged its principal accountant to perform audit services, audit-related services, tax services and other services during the past two fiscal years. “Audit services” refer to performing an audit of the registrant’s annual financial statements or services that are normally provided by the accountant in connection with statutory and regulatory filings or engagements for those fiscal years. “Audit-related services” refer to the assurance and related services by the principal accountant that are reasonably related to the performance of the audit. “Tax services” refer to professional services rendered by the principal accountant for tax compliance, tax advice, and tax planning. There were no “Other services” provided by the principal accountant. The following table details the aggregate fees billed or expected to be billed for each of the last two fiscal years for audit fees, audit-related fees, tax fees and other fees by the principal accountant.
| FYE 12/31/2006 | FYE 12/31/2005 | |||||||
| Audit Fees | $ | 49,800 | $ | 78,000 | ||||
| Audit-Related Fees | 6,000 | |||||||
| Tax Fees | 10,500 | 12,000 | ||||||
| All Other Fees | ||||||||
The audit committee has adopted pre-approval policies and procedures that require the audit committee to pre-approve all audit and non-audit services of the registrant, including services provided to any entity affiliated with the registrant. All of the principal accountant’s hours spent on auditing the registrant’s financial statements were attributed to work performed by full-time permanent employees of the principal accountant. (If more than 50 percent of the accountant’s hours were spent to audit the registrant’s financial statements for the most recent fiscal year,
2
state how many hours were attributed to work performed by persons other than the principal accountant’s full-time, permanent employees.)
The following table indicates the non-audit fees billed or expected to be billed by the registrant’s accountant for services to the registrant and to the registrant’s investment adviser (and any other controlling entity, etc.—not sub-adviser) for the last two years. The audit committee of the board of trustees/directors has considered whether the provision of non-audit services that were rendered to the registrant’s investment adviser is compatible with maintaining the principal accountant’s independence and has concluded that the provision of such non-audit services by the accountant has not compromised the accountant’s independence.
| Non-Audit Related Fees | FYE 12/31/2006 | FYE 12/31/2005 | ||||||
| Registrant | — | — | ||||||
| Registrant’s Investment Adviser | — | — | ||||||
Item 5. Audit Committee of Listed Registrants.
Not applicable to registrants who are not listed issuers (as defined in Rule 10A-3 under the Securities Exchange Act of 1934).
Item 6. Schedule of Investments.
Schedule of Investments is included as part of the report to shareholders filed under Item 1 of this Form.
Item 7. Disclosure of Proxy Voting Policies and Procedures for Closed-End Management Investment Companies.
Not applicable to open-end investment companies.
Item 8. Portfolio Managers of Closed-End Management Investment Companies.
Not applicable to open-end investment companies.
Item 9. Purchases of Equity Securities by Closed-End Management Investment Company and Affiliated Purchasers.
Not applicable to open-end investment companies.
Item 10. Submission of Matters to a Vote of Security Holders.
There have been no material changes to the procedures by which shareholders may recommend nominees to the registrant’s board of directors/trustees.
3
Item 11. Controls and Procedures.
| (a) | The Registrant’s President/Chief Executive Officer and Treasurer/Chief Financial Officer have reviewed the Registrant’s disclosure controls and procedures (as defined in Rule 30a-3(c) under the Investment Company Act of 1940 (the “Act”)) as of a date within 90 days of the filing of this report, as required by Rule 30a-3(b) under the Act and Rules 13a-15(b) or 15d-15(b) under the Securities Exchange Act of 1934. Based on their review, such officers have concluded that the disclosure controls and procedures are effective in ensuring that information required to be disclosed in this report is appropriately recorded, processed, summarized and reported and made known to them by others within the Registrant and by the Registrant’s service provider. | |
| (b) | There were no changes in the Registrant’s internal control over financial reporting (as defined in Rule 30a-3(d) under the Act) that occurred during the second fiscal quarter of the period covered by this report that has materially affected, or is reasonably likely to materially affect, the Registrant’s internal control over financial reporting. |
Item 12. Exhibits.
| (a) | (1) Any code of ethics or amendment thereto, that is subject of the disclosure required by Item 2, to the extent that the registrant intends to satisfy Item 2 requirements through filing an exhibit. Filed herewith. | |
| (2) Certifications pursuant to Section 302 of the Sarbanes-Oxley Act of 2002. Filed herewith. | ||
| (3) Any written solicitation to purchase securities under Rule 23c-1 under the Act sent or given during the period covered by the report by or on behalf of the registrant to 10 or more persons. Not applicable to open-end investment companies. | ||
| (b) | Certification pursuant to Section 906 of the Sarbanes-Oxley Act of 2002. Furnished herewith. |
4
SIGNATURES
Pursuant to the requirements of the Securities Exchange Act of 1934 and the Investment Company Act of 1940, the registrant has duly caused this report to be signed on its behalf by the undersigned, thereunto duly authorized.
| (Registrant) | Direxion Insurance Trust | |||||||
| By (Signature and Title)* | /s/ Ron Fernandes | |||||||
| Ron Fernandes, Chief Executive Officer | ||||||||
| Date | March 9, 2007 | |||||||
Pursuant to the requirements of the Securities Exchange Act of 1934 and the Investment Company Act of 1940, this report has been signed below by the following persons on behalf of the registrant and in the capacities and on the dates indicated.
| By (Signature and Title)* | /s/ Ron Fernandes | |||||
| Ron Fernandes, Chief Executive Officer | ||||||
| Date | March 9, 2007 | |||||
| By (Signature and Title)* | /s/ Daniel D. O’Neill | |||||
| Daniel D. O’Neill, Chief Financial Officer | ||||||
| Date | March 9, 2007 | |||||
* Print the name and title of each signing officer under his or her signature.
5