UNITED STATES
SECURITIES AND EXCHANGE COMMISSION
SECURITIES AND EXCHANGE COMMISSION
Washington, D.C. 20549
FORM N-CSR
CERTIFIED SHAREHOLDER REPORT OF REGISTERED
MANAGEMENT INVESTMENT COMPANIES
MANAGEMENT INVESTMENT COMPANIES
Investment Company Act file number 811-09761
Direxion Insurance Trust
(Exact name of registrant as specified in charter)
33 Whitehall Street, 10 th Floor
New York, NY 10004
(Address of principal executive offices) (Zip code)
New York, NY 10004
(Address of principal executive offices) (Zip code)
Daniel D. O’Neill
33 Whitehall Street, 10th Floor
New York, NY 10004
(Name and address of agent for service)
33 Whitehall Street, 10th Floor
New York, NY 10004
(Name and address of agent for service)
1-646-572-3390
Registrant’s telephone number, including area code
Registrant’s telephone number, including area code
Date of fiscal year end: December 31, 2007
Date of reporting period: June 30, 2007
Letter to Shareholders
Dear Shareholders,
This Semi-Annual Report covers the period from January 1, 2007 to June 30, 2007 (the “Semi-Annual Period”). During the Semi-Annual Period, the broad equity markets continued to deliver strong returns, as the S&P 500 Index and Dow Jones Industrial Average Index increased 6.96% and 8.76%, respectively, on a total return basis. Gains in the equity markets were fueled by strong corporate earnings and a sustained level of global merger and acquisition activity. However, on February 27th, a sell-off in China sparked a global decline that led to the largest one-day percentage decline in the S&P 500 Index since March 24th, 2003. Despite the sharp declines in February, the strength of the market led to positive Index returns over the course of the Semi-Annual Period.
A flight to quality, in light of the February sell-off, increased volatility in the equity markets and inflation at the higher end of the target range, resulted in the benchmark 10-Year Note moving from 4.7% at the beginning of the period, reaching a high of 5.3% in early June, and ending the period around 5%. The High Yield market continued to deliver positive returns through May. However, this same market experienced a challenging period in the month of June due to pricing pressure related to sub-prime matters in the broad market, a large new issue calendar, increased interest rates and a decline in general equity markets at the end of the Semi-Annual Period.
The Evolution VP All-Cap Equity Fund, Evolution VP Managed Bond Fund and the Dynamic VP HY Bond Fund had a total return of 4.4%, (.45)% and (0.18)%, respectively, over the course of the Semi-Annual Period.
As always, we thank you for using Direxion Funds and we look forward to our mutual success.

Todd Kellerman
Chief Financial Officer
Direxion Funds
The performance data quoted represents past performance; past performance does not guarantee future results. The investment return and principal value of an investment will fluctuate and an investor’s shares, when redeemed, may be worth more or less than their original cost. Current performance may be higher or lower than the performance data quoted. To obtain performance data current to the most recent month-end, please call, toll-free, 1-800-851-0511. The Evolution VP All-Cap Equity Fund, Evolution VP Managed Bond Fund and the Dynamic VP HY Bond Fund had gross annualized expense ratios, before reimbursement/recoupment, of 1.90%, 2.42% and 1.59% respectively.
An investment in any of the Direxion Funds is subject to a number of risks that could affect the value of its shares. It is important that investors closely review and understand these risks before making an investment. Investors considering an investment may obtain a prospectus by calling 1-800-851-0511. Investors should read the prospectus carefully for more complete information, including charges, expenses, and additional risks, before investing or sending money.
Distributed by: Rafferty Capital Markets, LLC
Date of First Use: August 29, 2007
Expense Example
June 30, 2007 (Unaudited)
As a shareholder of a mutual fund, you incur two types of costs: (1) transaction costs, including sales charges (loads) on purchase payments, reinvested dividends, or other distributions; redemption fees; and exchange fees; and (2) ongoing costs, including management fees; distribution and/or service fees; and other Fund expenses. This example is intended to help you understand your ongoing costs (in dollars) of investing in the Fund and to compare costs with the ongoing costs of investing in other mutual funds.
The Example is based on an investment of $1,000 invested at the beginning of the period and held the entire period (January 1, 2007 – June 30, 2007).
Actual Expenses
The first line of the table below provides information about actual account values and actual expenses. Although the Fund charges no sales load or transactions fees, you will be assessed fees for outgoing wire transfers, returned checks or stop payment orders at prevailing rates charged by U.S. Bancorp Fund Services, LLC, the Funds’ transfer agent. If you request a redemption be made by wire transfer, currently a $15.00 fee is charged by the Funds’ transfer agent. However, the example below does not include portfolio trading commissions and related expenses or other extraordinary expenses as determined under generally accepted accounting principles. You may use the information in this line, together with the amount you invested, to estimate the expenses that you paid over the period. Simply divide your account value by $1,000 (for example, an $8,600 account value divided by $1,000 = 8.6), then multiply the result by the number in the first line under the heading entitled “Expenses Paid During Period” to estimate the expenses you paid on your account during this period.
Hypothetical Example for Comparison Purposes
The second line of the table below provides information about hypothetical account values and hypothetical expenses based on the Funds’ actual expense ratios and an assumed rate of return of 5% per year before expenses, which is not the Funds’ actual return. The hypothetical account values and expenses may not be used to estimate the actual ending account balance or expenses you paid for the period. You may use this information to compare the ongoing costs of investing in the Funds and other funds. To do so, compare this 5% hypothetical example with the 5% hypothetical examples that appear in the shareholder reports of the other funds.
Please note that the expenses shown in the table are meant to highlight your ongoing costs only and do not reflect any transactional costs, such as wire transfers, returned checks or stop payment orders. Therefore, the second line of the table is useful in comparing ongoing costs only, and will not help you determine the relative costs of owning different funds. In addition, if these transactional costs were included, your costs would have been higher. The tables below do not reflect any fees and expenses imposed under variable annuity contracts and variable life insurance policies (“Contracts”) and certain qualified pension and retirement plans (“Plans”), which would increase overall fees and expenses. Please refer to your Contract or Plan Prospectus for a description of those fees and expenses.
2
Expense Example
June 30, 2007 (Unaudited)
| Evolution VP Managed Bond Fund (Unaudited) | |||||||||
| Expenses Paid | |||||||||
| Beginning | Ending | During Period | |||||||
| Account Value | Account Value | January 1, 2007 – | |||||||
| January 1, 2007 | June 30, 2007 | June 30, 2007* | |||||||
| Actual | $ | 1,000.00 | $ | 995.50 | $ | 9.90 | |||
| Hypothetical (5% return before expenses) | 1,000.00 | 1,014.88 | 9.99 | ||||||
| * | Expenses are equal to the Fund’s annualized expense ratio of 2.00%, multiplied by the average account value over the period, multiplied by 181/365 to reflect the one-half year period. |
| Evolution VP All-Cap Equity Fund (Unaudited) | |||||||||
| Expenses Paid | |||||||||
| Beginning | Ending | During Period | |||||||
| Account Value | Account Value | January 1, 2007 – | |||||||
| January 1, 2007 | June 30, 2007 | June 30, 2007* | |||||||
| Actual | $ | 1,000.00 | $ | 1,044.00 | $ | 10.03 | |||
| Hypothetical (5% return before expenses) | 1,000.00 | 1,014.98 | 9.89 | ||||||
| * | Expenses are equal to the Fund’s annualized expense ratio of 1.98%, multiplied by the average account value over the period, multiplied by 181/365 to reflect the one-half year period. |
| Dynamic VP HY Bond Fund (Unaudited) | |||||||||
| Expenses Paid | |||||||||
| Beginning | Ending | During Period | |||||||
| Account Value | Account Value | January 1, 2007 – | |||||||
| January 1, 2007 | June 30, 2007 | June 30, 2007* | |||||||
| Actual | $ | 1,000.00 | $ | 998.20 | $ | 7.13 | |||
| Hypothetical (5% return before expenses) | 1,000.00 | 1,017.65 | 7.20 | ||||||
| ** | Expenses are equal to the Fund’s annualized expense ratio of 1.44%, multiplied by the average account value over the period, multiplied by 181/365 to reflect the one-half year period. |
3
Evolution VP Managed Bond Fund
Allocation of Fund Holdings (Unaudited)
June 30, 2007

Evolution VP All-Cap Equity Fund
Allocation of Fund Holdings (Unaudited)
June 30, 2007
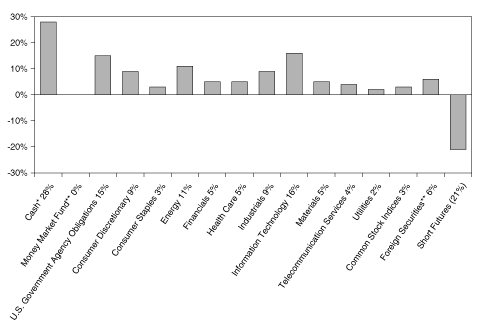
The percentages in these graphs are calculated based on net assets.
* Cash and other assets less liabilities.
** These are investment companies that primarily invest in this category of securities.
4
Dynamic VP HY Bond Fund
Allocation of Fund Holdings (Unaudited)
June 30, 2007
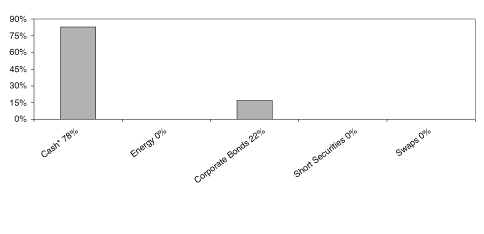
The percentages in these graphs are calculated based on net assets.
* Cash and other assets less liabilities.
** These are investment companies that primarily invest in this category of securities.
5
Direxion Evolution VP Managed Bond Fund
Schedule of Investments
June 30, 2007 (Unaudited)
| Shares | Value | |||||||||
| INVESTMENT COMPANIES - 20.1% | ||||||||||
| 1,098 | Alliance World Dollar Government Fund II | $ | 14,856 | |||||||
| 1,127 | Blackrock Corporate High Yield Fund VI | 15,181 | ||||||||
| 797 | Blackrock Floating Rate Income Strategies Fund | 15,079 | ||||||||
| 771 | Blackrock Preferred Income Strategies Fund | 15,004 | ||||||||
| 877 | Evergreen Managed Income Fund | 14,935 | ||||||||
| 734 | Flaherty & Crumrine/Claymore Preferred Securities Income Fund | 14,988 | ||||||||
| 591 | iShares GS $ InvesTop Corporate Bond Fund | 61,807 | ||||||||
| 1,513 | iShares Lehman 7-10 Year Treasury Bond Fund | 122,614 | ||||||||
| 13,488 | iShares Lehman 20+ Year Treasury Bond Fund | 1,148,503 | ||||||||
| 5,690 | iShares Lehman Treasury Inflation Protected Securities Fund | 563,196 | ||||||||
| 4,044 | iShares iBoxx $ High Yield Corporate Bond Fund | 412,043 | ||||||||
| 1,755 | MFS Charter Income Trust | 14,865 | ||||||||
| 2,468 | MFS Intermediate Income Trust | 14,932 | ||||||||
| 952 | Neuberger Berman Income Opportunity Fund | 14,946 | ||||||||
| 2,279 | Putnam Premier Income Trust | 15,041 | ||||||||
| 1,037 | Templeton Emerging Markets Income Fund | 15,088 | ||||||||
| 834 | Western Asset Emerging Markets Debt Fund | 14,904 | ||||||||
| 1,368 | Western Asset High Income Fund II | 14,952 | ||||||||
| 1,294 | Western Asset/Claymore US Treasury Inflation Protected Securities Fund 2 | 14,933 | ||||||||
| TOTAL INVESTMENT COMPANIES (Cost $2,511,500) | $ | 2,517,867 | ||||||||
| Face | ||||||||||
| Amount | Value | |||||||||
SHORT TERM INVESTMENTS - 72.5% | ||||||||||
U.S. GOVERNMENT OBLIGATIONS 71.8% | ||||||||||
| $ | 2,250,000 | Farmer Mac Discount Note 4.881%, 07/02/2007 | $ | 2,250,000 | ||||||
| 2,250,000 | Federal Farm Credit Discount Note 4.800%, 07/02/2007 | 2,250,000 | ||||||||
| 2,250,000 | Federal Home Loan Bank Discount Note 5.271%, 07/02/2007 | 2,250,000 | ||||||||
| 2,250,000 | Freddie Mac Discount Note 4.829%, 07/02/2007 | 2,250,000 | ||||||||
| TOTAL U.S. GOVERNMENT AGENCY OBLIGATIONS | $ | 9,000,000 | ||||||||
| Shares | ||||||||||
| MONEY MARKET FUND 0.7% | ||||||||||
| 83,314 | Federated Prime Obligations Fund - Class I | $ | 83,314 | |||||||
| TOTAL SHORT-TERM INVESTMENTS (Cost $9,083,314) | 9,083,314 | |||||||||
| TOTAL INVESTMENTS - 92.6% (Cost $11,594,814) | 11,601,181 | |||||||||
| Other Assets in Excess of Liabilities - 7.4% | 931,226 | |||||||||
| TOTAL NET ASSETS - 100.0% | $ | 12,532,407 | ||||||||
Percentages are calculated as a percent of net assets.
See notes to the financial statements.
6
Direxion Evolution VP All-Cap Equity Fund
Schedule of Investments
June 30, 2007 (Unaudited)
| Shares | Value | |||||||||
COMMON STOCKS - 69.4% | ||||||||||
Aerospace & Defense - 0.8% | ||||||||||
| 953 | Alliant Techsystems, Inc.* | $ | 94,490 | |||||||
| 538 | Ceradyne, Inc.* | 39,791 | ||||||||
| 186 | Lockheed Martin Corp. | 17,508 | ||||||||
| 1,013 | United Technologies Corp. | 71,852 | ||||||||
| 223,641 | ||||||||||
Air Freight & Logistics - 0.6% | ||||||||||
| 598 | FedEx Corp. | 66,360 | ||||||||
| 2,050 | Forward Air Corp. | 69,885 | ||||||||
| 864 | Ryanair Holdings PLC - ADR* | 32,616 | ||||||||
| 168,861 | ||||||||||
Airlines - 0.4% | ||||||||||
| 3,198 | UAL Corp.* | 129,807 | ||||||||
Auto Components - 0.4% | ||||||||||
| 313 | Johnson Controls, Inc. | 36,236 | ||||||||
| 2,280 | Keystone Automotive Industries, Inc.* | �� | 94,324 | |||||||
| 130,560 | ||||||||||
Automobiles - 0.6% | ||||||||||
| 694 | DaimlerChrysler AG | 63,814 | ||||||||
| 895 | Harley-Davidson, Inc. | 53,351 | ||||||||
| 690 | Honda Motor Co. Ltd. - ADR | 25,040 | ||||||||
| 274 | Monaco Coach Corp.* | 3,932 | ||||||||
| 1,312 | Nissan Motor Co Ltd. - ADR | 28,129 | ||||||||
| 174,266 | ||||||||||
Beverages - 1.1% | ||||||||||
| 543 | Coca-Cola Enterprises, Inc. | 13,032 | ||||||||
| 1,029 | Companhia de Bebidas das Americas | 72,030 | ||||||||
| 1,236 | Diageo PLC - ADR | 102,971 | ||||||||
Beverages - 1.1% (Continued) | ||||||||||
| 913 | Fomento Economico Mexicano SA de CV - ADR | 35,899 | ||||||||
| 1,651 | PepsiCo, Inc. | 107,068 | ||||||||
| 331,000 | ||||||||||
Biotechnology - 0.8% | ||||||||||
| 2,194 | Amgen, Inc.* | 121,306 | ||||||||
| 1,849 | Celgene Corp.* | 106,003 | ||||||||
| 108 | Invitrogen Corp.* | 7,965 | ||||||||
| 235,274 | ||||||||||
Capital Markets - 0.6% | ||||||||||
| 146 | AG Edwards, Inc. | 12,344 | ||||||||
| 462 | Credit Suisse Group - ADR | 32,784 | ||||||||
| 4,032 | Janus Capital Group, Inc. | 112,251 | ||||||||
| 112 | SWS Group, Inc. | 2,421 | ||||||||
| 2,363 | TradeStation Group, Inc.* | 27,529 | ||||||||
| 187,329 | ||||||||||
Chemicals - 0.1% | ||||||||||
| 202 | Cytec Industries, Inc. | 12,881 | ||||||||
| 169 | Lubrizol Corp. | 10,909 | ||||||||
| 23,790 | ||||||||||
Commercial Banks - 2.6% | ||||||||||
| 2,729 | ABN AMRO Holding NV - ADR | 125,316 | ||||||||
| 7,994 | Banco Bradesco SA | 192,735 | ||||||||
| 3,445 | Banco Itau Holding Financeira SA | 153,096 | ||||||||
| 1,547 | BanColombia SA | 50,788 | ||||||||
| 642 | Barclays PLC - ADR | 35,817 | ||||||||
| 322 | Comerica, Inc. | 19,149 | ||||||||
| 572 | Kookmin Bank - ADR* | 50,176 | ||||||||
| 1,043 | Uniao de Bancos Brasileiros SA | 117,724 | ||||||||
| 744,801 | ||||||||||
See notes to the financial statements.
7
Direxion Evolution VP All-Cap Equity Fund
Schedule of Investments (continued)
June 30, 2007 (Unaudited)
| Shares | Value | |||||||||
COMMON STOCKS - 69.4% (Continued) | ||||||||||
Commercial Services & Supplies - 1.2% | ||||||||||
| 249 | Career Education Corp.* | $ | 8,409 | |||||||
| 316 | Deluxe Corp. | 12,833 | ||||||||
| 434 | Equifax, Inc. | 19,278 | ||||||||
| 1,402 | Gevity HR, Inc. | 27,101 | ||||||||
| 193 | ITT Educational Services, Inc.* | 22,654 | ||||||||
| 1,194 | Labor Ready, Inc.* | 27,593 | ||||||||
| 415 | Manpower, Inc. | 38,280 | ||||||||
| 2,739 | Monster Worldwide, Inc.* | 112,573 | ||||||||
| 414 | Pitney Bowes, Inc. | 19,384 | ||||||||
| 300 | RR Donnelley & Sons Co. | 13,053 | ||||||||
| 395 | Tetra Tech, Inc.* | 8,512 | ||||||||
| 202 | Viad Corp. | 8,518 | ||||||||
| 139 | Volt Information Sciences, Inc.* | 2,563 | ||||||||
| 425 | Waste Connections, Inc.* | 12,852 | ||||||||
| 333 | Waste Management, Inc. | 13,004 | ||||||||
| 13 | Watson Wyatt Worldwide, Inc. - Class A | 656 | ||||||||
| 347,263 | ||||||||||
Communications Equipment - 2.1% | ||||||||||
| 1,615 | CommScope, Inc.* | 94,235 | ||||||||
| 1,459 | Comtech Telecommunications Corp.* | 67,727 | ||||||||
| 2,185 | Harris Corp. | 119,192 | ||||||||
| 4,666 | Plantronics, Inc. | 122,342 | ||||||||
| 4,313 | QUALCOMM, Inc. | 187,141 | ||||||||
| 630 | Telefonaktiebolaget LM Ericsson - ADR | 25,131 | ||||||||
| 131 | Viasat, Inc.* | 4,205 | ||||||||
| 619,973 | ||||||||||
Computers & Peripherals - 2.6% | ||||||||||
| 1,540 | Apple Computer, Inc.* | 187,942 | ||||||||
| 6,601 | EMC Corp.* | 119,478 | ||||||||
Computers & Peripherals - 2.6% (Continued) | ||||||||||
| 696 | International Business Machines Corp. | 73,254 | ||||||||
| 2,160 | Komag, Inc.* | 68,882 | ||||||||
| 3,673 | Logitech International SA * ^ | 96,930 | ||||||||
| 1,412 | SanDisk Corp.* | 69,103 | ||||||||
| 7,713 | Western Digital Corp.* | 149,247 | ||||||||
| 764,836 | ||||||||||
Construction & Engineering - 0.1% | ||||||||||
| 116 | EMCOR Group, Inc.* | 8,456 | ||||||||
| 148 | Jacobs Engineering Group, Inc.* | 8,512 | ||||||||
| 16,968 | ||||||||||
Construction Materials - 0.9% | ||||||||||
| 4,155 | Cemex SAB de C.V. - ADR* | 153,319 | ||||||||
| 126 | Florida Rock Industries, Inc. | 8,505 | ||||||||
| 249 | Martin Marietta Materials, Inc. | 40,343 | ||||||||
| 436 | Texas Industries, Inc. | 34,187 | ||||||||
| 166 | Vulcan Materials Co. | 19,014 | ||||||||
| 255,368 | ||||||||||
Consumer Services - 0.0% | ||||||||||
| 185 | Pre-Paid Legal Services, Inc.* | 11,897 | ||||||||
Containers & Packaging - 0.1% | ||||||||||
| 360 | Aptargroup, Inc. | 12,802 | ||||||||
| 391 | Bemis Company, Inc. | 12,973 | ||||||||
| 82 | Rock-Tenn Co. - Class A* | 2,601 | ||||||||
| 302 | Sonoco Products Co. | 12,932 | ||||||||
| 41,308 | ||||||||||
Diversified Financial Services - 0.2% | ||||||||||
| 646 | Financial Federal Corp. | 19,264 | ||||||||
| 1,144 | ING Groep NV - ADR | 50,301 | ||||||||
| 69,565 | ||||||||||
See notes to the financial statements.
8
Direxion Evolution VP All-Cap Equity Fund
Schedule of Investments (continued)
June 30, 2007 (Unaudited)
| Shares | Value | |||||||||
COMMON STOCKS - 69.4% (Continued) | ||||||||||
Diversified Telecommunication Services - 2.3% | ||||||||||
| 738 | Compania Anonima Nacionl Tel - ADR | $ | 10,885 | |||||||
| 3,400 | KT Corp. - ADR* | 79,764 | ||||||||
| 2,190 | Philippine Long Distance Telephone Co. - ADR | 125,268 | ||||||||
| 9,716 | Qwest Communications International, Inc.* | 94,245 | ||||||||
| 5,114 | Tele Norte Leste Participacoes SA | 97,013 | ||||||||
| 3,000 | Telecomunicacoes De Sao Paulo | 97,620 | ||||||||
| 4,517 | Telefonos de Mexico SA de CV - ADR | 171,149 | ||||||||
| 675,944 | ||||||||||
Electric Utilities - 1.6% | ||||||||||
| 4,767 | Companhia Energetica de Minas Gerais | 100,584 | ||||||||
| 2,966 | Companhia Paranaense de Energia-Copel | 50,808 | ||||||||
| 465 | CPFL Energia S.A. - ADR | 28,240 | ||||||||
| 3,097 | E.ON AG - ADR | 172,317 | ||||||||
| 1,789 | Enersis S.A. - ADR | 35,869 | ||||||||
| 602 | Huaneng Power International, Inc. - ADR | 27,963 | ||||||||
| 1,626 | Korea Electric Power Corp. - ADR* | 35,609 | ||||||||
| 559 | The Southern Co. | 19,168 | ||||||||
| 470,558 | ||||||||||
Electrical Equipment - 2.7% | ||||||||||
| 4,323 | ABB Ltd. - ADR | 97,700 | ||||||||
| 291 | Aeroflex, Inc.* | 4,123 | ||||||||
| 192 | Arrow Electronics, Inc.* | 7,379 | ||||||||
| 136 | Avnet, Inc.* | 5,391 | ||||||||
| 5,247 | Cognex Corp. | 118,110 | ||||||||
| 337 | Cooper Industries Ltd. | 19,239 | ||||||||
| 391 | Emerson Electric Co. | 18,299 | ||||||||
Electrical Equipment - 2.7% (Continued) | ||||||||||
| 4,626 | Flir Systems, Inc.* | 213,952 | ||||||||
| 332 | Jabil Circuit, Inc. | 7,327 | ||||||||
| 5,270 | LoJack Corp.* | 117,468 | ||||||||
| 255 | Methode Electronics, Inc.* | 3,991 | ||||||||
| 3,996 | Molex, Inc. | 119,920 | ||||||||
| 967 | Park Electrochemical Corp. | 27,250 | ||||||||
| 277 | Rockwell Automation, Inc. | 19,235 | ||||||||
| 155 | Woodward Governor Co. | 8,319 | ||||||||
| 787,703 | ||||||||||
Electronic Equipment & Instruments - 0.4% | ||||||||||
| 3,373 | Amphenol Corp. - Class A | 120,247 | ||||||||
Energy Equipment & Services 3.3% | ||||||||||
| 124 | Atwood Oceanics, Inc.* | 8,509 | ||||||||
| 3,512 | BJ Services Co. | 99,881 | ||||||||
| 1,560 | Cameron International Corp.* | 111,493 | ||||||||
| 852 | ENSCO International, Inc. | 51,981 | ||||||||
| 1,081 | National-Oilwell, Inc.* | 112,684 | ||||||||
| 1,791 | Noble Corp. | 174,658 | ||||||||
| 3,064 | Pride International, Inc.* | 114,777 | ||||||||
| 1,244 | Tenaris SA - ADR | 60,906 | ||||||||
| 1,074 | Transocean, Inc.* | 113,823 | ||||||||
| 2,033 | Weatherford International Ltd.* | 112,303 | ||||||||
| 961,015 | ||||||||||
Food & Staples Retailing - 0.6% | ||||||||||
| 3,368 | The Kroger Co. | 94,742 | ||||||||
| 2,843 | Performance Food Group Co.* | 92,369 | ||||||||
| 187,111 | ||||||||||
Food Products - 0.4% | ||||||||||
| 496 | Campbell Soup Co. | 19,250 | ||||||||
| 347 | Hormel Foods Corp. | 12,960 | ||||||||
| 679 | Tootsie Roll Industries, Inc. | 18,815 | ||||||||
See notes to the financial statements.
9
Direxion Evolution VP All-Cap Equity Fund
Schedule of Investments (continued)
June 30, 2007 (Unaudited)
| Shares | Value | |||||||||
COMMON STOCKS - 69.4% (Continued) | ||||||||||
Food Products - 0.4% (Continued) | ||||||||||
| 908 | Unilever NV - ADR | $ | 28,166 | |||||||
| 1,115 | Unilever PLC - ADR | 35,970 | ||||||||
| 115,161 | ||||||||||
Gas Utilities - 0.0% | ||||||||||
| 137 | Atmos Energy Corp.* | 4,118 | ||||||||
Health Care Equipment & Supplies - 1.1% | ||||||||||
| 2,738 | Advanced Medical Optics, Inc.* | 95,501 | ||||||||
| 2,122 | Arthrocare Corp.* | 93,177 | ||||||||
| 174 | Becton, Dickinson & Co. | 12,963 | ||||||||
| 103 | C.R. Bard, Inc. | 8,511 | ||||||||
| 134 | Greatbatch, Inc.* | 4,342 | ||||||||
| 333 | Immucor, Inc.* | 9,314 | ||||||||
| 1,694 | Varian, Inc.* | 92,882 | ||||||||
| 33 | Viasys Healthcare, Inc.* | 1,411 | ||||||||
| 318,101 | ||||||||||
Health Care Providers & Services - 1.5% | ||||||||||
| 150 | Aetna, Inc. | 7,410 | ||||||||
| 229 | Amedisys, Inc.* | 8,320 | ||||||||
| 1,947 | AMERIGROUP Corp.* | 46,339 | ||||||||
| 247 | CIGNA Corp. | 12,898 | ||||||||
| 1,245 | Coventry Health Care, Inc.* | 71,774 | ||||||||
| 146 | Express Scripts, Inc.* | 7,301 | ||||||||
| 141 | Health Net, Inc.* | 7,445 | ||||||||
| 177 | Healthways, Inc.* | 8,384 | ||||||||
| 2,204 | Humana, Inc.* | 134,246 | ||||||||
| 166 | Laboratory Corp Of America Holdings* | 12,991 | ||||||||
| 3,026 | Odyssey HealthCare, Inc.* | 35,888 | ||||||||
| 1,392 | Quest Diagnostics, Inc. | 71,897 | ||||||||
Health Care Providers & Services - 1.5% (Continued) | ||||||||||
| 201 | Sierra Health Services, Inc.* | 8,358 | ||||||||
| 74 | Wellpoint, Inc.* | 5,907 | ||||||||
| 439,158 | ||||||||||
Health Care Technology - 0.1% | ||||||||||
| 1,299 | IMS Health, Inc. | 41,737 | ||||||||
Hotels Restaurants & Leisure - 0.6% | ||||||||||
| 1,367 | Ctrip.com International Ltd. - ADR | 107,487 | ||||||||
| 352 | IHOP Corp. | 19,159 | ||||||||
| 378 | McDonald’s Corp. | 19,187 | ||||||||
| 205 | O’Charleys, Inc.* | 4,133 | ||||||||
| 89 | Papa John’s International, Inc.* | 2,560 | ||||||||
| 580 | Yum! Brands, Inc. | 18,978 | ||||||||
| 171,504 | ||||||||||
Household Durables - 1.7% | ||||||||||
| 1,659 | Beazer Homes USA, Inc. | 40,927 | ||||||||
| 602 | The Black & Decker Corp. | 53,163 | ||||||||
| 374 | D.R. Horton, Inc. | 7,454 | ||||||||
| 592 | Desarrolladora Homex SA de CV - ADR* | 35,869 | ||||||||
| 130 | Fortune Brands, Inc. | 10,708 | ||||||||
| 189 | KB Home | 7,441 | ||||||||
| 335 | Leggett & Platt, Inc. | 7,387 | ||||||||
| 1,479 | Lennar Corp. | 54,072 | ||||||||
| 4,949 | Matsushita Electric Industrial Co. Ltd. - ADR | 98,040 | ||||||||
| 839 | MDC Holdings, Inc. | 40,574 | ||||||||
| 1,503 | Meritage Homes Corp.* | 40,205 | ||||||||
| 1,015 | Ryland Group, Inc. | 37,931 | ||||||||
| 2,327 | Toll Brothers, Inc.* | 58,128 | ||||||||
| 65 | Whirlpool Corp. | 7,228 | ||||||||
| 499,127 | ||||||||||
See notes to the financial statements.
10
Direxion Evolution VP All-Cap Equity Fund
Schedule of Investments (continued)
June 30, 2007 (Unaudited)
| Shares | Value | |||||||||
COMMON STOCKS - 69.4% (Continued) | ||||||||||
Household Products - 0.0% | ||||||||||
| 1,068 | Central Garden and Pet Co.* | $ | 13,094 | |||||||
Independent Power Producers & Energy Traders 0.1% | ||||||||||
| 184 | Constellation Energy Group, Inc. | 16,039 | ||||||||
Industrial Conglomerates - 0.6% | ||||||||||
| 612 | 3M Co. | 53,116 | ||||||||
| 1,159 | Carlisle Cos., Inc. | 53,905 | ||||||||
| 486 | Textron, Inc. | 53,513 | ||||||||
| 160,534 | ||||||||||
Insurance - 1.2% | ||||||||||
| 2,564 | Aegon NV - ADR | 50,383 | ||||||||
| 2,157 | Allianz AG - ADR | 50,193 | ||||||||
| 2,846 | Brown & Brown, Inc. | 71,549 | ||||||||
| 663 | China Life Insurance Company Ltd. - ADR* | 35,583 | ||||||||
| 1,251 | Chubb Corp. | 67,729 | ||||||||
| 149 | First American Corp. | 7,376 | ||||||||
| 410 | Prudential Financial, Inc. | 39,864 | ||||||||
| 1,516 | Selective Insurance Group, Inc. | 40,750 | ||||||||
| 363,427 | ||||||||||
Internet & Catalog Retail - 1.1% | ||||||||||
| 1,655 | Amazon.com, Inc.* | 113,218 | ||||||||
| 4,040 | Coldwater Creek, Inc.* | 93,849 | ||||||||
| 3,726 | eBay, Inc.* | 119,903 | ||||||||
| 326,970 | ||||||||||
Internet Software & Services - 2.2% | ||||||||||
| 194 | Baidu.com, Inc. - ADR* | 32,588 | ||||||||
| 1,405 | Bankrate, Inc.* | 67,328 | ||||||||
| 359 | Google, Inc.* | 187,893 | ||||||||
| 1,970 | j2 Global Communications, Inc.* | 68,753 | ||||||||
| 1,659 | NetEase.com, Inc. - ADR* | 28,236 | ||||||||
Internet Software & Services - 2.2% (Continued) | ||||||||||
| 3,126 | Websense, Inc.* | 66,428 | ||||||||
| 6,877 | Yahoo!, Inc.* | 186,573 | ||||||||
| 637,799 | ||||||||||
IT Services - 0.8% | ||||||||||
| 395 | Automatic Data Processing, Inc. | 19,146 | ||||||||
| 2,341 | The BISYS Group, Inc.* | 27,694 | ||||||||
| 1,485 | Cognizant Technology Solutions Corp.* | 111,509 | ||||||||
| 535 | Convergys Corp.* | 12,968 | ||||||||
| 164 | DST Systems, Inc.* | 12,990 | ||||||||
| 1,084 | SRA International, Inc. - Class A* | 27,382 | ||||||||
| 1,442 | SYKES Enterprises, Inc.* | 27,384 | ||||||||
| 239,073 | ||||||||||
Leisure Equipment & Products - 0.3% | ||||||||||
| 1,611 | Jakks Pacific, Inc.* | 45,334 | ||||||||
| 734 | Polaris Industries, Inc. | 39,753 | ||||||||
| 85,087 | ||||||||||
Machinery - 4.4% | ||||||||||
| 480 | ASV, Inc.* | 8,294 | ||||||||
| 408 | Barnes Group, Inc. | 12,925 | ||||||||
| 2,610 | Caterpillar, Inc. | 204,363 | ||||||||
| 65 | Cummins, Inc. | 6,579 | ||||||||
| 1,576 | Danaher Corp. | 118,988 | ||||||||
| 2,326 | Dover Corp. | 118,975 | ||||||||
| 576 | Eaton Corp. | 53,568 | ||||||||
| 1,750 | Graco, Inc. | 70,490 | ||||||||
| 968 | Harsco Corp. | 50,336 | ||||||||
| 221 | IDEX Corp. | 8,517 | ||||||||
| 1,345 | Illinois Tool Works, Inc. | 72,886 | ||||||||
| 369 | Kaydon Corp. | 19,232 | ||||||||
| 364 | Nordson Corp. | 18,258 | ||||||||
| 836 | Paccar, Inc. | 72,766 | ||||||||
See notes to the financial statements.
11
Direxion Evolution VP All-Cap Equity Fund
Schedule of Investments (continued)
June 30, 2007 (Unaudited)
| Shares | Value | |||||||||
COMMON STOCKS - 69.4% (Continued) | ||||||||||
Machinery - 4.4% (Continued) | ||||||||||
| 2,954 | Parker Hannifin Corp. | $ | 289,226 | |||||||
| 1,174 | Reliance Steel & Aluminum Co. | 66,049 | ||||||||
| 704 | Terex Corp.* | 57,235 | ||||||||
| 220 | Toro Co. | 12,956 | ||||||||
| 1,441 | Volvo AB - ADR | 28,662 | ||||||||
| 1,290,305 | ||||||||||
Media - 0.3% | ||||||||||
| 367 | Arbitron, Inc. | 18,912 | ||||||||
| 704 | Focus Media Holding Ltd. - ADR* | 35,552 | ||||||||
| 581 | Tribune Co. | 17,081 | ||||||||
| 11 | The Washington Post Co. - Class B | 8,537 | ||||||||
| 80,082 | ||||||||||
Medical Instruments - 0.6% | ||||||||||
| 2,774 | MedImmune, Inc.* | 160,892 | ||||||||
Metals & Mining - 3.9% | ||||||||||
| 184 | Alcoa, Inc. | 7,457 | ||||||||
| 479 | Allegheny Technologies, Inc. | 50,238 | ||||||||
| 2,117 | Aluminum Corporation of China Ltd. - ADR | 90,396 | ||||||||
| 703 | Chaparral Steel Co. | 50,525 | ||||||||
| 1,348 | Cia de Minas Buenaventura SA - ADR | 50,496 | ||||||||
| 863 | Cleveland-Cliffs, Inc. | 67,029 | ||||||||
| 706 | Companhia Siderurgica Nacional SA - ADR | 36,514 | ||||||||
| 685 | Freeport-McMoRan Copper & Gold, Inc. - Class B | 56,732 | ||||||||
| 1,967 | Gerdau SA | 50,578 | ||||||||
| 195 | Nucor Corp. | 11,437 | ||||||||
| 2,349 | Peabody Energy Corp. | 113,645 | ||||||||
| 2,386 | POSCO - ADR* | 286,320 | ||||||||
| 147 | Quanex Corp.* | 7,159 | ||||||||
Metals & Mining - 3.9% (Continued) | ||||||||||
| 662 | Rio Tinto PLC - ADR | 202,651 | ||||||||
| 433 | United States Steel Corp. | 47,089 | ||||||||
| 1,128,266 | ||||||||||
Multiline Retail - 0.4% | ||||||||||
| 102 | J.C. Penney Co., Inc. | 7,383 | ||||||||
| 1,329 | Kohl’s Corp.* | 94,399 | ||||||||
| 101,782 | ||||||||||
Oil, Gas & Consumable Fuels - 7.1% | ||||||||||
| 656 | Apache Corp. | 53,523 | ||||||||
| 1,193 | BG Group PLC - ADR | 97,575 | ||||||||
| 699 | BP PLC - ADR | 50,426 | ||||||||
| 1,667 | Cabot Oil & Gas Corp. | 61,479 | ||||||||
| 1,547 | Chesapeake Energy Corp. | 53,526 | ||||||||
| 636 | Chevron Corp. | 53,577 | ||||||||
| 1,530 | China Petroleum & Chemical Corp. - ADR | 170,809 | ||||||||
| 1,377 | Cimarex Energy Co. | 54,268 | ||||||||
| 441 | CNOOC Ltd. - ADR | 50,137 | ||||||||
| 1,605 | ConocoPhillips | 125,992 | ||||||||
| 686 | Devon Energy Corp. | 53,707 | ||||||||
| 695 | ENI SpA - ADR | 50,283 | ||||||||
| 636 | Exxon Mobil Corp. | 53,348 | ||||||||
| 259 | Frontier Oil Corp. | 11,336 | ||||||||
| 126 | Hess Corp. | 7,429 | ||||||||
| 2,061 | Marathon Oil Corp. | 123,578 | ||||||||
| 1,594 | Murphy Oil Corp. | 94,747 | ||||||||
| 2,528 | Norsk Hydro ASA - ADR | 96,747 | ||||||||
| 935 | Occidental Petroleum Corp. | 54,118 | ||||||||
| 1,006 | Penn Virginia Corp. | 40,441 | ||||||||
| 1,160 | PetroChina Company Ltd. - ADR | 172,469 | ||||||||
| 1,429 | Petroleo Brasileiro SA - ADR | 173,295 | ||||||||
| 1,099 | Petroleum Development Corp.* | 52,181 | ||||||||
See notes to the financial statements.
12
Direxion Evolution VP All-Cap Equity Fund
Schedule of Investments (continued)
June 30, 2007 (Unaudited)
| Shares | Value | |||||||||
COMMON STOCKS - 69.4% (Continued) | ||||||||||
Oil, Gas & Consumable Fuels - 7.1% (Continued) | ||||||||||
| 982 | Royal Dutch Shell PLC - ADR | $ | 79,738 | |||||||
| 2,486 | Southwestern Energy Co.* | 110,627 | ||||||||
| 93 | Sunoco, Inc. | 7,410 | ||||||||
| 932 | Swift Energy Co.* | 39,852 | ||||||||
| 725 | Valero Energy Corp. | 53,549 | ||||||||
| 2,046,167 | ||||||||||
Paper & Forest Products - 0.2% | ||||||||||
| 765 | Aracruz Celulose SA | 50,674 | ||||||||
Personal Products - 0.1% | ||||||||||
| 359 | Alberto-Culver Co. | 8,516 | ||||||||
| 1,745 | Mannatech, Inc. | 27,728 | ||||||||
| 36,244 | ||||||||||
Pharmaceuticals - 1.2% | ||||||||||
| 360 | Abbott Laboratories | 19,278 | ||||||||
| 1,391 | AstraZeneca PLC - ADR | 74,391 | ||||||||
| 191 | Bradley Pharmaceuticals, Inc.* | 4,147 | ||||||||
| 3,398 | Elan Corp. PLC - ADR* | 74,518 | ||||||||
| 138 | Johnson & Johnson | 8,503 | ||||||||
| 383 | King Pharmaceuticals, Inc.* | 7,836 | ||||||||
| 205 | Omnicare, Inc. | 7,392 | ||||||||
| 303 | Pfizer, Inc. | 7,748 | ||||||||
| 2,773 | Sepracor, Inc.* | 113,748 | ||||||||
| 483 | Shire Pharmaceuticals PLC - ADR | 35,805 | ||||||||
| 353,366 | ||||||||||
Real Estate Investment Trusts - 0.0% | ||||||||||
| 232 | CB Richard Ellis Group, Inc. - Class A* | 8,468 | ||||||||
Road & Rail - 0.7% | ||||||||||
| 1,132 | Burlington Northern Santa Fe Corp. | 96,378 | ||||||||
| 3,110 | Old Dominion Freight Line, Inc.* | 93,767 | ||||||||
| 190,145 | ||||||||||
Semiconductor & Semiconductor Equipment - 4.0% | ||||||||||
| 3,991 | Altera Corp. | 88,321 | ||||||||
| 508 | Analog Devices, Inc. | 19,121 | ||||||||
| 1,082 | Cree, Inc.* | 27,970 | ||||||||
| 1,746 | Diodes, Inc.* | 72,930 | ||||||||
| 805 | Intel Corp. | 19,127 | ||||||||
| 2,821 | Intevac, Inc.* | 59,974 | ||||||||
| 2,990 | Lam Research Corp.* | 153,686 | ||||||||
| 5,171 | Linear Technology Corp. | 187,087 | ||||||||
| 1,074 | MEMC Electronic Materials, Inc.* | 65,643 | ||||||||
| 4,976 | Microsemi Corp.* | 119,175 | ||||||||
| 146 | MKS Instruments, Inc.* | 4,044 | ||||||||
| 4,979 | Texas Instruments, Inc. | 187,360 | ||||||||
| 8,094 | United Microelectronics Corp. - ADR | 27,682 | ||||||||
| 4,424 | Xilinx, Inc. | 118,430 | ||||||||
| 1,150,550 | ||||||||||
Software - 2.4% | ||||||||||
| 2,558 | ANSYS, Inc.* | 67,787 | ||||||||
| 5,470 | Captaris, Inc.* | 28,006 | ||||||||
| 571 | Citrix Systems, Inc.* | 19,226 | ||||||||
| 638 | Intuit, Inc.* | 19,191 | ||||||||
| 997 | Manhattan Associates, Inc.* | 27,826 | ||||||||
| 2,191 | MICRO Systems, Inc.* | 119,190 | ||||||||
| 653 | Microsoft Corp. | 19,244 | ||||||||
| 5,646 | Oracle Corp.* | 111,283 | ||||||||
| 5,561 | Quality Systems, Inc. | 211,151 | ||||||||
See notes to the financial statements.
13
Direxion Evolution VP All-Cap Equity Fund
Schedule of Investments (continued)
June 30, 2007 (Unaudited)
| Shares | Value | |||||||||
COMMON STOCKS - 69.4% (Continued) | ||||||||||
Software - 2.4% (Continued) | ||||||||||
| 1,176 | Shanda Interactive Entertainment Ltd. - ADR* | $ | 36,456 | |||||||
| 890 | THQ, Inc.* | 27,163 | ||||||||
| 686,523 | ||||||||||
Specialty Retail - 3.1% | ||||||||||
| 293 | Abercrombie & Fitch Co. - Class A | 21,383 | ||||||||
| 183 | Advance Auto Parts | 7,417 | ||||||||
| 611 | Aeropostale, Inc.* | 25,466 | ||||||||
| 843 | Autozone, Inc.* | 115,171 | ||||||||
| 392 | CarMax, Inc.* | 9,996 | ||||||||
| 1,627 | Christopher & Banks Corp. | 27,903 | ||||||||
| 2,396 | HOT Topic, Inc.* | 26,045 | ||||||||
| 1,829 | Men’s Wearhouse, Inc. | 93,407 | ||||||||
| 26 | OfficeMax, Inc. | 1,022 | ||||||||
| 2,573 | O’Reilly Automotive, Inc.* | 94,043 | ||||||||
| 1,230 | Pacific Sunwear of California, Inc.* | 27,060 | ||||||||
| 2,470 | The Sherwin-Williams Co. | 164,181 | ||||||||
| 1,784 | Tractor Supply Co.* | 92,857 | ||||||||
| 2,099 | Tween Brands, Inc.* | 93,615 | ||||||||
| 4,021 | Zale Corp.* | 95,740 | ||||||||
| 895,306 | ||||||||||
Textiles, Apparel & Luxury Goods - 0.3% | ||||||||||
| 949 | K-Swiss, Inc. - Class A | 26,885 | ||||||||
| 296 | Liz Claiborne, Inc. | 11,041 | ||||||||
| 103 | Movado Group, Inc. | 3,475 | ||||||||
| 827 | Nike, Inc. - Class B | 48,206 | ||||||||
| 89,607 | ||||||||||
Thrifts & Mortgage Finance - 0.7% | ||||||||||
| 1,610 | Countrywide Financial Corp. | 58,524 | ||||||||
| 603 | Downey Financial Corp. | 39,786 | ||||||||
Thrifts & Mortgage Finance - 0.7% (Continued) | ||||||||||
| 703 | FirstFed Financial Corp.* | 39,881 | ||||||||
| 1,338 | The PMI Group Inc. | 59,768 | ||||||||
| 197,959 | ||||||||||
Tobacco - 0.2% | ||||||||||
| 157 | Altria Group, Inc. | 11,012 | ||||||||
| 634 | Reynolds American, Inc. | 41,337 | ||||||||
| 52,349 | ||||||||||
Trading Companies & Distributors - 0.2% | ||||||||||
| 579 | W.W. Grainger, Inc. | 53,876 | ||||||||
Water Utilities 0.2% | ||||||||||
| 1,138 | Companhia de Saneamento Basico do Estado de Sao Paulo - ADR | 50,163 | ||||||||
Wireless Telecommunication Services - 1.6% | ||||||||||
| 1,157 | America Movil SA de CV, Series L - ADR | 71,653 | ||||||||
| 10,026 | China Unicom Ltd. - ADR | 172,748 | ||||||||
| 1,011 | Mobile TeleSystems - ADR* | 61,236 | ||||||||
| 316 | OAO Vimpel-Communications - ADR | 33,294 | ||||||||
| 2,881 | SK Telecom Co. Ltd. - ADR | 78,796 | ||||||||
| 1,075 | Vodafone Group PLC - ADR | 36,152 | ||||||||
| 453,879 | ||||||||||
| TOTAL COMMON STOCKS (Cost $18,624,029) | $ | 20,186,617 | ||||||||
INVESTMENT COMPANIES - 8.6% | ||||||||||
| 6,695 | iShares S&P MidCap Value Index Fund | 579,452 | ||||||||
| 5,296 | iShares Russell Microcap Index Fund | 320,408 | ||||||||
See notes to the financial statements.
14
Direxion Evolution VP All-Cap Equity Fund
Schedule of Investments (continued)
June 30, 2007 (Unaudited)
| Shares | Value | |||||||||
INVESTMENT COMPANIES - 8.6% (Continued) | ||||||||||
| 6,234 | iShares MSCI Emerging Markets Index Fund | $ | 815,719 | |||||||
| 3,694 | iShares S&P Latin American 40 Index Fund | 787,007 | ||||||||
| TOTAL INVESTMENT COMPANIES (Cost $2,328,507) | $ | 2,502,586 | ||||||||
| Face | ||||||||||
| Amount | ||||||||||
SHORT-TERM INVESTMENTS - 15.1%’ | ||||||||||
| $ | 4,401,000 | Federal Farm Credit Discount Note 4.869%, 07/02/2007 | $ | 4,401,000 | ||||||
| Shares | Value | |||||||||
MONEY MARKET FUND - 0.0% | ||||||||||
| 9,367 | Federated Prime Obligations Fund - Class I | $ | 9,367 | |||||||
| TOTAL SHORT-TERM INVESTMENTS (Cost $4,410,367) | $ | 4,410,367 | ||||||||
| TOTAL INVESTMENTS - 93.1% (Cost $25,362,903) | $ | 27,099,570 | ||||||||
| Other Assets in Excess of Liabilities - 6.9% | 2,007,444 | |||||||||
| TOTAL NET ASSETS - 100.0% | $ | 29,107,014 | ||||||||
Percentages are stated as a percent of net assets.
ADR American Depository Receipt
| * | Non-income producing. |
| ^ | Foreign security. |
Schedule of Short Futures Contracts
June 30, 2007 (Unaudited)
| Unrealized | ||||||||||
| Contracts | (Depreciation) | |||||||||
| 157 | NASDAQ 100 Mini Futures | |||||||||
| Expiring September 2007 (Underlying Face Amount at Market Value $6,144,195) | ($ | 104,994 | ) | |||||||
See notes to the financial statements.
15
Direxion Dynamic VP HY Bond Fund
Schedule of Investments
June 30, 2007 (Unaudited)
| Shares | Value | |||||||||
| COMMON STOCKS 0.3% | ||||||||||
Oil, Gas & Consumable Fuels 0.3% | ||||||||||
| 400 | Teekay Shipping Corp. | $ | 23,164 | |||||||
| TOTAL COMMON STOCKS (Cost $24,220) | $ | 23,164 | ||||||||
| Face | ||||||||||
| Amount | ||||||||||
CORPORATE BONDS 22.0% | ||||||||||
Auto Components 6.7% | ||||||||||
| $ | 500,000 | Goodyear Tire & Rubber Co. 9.140%, 12/01/2009 (Acquired 11/16/2006, Cost $499,046)(1)(2) | $ | 503,749 | ||||||
Food Products 1.3% | ||||||||||
| 100,000 | Dole Food Co, Inc. 7.250%, 06/15/2010 | 97,000 | ||||||||
Grantor Trust 11.2% | ||||||||||
| 850,000 | TRAINS High Yield Note, 7.548%, 05/01/2016 (Cost $834,063; Acquired 07/06/2006)(1)(2) | 836,644 | ||||||||
Health Care Providers & Services 1.4% | ||||||||||
| 100,000 | Triad Hospitals, Inc. 7.000%, 11/15/2013 | 105,370 | ||||||||
CORPORATE BONDS 22.0% (continued) | ||||||||||
| Face | ||||||||||
| Amount | Value | |||||||||
Metals & Mining 1.4% | ||||||||||
| $ | 100,000 | Novelis, Inc. 8.250%, 02/15/2015 | $ | 103,125 | ||||||
| TOTAL CORPORATE BONDS (Cost $1,622,835) | $ | 1,645,888 | ||||||||
| TOTAL INVESTMENTS - 22.3% (Cost $1,647,055) | $ | 1,669,052 | ||||||||
| Other Assets in Excess of Liabilities - 77.7% | 5,848,784 | |||||||||
| TOTAL NET ASSETS - 100.0% | $ | 7,517,836 | ||||||||
Percentages are stated as a percent of net assets.
| (1) | 144A securities are those that are exempt from registration under Rule 144A of the Securities Act of 1933, as amended. These securities are generally issued to qualified institutional buyers (“QIBs”), such as the Fund. Any resale of these securities must generally be effected through a sale that is exempt from registration (e.g. a sale to another QIB), or the security must be registered for public sale. At June 30, 2007, the market value of 144A securities was $1,340,393 or 17.8% of net assets. |
| (2) | The coupon rate shown on variable rate securities represents rates on June 30, 2007. |
See notes to the financial statements.
16
Direxion Dynamic VP HY Bond Fund
Schedule of Securities Sold Short
June 30, 2007 (Unaudited)
| Face | ||||||||||
| Amount | Value | |||||||||
CORPORATE BOND: | ||||||||||
| $ | 16,000 | Goodyear Tire & Rubber Co. 9.00%, 07/01/2015 | $ | 17,320 | ||||||
| TOTAL SECURITIES SOLD SHORT (Proceeds $17,128) | $ | 17,320 | ||||||||
Schedule of Swap Contracts
June 30, 2007 (Unaudited)
| Market | Notional | Termination | Appreciation/ | |||||||||||||||||
Counterparty | Reference Entity | Value | Amount | Date | (Depreciation) | |||||||||||||||
| Barclays | General Motors Corp. | $ | 1,976,700 | $ | 2,000,000 | 3/20/2010 | $ | (21,839 | ) | |||||||||||
See notes to the financial statements.
17
Statements Of Assets and Liabilities (Unaudited)
June 30, 2007
| Evolution VP Managed | Evolution VP All-Cap | Dynamic VP HY | ||||||||||
| Bond Fund | Equity Fund | Bond Fund | ||||||||||
Assets: | ||||||||||||
| Investments, at market value (Note 2) | $ | 11,601,181 | $ | 27,099,570 | $ | 1,669,052 | ||||||
| Cash | — | 5,656 | — | |||||||||
| Receivable for investments sold | 1,095,437 | 2,588,525 | 6,146,397 | |||||||||
| Receivable for Fund shares sold | 5,093 | 46,035 | 162,867 | |||||||||
| Receivable for futures | — | — | 6,716 | |||||||||
| Deposit at broker for futures | — | 3,258 | 18,000 | |||||||||
| Deposit at broker for shorts | — | 408,200 | — | |||||||||
| Deposit at broker for swaps | — | — | 1,070,000 | |||||||||
| Dividends and interest receivable | 35,121 | 26,902 | 247,610 | |||||||||
| Other assets | 6,771 | 10,255 | 14,312 | |||||||||
| Total Assets | 12,743,603 | 30,188,401 | 9,334,954 | |||||||||
Liabilities: | ||||||||||||
| Securities Sold Short | — | — | 17,320 | |||||||||
| Payable for investments purchased | 137,971 | 982,930 | — | |||||||||
| Payable for Fund shares redeemed | 1,005 | 3,477 | 42 | |||||||||
| Payable for variation margin | — | 4,710 | — | |||||||||
| Payable to Custodian | 3,493 | — | 1,566,992 | |||||||||
| Payable to Adviser | 3,799 | 24,116 | 37,997 | |||||||||
| Payable to broker for swaps | — | — | 114,658 | |||||||||
| Unrealized depreciation on swaps | — | — | 21,839 | |||||||||
| Accrued distribution expense | 2,612 | 6,140 | 14,434 | |||||||||
| Accrued expenses and other liabilities | 62,316 | 60,014 | 43,836 | |||||||||
| Total Liabilities | 211,196 | 1,081,387 | 1,817,118 | |||||||||
Net Assets | $ | 12,532,407 | $ | 29,107,014 | $ | 7,517,836 | ||||||
Net Assets Consist Of: | ||||||||||||
| Capital stock | $ | 12,476,700 | $ | 25,644,932 | $ | 7,036,489 | ||||||
| Accumulated undistributed net investment income | 524,250 | 7,087 | 563,925 | |||||||||
| Accumulated undistributed net realized gain (loss) | (474,910 | ) | 1,823,322 | (82,544 | ) | |||||||
| Net unrealized appreciation (depreciation) | 6,367 | 1,631,673 | (34 | ) | ||||||||
| Total Net Assets | $ | 12,532,407 | $ | 29,107,014 | $ | 7,517,836 | ||||||
Calculation of Net Asset Value Per Share: | ||||||||||||
| Net assets | $ | 12,532,407 | $ | 29,107,014 | $ | 7,517,836 | ||||||
| Shares outstanding (unlimited shares of beneficial interest authorized, no par value) | 629,554 | 1,084,253 | 375,013 | |||||||||
| Net asset value, redemption price and offering price per share | $ | 19.91 | $ | 26.85 | $ | 20.05 | ||||||
| Cost of Investments | $ | 11,594,814 | $ | 25,362,903 | $ | 1,647,055 | ||||||
| Proceeds from Securities Sold Short | $ | — | $ | — | $ | 17,128 | ||||||
See notes to the financial statements.
18
Statements of Operations (Unaudited)
For the Six Months Ended June 30, 2007
| Evolution VP Managed | Evolution VP All-Cap | |||||||
| Bond Fund | Equity Fund | |||||||
Investment income: | ||||||||
| Dividend income (net of foreign withholding tax of $0 and $2,468, respectively) | $ | 187,658 | $ | 136,734 | ||||
| Interest income | 116,240 | 70,673 | ||||||
| Total investment income | 303,898 | 207,407 | ||||||
Expenses: | ||||||||
| Investment advisory fees | 63,476 | 141,086 | ||||||
| Distribution expenses | 15,869 | 35,272 | ||||||
| Administration fees | 8,679 | 8,679 | ||||||
| Shareholder servicing fees | 19,240 | 35,984 | ||||||
| Fund accounting fees | 15,124 | 15,124 | ||||||
| Custody fees | 4,878 | 4,835 | ||||||
| Professional fees | 13,989 | 14,806 | ||||||
| Reports to shareholders | 10,355 | 10,608 | ||||||
| Directors’ fees and expenses | 380 | 380 | ||||||
| Other | 1,899 | 1,899 | ||||||
| Total expenses before reimbursement/recoupment | 153,889 | 268,673 | ||||||
| Less: Reimbursement of expenses by Adviser | (26,938 | ) | — | |||||
| Plus: Recoupment of expenses by Adviser | — | 10,616 | ||||||
| Total expenses | 126,951 | 279,289 | ||||||
Net investment income | 176,947 | (71,882 | ) | |||||
Realized and unrealized gain (loss) on investments: | ||||||||
| Net realized gain (loss) on: | ||||||||
| Investments | (144,443 | ) | 2,257,329 | |||||
| Futures | (778 | ) | (1,038,897 | ) | ||||
| Swaps | 17,428 | — | ||||||
| (127,793 | ) | 1,218,432 | ||||||
| Change in unrealized appreciation (depreciation) on: | ||||||||
| Investments | (109,079 | ) | 184,113 | |||||
| Futures | — | (104,994 | ) | |||||
| (109,079 | ) | 79,119 | ||||||
| Net realized and unrealized gain (loss) on investments | (236,872 | ) | 1,297,551 | |||||
Net increase (decrease) in net assets resulting from operations | $ | (59,925 | ) | $ | 1,225,669 | |||
See notes to the financial statements.
19
Statements of Operations (Unaudited)
For the Six Months Ended June 30, 2007
| Dynamic VP HY | ||||
| Bond Fund | ||||
Investment income: | ||||
| Dividend income | $ | 4,176 | ||
| Interest income | 1,277,072 | |||
| Total investment income | 1,281,248 | |||
Expenses: | ||||
| Investment advisory fees | 163,611 | |||
| Distribution expenses | 130,889 | |||
| Administration fees | 8,679 | |||
| Shareholder servicing fees | 4,853 | |||
| Fund accounting fees | 10,165 | |||
| Custody fees | 3,030 | |||
| Professional fees | 16,247 | |||
| Reports to shareholders | 6,116 | |||
| Directors’ fees and expenses | 1,107 | |||
| Other | 2,488 | |||
| Total expenses before waiver/recoupment | 347,185 | |||
| Less: Waiver of expenses by Distributor | (32,722 | ) | ||
| Total expenses | 314,463 | |||
Net investment income | 966,785 | |||
Realized and unrealized gain (loss) on investments: | ||||
| Net realized gain (loss) on: | ||||
| Investments | 709,214 | |||
| Futures | (452,065 | ) | ||
| Swaps | 832,963 | |||
| 1,090,112 | ||||
| Change in unrealized appreciation (depreciation) on: | ||||
| Investments | (549,565 | ) | ||
| Swaps | (891,139 | ) | ||
| Short Securities | (192 | ) | ||
| (1,440,896 | ) | |||
| Net realized and unrealized gain (loss) on investments | (350,784 | ) | ||
Net increase in net assets resulting from operations | $ | 616,001 | ||
See notes to the financial statements.
20
Statements of Changes in Net Assets (Unaudited)
| Evolution VP Managed Bond Fund | Evolution VP All-Cap Equity Fund | |||||||||||||||
| Six Months Ended | Six Months Ended | |||||||||||||||
| June 30, 2007 | Year Ended | June 30, 2007 | Year Ended | |||||||||||||
| (Unaudited) | December 31, 2006 | (Unaudited) | December 31, 2006 | |||||||||||||
Operations: | ||||||||||||||||
| Net investment income | $ | 176,947 | $ | 288,211 | $ | (71,882 | ) | $ | 80,263 | |||||||
| Net realized gain (loss) on investments | (127,793 | ) | (110,474 | ) | 1,218,432 | 811,720 | ||||||||||
| Change in unrealized appreciation (depreciation) on investments | (109,079 | ) | 95,186 | 79,119 | 1,121,731 | |||||||||||
| Net increase (decrease) in net assets resulting from operations | (59,925 | ) | 272,923 | 1,225,669 | 2,013,714 | |||||||||||
Distributions to shareholders: | ||||||||||||||||
| Net investment income | (30,745 | ) | — | (4,381 | ) | |||||||||||
| Net realized gains | — | — | — | (358,497 | ) | |||||||||||
| Total distributions | — | (30,745 | ) | — | (362,878 | ) | ||||||||||
Capital share transactions: | ||||||||||||||||
| Proceeds from shares sold | 1,173,585 | 10,112,920 | 3,985,669 | 19,734,601 | ||||||||||||
| Proceeds from shares issued to holders in reinvestment of distributions | — | 30,745 | — | 362,878 | ||||||||||||
| Cost of shares redeemed | (1,821,451 | ) | (1,342,210 | ) | (3,308,211 | ) | (2,524,896 | ) | ||||||||
| Net increase in net assets resulting from beneficial interest transactions | (647,866 | ) | 8,801,455 | 677,458 | 17,572,583 | |||||||||||
Total increase (decrease) in net assets | (707,791 | ) | 9,043,633 | 1,903,127 | 19,223,419 | |||||||||||
Net assets: | ||||||||||||||||
| Beginning of period | 13,240,198 | 4,196,565 | 27,203,887 | 7,980,468 | ||||||||||||
| End of period | $ | 12,532,407 | $ | 13,240,198 | $ | 29,107,014 | $ | 27,203,887 | ||||||||
Accumulated undistributed net investment income, end of period | $ | 524,250 | $ | 347,303 | $ | 7,087 | $ | 78,969 | ||||||||
See notes to the financial statements.
21
Statements of Changes in Net Assets (Unaudited)
| Dynamic VP HY Bond Fund | ||||||||
| Six Months Ended | ||||||||
| June 30, 2007 | Year Ended | |||||||
| (Unaudited) | December 31, 2006 | |||||||
Operations: | ||||||||
| Net investment income | $ | 966,785 | $ | 1,663,824 | ||||
| Net realized loss on investments | 1,090,112 | (52,157 | ) | |||||
| Change in unrealized appreciation (depreciation) on investments | (1,440,896 | ) | 1,197,492 | |||||
| Net increase in net assets resulting from operations | 616,001 | 2,809,159 | ||||||
Distributions to shareholders: | ||||||||
| Net investment income | (792,364 | ) | (1,883,085 | ) | ||||
| Total distributions | (792,364 | ) | (1,883,085 | ) | ||||
Capital share transactions: | ||||||||
| Proceeds from shares sold | 26,594,169 | 139,777,384 | ||||||
| Proceeds from shares issued to holders in reinvestment of distributions | 792,364 | 1,883,085 | ||||||
| Cost of shares redeemed | (64,397,547 | ) | (133,025,705 | ) | ||||
| Net increase in net assets resulting from beneficial interest transactions | (37,011,014 | ) | 8,634,764 | |||||
Total increase (decrease) in net assets | (37,187,377 | ) | 9,560,838 | |||||
Net assets: | ||||||||
| Beginning of period | 44,705,213 | 35,144,375 | ||||||
| End of period | $ | 7,517,836 | $ | 44,705,213 | ||||
Accumulated undistributed net investment income, end of period | $ | 563,925 | $ | 389,504 | ||||
See notes to the financial statements.
22
Financial Highlights
| Evolution VP Managed Bond Fund | ||||||||||||||||
| Six Months Ended | ||||||||||||||||
| June 30, 2007 | Year Ended | Year Ended | July 1, 20041 | |||||||||||||
| (Unaudited) | December 31, 2006 | to December 31, 2005 | to December 31, 2004 | |||||||||||||
Per share data: | ||||||||||||||||
Net asset value, beginning of period | $ | 20.00 | $ | 19.61 | $ | 20.76 | $ | 20.00 | ||||||||
Income (loss) from investment operations: | ||||||||||||||||
Net investment income (loss)4 | 0.31 | 0.63 | 0.67 | 6 | 0.32 | |||||||||||
| Net realized and unrealized gain (loss) on investments | (0.40) | (0.19) | (1.54) | 0.44 | ||||||||||||
| Total from investment operations | (0.09) | 0.44 | (0.87) | 0.76 | ||||||||||||
Less distributions: | ||||||||||||||||
| Dividends from net investment income | — | (0.05) | (0.25) | — | ||||||||||||
| Distributions from realized gains | — | — | (0.03) | — | ||||||||||||
| Total distributions | — | (0.05) | (0.28) | — | ||||||||||||
Net asset value, end of period | $ | 19.91 | $ | 20.00 | $ | 19.61 | $ | 20.76 | ||||||||
Total return8 | 0.45% | 2 | 2.23% | (4.19)% | 3.80% | 2 | ||||||||||
Supplemental data and ratios: | ||||||||||||||||
| Net assets, end of period | $ | 12,532,407 | $ | 13,240,198 | $ | 4,196,565 | $ | 753,551 | ||||||||
| Ratio of net expenses to average net assets excluding short dividends: | ||||||||||||||||
| Before expense reimbursement/recoupment | 2.42% | 3 | 2.55% | 4.69% | 23.17% | 3 | ||||||||||
| After expense reimbursement/recoupment | 2.00% | 3 | 2.00% | 2.00% | 2.00% | 3 | ||||||||||
| Ratio of net expenses to average net assets including short dividends: | ||||||||||||||||
| Before expense reimbursement/recoupment | — | — | 4.93% | — | ||||||||||||
| After expense reimbursement/recoupment | — | — | 2.24% | — | ||||||||||||
| Ratio of net investment income (loss) to average net assets including short dividends: | ||||||||||||||||
| Before expense reimbursement/recoupment | 2.37% | 3 | 2.64% | 0.68% | (17.98)% | 3 | ||||||||||
| After expense reimbursement/recoupment | 2.79% | 3 | 3.19% | 3.37% | 7 | 3.19% | 3 | |||||||||
Portfolio turnover rate5 | 441% | 954% | 978% | 7% | ||||||||||||
1Commencement of operations.
2Not annualized.
3Annualized.
4Net investment income (loss) per share represents net investment income (loss) divided by the daily average shares of beneficial interest outstanding throughout each period.
5Portfolio turnover ratio is calculated without regard to short-term securities having a maturity of less than one year. Investments in options, swaps, futures contracts and repurchase agreements are deemed short-term securities. The Fund’s aggressive investment strategy may result in significant portfolio turnover to take advantage of anticipated changes in market conditions.
6Net investment income (loss) before dividends on short positions for the year ended December 31, 2005 was $0.72 for the Evolution VP Managed Bond Fund.
7The net investment income (loss) ratio included dividends on short positions. The ratio excluding dividends on short positions for the year ended December 31, 2005 was 3.60% for the Evolution VP Managed Bond Fund.
8All returns reflect reinvested dividends, if any, but do not reflect the impact of taxes or any fees and expenses imposed under the Contracts and Plans, which would increase overall fees and expenses. Please refer to your Contract or Plan prospectus for a description of those fees and expenses. See notes to the financial statements.
See notes to the financial statements.
23
Financial Highlights
| Evolution VP All-Cap Equity Fund | ||||||||||||||||
| Six Months Ended | ||||||||||||||||
| June 30, 2007 | Year Ended | Year Ended | July 1, 20041 | |||||||||||||
| (Unaudited) | December 31, 2006 | December 31, 2005 | to December 31, 2004 | |||||||||||||
Per share data: | ||||||||||||||||
Net asset value, beginning of period | $ | 25.71 | $ | 23.12 | $ | 21.06 | $ | 20.00 | ||||||||
Income (loss) from investment operations: | ||||||||||||||||
Net investment income (loss)4 | (0.07) | 0.11 | 0.03 | (0.15) | ||||||||||||
| Net realized and unrealized gain (loss) on investments | 1.21 | 2.83 | 2.03 | 1.21 | ||||||||||||
| Total from investment operations | 1.14 | 2.94 | 2.06 | 1.06 | ||||||||||||
Less distributions: | ||||||||||||||||
| Dividends from net investment income | — | (0.00) | 6 | — | — | |||||||||||
| Distributions from realized gains | — | (0.35) | — | — | ||||||||||||
| Total distributions | — | (0.35) | — | — | ||||||||||||
Net asset value, end of period | $ | 26.85 | $ | 25.71 | $ | 23.12 | $ | 21.06 | ||||||||
Total return7 | 4.40% | 2 | 12.70% | 9.78% | 5.30% | 2 | ||||||||||
Supplemental data and ratios: | ||||||||||||||||
| Net assets, end of period | $ | 29,107,014 | $ | 27,203,887 | $ | 7,980,468 | $ | 1,043,923 | ||||||||
| Ratio of net expenses to average net assets: | ||||||||||||||||
| Before expense reimbursement/recoupment | 1.90% | 3 | 2.09% | 3.84% | 20.13% | 3 | ||||||||||
| After expense reimbursement/recoupment | 1.98% | 3 | 2.00% | 2.00% | 2.00% | 3 | ||||||||||
| Ratio of net investment income (loss) to average net assets: | ||||||||||||||||
| Before expense reimbursement/recoupment | (0.43)% | 3 | 0.35% | (1.72)% | (19.66)% | 3 | ||||||||||
| After expense reimbursement/recoupment | (0.51)% | 3 | 0.44% | 0.12% | (1.53)% | 3 | ||||||||||
Portfolio turnover rate5 | 447% | 909% | 1,001% | 2% | ||||||||||||
1 Commencement of operations.
2 Not annualized.
3 Annualized.
4 Net investment income (loss) per share represents net investment income (loss) divided by the daily average shares of beneficial interest outstanding
throughout each period.
5 Portfolio turnover ratio is calculated without regard to short-term securities having a maturity of less than one year. Investments in options, swaps, futures contracts and repurchase agreements are deemed short-term securities. The Fund’s aggressive investment strategy may result in significant portfolio turnover to take advantage of anticipated changes in market conditions.
6 Amount less than $0.005 per share.
7 All returns reflect reinvested dividends, if any, but do not reflect the impact of taxes or any fees and expenses imposed under the Contracts and Plans, which would increase overall fees and expenses. Please refer to your Contract or Plan prospectus for a description of those fees and expenses.
See notes to the financial statements.
24
Financial Highlights
| Dynamic VP HY Bond Fund | ||||||||||||
| Six Months Ended | ||||||||||||
| June 30, 2007 | Year Ended | February 1, 20051 | ||||||||||
| (Unaudited) | December 31, 2006 | to December 31, 2005 | ||||||||||
Per share data: | ||||||||||||
Net asset value, beginning of period | $ | 20.43 | $ | 20.05 | $ | 20.00 | ||||||
Income (loss) from investment operations: | ||||||||||||
Net investment income (loss)4 | 0.45 | 0.96 | 0.90 | |||||||||
| Net realized and unrealized gain (loss) on investments | (0.48) | 0.27 | (0.60) | |||||||||
| Total from investment operations | (0.03) | 1.23 | 0.30 | |||||||||
Less distributions: | ||||||||||||
| Dividends from net investment income | (0.35) | (0.85) | (0.25) | |||||||||
| Total distributions | (0.35) | (0.85) | (0.25) | |||||||||
Net asset value, end of period | $ | 20.05 | $ | 20.43 | $ | 20.05 | ||||||
Total return6 | (0.18)% | 2 | 6.21% | 1.50% | 2 | |||||||
Supplemental data and ratios: | ||||||||||||
| Net assets, end of period | $ | 7,517,836 | $ | 44,705,213 | $ | 35,144,375 | ||||||
| Ratio of net expenses to average net assets: | ||||||||||||
| Before expense waiver/reimbursement | 1.59% | 3 | 1.68% | 1.94% | 3 | |||||||
| After expense waiver/reimbursement | 1.44% | 3 | 1.67% | 1.74% | 3 | |||||||
| Ratio of net investment income (loss) to average net assets: | ||||||||||||
| Before expense waiver/reimbursement | 4.28% | 3 | 4.74% | 4.78% | 3 | |||||||
| After expense waiver/reimbursement | 4.43% | 3 | 4.75% | 4.98% | 3 | |||||||
Portfolio turnover rate5 | 56% | 538% | 654% | |||||||||
1 Commencement of operations.
2 Not annualized.
3 Annualized.
4 Net investment income (loss) per share represents net investment income (loss) divided by the daily average shares of beneficial interest outstanding
throughout each period.
5 Portfolio turnover ratio is calculated without regard to short-term securities having a maturity of less than one year. Investments in options, swaps, futures contracts and repurchase agreements are deemed short-term securities. The Fund’s aggressive investment strategy may result in significant portfolio turnover to take advantage of anticipated changes in market conditions.
6 All returns reflect reinvested dividends, if any, but do not reflect the impact of taxes or any fees and expenses imposed under the Contracts and Plans, which would increase overall fees and expenses. Please refer to your Contract or Plan prospectus for a description of those fees and expenses.
See notes to the financial statements.
25
Direxion Insurance Trust
(Formerly Potomac Insurance Trust)
(Formerly Potomac Insurance Trust)
Notes to the Financial Statements
June 30, 2007 (Unaudited)
| 1. | ORGANIZATION |
Direxion Insurance Trust (the “Trust”) was organized as a Massachusetts business trust on December 28, 1999 and is registered under the Investment Company Act of 1940, as amended (the “1940 Act”), as an open-end management investment company issuing its shares in series, each series representing a distinct portfolio with its own investment objective and policies. The series presently in operation are the Evolution VP Managed Bond Fund, the Evolution VP All-Cap Equity Fund (formerly the Evolution VP Managed Equity Fund), and the Dynamic VP HY Bond Fund (each a “Fund” and collectively, the “Funds”). Each Fund is a “non-diversified” series of the Trust pursuant to the 1940 Act. The Trust offers shares to unaffiliated life insurance separate accounts (registered as unit investment trusts under the 1940 Act) to fund the benefits under variable annuity and variable life contracts. The Evolution VP Managed Bond Fund and Evolution VP All-Cap Equity Fund commenced operations on July 1, 2004. The Dynamic VP HY Bond Fund commenced operations on February 1, 2005.
The objective of the Evolution VP Managed Bond Fund is to seek the highest appreciation on an annual basis consistent with a high tolerance for risk by investing at least 80% of its assets (plus any borrowing for investment purposes) in fixed-income securities indirectly through securities that invest in or are a derivative of fixed-income securities, including exchange traded funds (“ETFs”) and closed-end investment companies (collectively, fixed-income securities). The objective of the Evolution VP All-Cap Equity Fund is to seek the highest appreciation on an annual basis consistent with a high tolerance for risk by investing at least 80% of its assets (plus any borrowing for investment purposes) in equity securities either directly through individual stocks and American Depository Receipts (“ADRs”) or indirectly through securities that invest in or are a derivative of equity securities. The objective of the Dynamic VP HY Bond Fund is to maximize total return (income plus capital appreciation) by investing primarily in debt instruments, including convertible securities, and derivatives of such instruments, with an emphasis on lower-quality debt instruments.
| 2. | SIGNIFICANT ACCOUNTING POLICIES |
The following is a summary of significant accounting policies consistently followed by the Funds in the preparation of their financial statements. These policies are in conformity with U.S. generally accepted accounting principles.
a) Investment Valuation – Equity securities, OTC securities, swap agreements, closed-end investment companies, options, futures, and options on futures are valued at their last sales price, or if not available, the average of the last bid and asked prices. Securities primarily traded on the NASDAQ National Market are valued using the NASDAQ Official Closing Price (“NOCP”). Short-term debt securities with a maturity of 60 days or less and money market securities are valued using the amortized cost method. Other debt securities are valued by using the closing bid and asked prices provided by the Funds’ pricing service or, if such services are unavailable, by a pricing matrix method. Securities for which reliable market quotations are not readily available, the Funds’ pricing service does not provide a valuation for such securities, the Funds’ pricing service provides valuation that in the judgment of Rafferty Asset Managements, LLC (the “Adviser”) does not represent fair value, or the Fund or Adviser believes the market price is stale will be fair valued as determined by the Adviser under the supervision of the Board of Trustees.
b) Repurchase Agreements – Each Fund may enter into repurchase agreements with institutions that are members of the Federal Reserve System or securities dealers who are members of a national securities exchange or are primary dealers in U.S. government securities. In connection with transactions in repurchase agreements, it is the Trust’s policy that the Fund receives, as collateral, cash and/or securities (primarily U.S. government securities) whose market value,
26
including accrued interest, at all times will be at least equal to 100% of the amount invested by the Fund in each repurchase agreement. If the seller defaults, and the value of the collateral declines, realization of the collateral by the Fund may be delayed or limited.
c) Swap Contracts – Each Fund may enter into equity swap contacts. Standard swap contracts are between two parties that agree to exchange the returns (or differentials in rates of return) earned or realized on particular predetermined investments or instruments. The gross amount to be exchanged is calculated with respect to a “notional amount” (i.e. the return on or increase in value of a particular dollar amount invested in a “basket” of securities representing a particular index or industry sector). The Fund’s obligations are accrued daily (offset by any amounts owed to the funds.)
In a “long” swap agreement, the counterparty will generally agree to pay the Funds the amount, if any, by which the notional amount of swap contract would have increased in value if the Funds had been invested in the particular securities, plus dividends that would have been received on those securities. The Funds will agree to pay the counterparty a floating rate of interest on the notional amount of the swap contract plus the amount, if any, by which the notional amount would have decreased in value had it been invested in such securities plus, in certain instances, commissions or trading spreads on the notional amounts. Thus, the return on the swap contract should be the gain or loss on the notional amount plus dividends on the securities less the interest paid by the Fund on the notional amount. Payments may be made at the conclusion of the contract or periodically during its term. Swap contracts do not include the delivery of securities or other underlying securities. The net amount of the excess, if any, of the Fund’s obligations over its entitlement with respect to each swap is accrued on a daily basis and an amount of cash or liquid assets, having an aggregate net asset value at least equal to such accrued excess is maintained in a segregated account by the Fund’s custodian. Until a swap contract is settled in cash, the gain or loss on the notional amount plus dividends on the securities less the interest paid by the Funds on the notional amount are recorded as “unrealized gains or losses on swaps and futures” and when cash is exchanged, the gain or loss is recorded as “realized gains or losses on swaps and futures.” Swap contracts are collateralized by the securities and cash of each particular Fund.
Each Fund may enter into swap contracts that provide the opposite return of the particular benchmark or security (“short” the index or security). The operations are similar to that of the swaps disclosed above except that the counterparty pays interest to the Fund on the notional amount outstanding and the dividends on the underlying securities reduce the value of the swap, plus, in certain instances, the Fund will agree to pay to the counterparty commissions or trading spreads on the notional amount. These amounts are netted with any unrealized appreciation or depreciation to determine the value of the swap.
The Dynamic VP HY Bond Fund may enter into credit default swaps. In a credit default swap, one party makes a stream of payments to another party in exchange for the right to receive a specified return in the event of a default by a referenced entity, typically corporate issues on its obligation. The stream of payments is recorded as an unrealized gain or loss and adjusted to include up-front payments recorded as a component of unrealized gain or loss on swaps, and/or interest associated with the agreement until the swap is sold or expires, at which point it is recognized as a component of realized gain or loss. The Fund may use the swaps to attempt to gain exposure to debt securities without actually purchasing those securities or to hedge a position. The Fund may purchase credit protection on the referenced entity of the credit default swap (“Buy Contract”) or provide credit protection on the referenced entity of the credit default swap (“Sale Contract”). If a credit event occurs, the maximum payout amount for a sale contract is limited to the notional amount of the swap contract (“Maximum Payout Amount”). Maximum Payout Amounts could be offset by the subsequent sale, if any, of assets obtained via the execution of a payout event.
Swap contracts involve, to varying degrees, elements of market risk and exposure to loss in excess of the amount reflected in the Statements of Assets and Liabilities. The notional amounts reflect the extent of the total investment exposure that each Fund has under the swap contract. The primary risks associated with the use of swap agreements are imperfect correlation between movements in the notional amount and the price of the underlying securities and the
27
inability of counterparties to perform. A Fund bears the risk of loss of the amount expected to be received under a swap contract in the event of default or bankruptcy of a swap contract counterparty.
d) Concentration of Risk – Dynamic VP HY Bond Fund invests in the Dow Jones CDX High Yield Note (“CDX”) and TRAINS (Targeted Return Securities Trust) High Yield Notes (“TRAINS”), which represent trusts of pooled investments. The TRAINS invest in a portfolio of high-yield debt securities, rated below investment grade and therefore have greater credit and liquidity risk than investment grade obligations. The high yield debt securities are generally unsecured and may be subordinated to other obligations of the issuer thereof. Upon a downgrade of an underlying securities rating to a specified level, the TRAINS may distribute the respective security on a pro-rata basis to the respective holders. The TRAINS may also invest in one or more interest rate swap or other swap transactions.
The CDX invests in a portfolio of credit default swap agreements and a repurchase agreement. Credit default swap agreements involve commitments to pay/receive a fixed interest rate in exchange for receipt/payment of the referenced obligation if a credit event affecting the referenced obligation occurs. The CDX is providing credit protection to the counterparties of the respective credit default swap agreements in exchange for a fixed interest rate payment, therefore there is credit risk with respect to the referenced entities of these credit default swap agreements. If a credit event occurs to a referenced entity, the Fund’s principal amount in the CDX will be reduced by its pro-rata interest in the respective credit default swap agreement. A credit event may include a failure to pay interest or principal, bankruptcy, or restructuring. Any recoverable amounts of the liquidation of the referenced obligation will be allocated pro rata to the holders of the CDX.
e) Short Positions – Each Fund may engage in short sale transactions. For financial statement purposes, an amount equal to the settlement amount is included in the Statement of Assets and Liabilities as an asset and an equivalent liability. The amount of the liability is subsequently marked-to-market to reflect the current value of the short position. Subsequent fluctuations in the market prices of short positions may require purchasing the securities at prices which may differ from the market value reflected on the Statement of Assets and Liabilities. The Fund is liable to the buyer for any dividends payable on securities while those securities are in a short position. As collateral for its short positions, the Fund is required under the 1940 Act to maintain assets consisting of cash, cash equivalents or liquid securities equal to the market value of the securities sold short. This collateral is required to be adjusted daily.
f) Risks of Options, Futures Contracts, Options on Futures Contracts and Short Positions – The risks inherent in the use of options, futures contracts, options on futures contracts and short positions include 1) adverse changes in the value of such instruments; 2) imperfect correlation between the price of options and futures contracts and options thereon and movements in the price of the underlying securities, index or futures contracts; 3) the possible absence of a liquid secondary market for any particular instrument at any time; 4) the possible need to defer closing out certain positions to avoid adverse tax consequences; and 5) the possible nonperformance by the counterparty under the terms of the contract. The Funds designate all cash, cash equivalents and liquid securities as collateral for written options, futures contracts and short positions.
g) Security Transactions – Investment transactions are recorded on trade date. The Funds determine the gain or loss realized from investment transactions by comparing the identified cost, which is the same basis used for federal income tax purposes, with the net sales proceeds.
h) Federal Income Taxes – Each Fund intends to comply with the requirements of Subchapter M of the Internal Revenue Code necessary to qualify as a regulated investment company and to make the requisite distributions of income and capital gains to its shareholders sufficient to relieve it from all or substantially all federal income and excise taxes.
i) Income and Expenses – Dividend income is recorded on the ex-dividend date. Interest income, including amortization of premium and discount, is recognized on an accrual basis. The Funds are charged for those expenses
28
that are directly attributable to each series, such as Advisory fees and registration costs. Expenses that are not directly attributable to a series are generally allocated among the Trust’s series in proportion to their respective net assets.
j) Distributions to Shareholders – Each Fund generally pays dividends from net investment income and distributes net realized capital gains, if any, at least annually. Income and capital gain distributions are determined in accordance with income tax regulations, which may differ from U.S. generally accepted accounting principles. Distributions to shareholders are recorded on the ex-dividend date.
The tax character of distributions for the Funds during the periods ended June 30, 2007 and December 31, 2006, were as follows:
| Evolution VP Managed Bond Fund | Evolution VP All-Cap Equity Fund | |||||||||||||||
| Six Months Ended | Year Ended | Six Months Ended | Year Ended | |||||||||||||
| June 30, 2007 | December 31, | June 30, 2007 | December 31, | |||||||||||||
| (Unaudited) | 2006 | (Unaudited) | 2006 | |||||||||||||
| Distributions paid from: | ||||||||||||||||
| Ordinary Income | $ | — | $ | 30,745 | $ | — | $ | 362,670 | ||||||||
| Long-term capital gain | — | — | — | 208 | ||||||||||||
| Total distributions paid | $ | — | $ | 30,745 | $ | — | $ | 362,878 | ||||||||
| Dynamic VP HY Bond Fund | ||||||||
| Six Months Ended | Year Ended | |||||||
| June 30, 2007 | December 31, | |||||||
| (Unaudited) | 2006 | |||||||
| Distributions paid from: | ||||||||
| Ordinary Income | $ | 792,364 | $ | 1,883,085 | ||||
| Long-term capital gain | — | — | ||||||
| Total distributions paid | $ | 792,364 | $ | 1,883,085 | ||||
As of December 31, 2006, the components of distributable earnings of the Funds were as follows:
| Evolution VP | Evolution VP | Dynamic VP HY | ||||||||||
| Managed Bond Fund | All-Cap Equity Fund | Bond Fund | ||||||||||
| Cost basis of investments for federal income tax purposes | $ | 11,527,418 | $ | 27,936,261 | $ | 41,541,731 | ||||||
| Unrealized Appreciation | 144,871 | 1,787,632 | 584,899 | |||||||||
| Unrealized Depreciation | (137,932 | ) | (949,092 | ) | (57,103 | ) | ||||||
| Net unrealized appreciation/(depreciation) | 6,939 | 838,540 | 527,796 | |||||||||
| Undistributed ordinary income/(loss) | 347,303 | 1,326,522 | 1,258,805 | |||||||||
| Undistributed long-term gain/(loss) | — | 71,837 | — | |||||||||
| Distributable earnings | 347,303 | 1,398,359 | 1,258,805 | * | ||||||||
| Other Accumulated gain/(loss) | (238,610 | ) | (486 | ) | (1,128,891 | ) | ||||||
| Total Accumulated gain/(loss) | $ | 115,632 | $ | 2,236,413 | $ | 657,710 | ||||||
*Includes tax swap adjustments.
The difference between book cost of investments and tax cost of investments is attributable primarily to the tax deferral of losses on wash sales.
29
k) Use of Estimates – The preparation of financial statements in conformity with U.S. generally accepted accounting principles requires management to make estimates and assumptions that affect the reported amounts of assets and liabilities and disclosure of contingent assets and liabilities at the date of the financial statements and the reported amounts of revenues and expenses during the reporting period. Actual results could differ from those estimates.
3. CAPITAL SHARE TRANSACTIONS
Capital share transactions for the Funds during the periods ended June 30, 2007 and December 31, 2006 were as follows:
| Evolution VP Managed Bond Fund | Evolution VP All-Cap Equity Fund | |||||||||||||||
| Six Months | Six Months | |||||||||||||||
| Ended | Year Ended | Ended | Year Ended | |||||||||||||
| June 30, 2007 | December 31, | June 30, 2007 | December 31, | |||||||||||||
| (Unaudited) | 2006 | (Unaudited) | 2006 | |||||||||||||
| Shares sold | 58,383 | 514,029 | 152,250 | 798,745 | ||||||||||||
| Shares issued in reinvestment of distributions | 1,537 | 14,022 | ||||||||||||||
| Shares redeemed | (90,862 | ) | (67,489 | ) | (126,058 | ) | (99,872 | ) | ||||||||
| Total net increase from capital share transactions | (32,479 | ) | 448,077 | 26,192 | 712,895 | |||||||||||
| Dynamic VP HY Bond Fund | ||||||||
| Six Months | ||||||||
| Ended | Year Ended | |||||||
| June 30, 2007 | December 31, | |||||||
| (Unaudited) | 2006 | |||||||
| Shares sold | 1,295,659 | 6,997,498 | ||||||
| Shares issued in reinvestment of distributions | 38,702 | 92,387 | ||||||
| Shares redeemed | (3,147,314 | ) | (6,654,494 | ) | ||||
| Total net increase from capital share transactions | (1,812,953 | ) | 435,391 | |||||
| 4. | INVESTMENT TRANSACTIONS |
During the period ended June 30, 2007, the aggregate purchases and sales of investments (excluding short-term investments) for each Funds were as follows:
| Evolution VP Managed | Evolution VP All-Cap | Dynamic VP HY | ||||||||||
| Bond Fund | Equity Fund | Bond Fund | ||||||||||
| Purchases | $ | 38,260,720 | $ | 118,924,002 | $ | 15,847,218 | ||||||
| Sales | 46,304,818 | 123,538,777 | 29,010,796 | |||||||||
There were no purchases or sales of long-term U.S. Government Securities during the period ended June 30, 2007 for any of the Funds.
The Evolution VP Managed Bond Fund had post October losses (“POL”), capital losses incurred between October 31st and December 31st, of $56,830. The Evolution VP All-Cap Equity Fund had POL of $486. The Dynamic VP HY Bond Fund had POL of $68,355.
30
At December 31, 2006, the following funds had capital loss carryforwards on a tax basis of:
| Capital Loss | ||||||||
| Carryforwards | Expires | |||||||
| Evolution VP Managed Bond Fund | $ | (143,203 | ) | 12/31/13 | ||||
| $ | (38,577 | ) | 12/31/14 | |||||
| Evolution VP All-Cap Equity Fund | — | |||||||
| Dynamic VP HY Bond Fund | (756,247 | ) | 12/31/13 | |||||
| (304,289 | ) | 12/31/14 | ||||||
Net investment income and realized gains and losses for federal income tax purposes may differ from that reported on the financial statements because of permanent book-to-tax differences. U.S. generally accepted accounting principles require that permanent differences between financial reporting and tax reporting be reclassified between various components of net assets.
At December 31, 2006 on the Statements of Assets and Liabilities, the following adjustments were made for permanent tax adjustments:
| Accumulated | ||||||||||||
| Net | Undistributed Net | |||||||||||
| Realized | Investment | |||||||||||
| Gain/(Loss) | Income/(Loss) | Paid-in Capital | ||||||||||
| Evolution VP Managed Bond Fund | $ | (59,134 | ) | $ | 59,134 | $ | — | |||||
| Evolution VP All-Cap Equity Fund | 1,224 | (1,226 | ) | 2 | ||||||||
| Dynamic VP HY Bond Fund | (305,305 | ) | 305,305 | — | ||||||||
Differences are primarily due to income tax treatment of certain security investments.
| 5. | INVESTMENT ADVISORY AND OTHER AGREEMENTS |
The Funds have entered into an investment advisory agreement with the Adviser. The Adviser receives a fee, computed daily and payable monthly, at the annual rates presented below as applied to each Fund’s average daily net assets. In addition, the Adviser has entered into a sub-advisory agreement related to the Evolution VP Managed Bond Fund and the Evolution VP All-Cap Equity Fund with Flexible Plan Investments, Ltd., whereby the sub-adviser will direct investment activities of the Funds. The Adviser pays, out of the management fees it receives from the Funds, a fee for these sub-advisory services. Prior to July 1, 2006, the Adviser entered into a sub-advisory agreement related to the Dynamic VP HY Bond Fund. Effective July 1, 2006, the sub-advisory agreement was terminated. For the period ended June 30, 2007, the Adviser has voluntarily agreed to pay all operating expenses (excluding dividends on short positions), in excess of the annual cap on expenses presented below as applied to the Dynamic VP HY Bond Fund’s average daily net assets. Because this is a voluntary waiver, the Adviser may change or end the waiver at any time. With respect to the Evolution VP Managed Bond Fund and the Evolution VP All-Cap Equity Fund, the Adviser has contractually agreed to pay all operating expenses (excluding dividends on short positions), in excess of the annual cap on expenses presented below as applied to each Fund’s average daily net assets. The Adviser may recover from the Funds the expenses paid in excess of the
31
annual cap on expenses for the three previous years, as long as the recovery does not cause the Fund to exceed such annual cap on expenses. For the period ended June 30, 2007, the Adviser paid or recouped the following expenses:
| Evolution VP Managed | Evolution VP All-Cap | Dynamic VP HY | ||||||||||
| Bond Fund | Equity Fund | Bond Fund | ||||||||||
| Annual Advisory rate | 1.00% | 1.00% | 0.75% | |||||||||
| Annual cap on expenses | 2.00% | 2.00% | 1.75% | |||||||||
| Expenses paid in excess of annual cap on expenses — 2007 | $ | 26,938 | $ | — | $ | — | ||||||
| Adviser expense waiver recovery — 2007 | $ | — | $ | 10,616 | $ | — | ||||||
Remaining expenses subject to potential recovery expiring in:
| Evolution VP Managed | Evolution VP All-Cap | Dynamic VP HY | ||||||||||
| Bond Fund | Equity Fund | Bond Fund | ||||||||||
| 2007 | $ | 53,095 | $ | 47,757 | $ | — | ||||||
| 2008 | 60,627 | 66,665 | — | |||||||||
| 2009 | 49,690 | 16,813 | — | |||||||||
| 2010 | 26,938 | — | — | |||||||||
| Total | $ | 190,350 | $ | 131,235 | $ | — | ||||||
Shares of the Evolution VP Managed Bond and the Evolution VP All-Cap Equity Funds are subject to an annual Rule 12b-1 fee of up to 0.25% of Fund’s average daily net assets. The shares of the Dynamic VP HY Bond Fund are subject to an annual Rule 12b-1 fee of up to 0.60% of Fund’s average daily net assets. The Rule 12b-1 fees are to pay the insurance company of the plan sponsor for its services for servicing shareholder accounts. Because the fees are paid out of each Fund’s net assets on an ongoing basis, the cost of an investment in a Fund will increase over time.
The Adviser paid directly all offering costs and organizational expenses associated with the registration and seeding of each Fund.
Rafferty Capital Markets, LLC (the “Distributor”) serves as principal underwriter of the Funds and acts as the Funds’ distributor in a continuous public offering of the Funds’ shares. During the period ended June 30, 2007, Dynamic VP HY Bond Fund incurred expenses of $130,889 under Rule 12b-1, of which $32,722 was waived by the Distributor. There were no 12b-1 fees retained by the Distributor for the period ended June 30, 2007. The fee is paid to the Distributor for expenses incurred for distribution-related activities. The Distributor is an affiliate of the Adviser.
In the ordinary course of business, the Funds enter into contracts that contain a variety of indemnification provisions pursuant to which the Funds agree to indemnify third parties upon occurrence of specified events. The Fund’s maximum exposure relating to these indemnification agreements is unknown. However, the Funds have not had prior claims or losses in connection with these provisions and believe the risk of loss is remote.
| 6. | NEW ACCOUNTING PRONOUNCEMENTS |
In July, 2006, the Financial Accounting Standards Board (“FASB”) released FASB Interpretation No. 48, Accounting for Uncertainty in Income Taxes (“FIN 48”). FIN 48 provides guidance for how uncertain tax positions should be recognized, measured, presented and disclosed in the financial statements. FIN 48 requires the evaluation of tax positions taken or expected to be taken in the course of preparing the Fund’s tax returns to determine whether the tax positions are “more-likely-than-not” of being sustained by the applicable tax authority. Tax positions not deemed to meet the more-likely-than-not threshold would be recorded as a tax benefit or expense in the current year. Adoption of FIN 48 is required for fiscal years beginning after December 15, 2006 and is to be applied to all open tax years as of the effective date. Recent SEC guidance allows implementing FIN 48 in fund NAV calculations as late as the fund’s last NAV calculation in the first
32
required financial statement reporting period. Management has evaluated the impact of FIN 48 and has determined there is no material impact to the financial statements.
In September 2006, FASB issued its new Standard No. 157, Fair Value Measurements (“FAS 157”). FAS 157 is designed to unify guidance for the measurement of fair value of all types of assets, including financial instruments, and certain liabilities, throughout a number of accounting standards. FAS 157 also establishes a hierarchy for measuring fair value in generally accepted accounting principles and expands financial statement disclosures about fair value measurements that are relevant to mutual funds. FAS 157 is effective for financial statements issued for fiscal years beginning after November 15, 2007, and earlier adoption is permitted. At this time, management is evaluating the implications of FAS 157 and its impact on the financial statements has not yet been determined.
33
Investment Advisory and Subadvisory Agreements Approvals (Unaudited)
Provided below is a summary of certain of the factors the Board considered at the August 15, 2007 Board meeting in approving: (1) the Advisory Agreement between Rafferty Asset Management (“Rafferty”) and the Direxion Insurance Trust (the “Trust”), on behalf of the Dynamic VP HY Bond Fund, Evolution VP Managed Bond Fund and Evolution VP All-Cap Equity Fund (each, a “Fund” and collectively, the “Funds”), each a series of the Trust; and (2) the Subadvisory Agreement between Rafferty and Flexible Plan Investments, Inc. (the “Subadviser” or “Flexible”) on behalf of the Evolution VP Managed Bond Fund and Evolution VP All-Cap Equity Fund (collectively, the “Evolution Funds”).
The Board did not identify any particular information that was most relevant to its consideration to approve the Advisory Agreement and Subadvisory Agreement (collectively, the “Agreements”) and each Trustee may have afforded different weight to the various factors.
In determining whether to approve the continuance of the Agreements, the Board considered the best interests of each Fund separately. In addition, while the Agreements for the Funds were considered at the same Board meeting, the Board considered each Fund’s investment advisory and subadvisory relationships separately. In each instance, the Board considered, among other things, the following factors: (1) the nature and quality of the services provided; (2) the investment performance of each Fund; (3) the cost to Rafferty or the Subadviser for providing services and the profitability of the advisory business to Rafferty or the Subadviser, if such information was provided; (4) the extent to which economies of scale have been taken into account in setting the fee schedule; (5) whether fee levels reflect these economies of scale for the benefit of Fund investors; and (6) other benefits derived or anticipated to be derived by Rafferty or the Subadviser from its relationship with the Funds.
Nature, Extent and Quality of Services Provided. The Board reviewed the nature, extent and quality of the services provided under the Advisory Agreement by Rafferty. The Board noted that Rafferty has provided services to the Funds since their inception and has significant investment experience. The Board also noted that Rafferty attempts to trade efficiently with low commission schedules, which helps improve performance results. The Board considered Rafferty’s representation that it has the financial resources and appropriate staffing to manage the Funds. The Board also considered Rafferty’s ability to adopt and implement compliance and control functions for the Funds and noted that information concerning portfolio management and a report from the chief compliance officer are provided on a periodic basis to the Board. The Board also considered Rafferty’s ability to increase assets of the Trust complex. The Board also considered that Rafferty oversees all aspects of the operation of the Funds, including oversight of the Subadviser.
Regarding the Subadvisory Agreement with Flexible, the Board noted that the primary role of Flexible is to provide an investment program for the Evolution Funds. The Board also noted that there would be no change in the services provided by Flexible.
Based on these and other considerations, the Board determined that, in the exercise of its business judgment, the nature, extent and quality of the services provided by Rafferty to the Funds under the Agreement and Flexible under the applicable Subadvisory Agreement were fair and reasonable.
Performance of the Funds. The Board noted that Rafferty began directly managing the Dynamic VP HY Bond Fund’s assets on July 1, 2006. The Board evaluated the performance of the Fund to market indices for the period ending August 15, 2007. Also, with respect to the Evolution VP Managed Bond Fund and the Evolution VP All-Cap Equity Fund, the Board evaluated the performance of the Funds to market indices for the period ending August 15, 2007.
Costs of Services Provided to the Funds and Profits Realized. The Board considered the overall fees paid to Rafferty on an annual basis since each Fund’s commencement of operations, including any fee waivers and recoupment of fees previously waived. The Board also noted that Rafferty charges similar fees to other comparable client accounts. In considering the fees paid or to be paid by Rafferty to Flexible, the Board considered that the fees are higher than the industry average. The Board also noted that Rafferty negotiated the lowest fee Flexible charges for comparable client accounts. In addition, Rafferty also negotiated breakpoints in subadvisory fees with Flexible. In considering the
34
profitability of Rafferty, the Board considered the overall profitability of Rafferty’s investment business and its representation that it does not assess profitability with respect to its services to individual Funds. In considering the profitability of Flexible, the Board considered Flexible’s representation that it did not earn pre- or post-tax profits on its services to the Evolution Funds.
Based on these considerations, the Board determined that, in the exercise of its business judgment, the costs of the services provided and the profits realized under the Agreements were fair and reasonable.
Economies of Scale. The Board considered Rafferty’s representation that it believes that asset levels at this time are not sufficient to warrant a reduction in fee rates or the addition of breakpoints. Based on these and other considerations, the Board determined that, in the exercise of its business judgment, the reduction in fee rates or additions of breakpoints were not necessary at this time.
Other Benefits. The Board considered Rafferty’s representation that its relationship with the Funds has permitted Rafferty to attract business to its other client accounts. The Board also considered that Rafferty’s overall business with brokerage firms due to both the Funds and other client accounts help lower commission rates and provide better execution for Fund portfolio transactions. The Board also considered that Flexible has greater access to certain trust platforms due to its subadvisory services to the Evolution Funds. Based on these and other considerations, the Board determined that, in the exercise of its business judgment, the benefits to Rafferty and Flexible were fair and reasonable.
Conclusion. Based on, but not limited to, the above considerations and determinations, the Board determined that the Agreements for the Funds were fair and reasonable in light of the services to be performed, fees, expenses and such other matters as the Board considered relevant in the exercise of its business judgment. On this basis, the Board unanimously voted in favor of the continuance of the Agreements.
35
Advisor
Rafferty Asset Management, LLC
33 Whitehall Street, 10th Floor
New York, NY 10004
Flexible Plan Investments, Ltd.
3883 Telegraph Road
Bloomfield Hills, MI 48302
Paying Agent & Shareholding Servicing Agent
P.O. Box 1993
Milwaukee, WI 53201-1993
1555 RiverCenter Dr., Suite 302
Milwaukee, WI 53212
233 S. Wacker Dr.
Chicago, IL 60606
59 Hilton Avenue
Garden City, NY 11530
The Fund’s Proxy Voting Policies are available without charge by calling 1-800-851-0511, or by accessing the SEC’s website, at www.sec.gov.
The actual voting records relating to portfolio securities during the most recent twelve month period ended June 30 (starting with the year ended June 30, 2005) is available without charge by calling 1-800-851-0511 or by accessing the SEC’s website at www.sec.gov.
The Funds files complete schedules of portfolio holdings with the SEC on Form N-Q. The Form N-Q is available without charge, upon request, by calling 1-800-851-0511, or by accessing the SEC’s website, at www.sec.gov.
This report has been prepared for shareholders and may be distributed to others only if preceded or accompanied by a current prospectus.
SEMI-ANNUAL
REPORT
June 30, 2007

New York, NY 10004
(800) 851-0511
Item 2. Code of Ethics.
Not applicable for semi-annual reports.
Item 3. Audit Committee Financial Expert.
Not applicable for semi-annual reports.
Item 4. Principal Accountant Fees and Services.
Not applicable for semi-annual reports.
Item 5. Audit Committee of Listed Registrants.
Not applicable to open-end investment companies.
Item 6. Schedule of Investments.
Schedule of Investments is included as part of the report to shareholders filed under Item 1 of this Form.
Item 7. Disclosure of Proxy Voting Policies and Procedures for Closed-End Management Investment Companies.
Not applicable to open-end investment companies.
Item 8. Portfolio Managers of Closed-End Management Investment Companies
Not applicable to open-end investment companies.
Item 9. Purchases of Equity Securities by Closed-End Management Investment Company and Affiliated Purchases.
Not applicable to open-end investment companies.
Item 10. Submission of Matters to a Vote of Security Holders.
There have been no material changes to the procedures by which shareholders may recommend nominees to the registrant’s board of directors/trustees.
1
Item 11. Controls and Procedures.
| (a) | The Registrant’s President/Chief Executive Officer and Treasurer/Chief Financial Officer have reviewed the Registrant’s disclosure controls and procedures (as defined in Rule 30a-3(c) under the Investment Company Act of 1940 (the “Act”)) as of a date within 90 days of the filing of this report, as required by Rule 30a-3(b) under the Act and Rules 13a-15(b) or 15d-15(b) under the Securities Exchange Act of 1934. Based on their review, such officers have concluded that the disclosure controls and procedures are effective in ensuring that information required to be disclosed in this report is appropriately recorded, processed, summarized and reported and made known to them by others within the Registrant and by the Registrant’s service provider. | |
| (b) | There were no changes in the Registrant’s internal control over financial reporting (as defined in Rule 30a-3(d) under the Act) that occurred during the second fiscal quarter of the period covered by this report that has materially affected, or is reasonably likely to materially affect, the Registrant’s internal control over financial reporting. |
Item 12. Exhibits.
| (a) | (1) Any code of ethics or amendment thereto, that is subject of the disclosure required by Item 2, to the extent that the registrant intends to satisfy Item 2 requirements through filing an exhibit. 1) Not Applicable for semi-annual reports. | |
| (2) Certifications pursuant to Section 302 of the Sarbanes-Oxley Act of 2002. Filed herewith. | ||
| (3) Any written solicitation to purchase securities under Rule 23c-1 under the Act sent or given during the period covered by the report by or on behalf of the registrant to 10 or more persons. Not applicable to open-end investment companies. | ||
| (b) | Certification pursuant to Section 906 of the Sarbanes-Oxley Act of 2002. Furnished herewith. |
2
SIGNATURES
Pursuant to the requirements of the Securities Exchange Act of 1934 and the Investment Company Act of 1940, the registrant has duly caused this report to be signed on its behalf by the undersigned, thereunto duly authorized.
| (Registrant) | Direxion Insurance Trust | ||||||||
| By (Signature and Title)* | /s/ Daniel O’Neill | ||||||||
| Daniel O’Neill, President | |||||||||
| Date | 9/6/2007 | ||||||||
Pursuant to the requirements of the Securities Exchange Act of 1934 and the Investment Company Act of 1940, this report has been signed below by the following persons on behalf of the registrant and in the capacities and on the dates indicated.
| By (Signature and Title)* | /s/ Daniel O’Neill | ||||||||
| Daniel O’Neill, President | |||||||||
| Date | 9/6/2007 | ||||||||
| By (Signature and Title)* | /s/ Todd Kellerman | ||||||||
| Todd Kellerman, Chief Financial Officer | |||||||||
| Date | 9/6/2007 | ||||||||
* Print the name and title of each signing officer under his or her signature.
3