Filed by First Community Bancorp pursuant to Rule 425 under the Securities Act of 1933 and deemed filed pursuant to Rule 14a-12 under the Securities Exchange Act of 1934. Subject Company: Community Bancorp Inc. Commission File No.: 000-26505
Link to searchable text of slide shown above


Searchable text section of graphics shown above
Forward-Looking Statements and Where to Find Additional Information
This presentation contains forward-looking statements within the meaning of Section 27A of the Securities Act of 1933, as amended, and Section 21E of the Securities Exchange Act of 1934, as amended, that involve inherent risks and uncertainties. First Community Bancorp cautions readers that a number of important factors could cause actual results to differ materially from those in such forward-looking statements. All statements other than statements of historical fact are forward-looking statements. Risks and uncertainties include, but are not limited to: the possibility that personnel changes will not proceed as planned; planned acquisitions and relative cost savings cannot be realized or realized within the expected time frame; costs and uncertainties related to the outcome of pending litigation; revenues are lower than expected; competitive pressure among depository institutions increases significantly; the completion of planned acquisitions and the integration of such acquired businesses costs more, takes longer or is less successful than expected; the cost of additional capital is more than expected; changes in the interest rate environment reduces interest margins; general economic conditions, either nationally or in the market area in which First Community does business, are less favorable than expected; legislation or regulatory requirements or changes that adversely affect First Community’s business or regulatory capital requirements; changes that may occur in the securities markets; and other risks that are described in First Community’s Securities and Exchange Commission filings. If any of these risks or uncertainties materializes or any of these assumptions proves incorrect, First Community’s results could differ materially from those expressed in, implied or projected by such forward-looking statements. First Community assumes no obligation to update such forward-looking statements.
Investors and security holders are urged to read First Community Bancorp’s annual report on Form 10-K, quarterly reports on Form 10-Q and other documents filed by the Company with the Securities and Exchange Commission. The documents filed by First Community with the Commission may be obtained at First Community Bancorp’s website at www.firstcommunitybancorp.com or at the Commission’s website at www.sec.gov. These documents may also be obtained free of charge from First Community by directing a request to: First Community Bancorp c/o Pacific Western Bank, 275 North Brea Boulevard, Brea, CA 92821. Attention: Investor Relations. Telephone 714-671-6800.
This presentation may be deemed to be solicitation material in respect of the proposed acquisition of Community Bancorp Inc. First Community Bancorp and Community Bancorp intend to file a registration statement including a joint proxy statement/prospectus and other documents regarding the proposed acquisition with the Commission. Before making any voting or investment decision, investors and security holders of either Community Bancorp or First Community Bancorp are urged to carefully read the entire registration statement and proxy statement, when they become available, as well as any amendments or supplements to these documents, because they will contain important information about the proposed acquisition. A definitive proxy statement will be sent to the shareholders of each institution seeking any required shareholder approval of these documents. Investors and security holders will be able to obtain the registration statement and proxy statement free of charge from First Community Bancorp by requesting them in writing from First Community Bancorp c/o Pacific Western National Bank, 275 North Brea Boulevard, Brea, CA 92821; Attention: Investor Relations, or by telephone at (714) 671-6800.
First Community Bancorp, its directors, executive officers and certain other persons may be soliciting proxies from First Community Bancorp shareholders in favor of the approval of the acquisition. Shareholders may obtain additional information regarding the interest of such participants by reading the registration statement and proxy statement when they become available.
Community Bancorp, its directors, executive officers and certain other persons may be soliciting proxies from Community Bancorp shareholders in favor of the approval of the acquisition. Shareholders may obtain additional information regarding the interest of such participants by reading the registration statement and proxy statement when they become available.
[LOGO]
2
History
• Management Built Western Bancorp
• Grew to $2.6 Billion in Four Years
• Sold to US Bank in 1999
• 28x Cash EPS
• 5.2x Tangible Book
• Formed First Community in 2000
3
Overview
• Commercial Banking Focus in Southern California
• $5.3 Billion in Proforma Assets
• Operating Strategy Drives Top Tier Profitability
• Cost of Deposits — 83 bps
• Efficiency Ratio — 47.2%
• NPA Ratio — 0.41%
• Reserve to Nonaccrual Loans — 273%
• Acquisitions
• EPS Accretion Driven by Improving Profitability
• FCBP is the Culmination of 17 Acquisitions
• Acquisitions Augment Organic Growth
• Financial Goals
• High Profitability
• Strong EPS Growth
• Minimal Earnings Volatility
Source: Company Filings
4
Hallmarks of Our Success
• Successful Acquirer
• Outstanding Profitability
• Excellent EPS Growth Record
• Strong Credit Quality
• Trophy Franchise
5
Profitability
• Profitability is Top Priority
• Strategic Focus on Low-Cost Deposits
• Strong Expense Management
• Solid Credit Quality Is a Must
• Results Include
• Strong Net Interest Margin
• High Return on Assets
6
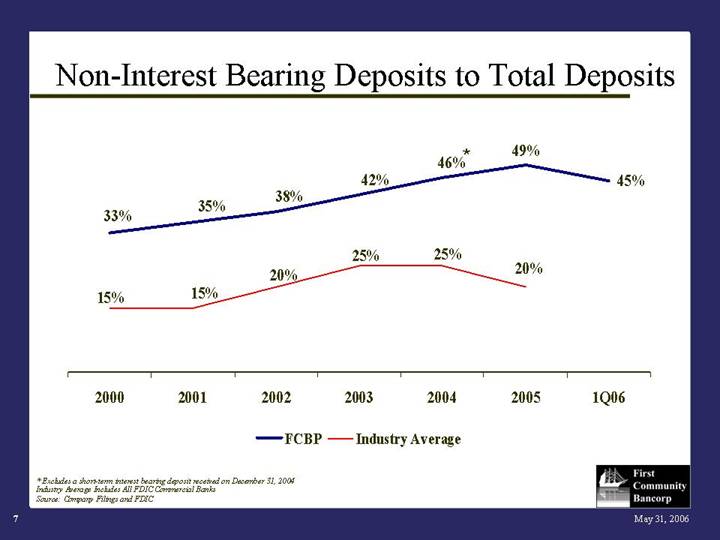
Non-Interest Bearing Deposits to Total Deposits
[CHART]
* Excludes a short-term interest bearing deposit received on December 31, 2004 Industry Average Includes All FDIC Commercial Banks
Source: Company Filings and FDIC
7
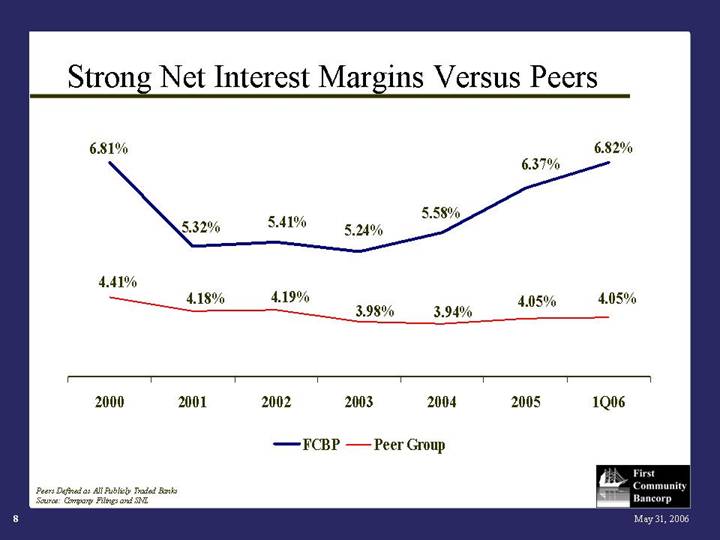
Strong Net Interest Margins Versus Peers
[CHART]
Peers Defined as All Publicly Traded Banks
Source: Company Filings and SNL
8
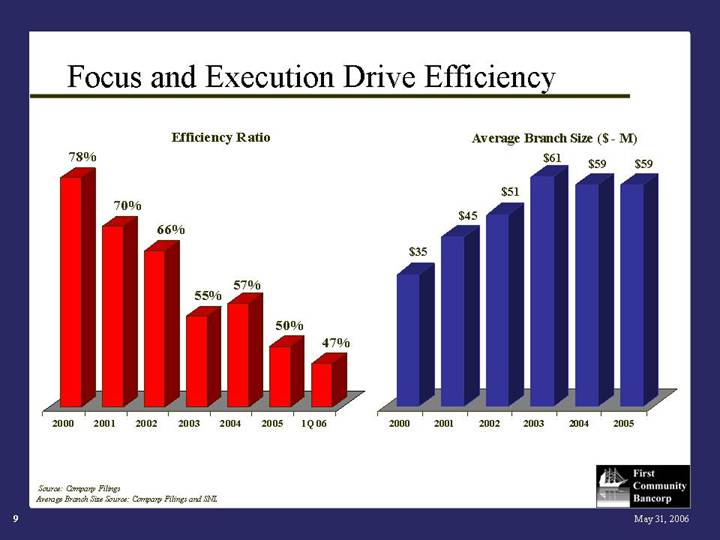
Focus and Execution Drive Efficiency
Efficiency Ratio |
| Average Branch Size ($ -M) |
|
|
|
[CHART] |
| [CHART] |
Source: Company Filings
Average Branch Size Source: Company Filings and SNL
9
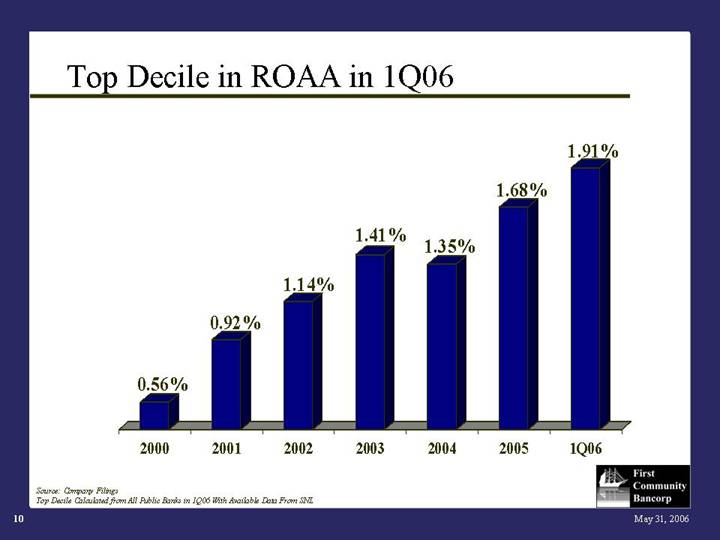
Top Decile in ROAA in 1Q06
[CHART]
Source: Company Filings
Top Decile Calculated from All Public Banks in 1Q06 With Available Data From SNL
10
Industry Leading Return on Assets
[CHART]
Data Comprised of All Public Banks With Available 1Q06 Data From SNL, (chart excludes those with a quarterly loss)
Source: Company Filings, SNL. As of March 31, 2006.
11
Acquisition Strategy
• Similar Strategic Focus
• In-Market Consolidation
• Peer Financial Performance
• Key Drivers of Accretion
• Cost Savings
• Customer Retention
• Margin Improvement
12
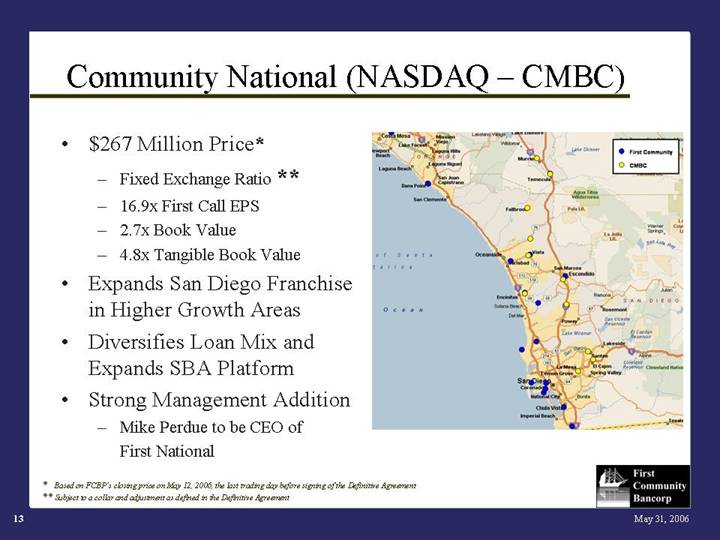
Community National (NASDAQ — CMBC)
• $267 Million Price*
• Fixed Exchange Ratio **
• 16.9x First Call EPS
• 2.7x Book Value
• 4.8x Tangible Book Value
• Expands San Diego Franchise in Higher Growth Areas
• Diversifies Loan Mix and Expands SBA Platform
• Strong Management Addition
• Mike Perdue to be CEO of First National
[GRAPHIC]
* Based on FCBP’s closing price on May 12, 2006, the last trading day before signing of the Definitive Agreement
** Subject to a collar and adjustment as defined in the Definitive Agreement
13
Strong Franchise Value
• $5.3 Billion in Proforma Assets
• 13th Largest Publicly Traded CA Bank*
• Southern California Footprint
• 71 Branches (Proforma)
• High Profitability
• Strong Capital Base
• Low Cost of Deposits
• High Net Interest Margin
• Solid Credit Quality
* Source: SNL
14
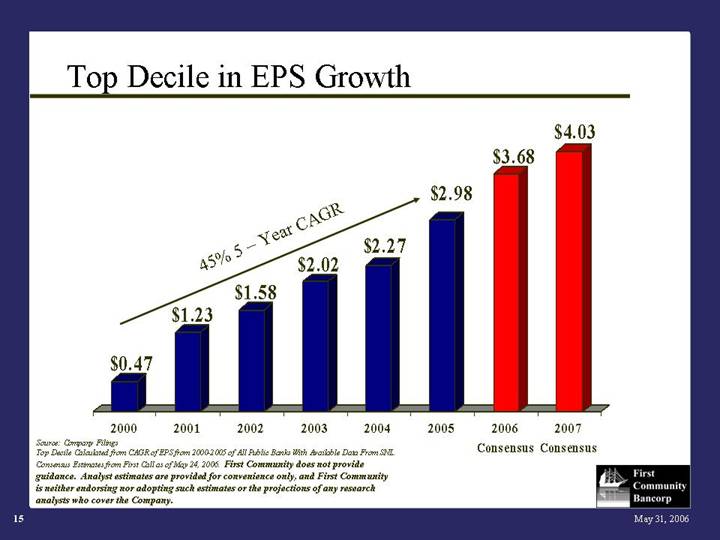
Top Decile in EPS Growth
[CHART]
Source: Company Filings
Top Decile Calculated from CAGR of EPS from 2000-2005 of All Public Banks With Available Data From SNL.
Consensus Estimates from First Call as of May 24, 2006. First Community does not provide guidance. Analyst estimates are provided for convenience only, and First Community is neither endorsing nor adopting such estimates or the projections of any research analysts who cover the Company.
15
Benefit of Leverage
• Leverage Enhances EPS Accretion
• High Cash Returns Repay Leverage
• Trust Preferred Par Calls Begin in 2006
• Retiring Trust Preferred Is Accretive to EPS
• Impact of Utilizing Leverage
• Near-Term: Hurts Tangible Book Value
• Long-Term: Minimizes Share Dilution
16
Our Two Cents
• Tangible Book
• Acquisitions Reduce Tangible Equity vs. Peers
• Our 30%+ ROTE Rapidly Replenishes Tangible Book
• We Believe the Quality and Consistency of Earnings is More Important Than Tangible Book Value
• All Earnings Are Not Equal
• No Treasury Arbitrage
• Core Banking Operations Drive Earnings
• Cash Earnings Better Represent Our Economic Reality
17
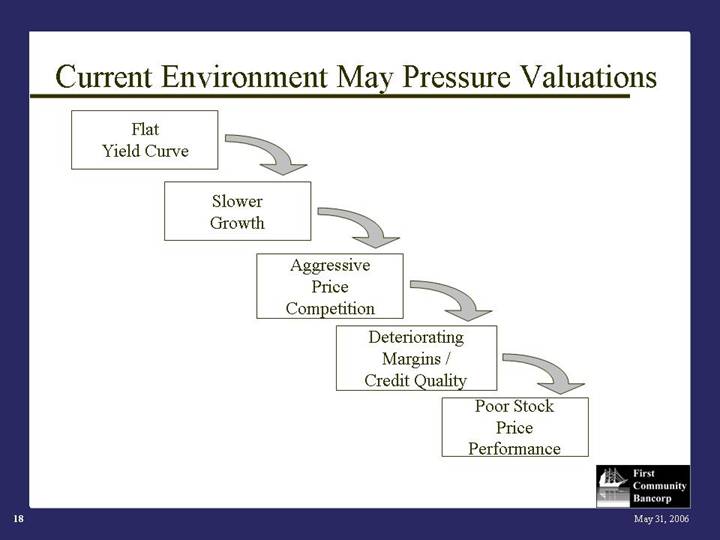
Current Environment May Pressure Valuations
Flat |
|
|
|
|
Yield Curve |
|
|
|
|
|
|
|
|
|
| Slower |
|
|
|
| Growth |
|
|
|
|
|
|
|
|
|
| Aggressive |
|
|
|
| Price Competition |
|
|
|
|
|
|
|
|
|
| Deteriorating |
|
|
|
| Margins / |
|
|
|
| Credit Quality |
|
|
|
|
|
|
|
|
|
| Poor Stock |
|
|
|
| Price |
|
|
|
| Performance |
18
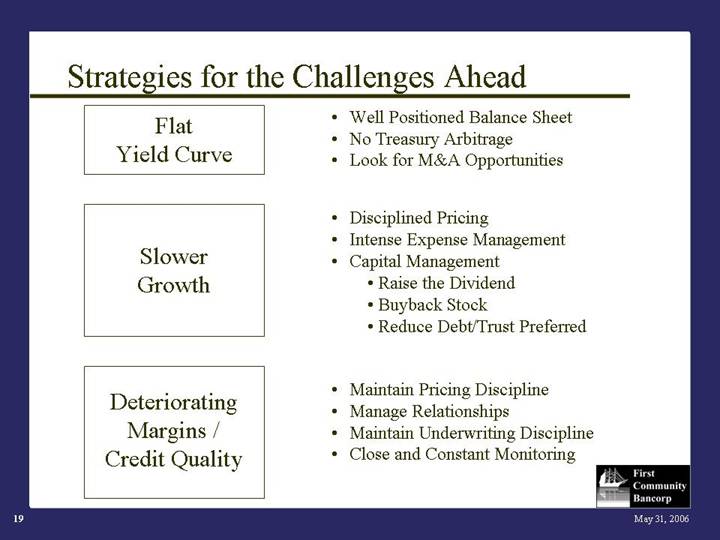
Strategies for the Challenges Ahead
Flat Yield Curve
• Well Positioned Balance Sheet
• No Treasury Arbitrage
• Look for M&A Opportunities
Slower Growth
• Disciplined Pricing
• Intense Expense Management
• Capital Management
• Raise the Dividend
• Buyback Stock
• Reduce Debt/Trust Preferred
Deteriorating Margins / Credit Quality
• Maintain Pricing Discipline
• Manage Relationships
• Maintain Underwriting Discipline
• Close and Constant Monitoring
19
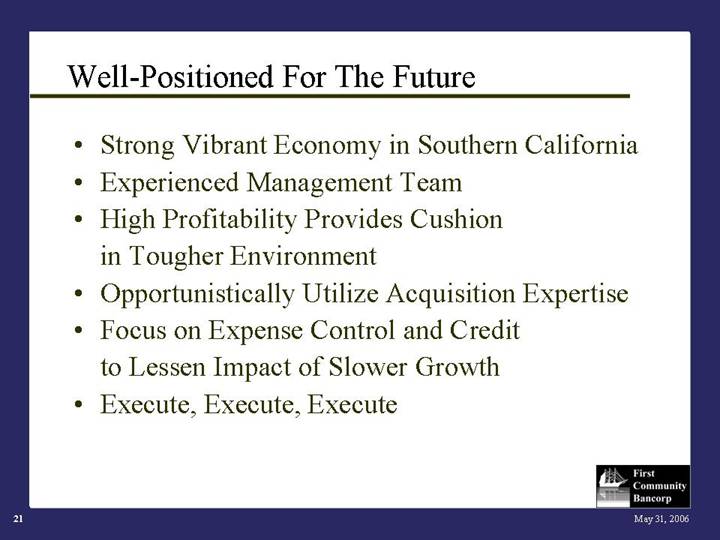
Well-Positioned For The Future
• Strong Vibrant Economy in Southern California
• Experienced Management Team
• High Profitability Provides Cushion in Tougher Environment
• Opportunistically Utilize Acquisition Expertise
• Focus on Expense Control and Credit to Lessen Impact of Slower Growth
• Execute, Execute, Execute
21
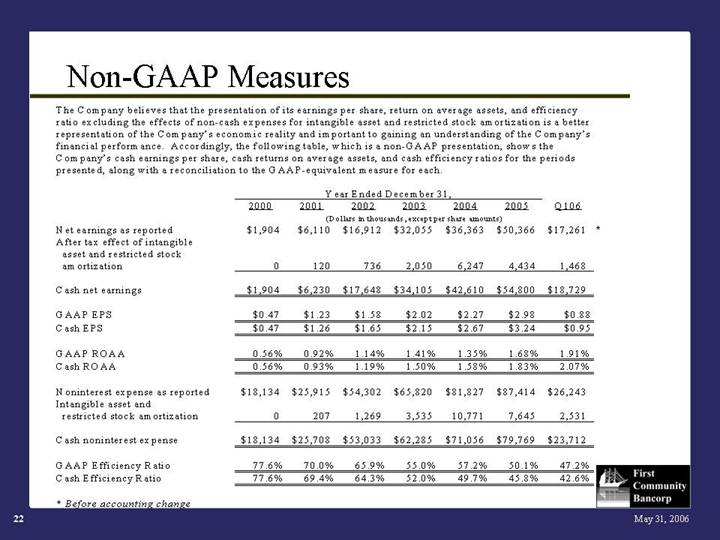
Non-GAAP Measures
The Company believes that the presentation of its earnings per share, return on average assets, and efficiency ratio excluding the effects of non-cash expenses for intangible asset and restricted stock amortization is a better representation of the Company’s economic reality and important to gaining an understanding of the Company’s financial performance. Accordingly, the following table, which is a non-GAAP presentation, shows the Company’s cash earnings per share, cash returns on average assets, and cash efficiency ratios for the periods presented, along with a reconciliation to the GAAP-equivalent measure for each.
|
| Year Ended December 31, |
| |||||||||||||||||||
|
| 2000 |
| 2001 |
| 2002 |
| 2003 |
| 2004 |
| 2005 |
| Q106 |
| |||||||
|
| (Dollars in thousands, except per share amounts) |
| |||||||||||||||||||
Net earnings as reported |
| $ | 1,904 |
| $ | 6,110 |
| $ | 16,912 |
| $ | 32,055 |
| $ | 36,363 |
| $ | 50,366 |
| $ | 17,261 | * |
After tax effect of intangible asset and restricted stock amortization |
| 0 |
| 120 |
| 736 |
| 2,050 |
| 6,247 |
| 4,434 |
| 1,468 |
| |||||||
|
|
|
|
|
|
|
|
|
|
|
|
|
|
|
| |||||||
Cash net earnings |
| $ | 1,904 |
| $ | 6,230 |
| $ | 17,648 |
| $ | 34,105 |
| $ | 42,610 |
| $ | 54,800 |
| $ | 18,729 |
|
|
|
|
|
|
|
|
|
|
|
|
|
|
|
|
| |||||||
GAAP EPS |
| $ | 0.47 |
| $ | 1.23 |
| $ | 1.58 |
| $ | 2.02 |
| $ | 2.27 |
| $ | 2.98 |
| $ | 0.88 |
|
Cash EPS |
| $ | 0.47 |
| $ | 1.26 |
| $ | 1.65 |
| $ | 2.15 |
| $ | 2.67 |
| $ | 3.24 |
| $ | 0.95 |
|
|
|
|
|
|
|
|
|
|
|
|
|
|
|
|
| |||||||
GAAP ROAA |
| 0.56 | % | 0.92 | % | 1.14 | % | 1.41 | % | 1.35 | % | 1.68 | % | 1.91 | % | |||||||
Cash ROAA |
| 0.56 | % | 0.93 | % | 1.19 | % | 1.50 | % | 1.58 | % | 1.83 | % | 2.07 | % | |||||||
|
|
|
|
|
|
|
|
|
|
|
|
|
|
|
| |||||||
Noninterest expense as reported |
| $ | 18,134 |
| $ | 25,915 |
| $ | 54,302 |
| $ | 65,820 |
| $ | 81,827 |
| $ | 87,414 |
| $ | 26,243 |
|
Intangible asset and restricted stock amortization |
| 0 |
| 207 |
| 1,269 |
| 3,535 |
| 10,771 |
| 7,645 |
| 2,531 |
| |||||||
|
|
|
|
|
|
|
|
|
|
|
|
|
|
|
| |||||||
Cash noninterest expense |
| $ | 18,134 |
| $ | 25,708 |
| $ | 53,033 |
| $ | 62,285 |
| $ | 71,056 |
| $ | 79,769 |
| $ | 23,712 |
|
|
|
|
|
|
|
|
|
|
|
|
|
|
|
|
| |||||||
GAAP Efficiency Ratio |
| 77.6 | % | 70.0 | % | 65.9 | % | 55.0 | % | 57.2 | % | 50.1 | % | 47.2 | % | |||||||
Cash Efficiency Ratio |
| 77.6 | % | 69.4 | % | 64.3 | % | 52.0 | % | 49.7 | % | 45.8 | % | 42.6 | % | |||||||
* Before accounting change
22