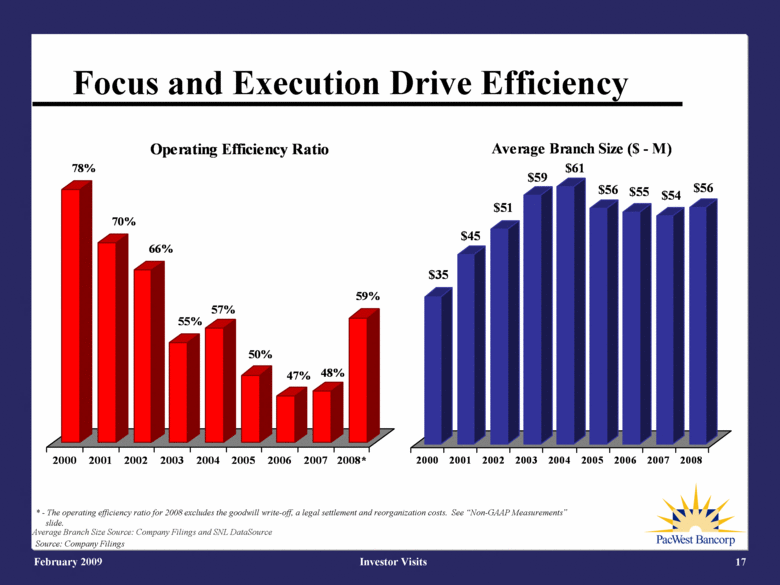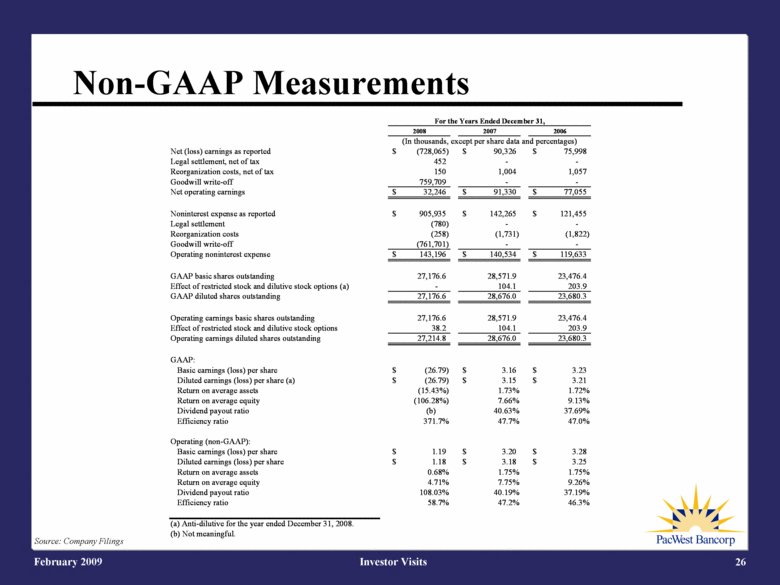
| Non-GAAP Measurements Source: Company Filings 2008 2007 2006 Net (loss) earnings as reported (728,065) $ 90,326 $ 75,998 $ Legal settlement, net of tax 452 - - Reorganization costs, net of tax 150 1,004 1,057 Goodwill write-off 759,709 - - Net operating earnings 32,246 $ 91,330 $ 77,055 $ Noninterest expense as reported 905,935 $ 142,265 $ 121,455 $ Legal settlement (780) - - Reorganization costs (258) (1,731) (1,822) Goodwill write-off (761,701) - - Operating noninterest expense 143,196 $ 140,534 $ 119,633 $ GAAP basic shares outstanding 27,176.6 28,571.9 23,476.4 Effect of restricted stock and dilutive stock options (a) - 104.1 203.9 GAAP diluted shares outstanding 27,176.6 28,676.0 23,680.3 Operating earnings basic shares outstanding 27,176.6 28,571.9 23,476.4 Effect of restricted stock and dilutive stock options 38.2 104.1 203.9 Operating earnings diluted shares outstanding 27,214.8 28,676.0 23,680.3 GAAP: Basic earnings (loss) per share (26.79) $ 3.16 $ 3.23 $ Diluted earnings (loss) per share (a) (26.79) $ 3.15 $ 3.21 $ Return on average assets (15.43%) 1.73% 1.72% Return on average equity (106.28%) 7.66% 9.13% Dividend payout ratio (b) 40.63% 37.69% Efficiency ratio 371.7% 47.7% 47.0% Operating (non-GAAP): Basic earnings (loss) per share 1.19 $ 3.20 $ 3.28 $ Diluted earnings (loss) per share 1.18 $ 3.18 $ 3.25 $ Return on average assets 0.68% 1.75% 1.75% Return on average equity 4.71% 7.75% 9.26% Dividend payout ratio 108.03% 40.19% 37.19% Efficiency ratio 58.7% 47.2% 46.3% (a) Anti-dilutive for the year ended December 31, 2008. (b) Not meaningful. (In thousands, except per share data and percentages) For the Years Ended December 31, |
