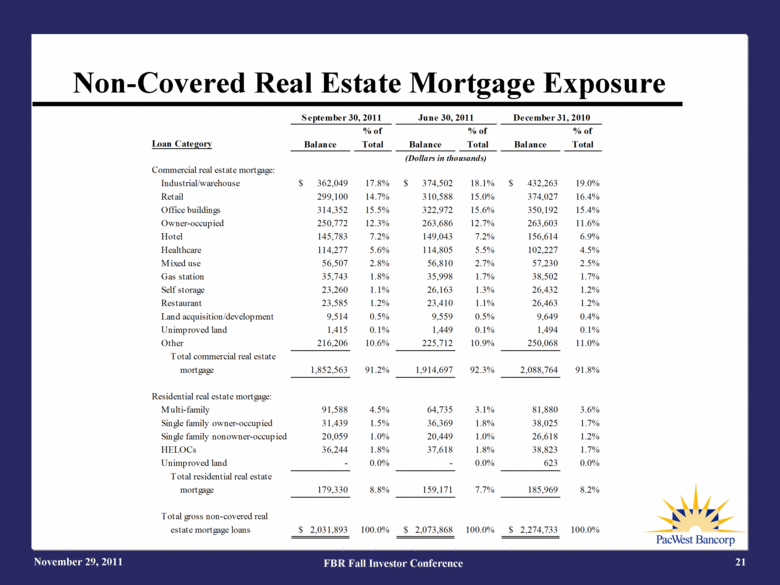
| November 29, 2011 FBR Fall Investor Conference 21 Non-Covered Real Estate Mortgage Exposure September 30, 2011 June 30, 2011 December 31, 2010 % of % of % of Loan Category Balance Total Balance Total Balance Total Commercial real estate mortgage: Industrial/warehouse $ 362,049 17.8% $ 374,502 18.1% $ 432,263 19.0% Retail 299,100 14.7% 310,588 15.0% 374,027 16.4% Office buildings 314,352 15.5% 322,972 15.6% 350,192 15.4% Owner-occupied 250,772 12.3% 263,686 12.7% 263,603 11.6% Hotel 145,783 7.2% 149,043 7.2% 156,614 6.9% Healthcare 114,277 5.6% 114,805 5.5% 102,227 4.5% Mixed use 56,507 2.8% 56,810 2.7% 57,230 2.5% Gas station 35,743 1.8% 35,998 1.7% 38,502 1.7% Self storage 23,260 1.1% 26,163 1.3% 26,432 1.2% Restaurant 23,585 1.2% 23,410 1.1% 26,463 1.2% Land acquisition/development 9,514 0.5% 9,559 0.5% 9,649 0.4% Unimproved land 1,415 0.1% 1,449 0.1% 1,494 0.1% Other 216,206 10.6% 225,712 10.9% 250,068 11.0% Total commercial real estate mortgage 1,852,563 91.2% 1,914,697 92.3% 2,088,764 91.8% Residential real estate mortgage: Multi-family 91,588 4.5% 64,735 3.1% 81,880 3.6% Single family owner-occupied 31,439 1.5% 36,369 1.8% 38,025 1.7% Single family nonowner-occupied 20,059 1.0% 20,449 1.0% 26,618 1.2% HELOCs 36,244 1.8% 37,618 1.8% 38,823 1.7% Unimproved land - 0.0% - 0.0% 623 0.0% Total residential real estate mortgage 179,330 8.8% 159,171 7.7% 185,969 8.2% Total gross non-covered real estate mortgage loans $ 2,031,893 100.0% $ 2,073,868 100.0% $ 2,274,733 100.0% (Dollars in thousands) |
