Exhibit 99.1
PRESS RELEASE
PacWest Bancorp
(NASDAQ: PACW)
Contact: |
| Matthew P. Wagner |
| Victor R. Santoro |
|
|
|
|
|
Phone: |
| 310-728-1020 |
| 310-728-1021 |
Fax: |
| 310-201-0498 |
| 310-201-0498 |
FOR IMMEDIATE RELEASE | April 18, 2012 |
PACWEST BANCORP ANNOUNCES RESULTS
FOR THE FIRST QUARTER OF 2012
Highlights
· Net Earnings of $5.3 Million or $0.14 Per Diluted Share
· Net Interest Margin Increases to 5.41%
· $243.6 Million in Debt Repaid in March
· Credit Loss Reserve at 2.85% of Net Non-Covered Loans and Leases and 170% of Non-Covered Nonaccrual Loans and Leases
· Noninterest-Bearing Deposits at 39% and Core Deposits at 80% of Total Deposits
Los Angeles, California . . . PacWest Bancorp (Nasdaq: PACW) today announced net earnings for the first quarter of 2012 of $5.3 million, or $0.14 per diluted share, compared to net earnings for the fourth quarter of 2011 of $13.9 million, or $0.38 per diluted share. First quarter of 2012 includes after-tax debt termination expense of $13.1 million, or $0.37 per diluted share, related to the prepayment of $225.0 million of fixed-rate term FHLB advances and the early redemption of $18.6 million of fixed-rate trust preferred securities.
This press release contains certain non-GAAP financial disclosures for tangible common equity, earnings before credit, debt termination and tax expenses, which we refer to as “pre-credit, pre-debt termination, pre-tax earnings”, and efficiency ratios adjusted to exclude credit-related and debt termination expenses. The Company uses certain non-GAAP financial measures to provide meaningful supplemental information regarding the Company’s operational performance and to enhance investors’ overall understanding of such financial performance. Given the use of tangible common equity amounts and ratios is prevalent among banking regulators, investors and analysts, we disclose our tangible common equity ratio in addition to equity-to-assets ratio. Also, as analysts and investors view pre-credit, pre-debt termination, pre-tax earnings as an
indicator of the Company’s ability to absorb credit losses, we disclose this amount in addition to net earnings. We disclose the adjusted efficiency ratio as it eliminates (a) the volatile FDIC loss income and OREO income and (b) debt termination expense from the base efficiency ratio, and shows the trend in overhead-related noninterest expense relative to net revenues. Please refer to the tables at the end of this release for a presentation of performance ratios in accordance with GAAP and a reconciliation of the non-GAAP financial measures to the GAAP financial measures.
FIRST QUARTER RESULTS
|
| Three Months Ended |
| ||||
|
| March 31, |
| December 31, |
| ||
|
| 2012 |
| 2011 |
| ||
|
| (Dollars in thousands, except per share data) |
| ||||
Financial Highlights: |
|
|
|
|
| ||
Net earnings |
| $ | 5,264 |
| $ | 13,883 |
|
Diluted earnings per share |
| $ | 0.14 |
| $ | 0.38 |
|
Pre-credit, pre-debt termination, and pre-tax earnings (1) |
| $ | 30,867 |
| $ | 27,831 |
|
Annualized return on average assets |
| 0.38 | % | 1.00 | % | ||
Annualized return on average equity |
| 3.83 | % | 10.22 | % | ||
Net interest margin |
| 5.41 | % | 5.00 | % | ||
Efficiency ratio (2) |
| 97.1 | % | 60.4 | % | ||
|
|
|
|
|
| ||
At Quarter End: |
|
|
|
|
| ||
Allowance for credit losses to non-covered loans and leases, net of unearned income (3) |
| 2.85 | % | 3.34 | % | ||
Allowance for credit losses to non-covered nonaccrual loans and leases (3) |
| 169.7 | % | 161.0 | % | ||
Equity to assets ratios: |
|
|
|
|
| ||
PacWest Bancorp Consolidated |
| 10.09 | % | 9.88 | % | ||
Pacific Western Bank |
| 11.56 | % | 11.35 | % | ||
Tangible common equity ratios: |
|
|
|
|
| ||
PacWest Bancorp Consolidated |
| 8.86 | % | 8.95 | % | ||
Pacific Western Bank |
| 10.35 | % | 10.43 | % | ||
(1) Represents net earnings excluding credit related costs, debt termination expense, and taxes.
(2) Excluding net credit costs and debt termination expense, the efficiency ratio is 58.6% for March 31, 2012 and 59.9% for December 31, 2011. See GAAP to Non-GAAP Reconciliation table.
(3) Non-covered loans exclude loans covered by loss sharing agreements with the FDIC.
The $8.6 million decline in net earnings for the linked quarters was due primarily to $22.6 million ($13.1 million after-tax) of debt termination expense incurred on the prepayment of $225.0 million of fixed-rate term FHLB advances and the early redemption of $18.6 million of fixed-rate trust preferred securities. In addition, the provision for credit losses on non-covered loans declined $10.0 million ($5.8 million after tax) and FDIC loss sharing income declined $6.2 million ($3.6 million after-tax) for the linked quarters. The operations of Pacific Western Equipment Finance, or PWE Finance, (formerly Marquette Equipment Finance) have been included since the January 3, 2012 acquisition date.
Net credit costs on a pre-tax basis are shown in the following table:
|
| Three Months Ended |
| ||||
|
| March 31, |
| December 31, |
| ||
|
| 2012 |
| 2011 |
| ||
|
| (In thousands) |
| ||||
Negative provision for credit losses on non-covered loans and leases |
| $ | (10,000 | ) | $ | — |
|
Non-covered OREO expense, net |
| 1,821 |
| 1,714 |
| ||
Total non-covered net credit costs |
| (8,179 | ) | 1,714 |
| ||
|
|
|
|
|
| ||
Provision for credit losses on covered loans |
| 3,926 |
| 4,122 |
| ||
Covered OREO expense, net |
| 822 |
| 226 |
| ||
|
| 4,748 |
| 4,348 |
| ||
Less: FDIC loss sharing income (expense), net |
| (3,579 | ) | 2,667 |
| ||
Total covered net credit costs |
| 8,327 |
| 1,681 |
| ||
|
|
|
|
|
| ||
Total net credit costs |
| $ | 148 |
| $ | 3,395 |
|
The provision for credit losses for the first quarter had two components: a $10.0 million negative provision for non-covered loans and leases and a $3.9 million provision for covered loans. The negative first quarter non-covered credit loss provision was based on our allowance methodology which reflected (a) lower net charge-offs, (b) declining levels and improving trends of nonaccrual and classified loans and leases, (c) the migration of loans and leases into various risk classifications, and (d) a decline in non-covered loans when acquisition activity is excluded. During the first quarter, nonaccrual loans and leases declined by $10.1 million to $48.2 million and classified loans and leases decreased by $39.6 million to $145.9 million. Gross non-covered loans and leases declined $97.7 million when the acquired PWE Finance lease receivables are excluded.
The covered loans credit loss provision was driven by decreases in expected cash flows on covered loan pools compared to those previously estimated. The covered loans credit loss provision and covered OREO expense are offset by an increase in FDIC loss sharing income, which represents the FDIC’s share of these net costs. FDIC loss sharing income also includes reductions of the FDIC loss sharing asset when covered loans are resolved or expected to be resolved at amounts higher than their carrying values.
Matt Wagner, Chief Executive Officer, commented, “We are pleased with our continued strong net earnings generated in the first quarter and with the overall improvement in our credit quality. Our pre-credit, pre-debt termination, and pre-tax earnings grew during the first quarter, reaching $30.9 million. This level of earnings strengthens our balance sheet and allows us to pursue attractive growth and acquisition opportunities as they arise. Credit quality metrics improved nicely during the first quarter, with declines in nonaccrual and classified loans. Our legacy credit loss reserve provides good coverage of our legacy loan and lease portfolio at 2.85% and of our legacy nonaccrual loans and leases at 170%. Core deposits continued their positive trend, with $26.5 million growth in the first quarter, reaching 80% of total deposits. Our noninterest-bearing demand deposits grew by nearly $100 million and represent 39% of total deposits.”
Mr. Wagner continued, “At the beginning of the first quarter, we completed the acquisition of Pacific Western Equipment Finance, an equipment leasing company. PWE Finance’s lease receivables and leases in process totaled $167.7 million at March 31, 2012, up from $162.2 million at the acquisition date. We are also pleased to announce that on April 3, 2012, we acquired Celtic Capital Corporation, an asset-based lender located here in Southern California. At that date, Celtic had $56.2 million in gross loans outstanding. Both of these acquisitions diversify our portfolio, expand our product line, deploy our excess liquidity into higher-yielding assets and provide solid platforms for future growth.”
Vic Santoro, Executive Vice President and Chief Financial Officer, stated, “The first quarter prepayment of FHLB advances and trust preferred securities, although negatively impacting our net earnings with an after-tax cost of $13.1 million, provides for significant interest savings and margin improvement beginning in the second quarter. The annual after-tax interest cost savings is $5.1 million, with $3.9 million in after-tax savings for the remainder of 2012.
Mr. Santoro continued, “Our net interest margin reached 5.41% for the first quarter, propelled by the PWE Finance acquisition. PWE Finance’s lease receivables yielded 12% during the first quarter and added approximately 25 basis points to the net interest margin. The debt repayments are expected to add approximately 25 basis points to the net interest margin beginning in the second quarter, and the Celtic Capital Corporation acquisition will likely add another 13 basis points.”
BALANCE SHEET CHANGES
Total assets decreased $80.1 million during the first quarter due to a lower balance in interest-earning deposits in financial institutions, offset by higher securities available-for-sale and higher loans and leases. During the first quarter, interest-earning deposits in financial institutions declined $169.0 million due to the purchase of PWE Finance for $35.0 million and the repayment of $128.7 million of its debt. Securities available-for-sale increased $54.5 million due to purchases of $134.5 million. The non-covered gross loan and lease portfolio increased $56.1 million due to the lease receivables gained in the PWE Finance acquisition. When the lease receivables from the PWE Finance acquisition are excluded, however, non-covered gross loans declined $97.7 million; such decline is centered in the real estate mortgage loan portfolio. The covered loan portfolio declined $42.7 million due to repayments and resolution activities. At March 31, 2012, non-covered gross loans and leases totaled $2.9 billion and the covered loan portfolio was $660.3 million.
Total deposits declined $20.8 million during the first quarter to $4.6 billion at March 31, 2012. Core deposits grew $26.5 million during the first quarter with increases of $99.9 million, $15.3 million, and $5.6 million in noninterest-bearing demand deposits, interest checking deposits and savings deposits, respectively, offset by a decline of $94.3 million in money market deposits. Time deposits decreased $47.3 million during the first quarter to $920.6 million at March 31, 2012. At March 31, 2012, core deposits totaled $3.6 billion, or 80% of total deposits at that date. Noninterest-bearing demand deposits were $1.8 billion at March 31, 2012 and represented 39% of total deposits at that date.
SECURITIES AVAILABLE-FOR-SALE
The following table presents the components, yields, and durations related to our securities available-for-sale portfolio as of March 31, 2012:
|
| March 31, 2012 |
| ||||||||
|
| Amortized |
| Carrying |
| Book |
| Duration |
| ||
Security Type |
| Cost |
| Value |
| Yield |
| (in years) |
| ||
|
| (Dollars in thousands) |
| ||||||||
Residential mortgage-backed securities: |
|
|
|
|
|
|
|
|
| ||
Government and government-sponsored entity pass through securities |
| $ | 1,000,280 |
| $ | 1,033,909 |
| 2.66 | % | 3.8 |
|
Government and government-sponsored entity collateralized mortgage obligations |
| 100,250 |
| 102,220 |
| 2.25 | % | 3.5 |
| ||
Covered private label collateralized mortgage obligations |
| 39,910 |
| 45,274 |
| 11.23 | % | 5.5 |
| ||
Municipal securities (1) |
| 144,127 |
| 147,641 |
| 3.16 | % | 6.2 |
| ||
Corporate debt securities |
| 43,202 |
| 43,149 |
| 5.88 | % | 12.3 |
| ||
Other securities |
| 6,384 |
| 8,685 |
| — |
| — |
| ||
Total securities available-for-sale (1) |
| $ | 1,334,153 |
| $ | 1,380,878 |
| 3.05 | % | 4.4 |
|
(1) The tax equivalent yield was 4.54% and 3.20% for municipal securities and total securities available-for-sale, respectively.
COVERED ASSETS
As part of the Los Padres and Affinity acquisitions we entered into loss sharing agreements with the FDIC that cover a substantial portion of losses incurred after the acquisition dates on covered loans and other real estate owned, and in the case of the Affinity acquisition, certain investment securities. A summary of covered assets is shown in the following table as of the dates indicated:
|
| March 31, |
| December 31, |
| ||
Covered Assets |
| 2012 |
| 2011 |
| ||
|
| (In thousands) |
| ||||
Loans, net |
| $ | 660,297 |
| $ | 703,023 |
|
Investment securities |
| 45,274 |
| 45,149 |
| ||
Other real estate owned, net |
| 29,888 |
| 33,506 |
| ||
Total covered assets |
| $ | 735,459 |
| $ | 781,678 |
|
|
|
|
|
|
| ||
Percentage of total assets |
| 13.5 | % | 14.1 | % | ||
NET INTEREST INCOME
Net interest income was $67.7 million for the first quarter of 2012 compared to $63.8 million for the fourth quarter of 2011. The $3.9 million increase was due to a $3.1 million increase in loan and lease interest income; such increase is attributed to a higher yield on average loans and leases and due mainly to the yield earned on PWE Finance’s lease portfolio. In addition, interest expense declined $420,000 due to lower rates on all interest-bearing deposits and lower average time deposits.
NET INTEREST MARGIN
Our net interest margin for the first quarter of 2012 was 5.41%, an increase of 41 basis points from the 5.00% reported for the fourth quarter of 2011. This increase is due mostly to an increase in loan and lease yield as the first quarter includes income on $146.4 million of average lease receivables with a 12% yield. The addition of the lease portfolio increased the net interest margin approximately 25 basis points, assuming such excess liquidity would have otherwise been deployed in investment securities. In addition, the net interest margin is impacted by the accelerated accretion of discounts on covered loan payoffs which increased the margin 18 basis points for the linked quarters. Average outstanding loans and leases were unchanged quarter over quarter.
The yield on average loans and leases increased 44 basis points to 7.31% for the first quarter of 2012 from 6.87% for the fourth quarter of 2011. The addition of PWE Finance’s lease portfolio increased the loan and lease yield 21 basis points and the accelerated accretion of discounts on covered loan payoffs increased the loan and lease yield 29 basis points.
All-in deposit cost declined 4 basis points to 0.32%. The cost of interest-bearing deposits declined 6 basis points to 0.51% due to lower rates on interest-bearing deposits and lower average time deposits. The cost of total interest-bearing liabilities declined 3 basis points to 0.85% for the first quarter of 2012.
In March 2012, the Company prepaid $18.6 million in fixed-rate trust preferred securities and $225.0 million in fixed-rate term FHLB advances. The resulting debt termination expense incurred was $22.6 million; the interest expense savings is estimated to be $6.8 million for the remainder of 2012 and $8.8 million annually through 2016. The Company used a combination of excess cash and collateralized overnight borrowings to repay these debt instruments. These repayments are expected to expand the net interest margin beginning in the second quarter by approximately 25 basis points from a combination of lower average earning assets and the reduced borrowing costs.
NONINTEREST INCOME
Noninterest income for the first quarter of 2012 totaled $3.3 million compared to $8.3 million for the fourth quarter of 2011. The $5.0 million decrease was due to lower net FDIC loss sharing income of $6.2 million and higher gain on sale of leases of $990,000, the latter item relating to PWE Finance’s operations. The first quarter includes net FDIC loss sharing expense of $3.6 million due to a higher level of write-downs and amortization of the loss sharing asset as the estimated amount of losses collectible from the FDIC decreased; this compares to net FDIC loss sharing income of $2.7 million in the fourth quarter.
The following table presents the details of FDIC loss sharing income (expense), net for the periods indicated:
|
| Three Months Ended |
| |||||||
|
| March 31, |
| December 31, |
| Increase |
| |||
|
| 2012 |
| 2011 |
| (Decrease) |
| |||
|
| (In thousands) |
| |||||||
FDIC Loss Sharing Income (Expense), Net: |
|
|
|
|
|
|
| |||
Gain (loss) on FDIC loss sharing asset (1) |
| $ | (3,380 | ) | $ | 2,560 |
| $ | (5,940 | ) |
Loan recoveries shared with FDIC |
| (839 | ) | — |
| (839 | ) | |||
Net reimbursement from FDIC for covered OREO write-downs and sales |
| 634 |
| 102 |
| 532 |
| |||
Other |
| 6 |
| 5 |
| 1 |
| |||
Total FDIC loss sharing income (expense), net |
| $ | (3,579 | ) | $ | 2,667 |
| $ | (6,246 | ) |
(1) Includes increases related to covered loan loss provisions and decreases for net loss share asset amortization and write-offs for covered loans resolved or expected to be resolved at amounts higher than their carrying value.
NONINTEREST EXPENSE
Noninterest expense increased $25.4 million to $68.9 million during the first quarter of 2012 compared to $43.5 million for the fourth quarter of 2011. The increase was due mostly to $22.6 million in debt termination expense for the early repayment of $225.0 million of fixed-rate term FHLB advances and $18.6 million of fixed-rate trust preferred securities. Excluding the debt termination expense, noninterest expense increased $2.8 million, of which $2.3 million relates to the PWE Finance acquisition which closed on January 3, 2012. Compensation cost increased $3.5 million quarter-over-quarter when the fourth quarter of 2011 severance cost of $885,000 is excluded. The leasing company acquisition accounted for $1.6 million of that increase. The remainder of the compensation increase was attributable to higher payroll taxes due to the start of the new year and higher incentive compensation. Covered OREO costs increased due to higher write-downs of $1.3 million offset by higher gains on sales of $692,000. These increases were offset by declines in other professional services, insurance and assessments, and acquisition costs for approximately $1.0 million in total. Other professional services declined due to lower legal costs and insurance and assessments are lower as a result of the revised deposit insurance assessment formula.
Noninterest expense includes amortization of time-based restricted stock, which is included in compensation, and intangible asset amortization. Amortization of restricted stock totaled $1.6 million and $1.4 million for the first quarter of 2012 and fourth quarter of 2011, respectively. Intangible asset amortization totaled $1.7 million and $1.8 million for the first quarter of 2012 and fourth quarter of 2011, respectively.
CREDIT QUALITY
|
| March 31, |
| December 31, |
| March 31, |
| |||
|
| 2012 |
| 2011 |
| 2011 |
| |||
|
| (Dollars in thousands) |
| |||||||
Non-Covered Credit Quality Metrics: |
|
|
|
|
|
|
| |||
Allowance for credit losses to loans and leases, net of unearned income |
| 2.85 | % | 3.34 | % | 3.41 | % | |||
Allowance for credit losses to nonaccrual loans and leases |
| 169.7 | % | 161.0 | % | 135.6 | % | |||
Nonperforming assets to loans and leases, net of unearned income, and other real estate owned |
| 3.24 | % | 3.73 | % | 4.03 | % | |||
Nonaccrual loans and leases |
| $ | 48,162 |
| $ | 58,260 |
| $ | 76,849 |
|
Classified loans and leases (1) |
| 145,933 |
| 185,560 |
| 207,012 |
| |||
Performing restructured loans |
| 110,062 |
| 116,791 |
| 71,669 |
| |||
Net charge-offs (for the quarter) |
| 2,046 |
| 2,752 |
| 7,889 |
| |||
(1) Classified loans and leases are those with a credit risk rating of substandard or doubtful.
Credit Loss Provisions
The Company recorded a negative provision for credit losses of $6.1 million in the first quarter of 2012 compared to a provision for credit losses of $4.1 million in the fourth quarter of 2011. The negative provision in the first quarter was composed of a $10.0 million negative provision for credit losses on non-covered loans and a $3.9 million provision for credit losses on covered loans. The provision for credit losses in the fourth quarter related only to the covered loan portfolio. The provision level on the non-covered portfolio is generated by our allowance methodology and reflects net charge-offs, the levels of nonaccrual and classified loans and leases, the migration of loans and leases into various risk classifications, and the level of outstanding loans and leases. The provision for credit losses on the covered loans increases the covered loan allowance for credit losses and results from decreases in expected cash flows on covered loans compared to those previously estimated.
First quarter of 2012 net charge-offs on non-covered loans and leases totaled $2.0 million compared to fourth quarter of 2011 net charge-offs of $2.8 million. The allowance for credit losses on the non-covered portfolio totaled $81.7 million and $93.8 million at March 31, 2012 and December 31, 2011, respectively, and represented 2.85% and 3.34% of the non-covered loan and lease balances, respectively. The allowance for credit losses as a percent of nonaccrual loans and leases was 170% at March 31, 2012 and 161% at December 31, 2011.
Non-covered Nonaccrual Loans and Other Real Estate Owned
Non-covered nonperforming assets include non-covered nonaccrual loans and leases and non-covered OREO and totaled $94.4 million at March 31, 2012 compared to $106.7 million at December 31, 2011. The $12.3 million decline in non-covered nonperforming assets was due to reductions of $10.1 million in nonaccrual loans and leases and $2.2 million in OREO. The ratio of non-covered nonperforming assets to non-covered loans and leases and non-covered OREO decreased to 3.24% at March 31, 2012 from 3.73% at December 31, 2011.
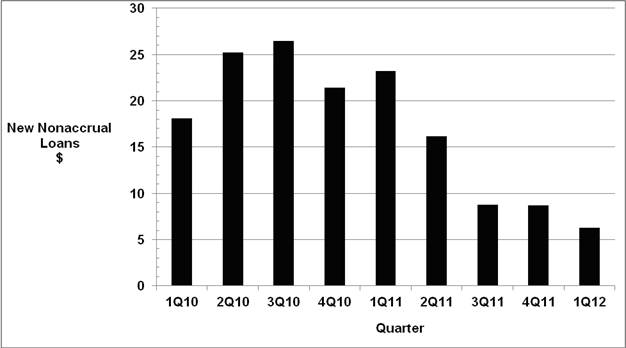
The amount of new nonaccrual loans and leases slowed significantly in 2011 and continued to decline in 2012 as shown in the following chart:
|
| Volume of New |
| |
|
| (In millions) |
| |
|
|
|
| |
1Q10 |
| $ | 18.1 |
|
2Q10 |
| $ | 25.2 |
|
3Q10 |
| $ | 26.5 |
|
4Q10 |
| $ | 21.4 |
|
1Q11 |
| $ | 23.2 |
|
2Q11 |
| $ | 16.2 |
|
3Q11 |
| $ | 8.8 |
|
4Q11 |
| $ | 8.7 |
|
1Q12 |
| $ | 6.3 |
|
The following table presents our non-covered nonaccrual loans and leases and accruing loans and leases past due between 30 and 89 days by portfolio segment and class as of the dates indicated:
|
| Nonaccrual Loans and Leases (1) |
| Accruing and |
| ||||||||||||
|
| March 31, 2012 |
| December 31, 2011 |
| 30 - 89 Days Past Due (1) |
| ||||||||||
|
|
|
| % of |
|
|
| % of |
| March 31, |
| December 31, |
| ||||
|
|
|
| Loan |
|
|
| Loan |
| 2012 |
| 2011 |
| ||||
|
| Balance |
| Category |
| Balance |
| Category |
| Balance |
| Balance |
| ||||
|
| (Dollars in thousands) |
| ||||||||||||||
Real estate mortgage: |
|
|
|
|
|
|
|
|
|
|
|
|
| ||||
Hospitality |
| $ | 7,165 |
| 5.0 | % | $ | 7,251 |
| 5.0 | % | $ | — |
| $ | — |
|
SBA 504 |
| 2,354 |
| 4.1 | % | 2,800 |
| 4.8 | % | 1,165 |
| — |
| ||||
Other |
| 14,171 |
| 0.8 | % | 21,286 |
| 1.2 | % | 973 |
| 13,237 |
| ||||
Total real estate mortgage |
| 23,690 |
| 1.2 | % | 31,337 |
| 1.6 | % | 2,138 |
| 13,237 |
| ||||
Real estate construction and land: |
|
|
|
|
|
|
|
|
|
|
|
|
| ||||
Residential |
| 1,075 |
| 4.2 | % | 1,086 |
| 6.1 | % | — |
| — |
| ||||
Commercial |
| 4,524 |
| 4.9 | % | 6,194 |
| 6.5 | % | — |
| 2,290 |
| ||||
Total real estate construction |
| 5,599 |
| 4.7 | % | 7,280 |
| 6.4 | % | — |
| 2,290 |
| ||||
Commercial: |
|
|
|
|
|
|
|
|
|
|
|
|
| ||||
Collateralized |
| 8,030 |
| 1.9 | % | 8,186 |
| 2.0 | % | 478 |
| 593 |
| ||||
Unsecured |
| 2,608 |
| 3.8 | % | 3,057 |
| 3.9 | % | — |
| 4 |
| ||||
Asset-based |
| 88 |
| 0.1 | % | 14 |
| 0.0 | % | — |
| — |
| ||||
SBA 7(a) |
| 7,416 |
| 26.8 | % | 7,801 |
| 26.9 | % | 252 |
| 434 |
| ||||
Total commercial |
| 18,142 |
| 2.7 | % | 19,058 |
| 2.8 | % | 730 |
| 1,031 |
| ||||
Leases |
| 233 |
| 0.2 | % | — |
| — |
| — |
| — |
| ||||
Consumer |
| 498 |
| 3.1 | % | 585 |
| 2.5 | % | 220 |
| 31 |
| ||||
Total non-covered loans and leases |
| $ | 48,162 |
| 1.7 | % | $ | 58,260 |
| 2.1 | % | $ | 3,088 |
| $ | 16,589 |
|
(1) Excludes covered loans.
The $10.1 million decline in non-covered nonaccrual loans and leases during the first quarter was attributable to (a) foreclosures of $1.8 million, (b) other reductions, payoffs and returns to accrual status of $12.1 million, (c) charge-offs of $2.5 million, and (d) additions of $6.3 million.
Below is a summary of the ten largest lending relationships on nonaccrual status, excluding SBA-related loans, at March 31, 2012:
Nonaccrual |
|
| ||
Amount |
| Description | ||
(In thousands) |
|
| ||
|
|
| ||
7,165 |
| Two loans, each secured by a hotel in San Diego County, California. The borrower is paying according to the restructured terms of each loan. (1) | ||
|
|
| ||
3,726 |
| Four loans, each secured by an industrial warehouse building in Riverside County, California. The borrower is paying according to the restructured terms of each loan. (1) | ||
|
|
| ||
3,442 |
| This loan is unsecured. The borrower is paying according to the restructured terms of the loan. (1) | ||
|
|
| ||
2,476 |
| This loan is secured by a strip retail center in Riverside County, California. The borrower is paying according to the restructured terms of the loan. (1) | ||
|
|
| ||
1,963 |
| This loan is secured by a multi-tenant industrial building in Riverside County, California. The borrower is not paying currently. (1) | ||
|
|
| ||
1,875 |
| This loan is unsecured and has a specific reserve for 95% of the balance. The borrower is paying according to the restructured terms of the loan. (1) | ||
|
|
| ||
1,725 |
| This loan is secured by a single family residence in Riverside County, California. The borrower is not paying currently. | ||
|
|
| ||
1,701 |
| Two unsecured loans which are fully reserved. The borrower is not paying currently. (1) | ||
|
|
| ||
1,469 |
| This loan is secured by a medical-related office building in Los Angeles County, California. The borrower is paying according to the restructured terms of the loan. (1) | ||
|
|
| ||
1,425 |
| This loan is secured by a retail/industrial building in Riverside County, California. The borrower is paying according to the restructured terms of the loan. (1) | ||
|
|
|
| |
$ |
| 26,967 |
| Total |
(1) On nonaccrual status at December 31, 2011
The following table presents the details of non-covered and covered OREO as of the dates indicated:
|
| March 31, 2012 |
| December 31, 2011 |
| ||||||||
|
| Non-Covered |
| Covered |
| Non-Covered |
| Covered |
| ||||
Property Type |
| OREO |
| OREO |
| OREO |
| OREO |
| ||||
|
| (In thousands) |
| ||||||||||
Commercial real estate |
| $ | 20,885 |
| $ | 13,868 |
| $ | 23,003 |
| $ | 15,053 |
|
Construction and land development |
| 25,321 |
| 13,143 |
| 24,788 |
| 15,461 |
| ||||
Single family residences |
| — |
| 2,877 |
| 621 |
| 2,992 |
| ||||
Total OREO, net |
| $ | 46,206 |
| $ | 29,888 |
| $ | 48,412 |
| $ | 33,506 |
|
The following table presents non-covered and covered OREO activity for the first quarter:
|
| Three Months Ended |
| |||||||
|
| March 31, 2012 |
| |||||||
|
| Non-Covered |
| Covered |
| Total |
| |||
|
| OREO |
| OREO |
| OREO |
| |||
|
| (In thousands) |
| |||||||
Beginning of period |
| $ | 48,412 |
| $ | 33,506 |
| $ | 81,918 |
|
Foreclosures |
| 1,839 |
| 7,241 |
| 9,080 |
| |||
Payments to third parties (1) |
| 622 |
| — |
| 622 |
| |||
Provision for losses |
| (752 | ) | (2,229 | ) | (2,981 | ) | |||
Reductions related to sales |
| (3,915 | ) | (8,630 | ) | (12,545 | ) | |||
End of period |
| $ | 46,206 |
| $ | 29,888 |
| $ | 76,094 |
|
|
|
|
|
|
|
|
| |||
Net (loss) gain on sale |
| $ | (42 | ) | $ | 1,476 |
| $ | 1,434 |
|
(1) Represent amounts due to participants and for guarantees, property taxes or any other prior lien positions.
REGULATORY CAPITAL MEASURES ARE ABOVE THE WELL-CAPITALIZED MINIMUMS
PacWest and its wholly-owned banking subsidiary, Pacific Western Bank, each remained well capitalized at March 31, 2012 as shown in the following table:
|
| March 31, 2012 |
| ||||
|
| Well |
| Pacific |
| PacWest |
|
|
| Capitalized |
| Western |
| Bancorp |
|
|
| Requirement |
| Bank |
| Consolidated |
|
Tier 1 leverage capital ratio |
| 5.00 | % | 9.76 | % | 10.15 | % |
Tier 1 risk-based capital ratio |
| 6.00 | % | 14.60 | % | 15.15 | % |
Total risk-based capital ratio |
| 10.00 | % | 15.87 | % | 16.42 | % |
Tangible common equity ratio |
| N/A |
| 10.35 | % | 8.86 | % |
CELTIC CAPITAL COPORATION ACQUISITION
On April 3, 2012, Pacific Western Bank completed the acquisition of Celtic Capital Corporation, or Celtic, an asset-based lending company based in Santa Monica, CA. Celtic focuses on providing asset-based loans to borrowers in the $5 million and under loan market in the United States. Pacific Western Bank acquired all of the capital stock of Celtic for $18 million in cash. Celtic’s tangible net assets at March 31, 2012 on a pro forma basis totaled approximately $9 million.
At April 3, 2012, Celtic had approximately $56 million in gross loans outstanding, with no loans on nonaccrual status. In addition, Pacific Western Bank assumed $47 million in outstanding debt, which was repaid on the closing date. The weighted average yield on Celtic’s loan portfolio as of the acquisition date was approximately 18% and its weighted average remaining maturity was seven months.
Celtic will operate under the name Celtic Capital Corporation as a subsidiary of Pacific Western Bank. Pacific Western has retained all 26 of Celtic employees.
ABOUT PACWEST BANCORP
PacWest Bancorp (“PacWest”) is a bank holding company with $5.4 billion in assets as of March 31, 2012, with one wholly-owned banking subsidiary, Pacific Western Bank (“Pacific Western”). Through 76 full-service community banking branches, Pacific Western provides commercial banking services, including real estate, construction and commercial loans, to small and medium-sized businesses. Pacific Western’s branches are located throughout California in Los Angeles, Orange, Riverside, San Bernardino, Santa Barbara, San Diego, San Francisco, San Luis Obispo, San Mateo and Ventura Counties. Through its subsidiaries, BFI Business Finance and Celtic Capital Corporation, and its divisions First Community Financial and Pacific Western Equipment Finance, Pacific Western also provides working capital financing and equipment leasing to growing companies located throughout the United States, with a focus on the Southwestern U.S., primarily in Arizona, California, Utah and Texas. Additional information regarding PacWest Bancorp is available on the Internet at www.pacwestbancorp.com. Information regarding Pacific Western Bank is also available on the Internet at www.pacificwesternbank.com.
FORWARD-LOOKING STATEMENTS
This press release contains certain forward-looking information about PacWest that is intended to be covered by the safe harbor for “forward-looking statements” provided by the Private Securities Litigation Reform Act of 1995. All statements other than statements of historical fact are forward-looking statements. Such statements involve inherent risks and uncertainties, many of which are difficult to predict and are generally beyond the control of the Company. We caution readers that a number of important factors could cause actual results to differ materially from those expressed in, implied or projected by, such forward-looking statements. Risks and uncertainties include, but are not limited to: lower than expected revenues; credit quality deterioration or a reduction in real estate values could cause an increase in the allowance for credit losses and a reduction in net earnings; increased competitive pressure among depository institutions; the Company’s ability to complete future acquisitions, successfully integrate such acquired entities, or achieve expected beneficial synergies and/or operating efficiencies within expected time-frames or at all; settlements with the FDIC related to our loss-sharing arrangements from the Los Padres Bank and Affinity Bank acquisitions; the possibility that personnel changes will not proceed as planned; the cost of additional capital is more than expected; a change in the interest rate environment reduces net interest margins; asset/liability repricing risks and liquidity risks; pending legal matters may take longer or cost more to resolve or may be resolved adversely to the Company; general economic conditions, either nationally or in the market areas in which the Company does or anticipates doing business, are less favorable than expected; environmental conditions, including natural disasters, may disrupt our business, impede our operations, negatively impact the values of collateral securing the Company’s loans
and leases or impair the ability of our borrowers to support their debt obligations; the economic and regulatory effects of the continuing war on terrorism and other events of war, including the conflicts in the Middle East; legislative or regulatory requirements or changes adversely affecting the Company’s business; changes in the securities markets; regulatory approvals for any capital activities cannot be obtained on the terms expected or on the anticipated schedule; and, other risks that are described in PacWest’s public filings with the U.S. Securities and Exchange Commission (the “SEC”). If any of these risks or uncertainties materializes or if any of the assumptions underlying such forward-looking statements proves to be incorrect, PacWest’s results could differ materially from those expressed in, implied or projected by such forward-looking statements. PacWest assumes no obligation to update such forward-looking statements.
For a more complete discussion of risks and uncertainties, investors and security holders are urged to read PacWest Bancorp’s annual report on Form 10-K, quarterly reports on Form 10-Q and other reports filed by PacWest with the SEC. The documents filed by PacWest with the SEC may be obtained at PacWest Bancorp’s website at www.pacwestbancorp.com or at the SEC’s website at www.sec.gov. These documents may also be obtained free of charge from PacWest by directing a request to: PacWest Bancorp c/o Pacific Western Bank, 275 North Brea Boulevard, Brea, CA 92821. Attention: Investor Relations. Telephone 714-671-6800.
PACWEST BANCORP AND SUBSIDIARIES
CONDENSED CONSOLIDATED BALANCE SHEETS
(Unaudited)
|
| March 31, |
| December 31, |
| ||
|
| 2012 |
| 2011 |
| ||
| �� | (In thousands, except per share and share data) |
| ||||
ASSETS |
|
|
|
|
| ||
Cash and due from banks |
| $ | 99,471 |
| $ | 92,342 |
|
Interest-earning deposits in financial institutions |
| 34,290 |
| 203,275 |
| ||
Total cash and cash equivalents |
| 133,761 |
| 295,617 |
| ||
|
|
|
|
|
| ||
Non-covered securities available-for-sale |
| 1,335,604 |
| 1,281,209 |
| ||
Covered securities available-for-sale |
| 45,274 |
| 45,149 |
| ||
Total securities available-for-sale, at estimated fair value |
| 1,380,878 |
| 1,326,358 |
| ||
Federal Home Loan Bank stock, at cost |
| 43,902 |
| 46,106 |
| ||
Total investment securities |
| 1,424,780 |
| 1,372,464 |
| ||
|
|
|
|
|
| ||
Non-covered loans and leases, net of unearned income |
| 2,865,283 |
| 2,807,713 |
| ||
Allowance for loan and lease losses |
| (74,767 | ) | (85,313 | ) | ||
Total non-covered loans and leases, net |
| 2,790,516 |
| 2,722,400 |
| ||
Covered loans, net |
| 660,297 |
| 703,023 |
| ||
Total loans and leases, net |
| 3,450,813 |
| 3,425,423 |
| ||
|
|
|
|
|
| ||
Non-covered other real estate owned, net |
| 46,206 |
| 48,412 |
| ||
Covered other real estate owned, net |
| 29,888 |
| 33,506 |
| ||
Total other real estate owned, net |
| 76,094 |
| 81,918 |
| ||
|
|
|
|
|
| ||
Premises and equipment, net |
| 22,885 |
| 23,068 |
| ||
FDIC loss sharing asset |
| 79,570 |
| 95,187 |
| ||
Cash surrender value of life insurance |
| 67,301 |
| 67,469 |
| ||
Goodwill |
| 56,144 |
| 39,141 |
| ||
Core deposit and customer relationship intangibles |
| 17,380 |
| 17,415 |
| ||
Other assets |
| 119,380 |
| 110,535 |
| ||
Total assets |
| $ | 5,448,108 |
| $ | 5,528,237 |
|
|
|
|
|
|
| ||
LIABILITIES |
|
|
|
|
| ||
Noninterest-bearing demand deposits |
| $ | 1,785,678 |
| $ | 1,685,799 |
|
Interest-bearing deposits |
| 2,770,992 |
| 2,891,654 |
| ||
Total deposits |
| 4,556,670 |
| 4,577,453 |
| ||
Borrowings |
| 193,104 |
| 225,000 |
| ||
Subordinated debentures |
| 108,250 |
| 129,271 |
| ||
Accrued interest payable and other liabilities |
| 40,439 |
| 50,310 |
| ||
Total liabilities |
| 4,898,463 |
| 4,982,034 |
| ||
STOCKHOLDERS’ EQUITY (1) |
| 549,645 |
| 546,203 |
| ||
Total liabilities and stockholders’ equity |
| $ | 5,448,108 |
| $ | 5,528,237 |
|
(1) Includes net unrealized gain on securities available-for-sale, net |
| $ | 27,101 |
| $ | 22,803 |
|
|
|
|
|
|
| ||
Tangible book value per share |
| $ | 12.77 |
| $ | 13.14 |
|
Book value per share |
| $ | 14.74 |
| $ | 14.66 |
|
|
|
|
|
|
| ||
Shares outstanding (includes unvested restricted shares of 1,617,760 at March 31, 2012 and 1,675,730 at December 31, 2011) |
| 37,298,138 |
| 37,254,318 |
| ||
PACWEST BANCORP AND SUBSIDIARIES
CONDENSED CONSOLIDATED STATEMENTS OF EARNINGS
(Unaudited)
|
| Three Months Ended |
| |||||||
|
| March 31, |
| December 31, |
| March 31, |
| |||
|
| 2012 |
| 2011 |
| 2011 |
| |||
|
| (In thousands, except per share data) |
| |||||||
Interest income: |
|
|
|
|
|
|
| |||
Loans and leases |
| $ | 64,752 |
| $ | 61,684 |
| $ | 66,781 |
|
Investment securities |
| 9,580 |
| 9,107 |
| 7,819 |
| |||
Deposits in financial institutions |
| 68 |
| 122 |
| 57 |
| |||
Total interest income |
| 74,400 |
| 70,913 |
| 74,657 |
| |||
|
|
|
|
|
|
|
| |||
Interest expense: |
|
|
|
|
|
|
| |||
Deposits |
| 3,604 |
| 4,103 |
| 5,956 |
| |||
Borrowings |
| 1,925 |
| 1,782 |
| 1,744 |
| |||
Subordinated debentures |
| 1,191 |
| 1,255 |
| 1,219 |
| |||
Total interest expense |
| 6,720 |
| 7,140 |
| 8,919 |
| |||
|
|
|
|
|
|
|
| |||
Net interest income |
| 67,680 |
| 63,773 |
| 65,738 |
| |||
|
|
|
|
|
|
|
| |||
Provision for credit losses: |
|
|
|
|
|
|
| |||
Non-covered loans and leases |
| (10,000 | ) | — |
| 7,800 |
| |||
Covered loans |
| 3,926 |
| 4,122 |
| 2,910 |
| |||
Total provision for credit losses |
| (6,074 | ) | 4,122 |
| 10,710 |
| |||
|
|
|
|
|
|
|
| |||
Net interest income after provision for credit losses |
| 73,754 |
| 59,651 |
| 55,028 |
| |||
|
|
|
|
|
|
|
| |||
Noninterest income: |
|
|
|
|
|
|
| |||
Service charges on deposit accounts |
| 3,353 |
| 3,326 |
| 3,558 |
| |||
Other commissions and fees |
| 1,883 |
| 1,864 |
| 1,720 |
| |||
Gain (loss) on sale of leases |
| 990 |
| — |
| — |
| |||
Increase in cash surrender value of life insurance |
| 365 |
| 337 |
| 379 |
| |||
FDIC loss sharing income (expense), net |
| (3,579 | ) | 2,667 |
| (1,170 | ) | |||
Other income |
| 250 |
| 60 |
| 302 |
| |||
Total noninterest income |
| 3,262 |
| 8,254 |
| 4,789 |
| |||
|
|
|
|
|
|
|
| |||
Noninterest expense: |
|
|
|
|
|
|
| |||
Compensation |
| 24,187 |
| 21,597 |
| 21,929 |
| |||
Occupancy |
| 7,288 |
| 7,137 |
| 6,983 |
| |||
Data processing |
| 2,280 |
| 2,132 |
| 2,475 |
| |||
Other professional services |
| 1,770 |
| 1,946 |
| 2,296 |
| |||
Business development |
| 638 |
| 609 |
| 569 |
| |||
Communications |
| 608 |
| 640 |
| 859 |
| |||
Insurance and assessments |
| 1,293 |
| 1,590 |
| 2,337 |
| |||
Non-covered other real estate owned, net |
| 1,821 |
| 1,714 |
| 703 |
| |||
Covered other real estate owned, net |
| 822 |
| 226 |
| (2,578 | ) | |||
Intangible asset amortization |
| 1,735 |
| 1,836 |
| 2,307 |
| |||
Acquisition costs |
| 25 |
| 600 |
| — |
| |||
Debt termination |
| 22,598 |
| — |
| — |
| |||
Other expenses |
| 3,830 |
| 3,442 |
| 3,519 |
| |||
Total noninterest expense |
| 68,895 |
| 43,469 |
| 41,399 |
| |||
|
|
|
|
|
|
|
| |||
Earnings before income taxes |
| 8,121 |
| 24,436 |
| 18,418 |
| |||
Income tax expense |
| (2,857 | ) | (10,553 | ) | (7,742 | ) | |||
Net earnings |
| $ | 5,264 |
| $ | 13,883 |
| $ | 10,676 |
|
|
|
|
|
|
|
|
| |||
Earnings per share information: |
|
|
|
|
|
|
| |||
Basic earnings per share |
| $ | 0.14 |
| $ | 0.38 |
| $ | 0.29 |
|
Diluted earnings per share |
| $ | 0.14 |
| $ | 0.38 |
| $ | 0.29 |
|
Basic weighted average shares |
| 35,630.0 |
| 35,548.0 |
| 35,454.1 |
| |||
Diluted weighted average shares |
| 35,630.0 |
| 35,548.0 |
| 35,454.1 |
| |||
PACWEST BANCORP AND SUBSIDIARIES
AVERAGE BALANCE SHEETS AND YIELD ANALYSIS
(Unaudited)
|
| Three Months Ended |
| |||||||
|
| March 31, |
| December 31, |
| March 31, |
| |||
|
| 2012 |
| 2011 |
| 2011 |
| |||
|
| (Dollars in Thousands) |
| |||||||
Average Assets: |
|
|
|
|
|
|
| |||
Loans and leases, net of unearned income |
| $ | 3,562,766 |
| $ | 3,562,766 |
| $ | 3,992,204 |
|
Investment securities |
| 1,363,067 |
| 1,309,931 |
| 913,613 |
| |||
Interest-earning deposits in financial institutions |
| 103,557 |
| 186,147 |
| 89,248 |
| |||
Average interest-earning assets |
| 5,029,390 |
| 5,058,844 |
| 4,995,065 |
| |||
Other assets |
| 471,177 |
| 463,328 |
| 515,717 |
| |||
Average total assets |
| $ | 5,500,567 |
| $ | 5,522,172 |
| $ | 5,510,782 |
|
|
|
|
|
|
|
|
| |||
Average liabilities: |
|
|
|
|
|
|
| |||
Interest checking deposits |
| $ | 513,190 |
| $ | 488,783 |
| $ | 495,950 |
|
Money market deposits |
| 1,199,226 |
| 1,229,387 |
| 1,240,524 |
| |||
Savings deposits |
| 160,958 |
| 157,617 |
| 141,027 |
| |||
Time deposits |
| 942,501 |
| 1,003,939 |
| 1,167,468 |
| |||
Average interest-bearing deposits |
| 2,815,875 |
| 2,879,726 |
| 3,044,969 |
| |||
Borrowings |
| 239,779 |
| 225,011 |
| 227,122 |
| |||
Subordinated debentures |
| 123,393 |
| 129,319 |
| 129,545 |
| |||
Average interest-bearing liabilities |
| 3,179,047 |
| 3,234,056 |
| 3,401,636 |
| |||
Noninterest-bearing demand deposits |
| 1,719,003 |
| 1,702,543 |
| 1,582,720 |
| |||
Other liabilities |
| 49,731 |
| 46,777 |
| 43,501 |
| |||
Average total liabilities |
| 4,947,781 |
| 4,983,376 |
| 5,027,857 |
| |||
Average stockholders’ equity |
| 552,786 |
| 538,796 |
| 482,925 |
| |||
Average liabilities and stockholders’ equity |
| $ | 5,500,567 |
| $ | 5,522,172 |
| $ | 5,510,782 |
|
|
|
|
|
|
|
|
| |||
Average deposits |
| $ | 4,534,878 |
| $ | 4,582,269 |
| $ | 4,627,689 |
|
|
|
|
|
|
|
|
| |||
Yield on: |
|
|
|
|
|
|
| |||
Average loans and leases |
| 7.31 | % | 6.87 | % | 6.78 | % | |||
Average investment securities |
| 2.83 | % | 2.76 | % | 3.47 | % | |||
Average interest-earning deposits |
| 0.26 | % | 0.26 | % | 0.26 | % | |||
Average interest-earning assets |
| 5.95 | % | 5.56 | % | 6.06 | % | |||
|
|
|
|
|
|
|
| |||
Cost of: |
|
|
|
|
|
|
| |||
Average deposits/all-in deposit cost (1) |
| 0.32 | % | 0.36 | % | 0.52 | % | |||
Average interest-bearing deposits |
| 0.51 | % | 0.57 | % | 0.79 | % | |||
Average borrowings |
| 3.23 | % | 3.14 | % | 3.11 | % | |||
Average subordinated debentures |
| 3.88 | % | 3.85 | % | 3.82 | % | |||
Average interest-bearing liabilities |
| 0.85 | % | 0.88 | % | 1.06 | % | |||
|
|
|
|
|
|
|
| |||
Interest rate spread (2) |
| 5.10 | % | 4.68 | % | 5.00 | % | |||
Net interest margin (3) |
| 5.41 | % | 5.00 | % | 5.34 | % | |||
(1) Cost of average deposits/all-in deposit cost is calculated as annualized interest expense on deposits divided by average deposits.
(2) Interest rate spread is calculated as the yield on average interest-earning assets less the cost of average interest-bearing liabilities.
(3) Net interest margin is calculated as annualized net interest income divided by average interest-earning assets.
PACWEST BANCORP AND SUBSIDIARIES
LOAN CONCENTRATION
(Unaudited)
|
| March 31, 2012 |
| |||||||||||||
|
| Total Loans |
| Non-Covered Loans |
| Covered Loans |
| |||||||||
|
|
|
| % of |
|
|
| % of |
|
|
| % of |
| |||
|
| Amount |
| Total |
| Amount |
| Total |
| Amount |
| Total |
| |||
|
| (Dollars in thousands) |
| |||||||||||||
Real estate mortgage: |
|
|
|
|
|
|
|
|
|
|
|
|
| |||
Hospitality |
| $ | 143,491 |
| 4 | % | $ | 143,491 |
| 5 | % | $ | — |
| 0 | % |
SBA 504 |
| 57,560 |
| 2 | % | 57,560 |
| 2 | % | — |
| 0 | % | |||
Other |
| 2,394,654 |
| 66 | % | 1,695,001 |
| 59 | % | 699,653 |
| 92 | % | |||
Total real estate mortgage |
| 2,595,705 |
| 72 | % | 1,896,052 |
| 66 | % | 699,653 |
| 92 | % | |||
Real estate construction: |
|
|
|
|
|
|
|
|
|
|
|
|
| |||
Residential |
| 41,367 |
| 1 | % | 25,454 |
| 1 | % | 15,913 |
| 2 | % | |||
Commercial |
| 118,128 |
| 3 | % | 92,850 |
| 3 | % | 25,278 |
| 3 | % | |||
Total real estate construction |
| 159,495 |
| 4 | % | 118,304 |
| 4 | % | 41,191 |
| 5 | % | |||
|
|
|
|
|
|
|
|
|
|
|
|
|
| |||
Total real estate loans |
| 2,755,200 |
| 76 | % | 2,014,356 |
| 70 | % | 740,844 |
| 97 | % | |||
|
|
|
|
|
|
|
|
|
|
|
|
|
| |||
Commercial: |
|
|
|
|
|
|
|
|
|
|
|
|
| |||
Collateralized |
| 442,145 |
| 12 | % | 421,996 |
| 15 | % | 20,149 |
| 3 | % | |||
Unsecured |
| 69,284 |
| 2 | % | 68,543 |
| 2 | % | 741 |
| 0 | % | |||
Asset-based |
| 147,181 |
| 4 | % | 147,181 |
| 5 | % | — |
| 0 | % | |||
SBA 7(a) |
| 27,721 |
| 1 | % | 27,721 |
| 1 | % | — |
| 0 | % | |||
Total commercial |
| 686,331 |
| 19 | % | 665,441 |
| 23 | % | 20,890 |
| 3 | % | |||
Leases |
| 153,845 |
| 4 | % | 153,845 |
| 5 | % | — |
| 0 | % | |||
Consumer |
| 16,511 |
| 0 | % | 15,826 |
| 1 | % | 685 |
| 0 | % | |||
Foreign |
| 18,752 |
| 1 | % | 18,752 |
| 1 | % | — |
| 0 | % | |||
Total gross loans |
| $ | 3,630,639 |
| 100 | % | $ | 2,868,220 |
| 100 | % | 762,419 |
| 100 | % | |
Covered loans: |
|
|
|
|
|
|
|
|
|
|
|
|
| |||
Discount |
|
|
|
|
|
|
|
|
| (66,312 | ) |
|
| |||
Allowance for loan losses |
|
|
|
|
|
|
|
|
| (35,810 | ) |
|
| |||
Covered loans, net |
|
|
|
|
|
|
|
|
| $ | 660,297 |
|
|
| ||
PACWEST BANCORP AND SUBSIDIARIES
NON-COVERED LOAN CONCENTRATION
REAL ESTATE MORTGAGE LOANS
(Unaudited)
|
| March 31, 2012 |
| December 31, 2011 |
| ||||||
|
|
|
| % of |
|
|
| % of |
| ||
Loan Category |
| Amount |
| Total |
| Amount |
| Total |
| ||
|
| (Dollars in thousands) |
| ||||||||
Commercial real estate mortgage: |
|
|
|
|
|
|
|
|
| ||
Industrial/warehouse |
| $ | 352,033 |
| 18.6 | % | $ | 367,494 |
| 18.5 | % |
Retail |
| 266,411 |
| 14.1 | % | 286,691 |
| 14.5 | % | ||
Office buildings |
| 288,105 |
| 15.2 | % | 290,074 |
| 14.6 | % | ||
Owner-occupied |
| 210,055 |
| 11.1 | % | 226,307 |
| 11.4 | % | ||
Hotel |
| 143,491 |
| 7.6 | % | 144,402 |
| 7.3 | % | ||
Healthcare |
| 117,440 |
| 6.2 | % | 131,625 |
| 6.6 | % | ||
Mixed use |
| 52,510 |
| 2.8 | % | 53,855 |
| 2.7 | % | ||
Gas station |
| 30,545 |
| 1.6 | % | 33,715 |
| 1.7 | % | ||
Self storage |
| 23,036 |
| 1.2 | % | 23,148 |
| 1.2 | % | ||
Restaurant |
| 21,670 |
| 1.1 | % | 22,549 |
| 1.1 | % | ||
Land acquisition/development |
| 13,953 |
| 0.7 | % | 14,015 |
| 0.7 | % | ||
Unimproved land |
| 12,137 |
| 0.6 | % | 1,369 |
| 0.1 | % | ||
Other |
| 193,920 |
| 10.2 | % | 206,504 |
| 10.4 | % | ||
Total commercial real estate mortgage |
| 1,725,306 |
| 91.0 | % | 1,801,748 |
| 90.9 | % | ||
|
|
|
|
|
|
|
|
|
| ||
Residential real estate mortgage: |
|
|
|
|
|
|
|
|
| ||
Multi-family |
| 95,263 |
| 5.0 | % | 93,866 |
| 4.7 | % | ||
Single family owner-occupied |
| 33,749 |
| 1.8 | % | 32,209 |
| 1.6 | % | ||
Single family nonowner-occupied |
| 8,314 |
| 0.4 | % | 19,341 |
| 1.0 | % | ||
HELOCs |
| 33,420 |
| 1.8 | % | 35,300 |
| 1.8 | % | ||
Total residential real estate mortgage |
| 170,746 |
| 9.0 | % | 180,716 |
| 9.1 | % | ||
|
|
|
|
|
|
|
|
|
| ||
Total gross non-covered real estate mortgage loans |
| $ | 1,896,052 |
| 100.0 | % | $ | 1,982,464 |
| 100.0 | % |
PACWEST BANCORP AND SUBSIDIARIES
COVERED LOAN CONCENTRATION
REAL ESTATE MORTGAGE LOANS
(Unaudited)
|
| March 31, 2012 |
| December 31, 2011 |
| ||||||
|
|
|
| % of |
|
|
| % of |
| ||
Loan Category |
| Amount |
| Total |
| Amount |
| Total |
| ||
|
| (Dollars in thousands) |
| ||||||||
Commercial real estate mortgage: |
|
|
|
|
|
|
|
|
| ||
Industrial/warehouse |
| $ | 31,942 |
| 4.6 | % | $ | 33,755 |
| 4.6 | % |
Retail |
| 109,654 |
| 15.7 | % | 114,475 |
| 15.5 | % | ||
Office buildings |
| 75,540 |
| 10.8 | % | 77,767 |
| 10.6 | % | ||
Owner-occupied |
| 24,663 |
| 3.5 | % | 24,837 |
| 3.4 | % | ||
Hotel |
| 2,931 |
| 0.4 | % | 2,944 |
| 0.4 | % | ||
Healthcare |
| 15,410 |
| 2.2 | % | 16,851 |
| 2.3 | % | ||
Mixed use |
| 7,757 |
| 1.1 | % | 7,817 |
| 1.1 | % | ||
Gas station |
| 5,972 |
| 0.9 | % | 6,001 |
| 0.8 | % | ||
Self storage |
| 52,529 |
| 7.5 | % | 52,793 |
| 7.2 | % | ||
Restaurant |
| 2,492 |
| 0.4 | % | 2,532 |
| 0.3 | % | ||
Unimproved land |
| 1,743 |
| 0.2 | % | 1,752 |
| 0.2 | % | ||
Other |
| 15,582 |
| 2.2 | % | 16,535 |
| 2.2 | % | ||
Total commercial real estate mortgage |
| 346,215 |
| 49.5 | % | 358,059 |
| 48.6 | % | ||
|
|
|
|
|
|
|
|
|
| ||
Residential real estate mortgage: |
|
|
|
|
|
|
|
|
| ||
Multi-family |
| 233,865 |
| 33.4 | % | 250,633 |
| 34.0 | % | ||
Single family owner-occupied |
| 87,345 |
| 12.5 | % | 95,248 |
| 12.9 | % | ||
Single family nonowner-occupied |
| 26,373 |
| 3.8 | % | 25,624 |
| 3.5 | % | ||
HELOCs |
| 5,855 |
| 0.8 | % | 6,794 |
| 0.9 | % | ||
Total residential real estate mortgage |
| 353,438 |
| 50.5 | % | 378,299 |
| 51.4 | % | ||
|
|
|
|
|
|
|
|
|
| ||
Total gross covered real estate mortgage loans |
| $ | 699,653 |
| 100.0 | % | $ | 736,358 |
| 100.0 | % |
PACWEST BANCORP AND SUBSIDIARIES
NON-COVERED LOAN CONCENTRATION TREND
(Unaudited)
|
| March 31, |
| December 31, |
| September 30, |
| June 30, |
| March 31, |
| |||||
Loan Segment |
| 2012 |
| 2011 |
| 2011 |
| 2011 |
| 2011 |
| |||||
|
| (In thousands) |
| |||||||||||||
Real estate mortgage |
| $ | 1,896,052 |
| $ | 1,982,464 |
| $ | 2,031,893 |
| $ | 2,073,868 |
| $ | 2,172,923 |
|
Real estate construction |
| 118,304 |
| 113,059 |
| 152,411 |
| 160,254 |
| 176,758 |
| |||||
Commercial |
| 665,441 |
| 671,939 |
| 671,963 |
| 640,805 |
| 667,401 |
| |||||
Leases (1) |
| 153,845 |
| — |
| — |
| — |
| — |
| |||||
Consumer |
| 15,826 |
| 23,711 |
| 20,621 |
| 22,248 |
| 21,815 |
| |||||
Foreign: |
|
|
|
|
|
|
|
|
|
|
| |||||
Commercial |
| 16,747 |
| 19,531 |
| 19,532 |
| 18,633 |
| 21,808 |
| |||||
Other, including real estate |
| 2,005 |
| 1,401 |
| 1,400 |
| 1,442 |
| 1,488 |
| |||||
Total gross non-covered loans and leases |
| $ | 2,868,220 |
| $ | 2,812,105 |
| $ | 2,897,820 |
| $ | 2,917,250 |
| $ | 3,062,193 |
|
(1) Does not include leases in process of $13.8 million.
PACWEST BANCORP AND SUBSIDIARIES
COVERED LOAN CONCENTRATION TREND
(Unaudited)
|
| March 31, |
| December 31, |
| September 30, |
| June 30, |
| March 31, |
| |||||
|
| 2012 |
| 2011 |
| 2011 |
| 2011 |
| 2011 |
| |||||
|
| (In thousands) |
| |||||||||||||
Real estate mortgage |
| $ | 699,653 |
| $ | 736,358 |
| $ | 788,253 |
| $ | 837,425 |
| $ | 879,753 |
|
Real estate construction |
| 41,191 |
| 46,918 |
| 55,464 |
| 64,868 |
| 82,992 |
| |||||
Commercial |
| 20,889 |
| 25,610 |
| 26,729 |
| 28,550 |
| 31,699 |
| |||||
Consumer |
| 686 |
| 735 |
| 824 |
| 844 |
| 939 |
| |||||
Total gross covered loans |
| 762,419 |
| 809,621 |
| 871,270 |
| 931,687 |
| 995,383 |
| |||||
Less: discount |
| (66,312 | ) | (75,323 | ) | (80,920 | ) | (92,847 | ) | (106,512 | ) | |||||
Less: allowance for loan losses |
| (35,810 | ) | (31,275 | ) | (29,291 | ) | (32,888 | ) | (29,438 | ) | |||||
Covered loans, net |
| $ | 660,297 |
| $ | 703,023 |
| $ | 761,059 |
| $ | 805,952 |
| $ | 859,433 |
|
PACWEST BANCORP AND SUBSIDIARIES
NON-COVERED NONCLASSIFIED AND CLASSIFIED LOANS AND LEASES
(Unaudited)
|
| March 31, 2012 |
| |||||||
|
| Nonclassified |
| Classified |
| Total |
| |||
|
| (In thousands) |
| |||||||
Real estate mortgage: |
|
|
|
|
|
|
| |||
Hospitality |
| $ | 122,944 |
| $ | 20,547 |
| $ | 143,491 |
|
SBA 504 |
| 50,611 |
| 6,949 |
| 57,560 |
| |||
Other |
| 1,640,177 |
| 54,824 |
| 1,695,001 |
| |||
Total real estate mortgage |
| 1,813,732 |
| 82,320 |
| 1,896,052 |
| |||
Real estate construction: |
|
|
|
|
|
|
| |||
Residential |
| 22,547 |
| 2,907 |
| 25,454 |
| |||
Commercial |
| 71,087 |
| 21,763 |
| 92,850 |
| |||
Total real estate construction |
| 93,634 |
| 24,670 |
| 118,304 |
| |||
Commercial: |
|
|
|
|
|
|
| |||
Collateralized |
| 402,904 |
| 19,092 |
| 421,996 |
| |||
Unsecured |
| 65,072 |
| 3,471 |
| 68,543 |
| |||
Asset-based |
| 145,948 |
| 1,233 |
| 147,181 |
| |||
SBA 7(a) |
| 17,152 |
| 10,569 |
| 27,721 |
| |||
Total commercial |
| 631,076 |
| 34,365 |
| 665,441 |
| |||
Leases |
| 150,220 |
| 3,625 |
| 153,845 |
| |||
Consumer |
| 14,873 |
| 953 |
| 15,826 |
| |||
Foreign |
| 18,752 |
| — |
| 18,752 |
| |||
Total non-covered loans and leases |
| $ | 2,722,287 |
| $ | 145,933 |
| $ | 2,868,220 |
|
|
| December 31, 2011 |
| |||||||
|
| Nonclassified |
| Classified |
| Total |
| |||
|
| (In thousands) |
| |||||||
Real estate mortgage: |
|
|
|
|
|
|
| |||
Hospitality |
| $ | 123,071 |
| $ | 21,331 |
| $ | 144,402 |
|
SBA 504 |
| 51,522 |
| 6,855 |
| 58,377 |
| |||
Other |
| 1,690,830 |
| 88,855 |
| 1,779,685 |
| |||
Total real estate mortgage |
| 1,865,423 |
| 117,041 |
| 1,982,464 |
| |||
Real estate construction: |
|
|
|
|
|
|
| |||
Residential |
| 14,743 |
| 2,926 |
| 17,669 |
| |||
Commercial |
| 64,667 |
| 30,723 |
| 95,390 |
| |||
Total real estate construction |
| 79,410 |
| 33,649 |
| 113,059 |
| |||
Commercial: |
|
|
|
|
|
|
| |||
Collateralized |
| 395,041 |
| 18,979 |
| 414,020 |
| |||
Unsecured |
| 75,017 |
| 3,920 |
| 78,937 |
| |||
Asset-based |
| 149,947 |
| 40 |
| 149,987 |
| |||
SBA 7(a) |
| 18,045 |
| 10,950 |
| 28,995 |
| |||
Total commercial |
| 638,050 |
| 33,889 |
| 671,939 |
| |||
Consumer |
| 22,730 |
| 981 |
| 23,711 |
| |||
Foreign |
| 20,932 |
| — |
| 20,932 |
| |||
Total non-covered loans |
| $ | 2,626,545 |
| $ | 185,560 |
| $ | 2,812,105 |
|
Note: Nonclassified loans and leases are those with a credit risk rating of either pass or special mention, while classified loans and leases are those with a credit risk rating of either substandard or doubtful.
PACWEST BANCORP AND SUBSIDIARIES
ALLOWANCE FOR CREDIT LOSSES ROLLFORWARD
AND NET CHARGE-OFF RATIOS FOR
NON-COVERED LOANS AND LEASES (1)
(Unaudited)
|
| Three Months Ended |
| |||||||
|
| March 31, |
| December 31, |
| March 31, |
| |||
|
| 2012 |
| 2011 |
| 2011 |
| |||
|
| (Dollars in thousands) |
| |||||||
Allowance for credit losses, beginning of period |
| $ | 93,783 |
| $ | 96,535 |
| $ | 104,328 |
|
Loans charged-off: |
|
|
|
|
|
|
| |||
Real estate mortgage |
| (2,190 | ) | (321 | ) | (1,212 | ) | |||
Real estate construction |
| — |
| (1,048 | ) | (4,645 | ) | |||
Commercial |
| (871 | ) | (2,105 | ) | (3,121 | ) | |||
Consumer |
| (199 | ) | (43 | ) | (160 | ) | |||
Foreign |
| — |
| — |
| — |
| |||
Total loans charged off |
| (3,260 | ) | (3,517 | ) | (9,138 | ) | |||
Recoveries on loans charged-off: |
|
|
|
|
|
|
| |||
Real estate mortgage |
| 329 |
| 164 |
| 97 |
| |||
Real estate construction |
| 10 |
| 4 |
| 92 |
| |||
Commercial |
| 824 |
| 508 |
| 617 |
| |||
Consumer |
| 31 |
| 19 |
| 411 |
| |||
Foreign |
| 20 |
| 70 |
| 32 |
| |||
Total recoveries on loans charged off |
| 1,214 |
| 765 |
| 1,249 |
| |||
Net charge-offs |
| (2,046 | ) | (2,752 | ) | (7,889 | ) | |||
Provision for credit losses |
| (10,000 | ) | — |
| 7,800 |
| |||
Allowance for credit losses, end of period |
| $ | 81,737 |
| $ | 93,783 |
| $ | 104,239 |
|
|
|
|
|
|
|
|
| |||
Annualized net charge-offs to average loans and leases |
| 0.29 | % | 0.39 | % | 1.03 | % | |||
(1) Applies only to non-covered loans and leases.
PACWEST BANCORP AND SUBSIDIARIES
ALLOWANCE FOR CREDIT LOSSES, NONPERFORMING
ASSETS AND CREDIT QUALITY RATIOS FOR
NON-COVERED LOANS AND LEASES
(Unaudited)
|
| March 31, |
| December 31, |
| ||
|
| 2012 |
| 2011 |
| ||
|
| (Dollars in thousands) |
| ||||
Allowance for loan and lease losses (1) |
| $ | 74,767 |
| $ | 85,313 |
|
Reserve for unfunded loan commitments (1) |
| 6,970 |
| 8,470 |
| ||
Total allowance for credit losses |
| $ | 81,737 |
| $ | 93,783 |
|
|
|
|
|
|
| ||
Nonaccrual loans and leases (2) |
| $ | 48,162 |
| $ | 58,260 |
|
Other real estate owned (2) |
| 46,206 |
| 48,412 |
| ||
Total nonperforming assets |
| $ | 94,368 |
| $ | 106,672 |
|
|
|
|
|
|
| ||
Performing restructured loans (1) |
| $ | 110,062 |
| $ | 116,791 |
|
|
|
|
|
|
| ||
Allowance for credit losses to loans and leases, net of unearned income |
| 2.85 | % | 3.34 | % | ||
Allowance for credit losses to nonaccrual loans and leases |
| 169.7 | % | 161.0 | % | ||
Nonperforming assets to loans and leases, net of unearned income, and other real estate owned |
| 3.24 | % | 3.73 | % | ||
Nonperforming assets to total assets |
| 1.73 | % | 1.93 | % | ||
Nonaccrual loans and leases to loans and leases, net of unearned income |
| 1.68 | % | 2.07 | % | ||
(1) Applies to non-covered loans.
(2) Excludes covered nonperforming assets.
PACWEST BANCORP AND SUBSIDIARIES
DEPOSITS
(Unaudited)
|
| March 31, |
| December 31, |
| ||
Deposit Category |
| 2012 |
| 2011 |
| ||
|
| (Dollars in thousands) |
| ||||
Noninterest-bearing demand deposits |
| $ | 1,785,678 |
| $ | 1,685,799 |
|
Interest checking deposits |
| 516,360 |
| 500,998 |
| ||
Money market deposits |
| 1,170,960 |
| 1,265,282 |
| ||
Savings deposits |
| 163,102 |
| 157,480 |
| ||
Total core deposits |
| 3,636,100 |
| 3,609,559 |
| ||
Time deposits under $100,000 |
| 310,007 |
| 324,521 |
| ||
Time deposits of $100,000 and over |
| 610,563 |
| 643,373 |
| ||
Total time deposits |
| 920,570 |
| 967,894 |
| ||
Total deposits |
| $ | 4,556,670 |
| $ | 4,577,453 |
|
|
|
|
|
|
| ||
Noninterest-bearing demand deposits as a percentage of total deposits |
| 39 | % | 37 | % | ||
Core deposits as a percentage of total deposits |
| 80 | % | 79 | % | ||
PACWEST BANCORP AND SUBSIDIARIES
TIME DEPOSITS
(Unaudited)
|
| March 31, 2012 |
| |||||||||
|
| Time |
| Time |
|
|
|
|
| |||
|
| Deposits |
| Deposits |
| Total |
|
|
| |||
|
| Under |
| $100,000 |
| Time |
|
|
| |||
Maturity |
| $100,000 |
| or More |
| Deposits |
| Rate |
| |||
|
| (In thousands) |
| |||||||||
Due in three months or less |
| $ | 57,671 |
| $ | 119,634 |
| $ | 177,305 |
| 0.65 | % |
Due in over three months through six months |
| 37,577 |
| 64,326 |
| 101,903 |
| 0.54 | % | |||
Due in over six months through twelve months |
| 75,283 |
| 118,986 |
| 194,269 |
| 1.39 | % | |||
Due in over twelve months |
| 139,476 |
| 307,617 |
| 447,093 |
| 1.61 | % | |||
Total |
| $ | 310,007 |
| $ | 610,563 |
| $ | 920,570 |
| 1.26 | % |
PACWEST BANCORP AND SUBSIDIARIES
GAAP TO NON-GAAP RECONCILIATIONS
(Unaudited)
|
| Three Months Ended |
| |||||||
Pre-Credit, Pre-Debt Termination, and |
| March 31, |
| December 31, |
| March 31, |
| |||
Pre-Tax Earnings |
| 2012 |
| 2011 |
| 2011 |
| |||
|
| (In thousands) |
| |||||||
Net earnings |
| $ | 5,264 |
| $ | 13,883 |
| $ | 10,676 |
|
Plus: Total provision for credit losses |
| (6,074 | ) | 4,122 |
| 10,710 |
| |||
Other real estate owned expense, net |
|
|
|
|
|
|
| |||
Non-covered |
| 1,821 |
| 1,714 |
| 703 |
| |||
Covered |
| 822 |
| 226 |
| (2,578 | ) | |||
Debt termination expense |
| 22,598 |
| — |
| — |
| |||
Income tax expense |
| 2,857 |
| 10,553 |
| 7,742 |
| |||
Less: FDIC loss sharing income (expense), net |
| (3,579 | ) | 2,667 |
| (1,170 | ) | |||
Pre-credit, pre-debt termination, and pre-tax earnings |
| $ | 30,867 |
| $ | 27,831 |
| $ | 28,423 |
|
|
| Three Months Ended |
| |||||||
|
| March 31, |
| December 31, |
| March 31, |
| |||
Adjusted Efficiency Ratio |
| 2012 |
| 2011 |
| 2011 |
| |||
|
| (Dollars in thousands) |
| |||||||
Noninterest expense |
| $ | 68,895 |
| $ | 43,469 |
| $ | 41,399 |
|
Less: Non-covered OREO expense |
| 1,821 |
| 1,714 |
| 703 |
| |||
Covered OREO expense |
| 822 |
| 226 |
| (2,578 | ) | |||
Debt termination expense |
| 22,598 |
| — |
| — |
| |||
Adjusted noninterest expense |
| $ | 43,654 |
| $ | 41,529 |
| $ | 43,274 |
|
|
|
|
|
|
|
|
| |||
Net interest income |
| $ | 67,680 |
| $ | 63,773 |
| $ | 65,738 |
|
Noninterest income |
| 3,262 |
| 8,254 |
| 4,789 |
| |||
Net revenues |
| 70,942 |
| 72,027 |
| 70,527 |
| |||
Less: FDIC loss sharing income (expense), net |
| (3,579 | ) | 2,667 |
| (1,170 | ) | |||
Adjusted net revenues |
| $ | 74,521 |
| $ | 69,360 |
| $ | 71,697 |
|
|
|
|
|
|
|
|
| |||
Base efficiency ratio (1) |
| 97.1 | % | 60.4 | % | 58.7 | % | |||
Adjusted efficiency ratio (2) |
| 58.6 | % | 59.9 | % | 60.4 | % | |||
(1) Noninterest expense divided by net revenues.
(2) Adjusted noninterest expense divided by adjusted net revenues.
PACWEST BANCORP AND SUBSIDIARIES
GAAP TO NON-GAAP RECONCILIATIONS
(Unaudited)
|
| March 31, |
| December 31, |
| ||
Tangible Common Equity |
| 2012 |
| 2011 |
| ||
|
| (Dollars in thousands) |
| ||||
PacWest Bancorp Consolidated: |
|
|
|
|
| ||
Stockholders’ equity |
| $ | 549,645 |
| $ | 546,203 |
|
Less: Intangible assets |
| 73,524 |
| 56,556 |
| ||
Tangible common equity |
| $ | 476,121 |
| $ | 489,647 |
|
|
|
|
|
|
| ||
Total assets |
| $ | 5,448,108 |
| $ | 5,528,237 |
|
Less: Intangible assets |
| 73,524 |
| 56,556 |
| ||
Tangible assets |
| $ | 5,374,584 |
| $ | 5,471,681 |
|
|
|
|
|
|
| ||
Equity to assets ratio |
| 10.09 | % | 9.88 | % | ||
Tangible common equity ratio (1) |
| 8.86 | % | 8.95 | % | ||
|
|
|
|
|
| ||
Pacific Western Bank: |
|
|
|
|
| ||
Stockholders’ equity |
| $ | 627,792 |
| $ | 625,494 |
|
Less: Intangible assets |
| 73,524 |
| 56,556 |
| ||
Tangible common equity |
| $ | 554,268 |
| $ | 568,938 |
|
|
|
|
|
|
| ||
Total assets |
| $ | 5,430,107 |
| $ | 5,512,025 |
|
Less: Intangible assets |
| 73,524 |
| 56,556 |
| ||
Tangible assets |
| $ | 5,356,583 |
| $ | 5,455,469 |
|
|
|
|
|
|
| ||
Equity to assets ratio |
| 11.56 | % | 11.35 | % | ||
Tangible common equity ratio (1) |
| 10.35 | % | 10.43 | % | ||
(1) Calculated as tangible common equity divided by tangible assets.
PACWEST BANCORP AND SUBSIDIARIES
EARNINGS PER SHARE CALCULATIONS
(Unaudited)
|
| Three Months Ended |
| |||||||
|
| March 31, |
| December 31, |
| March 31, |
| |||
|
| 2012 |
| 2011 |
| 2011 |
| |||
|
| (In thousands, except per share data) |
| |||||||
Basic Earnings Per Share: |
|
|
|
|
|
|
| |||
Net earnings |
| $ | 5,264 |
| $ | 13,883 |
| $ | 10,676 |
|
Less: earnings allocated to unvested restricted stock (1) |
| (122 | ) | (470 | ) | (386 | ) | |||
Net earnings allocated to common shares |
| $ | 5,142 |
| $ | 13,413 |
| $ | 10,290 |
|
|
|
|
|
|
|
|
| |||
Weighted-average basic shares and unvested restricted stock outstanding |
| 37,284.0 |
| 37,260.8 |
| 36,801.7 |
| |||
Less: weighted-average unvested restricted stock outstanding |
| (1,654.0 | ) | (1,712.8 | ) | (1,347.6 | ) | |||
Weighted-average basic shares outstanding |
| 35,630.0 |
| 35,548.0 |
| 35,454.1 |
| |||
|
|
|
|
|
|
|
| |||
Basic earnings per share |
| $ | 0.14 |
| $ | 0.38 |
| $ | 0.29 |
|
|
|
|
|
|
|
|
| |||
Diluted Earnings Per Share: |
|
|
|
|
|
|
| |||
Net earnings allocated to common shares |
| $ | 5,142 |
| $ | 13,413 |
| $ | 10,290 |
|
|
|
|
|
|
|
|
| |||
Weighted-average diluted shares outstanding |
| 35,630.0 |
| 35,548.0 |
| 35,454.1 |
| |||
|
|
|
|
|
|
|
| |||
Diluted earnings per share |
| $ | 0.14 |
| $ | 0.38 |
| $ | 0.29 |
|
(1) Represents cash dividends paid to holders of unvested restricted stock, net of estimated forfeitures, plus undistributed earnings amounts available to holders of unvested restricted stock, if any.
Contact information:
Matt Wagner, Chief Executive Officer, (310) 728-1020
Vic Santoro, Executive Vice President and CFO, (310) 728-1021