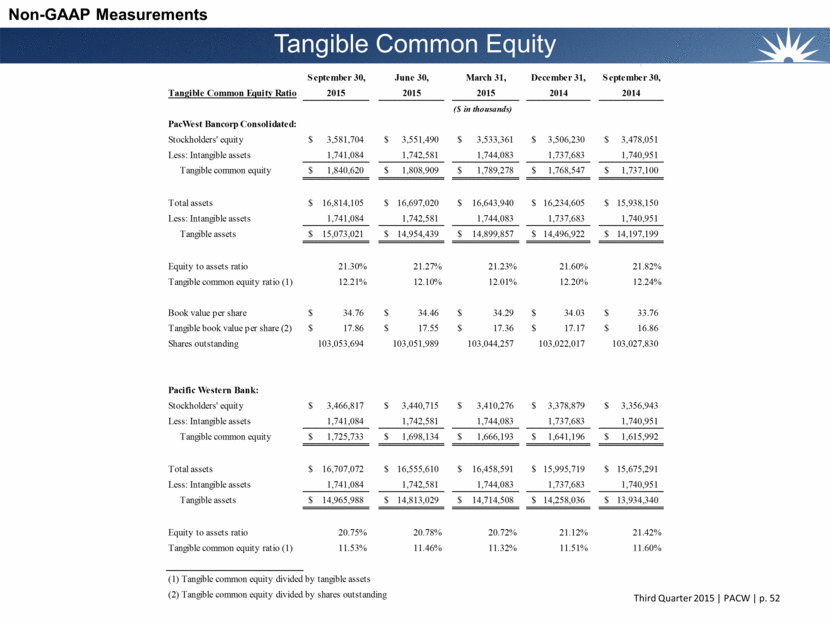
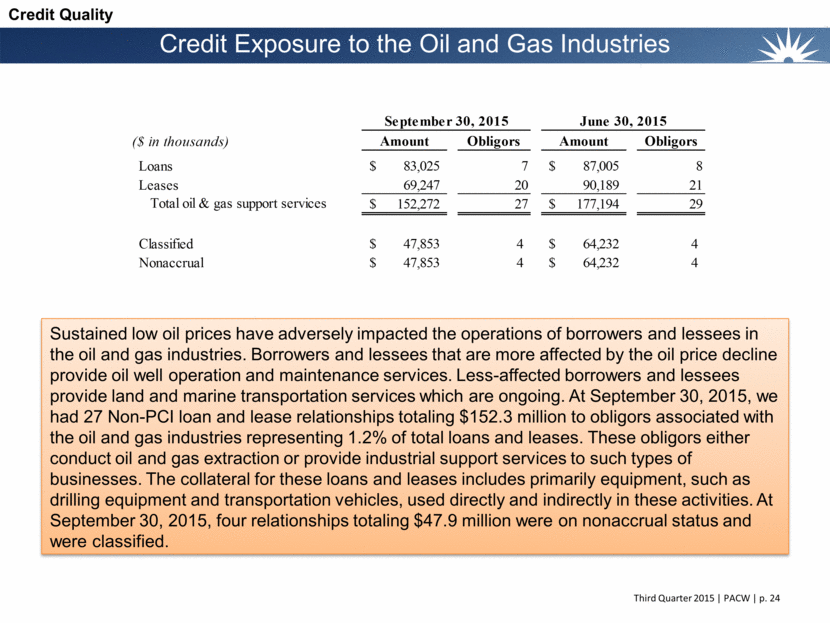
Tangible Common Equity Non-GAAP Measurements September 30, June 30, March 31, December 31, September 30, Tangible Common Equity Ratio 2015 2015 2015 2014 2014 PacWest Bancorp Consolidated: Stockholders' equity 3,581,704 $ 3,551,490 $ 3,533,361 $ 3,506,230 $ 3,478,051 $ Less: Intangible assets 1,741,084 1,742,581 1,744,083 1,737,683 1,740,951 Tangible common equity 1,840,620 $ 1,808,909 $ 1,789,278 $ 1,768,547 $ 1,737,100 $ Total assets 16,814,105 $ 16,697,020 $ 16,643,940 $ 16,234,605 $ 15,938,150 $ Less: Intangible assets 1,741,084 1,742,581 1,744,083 1,737,683 1,740,951 Tangible assets 15,073,021 $ 14,954,439 $ 14,899,857 $ 14,496,922 $ 14,197,199 $ Equity to assets ratio 21.30% 21.27% 21.23% 21.60% 21.82% Tangible common equity ratio (1) 12.21% 12.10% 12.01% 12.20% 12.24% Book value per share 34.76 $ 34.46 $ 34.29 $ 34.03 $ 33.76 $ Tangible book value per share (2) 17.86 $ 17.55 $ 17.36 $ 17.17 $ 16.86 $ Shares outstanding 103,053,694 103,051,989 103,044,257 103,022,017 103,027,830 Pacific Western Bank: Stockholders' equity 3,466,817 $ 3,440,715 $ 3,410,276 $ 3,378,879 $ 3,356,943 $ Less: Intangible assets 1,741,084 1,742,581 1,744,083 1,737,683 1,740,951 Tangible common equity 1,725,733 $ 1,698,134 $ 1,666,193 $ 1,641,196 $ 1,615,992 $ Total assets 16,707,072 $ 16,555,610 $ 16,458,591 $ 15,995,719 $ 15,675,291 $ Less: Intangible assets 1,741,084 1,742,581 1,744,083 1,737,683 1,740,951 Tangible assets 14,965,988 $ 14,813,029 $ 14,714,508 $ 14,258,036 $ 13,934,340 $ Equity to assets ratio 20.75% 20.78% 20.72% 21.12% 21.42% Tangible common equity ratio (1) 11.53% 11.46% 11.32% 11.51% 11.60% (1) Tangible common equity divided by tangible assets (2) Tangible common equity divided by shares outstanding ($ in thousands)