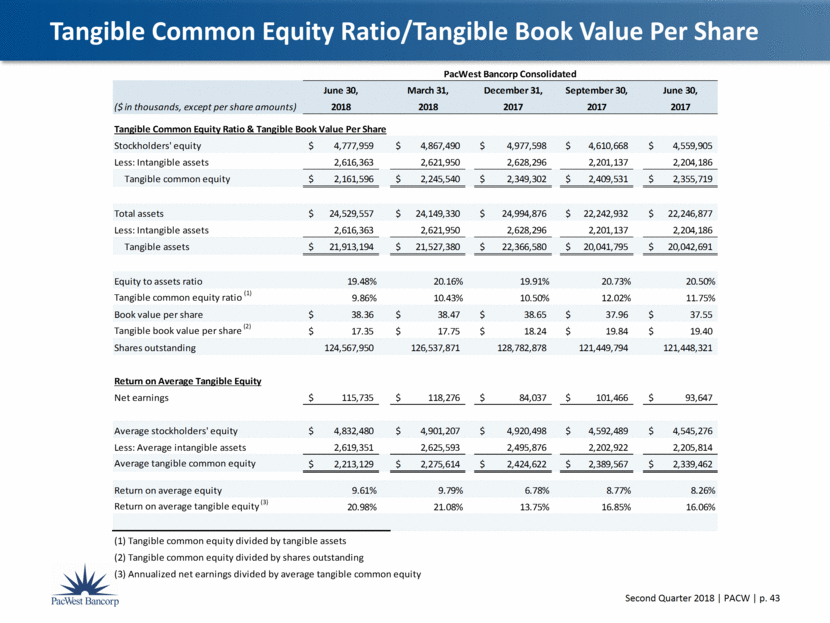
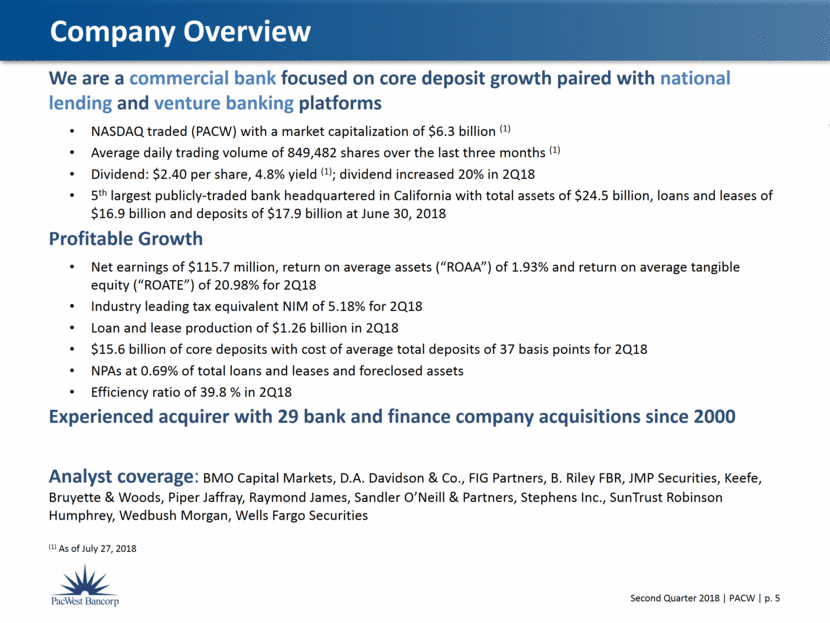
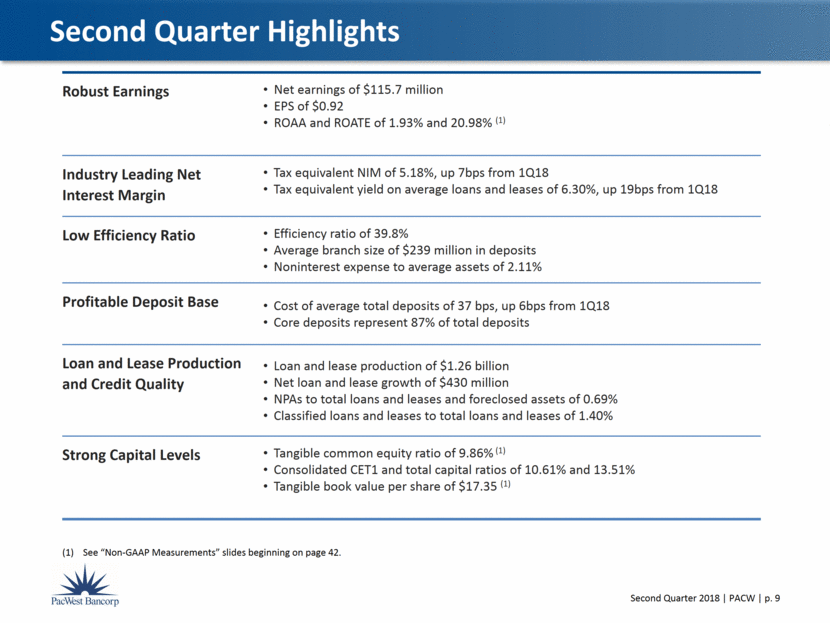
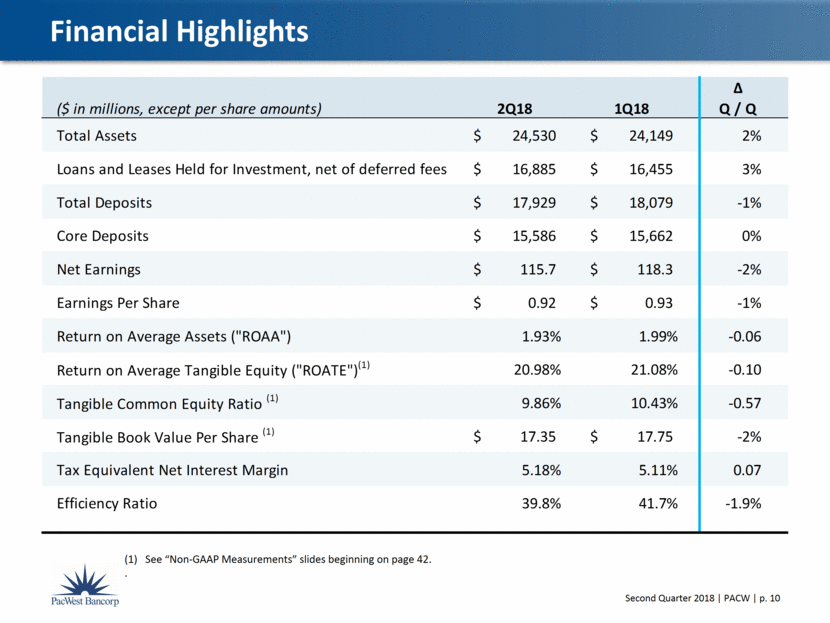
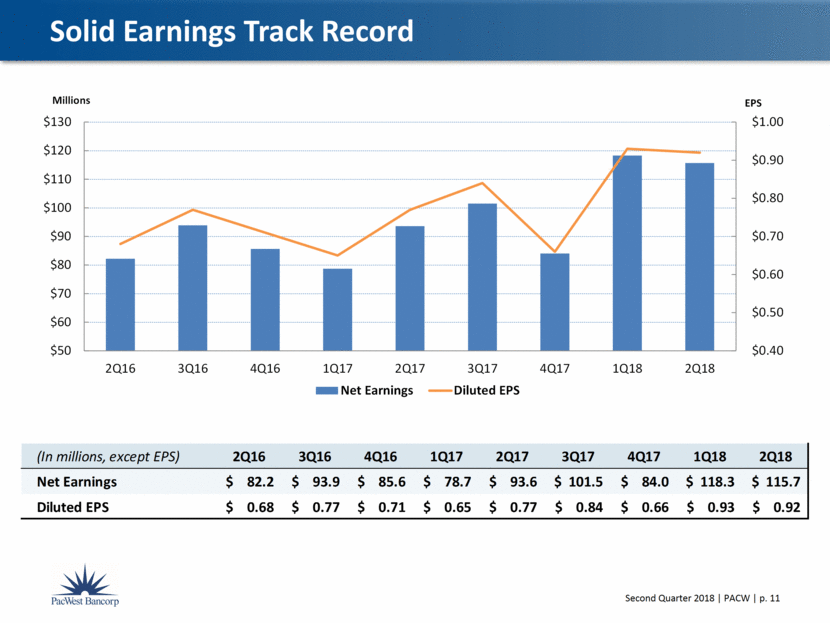
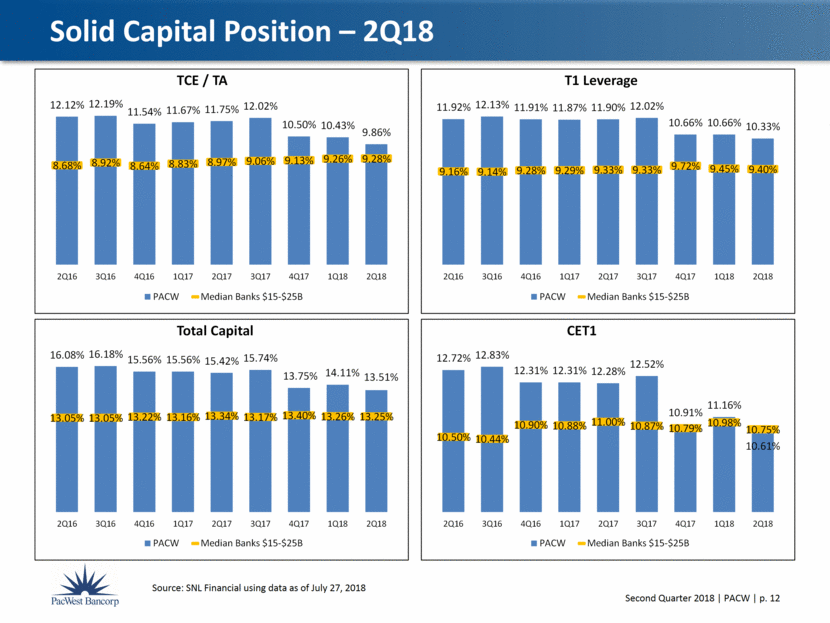
Tangible Common Equity Ratio/Tangible Book Value Per Share June 30, March 31, December 31, September 30, June 30, ($ in thousands, except per share amounts) 2018 2018 2017 2017 2017 Tangible Common Equity Ratio & Tangible Book Value Per Share Stockholders' equity 4,777,959 $ 4,867,490 $ 4,977,598 $ 4,610,668 $ 4,559,905 $ Less: Intangible assets 2,616,363 2,621,950 2,628,296 2,201,137 2,204,186 Tangible common equity 2,161,596 $ 2,245,540 $ 2,349,302 $ 2,409,531 $ 2,355,719 $ Total assets 24,529,557 $ 24,149,330 $ 24,994,876 $ 22,242,932 $ 22,246,877 $ Less: Intangible assets 2,616,363 2,621,950 2,628,296 2,201,137 2,204,186 Tangible assets 21,913,194 $ 21,527,380 $ 22,366,580 $ 20,041,795 $ 20,042,691 $ Equity to assets ratio 19.48% 20.16% 19.91% 20.73% 20.50% Tangible common equity ratio (1) 9.86% 10.43% 10.50% 12.02% 11.75% Book value per share 38.36 $ 38.47 $ 38.65 $ 37.96 $ 37.55 $ Tangible book value per share (2) 17.35 $ 17.75 $ 18.24 $ 19.84 $ 19.40 $ Shares outstanding 124,567,950 126,537,871 128,782,878 121,449,794 121,448,321 Return on Average Tangible Equity Net earnings 115,735 $ 118,276 $ 84,037 $ 101,466 $ 93,647 $ Average stockholders' equity 4,832,480 $ 4,901,207 $ 4,920,498 $ 4,592,489 $ 4,545,276 $ Less: Average intangible assets 2,619,351 2,625,593 2,495,876 2,202,922 2,205,814 Average tangible common equity 2,213,129 $ 2,275,614 $ 2,424,622 $ 2,389,567 $ 2,339,462 $ Return on average equity 9.61% 9.79% 6.78% 8.77% 8.26% Return on average tangible equity (3) 20.98% 21.08% 13.75% 16.85% 16.06% (1) Tangible common equity divided by tangible assets (2) Tangible common equity divided by shares outstanding (3) Annualized net earnings divided by average tangible common equity PacWest Bancorp Consolidated
