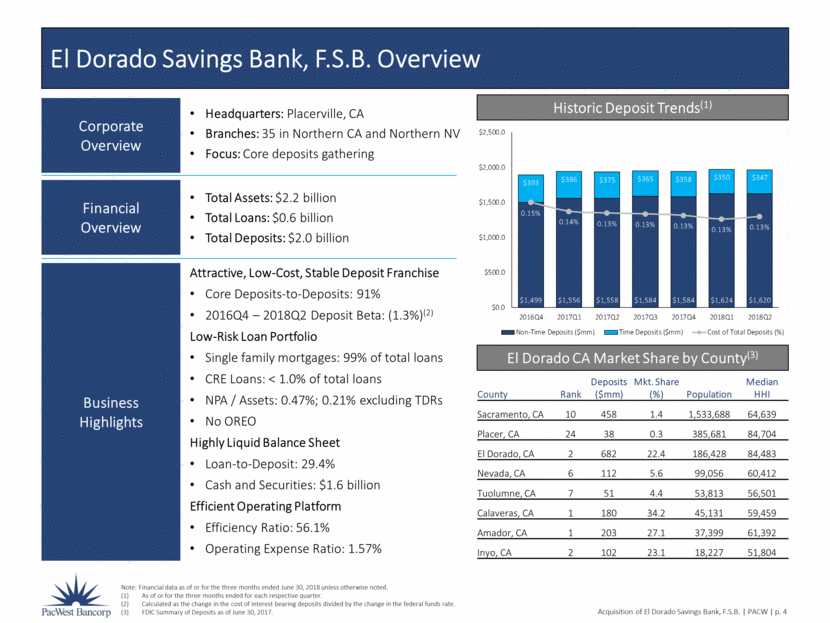
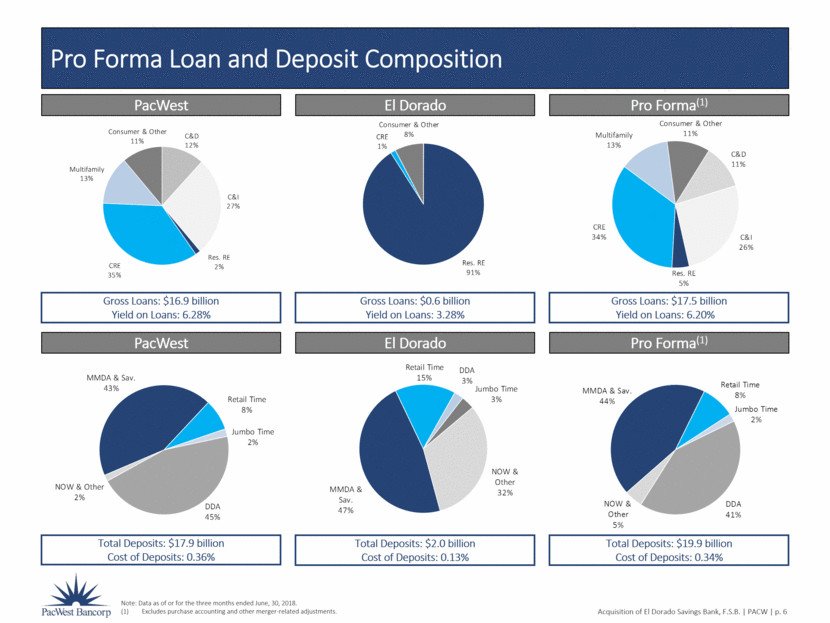
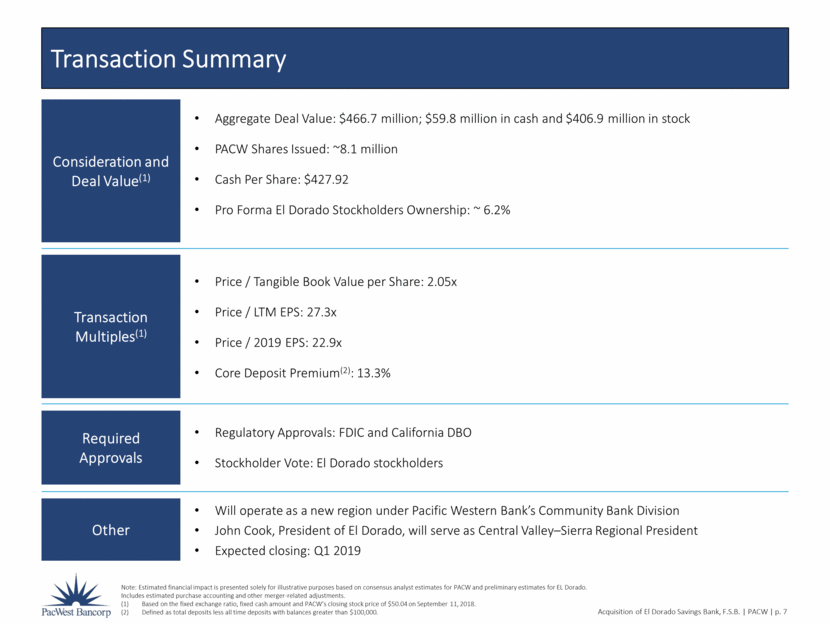
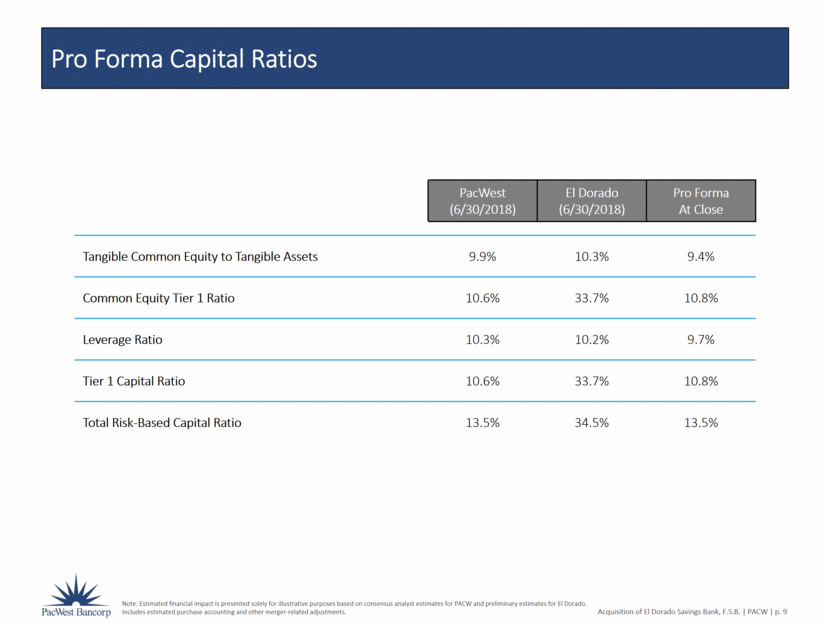
El Dorado Savings Bank, F.S.B. Overview Note: Financial data as of or for the three months ended June 30, 2018 unless otherwise noted. As of or for the three months ended for each respective quarter. Calculated as the change in the cost of interest bearing deposits divided by the change in the federal funds rate. FDIC Summary of Deposits as of June 30, 2017. Corporate Overview Headquarters: Placerville, CA Branches: 35 in Northern CA and Northern NV Focus: Core deposits gathering Financial Overview Total Assets: $2.2 billion Total Loans: $0.6 billion Total Deposits: $2.0 billion Business Highlights Attractive, Low-Cost, Stable Deposit Franchise Core Deposits-to-Deposits: 97% 2016Q4 – 2018Q2 Deposit Beta: (1.3%)(2) Low-Risk Loan Portfolio Single family mortgages: 99% of total loans CRE Loans: < 1.0% of total loans NPA / Assets: 0.47%; 0.21% excluding TDRs No OREO Highly Liquid Balance Sheet Loan-to-Deposit: 29.4% Cash and Securities: $1.6 billion Efficient Operating Platform Efficiency Ratio: 56.1% Operating Expense Ratio: 1.57% Historic Deposit Trends(1) El Dorado CA Market Share by County(3) County Rank Deposits ($mm) Mkt. Share (%) Population Median HHI Sacramento, CA 10 458 1.4 1,533,688 64,639 Placer, CA 24 38 0.3 385,681 84,704 El Dorado, CA 2 682 22.4 186,428 84,483 Nevada, CA 6 112 5.6 99,056 60,412 Tuolumne, CA 7 51 4.4 53,813 56,501 Calaveras, CA 1 180 34.2 45,131 59,459 Amador, CA 1 203 27.1 37,399 61,392 Inyo, CA 2 102 23.1 18,227 51,804 $1,499 $1,556 $1,558 $1,584 $1,584 $1,624 $1,620 $393 $386 $375 $365 $358 $350 $347 0.15% 0.14% 0.13% 0.13% 0.13% 0.13% 0.13% 0.00% 0.05% 0.10% 0.15% 0.20% 0.25% $0.0 $500.0 $1,000.0 $1,500.0 $2,000.0 $2,500.0 2016Q4 2017Q1 2017Q2 2017Q3 2017Q4 2018Q1 2018Q2 Non-Time Deposits ($mm) Time Deposits ($mm) Cost of Total Deposits (%)
