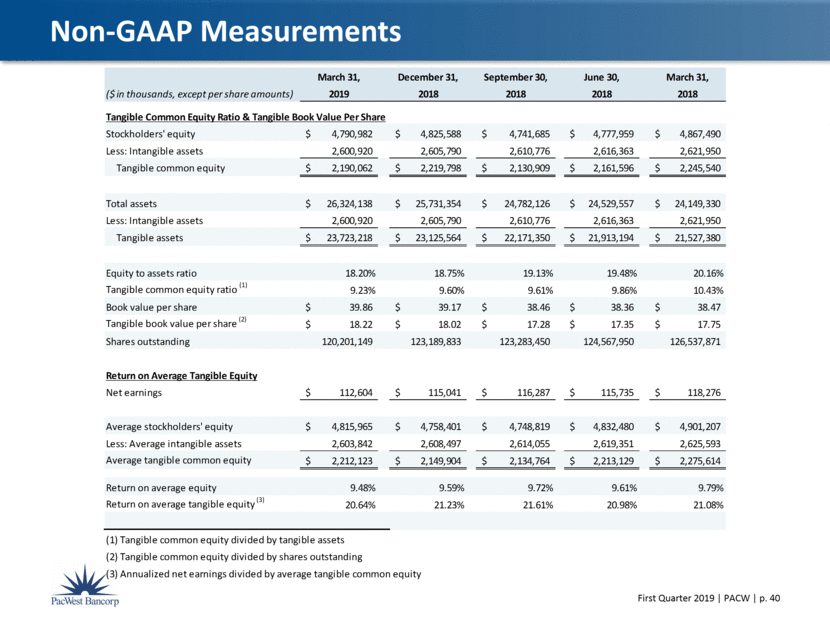
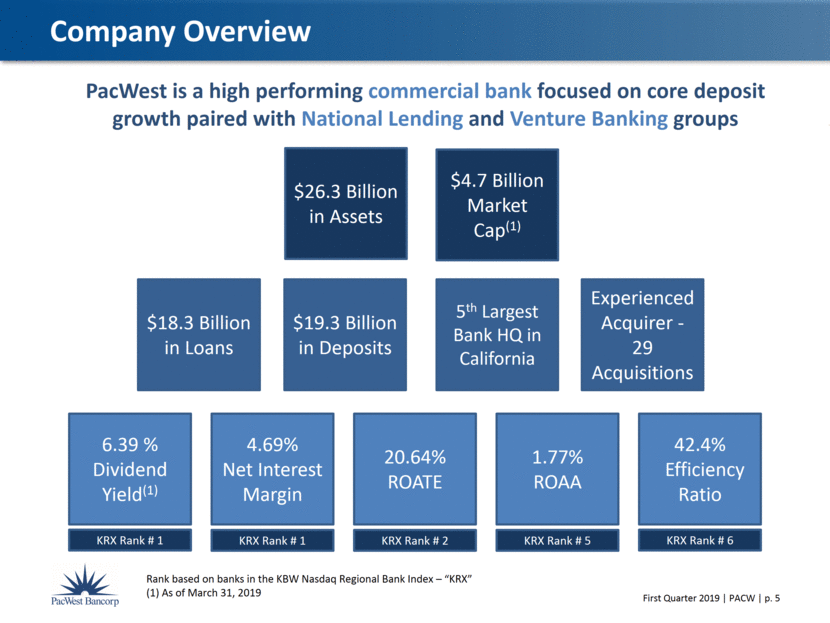
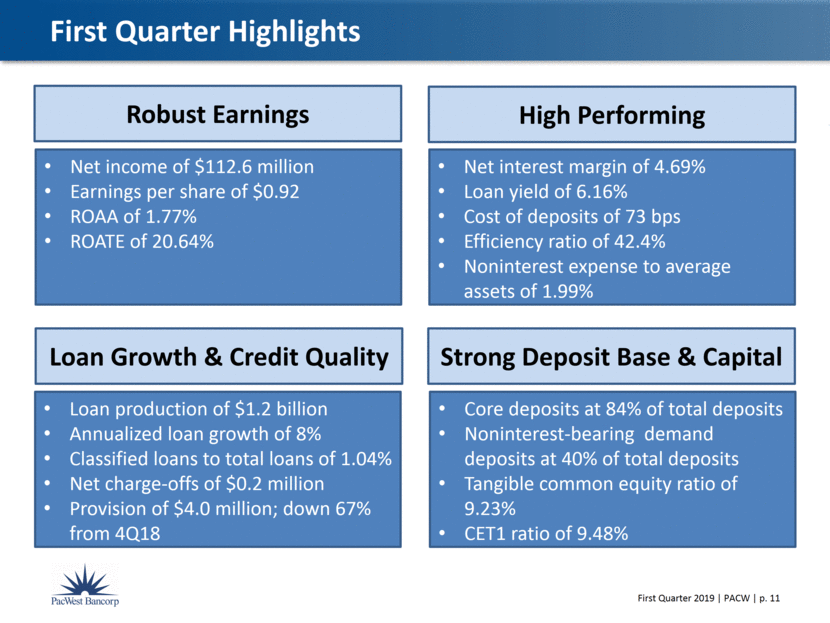
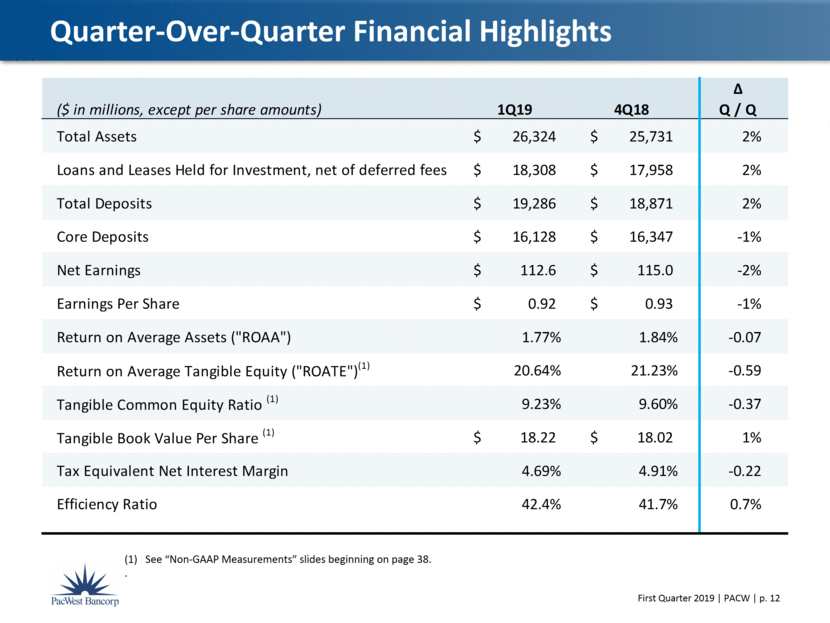
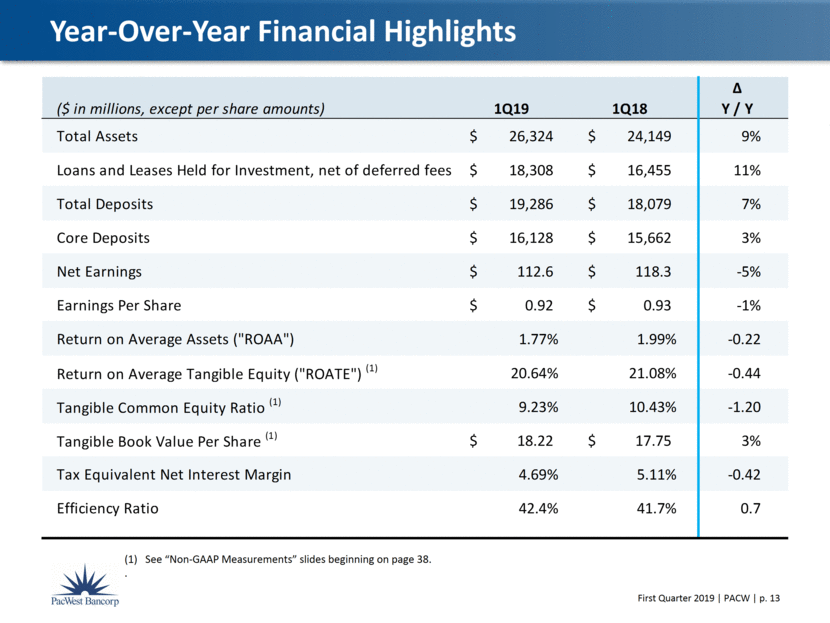
Non-GAAP Measurements March 31, December 31, September 30, June 30, March 31, ($ in thousands, except per share amounts) 2019 2018 2018 2018 2018 Tangible Common Equity Ratio & Tangible Book Value Per Share Stockholders' equity 4,790,982 $ 4,825,588 $ 4,741,685 $ 4,777,959 $ 4,867,490 $ Less: Intangible assets 2,600,920 2,605,790 2,610,776 2,616,363 2,621,950 Tangible common equity 2,190,062 $ 2,219,798 $ 2,130,909 $ 2,161,596 $ 2,245,540 $ Total assets 26,324,138 $ 25,731,354 $ 24,782,126 $ 24,529,557 $ 24,149,330 $ Less: Intangible assets 2,600,920 2,605,790 2,610,776 2,616,363 2,621,950 Tangible assets 23,723,218 $ 23,125,564 $ 22,171,350 $ 21,913,194 $ 21,527,380 $ Equity to assets ratio 18.20% 18.75% 19.13% 19.48% 20.16% Tangible common equity ratio (1) 9.23% 9.60% 9.61% 9.86% 10.43% Book value per share 39.86 $ 39.17 $ 38.46 $ 38.36 $ 38.47 $ Tangible book value per share (2) 18.22 $ 18.02 $ 17.28 $ 17.35 $ 17.75 $ Shares outstanding 120,201,149 123,189,833 123,283,450 124,567,950 126,537,871 Return on Average Tangible Equity Net earnings 112,604 $ 115,041 $ 116,287 $ 115,735 $ 118,276 $ Average stockholders' equity 4,815,965 $ 4,758,401 $ 4,748,819 $ 4,832,480 $ 4,901,207 $ Less: Average intangible assets 2,603,842 2,608,497 2,614,055 2,619,351 2,625,593 Average tangible common equity 2,212,123 $ 2,149,904 $ 2,134,764 $ 2,213,129 $ 2,275,614 $ Return on average equity 9.48% 9.59% 9.72% 9.61% 9.79% Return on average tangible equity (3) 20.64% 21.23% 21.61% 20.98% 21.08% (1) Tangible common equity divided by tangible assets (2) Tangible common equity divided by shares outstanding (3) Annualized net earnings divided by average tangible common equity
