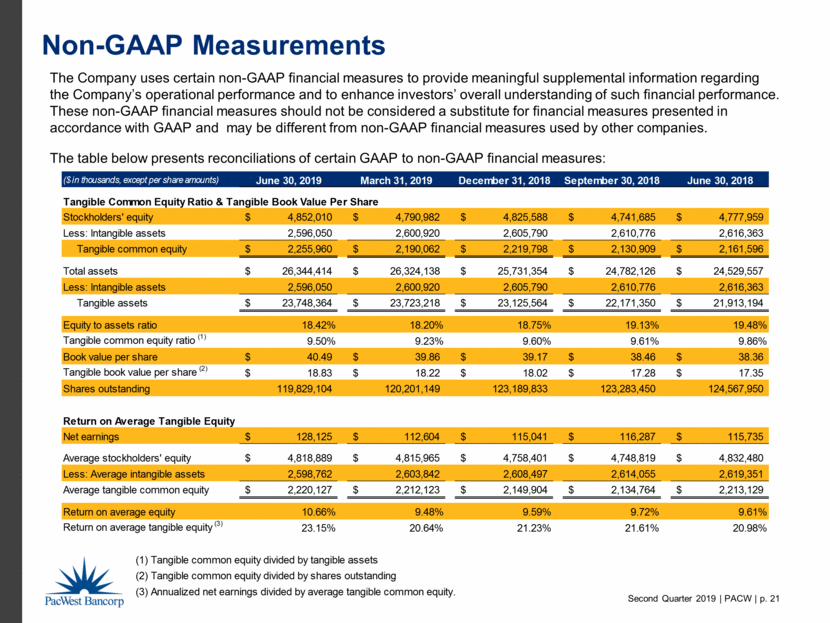
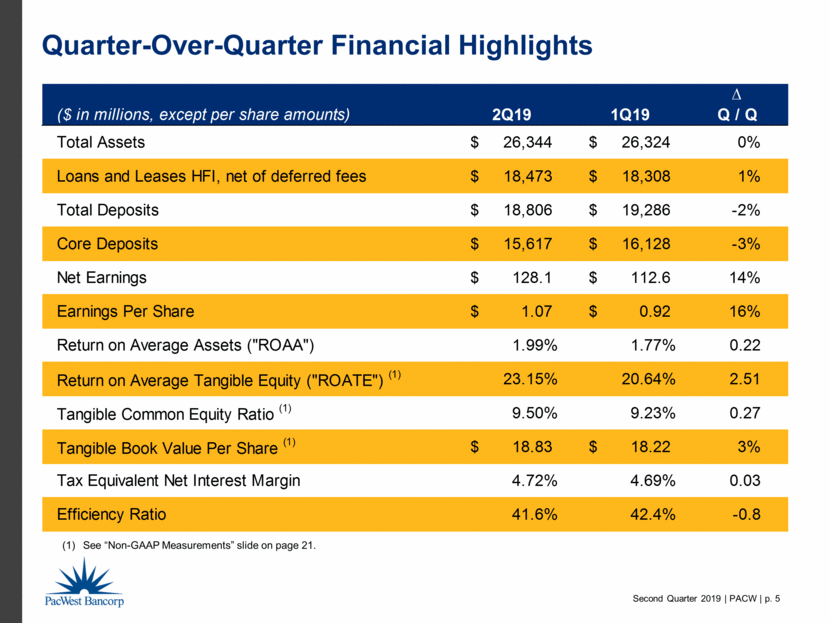
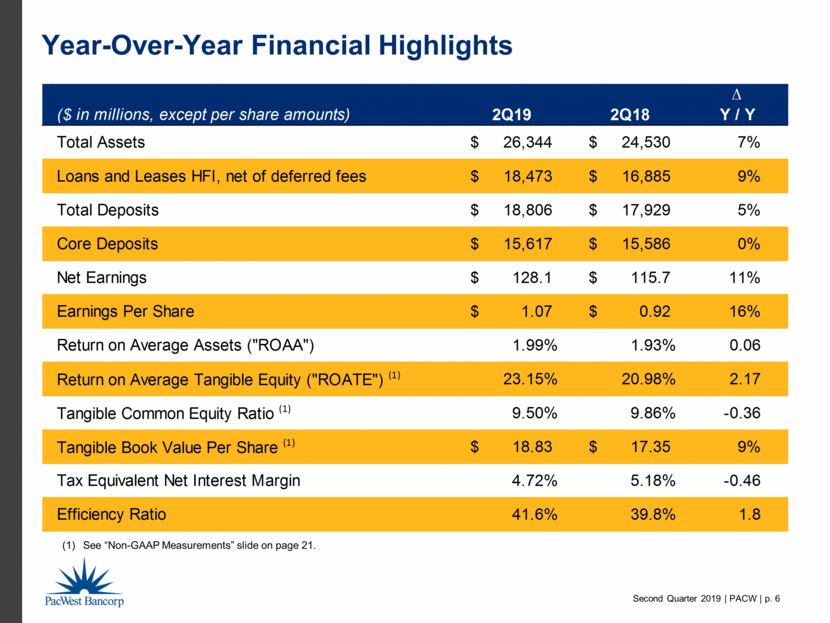
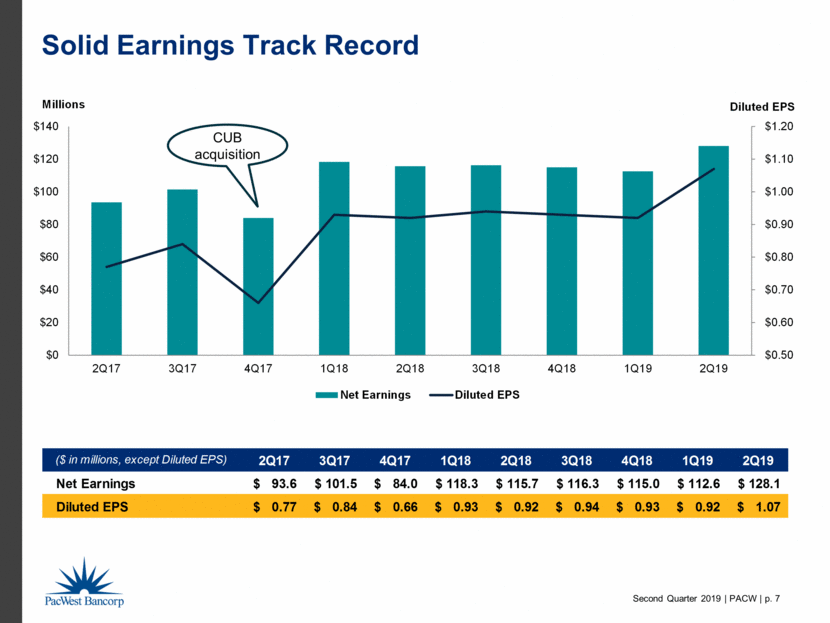
Non-GAAP Measurements The Company uses certain non-GAAP financial measures to provide meaningful supplemental information regarding the Company’s operational performance and to enhance investors’ overall understanding of such financial performance. These non-GAAP financial measures should not be considered a substitute for financial measures presented in accordance with GAAP and may be different from non-GAAP financial measures used by other companies. The table below presents reconciliations of certain GAAP to non-GAAP financial measures: ($ in thousands, except per share amounts) June 30, 2019 March 31, 2019 December 31, 2018 September 30, 2018 June 30, 2018 Tangible Common Equity Ratio & Tangible Book Value Per Share Stockholders' equity 4,852,010 $ 4,790,982 $ 4,825,588 $ 4,741,685 $ 4,777,959 $ Less: Intangible assets 2,596,050 2,600,920 2,605,790 2,610,776 2,616,363 Tangible common equity 2,255,960 $ 2,190,062 $ 2,219,798 $ 2,130,909 $ 2,161,596 $ Total assets 26,344,414 $ 26,324,138 $ 25,731,354 $ 24,782,126 $ 24,529,557 $ Less: Intangible assets 2,596,050 2,600,920 2,605,790 2,610,776 2,616,363 Tangible assets 23,748,364 $ 23,723,218 $ 23,125,564 $ 22,171,350 $ 21,913,194 $ Equity to assets ratio 18.42% 18.20% 18.75% 19.13% 19.48% Tangible common equity ratio (1) 9.50% 9.23% 9.60% 9.61% 9.86% Book value per share 40.49 $ 39.86 $ 39.17 $ 38.46 $ 38.36 $ Tangible book value per share (2) 18.83 $ 18.22 $ 18.02 $ 17.28 $ 17.35 $ Shares outstanding 119,829,104 120,201,149 123,189,833 123,283,450 124,567,950 Return on Average Tangible Equity Net earnings 128,125 $ 112,604 $ 115,041 $ 116,287 $ 115,735 $ Average stockholders' equity 4,818,889 $ 4,815,965 $ 4,758,401 $ 4,748,819 $ 4,832,480 $ Less: Average intangible assets 2,598,762 2,603,842 2,608,497 2,614,055 2,619,351 Average tangible common equity 2,220,127 $ 2,212,123 $ 2,149,904 $ 2,134,764 $ 2,213,129 $ Return on average equity 10.66% 9.48% 9.59% 9.72% 9.61% Return on average tangible equity (3) 23.15% 20.64% 21.23% 21.61% 20.98% (1) Tangible common equity divided by tangible assets (2) Tangible common equity divided by shares outstanding (3) Annualized net earnings divided by average tangible common equity.