EXHIBIT 99.1
SunTrust Robinson Humphrey’s
Sunbelt Community Bank Conference
September 2005
1
Forward Looking Statement
This presentation contains forward-looking statements, as defined by Federal Securities Laws, relating to present or future trends or factors affecting the operations, markets and products of CenterState Banks of Florida, Inc. (CSFL). These statements are provided to assist in the understanding of future financial performance. Any such statements are based on current expectations and involve a number of risks and uncertainties. For a discussion of factors that may cause such forward-looking statements to differ materially from actual results, please refer to CSFL’s most recent Form 10-Q filed with the Securities Exchange Commission.
CSFL undertakes no obligation to release revisions to these forward-looking statements or reflect events or circumstances after the date of this presentation.
2
Franchise Overview
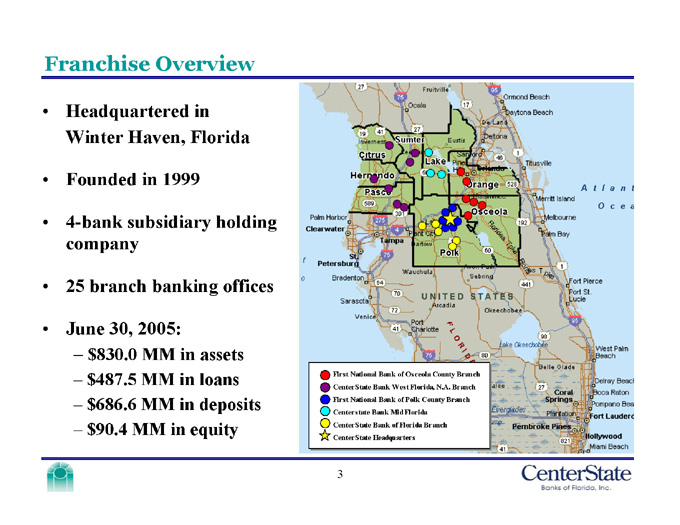
Headquartered in
Winter Haven, Florida
Founded in 1999
4-bank subsidiary holding company
25 branch banking offices
June 30, 2005:
$830.0 MM in assets
$487.5 MM in loans
$686.6 MM in deposits
$90.4 MM in equity
First National Bank of Osceola County Branch
CenterState Bank West Florida, N.A. Branch
First National Bank of Polk County Branch
Centerstate Bank Mid Florida
CenterState Bank of Florida Branch
CenterState Headquarters
3
Recent Developments
2nd Qtr ’05
Capital raise of $35 million of common equity
3rd Qtr ’05
Pending acquisition of CenterState Bank Mid Florida announced August 30, 2005
1st Qtr ’06
Combination of two subsidiary banks
CenterState Bank of Florida
First National Bank of Polk County
4
Business Strategy
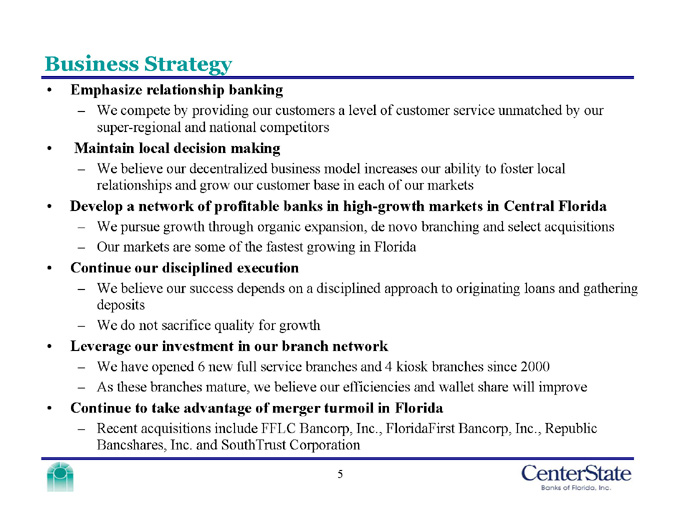
Emphasize relationship banking
We compete by providing our customers a level of customer service unmatched by our super-regional and national competitors
Maintain local decision making
We believe our decentralized business model increases our ability to foster local relationships and grow our customer base in each of our markets
Develop a network of profitable banks in high-growth markets in Central Florida
We pursue growth through organic expansion, de novo branching and select acquisitions
Our markets are some of the fastest growing in Florida
Continue our disciplined execution
We believe our success depends on a disciplined approach to originating loans and gathering deposits
We do not sacrifice quality for growth
Leverage our investment in our branch network
We have opened 6 new full service branches and 4 kiosk branches since 2000
As these branches mature, we believe our efficiencies and wallet share will improve
Continue to take advantage of merger turmoil in Florida
Recent acquisitions include FFLC Bancorp, Inc., FloridaFirst Bancorp, Inc., Republic Bancshares, Inc. and SouthTrust Corporation
5
Investment Thesis
Local decision making and accountability
Experienced management team
Attractive market demographics
Strong balance sheet growth
Excellent credit quality
Improving efficiencies
6
Local Decision Making and Accountability
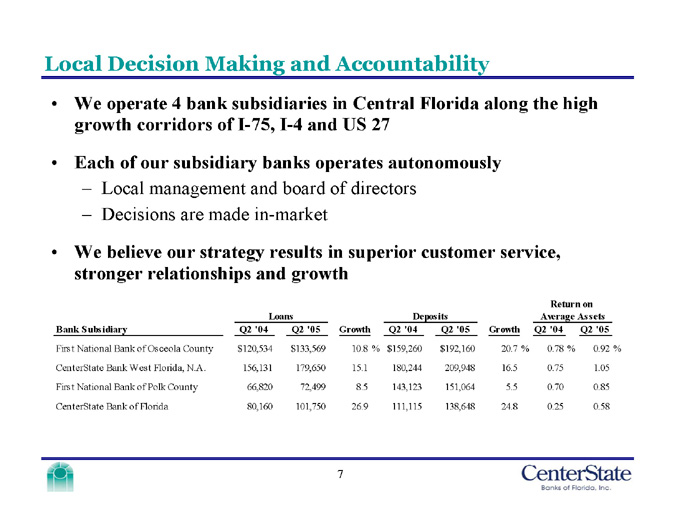
We operate 4 bank subsidiaries in Central Florida along the high growth corridors of I-75, I-4 and US 27
Each of our subsidiary banks operates autonomously
Local management and board of directors
Decisions are made in-market
We believe our strategy results in superior customer service, stronger relationships and growth
Bank Subsidiary First National Bank of Osceola County CenterState Bank West Florida, N.A. First National Bank of Polk County CenterState Bank of Florida
Loans
Q2 '04 $120,534 156,131 66,820 80,160
Q2 '05 $133,569 179,650 72,499 101,750
Growth 10.8 % 15.1 8.5 26.9
Deposits
Q2 '04 $159,260 180,244 143,123 111,115
Q2 '05 $192,160 209,948 151,064 138,648
Growth 20.7 % 16.5 5.5 24.8
Return on Average Assets
Q2 '04 0.78 % 0.75 0.70 0.25
Q2 '05 0.92 % 1.05 0.85 0.58
7
Experienced Management Team
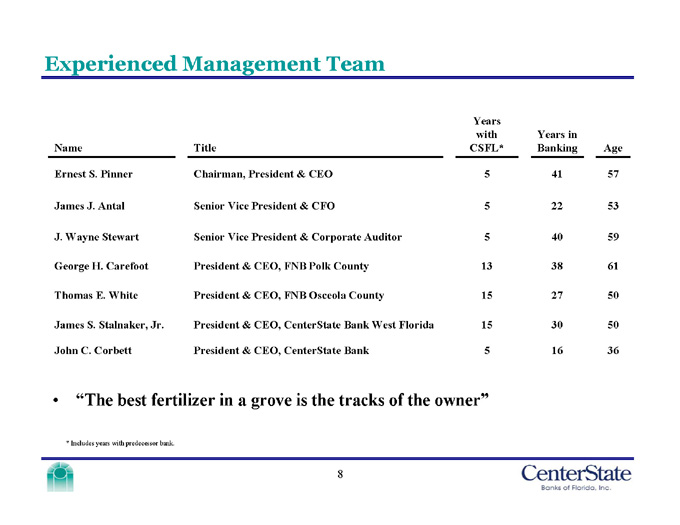
Name Ernest S. Pinner James J. Antal J. Wayne Stewart George H. Carefoot Thomas E. White James S. Stalnaker, Jr. John C. Corbett
Title Chairman, President & CEO Senior Vice President & CFO Senior Vice President & Corporate Auditor President & CEO, FNB Polk County President & CEO, FNB Osceola County President & CEO, CenterState Bank West Florida President & CEO, CenterState Bank
Years with CSFL* 5 5 5 13 15 15 5
Years in Banking 41 22 40 38 27 30 16
Age 57 53 59 61 50 50 36
“The best fertilizer in a grove is the tracks of the owner”
* Includes years with predecessor bank.
8
Attractive Market Demographics
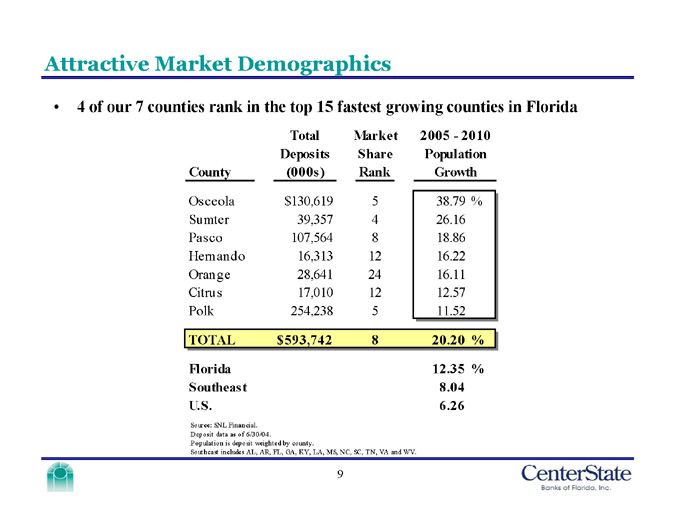
4 of our 7 counties rank in the top 15 fastest growing counties in Florida
County Osceola Sumter Pasco Hernando Orange Citrus Polk TOTAL
Total Deposits (000s) $130,619 39,357 107,564 16,313 28,641 17,010 254,238 $593,742
Market Share Rank 5 4 8 12 24 12 5 8
2005 - 2010 Population Growth 38.79% 26.16 18.86 16.22 16.11 12.57 11.52 20.20%
Florida 12.35%
Southeast 8.04
U.S. 6.26
Source: SNL Financial.
Deposit data as of 6/30/04.
Population is deposit weighted by county.
Southeast includes AL, AR, FL, GA, KY, LA, MS, NC, SC, TN, VA and WV.
9
Growth Opportunities
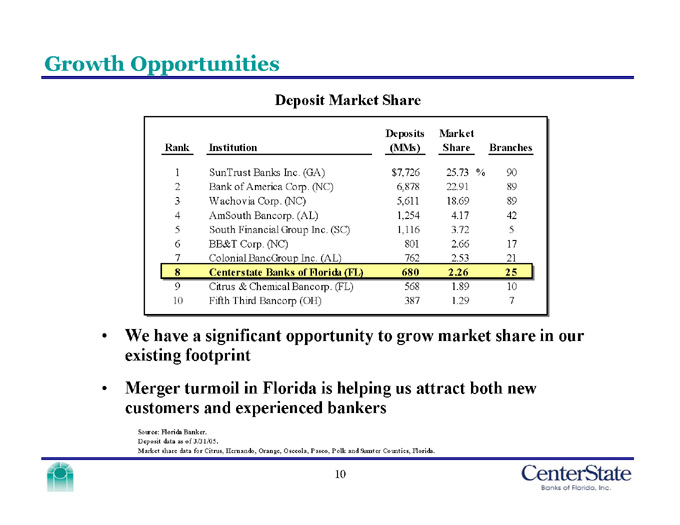
Deposit Market Share
Rank 1 2 3 4 5 6 7 8 9 10
Institution SunTrust Banks Inc. (GA) Bank of America Corp. (NC) Wachovia Corp. (NC) AmSouth Bancorp. (AL) South Financial Group Inc. (SC) BB&T Corp. (NC) Colonial BancGroup Inc. (AL) Centerstate Banks of Florida (FL) Citrus & Chemical Bancorp. (FL) Fifth Third Bancorp (OH)
Deposits (MMs) $7,726 6,878 5,611 1,254 1,116 801 762 680 568 387
Market Share 25.73% 22.91 18.69 4.17 3.72 2.66 2.53 2.26 1.89 1.29
Branches 90 89 89 42 5 17 21 25 10 7
We have a significant opportunity to grow market share in our existing footprint
Merger turmoil in Florida is helping us attract both new customers and experienced bankers
Source: Florida Banker.
Deposit data as of 3/31/05.
Market share data for Citrus, Hernando, Orange, Osceola, Pasco, Polk and Sumter Counties, Florida.
10

Strong Balance Sheet Growth
Total Loans ($ Millions)
Total Deposits ($ Millions)
600 450 300 150 0
2000 2001 2002 2003 2004 YTD
210 244 334 414 441 487
840 630 420 210 0
2000 2001 2002 2003 2004 YTD
280 308 441 538 660 687
Organic Acquisition
Organic Acquisition
Organic CAGR: 21% Peer CAGR: 12%
Organic CAGR: 17% Peer CAGR: 12%
Compounded annual growth rate from 2000 – 2004.
Peer group includes BBX, BKUNA, CCBG, CLBK, FFFL, HARB, SBCF and TIBB.
YTD as of 6/30/05.
11
Loan Portfolio
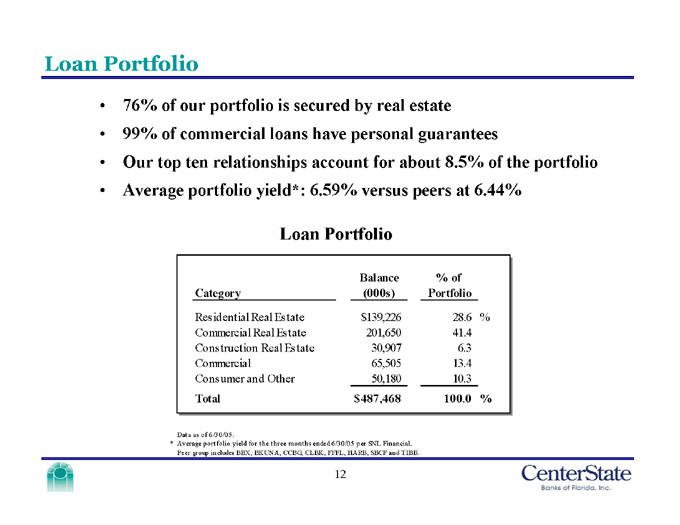
76% of our portfolio is secured by real estate
99% of commercial loans have personal guarantees
Our top ten relationships account for about 8.5% of the portfolio
Average portfolio yield*: 6.59% versus peers at 6.44%
Loan Portfolio
Balance (000s) $139,226 201,650 30,907 65,505 50,180 $487,468
% of Portfolio 28.6 % 41.4 6.3 13.4 10.3 100.0 %
Category Residential Real Estate Commercial Real Estate Construction Real Estate Commercial Consumer and Other Total
Data as of 6/30/05.
*Average portfolio yield for the three months ended 6/30/05 per SNL Financial.
Peer group includes BBX, BKUNA, CCBG, CLBK, FFFL, HARB, SBCF and TIBB.
12
Deposit Composition
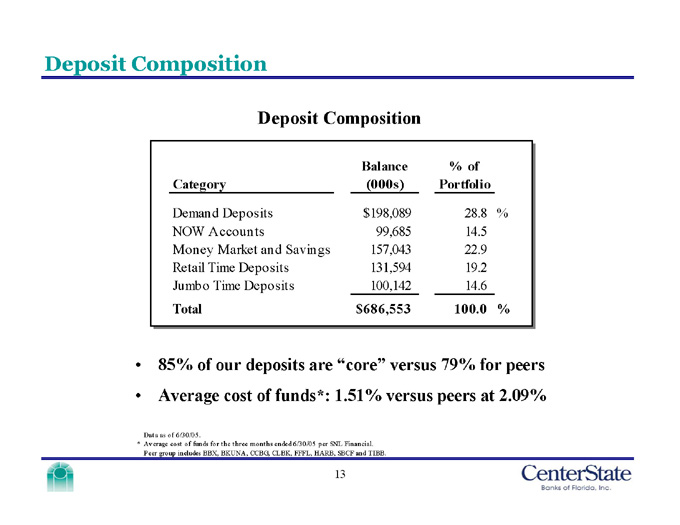
Deposit Composition
Balance (000s) $198,089 99,685 157,043 131,594 100,142 $686,553
% of Portfolio 28.8 % 14.5 22.9 19.2 14.6 100.0 %
Category Demand Deposits NOW Accounts Money Market and Savings Retail Time Deposits Jumbo Time Deposits Total
85% of our deposits are “core” versus 79% for peers
Average cost of funds*: 1.51% versus peers at 2.09%
Data as of 6/30/05.
*Average cost of funds for the three months ended 6/30/05 per SNL Financial.
Peer group includes BBX, BKUNA, CCBG, CLBK, FFFL, HARB, SBCF and TIBB.
13
Excellent Credit Quality
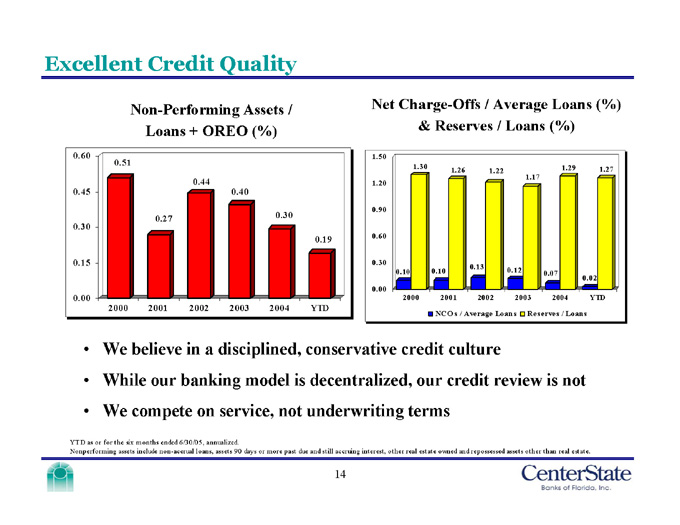
Non-Performing Assets /
Loans + OREO (%)
Net Charge-Offs / Average Loans (%)
& Reserves / Loans (%)
0.60 0.45 0.30 0.15 0.00
2000 2001 2002 2003 2004 YTD
0.51 0.27 0.44 0.40 0.30 0.19
1.50 1.20 0.90 0.60 0.30 0.00
2000 2001 2002 2003 2004 YTD
1.30 1.26 1.22 1.17 1.29 1.27
0.10 0.10 0.13 0.12 0.07 0.02
Reserves / Loans NCOs / Average Loans
We believe in a disciplined, conservative credit culture
While our banking model is decentralized, our credit review is not
We compete on service, not underwriting terms
YTD as or for the six months ended 6/30/05, annualized.
Nonperforming assets include non-accrual loans, assets 90 days or more past due and still accruing interest, other real estate owned and repossessed assets other than real estate.
14
Capital Ratios 2004 2003 2002 2001 2000 6/30/05
CAPITAL RATIOS:
Equity / Assets 10.90% 7.65% 6.89% 8.07% 8.12% 8.15%
Tangible Equity / Assets 8.15 8.12 7.12 6.07 7.01 10.34
Leverage 8.21 7.89 8.54 7.84 8.60 11.00
Tier 1 Capital 12.56 11.51 9.95 11.30 13.40 16.20
Total Capital 13.81 12.76 11.16 12.48 14.61 17.40
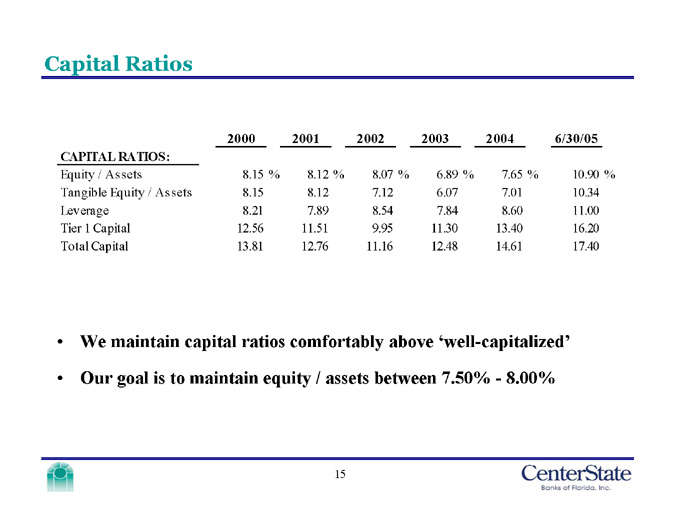
We maintain capital ratios comfortably above ‘well-capitalized’
Our goal is to maintain equity / assets between 7.50% - 8.00%
15
Financial Performance
Net Income ($ Millions) Earnings Per Share ($)
5.00 4.00 3.00 2.00 1.00 0.00
1.91 2.52 2.37 2.63 4.37 3.22 2.69
2000 2001 2002 2003 2004 YTD
1.50 1.20 0.90 0.60 0.30 0.00
0.67 0.89 0.82 0.77 1.14 0.84 0.63
2000 2001 2002 2003 2004 YTD Earnings per Share Gain on Sale of Branches
Common Shares Outstanding (000s) 2,816 2,819 3,362 3,369 4,069 5,097
Net Income Gain on Sale of Branches June 30, 2005:
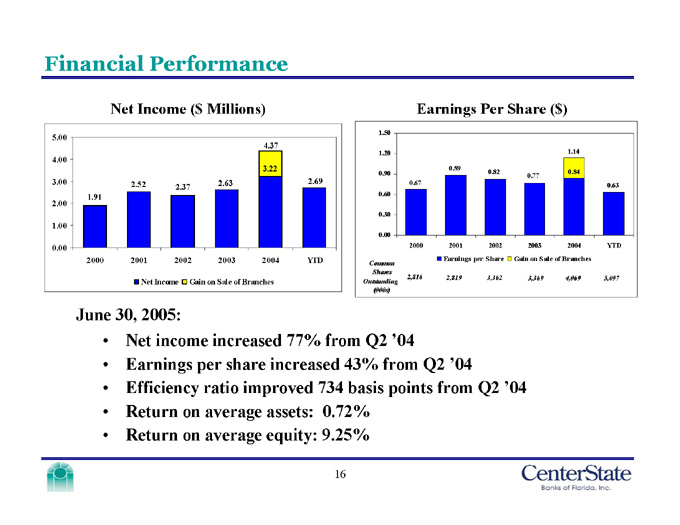
Net income increased 77% from Q2 ’04
Earnings per share increased 43% from Q2 ’04
Efficiency ratio improved 734 basis points from Q2 ’04
Return on average assets: 0.72% Return on average equity: 9.25%
16
Financial Performance
Net Interest Margin (%)
Loans to Deposits (%)
5.50 4.40 3.30 2.20 1.10 0.00
4.68 4.51 4.12 3.63 3.43 3.67
2000 2001 2002 2003 2004
YTD
110 100 99 80 70 60 50
75 90 79 96 76 97 77 94 67 96 71 93
2000 2001 2002 2003 2004
YTD CSFL Peers
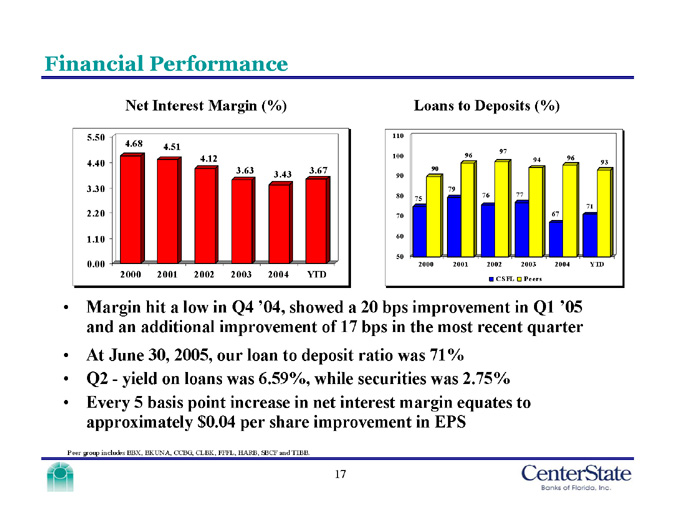
Margin hit a low in Q4 ’04, showed a 20 bps improvement in Q1 ’05 and an additional improvement of 17 bps in the most recent quarter
At June 30, 2005, our loan to deposit ratio was 71%
Q2 - yield on loans was 6.59%, while securities was 2.75%
Every 5 basis point increase in net interest margin equates to approximately $0.04 per share improvement in EPS
Peer group includes BBX, BKUNA, CCBG, CLBK, FFFL, HARB, SBCF and TIBB.
17
Improving Efficiencies
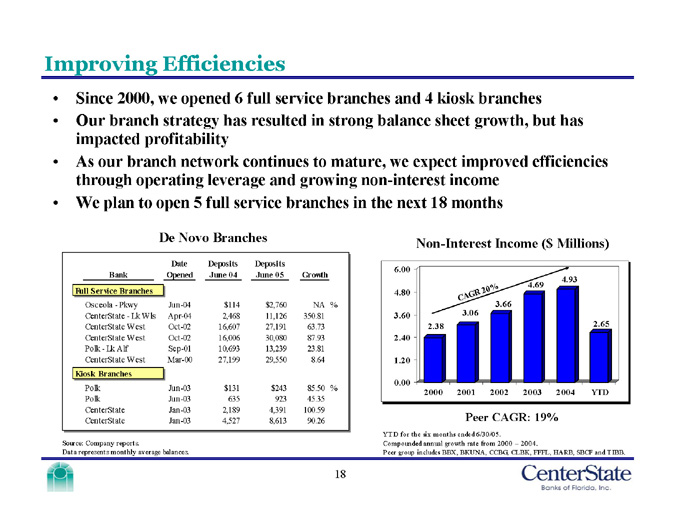
Since 2000, we opened 6 full service branches and 4 kiosk branches
Our branch strategy has resulted in strong balance sheet growth, but has impacted profitability
As our branch network continues to mature, we expect improved efficiencies through operating leverage and growing non-interest income
We plan to open 5 full service branches in the next 18 months
De Novo Branches Non-Interest Income ($ Millions) Bank Date Opened
Deposits June 04 Deposits June 05 Growth
Full Service Branches NA% $2,760 $114 Jun-04
Osceola - Pkwy 350.81 11,126 2,468 Apr-04
CenterState - Lk Wls 63.73 27,191 16,607 Oct-02
CenterState West 87.93 30,080 16,006 Oct-02
CenterState West 23.81 13,239 10,693 Sep-01
Polk - Lk Alf 8.64 29,550 27,199 Mar-00
CenterState West
Kiosk Branches 85.50% $243 $131 Jun-03
Polk 45.35 923 635 Jun-03
Polk 100.59 4,391 2,189 Jan-03
CenterState 90.26 8,613 4,527 Jan-03
CenterState 6.00 4.80 3.60 2.40 1.20 0.00
CAGR 20% 2.38 3.06 3.66 4.69 4.93 2.65
2004 2003 2002 2001 2000 YTD Peer CAGR: 19%
YTD for the six months ended 6/30/05. Source: Company reports.
Compounded annual growth rate from 2000 – 2004.
Peer group includes BBX, BKUNA, CCBG, CLBK, FFFL, HARB, SBCF and TIBB.
Data represents monthly average balances.
18
Improving Efficiencies
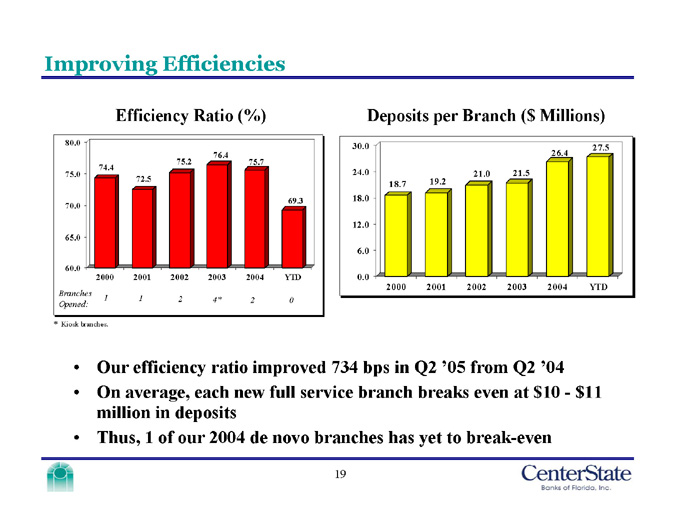
Efficiency Ratio (%)
Deposits per Branch ($ Millions)
80.0 75.0 70.0 65.0 60.0 74.4 72.5 75.2 76.4 75.7 69.3
2000 2001 2002 2003 2004
YTD
30.0 24.0 18.0 12.0 6.0 0.0
18.7
19.2
21.0
21.5
26.4
27.5
2000 2001 2002 2003 2004
YTD
Branches Opened:
1 1 2 4* 2 0
* Kiosk branches.
Our efficiency ratio improved 734 bps in Q2 ’05 from Q2 ’04
On average, each new full service branch breaks even at $10 - $11 million in deposits
Thus, 1 of our 2004 de novo branches has yet to break-even
19
CSFL – Building Shareholder Value
Our shareholder value is built upon the quality of our employees, the quality of our assets and liabilities and the growth markets in which we operate
Our long-term vision is to be a multi-billion dollar Central Florida bank known as the preeminent community bank in our markets
We remain focused on disciplined credit underwriting and execution of our corporate strategy
20
SunTrust Robinson Humphrey’s
Sunbelt Community Bank Conference
September 2005
21


