SECURITIES AND EXCHANGE COMMISSION
Washington, D.C. 20549
FORM 10-K
| x | ANNUAL REPORT PURSUANT TO SECTION 13 or 15(d) OF THE SECURITIES EXCHANGE ACT OF 1934 |
For the Fiscal Year Ended December 31, 2006
OR
| ¨ | TRANSITION REPORT PURSUANT TO SECTION 13 OR 15(d) OF THE SECURITIES EXCHANGE ACT OF 1934 |
Commission File Number 333-95087
CENTERSTATE BANKS OF FLORIDA, INC.
(Name of registrant as specified in its charter)
| | |
| Florida | | 59-3606741 |
(State or other jurisdiction of incorporation or organization) | | (I.R.S. Employer Identification No.) |
| | |
| 1101 First Street South, Suite 202, Winter Haven, Florida | | 33880 |
| (Address of principal executive offices) | | (Zip Code) |
Issuer’s telephone number, including area code: (863) 293-2600
Securities registered pursuant to Section 12(b) of the Act: Common Stock, par value $0.01 per share
Securities registered pursuant to Section 12(g) of the Act: None
The registrant is a well-known seasoned issuer, as defined in Rule 405 of the Securities Act. YES ¨ NO x
The registrant is not required to file reports pursuant to Section 13 or Section 15(d) of the Act. YES ¨ NO x
Check whether the issuer has (1) filed all reports required to be filed by Section 13 or 15(d) of the Securities Exchange Act of 1934 during the past 12 months (or for such shorter period that the issuer was required to file such reports), and (2) has been subject to such filing requirements for the past 90 days. YES x NO ¨
Check if there is no disclosure of delinquent filers in response to Item 405 of Regulation SK contained in this form, and no disclosure will be contained, to the best of issuer’s knowledge, in definitive proxy or information statements incorporated by reference in Part III of this Form 10-K or any amendment to this Form 10-K. ¨
Indicate by check mark if:
The issuer is a large accelerated filer, an accelerated filer, or a non-accelerated filer as defined in Rule 12b-2 of the Act.
Large accelerated filer ¨ Accelerated filer x Non-accelerated filer ¨
The registrant is a shell company, as defined in Rule 12b-2 of the Exchange Act. YES ¨ NO x
The aggregate market value of the Common Stock of the issuer held by non-affiliates of the issuer (7,821,226 shares) on June 30, 2006, was approximately $160,335,000. The aggregate market value was computed by reference the last sale of the Common Stock of the issuer at $20.50 per share on June 30, 2006. For the purposes of this response, directors, executive officers and holders of 5% or more of the issuer’s Common Stock are considered the affiliates of the issuer at that date.
As of March 8, 2007 there were outstanding 11,153,562 shares of the issuer’s Common Stock.
DOCUMENTS INCORPORATED BY REFERENCE
Portions of the Proxy Statement for the Annual Meeting of Shareholders to be held on April 24, 2007 to be filed with the Securities and Exchange Commission pursuant to Regulation 14A within 120 days of the issuer’s fiscal year end are incorporated by reference into Part II and Part III, of this Annual Report on Form 10-K.
TABLE OF CONTENTS
2
3
PART I
General
CenterState Banks of Florida, Inc. (“We,” “CenterState” or the “Company”) was incorporated under the laws of the State of Florida on September 20, 1999. CenterState is a registered bank holding company under the Bank Holding Company Act of 1956, as amended (the “BHC Act”) and owns all the outstanding shares of CenterState Bank Central Florida (“Central”), CenterState Bank West Florida (“CSWFL”), CenterState Bank of Florida (“CSB”) and CenterState Bank Mid Florida (“Mid FL”), (collectively, the “Banks”).
In January 2006, two of our Company’s subsidiary banks (First National Bank of Polk County and CSB merged with the resulting bank named CenterState Bank of Florida (“CSB”). At the close of business on March 31, 2006, we acquired another bank, CenterState Bank Mid Florida (“Mid FL”). Mid FL was a de novo bank that began operations in January 2004.
CenterState/Central and CSWFL commenced operations in 1989. First National/Polk, now merged with CenterState Bank, commenced operations in 1992 and CenterState Bank commenced operations in 2000. CenterState/Central’s operations are conducted from its main office located in Kissimmee, Florida, and branch offices located in St. Cloud, Poinciana, Ocoee and Orlando, Florida. CSWFL operations are conducted from its main office located in Zephyrhills, Florida, and branch offices located in Zephyrhills, Bushnell, Wildwood, Dade City, Inverness, Spring Hill and Crystal River, Florida. CenterState Bank (previously First National/Polk and CenterState Bank), operates through twelve banking locations all within Polk County, Florida. These cities within Polk County include Winter Haven, Haines City, Davenport, Lake Alfred, Auburdale, Lakeland and Lake Wales. Mid FL’s operations are conducted from its main office located in Leesburg, Florida, and branch offices located in Clermont, Groveland and Eustis, Florida. Our Company’s three national bank subsidiaries are subject to the supervision of the Office of the Comptroller of the Currency and our state bank subsidiary (Mid FL) is under the supervision of the Florida Office of Financial Regulation and the FDIC. As of December 31, 2006, we operate through our now four wholly owned subsidiary banks, with 30 banking locations located in eight counties in central Florida.
Our Company provides a range of consumer and commercial banking services to individuals, businesses and industries. The basic services we offer include: demand interest-bearing and noninterest-bearing accounts, money market deposit accounts, time deposits, safe deposit services, cash management, direct deposits, notary services, money orders, night depository, travelers’ checks, cashier’s checks, domestic collections, savings bonds, bank drafts, automated teller services, drive-in tellers, and banking by mail and by internet. In addition, we make secured and unsecured commercial and real estate loans and issue stand-by letters of credit. Our Company provides automated teller machine (ATM) cards, thereby permitting customers to utilize the convenience of larger ATM networks. We also offer internet banking services to our customers. In addition to the foregoing services, our offices provide customers with extended banking hours. We do not have a trust department, however, trust services are available to customers through a business relationship with another bank. We also offer other financial products to our customers, including mutual funds, annuities and other products, through a relationship with Infinex Investment, Inc.
4
The revenue of our Company is primarily derived from interest on, and fees received in connection with, real estate and other loans, and from interest and dividends from investment securities and short-term investments. The principal sources of funds for our lending activities are customer deposits, repayment of loans, and the sale and maturity of investment securities. Our principal expenses are interest paid on deposits, and operating and general administrative expenses.
As is the case with banking institutions generally, our Company’s operations are materially and significantly influenced by general economic conditions and by related monetary and fiscal policies of financial institution regulatory agencies, including the Board of Governors of the Federal Reserve System (the “Federal Reserve”). Deposit flows and costs of funds are influenced by interest rates on competing investments and general market rates of interest. Lending activities are affected by the demand for financing of real estate and other types of loans, which in turn is affected by the interest rates at which such financing may be offered and other factors affecting local demand and availability of funds. We face strong competition in the attraction of deposits (our primary source of lendable funds) and in the origination of loans.See “Competition.”
C.S. Processing, Inc. (“CSP”) is a wholly owned subsidiary of our Company’s subsidiary banks. CSP processes checks and renders statements (i.e. “item processing center”) and provides certain information technology services for our subsidiary banks.
In November 2006, we entered into a definitive agreement to acquire Valrico Bancorp, Inc. (“VBI”) and its wholly owned subsidiary bank, Valrico State Bank. VBI operates in Hillsborough County which is contiguous to Pasco and Polk Counties, where we currently have banking locations. VBI operates through four banking locations, all within Hillsborough County, and has total assets of approximately $150,000,000. We expect to operate VBI as a wholly owned subsidiary bank, similar to our other banks. We expect the transaction to close in April 2007.
At December 31, 2006, our Company’s primary assets were our ownership of stock of each of our four Banks. At December 31, 2006, we had total consolidated assets of $1,077,102,000, total consolidated deposits of $892,806,000, and total consolidated stockholders’ equity of $117,332,000.
Note about Forward-Looking Statements
This Form 10-K contains forward-looking statements, such as statements relating to our financial condition, results of operations, plans, objectives, future performance and business operations. These statements relate to expectations concerning matters that are not historical facts. These forward-looking statements reflect our current views and expectations based largely upon the information currently available to us and are subject to inherent risks and uncertainties. Although we believe our expectations are based on reasonable assumptions, they are not guarantees of future performance and there are a number of important factors that could cause actual results to differ materially from those expressed or implied by such forward-looking statements. By making these forward-looking statements, we do not undertake to update them in any manner except as may be required by our disclosure obligations in filings we make with the Securities and Exchange Commission under the Federal securities laws. Our actual results may differ materially from our forward-looking statements.
Lending Activities
We offer a range of lending services, including real estate, consumer and commercial loans, to individuals and small businesses and other organizations that are located in or conduct a substantial portion
5
of their business in our market area. The Company’s consolidated loans at December 31, 2006 and 2005 were $657,963,000, or 61% and $516,658,000 or 59%, respectively, of total consolidated assets. The interest rates charged on loans vary with the degree of risk, maturity, and amount of the loan, and are further subject to competitive pressures, money market rates, availability of funds, and government regulations. We have no foreign loans or loans for highly leveraged transactions.
Our loans are concentrated in three major areas: commercial loans, real estate loans, and consumer loans. A majority of our loans are made on a secured basis. As of December 31, 2006, approximately 81% of our consolidated loan portfolio consisted of loans secured by mortgages on real estate and 10% of the loan portfolio consisted of commercial loans (not secured by real estate). At the same date, 9% of our loan portfolio consisted of consumer and other loans.
Our commercial loan portfolio includes loans to individuals and small-to-medium sized businesses located primarily in Polk, Osceola, Pasco, Hernando, Citrus, Sumter, Lake and Orange counties for working capital, equipment purchases, and various other business purposes. A majority of commercial loans are secured by equipment or similar assets, but these loans may also be made on an unsecured basis. Commercial loans may be made at variable or fixed rates of interest. Commercial lines of credit are typically granted on a one-year basis, with loan covenants and monetary thresholds. Other commercial loans with terms or amortization schedules of longer than one year will normally carry interest rates which vary with the prime lending rate and will become payable in full and are generally refinanced in three to five years. Commercial and agricultural loans not secured by real estate amounted to approximately 10% of the our Company’s total loan portfolio as of December 31, 2006, compared to 12% at December 31, 2005.
Our real estate loans are secured by mortgages and consist primarily of loans to individuals and businesses for the purchase, improvement of or investment in real estate, for the construction of single-family residential and commercial units, and for the development of single-family residential building lots. These real estate loans may be made at fixed or variable interest rates. Generally, we do not make fixed-rate commercial real estate loans for terms exceeding five years. Loans in excess of five years are generally adjustable. Our residential real estate loans generally are repayable in monthly installments based on up to a 15-year or a 30-year amortization schedule with variable or fixed interest rates.
Our consumer loan portfolio consists primarily of loans to individuals for various consumer purposes, but includes some business purpose loans which are payable on an installment basis. The majority of these loans are for terms of less than five years and are secured by liens on various personal assets of the borrowers, but consumer loans may also be made on an unsecured basis. Consumer loans are made at fixed and variable interest rates, and are often based on up to a five-year amortization schedule.
For additional information regarding the Company’s loan portfolio,see “Management’s Discussion and Analysis of Financial Condition and Results of Operations.”
Loan originations are derived from a number of sources. Loan originations can be attributed to direct solicitation by our loan officers, existing customers and borrowers, advertising, walk-in customers and, in some instances, referrals from brokers.
Certain credit risks are inherent in making loans. These include prepayment risks, risks resulting from uncertainties in the future value of collateral, risks resulting from changes in economic and industry conditions, and risks inherent in dealing with individual borrowers. In particular, longer maturities increase the risk that economic conditions will change and adversely affect collectibility. We attempt to
6
minimize credit losses through various means. In particular, on larger credits, we generally rely on the cash flow of a debtor as the source of repayment and secondarily on the value of the underlying collateral. In addition, we attempt to utilize shorter loan terms in order to reduce the risk of a decline in the value of such collateral.
Deposit Activities
Deposits are the major source of our funds for lending and other investment activities. We consider the majority of our regular savings, demand, NOW and money market deposit accounts to be core deposits. These accounts comprised approximately 54% and 63% of our consolidated total deposits at December 31, 2006 and 2005, respectively. Approximately 46% of our consolidated deposits at December 31, 2006, were certificates of deposit compared to 37% at December 31, 2005. Generally, we attempt to maintain the rates paid on our deposits at a competitive level. Time deposits of $100,000 and over made up approximately 25% of consolidated total deposits at December 31, 2006 and 18% at December 31, 2005. The majority of the deposits are generated from Polk, Osceola, Orange, Pasco, Hernando, Sumter, Lake and Citrus counties. We do not currently accept brokered deposits and we do not solicit deposits on a national level. We obtain all of our deposits from customers in our local markets. For additional information regarding the Company’s deposit accounts,see “Management’s Discussion and Analysis of Financial Condition and Results of Operations - Deposits.”
Investments
A portion of our assets are invested in U.S. Treasury securities, obligations of U.S. government agencies, municipal securities, mortgage backed securities and federal funds sold. Our investments are managed in relation to loan demand and deposit growth, and are generally used to provide for the investment of excess funds at minimal risks while providing liquidity to fund increases in loan demand or to offset fluctuations in deposits.
With respect to our investment portfolio, we invest in U.S. Treasury securities, obligations of U.S. government agencies, mortgage backed securities and municipal securities, because such securities generally represent a minimal investment risk. Occasionally, we may purchase certificates of deposits of national and state banks. These investments may exceed $100,000 in any one institution (the limit of FDIC insurance for deposit accounts). Federal funds sold and money market accounts represent the excess cash we have available over and above daily cash needs. This money is invested on an overnight basis with approved correspondent banks.
We monitor changes in financial markets. In addition to investments for our portfolio, we monitor daily cash positions to ensure that all available funds earn interest at the earliest possible date. A portion of the investment account is invested in liquid securities that can be readily converted to cash with minimum risk of market loss. These investments usually consist of U.S. Treasury securities, obligations of U.S. government agencies, mortgage backed securities and federal funds. The remainder of the investment account may be placed in investment securities of different type and/or longer maturity. Daily surplus funds are sold in the federal funds market for one business day. We attempt to stagger the maturities of our securities so as to produce a steady cash-flow in the event cash is needed, or economic conditions change.
7
Correspondent Banking
Correspondent banking involves one bank providing services to another bank which cannot provide that service for itself from an economic or practical standpoint. We purchase correspondent services offered by larger banks, including check collections, purchase of federal funds, security safekeeping, investment services, coin and currency supplies, overline and liquidity loan participations and sales of loans to or participation with correspondent banks.
We have established correspondent relationships with Federal Home Loan Bank, Independent Bankers’ Bank of Florida, First American Bank and SunTrust Banks. The Company pays for such services.
Data Processing
Each of our subsidiary banks use the same third party core data processing service bureau which provides an automated general ledger system, deposit accounting, and commercial, mortgage and installment lending data processing. The output of each of these comprehensive systems is then consolidated at the holding company level.
Our banks’ wholly owned subsidiary, CSP, provides item processing services and certain information technology (“IT”) services for our subsidiary banks. These services include; sorting, encoding, processing, and imaging checks and rendering checking and other deposit statements to commercial and retail customers, as well provide IT services for each subsidiary bank and the Company overall. The total cost of providing these services are charged to each subsidiary bank based on usage.
Effect of Governmental Policies
The earnings and business of our Company are and will be affected by the policies of various regulatory authorities of the United States, especially the Federal Reserve. The Federal Reserve, among other things, regulates the supply of credit and deals with general economic conditions within the United States. The instruments of monetary policy employed by the Federal Reserve for these purposes influence in various ways the overall level of investments, loans, other extensions of credit and deposits, and the interest rates paid on liabilities and received on assets.
Interest and Usury
Our Company is subject to numerous state and federal statutes that affect the interest rates that may be charged on loans. These laws do not, under present market conditions, deter us from continuing the process of originating loans.
Supervision and Regulation
Banks and their holding companies, and many of their affiliates, are extensively regulated under both federal and state law. The following is a brief summary of certain statutes, rules, and regulations affecting our Company, and our subsidiary Banks. This summary is qualified in its entirety by reference to the particular statutory and regulatory provisions referred to below and is not intended to be an exhaustive description of the statutes or regulations applicable to the business of our Company and subsidiary Banks. Supervision, regulation, and examination of banks by regulatory agencies are intended primarily for the protection of depositors, rather than shareholders.
8
Bank Holding Company Regulation. Our Company is a bank holding company, registered with the Federal Reserve under the BHC Act. As such, we are subject to the supervision, examination and reporting requirements of the BHC Act and the regulations of the Federal Reserve. The BHC Act requires that a bank holding company obtain the prior approval of the Federal Reserve before (i) acquiring direct or indirect ownership or control of more than 5% of the voting shares of any bank, (ii) taking any action that causes a bank to become a subsidiary of the bank holding company, or (iii) merging or consolidating with any other bank holding company.
The BHC Act further provides that the Federal Reserve may not approve any transaction that would result in a monopoly or would be in furtherance of any combination or conspiracy to monopolize or attempt to monopolize the business of banking in any section of the United States, or the effect of which may be substantially to lessen competition or to tend to create a monopoly in any section of the country, or that in any other manner would be in restraint of trade, unless the anticompetitive effects of the proposed transaction are clearly outweighed by the public interest in meeting the convenience and needs of the community to be served. The Federal Reserve is also required to consider the financial and managerial resources and future prospects of the bank holding companies and banks concerned and the convenience, and needs of the community to be served. Consideration of financial resources generally focuses on capital adequacy and consideration of convenience and needs issues includes the parties’ performance under the Community Reinvestment Act of 1977 (the “CRA”), both of which are discussed below.
Banks are subject to the provisions of the CRA. Under the terms of the CRA, the appropriate federal bank regulatory agency is required, in connection with its examination of a bank, to assess such bank’s record in meeting the credit needs of the community served by that bank, including low- and moderate-income neighborhoods. The regulatory agency’s assessment of the bank’s record is made available to the public. Further, such assessment is required of any bank which has applied to:
| • | | obtain deposit insurance coverage for a newly chartered institution, |
| • | | establish a new branch office that will accept deposits, |
| • | | merge or consolidate with, or acquire the assets or assume the liabilities of, a federally regulated financial institution |
In the case of a bank holding company applying for approval to acquire a bank or other bank holding company, the Federal Reserve will assess the record of each subsidiary bank of the applicant bank holding company, and such records may be the basis for denying the application.
The BHC Act generally prohibits a bank holding company from engaging in activities other than banking, or managing or controlling banks or other permissible subsidiaries, and from acquiring or retaining direct or indirect control of any company engaged in any activities other than those activities determined by the Federal Reserve to be so closely related to banking or managing or controlling banks as to be a proper incident thereto. In determining whether a particular activity is permissible, the Federal Reserve must consider whether the performance of such an activity can reasonably be expected to produce benefits to the public, such as greater convenience, increased competition, or gains in efficiency that outweigh possible adverse effects, such as undue concentration of resources, decreased or unfair competition, conflicts of interest, or unsound banking practices. For example, factoring accounts receivable, acquiring or servicing loans, leasing personal property, conducting securities brokerage activities, performing certain data processing services, acting as agent or broker in selling credit life
9
insurance and certain other types of insurance in connection with credit transactions, and certain insurance underwriting activities have all been determined by regulations of the Federal Reserve to be permissible activities of bank holding companies. Despite prior approval, the Federal Reserve has the power to order a holding company or its subsidiaries to terminate any activity or terminate its ownership or control of any subsidiary, when it has reasonable cause to believe that continuation of such activity or such ownership or control constitutes a serious risk to the financial safety, soundness, or stability of any bank subsidiary of that bank holding company.
Gramm-Leach-Bliley Act. Enacted in 1999, the Gramm-Leach-Bliley Act reforms and modernizes certain areas of financial services regulation. The law permits the creation of new financial services holding companies that can offer a full range of financial products under a regulatory structure based on the principle of functional regulation. The legislation eliminates the legal barriers to affiliations among banks and securities firms, insurance companies, and other financial services companies. The law also provides financial organizations with the opportunity to structure these new financial affiliations through a holding company structure or a financial subsidiary. The new law reserves the role of the Federal Reserve Board as the supervisor for bank holding companies. At the same time, the law also provides a system of functional regulation which is designed to utilize the various existing federal and state regulatory bodies. The law also sets up a process for coordination between the Federal Reserve Board and the Secretary of the Treasury regarding the approval of new financial activities for both bank holding companies and national bank financial subsidiaries.
The law also includes a minimum federal standard of financial privacy. Financial institutions are required to have written privacy policies that must be disclosed to customers. The disclosure of a financial institution’s privacy policy must take place at the time a customer relationship is established and not less than annually during the continuation of the relationship. The act also provides for the functional regulation of bank securities activities. The law repeals the exemption that banks were afforded from the definition of “broker,” and replaces it with a set of limited exemptions that allow the continuation of some historical activities performed by banks. In addition, the act amends the securities laws to include banks within the general definition of dealer. Regarding new bank products, the law provides a procedure for handling products sold by banks that have securities elements. In the area of Community Reinvestment Act activities, the law generally requires that financial institutions address the credit needs of low-to-moderate income individuals and neighborhoods in the communities in which they operate. Bank regulators are required to take the Community Reinvestment Act ratings of a bank or of the bank subsidiaries of a holding company into account when acting upon certain branch and bank merger and acquisition applications filed by the institution. Under the law, financial holding companies and banks that desire to engage in new financial activities are required to have satisfactory or better Community Reinvestment Act ratings when they commence the new activity.
Bank Regulation. CenterState/Osceola, CenterState Bank and CSWFL are chartered under the national banking laws. Mid FL is a State chartered Bank. Each of the deposits of the Banks is insured by the FDIC to the extent provided by law. The Banks are subject to comprehensive regulation, examination and supervision by the OCC. The Banks also are subject to other laws and regulations applicable to banks. Such regulations include limitations on loans to a single borrower and to its directors, officers and employees; restrictions on the opening and closing of branch offices; the maintenance of required capital and liquidity ratios; the granting of credit under equal and fair conditions; and the disclosure of the costs and terms of such credit. The Banks are examined periodically by the OCC. The Banks submit to their examining agencies periodic reports regarding their financial condition and other matters. The bank regulatory agencies have a broad range of powers to enforce regulations under their jurisdiction, and to take discretionary actions determined to be for the protection and safety and soundness of banks, including
10
the institution of cease and desist orders and the removal of directors and officers. The bank regulatory agencies also have the authority to approve or disapprove mergers, consolidations, and similar corporate actions.
There are various statutory limitations on the ability of our Company to pay dividends. The bank regulatory agencies also have the general authority to limit the dividend payment by banks if such payment may be deemed to constitute an unsafe and unsound practice. For information on the restrictions on the right of our Banks to pay dividends to our Company,see Part II - Item 5 “Market for the Registrant’s Common Equity, Related Stockholder Matters and Purchases of Equity Securities.”
Under federal law, federally insured banks are subject, with certain exceptions, to certain restrictions on any extension of credit to their parent holding companies or other affiliates, on investment in the stock or other securities of affiliates, and on the taking of such stock or securities as collateral from any borrower. In addition, banks are prohibited from engaging in certain tie-in arrangements in connection with any extension of credit or the providing of any property or service.
The Financial Institutions Reform, Recovery and Enforcement Act of 1989 (“FIRREA”) imposed major regulatory reforms, stronger capital standards for savings and loan associations and stronger civil and criminal enforcement provisions. FIRREA also provides that a depository institution insured by the FDIC can be held liable for any loss incurred by, or reasonably expected to be incurred by, the FDIC in connection with:
| • | | the default of a commonly controlled FDIC insured depository institution; or |
| • | | any assistance provided by the FDIC to a commonly controlled FDIC insured institution in danger of default. |
The FDIC Improvement Act of 1993 (“FDICIA”) made a number of reforms addressing the safety and soundness of deposit insurance funds, supervision, accounting, and prompt regulatory action, and also implemented other regulatory improvements. Annual full-scope, on-site examinations are required of all insured depository institutions. The cost for conducting an examination of an institution may be assessed to that institution, with special consideration given to affiliates and any penalties imposed for failure to provide information requested. Insured state banks also are precluded from engaging as principal in any type of activity that is impermissible for a national bank, including activities relating to insurance and equity investments. The Act also recodified current law restricting extensions of credit to insiders under the Federal Reserve Act.
Also important in terms of its effect on banks has been the deregulation of interest rates paid by banks on deposits and the types of deposit accounts that may be offered by banks. Most regulatory limits on permissible deposit interest rates and minimum deposit amounts expired several years ago. The effect of the deregulation of deposit interest rates generally has been to increase the costs of funds to banks and to make their costs of funds more sensitive to fluctuations in money market rates. A result of the pressure on banks interest margins due to deregulation has been a trend toward expansion of services offered by banks and an increase in the emphasis placed on fee or noninterest income.
Capital Requirements. The Federal Reserve Board and bank regulatory agencies require bank holding companies and financial institutions to maintain capital at adequate levels based on a percentage of assets and off-balance sheet exposures, adjusted for risk weights ranging from 0% to 100%. Under the risk-based standard, capital is classified into two tiers. Tier 1 capital consists of common shareholders’ equity (excluding the unrealized gain (loss) on available-for-sale securities), trust preferred securities
11
subject to certain limitations, and minus certain intangible assets. Tier 2 capital consists of the general allowance for credit losses except for certain limitations. An institution’s qualifying capital base for purposes of its risk-based capital ratio consists of the sum of its Tier 1 and Tier 2 capital. The regulatory minimum requirements are 4% for Tier 1 and 8% for total risk-based capital. At December 31, 2006, our Tier 1 and total risk-based capital ratios were 15.6% and 16.6%, respectively.
Bank holding companies and banks are also required to maintain capital at a minimum level based on total assets, which is known as the leverage ratio. The minimum requirement for the leverage ratio is 3%, but all but the highest rated institutions are required to maintain ratios 100 to 200 basis points above the minimum. At December 31, 2006, our leverage ratio was 11.2%.
FDICIA contains “prompt corrective action” provisions pursuant to which banks are to be classified into one of five categories based upon capital adequacy, ranging from “well capitalized” to “critically undercapitalized” and which require (subject to certain exceptions) the appropriate federal banking agency to take prompt corrective action with respect to an institution which becomes “significantly undercapitalized” or “critically undercapitalized.”
The OCC and the FDIC have issued regulations to implement the “prompt corrective action” provisions of FDICIA. In general, the regulations define the five capital categories as follows:
| • | | an institution is “well capitalized” if it has a total risk-based capital ratio of 10% or greater, has a Tier 1 risk-based capital ratio of 6% or greater, has a leverage ratio of 5% or greater and is not subject to any written capital order or directive to meet and maintain a specific capital level for any capital measures; |
| • | | an institution is “adequately capitalized” if it has a total risk-based capital ratio of 8% or greater, has a Tier 1 risk-based capital ratio of 4% or greater, and has a leverage ratio of 4% or greater; |
| • | | an institution is “undercapitalized” if it has a total risk-based capital ratio of less than 8%, has a Tier 1 risk-based capital ratio that is less than 4% or has a leverage ratio that is less than 4%; |
| • | | an institution is “significantly undercapitalized” if it has a total risk-based capital ratio that is less than 6%, a Tier 1 risk-based capital ratio that is less than 3% or a leverage ratio that is less than 3%; and |
| • | | an institution is “critically undercapitalized” if its “tangible equity” is equal to or less than 2% of its total assets. |
The OCC and the FDIC, after an opportunity for a hearing, have authority to downgrade an institution from “well capitalized” to “adequately capitalized” or to subject an “adequately capitalized” or “undercapitalized” institution to the supervisory actions applicable to the next lower category, for supervisory concerns.
Generally, FDICIA requires that an “undercapitalized” institution must submit an acceptable capital restoration plan to the appropriate federal banking agency within 45 days after the institution becomes “undercapitalized” and the agency must take action on the plan within 60 days. The appropriate federal banking agency may not accept a capital restoration plan unless, among other requirements, each company having control of the institution has guaranteed that the institution will comply with the plan until the institution has been adequately capitalized on average during each of the three consecutive calendar quarters and has provided adequate assurances of performance. The aggregate liability under this provision of all companies having control of an institution is limited to the lesser of:
| • | | 5% of the institution’s total assets at the time the institution becomes “undercapitalized” or |
12
| • | | the amount which is necessary, or would have been necessary, to bring the institution into compliance with all capital standards applicable to the institution as of the time the institution fails to comply with the plan filed pursuant to FDICIA |
An “undercapitalized” institution may not acquire an interest in any company or any other insured depository institution, establish or acquire additional branch offices or engage in any new business unless the appropriate federal banking agency has accepted its capital restoration plan, the institution is implementing the plan, and the agency determines that the proposed action is consistent with and will further the achievement of the plan, or the appropriate Federal banking agency determines the proposed action will further the purpose of the “prompt corrective action” sections of FDICIA.
If an institution is “critically undercapitalized,” it must comply with the restrictions described above. In addition, the appropriate Federal banking agency is authorized to restrict the activities of any “critically undercapitalized” institution and to prohibit such an institution, without the appropriate Federal banking agency’s prior written approval, from:
| • | | entering into any material transaction other than in the usual course of business; |
| • | | engaging in any covered transaction with affiliates (as defined in Section 23A(b) of the Federal Reserve Act); |
| • | | paying excessive compensation or bonuses; and |
| • | | paying interest on new or renewed liabilities at a rate that would increase the institution’s weighted average costs of funds to a level significantly exceeding the prevailing rates of interest on insured deposits in the institution’s normal market areas. |
The “prompt corrective action” provisions of FDICIA also provide that in general no institution may make a capital distribution if it would cause the institution to become “undercapitalized.” Capital distributions include cash (but not stock) dividends, stock purchases, redemptions, and other distributions of capital to the owners of an institution.
Additionally, FDICIA requires, among other things, that:
| • | | only a “well capitalized” depository institution may accept brokered deposits without prior regulatory approval and |
| • | | the appropriate federal banking agency annually examine all insured depository institutions, with some exceptions for small, “well capitalized” institutions and state-chartered institutions examined by state regulators. |
FDICIA also contains a number of consumer banking provisions, including disclosure requirements and substantive contractual limitations with respect to deposit accounts.
As of December 31, 2006, each of our subsidiary Banks met the capital requirements of a “well capitalized” institution.
Enforcement Powers. Congress has provided the federal bank regulatory agencies with an array of powers to enforce laws, rules, regulations and orders. Among other things, the agencies may require that institutions cease and desist from certain activities, may preclude persons from participating in the affairs of insured depository institutions, may suspend or remove deposit insurance, and may impose civil money penalties against institution-affiliated parties for certain violations.
13
Maximum Legal Interest Rates. Like the laws of many states, Florida law contains provisions on interest rates that may be charged by banks and other lenders on certain types of loans. Numerous exceptions exist to the general interest limitations imposed by Florida law. The relative importance of these interest limitation laws to the financial operations of the Banks will vary from time to time, depending on a number of factors, including conditions in the money markets, the costs and availability of funds, and prevailing interest rates.
Branch Banking. Banks in Florida are permitted to branch state wide. Such branch banking, however, is subject to prior approval by the bank regulatory agencies. Any such approval would take into consideration several factors, including the bank’s level of capital, the prospects and economics of the proposed branch office, and other conditions deemed relevant by the bank regulatory agencies for purposes of determining whether approval should be granted to open a branch office.
Change of Control. Federal law restricts the amount of voting stock of a bank holding company and a bank that a person may acquire without the prior approval of banking regulators. The overall effect of such laws is to make it more difficult to acquire a bank holding company and a bank by tender offer or similar means than it might be to acquire control of another type of corporation. Consequently, shareholders of the Company may be less likely to benefit from the rapid increases in stock prices that may result from tender offers or similar efforts to acquire control of other companies. Federal law also imposes restrictions on acquisitions of stock in a bank holding company and a state bank. Under the federal Change in Bank Control Act and the regulations thereunder, a person or group must give advance notice to the Federal Reserve before acquiring control of any bank holding company, the OCC before acquiring control of any national bank and the FDIC and the Florida Department before acquiring control of a state bank. Upon receipt of such notice, the bank regulatory agencies may approve or disapprove the acquisition. The Change in Bank Control Act creates a rebuttable presumption of control if a member or group acquires a certain percentage or more of a bank holding company’s or state bank’s voting stock, or if one or more other control factors set forth in the Act are present.
Interstate Banking. Federal law provides for nationwide interstate banking and branching. Under the law, interstate acquisitions of banks or bank holding companies in any state by bank holding companies in any other state are permissible subject to certain limitations. Florida has a law that allows out-of-state bank holding companies (located in states that allow Florida bank holding companies to acquire banks and bank holding companies in that state) to acquire Florida banks and Florida bank holding companies. The law essentially provides for out-of-state entry by acquisition only (and not by interstate branching) and requires the acquired Florida bank to have been in existence for at least three years.
Effect of Governmental Policies. Our earnings and businesses are affected by the policies of various regulatory authorities of the United States, especially the Federal Reserve. The Federal Reserve, among other things, regulates the supply of credit and deals with general economic conditions within the United States. The instruments of monetary policy employed by the Federal Reserve for those purposes influence in various ways the overall level of investments, loans, other extensions of credit, and deposits, and the interest rates paid on liabilities and received on assets.
Sarbanes-Oxley Act. In 2002, the Sarbanes-Oxley Act was enacted which imposes a myriad of corporate governance and accounting measures designed that shareholders are treated and have full and accurate information about the public companies in which they invest. All public companies are affected by the Act. Some of the principal provisions of the Act include:
| | • | | the creation of an independent accounting oversight board (“PCAOB”) to oversee the audit of public companies and auditors who perform such audits; |
14
| | • | | auditor independence provisions which restrict non-audit services that independent accountants may provide to their audit clients; |
| | • | | additional corporate governance and responsibility measures which (a) require the chief executive officer and chief financial officer to certify financial statements and internal controls and to forfeit salary and bonuses in certain situations, and (b) protect whistleblowers and informants; |
| | • | | expansion of the authority and responsibilities of the company’s audit, nominating and compensation committees; |
| | • | | mandatory disclosure by analysts of potential conflicts of interest; and |
| | • | | enhanced penalties for fraud and other violations. |
USA Patriot Act. In 2001, the USA Patriot Act was enacted. The Act requires financial institutions to help prevent, detect and prosecute international money laundering and financing of terrorism. The effectiveness of a financial institution in combating money laundering activities is a factor to be considered in any application submitted by the financial institution with the bank regulatory agencies. Our Banks have adopted systems and procedures designed to comply with the USA Patriot Act and regulations adopted thereunder by the Secretary of the Treasury.
Competition
We encounter strong competition both in making loans and in attracting deposits. The deregulation of the banking industry and the widespread enactment of state laws which permit multi-bank holding companies as well as an increasing level of interstate banking have created a highly competitive environment for commercial banking. In one or more aspects of its business, our Company competes with other commercial banks, savings and loan associations, credit unions, finance companies, mutual funds, insurance companies, brokerage and investment banking companies, and other financial intermediaries. Most of these competitors, some of which are affiliated with bank holding companies, have substantially greater resources and lending limits, and may offer certain services that we do not currently provide. In addition, many of our non-bank competitors are not subject to the same extensive federal regulations that govern bank holding companies and federally insured banks. Recent federal and state legislation has heightened the competitive environment in which financial institutions must conduct their business, and the potential for competition among financial institutions of all types has increased significantly.
To compete, we rely upon specialized services, responsive handling of customer needs, and personal contacts by its officers, directors, and staff. Large multi-branch banking competitors tend to compete primarily by rate and the number and location of branches while smaller, independent financial institutions tend to compete primarily by rate and personal service.
15
Employees
As of December 31, 2006, we had a total of approximately 320 full-time equivalent employees. The employees are not represented by a collective bargaining unit. We consider relations with employees to be good.
Statistical Profile and Other Financial Data
Reference is hereby made to the statistical and financial data contained in the section captioned “Management’s Discussion and Analysis of Financial Condition and Results of Operations,” for statistical and financial data providing a review of our Company’s business activities.
Availability of Reports furnished or filed with the Securities and Exchange Commission (SEC)
Our annual report on Form 10-K, quarterly reports on Form 10-Q, current reports on Form 8-K, and amendments to those reports filed or furnished pursuant to Section 13(a) or 15(d) of the Exchange Act are available on our internet website atwww.csflbanks.com. The Company’s code of ethics is also included on our internet website.
We have identified risk factors described below, which should be viewed in conjunction with the other information contained in this document and information incorporated by reference, including our consolidated financial statements and related notes. If any of the following risks or other risks which have not been identified or which we may believe are immaterial or unlikely, actually occur, our business, financial condition and results of operations could be harmed. As noted previously, this report contains forward-looking statements that involve risks and uncertainties, including statements about our future plans, objectives, intentions and expectations. Many factors, including those described below, could cause actual results to differ materially from those discussed in forward-looking statements.
Our business strategy includes the continuation of significant growth plans, and our financial condition and results of operations could be negatively affected if we fail to grow or fail to manage our growth effectively
We intend to continue pursuing a significant growth strategy for our business. Our prospects must be considered in light of the risks, expenses and difficulties frequently encountered by companies in significant growth stages of development. There is no assurance we will be able to expand our market presence in our existing markets or successfully enter new markets or that any such expansion will not adversely affect our results of operations. Failure to manage our growth effectively could have a material adverse effect on our business, future prospects, financial condition or results of operations, and could adversely affect our ability to successfully implement our business strategy. Also, if our growth occurs more slowly than anticipated or declines, our operating results could be materially adversely affected.
Our ability to successfully grow will depend on a variety of factors including the continued availability of desirable business opportunities, the competitive responses from other financial institutions in our market areas and our ability to manage our growth. While we believe we have the management resources and internal systems in place to successfully manage our future growth, there can be no assurance growth opportunities will be available or growth will be successfully managed.
16
Our business is subject to the success of the local economies where we operate
Our success significantly depends upon the growth in population, income levels, deposits and housing starts in our primary and secondary markets. If the communities in which we operate do not grow or if prevailing economic conditions locally or nationally are unfavorable, our business may not succeed. Adverse economic conditions in our specific market area could reduce our growth rate, affect the ability of our customers to repay their loans to us and generally affect our financial condition and results of operations. We are less able than a larger institution to spread the risks of unfavorable local economic conditions across a large number of diversified economies. Moreover, we cannot give any assurance we will benefit from any market growth or favorable economic conditions in our primary market areas if they do occur.
Any adverse market or economic conditions in the State of Florida may disproportionately increase the risk our borrowers will be unable to make their loan payments. In addition, the market value of the real estate securing loans as collateral could be adversely affected by unfavorable changes in market and economic conditions. As of December 31, 2006, approximately 81% of our loans held for investment were secured by real estate. Of this amount, approximately 55% were commercial real estate loans, 34% were residential real estate loans and 11% were construction and development loans. Any sustained period of increased payment delinquencies, foreclosures or losses caused by adverse market or economic conditions in the State of Florida could adversely affect the value of our assets, our revenues, results of operations and financial condition.
We may face risks with respect to future expansion
We may acquire other financial institutions or parts of those institutions in the future and we may engage in additional de novo branch expansion. We may also consider and enter into new lines of business or offer new products or services. We also may receive future inquiries and have discussions with potential acquirors of us. Acquisitions and mergers involve a number of risks, including:
| | • | | the time and costs associated with identifying and evaluating potential acquisitions and merger partners; |
| | • | | the estimates and judgments used to evaluate credit, operations, management and market risks with respect to the target institution may not be accurate; |
| | • | | the time and costs of evaluating new markets, hiring experienced local management and opening new offices, and the time lags between these activities and the generation of sufficient assets and deposits to support the costs of the expansion; |
| | • | | our ability to finance an acquisition and possible dilution to our existing shareholders; |
| | • | | the diversion of our management’s attention to the negotiation of a transaction, and the integration of the operations and personnel of the combining businesses; |
| | • | | entry into new markets where we lack experience; |
| | • | | the introduction of new products and services into our business; |
| | • | | the incurrence and possible impairment of goodwill associated with an acquisition and possible adverse short-term effects on our results of operations; and |
17
| | • | | the risk of loss of key employees and customers. |
We may incur substantial costs to expand, and we can give no assurance such expansion will result in the levels of profits we seek. There can be no assurance integration efforts for any future mergers or acquisitions will be successful. Also, we may issue equity securities, including common stock and securities convertible into shares of our common stock in connection with future acquisitions, which could cause ownership and economic dilution to our current shareholders. There is no assurance that, following any future mergers or acquisition, our integration efforts will be successful or our company, after giving effect to the acquisition, will achieve profits comparable to or better than our historical experience.
If the value of real estate in our core Florida market were to decline materially, a significant portion of our loan portfolio could become under-collateralized, which could have a material adverse effect on us
With most of our loans concentrated in Central Florida, a decline in local economic conditions could adversely affect the values of our real estate collateral. Consequently, a decline in local economic conditions may have a greater effect on our earnings and capital than on the earnings and capital of larger financial institutions whose real estate loan portfolios are geographically diverse.
In addition to the financial strength and cash flow characteristics of the borrower in each case, the Banks often secure loans with real estate collateral. At December 31, 2006, approximately 81% of our loans have real estate as a primary or secondary component of collateral. The real estate collateral in each case provides an alternate source of repayment in the event of default by the borrower and may deteriorate in value during the time the credit is extended. If we are required to liquidate the collateral securing a loan to satisfy the debt during a period of reduced real estate values, our earnings and capital could be adversely affected.
An inadequate allowance for loan losses would reduce our earnings
The risk of credit losses on loans varies with, among other things, general economic conditions, the type of loan being made, the creditworthiness of the borrower over the term of the loan and, in the case of a collateralized loan, the value and marketability of the collateral for the loan. We maintain an allowance for loan losses based upon, among other things, historical experience, an evaluation of economic conditions and regular reviews of delinquencies and loan portfolio quality. Based upon such factors, management makes various assumptions and judgments about the ultimate collectibility of the loan portfolio and provides an allowance for loan losses based upon a percentage of the outstanding balances and for specific loans when their ultimate collectibility is considered questionable. If management’s assumptions and judgments prove to be incorrect and the allowance for loan losses is inadequate to absorb losses, or if the bank regulatory authorities require the Banks to increase the allowance for loan losses as a part of their examination process, our earnings and capital could be significantly and adversely affected.
The building of market share through our de novo branching strategy could cause our expenses to increase faster than revenues
We intend to continue to build market share in Central Florida through our de novo branching strategy. We currently plan to open several new branches in 2007 and 2008. There are considerable costs involved in opening branches and new branches generally do not generate sufficient revenues to offset
18
their costs until they have been in operation for at least a year or more. Accordingly, our new branches can be expected to negatively impact our earnings for some period of time until the branches reach certain economies of scale. Our expenses could be further increased if we encounter delays in the opening of any of our new branches. Finally, we have no assurance our new branches will be successful even after they have been established.
Our recent results may not be indicative of our future results
We may not be able to sustain our historical rate of growth or may not even be able to grow our business at all. In addition, our recent and rapid growth may distort some of our historical financial ratios and statistics. In the future, we may not have the benefit of several recently favorable factors, such as a generally favorable interest rate environment or the ability to find suitable expansion opportunities. Various factors, such as economic conditions, regulatory and legislative considerations and competition, may also impede or prohibit our ability to expand our market presence. If we experience a significant decrease in our historical rate of growth, our results of operations and financial condition may be adversely affected due to a high percentage of our operating costs being fixed expenses.
Our continued pace of growth may require us to raise additional capital in the future, but that capital may not be available when it is needed
We are required by federal and state regulatory authorities to maintain adequate levels of capital to support our operations. We anticipate our capital resources following this offering will satisfy our capital requirements for the foreseeable future. We may at some point, however, need to raise additional capital to support our continued growth.
Our ability to raise additional capital, if needed, will depend on conditions in the capital markets at that time, which are outside our control, and on our financial performance. Accordingly, we cannot assure you of our ability to raise additional capital if needed on terms acceptable to us. If we cannot raise additional capital when needed, our ability to further expand our operations through internal growth and acquisitions could be materially impaired.
Increases in interest rates may negatively affect our earnings and the value of our assets
Changes in interest rates may affect our level of interest income, the primary component of our gross revenue, as well as the level of our interest expense, our largest recurring expenditure. In a period of rising interest rates, our interest expense could increase in different amounts and at different rates while the interest that we earn on our assets may not change in the same amounts or at the same rates. Accordingly, increases in interest rates could decrease our net interest income.
Changes in the level of interest rates also may negatively affect our ability to originate real estate loans, the value of our assets and our ability to realize gains from the sale of our assets, all of which ultimately affect our earnings. A decline in the market value of our assets may limit our ability to borrow additional funds or result in our lenders requiring additional collateral from us under our loan agreements. As a result, we could be required to sell some of our loans and investments under adverse market conditions, upon terms that are not favorable to us, in order to maintain our liquidity. If those sales are made at prices lower than the amortized costs of the investments, we will incur losses.
19
Competition from financial institutions and other financial service providers may adversely affect our profitability
The banking business is highly competitive and we experience competition in each of our markets from many other financial institutions. We compete with commercial banks, credit unions, savings and loan associations, mortgage banking firms, consumer finance companies, securities brokerage firms, insurance companies, money market funds, and other mutual funds, as well as other super-regional, national and international financial institutions that operate offices in our primary market areas and elsewhere.
We compete with these institutions both in attracting deposits and in making loans. In addition, we have to attract our customer base from other existing financial institutions and from new residents. Many of our competitors are well-established, larger financial institutions. While we believe we can and do successfully compete with these other financial institutions in our primary markets, we may face a competitive disadvantage as a result of our smaller size, lack of geographic diversification and inability to spread our marketing costs across a broader market. Although we compete by concentrating our marketing efforts in our primary markets with local advertisements, personal contacts, and greater flexibility and responsiveness in working with local customers, we can give no assurance this strategy will be successful.
We are subject to extensive regulation that could limit or restrict our activities
We operate in a highly regulated industry and are subject to examination, supervision, and comprehensive regulation by various federal and state agencies. Our compliance with these regulations is costly and restricts certain of our activities, including payment of dividends, mergers and acquisitions, investments, loans and interest rates charged, interest rates paid on deposits and locations of offices. We are also subject to capitalization guidelines established by our regulators, which require us to maintain adequate capital to support our growth.
The laws and regulations applicable to the banking industry could change at any time, and we cannot predict the effects of these changes on our business and profitability. Because government regulation greatly affects the business and financial results of all commercial banks and bank holding companies, our cost of compliance could adversely affect our ability to operate profitably.
We are dependent upon the services of our management team
Our future success and profitability is substantially dependent upon the management and banking abilities of our senior executives. We believe that our future results will also depend in part upon our attracting and retaining highly skilled and qualified management and sales and marketing personnel. Competition for such personnel is intense, and we cannot assure you that we will be successful in retaining such personnel. We also cannot guarantee that members of our executive management team will remain with us. Changes in key personnel and their responsibilities may be disruptive to our business and could have a material adverse effect on our business, financial condition and results of operations.
| Item 1B. | Unresolved Staff Comments |
None
Our Holding Company owns no real property. We occupy office space in the main office building of CenterState Bank, one of our subsidiary Banks, which is located at 1101 First Street South, Suite 202,
20
Winter Haven, Florida 33880. Our Company, through our Banks, currently operates a total of 30 banking offices. Of these offices there are two “mini” offices in active adult communities. These offices are leased for nominal amounts, and generally consist of a room that is set aside for us in the community club house or community center. These offices are opened for abbreviated periods and cater to the residents of the gated community. Of the 28 full service offices, we lease two (downtown Lakeland office and our Leesburg office), we constructed two branch buildings on leased land (Kissimmee office and south Lakeland office), we are operating three offices in temporary locations during the construction of their permanent sites (Crystal River, Deer Creek and Eustis), and all the remaining offices (21) we own without encumbrances.See Note 4 to the Consolidated Financial Statements of our Company included in this Annual Report on Form 10-K beginning at page 63 for additional information regarding our premises and equipment.
Our Banks are periodically parties to or otherwise involved in legal proceedings arising in the normal course of business, such as claims to enforce liens, claims involving the making and servicing of real property loans, and other issues incident to their respective businesses. We do not believe that there is any pending or threatened proceeding against the Banks which would have a material adverse effect on our consolidated financial position.
| Item 4. | Submission of Matters to a Vote of Security Holders |
No matters were submitted to a vote of our Company security holders during the fourth quarter of the year ended December 31, 2006.
21
PART II
| Item 5. | Market for Common Equity, Related Stockholder Matters, Purchases of Equity Securities and Performance Graph |
The shares of our Common Stock are traded on the Nasdaq National Market System. The following sets forth the high and low trading prices for trades of our Common Stock that occurred during 2006 and 2005. Historical per share data has been adjusted to reflect our May 2006 two for one stock split.
| | | | | | | | | | | | |
| | | 2006 | | 2005 |
| | | High | | Low | | High | | Low |
1st Quarter | | $ | 19.57 | | $ | 17.08 | | $ | 17.25 | | $ | 14.91 |
2nd Quarter | | | 22.74 | | | 17.88 | | | 20.43 | | | 16.18 |
3rd Quarter | | | 21.05 | | | 18.16 | | | 17.47 | | | 16.25 |
4th Quarter | | | 22.26 | | | 19.10 | | | 17.48 | | | 16.75 |
As of December 31, 2006, there were 11,129,020 shares of common stock outstanding. There were approximately 970 registered shareholders as of that date, as reported by our transfer agent, Continental Stock Transfer & Trust Company.
Dividends
We have historically paid cash dividends on a quarterly basis, on the last business day of the calendar quarter. The following sets forth per share cash dividends paid during 2006 and 2005. Historical per share data has been adjusted to reflect our May 2006 two for one stock split.
| | | | | | |
| | | 2006 | | 2005 |
1st Quarter | | $ | 0.035 | | $ | 0.03 |
2nd Quarter | | $ | 0.035 | | $ | 0.03 |
3rd Quarter | | $ | 0.035 | | $ | 0.035 |
4th Quarter | | $ | 0.035 | | $ | 0.035 |
The payment of dividends is a decision of our Board of Directors based upon then-existing circumstances, including our rate of growth, profitability, financial condition, existing and anticipated capital requirements, the amount of funds legally available for the payment of cash dividends, regulatory constraints and such other factors as the Board determines relevant. The source of funds for payment of dividends by our Holding Company is dividends received from our Banks, or excess cash available at the Holding Company level. Payments by our subsidiary Banks to our Holding Company are limited by law and regulations of the bank regulatory authorities. There are various statutory and contractual limitations on the ability of our Banks to pay dividends to our Holding Company. The bank regulatory agencies also have the general authority to limit the dividends paid by banks if such payment may be deemed to constitute an unsafe and unsound practice. Our subsidiaries may not pay dividends from their paid-in surplus. All dividends must be paid out of undivided profits then on hand, after deducting expenses, including reserves for losses and bad debts. In addition, a national bank is prohibited from declaring a dividend on its shares of common stock until its surplus equals its stated capital, unless there has been transferred to surplus no less than one/tenth of the bank’s net profits of the preceding two consecutive half-year periods (in the case of an annual dividend). The approval of the OCC is required if the total of all
22
dividends declared by a national bank in any calendar year exceeds the total of its net profits for that year combined with its retained net profits for the preceding two years, less any required transfers to surplus. As to a state bank, no dividends may be paid at a time when the Bank’s net income from the preceding two years is a loss or which would cause the capital accounts of the Bank to fall below the minimum amount required by law, regulation, order or any written agreement with the Florida Department or a Federal regulatory agency.
Share Repurchases
We did not repurchase any shares of our common stock during 2006.
Stock Plans
With respect to information regarding our securities authorized for issuance under equity incentive plans, the information contained in the section entitled “Equity Compensation Plan Information” in our Definitive Proxy Statement for the 2007 Annual Meeting of Shareholders is incorporated herein by reference.
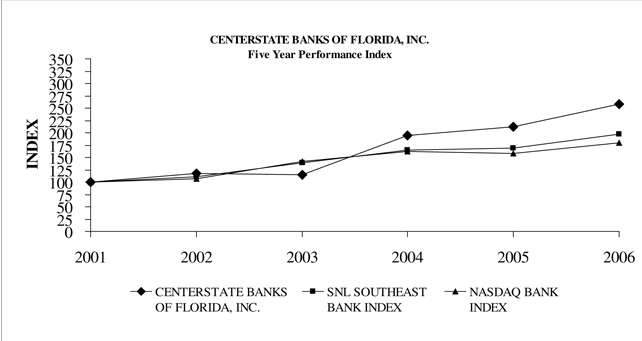
Performance Graph
Shares of our common stock commenced trading on the OTC Bulletin Board on January 26, 2001 and on the NASDAQ National Market System on February 20, 2001. The following graph compares the yearly percentage change in cumulative shareholder return on the Company’s common stock, with the cumulative total return of the SNL Southeast Bank Index and the NASDAQ Bank Index, since January 1, 2001 (assuming a $100 investment on January 1, 2001 and reinvestment of all dividends).
| | | | | | | | | | | | |
| | | 2001 | | 2002 | | 2003 | | 2004 | | 2005 | | 2006 |
CenterState Banks of Florida, Inc. | | 100 | | 117 | | 115 | | 194 | | 212 | | 258 |
SNL Southeast Bank Index | | 100 | | 110 | | 139 | | 165 | | 168 | | 197 |
NASDAQ Bank Index | | 100 | | 107 | | 142 | | 162 | �� | 158 | | 180 |
23
| Item 6. | Selected Consolidated Financial Data |
The selected consolidated financial data presented below should be read in conjunction with management’s discussion and analysis of financial condition and results of operations, and the consolidated financial statements and footnotes thereto, of the Company at December 31, 2006 and 2005, and the three year period ended December 31, 2006, presented elsewhere herein.
Selected Consolidated Financial Data
December 31
| | | | | | | | | | | | | | | | | | | | |
(Dollars in thousands except for share and per share data) | | 2006 | | | 2005 | | | 2004 | | | 2003 | | | 2002 | |
SUMMARY OF OPERATIONS: | | | | | | | | | | | | | | | | | | | | |
Total interest income | | $ | 59,113 | | | $ | 40,266 | | | $ | 29,088 | | | $ | 25,802 | | | $ | 21,048 | |
Total interest expense | | | (22,010 | ) | | | (11,722 | ) | | | (7,874 | ) | | | (7,532 | ) | | | (6,892 | ) |
| | | | | | | | | | | | | | | | | | | | |
Net interest income | | | 37,103 | | | | 28,544 | | | | 21,214 | | | | 18,270 | | | | 14,156 | |
Provision for loan losses | | | (717 | ) | | | (1,065 | ) | | | (1,270 | ) | | | (1,243 | ) | | | (644 | ) |
| | | | | | | | | | | | | | | | | | | | |
Net interest income after provision for loan losses | | | 36,386 | | | | 27,479 | | | | 19,944 | | | | 17,027 | | | | 13,512 | |
Non-interest income | | | 6,136 | | | | 5,380 | | | | 4,932 | | | | 4,687 | | | | 3,660 | |
Gain on sale of branches | | | — | | | | — | | | | 1,844 | | | | — | | | | — | |
Non-interest expense | | | (29,204 | ) | | | (22,805 | ) | | | (19,780 | ) | | | (17,547 | ) | | | (13,397 | ) |
| | | | | | | | | | | | | | | | | | | | |
Income before income taxes | | | 13,318 | | | | 10,054 | | | | 6,940 | | | | 4,167 | | | | 3,775 | |
Income taxes | | | (4,859 | ) | | | (3,724 | ) | | | (2,567 | ) | | | (1,541 | ) | | | (1,406 | ) |
| | | | | | | | | | | | | | | | | | | | |
Net income | | $ | 8,459 | | | $ | 6,330 | | | $ | 4,373 | | | $ | 2,626 | | | $ | 2,369 | |
| | | | | | | | | | | | | | | | | | | | |
PER COMMON SHARE DATA: | | | | | | | | | | | | | | | | | | | | |
Basic earnings per share | | $ | 0.77 | | | $ | 0.675 | | | $ | 0.585 | | | $ | 0.390 | | | $ | 0.42 | |
Diluted earnings per share | | $ | 0.75 | | | $ | 0.655 | | | $ | 0.570 | | | $ | 0.385 | | | $ | 0.41 | |
Book value per share | | $ | 10.54 | | | $ | 9.26 | | | $ | 7.09 | | | $ | 6.23 | | | $ | 5.94 | |
Tangible book value per share | | $ | 9.38 | | | $ | 8.77 | | | $ | 6.45 | | | $ | 5.18 | | | $ | 5.19 | |
Dividends per share | | $ | 0.14 | | | $ | 0.13 | | | $ | 0.12 | | | $ | 0.11 | | | $ | 0.10 | |
Actual shares outstanding | | | 11,129,020 | | | | 10,500,772 | | | | 8,137,426 | | | | 6,738,760 | | | | 6,724,136 | |
Weighted average shares outstanding | | | 10,964,890 | | | | 9,357,046 | | | | 7,500,316 | | | | 6,729,648 | | | | 5,646,426 | |
Diluted weighted average shares outstanding | | | 11,232,059 | | | | 9,629,194 | | | | 7,656,308 | | | | 6,857,638 | | | | 5,757,540 | |
| | | | | |
BALANCE SHEET DATA: | | | | | | | | | | | | | | | | | | | | |
Assets | | $ | 1,077,102 | | | $ | 871,521 | | | $ | 753,779 | | | $ | 608,896 | | | $ | 494,800 | |
Total loans, net | | | 650,608 | | | | 510,167 | | | | 435,320 | | | | 409,048 | | | | 329,666 | |
Total deposits | | | 892,806 | | | | 717,337 | | | | 659,630 | | | | 538,235 | | | | 441,462 | |
Short-term borrowings | | | 52,792 | | | | 42,811 | | | | 24,627 | | | | 17,465 | | | | 10,005 | |
Corporate debenture | | | 10,000 | | | | 10,000 | | | | 10,000 | | | | 10,000 | | | | — | |
Shareholders’ equity | | | 117,332 | | | | 97,241 | | | | 57,664 | | | | 41,963 | | | | 39,915 | |
Tangible capital | | | 104,386 | | | | 92,087 | | | | 52,438 | | | | 36,651 | | | | 34,868 | |
Goodwill | | | 9,863 | | | | 4,675 | | | | 4,675 | | | | 4,675 | | | | 4,308 | |
Core deposit intangible (CDI) | | | 3,083 | | | | 479 | | | | 551 | | | | 637 | | | | 739 | |
Average total assets | | | 981,640 | | | | 808,177 | | | | 673,669 | | | | 550,866 | | | | 374,008 | |
Average loans, net | | | 598,106 | | | | 476,676 | | | | 415,864 | | | | 370,029 | | | | 258,232 | |
Average interest earning assets | | | 894,286 | | | | 744,298 | | | | 618,589 | | | | 503,292 | | | | 343,541 | |
Average deposits | | | 807,471 | | | | 678,149 | | | | 584,442 | | | | 488,952 | | | | 340,123 | |
Average interest bearing deposits | | | 610,732 | | | | 496,046 | | | | 445,358 | | | | 393,528 | | | | 277,466 | |
Average interest bearing liabilities | | | 670,562 | | | | 544,663 | | | | 481,468 | | | | 412,457 | | | | 281,651 | |
Average shareholders’ equity | | | 109,794 | | | | 78,037 | | | | 51,340 | | | | 40,955 | | | | 28,581 | |
24
Selected Consolidated Financial Data - continued
December 31
| | | | | | | | | | | | | | | |
(Dollars in thousands except for share and per share data) | | 2006 | | | 2005 | | | 2004 | | | 2003 | | | 2002 | |
SELECTED FINANCIAL RATIOS: | | | | | | | | | | | | | | | |
Return on average assets | | 0.86 | % | | 0.78 | % | | 0.65 | % | | 0.48 | % | | 0.63 | % |
Return on average equity | | 7.70 | % | | 8.11 | % | | 8.52 | % | | 6.41 | % | | 8.29 | % |
Dividend payout | | 18 | % | | 19 | % | | 21 | % | | 28 | % | | 24 | % |
Efficiency (1) | | 68 | % | | 67 | % | | 76 | % | | 76 | % | | 75 | % |
Net interest margin (2) | | 4.15 | % | | 3.84 | % | | 3.43 | % | | 3.63 | % | | 4.12 | % |
Net interest spread (3) | | 3.33 | % | | 3.26 | % | | 3.06 | % | | 3.30 | % | | 3.68 | % |
| | | | | |
CAPITAL RATIOS: | | | | | | | | | | | | | | | |
Tier 1 leverage ratio | | 11.23 | % | | 12.35 | % | | 8.60 | % | | 7.84 | % | | 8.54 | % |
Risk-based capital | | | | | | | | | | | | | | | |
Tier 1 | | 15.60 | % | | 18.10 | % | | 13.40 | % | | 11.30 | % | | 9.95 | % |
Total | | 16.60 | % | | 19.23 | % | | 14.61 | % | | 12.48 | % | | 11.16 | % |
Average equity to average assets | | 11.18 | % | | 9.66 | % | | 7.62 | % | | 7.43 | % | | 7.64 | % |
| | | | | |
ASSET QUALITY RATIOS: | | | | | | | | | | | | | | | |
Net charge-offs to average loans | | 0.08 | % | | 0.05 | % | | 0.07 | % | | 0.12 | % | | 0.13 | % |
Allowance to period end loans | | 1.12 | % | | 1.26 | % | | 1.29 | % | | 1.17 | % | | 1.22 | % |
Allowance for loan losses to non-performing loans | | 1,206 | % | | 430 | % | | 634 | % | | 366 | % | | 290 | % |
Non-performing assets to total assets | | 0.06 | % | | 0.18 | % | | 0.17 | % | | 0.27 | % | | 0.30 | % |
| | | | | |
OTHER DATA: | | | | | | | | | | | | | | | |
Banking locations | | 30 | | | 26 | | | 25 | | | 25 | | | 21 | |
Full-time equivalent employees | | 320 | | | 275 | | | 257 | | | 254 | | | 233 | |
| (1) | Efficiency ratio is non-interest expense divided by the sum of net interest income before the provision for loan losses plus non-interest income, exclusive of non-recurring income. |
| (2) | Net interest margin is net interest income divided by total average earning assets. |
| (3) | Net interest spread is the difference between the average yield on earning assets and the average yield on average interest bearing liabilities. |
25
Quarterly Financial Information
The following table sets forth, for the periods indicated, certain consolidated quarterly financial information. This information is derived from our unaudited financial statements which include, in the opinion of management, all normal recurring adjustments which management considers necessary for a fair presentation of the results for such periods. The sum of the four quarters of earnings per share might not equal the total earnings per share for the full year due to rounding. This information should be read in conjunction with our consolidated financial statements and the notes thereto included elsewhere in this document. The results for any quarter are not necessarily indicative of results for future periods. Historical earnings per share data have been adjusted to reflect our May 2006 two for one stock split.
Selected Quarterly Data
(Dollars are in thousands)
| | | | | | | | | | | | | | | | | | | | | | | | | | | | | | | | |
(Dollars in thousands except for per share data) | | 2006 | | | 2005 | |
| | 4Q | | | 3Q | | | 2Q | | | 1Q | | | 4Q | | | 3Q | | | 2Q | | | 1Q | |
Interest income | | $ | 16,264 | | | $ | 15,934 | | | $ | 14,724 | | | $ | 12,191 | | | $ | 11,395 | | | $ | 10,624 | | | $ | 9,561 | | | $ | 8,686 | |
Interest expense | | | (6,642 | ) | | | (6,298 | ) | | | (5,143 | ) | | | (3,927 | ) | | | (3,440 | ) | | | (3,125 | ) | | | (2,744 | ) | | | (2,413 | ) |
| | | | | | | | | | | | | | | | | | | | | | | | | | | | | | | | |
Net interest income | | | 9,622 | | | | 9,636 | | | | 9,581 | | | | 8,264 | | | | 7,955 | | | | 7,499 | | | | 6,817 | | | | 6,273 | |
Provision for loan losses | | | (142 | ) | | | (129 | ) | | | (206 | ) | | | (240 | ) | | | (270 | ) | | | (255 | ) | | | (255 | ) | | | (285 | ) |
| | | | | | | | | | | | | | | | | | | | | | | | | | | | | | | | |
Net interest income after | | | | | | | | | | | | | | | | | | | | | | | | | | | | | | | | |
Provision for loan losses | | | 9,480 | | | | 9,507 | | | | 9,375 | | | | 8,024 | | | | 7,685 | | | | 7,244 | | | | 6,562 | | | | 5,988 | |
Non-interest income | | | 1,584 | | | | 1,550 | | | | 1,490 | | | | 1,495 | | | | 1,316 | | | | 1,416 | | | | 1,310 | | | | 1,341 | |
Securities gain (loss) | | | — | | | | — | | | | 17 | | | | — | | | | (3 | ) | | | — | | | | — | | | | — | |
Non-interest expenses | | | (7,854 | ) | | | (7,463 | ) | | | (7,297 | ) | | | (6,590 | ) | | | (6,117 | ) | | | (5,784 | ) | | | (5,583 | ) | | | (5,321 | ) |
| | | | | | | | | | | | | | | | | | | | | | | | | | | | | | | | |
Income before income tax expense | | | 3,210 | | | | 3,594 | | | | 3,585 | | | | 2,929 | | | | 2,881 | | | | 2,876 | | | | 2,289 | | | | 2,008 | |
Income tax expense | | | (1,019 | ) | | | (1,343 | ) | | | (1,378 | ) | | | (1,119 | ) | | | (1,046 | ) | | | (1,075 | ) | | | (857 | ) | | | (746 | ) |
| | | | | | | | | | | | | | | | | | | | | | | | | | | | | | | | |
Net income | | $ | 2,191 | | | $ | 2,251 | | | $ | 2,207 | | | $ | 1,810 | | | $ | 1,835 | | | $ | 1,801 | | | $ | 1,432 | | | $ | 1,262 | |
| | | | | | | | | | | | | | | | | | | | | | | | | | | | | | | | |
Basic earnings per common share | | $ | 0.20 | | | $ | 0.20 | | | $ | 0.20 | | | $ | 0.17 | | | $ | 0.175 | | | $ | 0.17 | | | $ | 0.175 | | | $ | 0.155 | |
Diluted earnings per common share | | $ | 0.19 | | | $ | 0.20 | | | $ | 0.19 | | | $ | 0.17 | | | $ | 0.170 | | | $ | 0.17 | | | $ | 0.165 | | | $ | 0.150 | |
| Item 7. | Management’s Discussion and Analysis of Financial Condition and Results of Operations |
Some of the statements in this report constitute forward-looking statements, within the meaning of the Private Securities Litigation Reform Act of 1995 and the Securities Exchange Act of 1934. These statements related to future events, other future financial performance or business strategies, and include statements containing terminology such as “may,” “will,” “should,” “expects,” “scheduled,” “plans,” “intends,” “anticipates,” “believes,” “estimates,” “potential,” or “continue” or the negative of such terms or other comparable terminology. Actual events or results may differ materially from the results anticipated in these forward looking statements, due to a variety of factors, including, without limitation: the effects of future economic conditions; governmental monetary and fiscal policies, as well as legislative and regulatory changes; the risks of changes in interest rates and the level and composition of deposits, loan demand, and the values of loan collateral; and the effects of competition from other commercial banks, thrifts, consumer finance companies, and other financial institutions operating in our market area and elsewhere. All forward looking statements attributable to our Company are expressly qualified in their entirety by these cautionary statements. We disclaim any intent or obligation to update these forward looking statements, whether as a result of new information, future events or otherwise. There is no assurance that future results, levels of activity, performance or goals will be achieved.
26
Our discussion and analysis of earnings and related financial data are presented herein to assist investors in understanding the financial condition of our Company at December 31, 2006 and 2005, and the results of operations for the years ended December 31, 2006, 2005 and 2004. This discussion should be read in conjunction with the consolidated financial statements and related footnotes of our Company presented elsewhere herein. Historical per share data has been adjusted to reflect our May 2006 two for one stock split.
Executive Summary
Our consolidated financial statements include the accounts of CenterState Banks of Florida, Inc. (the “Parent Company,” “CenterState” or “CSFL”), and our four wholly owned subsidiary banks. Our four wholly owned subsidiary banks include the accounts of their wholly owned subsidiary, C. S. Processing, Inc.
Our subsidiary banks operate through 30 locations in eight counties throughout Central Florida, providing traditional deposit and lending products and services to its commercial and retail customers. C.S. Processing is a wholly owned subsidiary, which provides item processing services and certain information technology services for our subsidiary banks.
During January 2006, we combined two of our subsidiary banks, First National Bank of Polk County and CenterState Bank of Florida. The combined bank operates under the name CenterState Bank of Florida, National Association (“CSB”). Both banks operated in Polk County, Florida. The two banks were geographically close and their market overlaps continued to grow. The proximity of the two banks led to some confusion with customers and operating inefficiencies.
At the close of business on March 31, 2006, we closed on our acquisition of CenterState Bank Mid Florida (“Mid FL”). We acquired 100% of the outstanding common stock of Mid FL (1,000,050 shares) for a combination of cash and stock. Specifically, each share of Mid FL common stock was exchangeable for $4.35 cash and 0.2774 shares of CSFL common stock, resulting in a purchase price of $14,559,000, based on CSFL share price as of the transaction date. Other costs included the value of the employee stock options acquired (approximately $760,000) and transaction expenses of approximately $279,000. The resulting transaction resulted in additional goodwill and core deposit intangible of approximately $5,188,000 and $3,118,000, respectively.
During the second quarter of this year, our Osceola County bank changed its name from First National Bank of Osceola County, N.A. to CenterState Bank Central Florida, N.A. (“Central”). This was our last bank that did not have the word CenterState in its name. During this same quarter, we split our stock two for one, effectively doubling the number of our common shares outstanding. All historical per share data included in this document has been adjusted to reflect the split.
On June 30, 2006, we reported that our Company will be included in the Russell 3000® Index as well as the small-cap Russell 2000® Index when Russell Investment Group reconstituted its family of U.S. indexes on June 30, 2006. Membership in the Russell 3000®, which remains in place for one year, means automatic inclusion in the large-cap Russell 1000® or small-cap Russell 2000® Index as well as the appropriate growth and style indexes. Russell determines membership for its equity indexes primarily by objective market capitalization rankings and style attributes. Russell indexes are widely used by investment managers and institutional investors for index funds and as benchmarks for both passive and active investment strategies.
27
During October of this year, we closed two of our four “freedom offices.” These are small offices located inside gated active adult communities in central Florida. Each office was usually located in a small room or area of the community’s “club house,” and catered to the needs of that particular community. Two of the four are very successful. The other two have not performed as well. Consequently, we closed those two locations during October 2006. The two offices combined had total deposits of less than $1,500,000, which were transferred to another branch office. The loss related to disposition of leasehold improvements and certain other fixed assets associated with these two offices was expensed during the fourth quarter of this year and totaled approximately $30,000.
During September, we opened a new branch office in Lake County (Eustis, Florida area) in a temporary location. Land has been purchased for the construction of a new permanent facility, which is expected to be completed sometime in 2007. During October, we opened our newly constructed branch office in Polk County (south of Lakeland, Florida) and opened a second new branch office in Polk County in a temporary facility on U.S. Highway 27 near Interstate 4. We have begun construction on a permanent facility, which we expect to complete late in 2007.
We also have another branch office under construction in Osceola County (St. Cloud, Florida area) which is expected to be completed during the first quarter of 2007. We also have several other site locations that we have purchased or are in the process of purchasing for future branches in 2007 and 2008.
At December 31, 2006, CenterState operated through our four subsidiary Banks with 30 banking locations in eight Counties in central Florida as summarized in the table below:
| | | | |
Subsidiary Banks | | No. of locations | | Counties |
CenterState Bank Central Florida (“Central”) | | 6 | | Osceola, Orange |
CenterState Bank West Florida (“CSWFL”) | | 8 | | Pasco, Hernando, Citrus, Sumter |
CenterState Bank of Florida (“CSB”) | | 12 | | Polk |
CenterState Bank Mid Florida (“Mid FL”) | | 4 | | Lake |
During November we entered into a definitive agreement to purchase Valrico Bancorp, Inc. (“VBI”) and it’s wholly owned subsidiary Valrico State Bank for a combination of cash and stock. Each VBI shareholder of record will have an option to elect payment in stock, cash or a combination of stock and cash, but in no event will more than 1,333,741 CSFL common shares (70%) nor less than 1,238,475 CSFL common shares (65%) be issued in the aggregate. VBI shareholders electing CSFL stock consideration will be entitled to receive 5.25 shares of CSFL common stock for each share of VBI common stock exchanged. Those electing cash consideration will be entitled to receive $105.06 for each share of VBI common stock exchanged. VBI is a one bank holding company operating through its subsidiary, Valrico State Bank (the “Bank”). The Bank opened for business in 1989 and operates through four banking locations in Hillsborough County, Florida. At December 31, 2006, VBI reported total consolidated assets of approximately $150,000,000. The transaction is expected to close in April of 2007, subject to regulatory approval and approval by VBI shareholders. We intend to operate the Bank as a separate wholly owned subsidiary, similar to our other subsidiary Banks. We believe the transaction will be neutral to earnings in year one and accretive in year two.
Our Company’s principal asset is its ownership of the Banks. Accordingly, our consolidated results of operations are primarily dependent upon the results of operations of the Banks. Through our subsidiary Banks, we conduct commercial banking business consisting of attracting deposits from the general public and applying those funds to the origination of commercial, consumer and real estate loans (including commercial loans collateralized by real estate). Our profitability depends primarily on net interest income, which is the difference between interest income generated from interest-earning assets (i.e.
28
loans and investments) less the interest expense incurred on interest-bearing liabilities (i.e. customer deposits and borrowed funds). Net interest income is affected by the relative amounts of interest-earning assets and interest-bearing liabilities, and the interest rate earned and paid on these balances. Net interest income is dependent upon the interest rate spread which is the difference between the average yield earned on our interest-earning assets and the average rate paid on our interest-bearing liabilities. When interest-earning assets approximate or exceed interest-bearing liabilities, any positive interest rate spread will generate net interest income. The interest rate spread is impacted by interest rates, deposit flows, and loan demand. Additionally, and to a lesser extent, our profitability is affected by such factors as the level of non-interest income and expenses, the provision for credit losses, and the effective tax rate. Non-interest income consists primarily of service fees on deposit accounts and related services, and to a lesser extent commission earned on brokering single family home loans, and commissions earned on the sale of mutual funds, annuities and other non traditional and non insured investments. Non-interest expense consists of compensation, employee benefits, occupancy and equipment expenses, and other operating expenses.
Critical Accounting Policies
Our accounting policies are integral to understanding the results reported. Accounting policies are described in detail in Note 1 of the notes to the consolidated financial statements. The critical accounting policies require management’s judgment to ascertain the valuation of assets, liabilities, commitments and contingencies. We have established policies and control procedures that are intended to ensure valuation methods are well controlled and applied consistently from period to period. In addition, the policies and procedures are intended to ensure that the process for changing methodologies occurs in an appropriate manner. The following is a brief description of our current accounting policies involving significant management valuation judgments.
Allowance for Loan Losses
The allowance for loan losses represents our estimate of losses inherent in the existing loan portfolio. The allowance for loan losses is increased by the provision for loan losses charged to expense and reduced by loans charged off, net of recoveries. The allowance for loan losses is determined based on our assessment of several factors: reviews and evaluation of individual loans, changes in the nature and volume of the loan portfolio, current economic conditions and the related impact on specific borrowers and industry concentrations, historical loan loss experiences and the level of classified and nonperforming loans.
Changes in the financial condition of individual borrowers, in economic conditions, in historical loss experience and in the condition of the various markets in which collateral may be sold may all affect the required level of the allowance for loan losses and the associated provision for loan losses.
A standardized loan grading system is utilized at each of our subsidiary Banks. The grading system is integral to our risk assessment function related to lending. Loan officers of each Bank assign a loan grade to their newly originated loans in accordance with the standard loan grades. Throughout the lending relationship, the loan officer is responsible for periodic reviews, and if warranted he/she will downgrade or upgrade a particular loan based on specific events and/or analyses. We use a loan grading system of 1 through 7. Grade 1 is “excellent” and grade 7 is “doubtful.” Loans graded 5 or higher are placed on a watch list each month end and reported to that particular Bank’s board of directors. The Company’s loan review officer, who is independent of the lending function and is not an employee of any subsidiary bank, periodically reviews each Bank’s loan portfolio and lending relationships. He may disagree with a particular Bank’s grade on a particular loan and subsequently downgrade or upgrade such loan(s) based on his risk analysis. As such, our lending process is decentralized, but our credit review process is centralized.
29
We maintain an allowance for loan losses that we believe is adequate to absorb probable losses inherent in our loan portfolio. The allowance consists of two components. The first component consists of amounts reserved for impaired loans, as defined by Statement of Financial Accounting Standard No. 114. Impaired loans are those loans that management has estimated will not repay as agreed upon. Each of these loans is required to have a written analysis supporting the amount of specific reserve allocated to the particular loan, if any. That is to say, a loan may be impaired (i.e. not expected to repay as agreed), but may be sufficiently collateralized such that we expect to recover all principle and interest eventually, and therefore no specific reserve is warranted.
The second component is a general reserve on all of the Company’s loans other than those identified as impaired. We group these loans into categories with similar characteristics and then apply a loss factor to each group which is derived from our historical loss factor for that category adjusted for current internal and external environmental factors, as well as for certain loan grading factors. The aggregate of these two components results in our total allowance for loan losses.
Goodwill and Intangible Assets
Goodwill represents the excess of cost over fair value of assets of business acquired. Goodwill and intangible assets acquired in a purchase business combination and determined to have an indefinite useful life are not amortized, but instead tested for impairment at least annually. Intangible assets with estimable useful lives are amortized over their respective estimated useful lives to their estimated residual values. We acquired CenterState Bank of Florida, in Winter Haven, Florida, on December 31, 2002 and CenterState Bank Mid Florida on March 31, 2006. Consequently, we were required to record the assets acquired, including identified intangible assets, and liabilities assumed at their fair value, which involves estimates based on third party valuations, such as appraisals, internal valuations based on discounted cash flow analyses or other valuation techniques. The determination of the useful lives of intangible assets is subjective as is the appropriate amortization period for such intangible assets. In addition, purchase acquisitions typically result in recording goodwill, which is subject to ongoing periodic impairment tests based on the fair value of net assets acquired compared to the carrying value of goodwill. In November 2006, the required impairment testing of goodwill was performed and no impairment existed as of the valuation date, as the fair value of our net assets exceeded their carrying value. If for any future period we determine that there has been impairment in the carrying value of our goodwill balances, we will record a charge to our earnings, which could have a material adverse effect on our net income. Goodwill and intangible assets are described further in Note 5 of the notes to the consolidated financial statements.
Stock Based Compensation
Effective January 1, 2006, with the adoption of Statement of Financial Accounting Standard No. 123(R), Share-based Payment, we began to include, as an expense, the estimated value of stock options we grant, in our consolidated statement of operations. Prior to this date, we disclosed this estimated cost and related information in the notes to our consolidated financial statements, consistent with Accounting Principle Board Opinion No. 25.
We estimate the value of options that we grant using the fair value method and the Black-Scholes option pricing model. Under the fair value method, stock option expense is measured on the date of grant using the Black-Scholes option pricing model with market assumptions. Option pricing models require the
30
use of highly subjective assumptions, including expected stock price volatility, which when changed can materially affect fair value estimates. Accordingly, the model produces an estimate of the fair value of our stock options and not a single definitive measure of fair value. We are required to record compensation cost for stock options provided to employees in return for employee service. The cost is measured at the fair value of the options when granted, and this cost is expensed over the employee service period, which generally is the vesting period of the options. This applies to awards granted or modified after the first fiscal year beginning after June 15, 2005. Compensation cost is also recorded for prior option grants that vest after the date of adoption. Stock based compensation is described further in Note 1(n) and Note 15 of the notes to our consolidated financial statements.
COMPARISON OF RESULTS OF OPERATIONS FOR THE YEARS ENDED DECEMBER 31, 2006 AND DECEMBER 31, 2005.
Net Income
Our net income for the year ended December 31, 2006 was $8,459,000 or $0.77 per share (basic) and $0.75 per share (diluted), compared to $6,330,000 or $0.675 per share (basic) and $0.655 per share (diluted) for the year ended December 31, 2005.
Our return on average assets (“ROA”) and return on average equity (“ROE”) for the year ended December 31, 2006 were 0.86% and 7.70%, as compared to the ROA and ROE of 0.78% and 8.11%, for the year ended December 31, 2005.
Net income increased approximately $2,129,000 or 34% to $8,459,000 for the year ended December 31, 2006, compared to $6,330,000 for the same period during 2005. Earnings per share (basic) increased by $0.095, or 14% during this same period. We acquired the Mid FL bank on March 31, 2006. Therefore, nine months of Mid FL net income (approximately $496,000) was included in our 2006 consolidated net income amount. Average shares outstanding during 2006 issued pursuant to the Mid FL transaction was approximately 416,000. Basic earnings per share, $0.77, would be reduced to approximately $0.75 without Mid FL. Mid FL appears to have been accretive to our basic earnings per share in 2006 by approximately $0.02. All remaining growth in net income and earnings per share resulted from the continuing growth of our business, helped out by expansion in our net interest margin in 2006 compared to 2005 (4.15% versus 3.84%). The significant line items contributing to our 2006 net income compared to 2005 are discussed below.
Net Interest Income/Margin
Net interest income consists of interest income generated by earning assets, less interest expense.
Net interest income increased $8,559,000 or 30% to $37,103,000 during the year ended December 31, 2006 compared to $28,544,000 for the year ended December 31, 2005. The $8,559,000 increase was a combination of a $18,847,000 increase in interest income offset by a $10,288,000 increase in interest expense.
Average interest earning assets increased $149,988,000 to $894,286,000 during the year ended December 31, 2006, compared to $744,298,000 for the year ended December 31, 2005. Comparing these same two periods, the yield on average interest earning assets increased from 5.41% in 2005 to 6.61% in 2006. The increase in volume had a positive effect on the change in interest income ($9,878,000 volume variance), and the increase in yields also had a positive effect on the change in interest income ($8,969,000 rate variance). The result was an $18,847,000 increase in interest income.
31
Average interest bearing liabilities increased $125,899,000 to $670,562,000 during the year ended December 31, 2006, compared to $544,663,000 for the year ended December 31, 2005. Comparing these same two periods, the cost of average interest bearing liabilities increased from 2.15% in 2005 to 3.28% in 2006. The increase in volume resulted in an increase in interest expense ($4,830,000 volume variance), and the increase in yields also resulted in an increase in interest expense ($5,458,000 rate variance). The result was a total increase of $10,288,000 in interest expense. See the tables “Average Balances – Yields & Rates,” and “Analysis Of Changes In Interest Income And Expenses” below.
Average Balances – Yields & Rates
(Dollars are in thousands)
| | | | | | | | | | | | | | | | | | | | |
| | | Years Ended December 31, | |
| | | 2006 | | | 2005 | |
| | | Average Balance | | | Interest Inc / Exp | | Average Rate | | | Average Balance | | | Interest Inc / Exp | | Average Rate | |
ASSETS: | | | | | | | | | | | | | | | | | | | | |
Federal funds sold & money market | | $ | 60,377 | | | $ | 2,991 | | 4.95 | % | | $ | 53,701 | | | $ | 1,641 | | 3.06 | % |
Securities available for sale (7) | | | 228,673 | | | | 9,653 | | 4.22 | % | | | 207,778 | | | | 6,101 | | 2.94 | % |
Loans (1) (2) (7) | | | 605,236 | | | | 46,469 | | 7.68 | % | | | 482,819 | | | | 32,524 | | 6.74 | % |
| | | | | | | | | | | | | | | | | | | | |
TOTAL EARNING ASSETS | | $ | 894,286 | | | $ | 59,113 | | 6.61 | % | | $ | 744,298 | | | $ | 40,266 | | 5.41 | % |
Allowance for loan losses | | | (7,130 | ) | | | | | | | | | (6,143 | ) | | | | | | |
All other assets | | | 94,484 | | | | | | | | | | 70,022 | | | | | | | |
| | | | | | | | | | | | | | | | | | | | |
TOTAL ASSETS | | $ | 981,640 | | | | | | | | | $ | 808,177 | | | | | | | |
| | | | | | | | | | | | | | | | | | | | |
LIABILITIES & SHAREHOLDERS’ EQUITY: | | | | | | | | | | | | | | | | | | | | |
Deposits: | | | | | | | | | | | | | | | | | | | | |
Now | | $ | 100,268 | | | $ | 659 | | 0.66 | % | | | 99,909 | | | | 317 | | 0.32 | % |
Money market | | | 106,707 | | | | 2,651 | | 2.48 | % | | | 105,625 | | | | 1,505 | | 1.42 | % |
Savings | | | 48,053 | | | | 343 | | 0.71 | % | | | 48,739 | | | | 201 | | 0.41 | % |
Time deposits | | | 355,704 | | | | 15,337 | | 4.31 | % | | | 241,773 | | | | 7,988 | | 3.30 | % |
Repurchase agreements | | | 49,830 | | | | 2,156 | | 4.33 | % | | | 38,210 | | | | 1,013 | | 2.65 | % |
Other borrowed funds (3) | | | — | | | | — | | — | | | | 407 | | | | 16 | | 3.93 | % |
Corporate debenture (4) | | | 10,000 | | | | 864 | | 8.64 | % | | | 10,000 | | | | 682 | | 6.82 | % |
| | | | | | | | | | | | | | | | | | | | |
TOTAL INTEREST BEARING LIABILITIES | | $ | 670,562 | | | $ | 22,010 | | 3.28 | % | | | 544,663 | | | $ | 11,722 | | 2.15 | % |
Demand deposits | | | 196,739 | | | | | | | | | | 182,103 | | | | | | | |
Other liabilities | | | 4,545 | | | | | | | | | | 3,374 | | | | | | | |
Shareholders’ equity | | | 109,794 | | | | | | | | | | 78,037 | | | | | | | |
| | | | | | | | | | | | | | | | | | | | |
TOTAL LIABILITIES AND SHAREHOLDERS’ EQUITY | | $ | 981,640 | | | | | | | | | $ | 808,177 | | | | | | | |
| | | | | | | | | | | | | | | | | | | | |
NET INTEREST SPREAD (5) | | | | | | | | | 3.33 | % | | | | | | | | | 3.26 | % |
| | | | | | | | | | | | | | | | | | | | |
NET INTEREST INCOME | | | | | | $ | 37,103 | | | | | | | | | $ | 28,544 | | | |
| | | | | | | | | | | | | | | | | | | | |
NET INTEREST MARGIN (6) | | | | | | | | | 4.15 | % | | | | | | | | | 3.84 | % |
| | | | | | | | | | | | | | | | | | | | |
| (1) | Loan balances are net of deferred fees/cost of origination. |
| (2) | Interest income on average loans includes fee recognition of $521,000 and $269,000 for the years ended December 31, 2006 and 2005, respectively. |
| (3) | Includes short-term (usually overnight) Federal Home Loan Bank advances and Federal Funds Purchased. |
| (4) | Includes amortization of origination costs of $38,000 and $38,000 during year ended December 31, 2006 and 2005, respectively. |
| (5) | Represents the average rate earned on interest earning assets minus the average rate paid on interest bearing liabilities. |
| (6) | Represents net interest income divided by total earning assets. |
| (7) | The average rates have not been presented on a tax equivalent basis, as this amount is not deemed material. |
32
Analysis of Changes in Interest Income and Expenses
(Dollars are in thousands)
| | | | | | | | | | | |
| | | Net Change Dec 31, 2006 versus 2005 | |
| | | Volume | | | Rate | | Net Change | |
INTEREST INCOME | | | | | | | | | | | |
Federal funds sold and money market | | $ | 225 | | | $ | 1,125 | | $ | 1,350 | |
Securities available for sale | | | 664 | | | | 2,888 | | | 3,552 | |
Loans | | | 8,989 | | | | 4,956 | | | 13,945 | |
| | | | | | | | | | | |
TOTAL INTEREST INCOME | | $ | 9,878 | | | $ | 8,969 | | $ | 18,847 | |
| | | | | | | | | | | |
INTEREST EXPENSE | | | | | | | | | | | |
Deposits | | | | | | | | | | | |
NOW accounts | | $ | 1 | | | $ | 341 | | $ | 342 | |
Money market accounts | | | 16 | | | | 1,130 | | | 1,146 | |
Savings | | | (3 | ) | | | 145 | | | 142 | |
Time deposits | | | 4,461 | | | | 2,888 | | | 7,349 | |
Repurchase agreements | | | 371 | | | | 772 | | | 1,143 | |
Other borrowed funds | | | (16 | ) | | | — | | | (16 | ) |
Corporate debenture | | | — | | | | 182 | | | 182 | |
| | | | | | | | | | | |
TOTAL INTEREST EXPENSE | | $ | 4,830 | | | $ | 5,458 | | $ | 10,288 | |
| | | | | | | | | | | |
NET INTEREST INCOME | | $ | 5,048 | | | $ | 3,511 | | $ | 8,559 | |
| | | | | | | | | | | |
The table above details the components of the changes in net interest income for the last two years. For each major category of interest earning assets and interest bearing liabilities, information is provided with respect to changes due to average volume and changes due to rates, with the changes in both volumes and rates allocated to these two categories based on the proportionate absolute changes in each category.
Provision for Loan Losses
The provision for loan losses is charged to earnings to bring the total loan loss allowance to a level deemed appropriate by management and is based upon historical experience, the volume and type of lending conducted by us, the amount of nonperforming loans, general economic conditions, particularly as they relate to our market areas, and other environmental factors related to the collectibility of our loan portfolio. As these factors change, the level of loan loss allowance changes. As such, the provision for loan loss (income statement) is the difference between the loan loss allowance (balance sheet) at the beginning and end of the period, net of current period loan charge-offs and recoveries of previously charged off loans. The provision was $717,000 for the year ending December 31, 2006 compared to $1,065,000 for the same period in 2005, a decrease of $348,000. There were several factors effecting the provision period to period (e.g.net differences in net charge-offs and recoveries), however, the primary reason for the decrease in the provision between the periods was due to a decrease in specific reserves on impaired loans of $645,000. The specific reserve on impaired loans at December 31, 2006 was $372,000 compared to $1,017,000 at December 31, 2005.
33
Non-Interest Income
Non-interest income for the year ended December 31, 2006 was $6,136,000 compared to $5,380,000 for the comparable period in 2005. This increase was the result of the following components listed in the table below (Amounts listed are in thousands of dollars).
| | | | | | | | | | | | | | |
(in thousands of dollars) | | 2006 | | 2005 | | | $
Increase
(decrease) | | | %
increase
(decrease) | |
Service charges on deposit accounts | | $ | 3,401 | | $ | 3,222 | | | $ | 179 | | | 5.6 | % |
Commissions from mortgage broker activities | | | 341 | | | 499 | | | | (158 | ) | | (31.7 | %) |
Loan related fees | | | 315 | | | 283 | | | | 32 | | | 11.3 | % |
Commissions from sale of mutual funds and annuities | | | 695 | | | 321 | | | | 374 | | | 116.5 | % |
Rental income | | | 203 | | | 203 | | | | — | | | — | % |
Debit card and ATM fees | | | 592 | | | 508 | | | | 84 | | | 16.5 | % |
BOLI income | | | 277 | | | 43 | | | | 234 | | | 544.2 | % |
Other service charges and fees | | | 248 | | | 298 | | | | (50 | ) | | (16.8 | %) |
Gain (loss) on sale of fixed assets | | | 47 | | | (2 | ) | | | 49 | | | n/a | |
Gain (loss) on sale of securities | | | 17 | | | (3 | ) | | | 20 | | | n/a | |
Gain on sale of other real estate owned | | | — | | | 8 | | | | (8 | ) | | n/a | |
| | | | | | | | | | | | | | |
Total non-interest income | | $ | 6,136 | | $ | 5,380 | | | $ | 756 | | | 14.1 | % |
| | | | | | | | | | | | | | |
Our general business growth helped increase fee income in general. Mid FL’s non-interest income is included in 2006 income, but not 2005. Mid Florida’s total non interest income contribution for 2006 was approximately $214,000, of which about $117,000 relates to service charges on deposit accounts. Partially off-setting these increasing effects on our deposit account service charges were rising interest rates and the related effect on the earnings credit on our commercial (business) checking accounts. That is, as interest rates rise, the earnings credit on checking accounts has increased thereby reducing checking account service fees, producing a decreasing effect in service charges on deposit accounts. Another off-setting decreasing effect on deposit account service charges was the merger of two of our subsidiary banks in January 2006. One of the banks had been charging customers for checking accounts (i.e. non-business checking accounts). Subsequent to the merger, that product has been changed to free checking, which produced a decreasing effect on service charges on deposit accounts. The reason we changed to free checking was to conform to our other banks and to better align ourselves to the local competition.
We purchased the majority of our Bank Owned Life Insurance (“BOLI”) on October 31, 2005. As such, we only had two months of income in 2005, compared to twelve months of earnings in 2006. BOLI is single premium life insurance placed on certain Bank officers. BOLI income is recognized as the cash surrender value of the insurance policies grow. BOLI income is generally tax deferred indefinitely.
Commissions from mortgage broker activities is dependent on market place forces including supply and demand of single family residential property in our local markets, and the interest rate environment which primarily effects refinancing activity.
Sales of mutual funds and annuities are also dependent on market place forces including the successful efforts of our investment sales representatives.
34
Non-Interest Expense
Non-interest expense for the year ended December 31, 2006 increased $6,399,000, or 28%, to $29,204,000, compared to $22,805,000 for 2005. The table below breaks down the individual components. Amounts are in thousands of dollars.
| | | | | | | | | | | | | | | |
(in thousands of dollars) | | 2006 | | | 2005 | | | $ increase
(decrease) | | | %
increase
(decrease) | |
Employee salaries and wages | | $ | 12,063 | | | $ | 10,006 | | | $ | 2,057 | | | 20.6 | % |
Employee incentive/bonus compensation | | | 2,061 | | | | 1,233 | | | | 828 | | | 67.2 | % |
Employee stock option expense | | | 594 | | | | — | | | | 594 | | | n/a | |
Health insurance and other employee benefits | | | 1,760 | | | | 1,180 | | | | 580 | | | 49.2 | %. |
Payroll taxes | | | 932 | | | | 753 | | | | 179 | | | 23.8 | %. |
Other employee related expenses | | | 647 | | | | 448 | | | | 199 | | | 44.4 | %. |
Incremental direct cost of loan origination | | | (1,096 | ) | | | (997 | ) | | | (99 | ) | | 9.9 | % |
| | | | | | | | | | | | | | | |
Total salaries, wages and employee benefits | | $ | 16,961 | | | $ | 12,623 | | | $ | 4,338 | | | 34.4 | % |
| | | | |
Occupancy expense | | | 3,443 | | | | 2,780 | | | | 663 | | | 23.8 | % |
Depreciation of premises and equipment | | | 1,935 | | | | 1,642 | | | | 293 | | | 17.8 | % |
Supplies, stationary and printing | | | 607 | | | | 522 | | | | 85 | | | 16.3 | % |
Marketing expenses | | | 585 | | | | 447 | | | | 138 | | | 30.9 | % |
Data processing expense | | | 1,105 | | | | 961 | | | | 144 | | | 15.0 | % |
Legal, auditing and other professional fees | | | 673 | | | | 577 | | | | 96 | | | 16.6 | % |
Bank regulatory related expenses | | | 326 | | | | 316 | | | | 10 | | | 3.2 | % |
Postage and delivery | | | 276 | | | | 270 | | | | 6 | | | 2.2 | % |
ATM related expenses | | | 434 | | | | 399 | | | | 35 | | | 8.8 | % |
CDI amortization | | | 514 | | | | 72 | | | | 442 | | | 613.9 | % |
Other expenses | | | 2,345 | | | | 2,196 | | | | 149 | | | 6.8 | % |
| | | | | | | | | | | | | | | |
Total non-interest expense | | $ | 29,204 | | | $ | 22,805 | | | $ | 6,399 | | | 28.1 | % |
| | | | | | | | | | | | | | | |
The most significant component when comparing current year non interest expense to prior year is the March 31, 2006 acquisition of Mid FL. Mid FL non interest expense is included in the current year but not in 2005. Mid FL’s total 2006 non interest expense was approximately $2,292,000. Excluding Mid FL, our net increase would adjust from $6,399,000, or 28.1%, to $4,107,000, or 18.0% ($6,399,000 minus $2,292,000).
Our largest non-interest expense is employee and employee related expenses. Total salaries, wages and employee benefits for 2006 accounted for 58% of our total non-interest expense (57% excluding stock option expense), compared to 55% for 2005. Effective January 1, 2006, we were required to expense employee stock options pursuant to Statement of Financial Accounting Standard No. 123(R). Prior to 2006, we were not required to record an estimated expense for stock options in our financial statements. We recorded an expense of $594,000 in 2006, which was approximately 2% of our total non interest expense.
Looking at the table above, employee salaries and wages increased by 20.6% to $12,063,000 for 2006, compared to $10,006,000 for 2005. To analyze this $2,057,000 increase, removing the Mid FL component of salary expense (approximately $799,000), results in an adjusted increase of $1,258,000, or 12.6%. This increase is a result of an increase in average FTEs (“full time equivalent employees”), exclusive of Mid FL (291 in 2006 compared to 266 in 2005), as well as salary increases commensurate with our market environment.
We use a combination of performance incentive / bonus guidelines to motivate our employees to perform. These are primarily all tied to earnings performance metrics. As our net income increases, our employee incentive/bonus compensation also increases.
35
Employee health insurance expense increased by $580,000, or 49.2% year to year as listed in the table above. Removing Mid FL employee health insurance expense (approximately $121,000 – Mid FL was not included in our 2005 expense) results in an adjusted increase of approximately $459,000, or 38.9%. Part of this increase is related to the increase in FTEs (exclusive of Mid FL FTEs), and the remaining amount is reflective of the increasing costs occurring in the health insurance industry.
Incremental direct cost of loan origination, represents direct incremental cost of originating loans for our portfolio (successful efforts) that are required to be capitalized and amortized to interest income over the life of the related loan pursuant to Statement of Financial Accounting Standard No. 91. The amount that we capitalize is dependent on not just the cost, but the volume of loans successfully originated.
We added one new branch in October 2005, which is currently operating out of a temporary location until we construct a new permanent facility. We opened a new office in September 2006 and one in October 2006, both in temporary facilities until we construct permanent facilities. We also opened a new branch in a newly constructed permanent facility in October 2006. This accounts for some of the additional FTEs year to year, the rest is due to the continual growth of our business. The increase in the remainder of our non-interest expense was primarily due to the continual growth of our business.
Income Tax Provision
The income tax provision for the year ended December 31, 2006, was $4,859,000, an effective tax rate of 36.5%, as compared to $3,724,000 for the year ended December 31, 2005, an effective tax rate of 37.0%. This year we had more tax exempt interest income from tax exempt securities than last year, which is a decreasing effect on our effective tax rate. We also had more BOLI income this year than last year, which is also tax exempt and also results in a decreasing effect on our effective tax rate. In the other direction, we had stock option expense this year relating to incentive stock options which are not tax deductible expenses, resulting in an increasing effect on our effective tax rate. This year we also crossed into a higher federal tax bracket, which is an increasing effect on our effective tax rate. Income taxes are described and discussed further in Note 10 of our notes to our consolidated financial statements.
COMPARISON OF RESULTS OF OPERATIONS FOR THE YEARS ENDED DECEMBER 31, 2005 AND DECEMBER 31, 2004.
Net Income
Our net income for the year ended December 31, 2005 was $6,330,000 or $0.675 per share (basic) and $0.655 per share (diluted), compared to $4,373,000 or $0.585 per share (basic) and $0.57 per share (diluted) for the year ended December 31, 2004. Exclusive of the non-recurring income relating to the gain from sale of branches, the net income for the year ended December 31, 2004 would have been $3,223,000 or $0.43 per share (basic) and $0.42 per share (diluted).
Our return on average assets (“ROA”) and return on average equity (“ROE”) for the year ended December 31, 2005 were 0.78% and 8.11%, as compared to the ROA and ROE of 0.65% and 8.52% (0.48% and 6.28% exclusive of non recurring income from the gain on sale of branches), for the year ended December 31, 2004. The efficiency ratios for the years ended December 31, 2005 and 2004 were 67% and 76%, respectively.
36
Net income increased approximately $1,957,000 or 45% to $6,330,000 ($3,107,000 or 96% increase, exclusive of non recurring income from the gain on sale of branches) for the year ended December 31, 2005, compared to $4,373,000 for the same period during 2004.
The table below provides a reconciliation between net income and net income exclusive of non recurring income resulting from the gain on sale of branches.
| | | | | | | | |
Amounts are in thousands of dollars, except per share data | | 2005 | | | 2004 | |
Net income | | $ | 6,330 | | | $ | 4,373 | |
Gain on sale of branches, net of tax $694 | | | — | | | | (1,150 | ) |
| | | | | | | | |
Net income exclusive of gain on sale of branches | | $ | 6,330 | | | $ | 3,223 | |
| | | | | | | | |
| | |
Earnings per share, basic | | $ | 0.675 | | | $ | 0.585 | |
Gain on sale of branches, net of tax $0.095 | | | — | | | | (0.155 | ) |
| | | | | | | | |
Earnings per share, basic, exclusive of gain on sale of branches | | $ | 0.675 | | | $ | 0.430 | |
| | | | | | | | |
| | |
Earnings per share, diluted | | $ | 0.655 | | | $ | 0.570 | |
Gain on sale of branches, net of tax $0.090 | | | — | | | | (0.150 | ) |
| | | | | | | | |
Earnings per share, diluted, exclusive of gain on sale of branches | | $ | 0.655 | | | $ | 0.420 | |
| | | | | | | | |
| | |
ROA | | | 0.78 | % | | | 0.65 | % |
Gain on sale of branches, net of taxes 0.10% | | | — | | | | (0.17 | )% |
| | | | | | | | |
ROA, exclusive of gain on sale of branches | | | 0.78 | % | | | 0.48 | % |
| | | | | | | | |
| | |
ROE | | | 8.11 | % | | | 8.52 | % |
Gain on sale of branches, net of taxes 1.35% | | | — | | | | (2.24 | )% |
| | | | | | | | |
ROE, exclusive of gain on sale of branches | | | 8.11 | % | | | 6.28 | % |
| | | | | | | | |
The primary component contributing to the increase in net income in 2005 compared to 2004 comes from net interest income which increased $7,330,000, or 35%, as shown in the table below. The increase in net interest income was due to both an increase in our net interest margin (“NIM”) and growth in assets. Our NIM was 3.84% in 2005 compared to 3.43% in 2004. Average interest earning assets during 2005 was $744,298,000, compared to $618,589,000 during 2004. Average interest bearing liabilities during 2005 was $544,663,000 compared to $481,468,000 during 2004.
37
The table below shows a comparison of our condensed consolidated income statements for 2005 and 2004.
| | | | | | | | | | | | | | | |
| Condensed Consolidated Income Statements | | | | | | | | | | | | |
Amounts in thousands of dollars (except per share data) | | | | | | | | | | | | |
| | | 2005 | | | 2004 | | | Increase
(decrease) | | | % | |
Net interest income | | $ | 28,544 | | | $ | 21,214 | | | $ | 7,330 | | | 35 | % |
Provision for loan losses | | | (1,065 | ) | | | (1,270 | ) | | | 205 | | | (16 | %) |
| | | | | | | | | | | | | | | |
Net interest income after loan loss provision | | | 27,479 | | | | 19,944 | | | | 7,535 | | | 38 | % |
Non interest income | | | 5,380 | | | | 4,932 | | | | 448 | | | 9 | % |
Gain on sale of branches | | | — | | | | 1,844 | | | | n/a | | | n/a | |
Non interest expense | | | (22,805 | ) | | | (19,780 | ) | | | (3,025 | ) | | 15 | % |
| | | | | | | | | | | | | | | |
Income before income tax | | | 10,054 | | | | 6,940 | | | | 3,114 | | | 45 | % |
Income tax expense | | | (3,724 | ) | | | (2,567 | ) | | | (1,157 | ) | | 45 | % |
| | | | | | | | | | | | | | | |
NET INCOME | | $ | 6,330 | | | $ | 4,373 | | | | 1,957 | | | 45 | % |
| | | | | | | | | | | | | | | |
Gain on sale of branches, net of tax $694 (as reconciled in the table above) | | | | | | | 1,150 | | | | | | | | |
| | | | | | | | | | | | | | | |
Net income exclusive of gain on sale of branches | | $ | 6,330 | | | $ | 3,223 | | | | 3,107 | | | 96 | % |
| | | | | | | | | | | | | | | |
Net Interest Income/Margin
Net interest income consists of interest income generated by earning assets, less interest expense.
Net interest income increased $7,330,000 or 35% to $28,544,000 during the year ended December 31, 2005 compared to $21,214,000 for the year ended December 31, 2004. The $7,330,000 increase was a combination of a $11,178,000 increase in interest income offset by a $3,848,000 increase in interest expense.
Average interest earning assets increased $125,709,000 to $744,298,000 during the year ended December 31, 2005, compared to $618,589,000 for the year ended December 31, 2004. Comparing these same two periods, the yield on average interest earning assets increased from 4.70% in 2004 to 5.41% in 2005. The increase in volume had a positive effect on the change in interest income ($5,580,000 volume variance), and the increase in yields also had a positive effect on the change in interest income ($5,598,000 rate variance). The result was an $11,178,000 increase in interest income.
Average interest bearing liabilities increased $63,195,000 to $544,663,000 during the year ended December 31, 2005, compared to $481,468,000 for the year ended December 31, 2004. Comparing these same two periods, the cost of average interest bearing liabilities increased from 1.64% in 2004 to 2.15% in 2005. The increase in volume resulted in an increase in interest expense ($1,204,000 volume variance), and the increase in yields also resulted in an increase in interest expense ($2,644,000 rate variance). The result was a net increase of $3,848,000 in interest expense. See the tables “Average Balances – Yields & Rates,” and “Analysis Of Changes In Interest Income And Expenses” below.
38
Average Balances – Yields & Rates
(Dollars are in thousands)
| | | | | | | | | | | | | | | | | | | | |
| | | Years Ended December 31, | |
| | | 2005 | | | 2004 | |
| | | Average Balance | | | Interest Inc / Exp | | Average Rate | | | Average Balance | | | Interest Inc / Exp | | Average Rate | |
ASSETS: | | | | | | | | | | | | | | | | | | | | |
Federal funds sold & money market | | $ | 53,701 | | | $ | 1,641 | | 3.06 | % | | $ | 54,579 | | | $ | 714 | | 1.31 | % |
Securities available for sale (7) | | | 207,778 | | | | 6,101 | | 2.94 | % | | | 142,781 | | | | 2,940 | | 2.06 | % |
Loans (1) (2) (7) | | | 482,819 | | | | 32,524 | | 6.74 | % | | | 421,229 | | | | 25,434 | | 6.04 | % |
| | | | | | | | | | | | | | | | | | | | |
TOTAL EARNING ASSETS | | $ | 744,298 | | | $ | 40,266 | | 5.41 | % | | $ | 618,589 | | | $ | 29,088 | | 4.70 | % |
Allowance for loan losses | | | (6,143 | ) | | | | | | | | | (5,365 | ) | | | | | | |
All other assets | | | 70,022 | | | | | | | | | | 60,445 | | | | | | | |
| | | | | | | | | | | | | | | | | | | | |
TOTAL ASSETS | | $ | 808,177 | | | | | | | | | $ | 673,669 | | | | | | | |
| | | | | | | | | | | | | | | | | | | | |
| | | | | | |
LIABILITIES & SHAREHOLDERS’ EQUITY: | | | | | | | | | | | | | | | | | | | | |
Deposits: | | | | | | | | | | | | | | | | | | | | |
Now | | $ | 99,909 | | | $ | 317 | | 0.32 | % | | | 87,710 | | | $ | 265 | | 0.30 | % |
Money market | | | 105,625 | | | | 1,505 | | 1.42 | % | | | 105,184 | | | | 1,057 | | 1.01 | % |
Savings | | | 48,739 | | | | 201 | | 0.41 | % | | | 44,767 | | | | 133 | | 0.30 | % |
Time deposits | | | 241,773 | | | | 7,988 | | 3.30 | % | | | 207,697 | | | | 5,730 | | 2.76 | % |
Repurchase agreements | | | 38,210 | | | | 1,013 | | 2.65 | % | | | 26,110 | | | | 193 | | 0.74 | % |
Other borrowed funds (3) | | | 407 | | | | 16 | | 3.93 | % | | | — | | | | — | | — | % |
Corporate debenture (4) | | | 10,000 | | | | 682 | | 6.82 | % | | | 10,000 | | | | 496 | | 4.96 | % |
| | | | | | | | | | | | | | | | | | | | |
TOTAL INTEREST BEARING LIABILITIES | | $ | 544,663 | | | $ | 11,722 | | 2.15 | % | | | 481,468 | | | $ | 7,874 | | 1.64 | % |
Demand deposits | | | 182,103 | | | | | | | | | | 139,084 | | | | | | | |
Other liabilities | | | 3,374 | | | | | | | | | | 1,777 | | | | | | | |
Shareholders’ equity | | | 78,037 | | | | | | | | | | 51,340 | | | | | | | |
| | | | | | | | | | | | | | | | | | | | |
TOTAL LIABILITIES AND SHAREHOLDERS’ EQUITY | | $ | 808,177 | | | | | | | | | $ | 673,669 | | | | | | | |
| | | | | | | | | | | | | | | | | | | | |
NET INTEREST SPREAD (5) | | | | | | | | | 3.26 | % | | | | | | | | | 3.06 | % |
| | | | | | | | | | | | | | | | | | | | |
NET INTEREST INCOME | | | | | | $ | 28,544 | | | | | | | | | $ | 21,214 | | | |
| | | | | | | | | | | | | | | | | | | | |
NET INTEREST MARGIN (6) | | | | | | | | | 3.84 | % | | | | | | | | | 3.43 | % |
| | | | | | | | | | | | | | | | | | | | |
| (1) | Loan balances are net of deferred fees/cost of origination. |
| (2) | Interest income on average loans includes fee recognition of $269,000 and $164,000 for the years ended December 31, 2005 and 2004, respectively. |
| (3) | Includes short-term (usually overnight) Federal Home Loan Bank advances and Federal Funds Purchased. |
| (4) | Includes amortization of origination costs of $38,000 and $38,000 during year ended December 31, 2005 and 2004, respectively. |
| (5) | Represents the average rate earned on interest earning assets minus the average rate paid on interest bearing liabilities. |
| (6) | Represents net interest income divided by total earning assets. |
| (7) | The average rates have not been presented on a tax equivalent basis, as this amount is not deemed material. |
39
Analysis of Changes in Interest Income and Expenses
(Dollars are in thousands)
| | | | | | | | | | |
| | | Net Change Dec 31, 2005
versus 2004 |
| | | Volume
(1) | | | Rate (2) | | Net
Change |
INTEREST INCOME | | | | | | | | | | |
Federal funds sold and money market | | $ | (12 | ) | | $ | 939 | | $ | 927 |
Securities available for sale | | | 1,633 | | | | 1,528 | | | 3,161 |
Loans | | | 3,959 | | | | 3,131 | | | 7,090 |
| | | | | | | | | | |
TOTAL INTEREST INCOME | | $ | 5,580 | | | $ | 5,598 | | $ | 11,178 |
| | | | | | | | | | |
| | | |
INTEREST EXPENSE | | | | | | | | | | |
Deposits | | | | | | | | | | |
NOW accounts | | $ | 38 | | | $ | 14 | | $ | 52 |
Money market accounts | | | 4 | | | | 444 | | | 448 |
Savings | | | 13 | | | | 55 | | | 68 |
Time deposits | | | 1,024 | | | | 1,234 | | | 2,258 |
Repurchase agreements | | | 125 | | | | 695 | | | 820 |
Other borrowed funds | | | 16 | | | | — | | | 16 |
Corporate debenture | | | — | | | | 186 | | | 186 |
| | | | | | | | | | |
TOTAL INTEREST EXPENSE | | $ | 1,220 | | | $ | 2,628 | | $ | 3,848 |
| | | | | | | | | | |
NET INTEREST INCOME | | $ | 4,392 | | | $ | 2,938 | | $ | 7,330 |
| | | | | | | | | | |
The table above details the components of the changes in net interest income for the last two years. For each major category of interest earning assets and interest bearing liabilities, information is provided with respect to changes due to average volume and changes due to rates, with the changes in both volumes and rates allocated to these two categories based on the proportionate absolute changes in each category.
Provision for Loan Losses
The provision for loan loss losses decreased $205,000 or 16% to $1,065,000 during the year ended December 31, 2005, as compared to $1,270,000 for the year ended December 31, 2004. Our policy is to maintain the allowance for loan losses at a level sufficient to absorb probable losses inherent in the loan portfolio. The allowance is increased by the provision for loan losses, which is a charge to current period earnings, and is decreased by charge-offs, net of recoveries on prior loan charge-offs. Therefore, the provision for loan losses (Income Statement effect) is a residual of management’s determination of allowance for loan losses (Balance Sheet approach). In determining the adequacy of the allowance for loan losses, we consider those levels maintained by conditions of individual borrowers, the historical loan loss experience, the general economic environment, the overall portfolio composition, and other information. As these factors change, the level of loan loss provision changes. See “Asset Quality” regarding the allowance for loan losses for additional information.
40
Non-Interest Income
Non-interest income for 2005 decreased by $1,396,000, or 20%, to $5,380,000 as compared to $6,776,000 for the year ending December 31, 2004. The largest component contributing to this difference was the gain on sale of branches that occurred in 2004. Non-interest income, exclusive of this $1,844,000 gain on the sale of branches, increased $448,000, or 9%, in 2005 compared to 2004. Commissions from mortgage broker activities is a function of, and will vary with, market and interest rate environments. Several of our newer branch offices where constructed with second floors, which are currently being leased, until such time we need the additional space, contributing to the increase in rental income. We hired two experienced financial sales professionals during 2004, resulting in increased commissions from the sale of mutual funds and annuities. Overall, the growth of all other fees and service charges relate to our general business growth. Non-interest income items are listed in the table below.
| | | | | | | | | | | | | | |
(in thousands of dollars) | | 2005 | | | 2004 | | $ increase
(decrease) | | | %
increase
(decrease) | |
Service charges on deposit accounts | | $ | 3,222 | | | $ | 3,113 | | $ | 109 | | | 4 | % |
Commissions from mortgage broker activities | | | 499 | | | | 571 | | | (72 | ) | | (13 | )% |
Loan related fees | | | 283 | | | | 289 | | | (6 | ) | | (2.1 | )% |
Commissions from sale of mutual funds and annuities | | | 321 | | | | 207 | | | 114 | | | 55 | % |
Rental income | | | 203 | | | | 134 | | | 69 | | | 52 | % |
Other service charges and fees | | | 847 | | | | 607 | | | 240 | | | 40 | % |
Loss on sale of securities | | | (3 | ) | | | 0 | | | (3 | ) | | n/a | |
Gain (loss) on sale of other real estate owned | | | 8 | | | | 11 | | | (3 | ) | | (27 | )% |
| | | | | | | | | | | | | | |
Sub-total | | $ | 5,380 | | | $ | 4,932 | | $ | 448 | | | 9 | % |
Gain on sale of branches | | | — | | | | 1,844 | | | (1,844 | ) | | n/a | |
| | | | | | | | | | | | | | |
Total non-interest income | | $ | 5,380 | | | $ | 6,776 | | ($ | 1,396 | ) | | (20 | )% |
| | | | | | | | | | | | | | |
41
Non-Interest Expense
Non-interest expense increased $3,025,000, or 15%, to $22,805,000 for the year ended December 31, 2005, compared to $19,780,000 for the year ended December 31, 2004. We opened two new branches in 2004, one in April 2004 and one in June 2004, and we opened one new branch, in a temporary facility during October 2005. This growth in new facilities, equipment and personnel, along with our overall business growth we experienced during 2005, are the primary reasons for the increase in non-interest expense.
Non-interest expenses are listed in the table below.
| | | | | | | | | | | | | |
(in thousands of dollars) | | 2005 | | 2004 | | $ increase
(decrease) | | | %
increase
(decrease) | |
Salaries, wages and employee benefits | | $ | 12,623 | | $ | 10,440 | | $ | 2,183 | | | 21 | % |
Occupancy expense | | | 2,780 | | | 2,419 | | | 361 | | | 15 | % |
Depreciation of premises and equipment | | | 1,642 | | | 1,526 | | | 116 | | | 8 | % |
Supplies, stationary and printing | | | 522 | | | 456 | | | 66 | | | 14 | % |
Marketing expenses | | | 447 | | | 378 | | | 69 | | | 18 | % |
Data processing expense | | | 961 | | | 864 | | | 97 | | | 11 | % |
Legal, auditing and other professional fees (1) | | | 577 | | | 626 | | | (49 | ) | | (8 | )% |
Bank regulatory related expenses | | | 316 | | | 276 | | | 40 | | | 14 | % |
Postage and delivery | | | 270 | | | 288 | | | (18 | ) | | (6 | )% |
ATM related expenses | | | 399 | | | 319 | | | 80 | | | 25 | % |
Correspondent account expenses | | | 156 | | | 196 | | | (40 | ) | | (20 | )% |
Item processing direct production expenses | | | 215 | | | 208 | | | 7 | | | 3 | % |
Other expenses | | | 1,897 | | | 1,784 | | | 113 | | | 6 | % |
| | | | | | | | | | | | | |
Total non-interest expense | | $ | 22,805 | | $ | 19,780 | | $ | 3,025 | | | 15 | % |
| | | | | | | | | | | | | |
| Note | 1: Out of pocket expenses in 2004 relating to the Company’s first year compliance with Section 404 of the Sarbanes-Oxley Act of 2002 were $240,000. In 2005, second year compliance expenses (out of pocket) were estimated to be about $111,000. |
Income Tax Provision
The income tax provision for the year ended December 31, 2005, was $3,724,000, an effective tax rate of 37.0%, as compared to $2,567,000 for the year ended December 31, 2004, an effective tax rate of 37.0%.
COMPARISON OF BALANCE SHEETS AT DECEMBER 31, 2006 AND DECEMBER 31, 2005
Overview
Our total assets grew by $205,581,000, or 23.6%, from $871,521,000 at December 31, 2005 to $1,077,102,000 at December 31, 2006. Part of this growth, approximately $94,016,000, was acquired by our acquisition of Mid FL on March 31, 2006. The remaining asset growth (approximately $111,565,000) resulted from the organic growth of our business. That is, the growth in assets was funded primarily by growth in deposits which were acquired from new and existing customers in our local markets.
Securities
We account for our investments at fair value and classify them as available for sale. Unrealized holding gains and losses are included as a separate component of shareholders’ equity, net of the effect of deferred income taxes.
42
A decline in the market value of any available-for-sale security below cost that is deemed to be other-than-temporary results in a reduction in carrying amount to fair value. The impairment is charged to earnings and a new cost basis for the security is established. To determine whether an impairment is other-than-temporary, we consider whether we have the ability and intent to hold the investment until a market price recovery and consider whether evidence indicating the cost of the investment is recoverable outweighs evidence to the contrary. Evidence considered in this assessment includes the reasons for the impairment, the severity and duration of the impairment, changes in value subsequent to year end, and forecasted performance of the security.
If a security has a decline in fair value below its amortized cost that is other than temporary, then the security will be written down to its new cost basis by recording a loss in the statement of operations. We do not engage in trading activities as defined in Statement of Financial Accounting Standard Number 115.
Our available for sale portfolio totaled $235,350,000 at December 31, 2006 and $217,369,000 at December 31, 2005, or 22% and 25%, respectively, of total assets. See the tables below for a summary of security type, maturity and average yield distributions.
We use our security portfolio primarily as a source of liquidity and a base from which to pledge assets for repurchase agreements and public deposits. When our liquidity position exceeds expected loan demand, other investments are considered as a secondary earnings alternative. Typically, we remain short-term in our decision to invest in certain securities. As these investments mature, they will be used to meet cash needs or will be reinvested to maintain a desired liquidity position. We have designated all of our securities as available for sale to provide flexibility, in case an immediate need for liquidity arises. We believe the composition of the portfolio offers flexibility in managing our liquidity position and interest rate sensitivity, without adversely impacting our regulatory capital levels. The available for sale portfolio is carried at fair market value and had a net unrealized loss of approximately $1,052,000 at December 31, 2006, compared to $2,831,000 at December 31, 2005.
We invest primarily in direct obligations of the United States, obligations guaranteed as to the principal and interest by the United States, mortgage backed securities, Municipal securities and obligations of agencies of the United States. In addition, we enter into federal funds transactions with our principal correspondent banks, and act as a net seller of such funds. The Federal Reserve Bank and the Federal Home Loan Bank also require equity investments to be maintained by us, which are shown separately in our consolidated balance sheet.
The tables below summarize the maturity distribution of securities, weighted average yield by range of maturities, and distribution of securities for the periods provided (dollars are in thousands).
| | | | | | | | | | | | | | | | | | | | | | | | | | | | | | |
| | | One year or less | | | Over one through
five years | | | Over five through
ten years | | | Over ten years | | | Total | |
AVAILABLE-FOR-SALE | | $ | | % | | | $ | | % | | | $ | | % | | | $ | | % | | | $ | | % | |
US Treasury securities | | $ | 32,345 | | 3.75 | % | | $ | 7,920 | | 4.61 | % | | | — | | — | % | | | — | | — | % | | $ | 40,265 | | 3.92 | % |
US Government agencies | | | 8,914 | | 3.52 | % | | | 29,818 | | 5.18 | % | | | — | | — | % | | | — | | — | % | | | 38,732 | | 4.79 | % |
State, county, & municipal | | | — | | — | % | | | 3,196 | | 5.54 | % | | | 5,954 | | 5.73 | % | | | 18,831 | | 5.66 | % | | | 27,981 | | 5.66 | % |
Mortgage-backed securities | | | 6,668 | | 3.99 | % | | | 115,418 | | 4.78 | % | | | 2,239 | | 4.65 | % | | | 4,047 | | 5.25 | % | | | 128,372 | | 4.75 | % |
| | | | | | | | | | | | | | | | | | | | | | | | | | | | | | |
Total | | $ | 47,927 | | 3.74 | % | | $ | 156,352 | | 4.86 | % | | $ | 8,193 | | 5.43 | % | | $ | 22,878 | | 5.59 | % | | $ | 235,350 | | 4.72 | % |
43
Distribution of Investment Securities
(Dollars are in thousands)
| | | | | | | | | | | | | | | | | | |
| | | December 31, 2006 | | December 31, 2005 | | December 31, 2004 |
AVAILABLE-FOR-SALE | | Amortized
Cost | | Fair Value | | Amortized
Cost | | Fair Value | | Amortized
Cost | | Fair Value |
US Treasury securities | | $ | 40,425 | | $ | 40,265 | | $ | 94,396 | | $ | 93,734 | | $ | 121,438 | | $ | 120,809 |
US Government agencies | | | 38,783 | | | 38,732 | | | 26,817 | | | 26,491 | | | 21,826 | | | 21,717 |
State, county, & municipal | | | 27,837 | | | 27,981 | | | 1,135 | | | 1,129 | | | 635 | | | 635 |
Mortgage-backed securities | | | 129,357 | | | 128,372 | | | 97,452 | | | 95,615 | | | 47,250 | | | 46,752 |
Other investment | | | — | | | — | | | 400 | | | 400 | | | 400 | | | 400 |
| | | | | | | | | | | | | | | | | | |
Total | | $ | 236,402 | | $ | 235,350 | | $ | 220,200 | | $ | 217,369 | | $ | 191,549 | | $ | 190,313 |
| | | | | | | | | | | | | | | | | | |
Loans
Lending-related income is the most important component of our net interest income and is a major contributor to profitability. The loan portfolio is the largest component of earning assets, and it therefore generates the largest portion of revenues. The absolute volume of loans and the volume of loans as a percentage of earning assets is an important determinant of net interest margin as loans are expected to produce higher yields than securities and other earning assets. Average loans during the year ended December 31, 2006, were $605,236,000, or 68% of average earning assets, as compared to $482,819,000, or 65% of average earning assets, for the year ending December 31, 2005. Total loans, net of unearned fees and cost, at December 31, 2006 and 2005 were $657,963,000 and $516,658,000, respectively, an increase of $141,305,000, or 27%. This represents a loan to total asset ratio of 61% and 59% and a loan to deposit ratio of 74% and 72%, at December 31, 2006 and 2005, respectively. The increase in loans during this period was partially attributable to our acquisition of Mid FL (approximately $53,336,000) and the remaining amount was normal business growth.
Total residential real estate loans totaled $180,869,000 and total commercial real estate loans totaled $291,536,000, making up approximately 28% and 44% (combined total of approximately 72%) of the loan portfolio as of December 31, 2006, respectively. Construction, development, land loans totaled $60,950,000, or 9% of the loan portfolio. Commercial loans totaled $68,948,000, or 10% of the loan portfolio. Consumer and all other loans totaled $56,684,000, or 9% of the loan portfolio.
Loan concentrations are considered to exist where there are amounts loaned to multiple borrowers engaged in similar activities, which collectively could be similarly impacted by economic or other conditions and when the total of such amounts would exceed 25% of total capital. Due to the lack of diversified industry and the relative proximity of markets served, the Company has concentrations in geographic as well as in types of loans funded.
44
The tables below provide a summary of the loan portfolio composition and maturities for the periods provided below.
Loan Portfolio Composition
(Dollars are in thousands)
| | | | | | | | | | | | | | | | | | | | |
Types of Loans | |
| at December 31: | | 2006 | | | 2005 | | | 2004 | | | 2003 | | | 2002 | |
Real estate loans: | | | | | | | | | | | | | | | | | | | | |
Residential | | $ | 180,869 | | | $ | 148,090 | | | $ | 129,796 | | | $ | 140,826 | | | $ | 114,183 | |
Commercial | | | 291,536 | | | | 219,094 | | | | 179,846 | | | | 157,586 | | | | 117,964 | |
Construction, development, land | | | 60,950 | | | | 36,352 | | | | 20,032 | | | | 16,930 | | | | 22,544 | |
| | | | | | | | | | | | | | | | | | | | |
Total real estate loans | | | 533,355 | | | | 403,536 | | | | 329,674 | | | | 315,342 | | | | 254,691 | |
| | | | | |
Commercial | | | 68,948 | | | | 63,475 | | | | 64,984 | | | | 59,175 | | | | 43,607 | |
Consumer and other loans | | | 56,684 | | | | 50,413 | | | | 46,883 | | | | 39,908 | | | | 35,906 | |
| | | | | | | | | | | | | | | | | | | | |
Total loans – gross | | | 658,987 | | | | 517,424 | | | | 441,541 | | | | 414,425 | | | | 334,204 | |
| | | | | |
Less: unearned fees/costs | | | (1,024 | ) | | | (766 | ) | | | (536 | ) | | | (527 | ) | | | (483 | ) |
| | | | | | | | | | | | | | | | | | | | |
Total loans | | | 657,963 | | | | 516,658 | | | | 441,005 | | | | 413,898 | | | | 333,721 | |
| | | | | |
Less: allowance for loan losses | | | (7,355 | ) | | | (6,491 | ) | | | (5,685 | ) | | | (4,850 | ) | | | (4,055 | ) |
| | | | | | | | | | | | | | | | | | | | |
Total loans, net | | $ | 650,608 | | | $ | 510,167 | | | $ | 435,320 | | | $ | 409,048 | | | $ | 329,666 | |
| | | | | | | | | | | | | | | | | | | | |
The repayment of loans is a source of additional liquidity for the Company. The following table sets forth the loans maturing within specific intervals at December 31, 2006.
Loan Maturity Schedule
(Dollars are in thousands)
| | | | | | | | | | | | |
| | | December 31, 2006 |
| | | 0 – 12 Months | | 1 – 5 Years | | Over 5 Years | | Total |
All loans other than construction | | $ | 209,905 | | $ | 247,240 | | $ | 140,892 | | $ | 598,037 |
Construction, development, land | | | 29,242 | | | 26,276 | | | 5,432 | | | 60,950 |
| | | | | | | | | | | | |
Total | | $ | 239,147 | | $ | 273,516 | | $ | 146,324 | | $ | 658,987 |
| | | | | | | | | | | | |
Fixed interest rate | | $ | 40,306 | | $ | 221,409 | | $ | 67,166 | | $ | 328,881 |
Variable interest rate | | | 198,841 | | | 52,107 | | | 79,158 | | | 330,106 |
| | | | | | | | | | | | |
Total | | $ | 239,147 | | $ | 273,516 | | $ | 146,324 | | $ | 658,987 |
| | | | | | | | | | | | |
The information presented in the above table is based upon the contractual maturities of the individual loans, including loans which may be subject to renewal at their contractual maturity. Renewal of such loans is subject to review and credit approval, as well as modification of terms upon their maturity. Consequently, management believes this treatment presents fairly the maturity structure of the loan portfolio.See “Liquidity and Market Risk Management” for a discussion regarding the repricing structure of the loan portfolio.
Credit Quality and Allowance for Loan Losses
We maintain an allowance for loan losses that we believe is adequate to absorb probable losses inherent in our loan portfolio. The allowance is increased by the provision for loan losses, which is a charge to current period earnings and decreased by loan charge-offs net of recoveries of prior period loan charge-offs. Loans are charged against the allowance when management believes collection of the principal is unlikely.
45
The allowance consists of two components. The first component consists of amounts reserved for impaired loans, as defined by Statement of Financial Accounting Standard No. 114. Impaired loans are those loans that management has estimated will not repay as agreed upon. Each of these loans is required to have a written analysis supporting the amount of specific reserve allocated to the particular loan, if any. That is to say, a loan may be impaired (i.e. not expected to repay as agreed), but may be sufficiently collateralized such that we expect to recover all principle and interest eventually, and therefore no specific reserve is warranted.
The second component is a general reserve on all of the Company’s loans other than those identified as impaired. We group these loans into five general categories with similar characteristics as listed below:
Residential real estate loans
Commercial real estate loans
Construction, development, land loans
Commercial loans (not collateralized by real estate)
Consumer and all other loans (not collateralized by real estate)
We then apply an adjusted loss factor to each group of loans to determine the total amount of this second component of our allowance for loan losses. The adjusted loss factor for each category of loans is a derivative of our historical loss factor for that category, adjusted for current internal and external environmental factors, as well as for certain loan grading factors. The environmental factors that we consider are listed below:
Levels of and trends in delinquencies and impaired loans
Levels of and trends in charge-offs and recoveries
Trends in volume and terms of loans
Effects of any changes in risk selection and underwriting standards, and other changes in lending policies, procedures and practices
Experience, ability, and depth of lending management and other relevant staff
National and local economic trends and conditions
Industry conditions
Effects of changes in credit concentrations
In the table below we have shown the two components, as discussed above, of our allowance for loan losses at December 31, 2006 and 2005.
| | | | | | | | | | | | |
| | | December 31, | | | increase | |
(amounts are in thousands of dollars) | | 2006 | | | 2005 | | | (decrease) | |
Impaired loans | | $ | 4,986 | | | $ | 6,346 | | | $ | (1,360 | ) |
Component 1 (specific reserves) | | | 372 | | | | 1,017 | | | | (645 | ) |
Specific reserves as percentage of impaired loans | | | 7.5 | % | | | 16.0 | % | | | (8.5 | )% |
| | | |
Total loans other than impaired loans | | | 652,977 | | | | 510,312 | | | | 142,665 | |
Component 2 (general reserve) | | | 6,983 | | | | 5,474 | | | | 1,509 | |
General reserves as percentage of non impaired loans | | | 1.07 | % | | | 1.07 | % | | | — | % |
| | | |
Total loans | | | 657,963 | | | | 516,658 | | | | 141,305 | |
Total allowance for loan losses | | | 7,355 | | | | 6,491 | | | | 864 | |
Allowance for loan losses as percentage of total loans | | | 1.12 | % | | | 1.26 | % | | | (0.14 | )% |
46
As shown in the table above, our allowance for loan losses as a percentage of total loans outstanding, decreased from 1.26% (December 31, 2005) to 1.12% (December 31, 2006). This decrease is due to the changes in our specific reserves on impaired loans. As discussed above, these reserves are determined by an analysis on a loan by loan basis for each impaired loan identified.
We are committed to the early recognition of problems and to maintaining a sufficient allowance. We believe our allowance for loan losses at December 31, 2006 was adequate. The table below sets forth the activity in the allowance for loan losses for the periods presented.
Activity in Allowance for Loan Losses
(Dollars are in thousands)
| | | | | | | | | | | | | | | | | | | | |
| | | 2006 | | | 2005 | | | 2004 | | | 2003 | | | 2002 | |
Balance, beginning of year | | $ | 6,491 | | | $ | 5,685 | | | $ | 4,850 | | | $ | 4,055 | | | $ | 3,076 | |
| | | | | |
Loans charged-off: | | | | | | | | | | | | | | | | | | | | |
Commercial | | | (368 | ) | | | (225 | ) | | | (133 | ) | | | (298 | ) | | | (47 | ) |
Real estate mortgage | | | (131 | ) | | | — | | | | (112 | ) | | | (85 | ) | | | (159 | ) |
Consumer | | | (99 | ) | | | (134 | ) | | | (105 | ) | | | (151 | ) | | | (160 | ) |
| | | | | | | | | | | | | | | | | | | | |
Total loans charged-off | | | (598 | ) | | | (359 | ) | | | (350 | ) | | | (534 | ) | | | (366 | ) |
| | | | | |
Recoveries on loans previously charged-off: | | | | | | | | | | | | | | | | | | | | |
Commercial | | | 53 | | | | 52 | | | | 7 | | | | 29 | | | | 1 | |
Real estate mortgage | | | 9 | | | | 31 | | | | 3 | | | | 24 | | | | 3 | |
Consumer | | | 36 | | | | 17 | | | | 35 | | | | 33 | | | | 22 | |
| | | | | | | | | | | | | | | | | | | | |
Total loan recoveries | | | 98 | | | | 100 | | | | 45 | | | | 86 | | | | 26 | |
| | | | | |
Net loans charged-off | | | (500 | ) | | | (259 | ) | | | (305 | ) | | | (448 | ) | | | (340 | ) |
| | | | | |
Provision for loan losses charged to expense | | | 717 | | | | 1,065 | | | | 1,270 | | | | 1,243 | | | | 644 | |
Acquisition of CSB | | | — | | | | — | | | | — | | | | — | | | | 675 | |
Adjustment relating to sale of branches | | | — | | | | — | | | | (130 | ) | | | — | | | | — | |
Acquisition of Mid FL | | | 647 | | | | — | | | | — | | | | — | | | | — | |
| | | | | | | | | | | | | | | | | | | | |
Balance, end of year | | $ | 7,355 | | | $ | 6,491 | | | $ | 5,685 | | | $ | 4,850 | | | $ | 4,055 | |
| | | | | | | | | | | | | | | | | | | | |
Total loans at year end | | $ | 657,963 | | | $ | 516,658 | | | $ | 441,005 | | | $ | 413,898 | | | $ | 333,721 | |
Average loans outstanding | | $ | 605,236 | | | $ | 482,819 | | | $ | 421,229 | | | $ | 374,567 | | | $ | 261,511 | |
| | | | | |
Allowance for loan losses to total loans at year end | | | 1.12 | % | | | 1.26 | % | | | 1.29 | % | | | 1.17 | % | | | 1.22 | % |
Net charge-offs to average loans outstanding | | | 0.08 | % | | | 0.05 | % | | | 0.07 | % | | | 0.12 | % | | | 0.13 | % |
Non-performing loans consist of non-accrual loans and loans past due 90 days or more and still accruing interest. Non-performing assets consist of non-performing loans plus other real estate owned (“OREO”) and repossessed assets other than real estate. We place loans on non-accrual status when they are past due 90 days and management believes the borrower’s financial condition, after giving consideration to economic conditions and collection efforts, is such that collection of interest is doubtful. When we place a loan on non-accrual status, interest accruals cease and uncollected interest is reversed and charged against current income. Subsequent collections reduce the principal balance of the loan until the loan is returned to accrual status.
At December 31, 2006 non-accrual loans totaled $448,000. This consisted of an aggregate $434,000 in real estate related loans (8 loans), $12,000 vehicle loan (1 loan), and $2,000 office equipment loan (1 loan). At December 31, 2006, loans past due 90 or more days and still accruing interest totaled $162,000.
47
There was no other real estate owned (OREO) at December 31, 2006. At December 31, 2006 repossessed assets other than real estate totaled $35,000. This represents a boat ($19,000) and two automobiles ($16,000).
Total non-performing assets as of December 31, 2006, decreased $904,000 or 58% to $645,000, compared to $1,549,000 as of December 31, 2005. Non-performing assets, as a percentage of total assets at December 31, 2006 and December 31, 2005, were 0.06% and 0.18%, respectively.
Non-performing loans as of December 31, 2006, decreased $900,000 or 60% to $610,000, compared to $1,510,000 as of December 31, 2005. Non-performing loans, as a percentage of total loans at December 31, 2006 and December 31, 2005, were 0.09% and 0.29%, respectively
Interest income not recognized on non accrual loans was approximately $16,000, $35,000 and $40,000 for the years ended December 31, 2006, 2005 and 2004, respectively. Interest income recognized on impaired loans was approximately $363,000, $18,000 and $48,000 for the years ended December 31, 2006, 2005 and 2004, respectively. The average recorded investment in impaired loans during 2006, 2005 and 2004 were $5,032,000, $987,000 and $1,103,000, respectively. The table below summarizes non-performing assets for the periods provided.
Non-Performing Assets
(Dollars are in thousands)
| | | | | | | | | | | | | | | | | | | | |
| | | December 31, | |
| | | 2006 | | | 2005 | | | 2004 | | | 2003 | | | 2002 | |
Non-accrual loans | | $ | 448 | | | $ | 852 | | | $ | 890 | | | $ | 1,078 | | | $ | 402 | |
Past due loans 90 days or more and still accruing interest | | | 162 | | | | 658 | | | | 7 | | | | 246 | | | | 996 | |
| | | | | | | | | | | | | | | | | | | | |
Total non-performing loans | | | 610 | | | | 1,510 | | | | 897 | | | | 1,324 | | | | 1,398 | |
Other real estate owned (“OREO”) | | | — | | | | — | | | | 384 | | | | 282 | | | | 65 | |
Repossessed assets other than real estate | | | 35 | | | | 39 | | | | 24 | | | | 35 | | | | 19 | |
| | | | | | | | | | | | | | | | | | | | |
Total non-performing assets | | $ | 645 | | | $ | 1,549 | | | $ | 1,305 | | | $ | 1,641 | | | $ | 1,482 | |
| | | | | | | | | | | | | | | | | | | | |
| | | | | |
Total non-performing loans as a percentage of total loans | | | 0.09 | % | | | 0.29 | % | | | 0.20 | % | | | 0.32 | % | | | 0.42 | % |
| | | | | | | | | | | | | | | | | | | | |
Total non-performing assets as a percentage of total assets | | | 0.06 | % | | | 0.18 | % | | | 0.17 | % | | | 0.27 | % | | | 0.30 | % |
| | | | | | | | | | | | | | | | | | | | |
Allowance for loan losses as a percentage of non-performing loans | | | 1,206 | % | | | 430 | % | | | 634 | % | | | 366 | % | | | 290 | % |
| | | | | | | | | | | | | | | | | | | | |
Restructured loans | | $ | — | | | $ | — | | | $ | — | | | $ | — | | | $ | — | |
| | | | | | | | | | | | | | | | | | | | |
Recorded investment in impaired loans | | $ | 4,986 | | | $ | 6,346 | | | $ | 1,053 | | | $ | 368 | | | $ | 433 | |
| | | | | | | | | | | | | | | | | | | | |
Allowance for loan losses related to impaired loans | | $ | 372 | | | $ | 1,017 | | | $ | 406 | | | $ | 132 | | | $ | 124 | |
| | | | | | | | | | | | | | | | | | | | |
We are continually analyzing our loan portfolio in an effort to recognize and resolve our problem assets as quickly and efficiently as possible. While we believe we use the best information available at the time to make a determination with respect to the allowance for loan losses, we recognize that many factors can adversely impact various segments of our markets, and subsequent adjustments in the allowance may be necessary if future economic indications or other factors differ from the assumptions used in making the initial determination or if regulatory policies change. We continuously focus our attention on promptly
48
identifying and providing for potential problem loans, as they arise. Although the total allowance for loan losses is available to absorb losses from all loans, management allocates the reserve among loan portfolio categories for informational and regulatory reporting purposes. Regulatory examiners may require us to recognize additions to the allowance based upon the regulators’ judgments about the information available to them at the time of their examination, which may differ from our judgments about the allowance for loan losses.
While no portion of the allowance is in any way restricted to any individual loan or group of loans, and the entire allowance is available to absorb losses from any and all loans, the following table summarizes our allocation of allowance for loan losses by loan category and loans in each category as a percentage of total loans, for the periods presented. Dollar amounts are in thousands.
| | | | | | | | | | | | | | | | | | |
| | | December 31, | |
| | | 2006 | | | 2005 | | | 2004 | |
Real estate loans: | | | | | | | | | | | | | | | | | | |
Residential | | $ | 998 | | 28 | % | | $ | 992 | | 29 | % | | $ | 876 | | 29 | % |
Commercial | | | 2,969 | | 44 | % | | | 2,888 | | 42 | % | | | 2,562 | | 41 | % |
Construction, development, land | | | 1,213 | | 9 | % | | | 435 | | 7 | % | | | 324 | | 4 | % |
| | | | | | | | | | | | | | | | | | |
Total real estate loans | | | 5,180 | | 81 | % | | | 4,315 | | 78 | % | | | 3,762 | | 74 | % |
| | | | | | |
Commercial Loans | | | 1,271 | | 10 | % | | | 1,303 | | 12 | % | | | 1,184 | | 15 | % |
Consumer and other loans | | | 904 | | 9 | % | | | 841 | | 10 | % | | | 665 | | 11 | % |
Unallocated | | | — | | | | | | 32 | | | | | | 74 | | | |
| | | | | | | | | | | | | | | | | | |
Total | | $ | 7,355 | | 100 | % | | $ | 6,491 | | 100 | % | | $ | 5,685 | | 100 | % |
| | | | | | | | | | | | | | | | | | |
| | | | | | | | | | | | |
| | | December 31, | |
| | | 2003 | | | 2002 | |
Real estate loans: | | | | | | | | | | | | |
Residential | | $ | 815 | | 34 | % | | $ | 854 | | 34 | % |
Commercial | | | 1,927 | | 38 | % | | | 1,789 | | 35 | % |
Construction, development, land | | | 237 | | 4 | % | | | 290 | | 7 | % |
| | | | | | | | | | | | |
Total real estate loans | | | 2,979 | | 76 | % | | | 2,933 | | 76 | % |
| | | | |
Commercial Loans | | | 1,301 | | 14 | % | | | 724 | | 13 | % |
Consumer and other loans | | | 570 | | 10 | % | | | 398 | | 11 | % |
Unallocated | | | — | | | | | | — | | | |
| | | | | | | | | | | | |
Total | | $ | 4,850 | | 100 | % | | $ | 4,055 | | 100 | % |
| | | | | | | | | | | | |
49
Bank Premises and Equipment
Bank premises and equipment was $39,879,000 at December 31, 2006 compared to $28,909,000 at December 31, 2005, an increase of $10,970,000 or 38%. This amount is the result of purchases totaling $13,268,000 less $1,935,000 of depreciation expense, less $326,000 sale of land and less $37,000 disposal of fixed assets. A portion of the purchase amount ($3,345,000) is a result of the March 31, 2006 acquisition of the Mid FL bank. The remaining purchases ($9,923,000) are listed in the table below (amounts are in thousands of dollars):
| | |
| $ 1,465 | | construction in progress, Osceola County (St. Cloud) branch; land purchased in prior year |
| |
| 1,300 | | construction of South Lakeland branch (Polk County) ; land is leased |
| |
| 300 | | construction cost; build out second floor Lake Wales branch (Polk County); completed |
| |
| 275 | | construction in progress, Polk County (Deer Creek) branch |
| |
| 100 | | leasehold improvement downtown Lakeland branch (Polk County) |
| |
| 45 | | leasehold improvement, remodel Poinciana branch (Osceola County) |
| |
| 600 | | purchased land -future branch site for Crystal River, Florida (Citrus County) |
| |
| 515 | | purchased land -future branch site Bushnell, Florida (Sumter County) |
| |
| 1,700 | | purchased land -future branch and corporate office site (Polk County) |
| |
| 1,450 | | purchased land -future branch site for Eustis, Florida (Lake County) |
| |
| 775 | | purchased land -future branch site for Wesly Chapel, Florida (Pasco County) |
| |
| 1,398 | | purchases of equipment and furniture |
| | | |
| |
| $ 9,923 | | |
| | | |
Deposits
Total deposits increased $175,469,000 to $892,806,000 as of December 31, 2006, compared to $717,337,000 at December 31, 2005. The increase in deposits during this period was partially attributable to our acquisition of Mid FL (approximately $78,302,000) and the remaining amount was normal business growth. We do not rely on purchased or brokered deposits as a source of funds. Instead, the generation of deposits within our market area serves as our primary source of funds for investment principally in loans. The tables below summarize selected deposit information for the periods indicated.
Average deposit balance by type and average interest rates
(Dollars are in thousands)
| | | | | | | | | | | | | | | | | | |
| | | 2006 | | | 2005 | | | 2004 | |
| | | Average | | Average | | | Average | | Average | | | Average | | Average | |
| | | Balance | | Rate | | | Balance | | Rate | | | Balance | | Rate | |
Non interest bearing demand deposits | | $ | 196,739 | | 0.00 | % | | $ | 182,103 | | 0.00 | % | | $ | 139,084 | | 0.00 | % |
NOW accounts | | | 100,268 | | 0.66 | % | | | 99,909 | | 0.32 | % | | | 87,710 | | 0.30 | % |
Money market accounts | | | 106,707 | | 2.48 | % | | | 105,625 | | 1.42 | % | | | 105,184 | | 1.01 | % |
Savings accounts | | | 48,053 | | 0.71 | % | | | 48,739 | | 0.41 | % | | | 44,767 | | 0.30 | % |
Time deposits | | | 355,704 | | 4.31 | % | | | 241,773 | | 3.30 | % | | | 207,697 | | 2.76 | % |
| | | | | | | | | | | | | | | | | | |
Total | | $ | 807,471 | | 2.35 | % | | $ | 678,149 | | 1.48 | % | | $ | 584,442 | | 1.23 | % |
| | | | | | | | | | | | | | | | | | |
50
Maturity of time deposits of $100,000 or more
(Dollars are in thousands)
| | | | | | | | | |
| | | December 31, |
| | | 2006 | | 2005 | | 2004 |
Three months or less | | $ | 60,495 | | $ | 28,106 | | $ | 15,261 |
Three through six months | | | 68,047 | | | 24,057 | | | 16,678 |
Six through twelve months | | | 60,311 | | | 31,364 | | | 13,886 |
Over twelve months | | | 38,780 | | | 46,672 | | | 41,339 |
| | | | | | | | | |
Total | | $ | 227,633 | | $ | 130,199 | | $ | 87,164 |
| | | | | | | | | |
Repurchase Agreements
We, through our subsidiary Banks, enter into borrowing arrangements with retail business customers by agreements to repurchase (“repurchase agreements”) under which we pledge investment securities owned and under our control as collateral against the one-day borrowing arrangement. These arrangements are not transactions with investment bankers or brokerage firms, but rather, with several of our larger commercial customers who periodically have excess cash balances and do not want to keep those balances in non interest bearing checking accounts. Because our Banks are not permitted to pay interest on commercial checking accounts, we offer an arrangement via a repurchase agreement whereby balances are transferred from their checking account into a repurchase agreement arrangement which we will pay a daily adjustable interest rate of the federal fund rate minus an amount that generally ranges between 0.35% and 0.75%.
The daily average balance of these short-term borrowing agreements for the years ended December 31, 2006, 2005 and 2004, was approximately $49,830,000, $38,210,000 and $26,110,000, respectively. Interest expense for the same periods was approximately $2,156,000, $1,013,000 and $193,000, respectively, resulting in an average rate paid of 4.33%, 2.65% and 0.74% for the years ended December 31, 2006, 2005, and 2004, respectively. The table below summarizes our repurchase agreements for the periods presented.
Schedule of short-term borrowings (1)
(Dollars are in thousands)
| | | | | | | | | | | | | | | |
| | | Maximum Outstanding at any month end | | Average
balance | | Average interest rate
during the year | | | Ending
balance | | Weighted average interest rate at year end | |
| Year ended December 31, | | | | | | | | | | | | | | | |
2006 | | $ | 54,812 | | $ | 49,830 | | 4.33 | % | | $ | 52,792 | | 4.39 | % |
2005 | | $ | 49,046 | | $ | 38,210 | | 2.65 | % | | $ | 41,811 | | 3.38 | % |
2004 | | $ | 35,167 | | $ | 26,110 | | 0.74 | % | | $ | 24,627 | | 1.56 | % |
| (1) | Consists of securities sold under agreements to repurchase |
Other borrowed funds
From time to time we borrow on a short-term basis, usually over-night, either through Federal Home Loan Bank advances or Federal Funds Purchased. At December 31, 2005 we had an over-night borrowing of this type of $1,000,000 outstanding. The interest rate was 4.5%. During 2005, our average balance outstanding was $407,000, with an average interest rate of 3.93%. We did not have any of these types of transactions during 2006.
51
Corporate debenture
We formed CenterState Banks of Florida Statutory Trust I (the “Trust”) for the purpose of issuing trust preferred securities. On September 22, 2003, we issued a floating rate corporate debenture in the amount of $10,000,000. The Trust used the proceeds from the issuance of a trust preferred security to acquire the corporate debenture of the Company. The trust preferred security essentially mirrors the corporate debenture, carrying a cumulative preferred dividend at a variable rate equal to the interest rate on the corporate debenture (three month LIBOR plus 305 basis points). The rate is subject to change quarterly. The rate in effect during the quarter ended December 31, 2006 was 8.42%. The corporate debenture and the trust preferred security each have 30-year lives. The trust preferred security and the corporate debenture are callable by the Company or the Trust, at their respective option after five years, and sooner in specific events, subject to prior approval by the Federal Reserve Board, if then required. Related debt issuance costs of $188,000 were capitalized and are being amortized to interest expense over a five year period. The Company has treated the trust preferred security as Tier 1 capital up to the maximum amount allowed, and the remainder as Tier 2 capital for federal regulatory purposes.
Liquidity and Market Risk Management
Market and public confidence in our financial strength and financial institutions in general will largely determine our access to appropriate levels of liquidity. This confidence is significantly dependent on our ability to maintain sound asset quality and appropriate levels of capital reserves.
Liquidity is defined as the ability to meet anticipated customer demands for funds under credit commitments and deposit withdrawals at a reasonable cost and on a timely basis. We measure our liquidity position by giving consideration to both on- and off-balance sheet sources of and demands for funds on a daily and weekly basis.
Liquidity risk involves the risk of being unable to fund assets with the appropriate duration and rate-based liabilities, as well as the risk of not being able to meet unexpected cash needs. Liquidity planning and management are necessary to ensure the ability to fund operations cost-effectively and to meet current and future potential obligations such as loan commitments, lease obligations, and unexpected deposit outflows. In this process, we focus on both assets and liabilities and on the manner in which they combine to provide adequate liquidity to meet our needs.
Interest rate sensitivity refers to the responsiveness of interest-earning assets and interest-bearing liabilities to changes in market interest rates. The rate sensitive position, or gap, is the difference in the volume of rate-sensitive assets and liabilities, at a given time interval, including both floating rate instruments and instruments which are approaching maturity. The measurement of our interest rate sensitivity, or gap, is one of the principal techniques we use in our asset/liability management effort. Each of our Banks, generally attempts to maintain a range, set by policy, between rate-sensitive assets and liabilities by repricing periods. Each of our Banks set their own range, approved by their board of directors. If any of our Banks fall outside their pre-approved range, it requires board action and board approval, by that particular Bank’s board of directors. The asset mix of our balance sheet is evaluated continually in terms of several variables: yield, credit quality, and appropriate funding sources and liquidity. Management of the liability mix of the balance sheet focuses on expanding the various funding sources.
Our gap and liquidity positions are reviewed periodically to determine whether or not changes in policies and procedures are necessary to achieve financial goals. At December 31, 2006, approximately
52
50% of total gross loans were adjustable rate and 40% of total investments (includes investment securities, federal funds sold and money market) either reprice or mature in less than one year. Deposit liabilities, at that date, consisted of approximately $110,627,000 (12%) in NOW accounts, $147,334,000 (17%) in money market accounts and savings, $411,243,000 (46%) in time deposits and $223,602,000 (25%) in non-interest bearing demand accounts.
The table below presents the market risk associated with our financial instruments. In the “Rate Sensitivity Analysis” table, rate sensitive assets and liabilities are shown by maturity or repricing periods, separating fixed and variable interest rates. The estimated fair value of each instrument category is also shown in the table. While these estimates of fair value are based on our judgment of the most appropriate factors, there is no assurance that, if we had to dispose of such instruments at December 31, 2006, the estimated fair values would necessarily have been achieved at that date, since market values may differ depending on various circumstances. The estimated fair values at December 31, 2006, should not necessarily be considered to apply at subsequent dates.
53
RATE SENSITIVITY ANALYSIS
December 31, 2006
(Dollars are in thousands)
| | | | | | | | | | | | | | | | | | | | | | | | | | | | | | | |
(Dollars in thousands) | | 0-1 Yr | | | 1-2 Yrs | | | 2-3 Yrs | | | 3-4 Yrs | | | 4-5 Yrs | | | 5 Yrs + | | | TOTAL | | | Est. Fair Value |
| INTEREST EARNING ASSETS: | | | | | | | | | | | | | | | | | | | | | | | | | | | | | | | |
Loans | | | | | | | | | | | | | | | | | | | | | | | | | | | | | | | |
Fixed rate loans (3) | | $ | 40,306 | | | $ | 46,141 | | | $ | 51,025 | | | $ | 51,145 | | | $ | 73,098 | | | $ | 67,166 | | | $ | 328,881 | | | $ | 326,783 |
Average interest rate | | | 7.22 | % | | | 6.57 | % | | | 7.01 | % | | | 7.32 | % | | | 7.93 | % | | | 7.33 | % | | | 7.29 | % | | | |
Variable rate loans (3) | | | 247,095 | | | | 15,521 | | | | 15,227 | | | | 16,043 | | | | 21,531 | | | | 14,689 | | | | 330,106 | | | | 330,106 |
Average interest rate | | | 8.49 | % | | | 6.60 | % | | | 6.71 | % | | | 6.56 | % | | | 6.97 | % | | | 6.30 | % | | | 8.03 | % | | | |
Investment securities (1) | | | | | | | | | | | | | | | | | | | | | | | | | | | | | | | |
Fixed rate investments | | | 46,613 | | | | 27,701 | | | | 22,921 | | | | 18,938 | | | | 24,258 | | | | 95,336 | | | | 235,767 | | | | 234,715 |
Average interest rate | | | 3.73 | % | | | 4.08 | % | | | 4.28 | % | | | 4.73 | % | | | 5.15 | % | | | 4.87 | % | | | 4.51 | % | | | |
Variable rate investments | | | 635 | | | | — | | | | — | | | | — | | | | — | | | | — | | | | 635 | | | | 635 |
Average interest rate | | | 5.46 | % | | | | | | | | | | | | | | | | | | | | | | | 5.46 | % | | | |
Federal funds sold (4) | | | 79,636 | | | | — | | | | — | | | | — | | | | — | | | | — | | | | 79,636 | | | | 79,636 |
Average interest rate | | | 5.15 | % | | | | | | | | | | | | | | | | | | | | | | | 5.15 | % | | | |
Other earning assets (2) | | | 2,665 | | | | — | | | | — | | | | — | | | | — | | | | — | | | | 2,665 | | | | 2,665 |
Average interest rate | | | 5.95 | % | | | | | | | | | | | | | | | | | | | | | | | 5.95 | % | | | |
| | | | | | | | | | | | | | | | | | | | | | | | | | | | | | | |
Total interest-earning assets | | $ | 416,950 | | | $ | 89,363 | | | $ | 89,173 | | | $ | 86,126 | | | $ | 118,887 | | | $ | 177,191 | | | $ | 977,690 | | | $ | 974,540 |
Average interest rate | | | 7.18 | % | | | 5.80 | % | | | 6.26 | % | | | 6.61 | % | | | 7.19 | % | | | 5.92 | % | | | 6.69 | % | | | |
| | | | | | | | | | | | | | | | | | | | | | | | | | | | | | | |
| | | | | | | | |
| INTEREST BEARING LIABILITIES | | | | | | | | | | | | | | | | | | | | | | | | | | | | | | | |
NOW | | $ | 110,627 | | | $ | — | | | $ | — | | | $ | — | | | $ | — | | | $ | — | | | $ | 110,627 | | | $ | 110,627 |
Average interest rate | | | 0.95 | % | | | | | | | | | | | | | | | | | | | | | | | 0.95 | % | | | |
Money market | | | 100,528 | | | | — | | | | — | | | | — | | | | — | | | | — | | | | 100,528 | | | | 100,528 |
Average interest rate | | | 2.76 | % | | | | | | | | | | | | | | | | | | | | | | | 2.76 | % | | | |
Savings | | | 46,806 | �� | | | — | | | | — | | | | — | | | | — | | | | — | | | | 46,806 | | | | 46,806 |
Average interest rate | | | 0.86 | % | | | | | | | | | | | | | | | | | | | | | | | 0.86 | % | | | |
CDs $100,000 & over | | | 188,853 | | | | 15,994 | | | | 13,429 | | | | 6,216 | | | | 3,141 | | | | — | | | | 227,633 | | | | 228,221 |
Average interest rate | | | 4.93 | % | | | 4.79 | % | | | 4.68 | % | | | 4.79 | % | | | 5.75 | % | | | | | | | 4.91 | % | | | |
CDs under $100,000 | | | 139,591 | | | | 21,169 | | | | 14,366 | | | | 5,759 | | | | 2,725 | | | | — | | | | 183,610 | | | | 183,709 |
Average interest rate | | | 4.57 | % | | | 4.52 | % | | | 4.59 | % | | | 4.49 | % | | | 5.14 | % | | | | | | | 4.57 | % | | | |
Securities sold under agreements to repurchase | | | 52,792 | | | | — | | | | — | | | | — | | | | — | | | | — | | | | 52,792 | | | | 52,792 |
Average interest rate | | | 4.39 | % | | | | | | | | | | | | | | | | | | | | | | | 4.39 | % | | | |
Corporate debenture | | | 10,000 | | | | — | | | | — | | | | — | | | | — | | | | — | | | | 10,000 | | | | 10,238 |
Average interest rate | | | 8.42 | % | | | | | | | | | | | | | | | | | | | | | | | 8.42 | % | | | |
| | | | | | | | | | | | | | | | | | | | | | | | | | | | | | | |
Total interest-bearing liabilities | | $ | 649,197 | | | $ | 37,163 | | | $ | 27,795 | | | $ | 11,975 | | | $ | 5,866 | | | $ | — | | | $ | 731,996 | | | $ | 732,921 |
Average interest rate | | | 3.55 | % | | | 4.64 | % | | | 4.63 | % | | | 4.64 | % | | | 5.47 | % | | | | | | | 3.68 | % | | | |
| | | | | | | | | | | | | | | | | | | | | | | | | | | | | | | |
Interest sensitivity gap | | | (232,247 | ) | | | 52,200 | | | | 61,378 | | | | 74,151 | | | | 113,021 | | | | 177,191 | | | | | | | | |
Cumulative gap | | | (232,247 | ) | | | (180,047 | ) | | | (118,669 | ) | | | (44,518 | ) | | | 68,503 | | | | 245,694 | | | | | | | | |
Cumulative gap to total assets | | | (21.9 | %) | | | (16.7 | %) | | | (11.0 | %) | | | (4.1 | %) | | | 6.4 | % | | | 22.8 | % | | | | | | | |
Cumulative gap (RSA/RSL) (5) | | | 0.64 | | | | 0.74 | | | | 0.83 | | | | 0.94 | | | | 1.09 | | | | 1.34 | | | | | | | | |
| (1) | Securities are shown at amortized cost. |
| (2) | Represents interest earning Federal Reserve stock and Federal Home Loan Bank stock. |
| (3) | Loans are shown at gross value. |
| (4) | Includes fed funds sold and money market accounts held at a large regional bank. |
| (5) | Rate sensitive assets (RSA) divided by rate sensitive liabilities (RSL), cumulative basis. |
54
Contractual Obligations
While our liquidity monitoring and management considers both present and future demands for and sources of liquidity, the following table of contractual commitments focuses only on our future obligations. In the table, all deposits with indeterminate maturities, such as demand deposits, checking accounts, savings accounts and money market accounts, are presented as having a maturity of one year or less.
| | | | | | | | | | | | | | | |
| | | December 31, 2006 |
(in thousands of dollars) | | Total | | Due in one year
or less | | Due over one
year and
less than
three years | | Due over three
years and
less than
five years | | Due over five
years |
Contractual commitments: | | | | | | | | | | | | | | | |
Deposit maturities | | $ | 892,806 | | $ | 810,007 | | $ | 64,958 | | $ | 17,841 | | $ | — |
Securities sold under agreements to repurchase | | | 52,792 | | | 52,792 | | | — | | | — | | | — |
Corporate debenture | | | 10,000 | | | — | | | — | | | — | | | 10,000 |
Operating lease obligations | | | 1,952 | | | 533 | | | 707 | | | 465 | | | 247 |
| | | | | | | | | | | | | | | |
Total | | $ | 957,550 | | $ | 863,332 | | $ | 65,665 | | $ | 18,306 | | $ | 10,247 |
| | | | | | | | | | | | | | | |
Primary Sources and Uses of Funds
Our primary sources of funds during the year ended December 31, 2006 were a $97,437,000 increase in deposits, $488,000 of proceeds received upon the exercise of stock options by our employees, $10,625,000 in funds provided by operations, a $9,981,000 increase in borrowings, net cash from acquisition of Mid FL of $13,646,000 and $373,000 proceeds from the sale of land.
Our primary uses of funds during 2006 included a $88,548,000 increase in net loans outstanding, $9,923,000 purchases of premises and equipment, a $6,449,000 increase in investment securities net of maturities/sales, $1,000,000 purchase of bank owned life insurance, $1,535,000 in dividends paid to our shareholders and a $25,095,000 increase in federal funds sold and other cash items.
Capital Resources
Total stockholders’ equity at December 31, 2006 was $117,332,000, or 10.9% of total assets compared to $97,241,000, or 11.2% of total assets at December 31, 2005. The $20,091,000 increase was primarily the result of the following items: common stock issued pursuant to the acquisition of Mid FL ($10,965,000), plus net income ($8,459,000), plus exercise of stock options ($488,000), plus stock based compensation expense pursuant to Statement of Accounting Standard No. 123(R) ($594,000), plus net change of unrealized gain in securities available for sale ($1,120,000), less dividends paid ($1,535,000).
The bank regulatory agencies have established risk-based capital requirements for banks. These guidelines are intended to provide an additional measure of a bank’s capital adequacy by assigning weighted levels of risk to asset categories. Banks are also required to systematically maintain capital against such “off- balance sheet” activities as loans sold with recourse, loan commitments, guarantees and standby letters of credit. These guidelines are intended to strengthen the quality of capital by increasing the emphasis on common equity and restricting the amount of loan loss reserves and other forms of equity such as preferred stock that may be included in capital. Each of our Company’s subsidiary Banks’ objective is to maintain its current status as a “well-capitalized institution” as that term is defined by its regulators.
55
Under the terms of the guidelines, banks must meet minimum capital adequacy based upon both total assets and risk-adjusted assets. All banks are required to maintain a minimum ratio of total capital to risk-weighted assets of 8% and a minimum ratio of Tier 1 capital to risk-weighted assets of 4%. Adherence to these guidelines has not had an adverse impact on our Company.
Selected consolidated capital ratios at December 31, 2006, and 2005 were as follows:
Capital Ratios
(Dollars are in thousands)
| | | | | | | | | | | | | | | |
| | | Actual | | | Well Capitalized | | | Excess |
| | | Amount | | Ratio | | | Amount | | Ratio | | | Amount |
As of December 31, 2006: | | | | | | | | | | | | | | | |
Total capital: (to risk weighted assets): | | $ | 122,387 | | 16.6 | % | | $ | 73,716 | | 10.0 | % | | $ | 48,671 |
Tier 1 capital: (to risk weighted assets): | | $ | 115,032 | | 15.6 | % | | $ | 44,230 | | 6.0 | % | | $ | 70,802 |
Tier 1 capital: (to average assets): | | $ | 115,032 | | 11.2 | % | | $ | 51,236 | | 5.0 | % | | $ | 63,796 |
| | | | | |
As of December 31, 2005: | | | | | | | | | | | | | | | |
Total capital: (to risk weighted assets): | | $ | 110,344 | | 19.2 | % | | $ | 57,379 | | 10.0 | % | | $ | 52,965 |
Tier 1 capital: (to risk weighted assets): | | $ | 103,853 | | 18.1 | % | | $ | 34,427 | | 6.0 | % | | $ | 69,426 |
Tier 1 capital: (to average assets): | | $ | 103,853 | | 12.4 | % | | $ | 42,029 | | 5.0 | % | | $ | 61,824 |
Effects of Inflation and Changing Prices
The accompanying consolidated financial statements have been prepared in accordance with generally accepted accounting principles, which require the measurement of financial position and operating results in terms of historical dollars without considering the change in the relative purchasing power of money over time due to inflation. Unlike most industrial companies, virtually all of the assets and liabilities of a financial institution are monetary in nature. As a result, interest rates generally have a more significant impact on the performance of a financial institution than the effects of general levels of inflation. Although interest rates do not necessarily move in the same direction or to the same extent as the prices of goods and services, increases in inflation generally have resulted in increased interest rates. In addition, inflation affects financial institutions’ increased cost of goods and services purchased, the cost of salaries and benefits, occupancy expense, and similar items. Inflation and related increases in interest rates generally decrease the market value of investments and loans held and may adversely affect liquidity, earnings, and shareholders’ equity. Commercial and other loan originations and refinancings tend to slow as interest rates increase, and can reduce our earnings from such activities.
Off-Balance Sheet Arrangements
We do not currently have any off-balance sheet arrangements, other than approved and unfunded loans and letters and lines of credit to our customers in the ordinary course of business.
Accounting Pronouncements
Refer to Note 1(x) in our Notes to Consolidated Financial Statements for a discussion on the effects of new accounting pronouncements.
| Item 7A. | Quantitative and qualitative disclosures about market risk. |
Market risk is the risk of economic loss from adverse changes in the fair value of financial instruments due to changes in (a) interest rates, (b) foreign exchange rates, or (c) other factors that relate to
56
market volatility of the rate, index, or price underlying the financial instrument. Our market risk is composed primarily of interest rate risk. Each of our subsidiary Banks has an Asset/Liability Committee (“ALCO”) which is responsible for reviewing the interest rate sensitivity position, and establishing policies to monitor and limit the exposure to interest rate risk for their specific Bank. Substantially all of our interest rate risk exposure relates to the financial instrument activity of each of our subsidiary Banks. As such, the board of directors of each subsidiary Bank is responsible to review and approve the policies and guidelines established by their Bank’s ALCO.
The primary objective of asset/liability management is to provide an optimum and stable net interest margin, after-tax return on assets and return on equity capital, as well as adequate liquidity and capital. Interest rate risk is measured and monitored through gap analysis, which measures the amount of repricing risk associated with the balance sheet at specific points in time. See “Liquidity and Market Risk Management” presented in Item 7 above for quantitative disclosures in tabular format, as well as additional qualitative disclosures.
| Item 8. | Financial Statements and Supplementary Data |
The financial statements of our Company as of December 31, 2006 and 2005 and for the years ended December 31, 2006, 2005 and 2004 are set forth in this Form 10-K at page 64.
| Item 9. | Changes in and Disagreements with Accountants on Accounting and Financial Disclosure. |
On April 4, 2006, KPMG LLP (“KPMG”) was advised that the firm’s services as auditors of the Company were terminated. The decision was approved by the Audit Committee of the Board of Directors of the Company.
The audit reports of KPMG on the consolidated financial statements of CenterState Banks of Florida, Inc. and subsidiaries as of and for the years ended December 31, 2005 and 2004 did not contain an adverse opinion or a disclaimer of opinion and were not qualified or modified as to uncertainty, audit scope or accounting principle. The audit reports of KPMG on management’s assessment of the effectiveness of internal control over financial reporting and the effectiveness of internal control over financial reporting as of December 31, 2005 and 2004 did not contain an adverse opinion or disclaimer of opinion, and were not qualified or modified as to uncertainty, audit scope or accounting principles.
In connection with the audits of the Company’s consolidated financial statements for each of the fiscal years ended December 31, 2005 and 2004 there were: (1) no disagreements between the Company and KPMG on any matters of accounting principles or practices, financial statement disclosure, or auditing scope or procedure, which disagreements, if not resolved to the satisfaction of KPMG, would have caused KPMG to make reference in connection with their opinion to the subject matter of the disagreement, and (2) no reportable events.
The Company has engaged Crowe Chizek and Company LLC (“Crowe Chizek”) to serve as its new independent registered certified public accountants. Prior to the engagement of Crowe Chizek to provide the audit of the Company’s financial statements and the review of interim filings, the Company did not consult Crowe Chizek regarding any matter requiring disclosure under Item 304(a)(2) of Regulation S-K.
57
| Item 9A. | Controls and Procedures. |
| | (a) | Evaluation of disclosure controls and procedures. The Company maintains controls and procedures designed to ensure that information required to be disclosed in the reports that the Company files or submits under the Securities Exchange Act of 1934 is recorded, processed, summarized and reported within the time periods specified in the rules and forms of the Securities and Exchange Commission. Based upon their evaluation of those controls and procedures performed within 90 days of the filing date of this report, the Chief Executive and Chief Financial officers of the Company concluded that the Company’s disclosure controls and procedures were adequate. |
| | (b) | Changes in internal controls. The Company made no significant changes in its internal controls or in other factors that could significantly affect these controls subsequent to the date of the evaluation of those controls by the Chief Executive and Chief Financial officers. |
| | (c) | Management’s report on internal control over financial reporting. Management’s assessment of the effectiveness of internal control over financial reporting as of December 31, 2006 has been audited by Crowe Chizek and Company LLC, an independent registered public accounting firm, as stated in their report which is included herein. Management is responsible for establishing and maintaining adequate internal control over financial reporting, as such term is defined in Exchange Act Rules 13a-15(f). Under the supervision and with the participation of our management, including our Chief Executive Officer and Chief Financial Officer, we conducted an evaluation of the effectiveness of our internal control over financial reporting based on the framework inInternal Control – Integrated Framework issued by the Committee of Sponsoring Organizations, also referred to as the Treadway Commission. Based upon our evaluation under the framework inInternal Control – Integrated Framework, management concluded that our internal control over financial reporting was effective as of December 31, 2006. |
Management’s assessment excluded internal control over financial reporting for CenterState Bank Mid Florida as allowed by the SEC for current year acquisitions. CenterState Bank Mid Florida was acquired on March 31, 2006 and represents 9% of the Company’s consolidated assets as of December 31, 2006 and 5.9% of consolidated net income for the year ending December 31, 2006.
| Item 9B. | Other Information. |
Not applicable.
58
PART III
| Item 10. | Directors, Executive Officers and Corporate Governance |
Our Company has a Code of Ethics that applies to its principal executive officer and principal financial officer (who is also its principal accounting officer), a copy of which is included with this Form 10-K as Exhibit 14.1. The information contained under the sections captioned “Directors” and “Executive Officers” under “Proposal One – Election of Directors,” and in the sections captioned “Audit Committee Report” and “Section 16(a) Reporting Requirements,” in the registrant’s definitive Proxy Statement for the Annual Meeting of Shareholders to be held on April 24, 2007, to be filed with the SEC pursuant to Regulation 14A within 120 days of their registrant’s fiscal year end (the “Proxy Statement”), is incorporated herein by reference.
| Item 11. | Executive Compensation |
The information contained in the sections captioned “Executive Compensation,” “Director Compensation,” “Compensation Committee Report,” and “Compensation Committee Interlocks and Insider Participation” in the Proxy Statement, is incorporated herein by reference.
| Item 12. | Security Ownership of Certain Beneficial Owners and Management |
Information contained in the section captioned “Management and Principal Stock Ownership” under “Election of Directors,” and under the table captioned “Equity Compensation Plan Information,” in the Proxy Statement, is incorporated herein by reference.
| Item 13. | Certain Relationships and Related Transactions, and Director Independence |
The information contained in the section entitled “Director Independence” under “Proposal One – Election of Directors” and “Certain Related Transactions” in the Proxy Statement is incorporated herein by reference.
| Item 14. | Principal Accountant Fees and Services |
The information contained in the section captioned “Independent Auditors” in the Proxy Statement is incorporated herein by reference.
| Item 15. | Exhibits and Financial Statement Schedules |
| | (a) | The following documents are filed as part of this report: |
Reports of Independent Registered Public Accounting Firm
Consolidated Balance Sheets as of December 31, 2006 and 2005
Consolidated Statements of Operations for the years ended December 31, 2006, 2005 and 2004
Consolidated Statements of Cash Flows for the years ended December 31, 2006, 2005 and 2004
59
Consolidated Statement of changes in stockholders’ Equity and Comprehensive Income for the years ended December 31, 2006, 2005 and 2004
Notes to Consolidated Financial Statements
| | 2. | Financial Statement Schedules |
All schedules have been omitted as the required information is either inapplicable or included in the Notes to Consolidated Financial Statements.
| | | | |
| 3.1 | | - | | Articles of Incorporation of CenterState Banks of Florida, Inc. (Incorporated by reference to Exhibit 3.1 to the Company’s Registration Statement No. 333-95087 (the “Registration Statement”)) |
| | |
| 3.2 | | - | | Articles of Amendment to Articles of Incorporation of CenterState Banks of Florida, Inc. (Incorporated by reference to Exhibit 99.1 to the Company’s Form 8-K dated April 25, 2006.) |
| | |
| 3.3 | | - | | Bylaws of CenterState Banks of Florida, Inc. (Incorporated by reference to Exhibit 3.2 to the Registration Statement) |
| | |
| 4.1 | | - | | Specimen Stock Certificate of CenterState Banks of Florida, Inc. (Incorporated by reference to Exhibit 4.2 to the Registration Statement) |
| | |
| 10.1 | | - | | CenterState Banks of Florida, Inc. Stock Option Plan (Incorporated by reference to Exhibit 10.1 to the Registration Statement)* |
| | |
| 10.2 | | - | | CenterState Banks of Florida, Inc. Employee Stock Purchase Plan (Incorporated by reference to Appendix A to the Company’s Proxy Statement dated March 25, 2004 )* |
| | |
| 10.3 | | - | | Form of CenterState Banks of Florida, Inc. Split Dollar Agreement (Incorporated by reference to Exhibit 10.1 to the Company’s Form 8-K dated January 11, 2006) |
| | |
| 10.4 | | - | | Form of CenterState Banks of Florida, Inc. Change in Control and Severance Agreement for Ernest S. Pinner, President, CEO and Chairman of the Board, James J. Antal, Senior Vice President, CFO and Corporate Secretary (Incorporated by reference to Exhibit 10.1 to the Company’s Form 8-K dated July 12, 2006) |
| | |
| 10.5 | | - | | Form of CenterState Banks of Florida, Inc. Change in Control and Severance Agreement for George H. Carefoot, Senior Vice President, Treasurer and Chief Operations Officer, and the Company’s four subsidiary bank Presidents Thomas E. White, James S. Stalnaker, Jr., John C. Corbett and Timothy A. Pierson. (Incorporated by reference to Exhibit 10.2 to the Company’s Form 8-K dated July 12, 2006) |
60
| | | | |
| 14.1 | | - | | Code of Ethics (Incorporated by reference to Exhibit 14.1 to the Company’s December 31, 2003 Form 10-K dated March 26, 2004) |
| | |
| 21.1 | | - | | List of Subsidiaries of CenterState Banks of Florida, Inc. |
| | |
| 23.1 | | - | | Consent of Crowe Chizek and Company LLC |
| | |
| 23.2 | | - | | Consent of KPMG LLP |
| | |
| 31.1 | | - | | Certification of President and Chief Executive Officer under Section 302 of the Sarbanes–Oxley Act of 2002 |
| | |
| 31.2 | | - | | Certification of Chief Financial Officer under Section 302 of the Sarbanes-Oxley Act of 2002 |
| | |
| 32.1 | | - | | Certification of President and Chief Executive Officer under Section 906 of the Sarbanes–Oxley Act of 2002 |
| | |
| 32.2 | | - | | Certification of Chief Financial Officer under Section 906 of the Sarbanes-Oxley Act of 2002 |
| * | Represents a management contract or compensatory plan or arrangement required to be filed as an exhibit. |
61
CENTERSTATE BANKS OF FLORIDA, INC. and SUBSIDIARIES
Index to consolidated financial statements
| | |
Report of Independent Registered Public Accounting Firm | | 63 |
| |
Report of Independent Registered Public Accounting Firm | | 65 |
| |
Consolidated Balance Sheets as of December 31, 2006 and 2005 | | 66 |
| |
Consolidated Statements of Operations for the years ended December 31, 2006, 2005 and 2004 | | 67 |
| |
Consolidated Statement of Changes in Stockholders’ Equity for the years ended December 31, 2006, 2005 and 2004 | | 68 |
| |
Consolidated Statements of Cash Flows for the years ended December 31, 2006, 2005 and 2004 | | 69 |
| |
Notes to Consolidated Financial Statements | | 71 |
62
REPORT OF INDEPENDENT REGISTERED PUBLIC ACCOUNTING FIRM
Board of Directors and Shareholders
CenterState Banks of Florida, Inc.
Winter Haven, Florida
We have audited the accompanying consolidated balance sheet of CenterState Banks of Florida, Inc. as of December 31, 2006, and the related statements of operations, changes in stockholders’ equity, and cash flows for the year then ended. We also have audited management’s assessment, included in Management’s Report on Internal Control Over Financial Reporting in Item 9A of the accompanying Form 10-K, that CenterState Banks of Florida, Inc. maintained effective internal control over financial reporting as of December 31, 2006, based on the framework set forth by the Committee of Sponsoring Organizations of the Treadway Commission (COSO) in “Internal Control—Integrated Framework.” CenterState Banks of Florida, Inc.’s management is responsible for these financial statements, for maintaining effective internal control over financial reporting, and for its assessment of the effectiveness of internal control over financial reporting. Our responsibility is to express an opinion on these financial statements, an opinion on management’s assessment, and an opinion on the effectiveness of the Company’s internal control over financial reporting based on our audit. The consolidated balance sheet of CenterState Banks of Florida, Inc. as of December 31, 2005, and the related statements of operations, changes in stockholders’ equity, and cash flows for each of the two years in the period ended December 31, 2005, were audited by other auditors whose report dated March 10, 2006, expressed an unqualified opinion on those statements.
We conducted our audit in accordance with the standards of the Public Company Accounting Oversight Board (United States). Those standards require that we plan and perform the audit to obtain reasonable assurance about whether the financial statements are free of material misstatement and whether effective internal control over financial reporting was maintained in all material respects. Our audit of the financial statements included examining, on a test basis, evidence supporting the amounts and disclosures in the financial statements, assessing the accounting principles used and significant estimates made by management, and evaluating the overall financial statement presentation. Our audit of internal control over financial reporting included obtaining an understanding of internal control over financial reporting, evaluating management’s assessment, testing and evaluating the design and operating effectiveness of internal control, and performing such other procedures as we considered necessary in the circumstances. We believe that our audit provides a reasonable basis for our opinions.
A company’s internal control over financial reporting is a process designed to provide reasonable assurance regarding the reliability of financial reporting and the preparation of financial statements for external purposes in accordance with generally accepted accounting principles. A company’s internal control over financial reporting includes those policies and procedures that (1) pertain to the maintenance of records that, in reasonable detail, accurately and fairly reflect the transactions and dispositions of the assets of the company; (2) provide reasonable assurance that transactions are recorded as necessary to permit preparation of financial statements in accordance with generally accepted accounting principles, and that receipts and expenditures of the company are being made only in accordance with authorizations of management and directors of the company; and (3) provide reasonable assurance regarding prevention or timely detection of unauthorized acquisition, use, or disposition of the company’s assets that could have a material effect on the financial statements.
Because of its inherent limitations, internal control over financial reporting may not prevent or detect misstatements. Also, projections of any evaluation of effectiveness to future periods are subject to the risk that controls may become inadequate because of changes in conditions, or that the degree of compliance with the policies or procedures may deteriorate.
63
As permitted, the Company excluded the bank acquired in March 2006 (CenterState Bank Mid Florida of Leesburg, Florida) from the scope of Management’s Report on Internal Control Over Financial Reporting. As such, this entity has also been excluded from the scope of our audit of internal control over financial reporting.
In our opinion, the 2006 consolidated financial statements referred to above present fairly, in all material respects, the financial position of CenterState Banks of Florida, Inc. as of December 31, 2006, and the results of its operations and its cash flows for the year then ended, in conformity with accounting principles generally accepted in the United States of America. Also in our opinion, management’s assessment that CenterState Banks of Florida, Inc. maintained effective internal control over financial reporting as of December 31, 2006, is fairly stated, in all material respects, based on the framework set forth by the Committee of Sponsoring Organizations of the Treadway Commission (COSO) in “Internal Control—Integrated Framework.” Furthermore, in our opinion, CenterState Banks of Florida, Inc. maintained, in all material respects, effective internal control over financial reporting as of December 31, 2006, based on the framework set forth by the Committee of Sponsoring Organizations of the Treadway Commission (COSO) in “Internal Control—Integrated Framework.”
|
| Crowe Chizek and Company LLC |
Fort Lauderdale, Florida
March 12, 2007
64
REPORT OF INDEPENDENT REGISTERED PUBLIC ACCOUNTING FIRM
The Board of Directors and Shareholders
Centerstate Banks of Florida, Inc.:
We have audited the accompanying consolidated balance sheet of CenterState Banks of Florida, Inc. and subsidiaries (the Company) as of December 31, 2005, and the related consolidated statements of operations, changes in stockholders’ equity and comprehensive income, and cash flows for each of the years in the two-year period ended December 31, 2005. These consolidated financial statements are the responsibility of the Company’s management. Our responsibility is to express an opinion on these consolidated financial statements based on our audits.
We conducted our audits in accordance with the standards of the Public Company Accounting Oversight Board (United States). Those standards require that we plan and perform the audit to obtain reasonable assurance about whether the financial statements are free of material misstatement. An audit includes examining, on a test basis, evidence supporting the amounts and disclosures in the financial statements. An audit also includes assessing the accounting principles used and significant estimates made by management, as well as evaluating the overall financial statement presentation. We believe that our audits provide a reasonable basis for our opinion.
In our opinion, the consolidated financial statements referred to above represent fairly, in all material respects, the financial position of CenterState Banks of Florida, Inc. and subsidiaries as of December 31, 2005, and the results of their operations and their cash flows for each of the years in the two-year period ended December 31, 2005, in conformity with U.S. generally accepted accounting principles.
KPMG, LLP
Tampa, Florida
March 10, 2006
Certified Public Accountants
65
CENTERSTATE BANKS OF FLORIDA, INC. AND SUBSIDIARIES
Consolidated Balance Sheets
December 31, 2006 and 2005
(in thousands of dollars, except per share data)
| | | | | | | | |
| | | 2006 | | | 2005 | |
Assets | | | | | | | | |
Cash and due from banks | | $ | 40,385 | | | $ | 41,949 | |
Federal funds sold and money market account | | | 79,636 | | | | 52,977 | |
| | | | | | | | |
Cash and cash equivalents | | | 120,021 | | | | 94,926 | |
| | |
Investment securities available for sale, at fair value | | | 235,350 | | | | 217,369 | |
| | |
Loans | | | 657,963 | | | | 516,658 | |
Less allowance for loan losses | | | (7,355 | ) | | | (6,491 | ) |
| | | | | | | | |
Net loans | | | 650,608 | | | | 510,167 | |
| | |
Accrued interest receivable | | | 5,035 | | | | 3,610 | |
Federal Home Loan Bank and Federal Reserve Bank stock | | | 2,665 | | | | 1,472 | |
Bank premises and equipment, net | | | 39,879 | | | | 28,909 | |
Deferred income taxes, net | | | 1,898 | | | | 2,712 | |
Goodwill | | | 9,863 | | | | 4,675 | |
Core deposit intangible | | | 3,083 | | | | 479 | |
Bank owned life insurance | | | 7,320 | | | | 6,043 | |
Prepaid expenses and other assets | | | 1,380 | | | | 1,159 | |
| | | | | | | | |
Total assets | | $ | 1,077,102 | | | $ | 871,521 | |
| | | | | | | | |
Liabilities and Stockholders’ Equity | | | | | | | | |
| | |
Deposits: | | | | | | | | |
Interest bearing | | $ | 669,204 | | | $ | 497,893 | |
Noninterest bearing | | | 223,602 | | | | 219,444 | |
| | | | | | | | |
Total deposits | | | 892,806 | | | | 717,337 | |
| | |
Securities sold under agreement to repurchase | | | 52,792 | | | | 41,811 | |
Corporate debenture | | | 10,000 | | | | 10,000 | |
Other borrowed funds | | | — | | | | 1,000 | |
Accrued interest payable | | | 993 | | | | 582 | |
Accounts payable and accrued expenses | | | 3,179 | | | | 3,430 | |
| | | | | | | | |
Total liabilities | | | 959,770 | | | | 774,160 | |
| | | | | | | | |
| | |
Minority interest | | | — | | | | 120 | |
| | |
Stockholders’ equity: | | | | | | | | |
Preferred stock, $.01 par value; 5,000,000 shares authorized, no shares issued or outstanding | | | — | | | | — | |
Common stock, $.01 par value: 40,000,000 shares authorized; 11,129,020 and 10,500,772 shares issued and outstanding at December 31, 2006 and 2005, respectively | | | 111 | | | | 52 | |
Additional paid-in capital | | | 86,989 | | | | 75,001 | |
Retained earnings | | | 30,878 | | | | 23,954 | |
Accumulated other comprehensive income (loss) | | | (646 | ) | | | (1,766 | ) |
| | | | | | | | |
Total stockholders’ equity | | | 117,332 | | | | 97,241 | |
| | | | | | | | |
Total liabilities and stockholders’ equity | | $ | 1,077,102 | | | $ | 871,521 | |
| | | | | | | | |
See accompanying notes to the consolidated financial statements
66
CENTERSTATE BANKS OF FLORIDA, INC. AND SUBSIDIARIES
Consolidated Statements of Operations
Years ended December 31, 2006, 2005 and 2004
(in thousands of dollars, except per share data)
| | | | | | | | | | |
| | | 2006 | | 2005 | | | 2004 |
| Interest income: | | | | | | | | | | |
Loans | | $ | 46,469 | | $ | 32,524 | | | $ | 25,434 |
Investment securities | | | 9,653 | | | 6,101 | | | | 2,940 |
Federal funds sold and money market accounts | | | 2,991 | | | 1,641 | | | | 714 |
| | | | | | | | | | |
| | | | 59,113 | | | 40,266 | | | | 29,088 |
| | | | | | | | | | |
Interest expense: | | | | | | | | | | |
Deposits | | | 18,990 | | | 10,011 | | | | 7,185 |
Securities sold under agreement to repurchase | | | 2,156 | | | 1,013 | | | | 193 |
Corporate debentures | | | 864 | | | 682 | | | | 496 |
Other borrowed funds | | | — | | | 16 | | | | — |
| | | | | | | | | | |
| | | 22,010 | | | 11,722 | | | | 7,874 |
| | | | | | | | | | |
Net interest income | | | 37,103 | | | 28,544 | | | | 21,214 |
| Provision for loan losses | | | 717 | | | 1,065 | | | | 1,270 |
| | | | | | | | | | |
Net interest income after provision for loan losses | | | 36,386 | | | 27,479 | | | | 19,944 |
| | | | | | | | | | |
| Other income: | | | | | | | | | | |
Service charges on deposit accounts | | | 3,401 | | | 3,222 | | | | 3,113 |
Commissions from mortgage broker activities | | | 341 | | | 499 | | | | 571 |
Commissions from sale of mutual funds and annuities | | | 695 | | | 321 | | | | 207 |
Debit card and ATM fees | | | 592 | | | 508 | | | | 404 |
Other income | | | 1,090 | | | 825 | | | | 626 |
Gain on sale of branches | | | — | | | — | | | | 1,844 |
Gain (loss) on sale of securities | | | 17 | | | (3 | ) | | | — |
Gain on sale of other real estate owned | | | — | | | 8 | | | | 11 |
| | | | | | | | | | |
| | | 6,136 | | | 5,380 | | | | 6,776 |
| | | | | | | | | | |
Other expenses: | | | | | | | | | | |
Salaries, wages and employee benefits | | | 16,961 | | | 12,623 | | | | 10,440 |
Occupancy expense | | | 3,443 | | | 2,780 | | | | 2,419 |
Depreciation of premises and equipment | | | 1,935 | | | 1,642 | | | | 1,526 |
Supplies, stationary and printing | | | 607 | | | 522 | | | | 456 |
Marketing expenses | | | 585 | | | 447 | | | | 378 |
Data processing expense | | | 1,105 | | | 961 | | | | 864 |
Legal, audit and other professional fees | | | 673 | | | 577 | | | | 626 |
Core deposit intangible (CDI) amortization | | | 514 | | | 72 | | | | 86 |
Other expenses | | | 3,381 | | | 3,181 | | | | 2,985 |
| | | | | | | | | | |
Total other expenses | | | 29,204 | | | 22,805 | | | | 19,780 |
| | | | | | | | | | |
Income before provision for income taxes | | | 13,318 | | | 10,054 | | | | 6,940 |
Provision for income taxes | | | 4,859 | | | 3,724 | | | | 2,567 |
| | | | | | | | | | |
Net income | | $ | 8,459 | | $ | 6,330 | | | $ | 4,373 |
| | | | | | | | | | |
Earnings per share: | | | | | | | | | | |
Basic | | $ | 0.770 | | $ | 0.675 | | | $ | 0.585 |
| | | | | | | | | | |
Diluted | | $ | 0.750 | | $ | 0.655 | | | $ | 0.570 |
| | | | | | | | | | |
| Common shares used in the calculation of earnings per share: | | | | | | | | | | |
Basic | | | 10,964,890 | | | 9,357,046 | | | | 7,500,316 |
| | | | | | | | | | |
Diluted | | | 11,232,059 | | | 9,629,194 | | | | 7,656,308 |
| | | | | | | | | | |
See accompanying notes to the consolidated financial statements.
67
CENTERSTATE BANKS OF FLORIDA, INC. AND SUBSIDIARIES
Consolidated Statements of Changes in Stockholders’ Equity
Years ended December 31, 2006, 2005, and 2004
(in thousands of dollars)
| | | | | | | | | | | | | | | | | | | | | | |
| | | Number of
Shares | | Common
stock | | | Additional
paid-in
capital | | | Retained
earnings | | | Accumulated
other
comprehensive
income (loss) | | | Total
stockholders’
equity | |
Balances at January 1, 2004 | | 6,738,760 | | $ | 34 | | | $ | 26,500 | | | $ | 15,409 | | | $ | 20 | | | $ | 41,963 | |
Comprehensive income: | | | | | | | | | | | | | | | | | | | | | | |
Net income | | | | | — | | | | — | | | | 4,373 | | | | — | | | | 4,373 | |
Unrealized holding loss on available for sale securities, net of deferred income taxes of $476 | | | | | — | | | | — | | | | — | | | | (791 | ) | | | (791 | ) |
| | | | | | | | | | | | | | | | | | | | | | |
Total comprehensive income | | | | | | | | | | | | | | | | | | | | | 3,582 | |
Dividends paid ($0.12 per share) | | | | | — | | | | — | | | | (933 | ) | | | — | | | | (933 | ) |
Stock options exercised, including tax benefit | | 47,412 | | | — | | | | 354 | | | | — | | | | — | | | | 354 | |
Shareholder rights offering (net of cost) | | 1,351,254 | | | 7 | | | | 12,691 | | | | — | | | | — | | | | 12,698 | |
| | | | | | | | | | | | | | | | | | | | | | |
Balances at December 31, 2004 | | 8,137,426 | | $ | 41 | | | $ | 39,545 | | | $ | 18,849 | | | $ | (771 | ) | | $ | 57,664 | |
Comprehensive income: | | | | | | | | | | | | | | | | | | | | | | |
Net income | | | | | — | | | | — | | | | 6,330 | | | | — | | | | 6,330 | |
Unrealized holding loss on available for sale securities, net of deferred income taxes of $600 | | | | | — | | | | — | | | | — | | | | (995 | ) | | | (995 | ) |
| | | | | | | | | | | | | | | | | | | | | | |
Total comprehensive income | | | | | | | | | | | | | | | | | | | | | 5,335 | |
Dividends paid ($0.13 per share) | | | | | — | | | | — | | | | (1,225 | ) | | | — | | | | (1,225 | ) |
Stock options exercised | | 63,346 | | | — | | | | 613 | | | | — | | | | — | | | | 613 | |
Public stock offering (net of cost) | | 2,300,000 | | | 11 | | | | 34,843 | | | | — | | | | — | | | | 34,854 | |
| | | | | | | | | | | | | | | | | | | | | | |
Balances at December 31, 2005 | | 10,500,772 | | $ | 52 | | | $ | 75,001 | | | $ | 23,954 | | | $ | (1,766 | ) | | $ | 97,241 | |
Comprehensive income: | | | | | | | | | | | | | | | | | | | | | | |
Net income | | | | | — | | | | — | | | | 8,459 | | | | — | | | | 8,459 | |
Unrealized holding gain on available for sale securities, net of deferred income taxes of $659 | | | | | — | | | | — | | | | — | | | | 1,120 | | | | 1,120 | |
| | | | | | | | | | | | | | | | | | | | | | |
Total comprehensive income | | | | | | | | | | | | | | | | | | | | | 9,579 | |
Dividends paid ($0.14 per share) | | | | | — | | | | — | | | | (1,535 | ) | | | — | | | | (1,535 | ) |
Stock options exercised, including tax benefit | | 73,638 | | | — | | | | 488 | | | | — | | | | — | | | | 488 | |
Stock based compensation expense | | | | | — | | | | 594 | | | | — | | | | — | | | | 594 | |
Shares issued pursuant to the acquisition of Mid FL | | 554,610 | | | 3 | | | | 10,962 | | | | — | | | | — | | | | 10,965 | |
Stock split | | | | | 56 | | | | (56 | ) | | | — | | | | — | | | | — | |
| | | | | | | | | | | | | | | | | | | | | | |
Balances at December 31, 2006 | | 11,129,020 | | $ | 111 | | | $ | 86,989 | | | $ | 30,878 | | | $ | (646 | ) | | $ | 117,332 | |
| | | | | | | | | | | | | | | | | | | | | | |
| | | | | | |
| | | | | 2006 | | | 2005 | | | 2004 | | | | | | | |
Disclosure of reclassification amounts: | | | | | | | | | | | | | | | | | | | | | | |
Unrealized holding gain (loss) arising during the year | | | | $ | 1,131 | | | $ | (997 | ) | | $ | (791 | ) | | | | | | | | |
Add: reclassified adjustments for (gain) loss included in net income, net of income taxes, at December 31, 2006, 2005 and 2004 of $6, $1 and $0, respectively | | | | | (11 | ) | | | 2 | | | | — | | | | | | | | | |
| | | | | | | | | | | | | | | | | | | | | | |
Net unrealized gain (loss) on securities | | | | $ | 1,120 | | | $ | (995 | ) | | $ | (791 | ) | | | | | | | | |
| | | | | | | | | | | | | | | | | | | | | | |
See accompanying notes to the consolidated financial statements.
68
CENTERSTATE BANKS OF FLORIDA, INC. AND SUBSIDIARIES
Consolidated Statements of Cash Flows
Years ended December 31, 2006, 2005 and 2004
(in thousands of dollars)
| | | | | | | | | | | | |
| | | 2006 | | | 2005 | | | 2004 | |
Cash flows from operating activities: | | | | | | | | | | | | |
Net income | | $ | 8,459 | | | $ | 6,330 | | | $ | 4,373 | |
Adjustments to reconcile net income to net cash provided by operating activities: | | | | | | | | | | | | |
Provision for loan losses | | | 717 | | | | 1,065 | | | | 1,270 | |
Depreciation of premises and equipment | | | 1,935 | | | | 1,642 | | | | 1,526 | |
Amortization of purchase accounting adjustments | | | 444 | | | | 4 | | | | (58 | ) |
Net amortization/accretion of investment securities | | | 162 | | | | 378 | | | | 470 | |
Net deferred loan origination fees | | | 78 | | | | 231 | | | | 9 | |
Write down of other real estate owned | | | — | | | | — | | | | 29 | |
Gain on sale of other real estate owned | | | — | | | | (8 | ) | | | (11 | ) |
(Gain) loss on sale or disposal of fixed assets | | | (10 | ) | | | 2 | | | | — | |
Deferred income taxes | | | 155 | | | | (228 | ) | | | 584 | |
Realized (gain) loss on sale of available for sale securities | | | (17 | ) | | | 3 | | | | — | |
Gain on sale of branches | | | — | | | | — | | | | (1,844 | ) |
Tax deduction in excess of book deduction on options exercised in 2005 and 2004 | | | — | | | | — | | | | 33 | |
Stock based compensation expense | | | 594 | | | | — | | | | — | |
Bank owned life insurance income | | | (277 | ) | | | (43 | ) | | | — | |
Cash provided by (used in) changes in: | | | | | | | | | | | | |
Net change in accrued interest receivable, prepaid expenses, and other assets | | | (1,517 | ) | | | (988 | ) | | | (931 | ) |
Net change in interest payable, accounts payable and accrued expenses | | | (98 | ) | | | 2,274 | | | | 595 | |
| | | | | | | | | | | | |
Net cash provided by operating activities | | | 10,625 | | | | 10,662 | | | | 6,045 | |
| | | | | | | | | | | | |
| | | |
Cash flows from investing activities: | | | | | | | | | | | | |
Purchases of investment securities available for sale | | | (56,618 | ) | | | (62,899 | ) | | | (126,110 | ) |
Purchases of mortgage backed securities available for sale | | | (56,583 | ) | | | (78,570 | ) | | | (32,783 | ) |
Proceeds from callable investment securities available for sale | | | — | | | | — | | | | 5,000 | |
Proceeds from maturities of investment securities available for sale | | | 78,250 | | | | 81,500 | | | | 44,105 | |
Proceeds from pay-downs of mortgage backed securities available for sale | | | 28,385 | | | | 27,559 | | | | 11,779 | |
Proceeds from sales of investment securities available for sale | | | 117 | | | | 2,993 | | | | 229 | |
Purchase of bank owed life insurance | | | (1,000 | ) | | | (6,000 | ) | | | — | |
Increase in loans, net of repayments | | | (88,548 | ) | | | (76,143 | ) | | | (49,498 | ) |
Purchases of premises and equipment, net | | | (9,550 | ) | | | (4,884 | ) | | | (5,883 | ) |
Proceeds from sale of other real estate owned | | | — | | | | 392 | | | | 497 | |
Net cash paid in connection with CSB merger | | | — | | | | — | | | | (65 | ) |
Net cash from branch sales | | | — | | | | — | | | | 829 | |
Net cash from acquisition of Mid FL bank | | | 13,646 | | | | — | | | | — | |
| | | | | | | | | | | | |
Net cash used in investing activities | | | (91,901 | ) | | | (116,052 | ) | | | (151,900 | ) |
| | | | | | | | | | | | |
| | | |
Cash flows from financing activities: | | | | | | | | | | | | |
Net increase in deposits | | | 97,437 | | | | 57,775 | | | | 145,543 | |
Net increase in securities sold under agreement to repurchase | | | 10,981 | | | | 17,184 | | | | 7,162 | |
Net (decrease) increase in other borrowed funds | | | (1,000 | ) | | | 1,000 | | | | — | |
Net proceeds from common stock issuance | | | — | | | | 34,854 | | | | 12,698 | |
Stock options exercised, including tax benefit in 2006 | | | 488 | | | | 613 | | | | 321 | |
Proceeds from sale of minority interest of subsidiary | | | — | | | | — | | | | 120 | |
Dividends paid | | | (1,535 | ) | | | (1,225 | ) | | | (933 | ) |
| | | | | | | | | | | | |
Net cash provided by financing activities | | | 106,371 | | | | 110,201 | | | | 164,911 | |
| | | | | | | | | | | | |
Net increase (decrease) in cash and cash equivalents | | | 25,095 | | | | 4,811 | | | | 19,056 | |
Cash and cash equivalents, at beginning of year | | | 94,926 | | | | 90,115 | | | | 71,059 | |
| | | | | | | | | | | | |
Cash and cash equivalents, at end of year | | $ | 120,021 | | | $ | 94,926 | | | $ | 90,115 | |
| | | | | | | | | | | | |
CENTERSTATE BANKS OF FLORIDA, INC. AND SUBSIDIARIES
Consolidated Statements of Cash Flows (continued)
Years ended December 31,2006, 2005, and 2004
(in thousands of dollars)
| | | | | | | | | |
| | | 2006 | | 2005 | | 2004 |
Transfer of loans to other real estate owned | | $ | — | | $ | — | | $ | 617 |
| | | | | | | | | |
| | | |
Cash paid during the year for: | | | | | | | | | |
Interest | | $ | 21,561 | | $ | 11,476 | | $ | 7,845 |
| | | | | | | | | |
Income taxes | | $ | 6,483 | | $ | 2,560 | | $ | 2,038 |
| | | | | | | | | |
See accompanying notes to the consolidated financial statements.
70
CENTERSTATE BANKS OF FLORIDA, INC. AND SUBSIDIARIES
Notes to Consolidated Financial Statements
(amounts are in thousands of dollars, except per share data)
December 31, 2006, 2005 and 2004
(1) Nature of Operations and Summary of Significant Accounting Policies
The consolidated financial statements of CenterState Banks of Florida, Inc. (the “Company”) include the accounts of CenterState Banks of Florida, Inc. (the “Parent Company”), its four wholly owned subsidiary banks and their wholly owned subsidiary, C. S. Processing.
The Company, through its subsidiary banks, operates through 30 locations in eight Counties throughout Central Florida, providing traditional deposit and lending products and services to its commercial and retail customers. C.S. Processing is a 100% owned subsidiary at December 31, 2006, which provides information technology and item processing services for the Company’s four subsidiary banks.
The following is a description of the basis of presentation and the significant accounting and reporting policies, which the Company follows in preparing and presenting its consolidated financial statements.
(a) Principles of consolidation
The accompanying consolidated financial statements include the accounts of the Parent Company, its four wholly owned banking subsidiaries (the “Banks”) and their wholly owned subsidiary, C.S. Processing. The operations of the Company currently consist primarily of the operations of each of the four banks. All significant intercompany accounts and transactions have been eliminated in consolidation.
(b) Use of estimates
The preparation of the consolidated financial statements in conformity with accounting principles generally accepted in the United States of America requires management to make estimates and assumptions that affect the reported amounts of assets and liabilities and disclosure of contingent assets and liabilities at the date of the financial statements and the reported amount of revenues and expenses during the reporting period. Significant items subject to estimates and assumptions include allowance for loan losses, fair values of financial instruments, useful life of intangibles and valuation of goodwill, and fair value estimates of stock-based compensation. Actual results could differ from these estimates.
(c) Cash flow reporting
For purposes of the statement of cash flows, the Company considers cash and due from banks, federal funds sold, money market and non interest bearing deposits in other banks with a purchased maturity of three months or less to be cash equivalents. Net cash flows are reported for customer loan and deposit transactions, interest bearing deposits in other financial institutions, and federal funds purchased and repurchase agreements.
(d) Investment securities available for sale
The Company accounts for its investments at fair value and classifies them as available for sale. Unrealized holding gains and losses are included as a separate component of stockholders’ equity, net of the effect of deferred income taxes.
Interest income includes amortization of purchase premium or discount. Premiums and discounts on securities are amortized on the level-yield method without anticipating prepayments, except for mortgage backed securities where prepayments are anticipated. Gains and losses on sales are recorded on the trade date and determined using the specific identification method.
CENTERSTATE BANKS OF FLORIDA, INC. AND SUBSIDIARIES
Notes to Consolidated Financial Statements
(amounts are in thousands of dollars, except per share data)
December 31, 2006, 2005 and 2004
A decline in the fair value of any available-for-sale security below cost that is deemed to be other-than-temporary results in a reduction in carrying amount to fair value. The impairment is charged to earnings and a new cost basis for the security is established. To determine whether an impairment is other-than-temporary, the Company considers whether it has the ability and intent to hold the investment until a market price recovery and considers whether evidence indicating the cost of the investment is recoverable outweighs evidence to the contrary. Evidence considered in this assessment includes the reasons for the impairment, the severity and duration of the impairment, changes in value subsequent to year-end, and forecasted performance of the security.
(e) Loans
Loans receivable that management has the intent and the Company has the ability to hold for the foreseeable future or payoff are reported at their outstanding unpaid principal balance, less the allowance for loan losses and deferred fees on originated loans.
Loan origination fees and the incremental direct cost of loan origination, are capitalized and recognized in income over the contractual life of the loans. If the loan is prepaid, the remaining unamortized fees and costs are charged or credited to interest income. Amortization ceases for non-accrual loans.
Loans are placed on nonaccrual status when the loan becomes 90 days past due as to interest or principal, or when the full timely collection of interest or principal becomes uncertain, unless the loan is both well secured and in the process of collection. When a loan is placed on nonaccrual status, the accrued and unpaid interest receivable is written off and accretion of the net deferred loan origination fees cease. The loan is accounted for on the cash or cost recovery method thereafter until qualifying for return to accrual status.
The Company, considering current information and events regarding the borrower’s ability to repay their obligations, considers a loan to be impaired when it is probable that the Company will be unable to collect all amounts due according to the contractual terms of the loan agreement. When a loan is considered to be impaired, the amount of the impairment is measured based on the present value of expected future cash flows discounted at the loan’s effective interest rate, the secondary market value of the loan, or the fair value of the collateral for collateral dependent loans. Impaired loans are written down to the extent that principal is judged to be uncollectible and, in the case of impaired collateral dependent loans where repayment is expected to be provided solely by the underlying collateral and there is no other available and reliable sources of repayment, are written down to the lower of cost or collateral value. Impairment losses are included in the allowance for loan losses. Large groups of smaller balance homogeneous loans, such as consumer and residential real estate loans, are collectively evaluated for impairment, and accordingly, they are not separately identified for impairment disclosures.
(f) Allowance for loan losses
The allowance for loan losses is a valuation allowance for probable incurred credit losses. Loan losses are charged against the allowance when management believes the uncollectibility of a loan balance is confirmed. Subsequent recoveries, if any, are credited to the allowance. Management estimates the allowance balance required using past loan loss experience, the nature and volume of the portfolio, information about specific borrower situations and estimated collateral values, economic conditions, and other factors. Allocations of the allowance may be made for specific loans, but the entire allowance is available for any loan that, in management’s judgment, should be charged-off.
CENTERSTATE BANKS OF FLORIDA, INC. AND SUBSIDIARIES
Notes to Consolidated Financial Statements
(amounts are in thousands of dollars, except per share data)
December 31, 2006, 2005 and 2004
The allowance consists of specific and general components. The specific component relates to loans that are individually classified as impaired. The general component covers loans that are not individually classified as impaired and is based on historical loss experience adjusted for current factors.
(g) Premises and equipment
Company premises and equipment are stated at cost less accumulated depreciation. Depreciation is provided on a straight-line basis over the estimated useful lives of the related assets (3 to 40 years). Leasehold improvements are depreciated over the shorter of their useful lives or the term of the lease. Major renewals and betterments of property are capitalized; maintenance, repairs, and minor renewals and betterments are expensed in the period incurred. Upon retirement or other disposition of the asset, the asset cost and related accumulated depreciation are removed from the accounts, and gains or losses are included in income.
(h) Federal Home Loan Bank (FHLB) and Federal Reserve Bank (FRB) stock
Several of the Company’s banks are members of the FHLB and FRB system. Members are required to own a certain amount of stock based on the level of borrowings and other factors, and may invest in additional amounts. FHLB and FRB stock is carried at cost (redemption value) and periodically evaluated for impairment. Dividends are reported as income.
(i) Bank owned life insurance (BOLI)
The Company, through its subsidiary banks, has purchased life insurance policies on certain key executives. Bank owned life insurance is recorded at its cash surrender value (or the amount that can be realized).
(j) Impairment of long-lived assets
In accordance with SFAS No. 144,Accounting for Impairment or Disposal of Long-Lived Assets, assets, such as premises and equipment, and purchased intangibles subject to amortization, are reviewed for impairment whenever events or changes in circumstances indicate that the carrying amount of the assets may not be recoverable. Recoverability of assets to be held and used is measured by a comparison of the carrying amount of an asset to estimated undiscounted future cash flows expected to be generated by the asset. If the carrying amount of an asset exceeds its estimated future cash flows, an impairment charge is recognized by the amount by which the carrying amount of the asset exceeds the fair value of the asset. Assets to be disposed of would be separately presented in the balance sheet and reported at the lower of the carrying amount or fair value less costs to sell, and are no longer depreciated. The assets and liabilities of a disposed group classified as held for sale would be presented separately in the appropriate asset and liability sections of the balance sheet.
(k) Goodwill and intangible assets
Goodwill represents the excess of costs over fair value of assets of businesses acquired. Goodwill and intangible assets acquired in a purchase business combination and determined to have an indefinite useful life are not amortized, but instead tested for impairment at least annually. Intangible assets with estimable useful lives are amortized over their respective estimated useful lives to their estimated residual values, and reviewed for impairment in accordance with SFAS No. 144,Accounting for Impairment or Disposal of Long-Lived Assets.
CENTERSTATE BANKS OF FLORIDA, INC. AND SUBSIDIARIES
Notes to Consolidated Financial Statements
(amounts are in thousands of dollars, except per share data)
December 31, 2006, 2005 and 2004
The core deposit intangible is amortized over a ten-year period on an accelerated basis using the projected decay rates of the underlying core deposits.
(l) Other real estate owned
Real estate acquired in the settlement of loans is recorded at the lower of cost (principal balance of the former loan plus costs of obtaining title and possession) or estimated fair value, less estimated selling costs. Costs relating to development and improvement of the property are capitalized, whereas those relating to holding the property are charged to operations.
(m) Loan commitments and related financial instruments
Financial instruments include off-balance sheet credit instruments, such as commitments to make loans and commercial letters of credit, issued to meet customer financing needs. The face amount for these items represents the exposure to loss, before considering customer collateral or ability to repay. Such financial instruments are recorded when they are funded.
(n) Stock based compensation
Effective January 1, 2006, the Company adopted Statement of Financial Accounting Standards (“SFAS”) No. 123(R),Share-based Payment, using the modified prospective transition method. Accordingly, the Company has recorded stock-based employee compensation cost using the fair value method starting in 2006. For 2006, adopting this Standard resulted in a reduction of income before income taxes of $594, a reduction in net income of $476, and a decrease in basic and diluted earnings per share of $0.04.
Prior to January 1, 2006, employee compensation expense under stock options was reported using the intrinsic value method; therefore, no stock-based compensation cost is reflected in net income for the years ending December 31, 2005 and 2004, as all options granted had an exercise price equal to or greater than the market price of the underlying common stock at date of grant.
The following table illustrates the effect on net income and earnings per share if expense was measured using the fair value recognition provision of SFAS No. 123,Accounting for Stock-Based Compensation, for the years ending December 31, 2005 and 2004:
| | | | | | | | |
| | | 2005 | | | 2004 | |
Net income as reported | | $ | 6,330 | | | $ | 4,373 | |
Deduct: Stock-based compensation expense Determined under fair value based method | | | (369 | ) | | | (420 | ) |
| | | | | | | | |
Pro forma net income | | $ | 5,961 | | | $ | 3,953 | |
| | | | | | | | |
Basic earnings per share as reported | | $ | 0.675 | | | $ | 0.585 | |
Pro forma basic earnings per share | | $ | 0.635 | | | $ | 0.530 | |
| | |
Diluted earnings per share as reported | | $ | 0.655 | | | $ | 0.570 | |
Pro forma diluted earnings per share | | $ | 0.620 | | | $ | 0.515 | |
(o) Income taxes
Income taxes are accounted for under the asset and liability method. Deferred tax assets and liabilities are recognized for the future tax consequences attributable to temporary differences between the consolidated
CENTERSTATE BANKS OF FLORIDA, INC. AND SUBSIDIARIES
Notes to Consolidated Financial Statements
(amounts are in thousands of dollars, except per share data)
December 31, 2006, 2005 and 2004
financial statement carrying amounts of existing assets and liabilities and their respective tax bases. Deferred tax assets and liabilities are measured using enacted tax rates expected to apply to taxable income in the years in which those temporary differences are expected to be recovered or settled. The effect on deferred tax assets and liabilities of a change in tax rates is recognized in income in the period that included the enactment date. Deferred tax assets are recognized subject to management’s judgment that realization is more likely than not.
(p) Earnings per common share
Basic earnings per common share is net income divided by the weighted average number of common shares outstanding during the period. Diluted earnings per common share includes the dilutive effect of additional potential common shares issuable under stock options. Historical earnings and dividends per share have been adjusted to reflect the two for one stock split which occurred in May 2006.
(q) Comprehensive income
Comprehensive income consists of net income and other comprehensive income. Other comprehensive income includes unrealized gains and losses on securities available for sale, which are also recognized as separate components of shareholders’ equity.
(r) Loss contingencies
Loss contingencies, including claims and legal actions arising in the ordinary course of business, are recorded as liabilities when the likelihood of loss is probable and an amount or range of loss can be reasonably estimated. Management does not believe there now are such matters that will have a material effect on the financial statements.
(s) Restrictions on cash
Cash on hand or on deposit with the Federal Reserve Bank was required to meet regulatory reserve and clearing requirements. These balances do not earn interest.
(t) Dividend restriction
Banking regulations require maintaining certain capital levels and may limit the dividends paid by the banks to the holding company or by the holding company to stockholders.
(u) Fair value of financial instruments
Fair values of financial instruments are estimated using relevant market information and other assumptions, as more fully disclosed in a separate note. Fair value estimates involve uncertainties and matters of significant judgment regarding interest rates, credit risk, prepayments, and other factors, especially in the absence of broad markets for particular items. Changes in assumptions or in market conditions could significantly affect the estimates.
(v) Segment reporting
The Company follows SFAS No. 131,Disclosures about Segments of an Enterprise and Related Information. SFAS No. 131 establishes standards for reporting information about segments in financial
CENTERSTATE BANKS OF FLORIDA, INC. AND SUBSIDIARIES
Notes to Consolidated Financial Statements
(amounts are in thousands of dollars, except per share data)
December 31, 2006, 2005 and 2004
statements. Operating segments are defined as components of an enterprise about which separate financial information is available and that is evaluated regularly by the chief operating decision maker in deciding how to allocate resources and in assessing performance. The Company derives its revenues from providing similar banking products and services to customers located throughout the Central Florida Region through similar distribution channels and processes. Operating segments consist of the Company’s banking subsidiaries. Management believes that the Company meets the aggregation criteria, as defined by SFAS No. 131, for aggregating its operating segments into the bank segment.
(w) Reclassifications
Some items in the prior year financial statements were reclassified to conform to the current presentation.
(x) Effect of new pronouncements
Effective January 1, 2006, the Company adopted Statement of Financial Accounting Standards (“SFAS”) No. 123(R),Share-based Payment. See “Stock based compensation” above for further discussion of the effect of adopting this Standard.
In September 2006, the Securities and Exchange Commission (SEC) released Staff Accounting Bulletin No. 108,Considering the Effects of Prior Year Misstatements when Quantifying Misstatements in Current Year Financial Statements (SAB 108),which is effective for fiscal years ending on or after November 15, 2006. SAB 108 provides guidance on how the effects of prior-year uncorrected financial statement misstatements should be considered in quantifying a current year misstatement. SAB 108 requires public companies to quantify misstatements using both an income statement (rollover) and balance sheet (iron curtain) approach and evaluate whether either approach results in a misstatement that, when all relevant quantitative and qualitative factors are considered, is material. If prior year errors that had been previously considered immaterial now are considered material based on either approach, no restatement is required so long as management properly applied its previous approach and all relevant facts and circumstances were considered. Adjustments considered immaterial in prior years under the method previously used, but now considered material under the dual approach required by SAB 108, are to be recorded upon initial adoption of SAB 108. The amount so recorded is shown as a cumulative effect adjustment and is recorded in opening retained earnings as of January 1, 2006. The adoption of SAB 108 had no effect on the Company’s financial statements for the year ending December 31, 2006.
In September 2006, the Financial Accounting Standards Board (“FASB”) issued SFAS No. 158,Employers’ Accounting for Defined Benefit Pension and Other Postretirement Plans – an amendment of FASB Statements No. 87, 88, 106 and 132(R). This Statement requires an employer to recognize the overfunded or underfunded status of a defined benefit postretirement plan (other than a multiemployer plan) as an asset or liability in its balance sheet, beginning with year end 2006, and to recognize changes in the funded status in the year in which the changes occur through comprehensive income beginning in 2007. Additionally, defined benefit plan assets and obligations are to be measured as of the date of the employer’s fiscal year-end, starting in 2008. Adoption had no effect on the Company’s financial statements.
Effect of newly issued but not yet effective accounting standards:
In February 2006, FASB issued Statement No. 155,Accounting for Certain Hybrid Financial Instruments-an amendment to FASB Statements No. 133 and 140. This Statement permits fair value re-measurement for any hybrid financial instruments, clarifies which instruments are subject to the requirements of Statement No. 133, and establishes a requirement to evaluate interests in securitized financial assets and other items. The new standard is effective for financial assets acquired or issued after the beginning of the entity’s first fiscal year that begins after September 15, 2006. Management does not expect the adoption of this Statement to have a material impact on its consolidated financial position or results of operations.
CENTERSTATE BANKS OF FLORIDA, INC. AND SUBSIDIARIES
Notes to Consolidated Financial Statements
(amounts are in thousands of dollars, except per share data)
December 31, 2006, 2005 and 2004
In March 2006, the FASB issued Statement No. 156,Accounting for Servicing of Financial Assets-an amendment of FASB Statement No. 140. This Statement provides the following: 1) revised guidance on when a servicing asset and servicing liability should be recognized; 2) requires all separately recognized servicing assets and servicing liabilities to be initially measured at fair value, if practicable; 3) permits an entity to elect to measure servicing assets and servicing liabilities at fair value each reporting date and report changes in fair value in earnings in the period in which the changes occur; 4) upon initial adoption, permits a onetime reclassification of available-for-sale securities to trading securities for securities which are identified as offsetting the entity’s exposure to changes in the fair value of servicing assets or liabilities that a servicer elects to subsequently measure at fair value; and 5) requires separate presentation of servicing assets and servicing liabilities subsequently measured at fair value in the statement of financial position and additional footnote disclosures. This Standard is effective as of the beginning of an entity’s first fiscal year that begins after September 15, 2006 with the effects of initial adoption being reported as a cumulative-effect adjustment to retained earnings. Management does not expect the adoption of this Statement will have a material impact on its consolidated financial position or results of operations.
In September 2006, the FASB issued Statement No. 157,Fair Value Measurements. This Statement defines fair value, establishes a framework for measuring fair value and expands disclosures about fair value measurements. This Statement establishes a fair value hierarchy about the assumptions used to measure fair value and clarifies assumptions about risk and the effect of a restriction on the sale or use of an asset. The Statement is effective for fiscal years beginning after November 15, 2007. The Company has not completed its evaluation of the impact of the adoption of this Statement.
In February 2007, the Financial Accounting Standards Board (FASB) issued SFAS No. 159,The Fair Value Option for Financial Assets and Financial Liabilities.This Statement permits entities to choose to measure many financial instruments and certain other items at fair value. The objective is to improve financial reporting by providing entities with the opportunity to mitigate volatility in reported earnings caused by measuring related assets and liabilities differently without having to apply complex hedge accounting provisions. This Statement is expected to expand the use of fair value measurement, which is consistent with the Board’s long-term measurement objectives for accounting for financial instruments. This Statement is effective for fiscal years beginning after November 15, 2007. The Company has not completed its evaluation of the impact of the adoption of this Statement.
In July 2006, the FASB issued FASB Interpretation No. 48,Accounting for Uncertainty in Income Taxes – an interpretation of FASB Statement No. 109 (FIN 48), which prescribes a recognition threshold and measurement attribute for a tax position taken or expected to be taken in a tax return. FIN 48 also provides guidance on derecognition, classification, interest and penalties, accounting in interim periods, disclosure and transition. FIN 48 is effective for fiscal years beginning after December 15, 2006. The Company has determined that the adoption of FIN 48 will not have a material effect on the financial statements.
In September 2006, the FASB Emerging Issues Task Force finalized Issue No. 06-4,Accounting for Deferred Compensation and Postretirement Benefit Aspects of Endorsement Split-Dollar Life Insurance Arrangements. This Issue requires that a liability be recorded during the service period when a split-dollar life insurance agreement continues after participants’ employment or retirement. The required accrued liability will be based on either the post-employment benefit cost for the continuing life insurance or based on the future death benefit depending on the contractual terms of the underlying agreement. This Issue is effective for fiscal years beginning after December 15, 2007. The Company has not completed its evaluation of the impact of adoption of EITF 06-4.
CENTERSTATE BANKS OF FLORIDA, INC. AND SUBSIDIARIES
Notes to Consolidated Financial Statements
(amounts are in thousands of dollars, except per share data)
December 31, 2006, 2005 and 2004
In September 2006, the FASB Emerging Issues Task Force finalized Issue No. 06-5,Accounting for Purchases of Life Insurance—Determining the Amount That Could Be Realized in Accordance with FASB Technical Bulletin No. 85-4 (Accounting for Purchases of Life Insurance).This Issue requires that a policyholder consider contractual terms of a life insurance policy in determining the amount that could be realized under the insurance contract. It also requires that if the contract provides for a greater surrender value if all individual policies in a group are surrendered at the same time, that the surrender value be determined based on the assumption that policies will be surrendered on an individual basis. Lastly, the Issue discusses whether the cash surrender value should be discounted when the policyholder is contractually limited in its ability to surrender a policy. This Issue is effective for fiscal years beginning after December 15, 2006. The Company does not believe the adoption of this Issue will have a material impact on the financial statements.
(2) Investment Securities Available for Sale
The amortized cost and estimated fair values of investment securities available for sale at December 31, 2006 and 2005, are as follows:
| | | | | | | | | | | | | |
| | | December 31, 2006 |
| | | Amortized Cost | | Gross Unrealized Gains | | Gross Unrealized Losses | | | Estimated Fair Value |
U.S. treasury securities | | $ | 40,425 | | $ | 6 | | $ | (166 | ) | | $ | 40,265 |
Obligations of U.S. government agencies | | | 38,783 | | | 133 | | | (184 | ) | | | 38,732 |
Mortgage backed securities | | | 129,357 | | | 274 | | | (1,259 | ) | | | 128,372 |
Municipal securities | | | 27,837 | | | 217 | | | (73 | ) | | | 27,981 |
| | | | | | | | | | | | | |
| | $ | 236,402 | | $ | 630 | | $ | (1,682 | ) | | $ | 235,350 |
| | | | | | | | | | | | | |
| | | | | | | | | | | | | |
| | | December 31, 2005 |
| | | Amortized Cost | | Gross Unrealized Gains | | Gross Unrealized Losses | | | Estimated Fair Value |
U.S. treasury securities | | $ | 94,396 | | $ | — | | $ | (662 | ) | | $ | 93,734 |
Obligations of U.S. government agencies | | | 26,817 | | | — | | | (326 | ) | | | 26,491 |
Mortgage backed securities | | | 97,452 | | | 1 | | | (1,838 | ) | | | 95,615 |
Municipal securities | | | 1,135 | | | — | | | (6 | ) | | | 1,129 |
Other investments | | | 400 | | | — | | | — | | | | 400 |
| | | | | | | | | | | | | |
| | $ | 220,200 | | $ | 1 | | $ | (2,832 | ) | | $ | 217,369 |
| | | | | | | | | | | | | |
The estimated fair value of investment securities available for sale at December 31, 2006, by contractual maturity, are shown below. Actual maturities will differ from contractual maturities because borrowers may have the right to call or prepay obligations with or without call or prepayment penalties. Securities not due at a single maturity date, primarily mortgage backed securities, are shown separately:
CENTERSTATE BANKS OF FLORIDA, INC. AND SUBSIDIARIES
Notes to Consolidated Financial Statements
(amounts are in thousands of dollars, except per share data)
December 31, 2006, 2005 and 2004
| | | |
| | | Estimated Fair Value |
Investment securities available for sale | | | |
Due in one year or less | | $ | 41,259 |
Due after one year through five years | | | 37,738 |
Due after five years through fifteen years | | | 5,792 |
Due after fifteen years through thirty years | | | 22,189 |
Mortgage backed securities | | | 128,372 |
| | | |
| | $ | 235,350 |
| | | |
At December 31, 2006, the Company had $51,481 (estimated fair value) in investment securities pledged to the Treasurer of the State of Florida as collateral on public fund deposits and for other purposes required or permitted by law. Repurchase agreements are secured by U.S. Treasury securities and Government Agency securities with fair values of $116,857 and $80,047 at December 31, 2006 and 2005, respectively.
Proceeds from sales of investment securities available for sale were $117, $2,993 and $229 for the years ending December 31, 2006, 2005 and 2004, respectively. Gross realized gains (losses) on sales of investment securities available for sale during 2005, 2004 and 2003 were $17, ($3) and $0, respectively.
The following tables show the Company’s investments’ gross unrealized losses and fair value, aggregated by investment category and length of time that individual securities have been in a continuous unrealized loss position, at December 31, 2006 and 2005.
| | | | | | | | | | | | | | | | | | |
| | | December 31, 2006 |
| | | Less than 12 months | | 12 months or more | | Total |
| | | Fair Value | | Unrealized Losses | | Fair Value | | Unrealized Losses | | Fair Value | | Unrealized Losses |
| | | | | | |
U.S. Treasury securities | | $ | 16,872 | | $ | 70 | | $ | 20,391 | | $ | 96 | | $ | 37,263 | | $ | 166 |
Obligations of U.S. government agencies | | | 3,985 | | | 12 | | | 12,816 | | | 172 | | | 16,801 | | | 184 |
Mortgage backed securities | | | 39,256 | | | 338 | | | 54,218 | | | 921 | | | 93,474 | | | 1,259 |
Municipal securities | | | 5,370 | | | 70 | | | 497 | | | 3 | | | 5,867 | | | 73 |
| | | | | | | | | | | | | | | | | | |
Total temporarily impaired securities | | $ | 65,483 | | $ | 490 | | $ | 87,922 | | $ | 1,192 | | $ | 153,405 | | $ | 1,682 |
| | | | | | | | | | | | | | | | | | |
| | | | | | | | | | | | | | | | | | |
| | | December 31, 2005 |
| | | less than 12 months | | 12 months or more | | Total |
| | | Fair value | | Unrealized Losses | | Fair value | | Unrealized Losses | | Fair Value | | Unrealized Losses |
| | | | | | |
U.S. Treasury securities | | $ | 46,035 | | $ | 274 | | $ | 44,714 | | $ | 388 | | $ | 90,749 | | $ | 662 |
Obligations of U.S. government agencies | | | 13,817 | | | 157 | | | 12,674 | | | 169 | | | 26,491 | | | 326 |
Mortgage backed securities | | | 65,273 | | | 978 | | | 25,954 | | | 860 | | | 91,227 | | | 1,838 |
Municipal securities | | | 494 | | | 6 | | | — | | | — | | | 494 | | | 6 |
| | | | | | | | | | | | | | | | | | |
Total temporarily impaired securities | | $ | 125,619 | | $ | 1,415 | | $ | 83,342 | | $ | 1,417 | | $ | 208,961 | | $ | 2,832 |
| | | | | | | | | | | | | | | | | | |
U.S. Treasury securities and obligations of U.S. government agencies: The unrealized losses on investments in U.S. Treasury securities and obligations of U.S government agencies were caused by interest rate increases. The contractual terms of these investments do not permit the issuer to settle the securities at a price less than the par value of the investment. Because the Company has the ability and intent to hold these investments until a market price recovery or maturity, these investments are not considered other-than-temporarily impaired.
CENTERSTATE BANKS OF FLORIDA, INC. AND SUBSIDIARIES
Notes to Consolidated Financial Statements
(amounts are in thousands of dollars, except per share data)
December 31, 2006, 2005 and 2004
Mortgage-backed securities: The unrealized losses on investments in mortgage-backed securities were caused by interest rate increases. Fannie Mae guarantees the contractual cash flows of these securities. It is expected that the securities would not be settled at a price less than the par value of the investment. Because the decline in fair value is attributable to changes in interest rates and not credit quality, and because the Company has the ability and intent to hold these investments until a market price recovery or maturity, these investments are not considered other-than-temporarily impaired.
Municipal securities: Unrealized losses on municipal securities have not been recognized into income because the issuers bonds are of high quality, management has the intent and ability to hold for the foreseeable future, and the decline in fair value is largely due to changes in interest rates. The fair value is expected to recover as the securities approach maturity.
(3) Loans
Major categories of loans included in the loan portfolio as of December 31, 2006 and 2005 are:
| | | | | | |
| | | December 31, |
| | | 2006 | | 2005 |
Real estate: | | | | | | |
Residential | | $ | 180,869 | | $ | 148,090 |
Commercial | | | 291,536 | | | 219,094 |
Construction, development, land | | | 60,950 | | | 36,352 |
| | | | | | |
Total real estate | | | 533,355 | | | 403,536 |
| | |
Commercial | | | 68,948 | | | 63,475 |
Consumer and other loans | | | 56,684 | | | 50,413 |
| | | | | | |
| | | 658,987 | | | 517,424 |
| | |
Less: Deferred loan origination fees, net | | | 1,024 | | | 766 |
| | | | | | |
Total loans | | | 657,963 | | | 516,658 |
Less: Allowance for loan losses | | | 7,355 | | | 6,491 |
| | | | | | |
Total net loans | | $ | 650,608 | | $ | 510,167 |
| | | | | | |
The following is a summary of information regarding impaired loans at December 31, 2006 and 2005:
| | | | | | |
Individually impaired loans were as follows: | | December 31, |
| | | 2006 | | 2005 |
Impaired loans with no allocated allowance for loan losses | | $ | 2,522 | | $ | 114 |
Impaired loans with allocated allowance for loan losses | | | 2,464 | | | 6,232 |
| | | | | | |
Total | | $ | 4,986 | | $ | 6,346 |
| | | | | | |
Amount of the allowance for loan losses allocated to impaired loans | | $ | 372 | | $ | 1,017 |
| | | | | | |
CENTERSTATE BANKS OF FLORIDA, INC. AND SUBSIDIARIES
Notes to Consolidated Financial Statements
(amounts are in thousands of dollars, except per share data)
December 31, 2006, 2005 and 2004
| | | | | | | | | |
| | | 2006 | | 2005 | | 2004 |
Average of impaired loans during the year | | $ | 5,243 | | $ | 987 | | $ | 1,103 |
Interest income recognized on impaired loans during the impairment period during 2006 was $394. Cash basis interest income recognized during this same period was $406.
Non performing loans include both smaller balance homogeneous loans that are collectively evaluated for impairment and individually classified impaired loans.
| | | | | | |
Non performing loans were as follows: | | December 31, |
| | | 2006 | | 2005 |
Non accrual loans | | $ | 448 | | $ | 852 |
| | | | | | |
Loans past due over 90 days and still accruing interest | | $ | 162 | | $ | 658 |
| | | | | | |
Certain principal stockholders, directors and officers and their related interests were indebted to the Company as summarized below, for the periods ending December 31, 2006, 2005 and 2004:
| | | | | | | | | |
| | | December 31, |
| | | 2006 | | 2005 | | 2004 |
Balance, beginning of year | | $ | 13,538 | | $ | 11,037 | | $ | 13,230 |
Additional new loans | | | 11,491 | | | 9,914 | | | 5,297 |
Repayments on outstanding loans | | | 10,552 | | | 7,413 | | | 7,490 |
| | | | | | | | | |
Balance, end of year | | $ | 14,477 | | $ | 13,538 | | $ | 11,037 |
| | | | | | | | | |
All such loans were made in the ordinary course of business. At December 31, 2006, 2005 and 2004, certain principal stockholders, directors and officers of the Company and their related interests had $14,157, $5,541 and $5,272, respectively, available in lines of credit.
Changes in the allowance for loan losses for the years ended December 31, 2006, 2005 and 2004, are as follows:
| | | | | | | | | | | | |
| | | December 31, | |
| | | 2006 | | | 2005 | | | 2004 | |
Balance, beginning of year | | $ | 6,491 | | | $ | 5,685 | | | $ | 4,850 | |
Provision charged to operations | | | 717 | | | | 1,065 | | | | 1,270 | |
Loans charged-off | | | (598 | ) | | | (359 | ) | | | (350 | ) |
Recoveries of previous charge-offs | | | 98 | | | | 100 | | | | 45 | |
Adjustment relating to sale of branches | | | — | | | | — | | | | (130 | ) |
Acquisition of Mid FL | | | 647 | | | | — | | | | — | |
| | | | | | | | | | | | |
Balance, end of year | | $ | 7,355 | | | $ | 6,491 | | | $ | 5,685 | |
| | | | | | | | | | | | |
CENTERSTATE BANKS OF FLORIDA, INC. AND SUBSIDIARIES
Notes to Consolidated Financial Statements
(amounts are in thousands of dollars, except per share data)
December 31, 2006, 2005 and 2004
(4) Bank Premises and Equipment
A summary of bank premises and equipment as of December 31, 2006 and 2005, is as follows:
| | | | | | |
| | | December 31, |
| | | 2006 | | 2005 |
Land | | $ | 16,611 | | $ | 10,509 |
Land improvements | | | 591 | | | 571 |
Buildings | | | 20,080 | | | 16,501 |
Leasehold improvements | | | 1,164 | | | 1,243 |
Furniture, fixtures and equipment | | | 10,760 | | | 9,641 |
Construction in progress | | | 2,064 | | | 249 |
| | | | | | |
| | | 51,270 | | | 38,714 |
Less: Accumulated depreciation | | | 11,391 | | | 9,805 |
| | | | | | |
| | $ | 39,879 | | $ | 28,909 |
| | | | | | |
(5) Goodwill and Intangible Assets
The change in balance for goodwill during the years 2006 and 2005 is as follows:
| | | | | | |
| | | 2006 | | 2005 |
Beginning of year | | $ | 4,675 | | $ | 4,675 |
Acquired goodwill | | | 5,188 | | | — |
Impairment | | | — | | | — |
| | | | | | |
End of year | | $ | 9,863 | | $ | 4,675 |
| | | | | | |
Acquired intangible assets were as followed for years ended December 31, 2006 and 2005:
| | | | | | | | | | | | |
| | | December 31, 2006 | | December 31, 2005 |
| | | Gross
Carrying
Amount | | Accumulated
Amortization | | Gross
Carrying
Amount | | Accumulated
Amortization |
Amortized intangible assets: | | | | | | | | | | | | |
Core deposit intangibles | | $ | 3,857 | | $ | 774 | | $ | 739 | | $ | 260 |
| | | | | | | | | | | | |
Total amortized intangible assets | | $ | 3,857 | | $ | 774 | | $ | 739 | | $ | 260 |
| | | | | | | | | | | | |
Estimated amortization expense for each of the next five years:
| | | |
2007 | | $ | 557 |
2008 | | $ | 447 |
2009 | | $ | 365 |
2010 | | $ | 310 |
2011 | | $ | 310 |
CENTERSTATE BANKS OF FLORIDA, INC. AND SUBSIDIARIES
Notes to Consolidated Financial Statements
(amounts are in thousands of dollars, except per share data)
December 31, 2006, 2005 and 2004
(6) Deposits
A detail of deposits at December 31, 2006 and 2005 is as follows:
| | | | | | | | | | | | |
| | | December 31, | |
| | | 2006 | | Weighted Average Interest
Rate | | | 2005 | | Weighted Average Interest Rate | |
Non-interest bearing deposits | | $ | 223,602 | | — | % | | $ | 219,444 | | — | % |
Interest bearing deposits: | | | | | | | | | | | | |
Interest bearing demand deposits | | | 110,627 | | 0.9 | % | | | 89,309 | | 0.3 | % |
Savings deposits | | | 46,806 | | 0.9 | % | | | 47,350 | | 0.5 | % |
Money market accounts | | | 100,528 | | 2.8 | % | | | 96,082 | | 1.9 | % |
Time deposits less than $100,000 | | | 183,610 | | 4.6 | % | | | 134,953 | | 3.5 | % |
Time deposits of $100,000 or greater | | | 227,633 | | 4.9 | % | | | 130,199 | | 3.7 | % |
| | | | | | | | | | | | |
| | $ | 892,806 | | 2.7 | % | | $ | 717,337 | | 1.7 | % |
| | | | | | | | | | | | |
The following table presents the amount of certificate accounts at December 31, 2006, maturing during the periods reflected below:
| | | |
Year | | Amount |
2007 | | $ | 328,444 |
2008 | | | 37,163 |
2009 | | | 27,795 |
2010 | | | 11,975 |
2011 | | | 5,866 |
| | | |
Total | | $ | 411,243 |
| | | |
A summary of interest expense on deposits for the years ended December 31, 2006, 2005 and 2004, is as follows:
| | | | | | | | | |
| | | December 31, |
| | | 2006 | | 2005 | | 2004 |
Interest-bearing demand deposits | | $ | 659 | | $ | 317 | | $ | 265 |
Savings deposits | | | 343 | | | 201 | | | 133 |
Money market accounts | | | 2,651 | | | 1,505 | | | 1,057 |
Time deposits less than $100,000 | | | 6,993 | | | 4,392 | | | 3,480 |
Time deposits of $100,000 or greater | | | 8,344 | | | 3,596 | | | 2,250 |
| | | | | | | | | |
| | $ | 18,990 | | $ | 10,011 | | $ | 7,185 |
| | | | | | | | | |
The Company had deposits from certain principle stockholders, directors and officers and their related interests of approximately $64,313, and $18,630 at December 31, 2006 and 2005, respectively.
(7) Securities Sold Under Agreements to Repurchase
The Company’s subsidiary banks enter into borrowing arrangements with their retail business customers by agreements to repurchase (“repurchase agreements”) under which the banks pledge investment securities owned and under its control as collateral against the one-day borrowing arrangement.
CENTERSTATE BANKS OF FLORIDA, INC. AND SUBSIDIARIES
Notes to Consolidated Financial Statements
(amounts are in thousands of dollars, except per share data)
December 31, 2006, 2005 and 2004
At December 31, 2006 and 2005, the Company had $52,792 and $41,811 in repurchase agreements with weighted average interest rates of 4.39% and 3.38%, respectively. Repurchase agreements are secured by U.S. Treasury securities and government agency securities with fair values of $116,857 and $80,047 at December 31, 2006 and 2005, respectively.
Repurchase agreements averaged $49,830, $38,210 and $26,110 for the years ended December 31, 2006, 2005 and 2004, respectively. The maximum amount outstanding at any month-end for the corresponding periods was $54,812, $49,046 and $35,167, respectively. Total interest expense paid on repurchase agreements for the years ending December 31, 2006, 2005 and 2004, was $2,156, $1,013 and $193, respectively.
(8) Other Borrowed Funds
From time to time the Company will borrow short-term either through Federal Home Loan Bank advances or Federal Funds Purchased. As of December 31, 2005, $1,000 of Federal Funds Purchased was outstanding with an overnight maturity and an interest rate of 4.5%. As of December 31, 2006, the Company had no short-term borrowings either through the Federal Home Loan Bank advances or Federal Funds Purchased.
(9) Corporate Debenture
In September 2003, the Company formed CenterState Banks of Florida Statutory Trust I (the “Trust”) for the purpose of issuing trust preferred securities. The Company issued a floating rate corporate debenture in the amount of $10,000. The Trust used the proceeds from the issuance of a trust preferred security to acquire the corporate debenture of the Company. The trust preferred security essentially mirrors the corporate debenture, carrying a cumulative preferred dividend at a variable rate equal to the interest rate on the corporate debenture (three month LIBOR plus 305 basis points). The rate is subject to change on a quarterly basis. The rate in effect during the quarter ended December 31, 2006 was 8.42%. The corporate debenture and the trust preferred security each have 30-year lives. The trust preferred security and the corporate debenture are callable by the Company or the Trust, at their respective option after five years, and sooner in specific events, subject to prior approval by the Federal Reserve Board, if then required. Related debt issuance costs of $188 were capitalized and are being amortized to interest expense over a five year period. The Company has treated the trust preferred security as Tier 1 capital up to the maximum amount allowed, and the remainder as Tier 2 capital for federal regulatory purposes.
(10) Income Taxes
Allocation of federal and state income taxes between current and deferred portions for the years ended December 31, 2006, 2005 and 2004, is as follows:
| | | | | | | | | | |
| | | Current | | Deferred | | | Total |
December 31, 2006: | | | | | | | | | | |
Federal | | $ | 3,988 | | $ | 133 | | | $ | 4,121 |
State | | | 716 | | | 22 | | | | 738 |
| | | | | | | | | | |
| | $ | 4,704 | | $ | 155 | | | $ | 4,859 |
| | | | | | | | | | |
December 31, 2005: | | | | | | | | | | |
Federal | | $ | 3,375 | | $ | (195 | ) | | $ | 3,180 |
State | | | 577 | | | (33 | ) | | | 544 |
| | | | | | | | | | |
| | $ | 3,952 | | $ | (228 | ) | | $ | 3,724 |
| | | | | | | | | | |
December 31, 2004: | | | | | | | | | | |
Federal | | $ | 1,681 | | $ | 499 | | | $ | 2,180 |
State | | | 301 | | | 86 | | | | 387 |
| | | | | | | | | | |
| | $ | 1,982 | | $ | 585 | | | $ | 2,567 |
| | | | | | | | | | |
CENTERSTATE BANKS OF FLORIDA, INC. AND SUBSIDIARIES
Notes to Consolidated Financial Statements
(amounts are in thousands of dollars, except per share data)
December 31, 2006, 2005 and 2004
The tax effect of temporary differences that give rise to significant portions of the deferred tax assets and deferred tax liabilities at December 31, 2006 and 2005, are presented below:
| | | | | | | | |
| | | December 31, | |
| | | 2006 | | | 2005 | |
Deferred tax assets: | | | | | | | | |
Allowance for loan losses | | $ | 2,760 | | | $ | 2,414 | |
Deferred loan fees | | | 289 | | | | 289 | |
Stock based compensation | | | 118 | | | | — | |
Intangible assets | | | 98 | | | | 16 | |
Unrealized loss on investment securities available for sale | | | 406 | | | | 1,065 | |
Net operating loss carryforward | | | 294 | | | | 32 | |
Other | | | — | | | | 147 | |
| | | | | | | | |
Total deferred tax asset | | | 3,965 | | | | 3,963 | |
| | | | | | | | |
| | |
Deferred tax liabilities: | | | | | | | | |
Premises and equipment, due to differences in depreciation methods and useful lives | | | (595 | ) | | | (650 | ) |
Fair value adjustments | | | (1,076 | ) | | | (180 | ) |
Like kind exchange | | | (300 | ) | | | (293 | ) |
Accretion of discounts on investments | | | (83 | ) | | | (128 | ) |
Other | | | (13 | ) | | | — | |
| | | | | | | | |
Total deferred tax liability | | | (2,067 | ) | | | (1,251 | ) |
| | | | | | | | |
Net deferred tax asset | | $ | 1,898 | | | $ | 2,712 | |
| | | | | | | | |
At December 31, 2006 the Company had approximately $761 of net operating loss carryforwards, federal and state, available to offset future taxable income. These carryforwards will begin to expire in 2024. The increase in the net operating loss carryforward in 2006 was a result of the March 31, 2006 acquisition of CenterState Bank Mid Florida.
In assessing the realizability of deferred tax assets, management considers whether it is more likely than not that some portion or all of the deferred tax assets will not be realized. The ultimate realization of deferred tax assets is dependent upon the generation of future taxable income during the periods in which those temporary differences become deductible. Management considers the scheduled reversal of deferred tax liabilities, projected future taxable income, and tax planning strategies in making this assessment. Based upon the level of historical taxable income and projections for future taxable income over the periods in which the deferred tax assets are deductible, management believes it is more likely than not that the Company will realize the benefits of these deductible differences.
A reconciliation between the actual tax expense and the “expected” tax expense, computed by applying the U.S. federal corporate rate of 35 percent (34 percent for 2005 and 2004) is as follows:
| | | | | | | | | | | | |
| | | December 31, | |
| | | 2006 | | | 2005 | | | 2004 | |
“Expected” tax expense | | $ | 4,661 | | | $ | 3,418 | | | $ | 2,360 | |
Tax exempt interest, net | | | (174 | ) | | | (79 | ) | | | (84 | ) |
Bank owned life insurance | | | (97 | ) | | | (15 | ) | | | — | |
State income taxes, net of federal income tax benefits | | | 480 | | | | 366 | | | | 256 | |
Other, net | | | (11 | ) | | | 34 | | | | 35 | |
| | | | | | | | | | | | |
| | $ | 4,859 | | | $ | 3,724 | | | $ | 2,567 | |
| | | | | | | | | | | | |
CENTERSTATE BANKS OF FLORIDA, INC. AND SUBSIDIARIES
Notes to Consolidated Financial Statements
(amounts are in thousands of dollars, except per share data)
December 31, 2006, 2005 and 2004
(11) Rent
The Company leases land and certain facilities under noncancellable operating leases. The following is a schedule of future minimum annual rentals under the noncancellable operating leases:
| | | |
Year ending December 31, | | |
2007 | | $ | 533 |
2008 | | | 460 |
2009 | | | 247 |
2010 2011 Thereafter | |
| 228
237
247 |
| | | |
| | $ | 1,952 |
| | | |
Rent expense for the years ended December 31, 2006, 2005 and 2004, was $555, $403 and $335, respectively, and is included in occupancy expense in the accompanying consolidated statements of operations.
(12) Fair Value of Financial Instruments
The methods and assumptions used to estimate fair value are described as follows:
Carrying amount is the estimated fair value for cash and cash equivalents, Federal Home Loan Bank stock, Federal Reserve Bank stock, accrued interest receivable and payable, deposits without stated maturities, short-term debt, and variable rate loans that reprice frequently and fully. Security fair values are based on market prices or dealer quotes, and if no such information is available, on the rate and term of the security and information about the issuer. For fixed rate loans or deposits, fair value is based on discounted cash flows using current market rates applied to the estimated life and credit risk. Fair values for impaired loans are estimated using discounted cash flow analysis or underlying collateral values. Fair value of debt is based on current rates for similar financing. The fair value of off-balance-sheet items is not considered material.
CENTERSTATE BANKS OF FLORIDA, INC. AND SUBSIDIARIES
Notes to Consolidated Financial Statements
(amounts are in thousands of dollars, except per share data)
December 31, 2006, 2005 and 2004
The following tables present the carrying amounts and estimated fair values of the Company’s financial instruments:
| | | | | | |
| | | December 31, 2006 |
| | | Carrying
Amount | | Fair Value |
Financial assets: | | | | | | |
Cash and cash equivalents | | $ | 120,021 | | $ | 120,021 |
Investment securities available for sale | | | 235,350 | | | 235,350 |
FHLB and FRB stock | | | 2,665 | | | 2,665 |
Loans, less allowance for loan losses of $7,355 | | | 650,608 | | | 648,510 |
Accrued interest receivable | | | 5,035 | | | 5,035 |
| | |
Financial liabilities: | | | | | | |
Deposits: | | | | | | |
Without stated maturities | | $ | 481,563 | | $ | 481,563 |
With stated maturities | | | 411,243 | | | 411,930 |
Securities sold under agreement to repurchase | | | 52,792 | | | 52,792 |
Corporate debenture | | | 10,000 | | | 10,238 |
Accrued interest payable | | | 993 | | | 993 |
| | | | | | |
| | | December 31, 2005 |
| | | Carrying
Amount | | Fair Value |
Financial assets: | | | | | | |
Cash and cash equivalents | | $ | 94,926 | | $ | 94,926 |
Investment securities available for sale | | | 217,369 | | | 217,369 |
FHLB and FRB stock | | | 1,472 | | | 1,472 |
Loans, less allowance for loan losses of $6,491 | | | 510,167 | | | 505,880 |
Accrued interest receivable | | | 3,610 | | | 3,610 |
| | |
Financial liabilities: | | | | | | |
Deposits: | | | | | | |
Without stated maturities | | $ | 452,185 | | $ | 452,185 |
With stated maturities | | | 265,152 | | | 266,024 |
Securities sold under agreement to repurchase | | | 41,811 | | | 41,811 |
Corporate debenture | | | 10,000 | | | 10,000 |
Other borrowed funds | | | 1,000 | | | 1,000 |
Accrued interest payable | | | 582 | | | 582 |
(13) Regulatory Capital
The Company and the Banks are subject to various regulatory capital requirements administered by the federal banking agencies. Failure to meet minimum capital requirements can initiate certain mandatory and possibly additional discretionary actions by regulators that, if undertaken, could have a direct material effect on the Company’s consolidated financial statements. Under capital adequacy guidelines and the regulatory framework for prompt corrective action, the Company and the Banks must meet specific capital guidelines that involve
CENTERSTATE BANKS OF FLORIDA, INC. AND SUBSIDIARIES
Notes to Consolidated Financial Statements
(amounts are in thousands of dollars, except per share data)
December 31, 2006, 2005 and 2004
quantitative measures of assets, liabilities and certain off-balance-sheet items as calculated under regulatory accounting practices. The capital amounts and classification are also subject to qualitative judgments by the regulators about components, risk weightings and other factors.
Quantitative measures established by regulation to ensure capital adequacy require the Company to maintain minimum amounts and ratios (set forth in the table below) of total and Tier I capital (as defined in the regulations) to risk-weighted assets. Management believes, as of December 31, 2006, that the Company meets all capital adequacy requirements to which it is subject.
As of December 31, 2006, the most recent notification from the Office of Comptroller of the Currency and the FDIC categorized the Banks as well capitalized under the regulatory framework for prompt corrective action. To be categorized as well capitalized, the Banks must maintain total risk-based, Tier I risk-based and Tier I leverage ratios as set forth in the table. There are no conditions or events since that notification that management believes have changed the institution’s category.
A summary of actual, required, and capital levels necessary to be considered well-capitalized for the Company as of December 31, 2006 and 2005, are presented in the table below.
| | | | | | | | | | | | | | | | | | |
| | | Actual | | | For Capital Adequacy purposes | | | To be well capitalized under prompt corrective action provision | |
| | | Amount | | Ratio | | | Amount | | Ratio | | | Amount | | Ratio | |
December 31, 2006: | | | | | | | | | | | | | | | | | | |
Total capital (to risk weighted assets) | | $ | 122,387 | | 16.6 | % | | $ | 58,986 | | > 8 | % | | $ | 73,716 | | >10 | % |
Tier 1 capital (to risk weighted assets) | | | 115,032 | | 15.6 | % | | | 29,493 | | > 4 | % | | | 44,230 | | > 6 | % |
Tier 1 capital (to average assets) | | | 115,032 | | 11.2 | % | | | 40,989 | | > 4 | % | | | 51,236 | | > 5 | % |
| | | | | | |
December 31, 2005: | | | | | | | | | | | | | | | | | | |
Total capital (to risk weighted assets) | | $ | 110,344 | | 19.2 | % | | $ | 45,903 | | > 8 | % | | $ | 57,379 | | >10 | % |
Tier 1 capital (to risk weighted assets) | | | 103,853 | | 18.1 | % | | | 22,951 | | > 4 | % | | | 34,427 | | > 6 | % |
Tier 1 capital (to average assets) | | | 103,853 | | 12.4 | % | | | 33,623 | | > 4 | % | | | 42,029 | | > 5 | % |
CENTERSTATE BANKS OF FLORIDA, INC. AND SUBSIDIARIES
Notes to Consolidated Financial Statements
(amounts are in thousands of dollars, except per share data)
December 31, 2006, 2005 and 2004
A summary of actual, required, and capital levels necessary to be considered well-capitalized for each of the Company’s subsidiary Banks as of December 31, 2006 and 2005, are presented in the table below. During January 2006, First National Bank of Polk County, N.A. and CenterState Bank of Florida, N.A. were merged together. On March 31, 2006, the Company acquired CenterState Bank Mid Florida.
| | | | | | | | | | | | | | | | | | |
| | | Actual | | | For capital adequacy purposes | | | To be well capitalized under prompt corrective action provision | |
| | | Amount | | Ratio | | | Amount | | Ratio | | | Amount | | Ratio | |
December 31, 2006: | | | | | | | | | | | | | | | | | | |
CenterState Bank Central Florida, N.A. | | | | | | | | | | | | | | | | | | |
Total capital (to risk weighted assets) | | $ | 22,635 | | 13.0 | % | | $ | 13,983 | | >8 | % | | $ | 17,479 | | >10 | % |
Tier 1 capital (to risk weighted assets) | | | 20,877 | | 11.9 | % | | | 6,992 | | >4 | % | | | 10,487 | | >6 | % |
Tier 1 capital (to average assets) | | | 20,877 | | 8.3 | % | | | 10,070 | | >4 | % | | | 12,588 | | >5 | % |
CenterState Bank West Florida, N.A. | | | | | | | | | | | | | | | | | | |
Total capital (to risk weighted assets) | | | 25,695 | | 11.1 | % | | | 18,487 | | >8 | % | | | 23,108 | | >10 | % |
Tier 1 capital (to risk weighted assets) | | | 23,250 | | 10.1 | % | | | 9,243 | | >4 | % | | | 13,865 | | >6 | % |
Tier 1 capital (to average assets) | | | 23,250 | | 8.5 | % | | | 10,949 | | >4 | % | | | 13,686 | | >5 | % |
CenterState Bank of Florida, N.A. | | | | | | | | | | | | | | | | | | |
Total capital (to risk weighted assets) | | | 32,276 | | 12.3 | % | | | 21,005 | | >8 | % | | | 26,256 | | >10 | % |
Tier 1 capital (to risk weighted assets) | | | 29,767 | | 11.3 | % | | | 10,503 | | >4 | % | | | 15,754 | | >6 | % |
Tier 1 capital (to average assets) | | | 29,797 | | 7.4 | % | | | 16,006 | | >4 | % | | | 20,007 | | >5 | % |
CenterState Bank Mid Florida | | | | | | | | | | | | | | | | | | |
Total capital (to risk weighted assets) | | | 8,757 | | 12.7 | % | | | 5,512 | | >8 | % | | | 6,889 | | >10 | % |
Tier 1 capital (to risk weighted assets) | | | 8,234 | | 12.0 | % | | | 2,756 | | >4 | % | | | 4,134 | | >6 | % |
Tier 1 capital (to average assets) | | | 8,234 | | 9.5 | % | | | 3,451 | | >4 | % | | | 4,314 | | >5 | % |
| | | | | | |
December 31, 2005: | | | | | | | | | | | | | | | | | | |
CenterState Bank Central Florida, N.A. | | | | | | | | | | | | | | | | | | |
Total capital (to risk weighted assets) | | $ | 19,667 | | 12.6 | % | | $ | 12,465 | | >8 | % | | $ | 15,581 | | >10 | % |
Tier 1 capital (to risk weighted assets) | | | 17,911 | | 11.5 | % | | | 6,233 | | >4 | % | | | 9,349 | | >6 | % |
Tier 1 capital (to average assets) | | | 17,911 | | 7.2 | % | | | 9,930 | | >4 | % | | | 12,412 | | >5 | % |
CenterState Bank West Florida, N.A. | | | | | | | | | | | | | | | | | | |
Total capital (to risk weighted assets) | | | 21,051 | | 10.4 | % | | | 16,226 | | >8 | % | | | 20,282 | | >10 | % |
Tier 1 capital (to risk weighted assets) | | | 18,531 | | 9.1 | % | | | 8,113 | | >4 | % | | | 12,169 | | >6 | % |
Tier 1 capital (to average assets) | | | 18,531 | | 7.5 | % | | | 9,850 | | >4 | % | | | 12,312 | | >5 | % |
First National Bank of Polk County, N.A. | | | | | | | | | | | | | | | | | | |
Total capital (to risk weighted assets) | | | 14,597 | | 18.5 | % | | | 6,316 | | >8 | % | | | 7,895 | | >10 | % |
Tier 1 capital (to risk weighted assets) | | | 13,688 | | 17.3 | % | | | 3,158 | | >4 | % | | | 4,737 | | >6 | % |
Tier 1 capital (to average assets) | | | 13,688 | | 7.8 | % | | | 6,989 | | >4 | % | | | 8,736 | | >5 | % |
CenterState Bank of Florida, N.A. | | | | | | | | | | | | | | | | | | |
Total capital (to risk weighted assets) | | | 13,759 | | 10.1 | % | | | 10,859 | | >8 | % | | | 13,573 | | >10 | % |
Tier 1 capital (to risk weighted assets) | | | 12,453 | | 9.2 | % | | | 5,429 | | >4 | % | | | 8,144 | | >6 | % |
Tier 1 capital (to average assets) | | | 12,453 | | 7.3 | % | | | 6,845 | | >4 | % | | | 8,556 | | >5 | % |
CENTERSTATE BANKS OF FLORIDA, INC. AND SUBSIDIARIES
Notes to Consolidated Financial Statements
(amounts are in thousands of dollars, except per share data)
December 31, 2006, 2005 and 2004
(14) Dividends
The Company declared and paid cash dividends of $1,535, $1,225 and $933 during the years ended December 31, 2006, 2005 and 2004, respectively. Banking regulations limit the amount of dividends that may be paid by the subsidiary banks to the Company without prior approval of the Bank’s regulatory agency. At December 31, 2006, dividends from the subsidiary banks available to be paid to the Company, without prior approval of the Banks’ regulatory agency, was $23,712, subject to the Banks meeting or exceeding regulatory capital requirements.
(15) Stock Option Plans
The Company has authorized 730,000 common shares for employees of the Company under an incentive stock option and non-statutory stock option plan (the “1999 Plan”). Options are granted at fair market value of the underlying stock at date of grant. Each option expires ten years from the date of grant. Options become 25% vested immediately as of the grant date and will continue to vest at a rate of 25% on each anniversary date thereafter until fully vested. At December 31, 2006, there were 104,760 shares available for future grants. In addition to the 1999 Plan, the Company assumed and converted the stock option plans of its subsidiary banks consistent with the terms and conditions of their respective merger agreements. These options are all vested and exercisable. At December 31, 2006, they represented exercisable options on 192,662 shares of the Company’s common stock.
In 2004, the Company’s shareholders authorized an Employee Stock Purchase Plan (“ESPP”). The number of shares of common stock for which options may be granted under the ESPP is 400,000, which amount shall be increased on December 31 of each calendar year. At December 31, 2006, there were no options outstanding pursuant to this plan, and no activity occurred during the twelve month period ending December 31, 2006 relating to our ESPP.
The Company’s stock-based compensation consists solely of expense related to stock options. During the twelve month period ended December 31, 2006, the Company recognized approximately $594 of stock-based compensation expense. As of December 31, 2006, the total remaining unrecognized compensation cost related to non-vested stock options, net of estimated forfeitures, was approximately $590 and is expected to be recognized as follows: $491 in 2007, $81 in 2008 and $18 in 2009.
The Company granted stock options for 31,500 shares of common stock during the twelve month period ending December 31, 2006. The Company also acquired stock options for 77,456 shares of common stock pursuant to the merger with CenterState Bank Mid Florida (“Mid FL”) as of the close of business March 31, 2006. These options vested immediately upon change of control, and their fair value was included as a portion of the purchase price paid for Mid FL. The Company granted stock options for 41,000 shares and 244,000 shares for the twelve month periods ending December 31, 2005 and 2004, respectively. In addition, options for 61,214 shares were granted pursuant to the Employee Stock Purchase Plan during the twelve month period ending December 31, 2004, of which all have been either exercised or forfeited.
The estimated fair value of options granted during these periods were calculated as of the grant date (as of the merger date for those options acquired pursuant to the merger of Mid FL) using the Black-Scholes option-pricing model. The weighted-average assumptions as of the grant date, and as of the merger date in the case of the Mid FL transaction, are as follows:
| | | | | | | | | |
| | | 2006 | | | 2005 | | | 2004 | |
Expected option life | | 6.9 years | | | 10 years | | | 8.2 years | |
Risk-free interest rate | | 4.91 | % | | 4.37 | % | | 3.75 | % |
Expected volatility | | 29.8 | % | | 31.5 | % | | 31.3 | % |
Dividend yield | | 0.76 | % | | 0.71 | % | | 0.84 | % |
CENTERSTATE BANKS OF FLORIDA, INC. AND SUBSIDIARIES
Notes to Consolidated Financial Statements
(amounts are in thousands of dollars, except per share data)
December 31, 2006, 2005 and 2004
In 2006, the Company determined the expected life of the stock options using the simplified method approach allowed for plain-vanilla share options granted prior to December 31, 2007 as described in SAB 107. Prior to 2006, the Company determined the expected life of the stock options using historical data adjusted for known factors that would alter historical exercise behavior including announced retirement dates. The risk-free interest rate is based on the U.S. Treasury yield curve in effect as of the grant date. Expected volatility was determined using historical volatility.
SFAS 123R requires the recognition of stock-based compensation for the number of awards that are ultimately expected to vest. As a result, for most awards, recognized stock compensation would be reduced for estimated forfeitures prior to vesting. Based on historical data, the Company expects the annual forfeiture rates to be immaterial. Estimated forfeitures will be reassessed in subsequent periods and may change based on new facts and circumstances. Prior to January 1, 2006, actual forfeitures were accounted for as they occurred for purposes of required pro forma stock compensation disclosures.
The weighted-average estimated fair value of stock options granted during the twelve month periods ended December 31, 2006, 2005 and 2004 were $8.35 per share, $8.07 per share and $6.73 per share respectively.
The table below present’s information related to stock option activity for the years ended December 31, 2006, 2005 and 2004 (in thousands of dollars):
| | | | | | | | | |
| | | 2006 | | 2005 | | 2004 |
Total intrinsic value of stock options exercised | | $ | 910 | | $ | 173 | | $ | 215 |
Cash received from stock options exercised | | | 467 | | | 156 | | | 236 |
Gross income tax benefit from the exercise of stock options | | | 22 | | | — | | | 33 |
A summary of stock option activity for the years ended December 31, 2006, 2005 and 2004 is as follows (dollars are in thousands, except for per share data):
| | | | | | | | | | | | | | | | | | |
| | | December 31, 2006 | | December 31, 2005 | | December 31, 2004 |
| | | Number of
Options | | | Weighted-
Average
Exercise
Price | | Number of
Options | | | Weighted-
Average
Exercise
Price | | Number of
Options | | | Weighted-
Average
Exercise
Price |
Options outstanding, beginning of period | | 706,918 | | | $ | 10.43 | | 688,666 | | | $ | 9.98 | | 490,172 | | | $ | 7.13 |
Options granted | | 31,500 | | | $ | 18.56 | | 41,000 | | | $ | 17.00 | | 244,000 | | | $ | 14.99 |
Options exercised | | (73,638 | ) | | $ | 6.34 | | (18,248 | ) | | $ | 8.55 | | (39,006 | ) | | $ | 6.06 |
Options forfeited | | — | | | | — | | (4,500 | ) | | $ | 9.17 | | (6,500 | ) | | $ | 6.58 |
Options issued pursuant to Mid FL merger | | 77,456 | | | $ | 12.62 | | — | | | | — | | — | | | | — |
| | | | | | | | | | | | | | | | | | |
Options outstanding, end of period | | 742,236 | | | $ | 11.41 | | 706,918 | | | $ | 10.43 | | 688,666 | | | $ | 9.98 |
| | | | | | | | | | | | | | | | | | |
CENTERSTATE BANKS OF FLORIDA, INC. AND SUBSIDIARIES
Notes to Consolidated Financial Statements
(amounts are in thousands of dollars, except per share data)
December 31, 2006, 2005 and 2004
| | | | | | | | | | |
| | | Number of
Options | | Weighted-
Average
Exercise
Price | | Weighted-
Average
Contractual
Term | | Aggregate
Intrinsic
Value |
Options outstanding, December 31, 2006 | | 742,236 | | $ | 11.41 | | 6.2 years | | $ | 7,044 |
Options fully vested and expected to vest, December 31, 2006 | | 742,236 | | $ | 11.41 | | 6.2 years | | $ | 7,044 |
Options exercisable, December 31, 2006 | | 638,611 | | $ | 10.61 | | 5.9 years | | $ | 6,571 |
(16) Employee Benefit Plan
Substantially all of the subsidiary banks employees are covered under the Company’s 401(k) compensation and incentive plan. Employees are eligible to participate in the plan after completing six months of continuous employment. The Company contributes an amount equal to a certain percentage of the employees’ contributions based on the discretion of the Board of Directors. In addition, the Company may also make additional contributions to the plan each year, subject to profitability and other factors, and based solely on the discretion of the Board of Directors. For the years ended December 31, 2006, 2005 and 2004, the Company’s contributions to the plan were $842, $650 and $470, respectively, which are included in salary and benefits on the Consolidated Statement of Operations.
CENTERSTATE BANKS OF FLORIDA, INC. AND SUBSIDIARIES
Notes to Consolidated Financial Statements
(amounts are in thousands of dollars, except per share data)
December 31, 2006, 2005 and 2004
(17) Parent Company Only Financial Statements
Condensed financial statements of CenterState Banks of Florida, Inc. (parent company only) follow:
Condensed Balance Sheet
December 31, 2006 and 2005
| | | | | | | | |
| | | 2006 | | | 2005 | |
Assets: | | | | | | | | |
Cash and due from banks | | $ | 1,278 | | | $ | 3,850 | |
Inter-company receivable from bank subsidiaries | | | 32,000 | | | | 37,000 | |
Investment in wholly-owned bank subsidiaries | | | 94,426 | | | | 65,971 | |
Investments | | | — | | | | 400 | |
Prepaid expenses and other assets | | | 717 | | | | 509 | |
| | | | | | | | |
Total assets | | $ | 128,421 | | | $ | 107,730 | |
| | | | | | | | |
| | |
Liabilities: | | | | | | | | |
Accounts payable and accrued expenses | | $ | 1,089 | | | $ | 489 | |
Corporate debenture | | | 10,000 | | | | 10,000 | |
| | | | | | | | |
Total liabilities | | | 11,089 | | | | 10,489 | |
| | |
Stockholders’ Equity: | | | | | | | | |
Common stock | | | 111 | | | | 52 | |
Additional paid-in capital | | | 86,989 | | | | 75,001 | |
Retained earnings | | | 30,878 | | | | 23,954 | |
Accumulated other comprehensive loss | | | (646 | ) | | | (1,766 | ) |
| | | | | | | | |
Total stockholders’ equity | | | 117,332 | | | | 97,241 | |
| | | | | | | | |
Total liabilities and stockholders’ equity | | $ | 128,421 | | | $ | 107,730 | |
| | | | | | | | |
Condensed Statements of Operations
Years ended December 31, 2006, 2005 and 2004
| | | | | | | | | | | | |
| | | 2006 | | | 2005 | | | 2004 | |
Other income | | $ | 22 | | | $ | 21 | | | $ | 8 | |
Interest expense | | | 864 | | | | 682 | | | | 496 | |
Operating expenses | | | 2,587 | | | | 1,303 | | | | 1,174 | |
| | | | | | | | | | | | |
Loss before equity in net earnings of subsidiaries | | | (3,429 | ) | | | (1,964 | ) | | | (1,662 | ) |
| | | |
Equity in net earnings of subsidiaries (net of income tax expense of $6,010, $4,457 and $3,187 at December 31, 2006, 2005 and 2004, respectively) | | | 10,737 | | | | 7,561 | | | | 5,415 | |
| | | | | | | | | | | | |
Net income before income tax benefit | | | 7,308 | | | | 5,597 | | | | 3,753 | |
Income tax benefit | | | (1,151 | ) | | | (733 | ) | | | (620 | ) |
| | | | | | | | | | | | |
Net income | | $ | 8,459 | | | $ | 6,330 | | | $ | 4,373 | |
| | | | | | | | | | | | |
CENTERSTATE BANKS OF FLORIDA, INC. AND SUBSIDIARIES
Notes to Consolidated Financial Statements
(amounts are in thousands of dollars, except per share data)
December 31, 2006, 2005 and 2004
Condensed Statements of Cash Flows
Years ended December 31, 2006, 2005 and 2004
| | | | | | | | | | | | |
| | | 2006 | | | 2005 | | | 2004 | |
Cash flows from operating activities: | | | | | | | | | | | | |
Net income | | $ | 8,459 | | | $ | 6,330 | | | $ | 4,373 | |
Tax deduction in excess of book deduction on options exercised prior to 2006 | | | — | | | | — | | | | 33 | |
Adjustments to reconcile net income to net cash used in operating activities: | | | | | | | | | | | | |
Equity in net earnings of subsidiaries | | | (10,737 | ) | | | (7,561 | ) | | | (5,415 | ) |
Increase (decrease) in payables and accrued expenses | | | 434 | | | | 120 | | | | 244 | |
(Increase) decrease in other assets | | | (189 | ) | | | 117 | | | | (299 | ) |
Stock based compensation expense | | | 594 | | | | — | | | | — | |
Realized gain on sale of available for sale securities | | | (17 | ) | | | — | | | | — | |
| | | | | | | | | | | | |
Net cash flows used in operating activities | | | (1,456 | ) | | | (994 | ) | | | (1,064 | ) |
| | | | | | | | | | | | |
| | | |
Cash flows from investing activities: | | | | | | | | | | | | |
Inter-company receivables from subsidiary banks | | | 5,000 | | | | (37,000 | ) | | | — | |
Cash payments for merger transaction costs | | | (279 | ) | | | — | | | | — | |
Cash payments to CSB shareholders | | | — | | | | — | | | | (65 | ) |
Cash payments to Mid FL shareholders | | | (4,207 | ) | | | — | | | | — | |
Proceeds from maturities of investment securities AFS | | | 300 | | | | — | | | | — | |
Proceeds from sales of investment securities available for sale | | | 117 | | | | — | | | | — | |
Purchase of CD investment, available for sale portfolio | | | — | | | | — | | | | (300 | ) |
Investment in subsidiaries | | | (1,000 | ) | | | (3,000 | ) | | | (4,600 | ) |
| | | | | | | | | | | | |
Net cash flows used in investing activities | | | (69 | ) | | | (40,000 | ) | | | (4,965 | ) |
| | | | | | | | | | | | |
| | | |
Cash flows from financing activities: | | | | | | | | | | | | |
Stock options exercised, including tax benefit in 2006 | | | 488 | | | | 613 | | | | 321 | |
Dividends paid to shareholders | | | (1,535 | ) | | | (1,225 | ) | | | (933 | ) |
Net proceeds from common stock issuance | | | — | | | | 34,854 | | | | 12,698 | |
| | | | | | | | | | | | |
Net cash flows provided by financing activities | | | (1,047 | ) | | | 34,242 | | | | 12,086 | |
| | | | | | | | | | | | |
Net (decrease )increase in cash and cash equivalents | | | (2,572 | ) | | | (6,752 | ) | | | 6,057 | |
Cash and cash equivalents at beginning of year | | | 3,850 | | | | 10,602 | | | | 4,545 | |
| | | | | | | | | | | | |
Cash and cash equivalents at end of year | | $ | 1,278 | | | $ | 3,850 | | | $ | 10,602 | |
| | | | | | | | | | | | |
CENTERSTATE BANKS OF FLORIDA, INC. AND SUBSIDIARIES
Notes to Consolidated Financial Statements
(amounts are in thousands of dollars, except per share data)
December 31, 2006, 2005 and 2004
(18) Credit Commitments
The Company has outstanding at any time a significant number of commitments to extend credit. These arrangements are subject to strict credit control assessments and each customer’s credit worthiness is evaluated on a case-by-case basis. A summary of commitments to extend credit and standby letters of credit written at December 31, 2006 and 2005, are as follows:
| | | | | | |
| | | December 31, |
| | | 2006 | | 2005 |
Standby letters of credit | | $ | 3,902 | | $ | 4,817 |
Available lines of credit | | | 122,431 | | | 103,611 |
Unfunded loan commitments – fixed | | | 10,498 | | | 13,790 |
Unfunded loan commitments – variable | | | 10,985 | | | 23,595 |
Because many commitments expire without being funded in whole or part, the contract amounts are not estimates of future cash flows.
Credit risk represents the accounting loss that would be recognized at the reporting date if counterparties failed completely to perform as contracted. The credit risk amounts are equal to the contractual amounts, assuming that the amounts are fully advanced and that the collateral or other security is of no value.
The Company’s policy is to require customers to provide collateral prior to the disbursement of approved loans. The amount of collateral obtained, if it is deemed necessary by the Company upon extension of credit, is based on management’s credit evaluation of the counterparty. Collateral held varies but may include accounts receivable, inventory, real estate and income providing commercial properties.
Standby letters of credit are contractual commitments issued by the Company to guarantee the performance of a customer to a third party. The credit risk involved in issuing letters of credit is essentially the same as that involved in extending loan facilities to customers.
Outstanding commitments are deemed to approximate fair value due to the variable nature of the interest rates involved and the short-term nature of the commitments.
(19) Concentrations of Credit Risk
Most of the Company’s business activity is with customers located within Osceola, Orange, Pasco, Hernando, Citrus, Sumter, Lake and Polk Counties of the State of Florida and portions of adjacent counties. The majority of commercial and mortgage loans are granted to customers residing in these areas. Generally, commercial loans are secured by real estate, and mortgage loans are secured by either first or second mortgages on residential or commercial property. As of December 31, 2006, substantially all of the Company’s loan portfolio was secured. Although the Company has a diversified loan portfolio, a substantial portion of its debtors’ ability to honor their contracts is dependent upon the economy of Osceola, Orange, Pasco, Hernando, Citrus, Sumter, Lake and Polk Counties and portions of adjacent counties. The Company does not have significant exposure to any individual customer or counterparty.
CENTERSTATE BANKS OF FLORIDA, INC. AND SUBSIDIARIES
Notes to Consolidated Financial Statements
(amounts are in thousands of dollars, except per share data)
December 31, 2006, 2005 and 2004
(20) Basic and Diluted Earnings Per Share
Basic earnings per share is based on the weighted average number of common shares outstanding during the periods. Diluted earnings per share includes the weighted average number of common shares outstanding during the periods and the further dilution from stock options using the treasury method. There were 70,500 stock options that were anti dilutive at December 31, 2006. The following is a reconciliation of the numerators and denominators of the basic and diluted earnings per share computations for the periods presented (dollars are in thousands, except per share data). All per share data has been adjusted to reflect our May 2006 two for one stock split.
| | | | | | | | | |
| | | 2006 | | 2005 | | 2004 |
Numerator for basic and diluted earnings per share: | | | | | | | | | |
Net income | | $ | 8,459 | | $ | 6,330 | | $ | 4,373 |
| | | | | | | | | |
Denominator: | | | | | | | | | |
Denominator for basic earnings per share - weighted-average shares | | | 10,964,890 | | | 9,357,046 | | | 7,500,316 |
Effect of dilutive securities: | | | | | | | | | |
Employee stock options | | | 267,169 | | | 272,148 | | | 155,992 |
| | | | | | | | | |
Denominator for diluted earnings per share - adjusted weighted-average shares | | | 11,232,059 | | | 9,629,194 | | | 7,656,308 |
Basic earnings per share | | $ | 0.770 | | $ | 0.675 | | $ | 0.585 |
Diluted earnings per share | | $ | 0.750 | | $ | 0.655 | | $ | 0.570 |
CENTERSTATE BANKS OF FLORIDA, INC. AND SUBSIDIARIES
Notes to Consolidated Financial Statements
(amounts are in thousands of dollars, except per share data)
December 31, 2006, 2005 and 2004
(21) Business combinations
On March 31, 2006, the Company acquired 100% of the outstanding common stock of CenterState Bank Mid Florida. The purchase price consisted of cash and stock. Each share of Mid FL common stock was exchanged for $4.35 cash and 0.2774 shares of the Company’s common stock. Based on the closing price of the Company’s common stock on March 31, 2006, the resulting purchase price was $14,559. Other costs include the value of the employee stock options acquired (approximately $760) and transaction expenses of approximately $279. Total cost of the transaction was approximately $15,598.
The following table summarizes the fair values of the assets acquired and liabilities assumed at the date of acquisition:
| | | |
| | | March 31,
2006 Fair Value |
Assets: | | | |
Cash and due from banks | | $ | 1,813 |
Federal funds sold | | | 16,240 |
Securities available for sale | | | 11,090 |
Loans – net | | | 52,689 |
Premises and equipment | | | 3,345 |
Goodwill | | | 5,188 |
Core deposit intangible | | | 3,118 |
Other assets | | | 533 |
| | | |
Total assets | | $ | 94,016 |
| | | |
| |
Liabilities: | | | |
Deposits | | $ | 78,302 |
Other liabilities | | | 116 |
| | | |
Total liabilities | | | 78,418 |
Net assets acquired | | | 15,598 |
| | | |
Total liabilities and net assets acquired | | $ | 94,016 |
| | | |
During November, the Company entered into a definitive agreement to purchase Valrico Bancorp, Inc. (“VBI”) for a combination of cash and stock. Each VBI shareholder of record will have an option to elect payment in stock, cash or a combination of stock and cash, but in no event will more than 1,333,741 nor less than 1,238,475 of the CenterState’s common shares be issued in the aggregate, pursuant to the terms and restrictions set forth in the definitive agreement. VBI shareholders electing stock consideration will be entitled to receive 5.25 shares of CenterState common stock for each share of VBI common stock exchanged. VBI shareholders electing cash consideration will be entitled to receive $105.06 for each share of VBI common stock exchanged. At December 31, 2006, VBI reported total consolidated assets of approximately $150,000, total loans of $124,000 and total deposits of $120,000. The transaction is expected to close during April 2007, subject to VBI shareholder approval and regulatory approval. The purchase price will depend on the market value of the Company’s stock at the time of closing. Assuming a market value of $20.90 per share, the Company’s closing price at December 31, 2006, as reported by NASDAQ, the purchase price would approximate $39.6 million.
SIGNATURES
Pursuant to the requirements of Section 13 or 15(d) of the Securities Exchange Act of 1934, the Registrant has caused this report to be duly signed on its behalf by the undersigned, thereunto duly authorized, in the City of Winter Haven, State of Florida, on the 12th day of March, 2007.
|
CenterState BANKS OF FLORIDA, INC. |
|
/s/ Ernest S. Pinner |
| Ernest S. Pinner |
| Chairman of the Board, |
| President and Chief Executive Officer |
|
/s/ James J. Antal |
| James J. Antal |
| Senior Vice President and Chief Financial Officer |
| (Principal financial officer and principal accounting officer) |
Pursuant to the requirements of the Securities Exchange Act of 1934, this report has been signed below by the following persons on behalf of the Registrant and in the capacities and on March 12, 2007.
| | |
Signature | | Title |
| |
/s/ E. S “Ernie” Pinner E. S. “Ernie” Pinner | | Chairman of the Board President and Chief Executive Officer |
| |
| | |
| |
/s/ James H. Bingham James H. Bingham | | Director |
| |
| | |
| |
/s/ G. Robert Blanchard, Jr. G. Robert Blanchard, Jr. | | Director |
| |
| | |
| |
/s/ Terry W. Donley Terry W. Donley | | Director |
| |
| | |
| |
/s/ Frank M. Foster, Jr. Frank M. Foster, Jr. | | Director |
| |
| | |
| |
/s/ Gail E. Gregg-Strimenos Gail E. Gregg-Strimenos | | Director |
| |
| | |
98
| | |
/s/ Bryan W. Judge Bryan W. Judge | | Director |
| |
| | |
| |
/s/ Samuel L. Lupfer, IV Samuel L. Lupfer, IV | | Director |
| |
| | |
| |
/s/ Lawrence W. Maxwell Lawrence W. Maxwell | | Director |
| |
| | |
| |
/s/ Rulon D. Munns Rulon D. Munns | | Director |
| |
| | |
| |
/s/ G. Tierso Nunez II G. Tierso Nunez II | | Director |
| |
| | |
| |
/s/ Thomas E. Oakley Thomas E. Oakley | | Director |
| |
| | |
| |
/s/ J. Thomas Rocker J. Thomas Rocker | | Director |
99
CenterState Banks of Florida, Inc.
Form 10-K
For Fiscal Year Ending December 31, 2006
EXHIBIT INDEX
| | |
Exhibit
No. | | Exhibit |
| 21.1 | | Subsidiaries of the Registrant |
| |
| 23.1 | | Consent of Crowe Chizek and Company LLC |
| |
| 23.2 | | Consent of KPMG LLP |
| |
| 31.1 | | Certification of President and Chief Executive Officer under Section 302 of the Sarbanes-Oxley Act of 2002 |
| |
| 31.2 | | Certification of Chief Financial Officer under Section 302 of the Sarbanes-Oxley Act of 2002 |
| |
| 32.1 | | Certification of President and Chief Executive Officer under Section 906 of the Sarbanes-Oxley Act of 2002 |
| |
| 32.2 | | Certification of Chief Financial Officer under Section 906 of the Sarbanes-Oxley Act of 2002 |
100