 NASDAQ: CSFL July 31, 2007 Exhibit 99.1 |
 2 Forward Looking Statement This presentation contains forward-looking statements, as defined by Federal Securities Laws, relating to present or future trends or factors affecting the operations, markets and products of CenterState Banks of Florida, Inc. (CSFL). These statements are provided to assist in the understanding of future financial performance. Any such statements are based on current expectations and involve a number of risks and uncertainties. For a discussion of factors that may cause such forward- looking statements to differ materially from actual results, please refer to CSFL’s most recent Form 10-Q filed with the Securities Exchange Commission. CSFL undertakes no obligation to release revisions to these forward- looking statements or reflect events or circumstances after the date of this presentation. |
 3 Franchise Overview |
 4 Corporate Profile • Headquartered in Winter Haven, Florida • Nasdaq Symbol: CSFL • Company formed: June 2000 • 5 Subsidiary Banks; 36 branch banking offices – 9 Counties throughout Central Florida 192 Hillsborough 5 Valrico State Bank (1989) 104 Lake 4 CenterState Bank Mid FL (2004) 414 Polk 12 CenterState Bank of FL (2000 & 1992) 277 Pasco, Sumter, Hernando, Citrus 8 CenterState Bank West FL (1989) $254 Osceola, Orange 7 CenterState Bank Central FL (1989) Asset Size ($ millions) Counties of Operation No. of Offices • Acquisitions: CenterState Bank of FL (Dec 2002) CenterState Bank Mid FL (Mar 2006) Valrico State Bank (Apr 2007) 142 998 817 $ 1,241 Equity: Deposits: Loans: Assets: 2 nd Qrt 2007 Highlights ($ millions) |
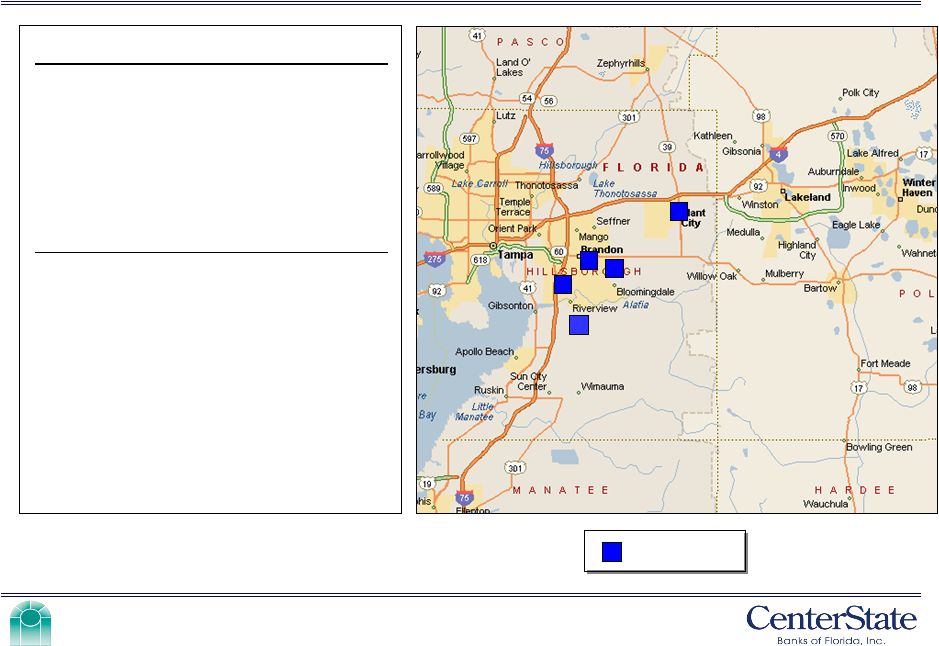
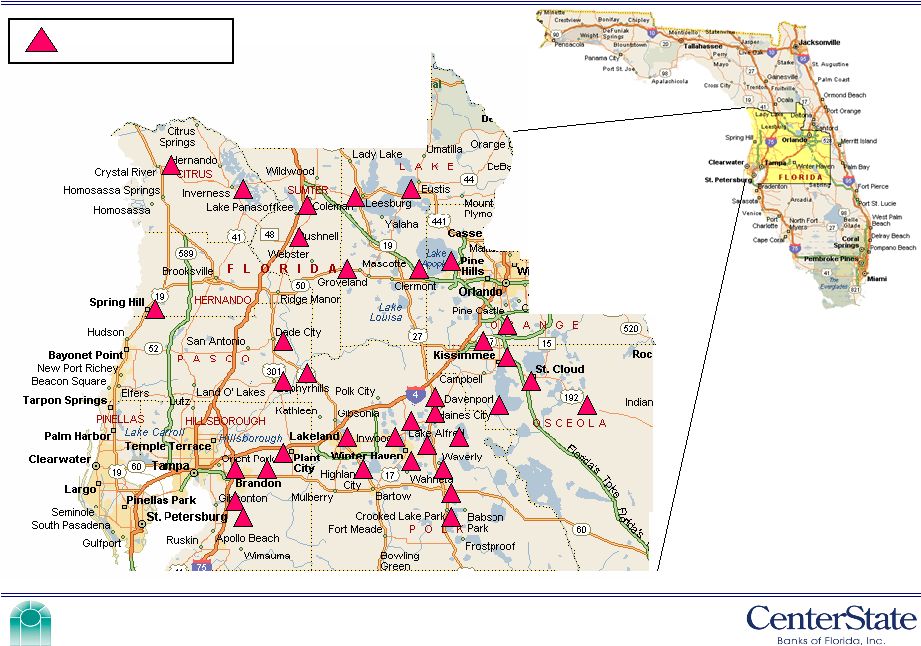 5 Branch Footprint CSFL Branch |
 6 Experienced Management Team Executive Management Internal Audit / Compliance Senior Commercial Loan Officers 54 30 President & CEO, Valrico State Bank Jerry Ball 47 27 President & CEO, CenterState Bank Mid Florida Timothy A. Pierson 38 18 President & CEO, CenterState Bank of Florida John C. Corbett 52 30 President & CEO, CenterState Bank Central Florida Thomas E. White 63 40 Senior Vice President & COO George H. Carefoot 55 24 Senior Vice President & CFO James J. Antal 59 43 Chairman, President & CEO Ernest S. Pinner Age Years in Banking Title Name 50 26 Senior Lenders (20) Title Avg Age Avg Years in Banking 46 (Avg) 22 (Avg) Auditor/Compliance/Loan Review Staff (4) 61 43 Senior Vice President & Chief Internal Auditor J. Wayne Stewart Age Years in Banking Title Name |
 7 Business Strategy • Maintain local decision making • Emphasize relationship banking • Develop a network of profitable banks in high-growth markets in Central Florida • Disciplined approach to loan and deposit growth • Leverage our investment in our branch network • Continue to take advantage of merger turmoil in Florida |
  8 Acquisition of Valrico Bancorp, Inc. Valrico Branch TRANSACTION OVERVIEW Close Date 4/2/2007 Deal Value $36.1 million Consideration Mix 65% Stock Price / Earnings (2006) 19 x Price / Book 221 % Core Deposit Premium 18 FINANCIAL HIGHLIGHTS Assets $161.5 million Loans 122.1 Deposits 130.6 ROAA (2006) 1.24 % ROAE (2006) 13.26 Net Interest Margin (2Q 07) 4.88 Efficiency (2Q 07) 71.10 NPAs / Assets (6/30/07) 0.00 Reserves / Loans (6/30/07) 1.36 Loans / Deposits (6/30/07) 86.98 Tangible Equity / Assets (6/30/07) 10.35 Source: SNL Financial, FDIC and Company reports. Deal Value and pricing multiples at close. Data as of 04/02/07 unless otherwise noted. |
 9 Strong Market Share Counties of Operation Source: SNL Financial. Deposit data as of 6/30/06; pro forma for acquisition of Valrico Bancorp, Inc. Market share data for Citrus, Hernando, Hillsborough, Lake, Osceola, Pasco, Polk and Sumter Counties, Florida. Excludes Orange County in which CSFL has $33 million in deposits and 2 branches. Osceola County - (Orlando MSA) # 3 in market share (8.4%) 2nd fastest growing county in Florida 2006 - 2011 population growth of 38.3% 5 branches Polk County - (Lakeland MSA) # 5 in market share (5.5%) 2006 - 2011 population growth of 11.9% 12 branches Sumter County - (The Villages MSA) # 5 in market share (5.0%) 7th fastest growing county in Florida 2006 - 2011 population growth of 28.9% 2 branches Pasco County - (Tampa MSA) # 9 in market share (2.2%) 8th fastest growing county in Florida 2006 - 2011 population growth of 25.1% 3 branches * Colonial BancGroup acquisition of C & C Bancorp announced on July 18, 2007 Deposits Market Rank Institution ($000s) Share Branches 1 Bank of America Corp. (NC) 9,191,252 22.35 % 103 2 Wachovia Corp. (NC) 8,218,794 19.99 115 3 SunTrust Banks Inc. (GA) 7,597,060 18.48 131 4 Regions Financial Corp. (AL) 2,516,248 6.12 84 5 Colonial BancGroup Inc. (AL) 2,261,722 5.50 41 6 CenterState Banks of Florida (FL) 957,218 2.33 33 7 Fifth Third Bancorp (OH) 842,457 2.05 21 8 BB&T Corp. (NC) 735,384 1.79 20 9 Citrus & Chemical Bancorp. (FL)* 731,620 1.78 10 10 South Financial Group Inc. (SC) 715,293 1.74 17 |
 10 Market Demographics • 4 of our 9 counties rank in the top 10 fastest growing counties in Florida CSFL Counties 2006 - 2011 Projected Population Growth (%) CenterState Banks of Florida, Inc. 21.5 % Bank of Florida Corporation 18.7 Seacoast Banking Corporation of Florida 13.8 TIB Financial Corp. 10.2 BankUnited Financial Corporation 9.7 BankAtlantic Bancorp, Inc. 9.4 Capital City Bank Group, Inc. 8.3 Florida 12.9 % Southeast 9.0 United States 6.7 2006 - 2011 Population Growth (%) Osceola 38.3 % Lake 29.6 Sumter 28.9 Pasco 25.1 Hernando 18.9 Orange 15.8 Citrus 14.2 Hillsborough 13.8 Polk 11.9 Source: SNL Financial. CSFL pro forma for acquisition of Valrico Bancorp, Inc. Population deposit weighted by county as of 6/30/06. Southeast includes AL, AR, FL, GA, KY, LA, MS, NC, SC, TN, VA and WV. |
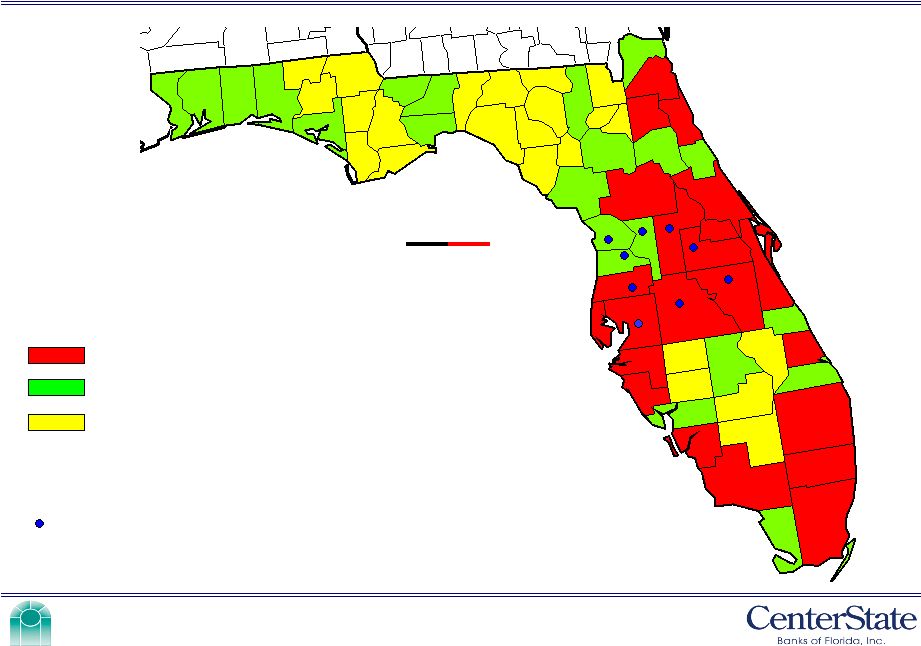 11 Market Demographics Escambia Santa Rosa Okaloosa Walton Holmes Washington Bay Calhoun Gulf Liberty Jackson Gadsden Franklin Wakulla Leon Jefferson Taylor Madison Dixie Lafayette Suwannee Hamilton Columbia Gilchrist Levy Citrus Marion Alachua Union Baker Bradford Clay Duval Nassau St. Johns Putnam Flagler Volusia Lake Seminole Orange Sumter Hernando Pasco Pinellas Hillsborough Manatee Sarasota Charlotte Lee Collier Monroe Dade Broward Palm Beach Hendry Glades Martin St. Lucie Okeechobee Highlands De Soto Hardee Polk Osceola Indian River Brevard Miles 0 30 60 Indicates counties in which CSFL currently has branches High Growth County (Based on Projected Economic Indicator Change ’05-’10) Medium Growth County Low Growth County |
 12 Operating Results |
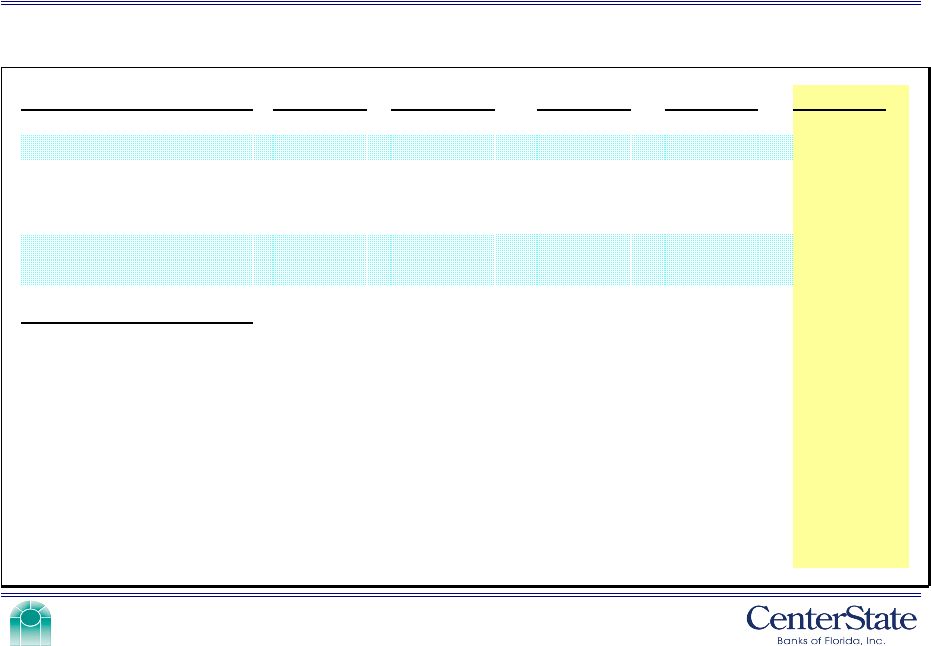 13 Solid Operating Results Quarterly Financial Performance & Condition ($ in thousands, except per share data) 8.70 9.56 9.38 9.14 8.80 Tangible Book Value per Share % % $11.44 $10.71 $10.54 $10.32 $10.00 Book Value per Share 9.88 11.2 11.2 11.2 11.3 Tier 1 Capital / Avg Assets 11.5 11.0 10.9 11.2 10.8 Equity / Assets 82.8 % 76.9 % 73.7 % 75.4 % 72.7 Loans / Deposits 142,247 119,716 117,332 114,812 111,072 Equity 1,063,118 953,174 945,598 895,454 903,626 Deposits & Repos 998,382 889,638 892,806 845,849 855,031 Deposits 826,215 684,141 657,963 637,684 621,638 Loans $1,240,984 $1,086,818 $1,077,102 $1,024,690 $1,028,630 Assets Balance Sheet Data: 0.18 0.16 0.19 0.20 0.19 Diluted Earnings per Share $2,280 $1,808 $2,191 $2,251 $2,207 Net Income 71 72 70 67 66 Efficiency 6.41 6.17 7.46 7.87 7.99 ROAE 0.74 0.69 0.84 0.87 0.89 ROAA 4.13 % 4.09 % 4.09 % 4.12 % 4.29 Net Interest Margin $11,244 $9,598 $9,622 $9,636 $9,581 Net Interest Income Q2 ’07 Q1 ‘07 Q4 ‘06 Q3 ‘06 Q2 ‘06 Operating Results: |
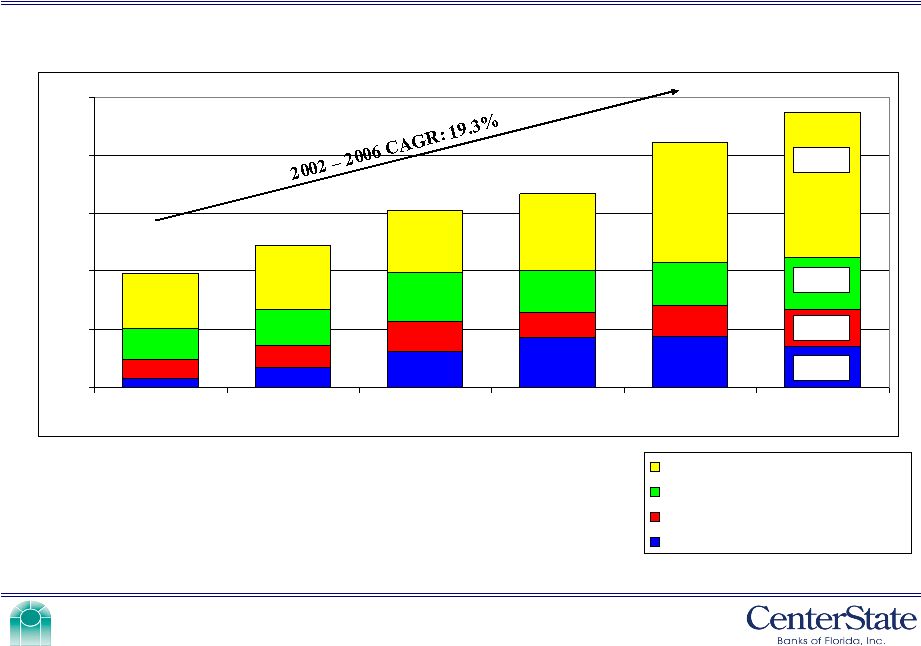
 14 100 250 400 550 700 850 2002 2003 2004 2005 2006 6/30/07 Loan Portfolio • 83% of our portfolio is secured by real estate • Our top ten relationships account for about 6% of loans • 41% variable rate versus 59% fixed rate • C, D, and Land loans represent 13% of total portfolio ($ Millions) Consumer & Other Commercial Construction, Development, & Land Commercial Real Estate Residential Real Estate 334 414 441 517 658 826 79 109 379 198 61 |
 15 Credit Quality Net Charge – Offs / Avg Loans (%) & Reserves / Loans (%) NPAs / Assets (%) Nonperforming assets include assets 90 days or more past due. 0.30 0.27 0.17 0.18 0.06 0.17 0.00 0.15 0.30 0.45 2002 2003 2004 2005 2006 6/30/07 0.13 0.12 0.07 0.05 0.08 0.01 1.17 1.29 1.15 1.22 1.12 1.26 0.00 0.35 0.70 1.05 1.40 2002 2003 2004 2005 2006 6/30/07 NCOs / Avg Loans Reserves / Loans |
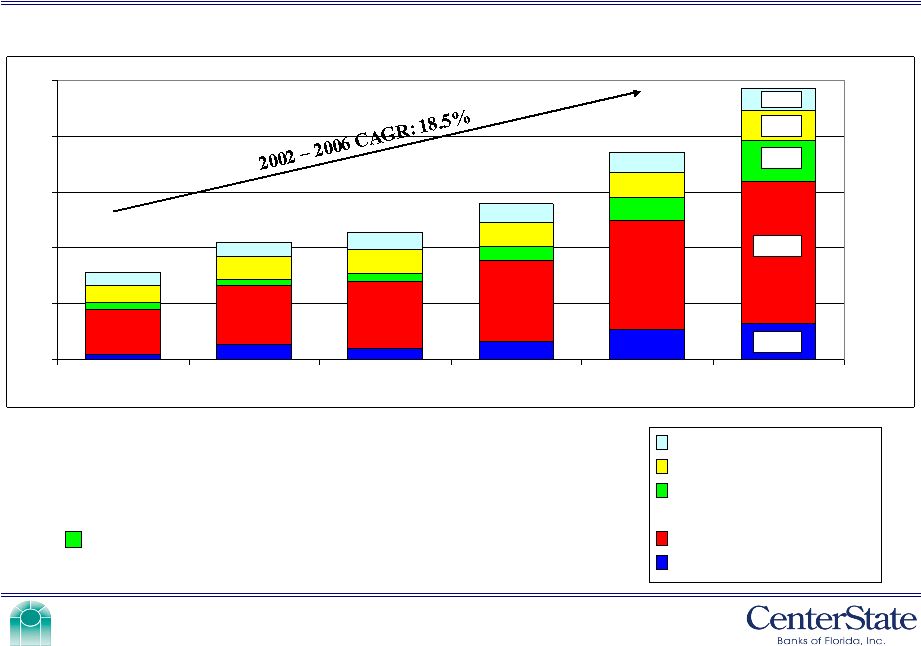
 16 Deposit Composition • Approximately 19% of our deposits are non-interest bearing checking accounts • 2002 – 2006 CAGR for non-interest bearing demand of 29% • Q1 ’07 cost of funds of 2.95% vs. 3.53% for peers • Q2 ’07 cost of funds is 3.09% ($ Millions) 50 250 450 650 850 1050 2002 2003 2004 2005 2006 6/30/07 441 538 660 717 893 998 499 179 130 190 CDs Money market & savings accounts Demand - interest bearing Non-interest bearing deposits |
 17 Low Cost Funding Fed Funds Rate (%) Cost of Funds (%) 2.88 2.77 2.78 2.59 2.16 1.23 1.17 1.26 1.26 1.28 1.39 1.56 1.67 1.84 3.09 2.95 2.89 2.72 2.35 1.25 1.19 1.30 1.32 1.37 1.51 1.70 1.85 2.03 0.50 1.25 2.00 2.75 3.50 Q1 '04 Q4 '04 Q3 '05 Q2 '06 Q1 '07 Cost of Deposits Cost of Funds 1.00 1.25 1.75 2.25 2.75 3.25 3.75 4.25 4.75 5.25 5.25 5.25 5.25 5.25 0.00 1.35 2.70 4.05 5.40 Q1 '04 Q3 '04 Q1 '05 Q3 '05 Q1 '06 Q3 '06 Q1 '07 |
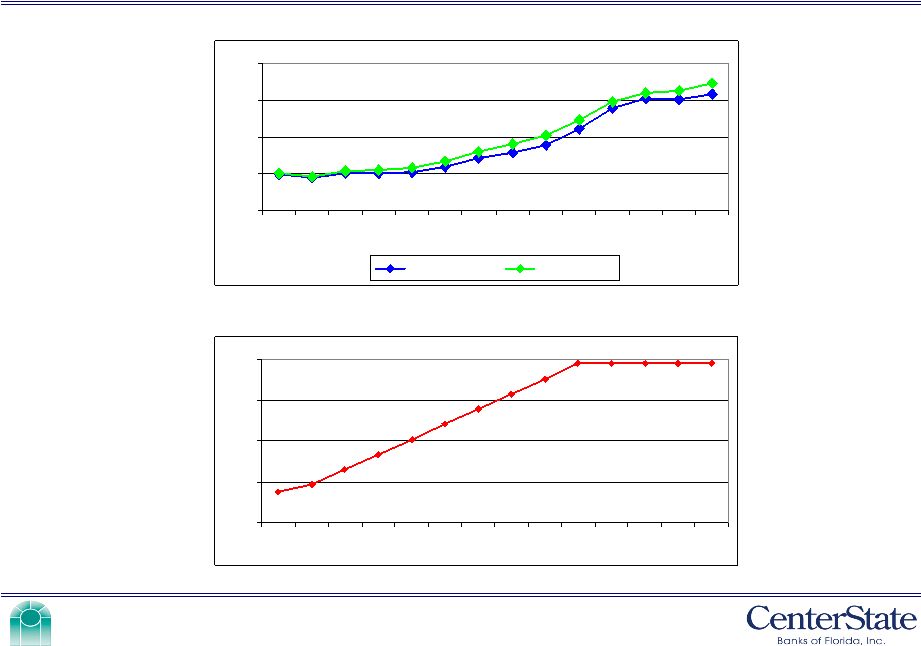
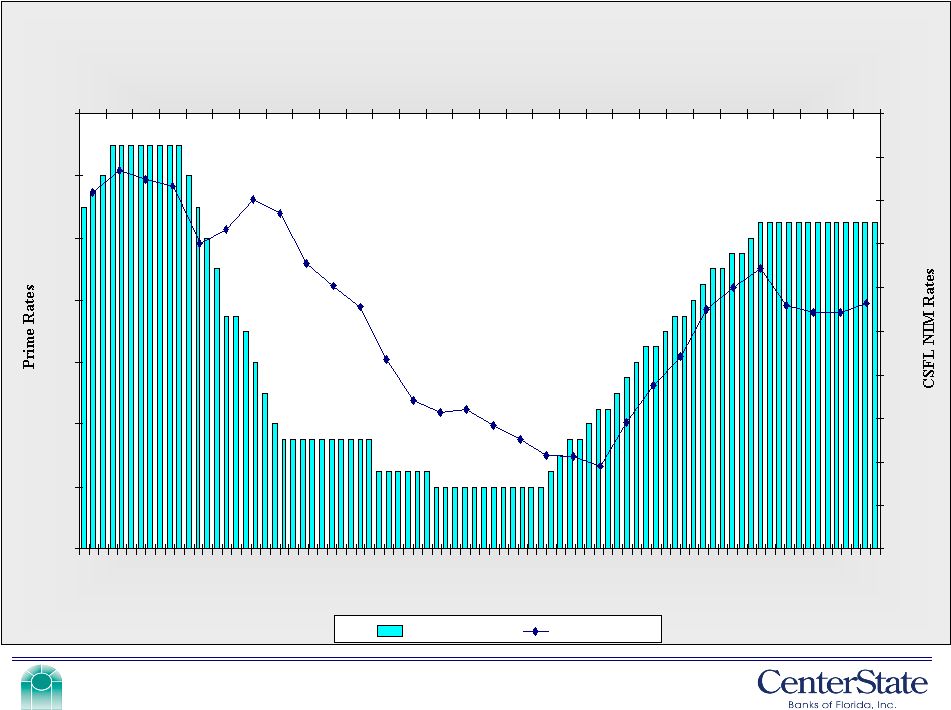 18 3.00 4.00 5.00 6.00 7.00 8.00 9.00 10.00 3.00 3.20 3.40 3.60 3.80 4.00 4.20 4.40 4.60 4.80 5.00 Prime CSFL NIM NIM - Time Interval Net Interest Margin vs. Prime 2000 2001 2002 2003 2004 2005 2006 2007 Prime - Time Interval |
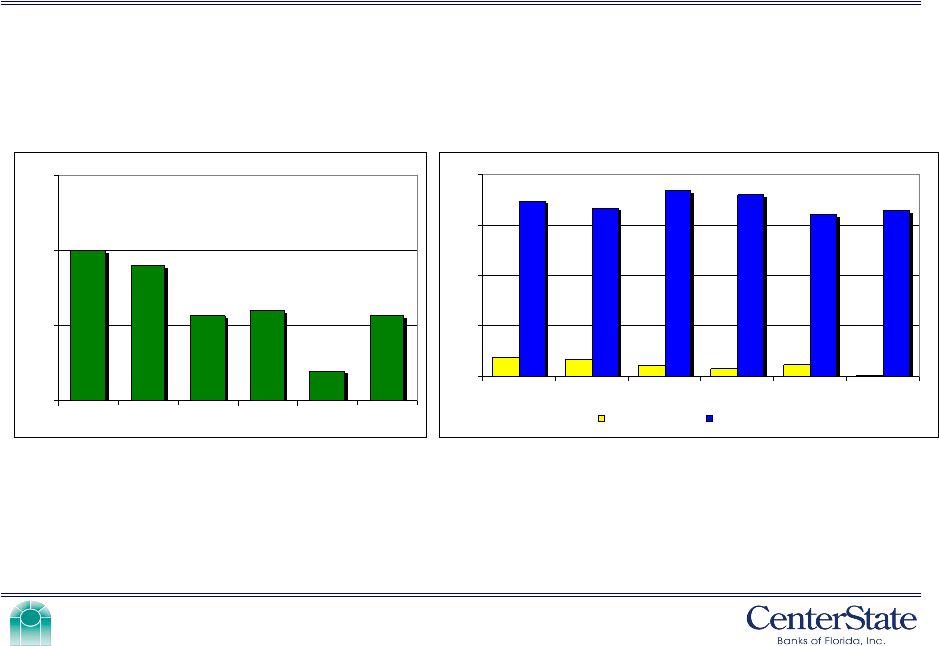
 19 Liquidity Loans / Deposits (%) 76 90 77 99 67 96 72 99 74 100 83 106 55 65 75 85 95 105 115 2002 2003 2004 2005 2006 6/30/07 CSFL Peers Peer group includes BOFL, BBX, BKUNA, CCBG, SBCF, and TIBB. Peer data for the most recent quarter available: March 31, 2007. |
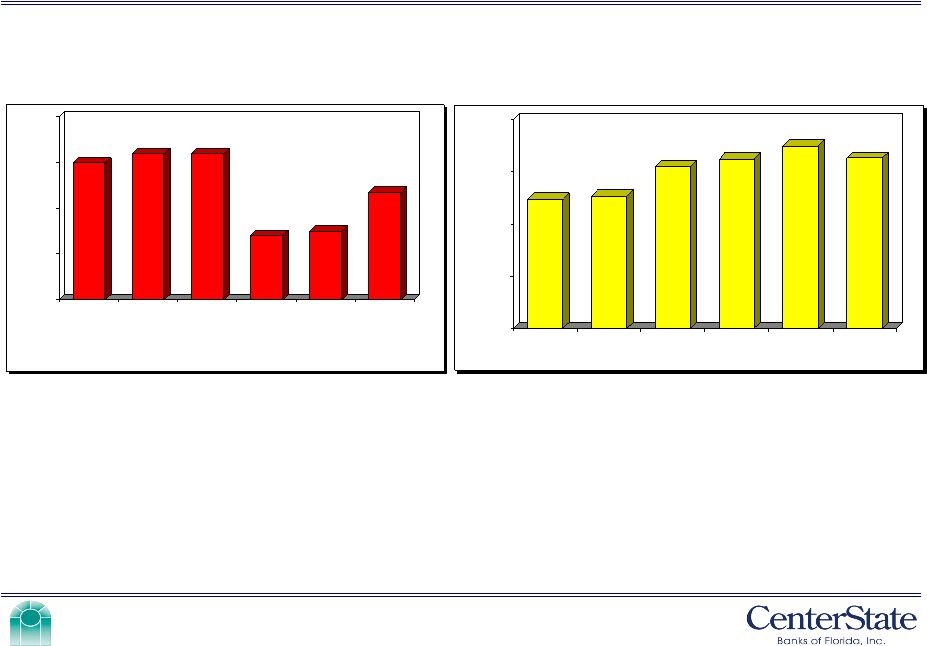 20 Improving Efficiencies Efficiency Ratio (%) Deposits per Branch ($ Millions) * Freedom branches; 2 of the freedom branches were closed in 2006. 75 76 76 67 68 72 60 65 70 75 80 2002 2003 2004 2005 2006 6/30/07 Branches Opened: 3 4* 2 1 3 2 21.0 21.5 26.4 27.6 29.8 27.7 0.0 8.5 17.0 25.5 34.0 2002 2003 2004 2005 2006 June '07 |
 21 Branches 36 Total Branch Locations $27,732 Avg Deposits @ Location June 2007 $5,173 Less than 3 year 7 $27,631 3 thru 5 years 6 $34,285 5 yrs and older 23 Avg Deposits at Location June 2007 No. of Years Open No. of Branch Locations |
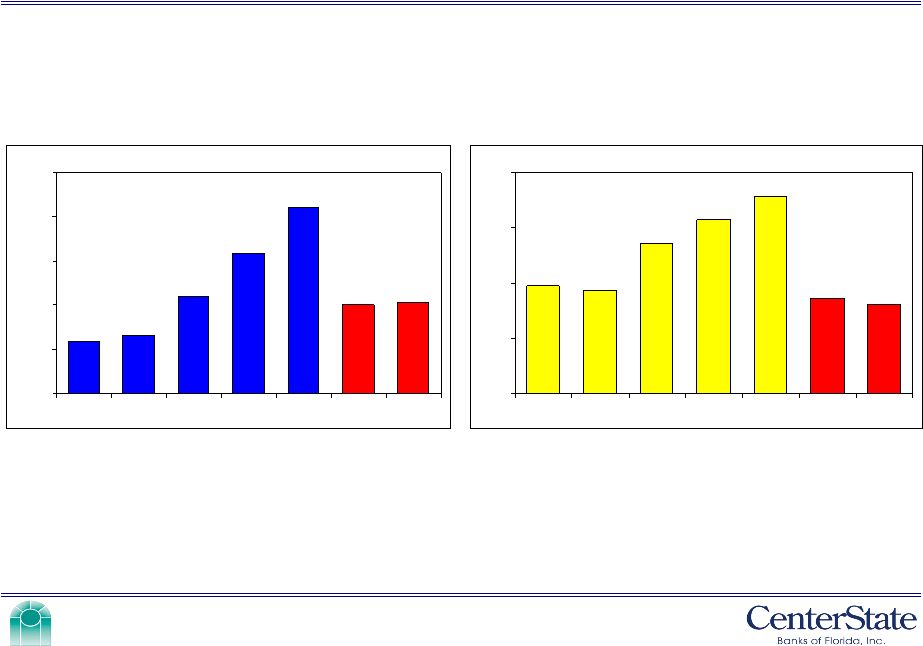 22 Financial Performance Net Income ($ Millions) Earnings Per Share ($) 0.00 2.00 4.00 6.00 8.00 10.00 2002 2003 2004 2005 2006 YTD '06 YTD '07 2.37 2.63 4.37 6.33 8.46 4.02 4.09 0.00 0.21 0.42 0.63 0.84 2002 2003 2004 2005 2006 YTD '06 YTD '07 0.41 0.39 0.57 0.66 0.75 0.36 0.34 2002 – 2006 CAGR of 37.5% 2002 – 2006 CAGR of 16.3% |
 23 Investment Highlights |
 24 Investment Highlights Market Capitalization (6/30/07): $225 million Institutional Ownership: 21 % Insider Ownership: 21 # of Registered Shareholders: 1,023* Free Float Shares: Approximately 9.8 million shares Price Performance *As reported by Transfer Agent. 3 and 5 year price performance as of June 30, 2007. S&P 500 Nasdaq Bank Time Horizon CSFL Index Index YTD 7/10/07 (12.5) % 6.5 % (9.4) % 3-Year 50.8 31.8 8.3 5-Year 87.9 51.9 31.0 |
 25 Building Shareholder Value • Dedicated employees • Sustainable earnings growth • Credit Quality • Growth Markets • Vision • Focus |
 26 NASDAQ: CSFL July 31, 2007 |