Exhibit 99.1

CenterState Banks of Florida, Inc.
NASDAQ: CSFL
February 2008
Forward Looking Statement
This presentation contains forward-looking statements, as defined by Federal Securities Laws, relating to present or future trends or factors affecting the operations, markets and products of CenterState Banks of Florida, Inc. (CSFL). These statements are provided to assist in the understanding of future financial performance. Any such statements are based on current expectations and involve a number of risks and uncertainties. For a discussion of factors that may cause such forward-looking statements to differ materially from actual results, please refer to CSFL’s most recent Form 10-Q filed with the Securities Exchange Commission.
CSFL undertakes no obligation to release revisions to these forward-looking statements or reflect events or circumstances after the date of this presentation.
Franchise Overview
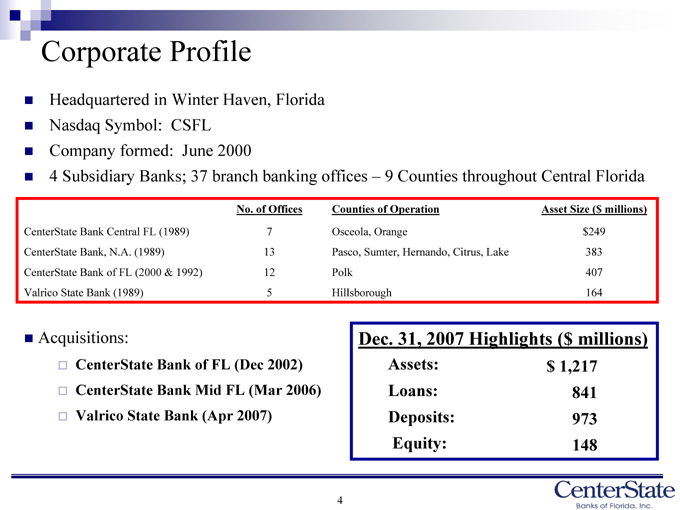
Corporate Profile
Headquartered in Winter Haven, Florida
Nasdaq Symbol: CSFL
Company formed: June 2000
4 | | Subsidiary Banks; 37 branch banking offices – 9 Counties throughout Central Florida |
No. of Offices
Counties of Operation
Asset Size ($ millions)
CenterState Bank Central FL (1989)
Osceola, Orange $249
CenterState Bank, N.A. (1989)
13
Pasco, Sumter, Hernando, Citrus, Lake
383
CenterState Bank of FL (2000 & 1992)
12
Polk
407
Valrico State Bank (1989)
Hillsborough
164
Acquisitions:
CenterState Bank of FL (Dec 2002)
CenterState Bank Mid FL (Mar 2006)
Valrico State Bank (Apr 2007)
Dec. 31, 2007 Highlights ($ millions)
Assets: $ 1,217
Loans:
841
Deposits:
973
Equity:
148
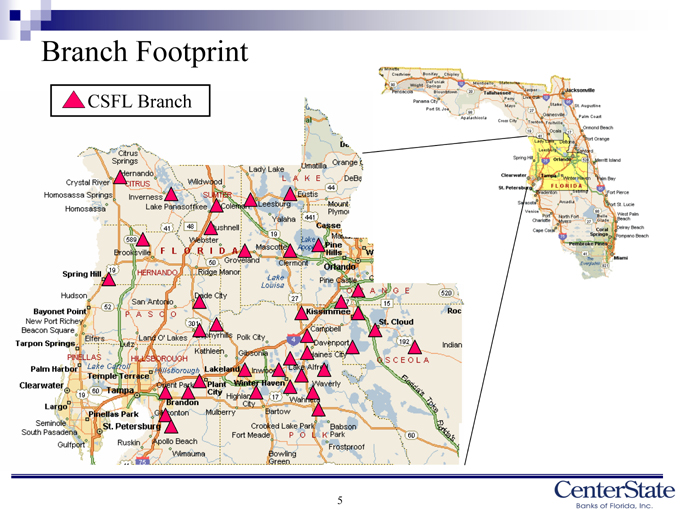
Branch Footprint
CSFL Branch
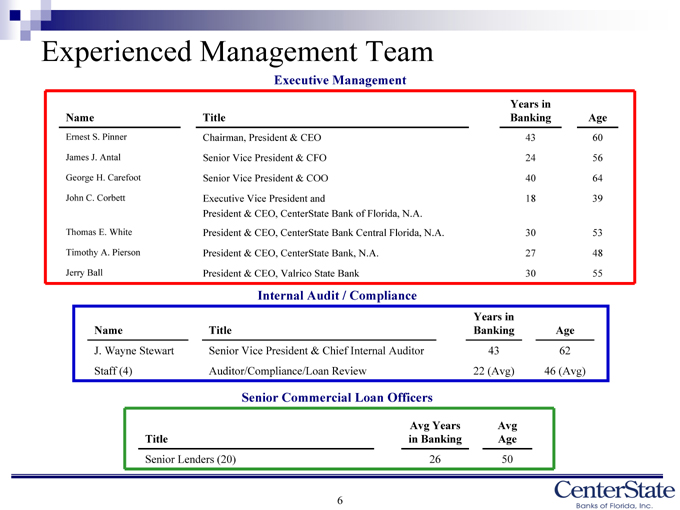
Experienced Management Team
Executive Management
Name Title Years in Banking Age
Ernest S. Pinner Chairman, President & CEO 43 60
James J. Antal Senior Vice President & CFO 24 56
George H. Carefoot Senior Vice President & COO 40 64
John C. Corbett Executive Vice President and 18 39
President & CEO, CenterState Bank of Florida, N.A.
Thomas E. White President & CEO, CenterState Bank Central Florida, N.A. 30 53
Timothy A. Pierson President & CEO, CenterState Bank, N.A. 27 48
Jerry Ball President & CEO, Valrico State Bank 30 55
Internal Audit / Compliance
Years in
Name Title Banking Age
J. Wayne Stewart Senior Vice President & Chief Internal Auditor 43 62
Staff (4) Auditor/Compliance/Loan Review 22 (Avg) 46 (Avg)
Senior Commercial Loan Officers
Title Avg Years in Banking Avg Age
Senior Lenders (20) 26 50
Business Strategy
Maintain local decision making
Emphasize relationship banking
Develop a network of profitable banks in high-growth markets in Central Florida
Disciplined approach to loan and deposit growth
Leverage our investment in our branch network
Continue to take advantage of merger turmoil in Florida
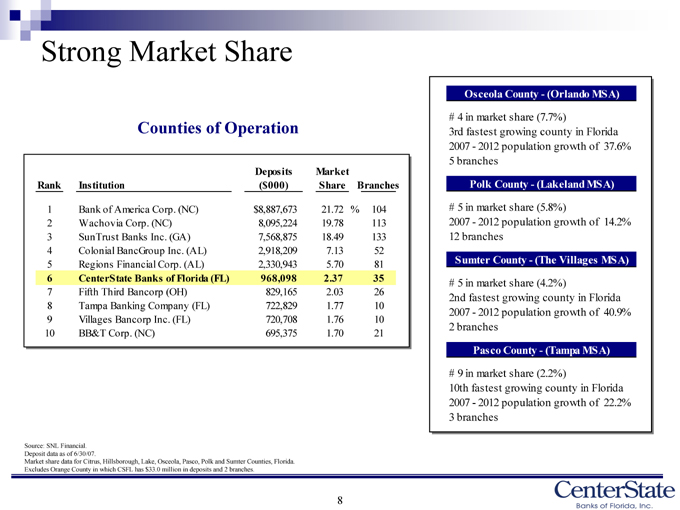
Strong Market Share
Counties of Operation
Deposits
Market
Rank
Institution
($
000)
ShareBranches
1
Bank of America Corp. (NC)
$8,887,673
21.72%
104
2
Wachovia Corp. (NC)
8,095,224
19.78
113
3
SunTrust Banks Inc. (GA)
7,568,875
18.49
133
4
Colonial BancGroup Inc. (AL)
2,918,209
7.13
52
5
Regions Financial Corp. (AL)
2,330,943
5.70
81
6
CenterState Banks of Florida (FL)
968,098
2.37
35
7
Fifth Third Bancorp (OH)
829,165
2.03
26
8
Tampa Banking Company (FL)
722,829
1.77
10
9
Villages Bancorp Inc. (FL)
720,708
1.76
10
10
BB&T Corp. (NC)
695,375
1.70
21
Source: SNL Financial. Deposit data as of 6/30/07.
Market share data for Citrus, Hillsborough, Lake, Osceola, Pasco, Polk and Sumter Counties, Florida. Excludes Orange County in which CSFL has $33.0 million in deposits and 2 branches.
Osceola County—(Orlando MSA)
# 4 in market share (7.7%)
3rd fastest growing county in Florida 2007—2012 population growth of 37.6% 5 branches
Polk County—(Lakeland MSA)
# 5 in market share (5.8%)
2007—2012 population growth of 14.2% 12 branches
Sumter County—(The Villages MSA)
# 5 in market share (4.2%)
2nd fastest growing county in Florida 2007—2012 population growth of 40.9% 2 branches
Pasco County—(Tampa MSA)
# 9 in market share (2.2%)
10th fastest growing county in Florida 2007—2012 population growth of 22.2% 3 branches
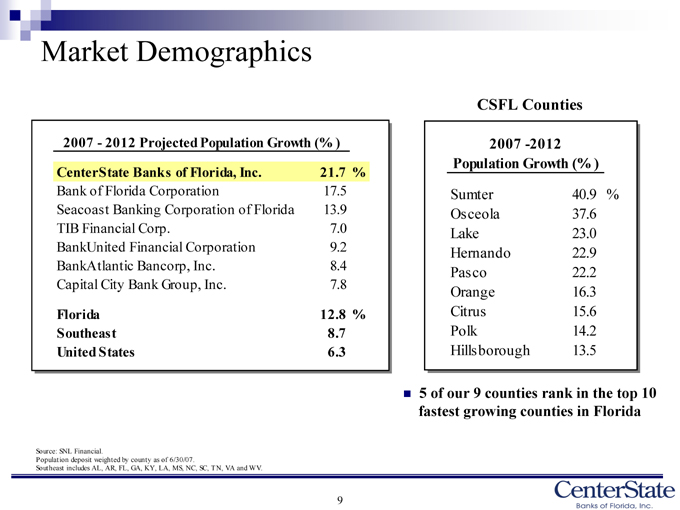
Market Demographics
2007—2012 Projected Population Growth (% )
CenterState Banks of Florida, Inc. 21.7 %
Bank of Florida Corporation 17.5
Seacoast Banking Corporation of Florida 13.9
TIB Financial Corp. 7.0
BankUnited Financial Corporation 9.2
BankAtlantic Bancorp, Inc. 8.4
Capital City Bank Group, Inc. 7.8
Florida 12.8 %
Southeast 8.7
United States 6.3
CSFL Counties
2007 -2012
Population Growth (% )
Sumter 40.9 %
Osceola 37.6
Lake 23.0
Hernando 22.9
Pasco 22.2
Orange 16.3
Citrus 15.6
Polk 14.2
Hillsborough 13.5
5 | | of our 9 counties rank in the top 10 fastest growing counties in Florida |
Source: SNL Financial.
Population deposit weighted by county as of 6/30/07.
Southeast includes AL, AR, FL, GA, KY, LA, MS, NC, SC, TN, VA and WV.
9
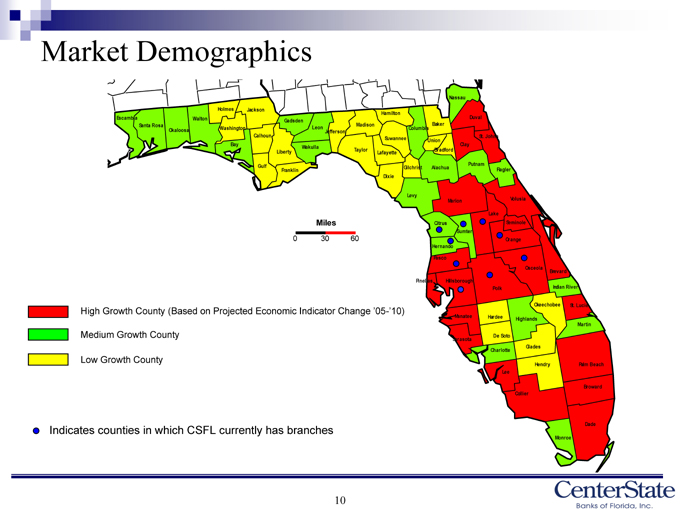
Market Demographics
High Growth County (Based on Projected Economic Indicator Change ‘05-’10)
Medium Growth County
Low Growth County
Indicates counties in which CSFL currently has branches
10
Operating Results
11
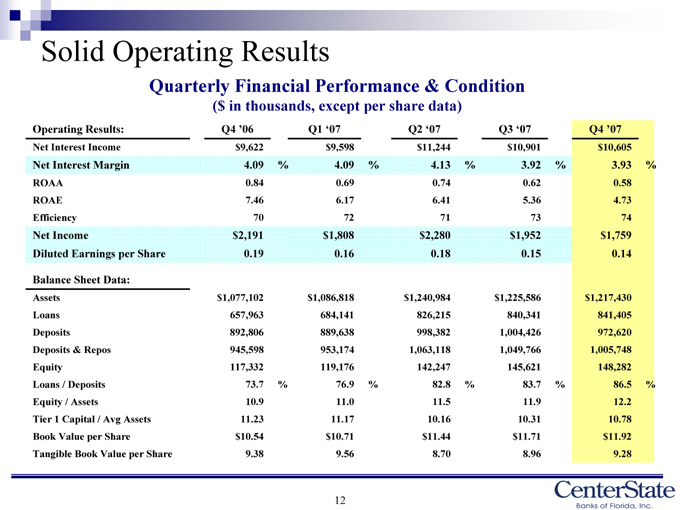
Solid Operating Results
Quarterly Financial Performance & Condition
($ in thousands, except per share data)
Operating Results: Q4 ‘06 Q1 ‘07 Q2 ‘07 Q3 ‘07 Q4 ‘07
Net Interest Income $ 9,622 $ 9,598 $ 11,244 $ 10,901 $ 10,605
Net Interest Margin 4.09 % 4.09 % 4.13 % 3.92 % 3.93 %
ROAA 0.84 0.69 0.74 0.62 0.58
ROAE 7.46 6.17 6.41 5.36 4.73
Efficiency 70 72 71 73 74
Net Income $1,808 $2,191 $ 2,280 $ 1,952 $ 1,759
Diluted Earnings per Share 0.19 0.16 0.18 0.15 0.14
Balance Sheet Data:
Assets $ 1,077,102 $ 1,086,818 $ 1,240,984 $ 1,225,586 $ 1,217,430
Loans 657,963 684,141 826,215 840,341 841,405
Deposits 892,806 889,638 998,382 1,004,426 972,620
Deposits & Repos 945,598 953,174 1,063,118 1,049,766 1,005,748
Equity 117,332 119,176 142,247 145,621 148,282
Loans / Deposits 73.7 % 76.9 % 82.8 % 83.7 % 86.5 %
Equity / Assets 10.9 11.0 11.5 11.9 12.2
Tier 1 Capital / Avg Assets 11.23 11.17 10.16 10.31 10.78
Book Value per Share $ 10.54 $ 10.71 $ 11.44 $ 11.71 $ 11.92
Tangible Book Value per Share 9.38 9.56 8.70 8.96 9.28
12
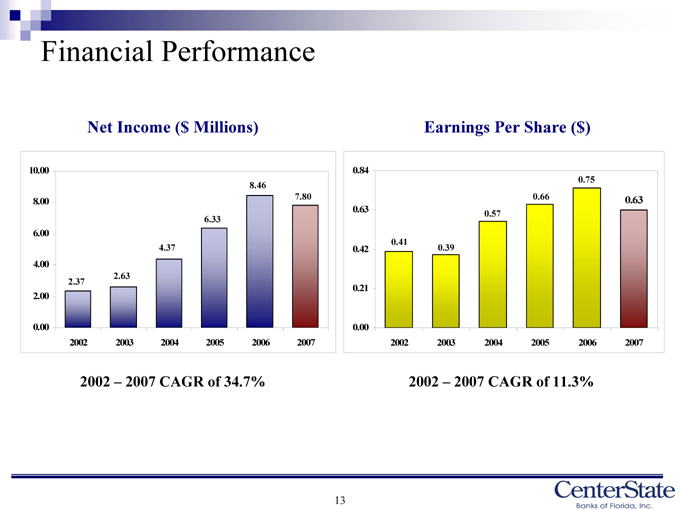
Financial Performance
Net Income ($ Millions)
10.00 8.00 6.00 4.00 2.00 0.00
2.37
2002
2.63
2003
4.37
2004
6.33
2005
8.46
2006
7.80
2007
Earnings Per Share ($)
0.84
0.63
0.42 0.21 0.00
0.41
2002
0.39
2003
0.57
2004
0.66
2005
0.75
2006
0.63
2007
2002 – 2007 CAGR of 34.7%
2002 – 2007 CAGR of 11.3%
13
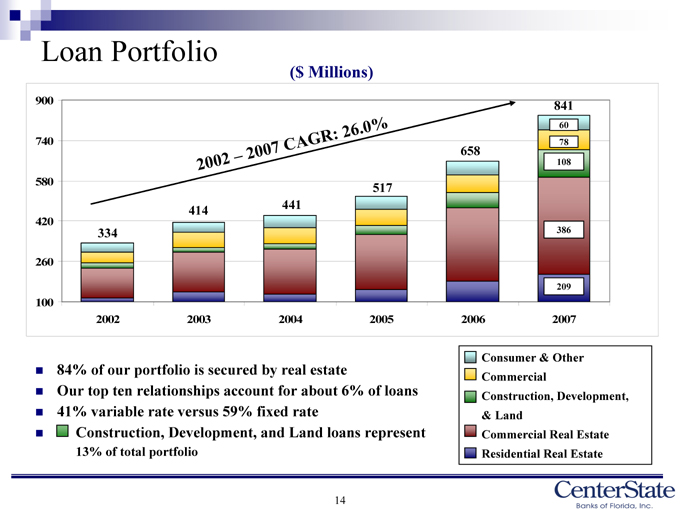
Loan Portfolio
($ Millions)
900 740 580 420 260 100
C A
G
R
:
.
0 %
334
2002
414
2003
441
2004
517
2005
658
2006
841
60 78
108 386 209
2007
84% of our portfolio is secured by real estate
Our top ten relationships account for about 6% of loans
41% variable rate versus 59% fixed rate
Construction, Development, and Land loans represent
13% of total portfolio
Consumer & Other
Commercial
Construction, Development, & Land
Commercial Real Estate
Residential Real Estate
14
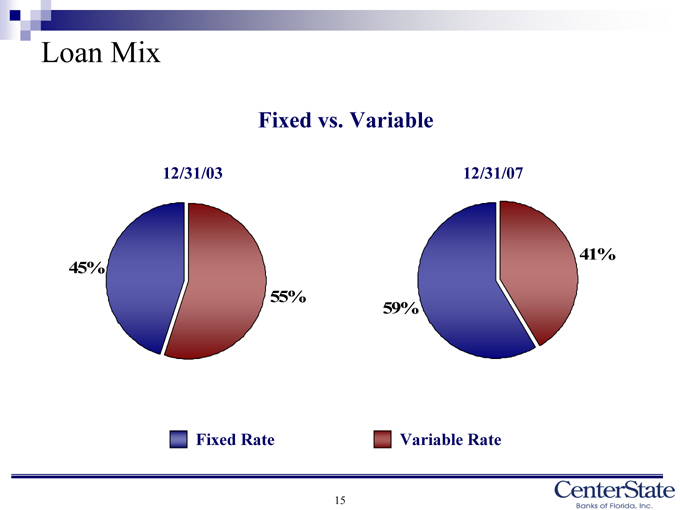
Loan Mix
Fixed vs. Variable
12/31/03
45%
55%
12/31/07
59%
41%
Fixed Rate
Variable Rate
15
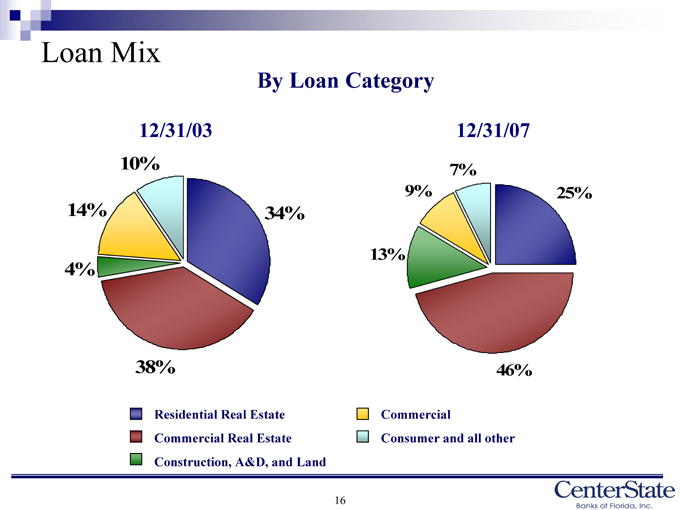
Loan Mix
By Loan Category
12/31/03
10%
14%
4%
34%
38%
12/31/07
7%
9%
13%
25%
46%
Residential Real Estate
Commercial Real Estate
Construction, A&D, and Land
Commercial
Consumer and all other
16
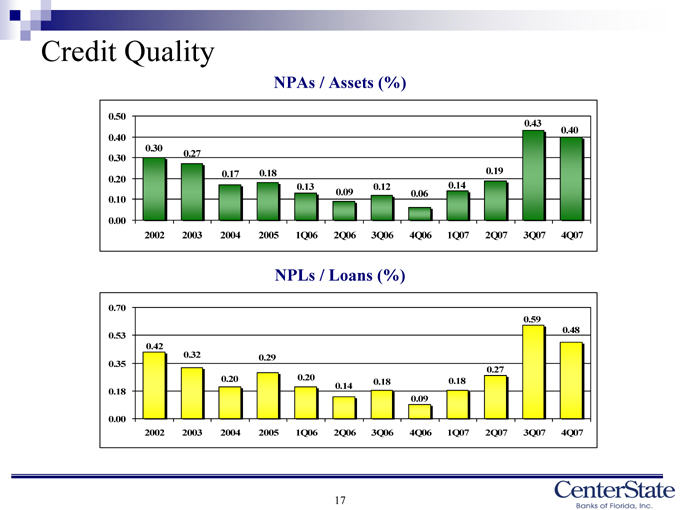
Credit Quality
NPAs / Assets (%)
0.50 0.40 0.30 0.20 0.10 0.00
0.30 0.27
0.17 0.18
0.13 0.09
0.12 0.06
0.19 0.14
0.43 0.40
2002 2003 2004 2005 1Q06 2Q06 3Q06 4Q06 1Q07 2Q07 3Q07 4Q07
NPLs / Loans (%)
0.70 0.53 0.35 0.18 0.00
0.59 0.48 0.42 0.32 0.29 0.27 0.20 0.20 0.18 0.18 0.09
2002 2003 2004 2005 1Q06 2Q06 3Q06 4Q06 1Q07 2Q07 3Q07 4Q07
17
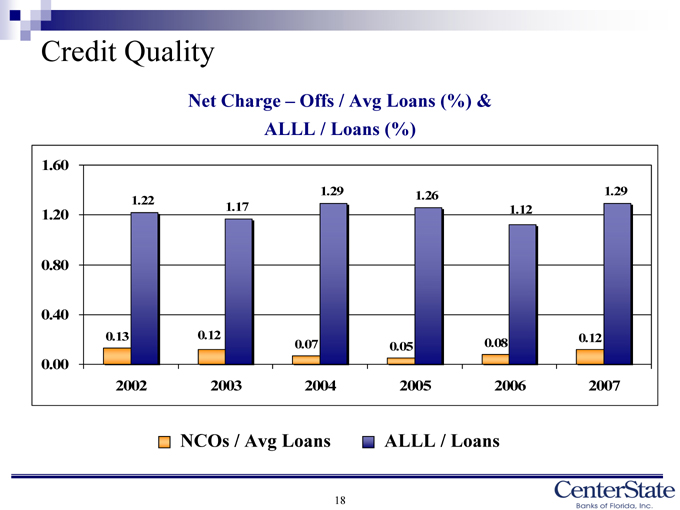
Credit Quality
Net Charge – Offs / Avg Loans (%) & ALLL / Loans (%)
1.60 1.20 0.80 0.40 0.00
0.13
1.22
0.12
1.17
0.07
1.29
0.05
1.26
0.08
1.12
0.12
1.29
2002 2003 2004 2005 2006 2007
NCOs / Avg Loans
ALLL / Loans
18
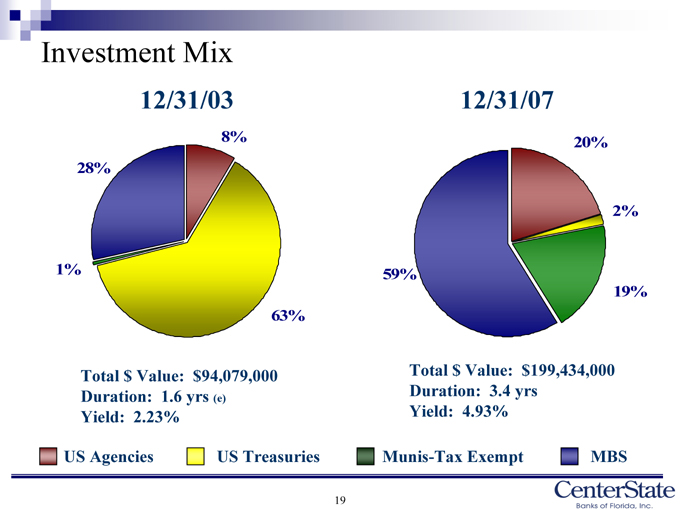
Investment Mix
12/31/03
8%
28%
1%
63%
Total $ Value: $94,079,000 Duration: 1.6 yrs (e) Yield: 2.23%
US Agencies
US Treasuries
12/31/07
20%
2%
19%
59%
Total $ Value: $199,434,000 Duration: 3.4 yrs Yield: 4.93%
Munis-Tax Exempt
MBS
19
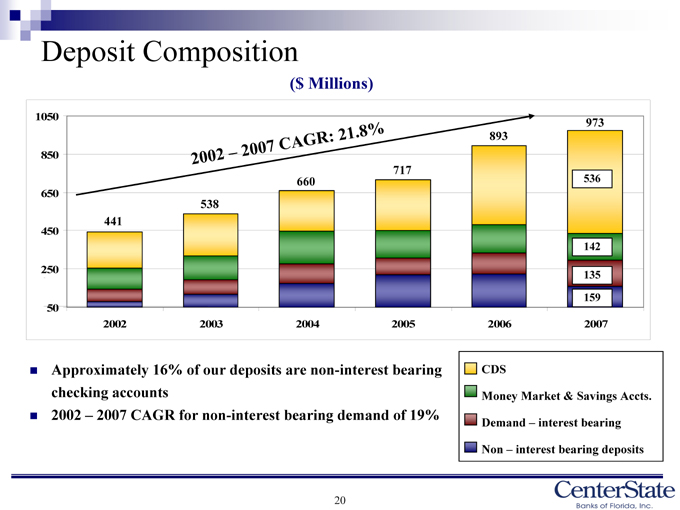
Deposit Composition
($ Millions)
1050 850 650 450 250 50
C A
G
R
:
.
441
2002
538
2003
660
2004
717
2005
893
2006
973
536
142
135 159
2007
Approximately 16% of our deposits are non-interest bearing checking accounts
2002 – 2007 CAGR for non-interest bearing demand of 19%
CDS
Money Market & Savings Accts.
Demand – interest bearing
Non – interest bearing deposits
20
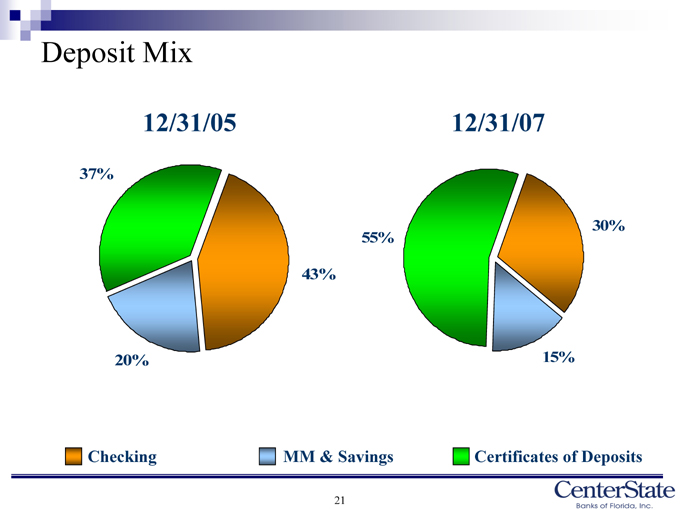
Deposit Mix
12/31/05
37%
20%
43%
12/31/07
55%
30%
15%
Checking
MM & Savings
Certificates of Deposits
21
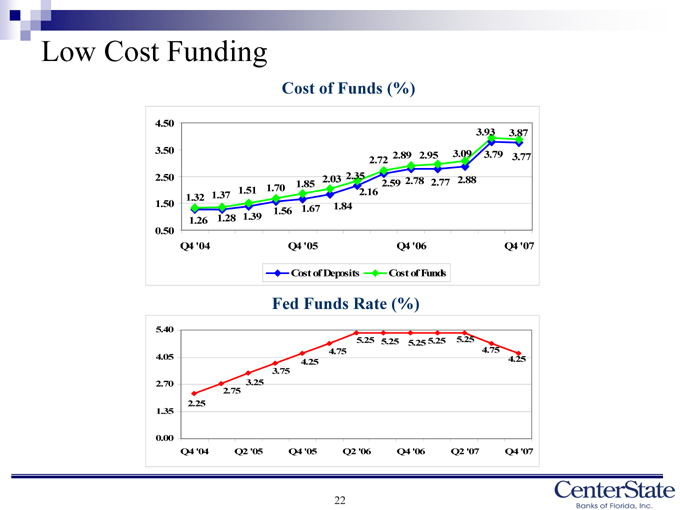
Low Cost Funding
Cost of Funds (%)
4.50 3.50 2.50 1.50 0.50
1.32
1.37
1.51
1.70
1.85
2.03
2.35
2.72
2.89
2.95
3.09
3.93
3.87
1.26
1.28
1.39
1.56
1.67
1.84
2.16
2.59
2.78
2.77
2.88
3.79
3.77
Q4 ‘04
Q4 ‘05
Q4 ‘06
Q4 ‘07
Cost of Deposits
Cost of Funds
Fed Funds Rate (%)
5.40 4.05 2.70 1.35 0.00
2.25
2.75
3.25
3.75
4.25
4.75
5.25
5.25
5.25
5.25
5.25
4.75
4.25
Q4 ‘04
Q2 ‘05
Q4 ‘05
Q2 ‘06
Q4 ‘06
Q2 ‘07
Q4 ‘07
22
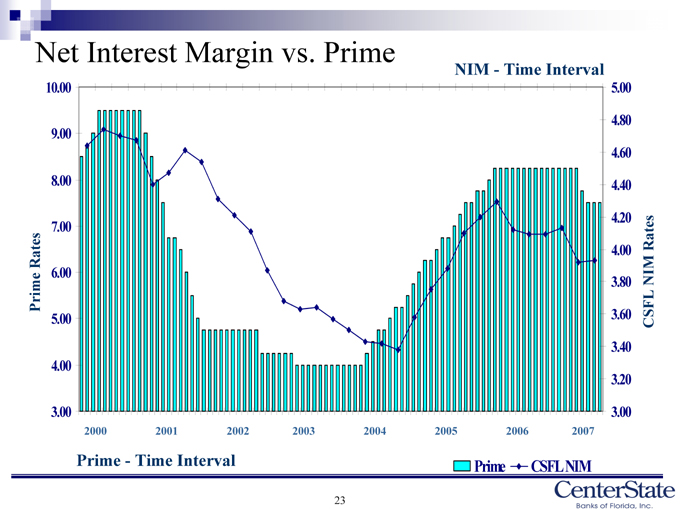
Net Interest Margin vs. Prime
NIM—Time Interval
10.00 9.00 8.00 7.00 6.00 5.00 4.00 3.00
2000 2001 2002 2003 2004 2005 2006 2007
5.00 4.80 4.60 4.40 4.20 4.00 3.80 3.60 3.40 3.20 3.00
CSFL NIM Rates
Prime—Time Interval
Prime CSFL NIM
23
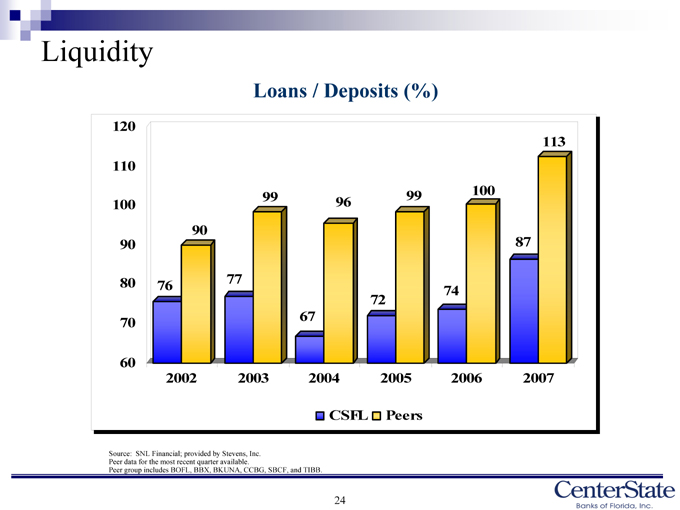
Liquidity
Loans / Deposits (%)
120 110 100 90 80 70 60
76
90
77
99
67
96
72
99
74
100
87
113
2002 2003 2004 2005 2006 2007
CSFL
Peers
Source: SNL Financial; provided by Stevens, Inc. Peer data for the most recent quarter available.
Peer group includes BOFL, BBX, BKUNA, CCBG, SBCF, and TIBB.
24
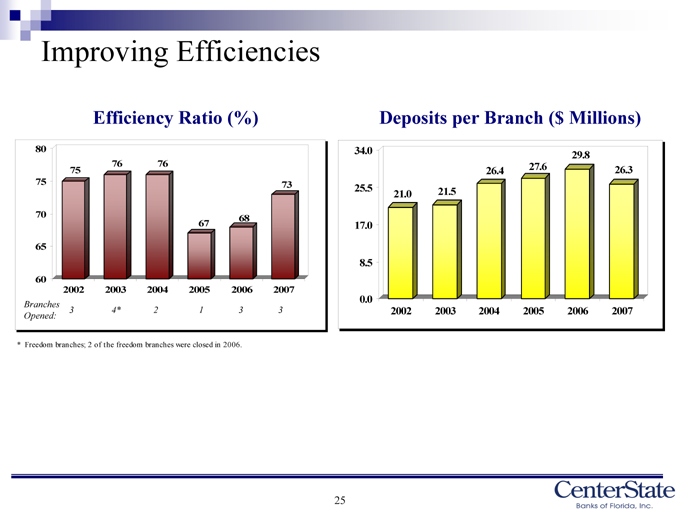
Improving Efficiencies
Efficiency Ratio (%)
80 75 70 65 60
75
2002
76
2003
76
2004
67
2005
68
2006
73
2007
Branches
Deposits per Branch ($ Millions)
34.0 25.5 17.0 8.5 0.0
21.0
2002
21.5
2003
26.4
2004
27.6
2005
29.8
2006
26.3
2007
* | | Freedom branches; 2 of the freedom branches were closed in 2006. |
25
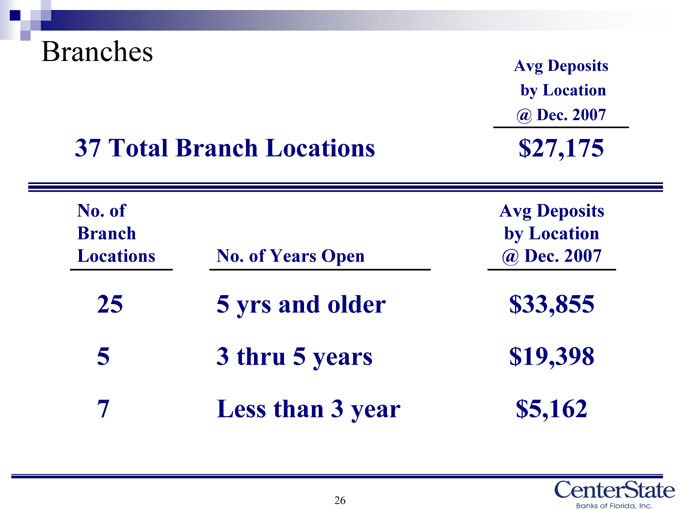
Branches
Avg Deposits by Location @ Dec. 2007
37 Total Branch Locations $27,175
No. of Avg Deposits
Branch by Location
Locations No. of Years Open @ Dec. 2007
25 5 yrs and older $ 33,855
5 | | 3 thru 5 years $ 19,398 |
7 | | Less than 3 year $ 5,162 |
26
Investment Highlights
27
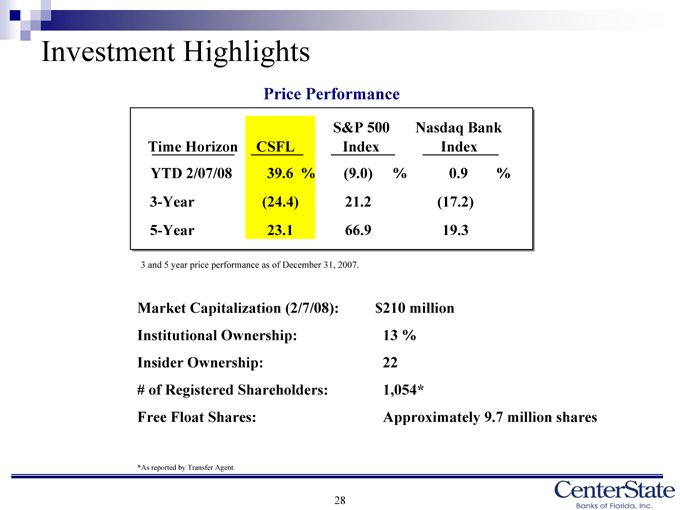
Investment Highlights
Price Performance
S&P 500 Nasdaq Bank
Time Horizon CSFL Index Index
YTD 2/07/08 39.6 % (9.0) % 0.9 %
3-Year (24.4) 21.2 (17.2)
5-Year 23.1 66.9 19.3
3 | | and 5 year price performance as of December 31, 2007. |
Market Capitalization (2/7/08): $210 million
Institutional Ownership: 13 %
Insider Ownership: 22
# of Registered Shareholders: 1,054*
Free Float Shares: Approximately 9.7 million shares
*As reported by Transfer Agent.
28
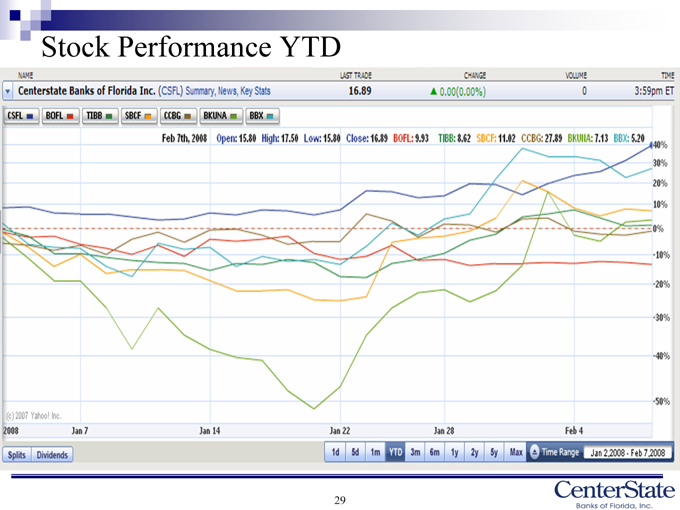
Stock Performance YTD
29
Building Shareholder Value
Dedicated Employees
Sustainable Earnings Growth
Credit Quality
Growth Markets
Vision
Focus
Nothing special – just a candid straight-forward culture, realistic about our business
30
CenterState Banks of Florida, Inc.
NASDAQ: CSFL
February 2007