 CenterState Banks of Florida, Inc. NASDAQ: CSFL May 2008 |
 2 This presentation contains forward-looking statements, as defined by Federal Securities Laws, relating to present or future trends or factors affecting the operations, markets and products of CenterState Banks of Florida, Inc. (CSFL). These statements are provided to assist in the understanding of future financial performance. Any such statements are based on current expectations and involve a number of risks and uncertainties. For a discussion of factors that may cause such forward- looking statements to differ materially from actual results, please refer to CSFL’s most recent Form 10-Q filed with the Securities Exchange Commission. CSFL undertakes no obligation to release revisions to these forward- looking statements or reflect events or circumstances after the date of this presentation. Forward Looking Statement |
 3 Franchise Overview |
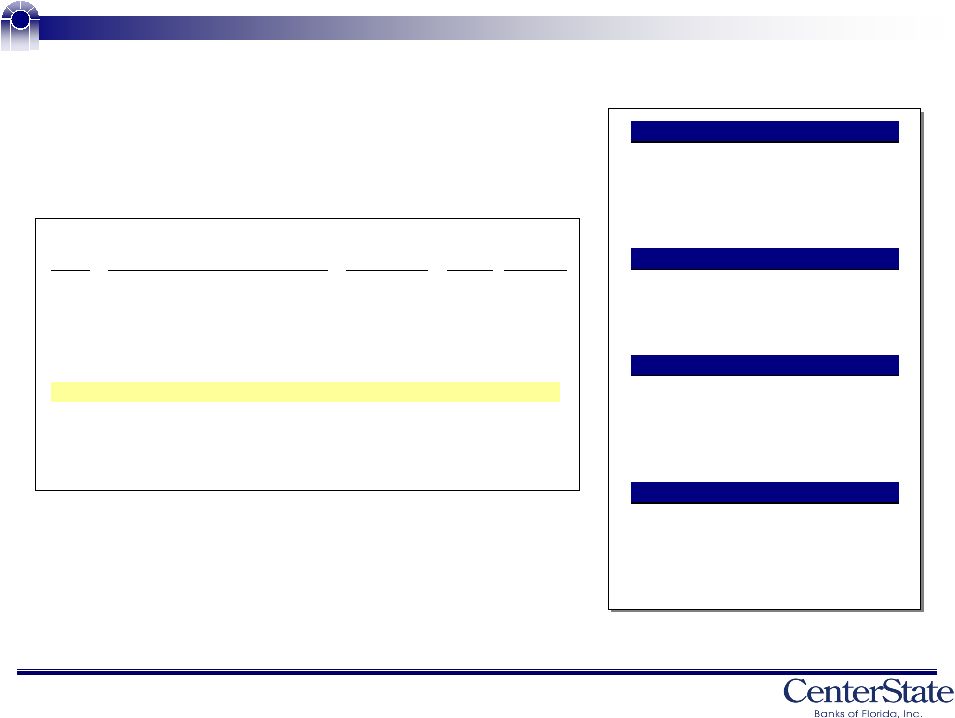
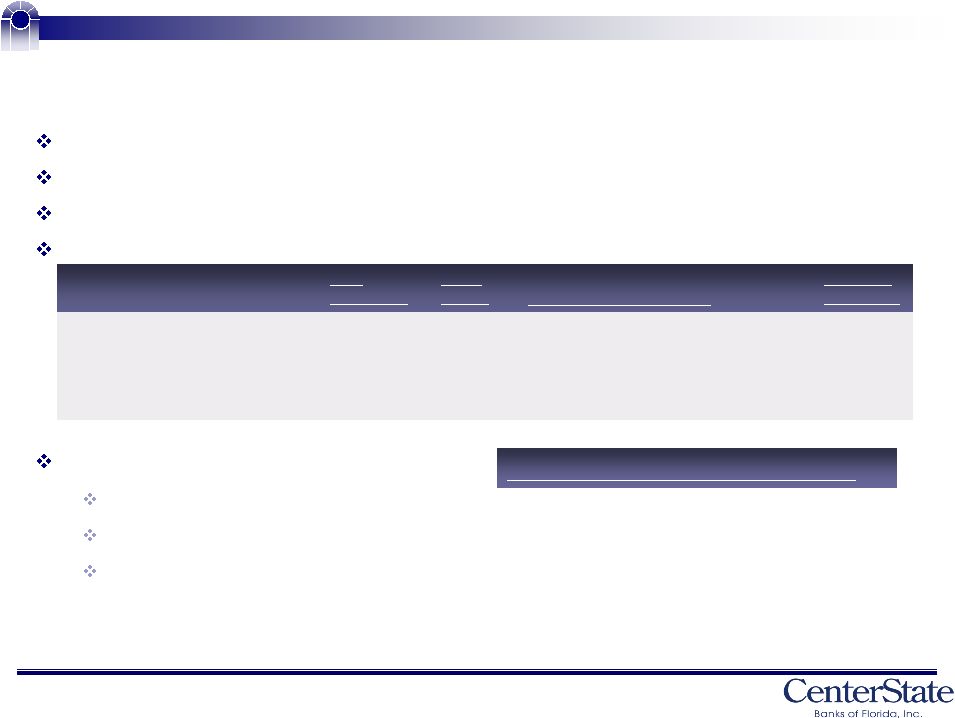 4 Corporate Profile Headquartered in Davenport, Florida (Greater Orlando/Tampa Area) Nasdaq Symbol: CSFL Company formed: June 2000 4 Subsidiary Banks; 37 branch banking offices – 9 Counties throughout Central Florida Acquisitions: CenterState Bank of FL (Dec 2002) CenterState Bank Mid FL (Mar 2006) Valrico State Bank (Apr 2007) 150 1,005 834 $ 1,248 Equity: Deposits: Loans: Assets: March 31, 2008 Highlights ($ millions) 1989 2000 & 1992 1989 1989 Date Established 196 Hillsborough 5 Valrico State Bank 408 Polk 12 CenterState Bank of FL 390 Pasco, Sumter, Hernando, Citrus, Lake 13 CenterState Bank, N.A. $253 Osceola, Orange 7 CenterState Bank Central FL Asset Size ($ millions) Counties of Operation No. of Offices Subsidiary Banks |
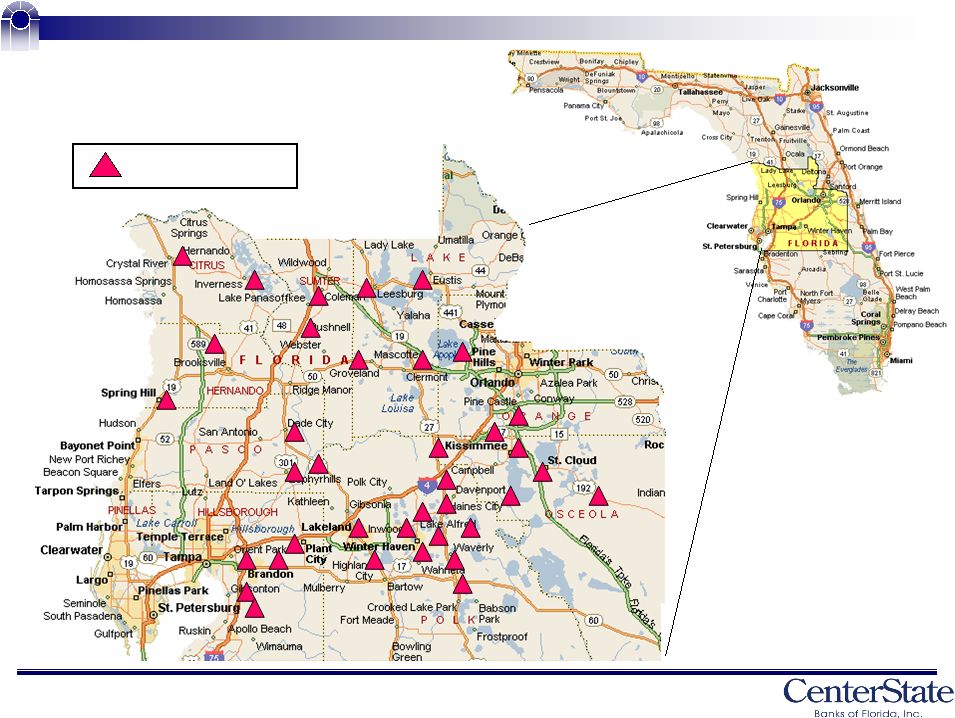 5 Branch Footprint CSFL Branch |
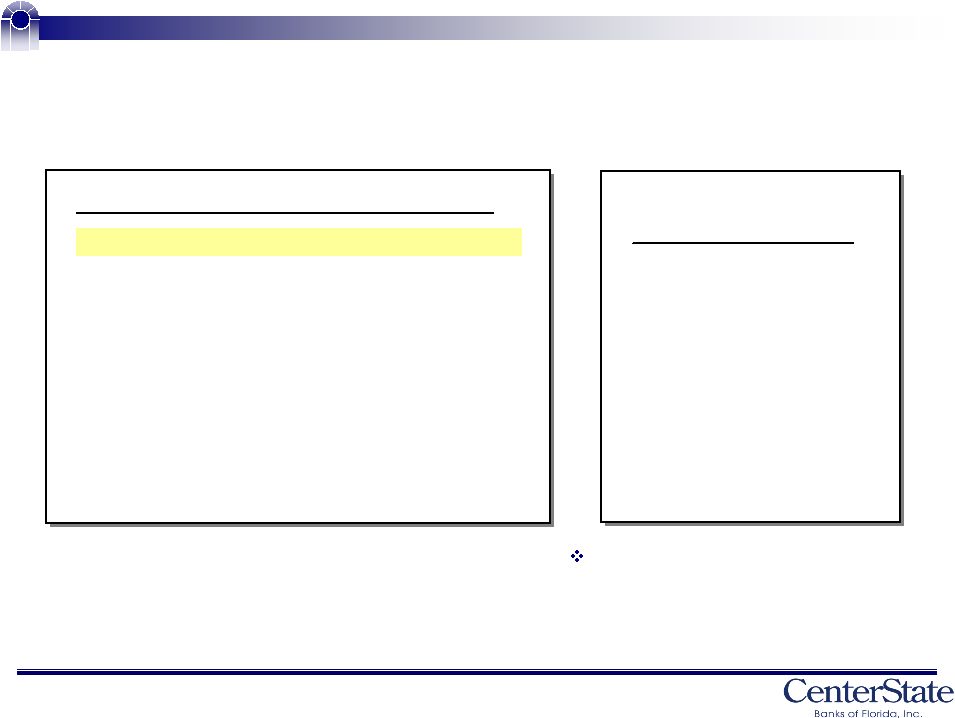
 6 Business Strategy Maintain local decision making Emphasize relationship banking Develop a network of profitable banks in high-growth markets in Central Florida Disciplined approach to loan and deposit growth Leverage our investment in our branch network |
 7 Strong Market Share Counties of Operation Osceola County - (Orlando MSA) # 4 in market share (7.7%) 3rd fastest growing county in Florida 2007 - 2012 population growth of 37.6% 5 branches Polk County - (Lakeland MSA) # 5 in market share (5.8%) 2007 - 2012 population growth of 14.2% 12 branches Sumter County - (The Villages MSA) # 5 in market share (4.2%) 2nd fastest growing county in Florida 2007 - 2012 population growth of 40.9% 2 branches Pasco County - (Tampa MSA) # 9 in market share (2.2%) 10th fastest growing county in Florida 2007 - 2012 population growth of 22.2% 3 branches Source: SNL Financial. Deposit data as of 6/30/07. Market share data for Citrus, Hernando, Hillsborough, Lake, Osceola, Pasco, Polk and Sumter Counties, Florida. Excludes Orange County in which CSFL has $33.0 million in deposits and 2 branches. Deposits Market Rank Institution ($000) Share Branches 1 Bank of America Corp. (NC) $8,887,673 21.72 % 104 2 Wachovia Corp. (NC) 8,095,224 19.78 113 3 SunTrust Banks Inc. (GA) 7,568,875 18.49 133 4 Colonial BancGroup Inc. (AL) 2,918,209 7.13 52 5 Regions Financial Corp. (AL) 2,330,943 5.70 81 6 CenterState Banks of Florida (FL) 968,098 2.37 35 7 Fifth Third Bancorp (OH) 829,165 2.03 26 8 Tampa Banking Company (FL) 722,829 1.77 10 9 Villages Bancorp Inc. (FL) 720,708 1.76 10 10 BB&T Corp. (NC) 695,375 1.70 21 |
 8 Market Demographics CSFL Counties 2007 - 2012 Projected Population Growth (%) CenterState Banks of Florida, Inc. 21.7 % Bank of Florida Corporation 17.5 Seacoast Banking Corporation of Florida 13.9 TIB Financial Corp. 7.0 BankUnited Financial Corporation 9.2 BankAtlantic Bancorp, Inc. 8.4 Capital City Bank Group, Inc. 7.8 Florida 12.8 % Southeast 8.7 United States 6.3 2007 -2012 Population Growth (%) Sumter 40.9 % Osceola 37.6 Lake 23.0 Hernando 22.9 Pasco 22.2 Orange 16.3 Citrus 15.6 Polk 14.2 Hillsborough 13.5 5 of our 9 counties rank in the top 10 fastest growing counties in Florida Source: SNL Financial. Population deposit weighted by county as of 6/30/07. Southeast includes AL, AR, FL, GA, KY, LA, MS, NC, SC, TN, VA and WV. |
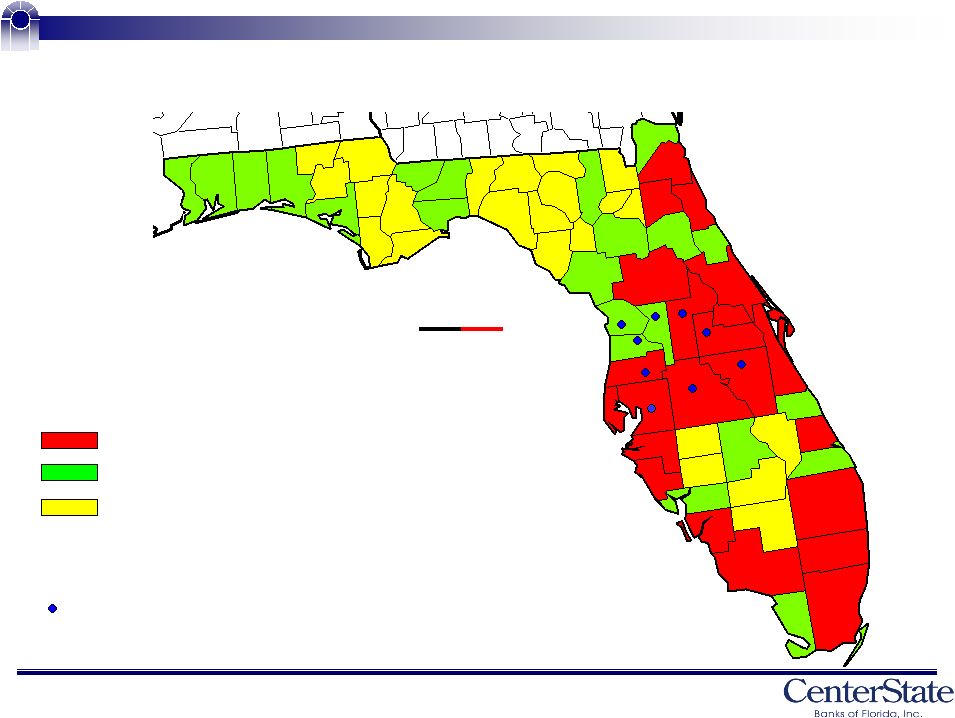 9 Market Demographics Escambia Santa Rosa Okaloosa Walton Holmes Washington Bay Calhoun Gulf Liberty Jackson Gadsden Franklin Wakulla Leon Jefferson Taylor Madison Dixie Lafayette Suwannee Hamilton Columbia Gilchrist Levy Citrus Marion Alachua Union Baker Bradford Clay Duval Nassau St. Johns Putnam Flagler Volusia Lake Seminole Orange Sumter Hernando Pasco Pinellas Hillsborough Manatee Sarasota Charlotte Lee Collier Monroe Dade Broward Palm Beach Hendry Glades Martin St. Lucie Okeechobee Highlands De Soto Hardee Polk Osceola Indian River Brevard Miles 0 30 60 Indicates counties in which CSFL currently has branches High Growth County (Based on Projected Economic Indicator Change ’05-’10) Medium Growth County Low Growth County |
 10 Operating Results |
 11 Operating Results: Net Interest Income and Net Interest Margin $9,000 $10,000 $11,000 $12,000 Q1 '07 Q2 '07 Q3 '07 Q4 '07 1Q '08 3.55% 3.75% 3.95% 4.16% 3.61% 3.93% 3.92% 4.13% 4.09% Net Interest Margin $9,814 $10,605 $10,901 $11,244 $9,598 Net Interest Income |
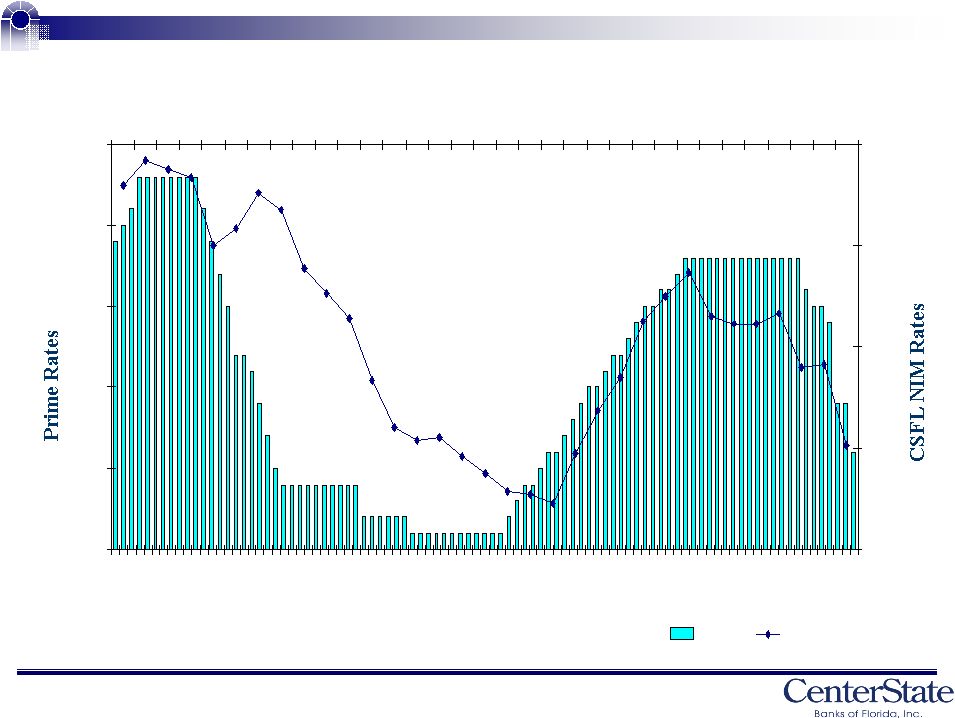 12 2000 2001 2002 2003 2004 2005 2006 2007 1Q08 NIM - Time Interval Prime - Time Interval Net Interest Margin vs. Prime 3.75 5.00 6.25 7.50 8.75 10.00 3.20 3.60 4.00 4.40 4.80 Prime CSFL NIM |
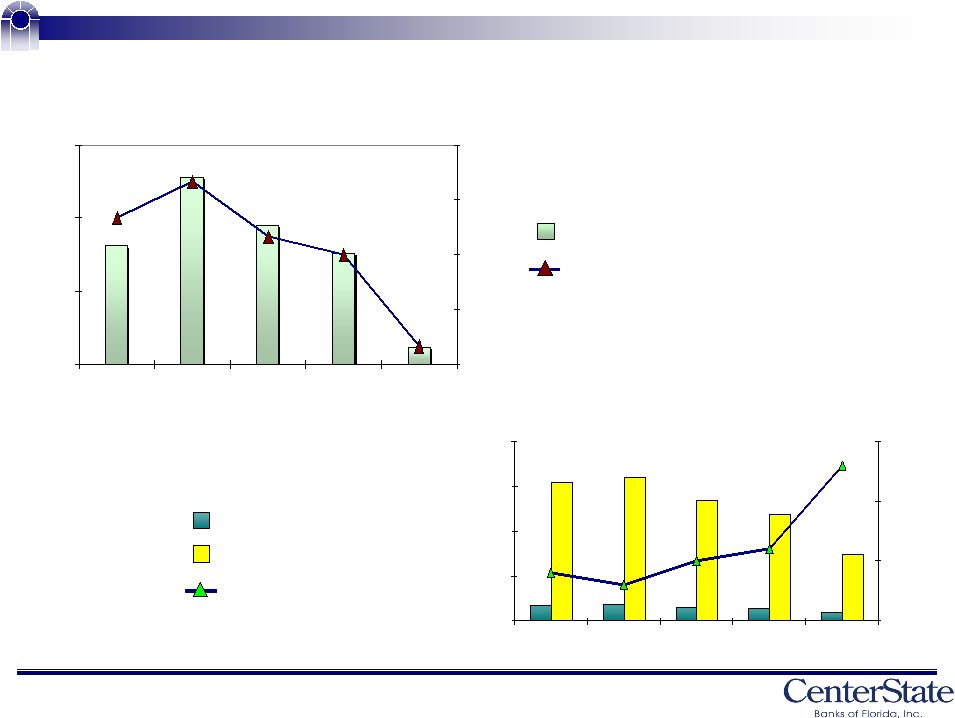 13 Operating Results Return on Average Assets (%) Return on Average Equity (%) Efficiency Ratio (%) 6.17% 6.41% 5.36% 4.73% 2.97% 81% 74% 73% 71% 72% 0.00% 2.00% 4.00% 6.00% 8.00% Q1 '07 Q2 '07 Q3 '07 Q4 '07 1Q '08 68% 73% 78% 83% Net Income ($) Diluted Earnings per Share $1,808 $0.16 Net Income EPS (diluted) $2,280 $0.18 $1,952 $0.15 $1,759 $0.14 $1,111 $0.09 $1,000 $1,500 $2,000 $2,500 Q1 '07 Q2 '07 Q3 '07 Q4 '07 1Q '08 $0.08 $0.11 $0.14 $0.17 $0.20 |
 14 Balance Sheet Data 600,000 700,000 800,000 900,000 1,000,000 1,100,000 Q1 '07 Q2 '07 Q3 '07 Q4 '07 1Q '08 - Loans, Deposits, & Repos 1,040,102 1,005,748 1,049,766 1,063,118 953,174 Deposits & Repos Q1 ‘08 Q4 ‘07 Q3 ‘07 Q2 ‘07 Q1 ‘07 1,005,097 972,620 1,004,426 998,382 889,638 Deposits 83.0% 86.5% 83.7% 82.8% 76.9% Loans / Deposits $833,743 $841,405 $840,341 $826,215 $684,141 Loans |
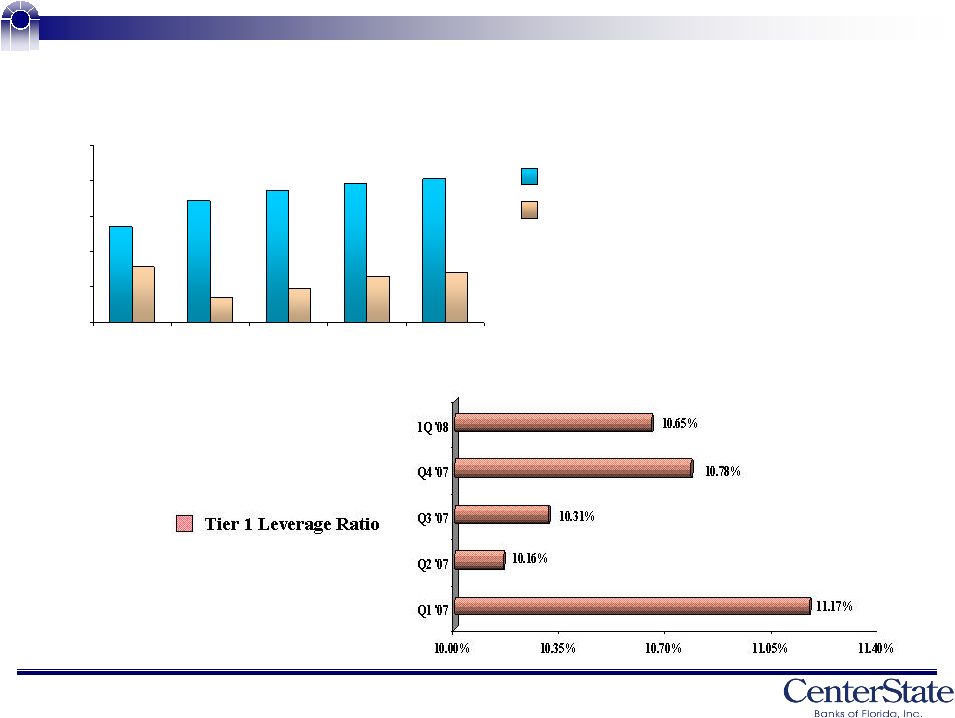 15 Capital $10.71 $11.44 $11.71 $11.92 $12.05 9.56 8.70 8.96 9.28 9.43 $8.00 $9.00 $10.00 $11.00 $12.00 $13.00 Q1 '07 Q2 '07 Q3 '07 Q4 '07 1Q '08 Book Value ($) Tangible Book Value ($) |
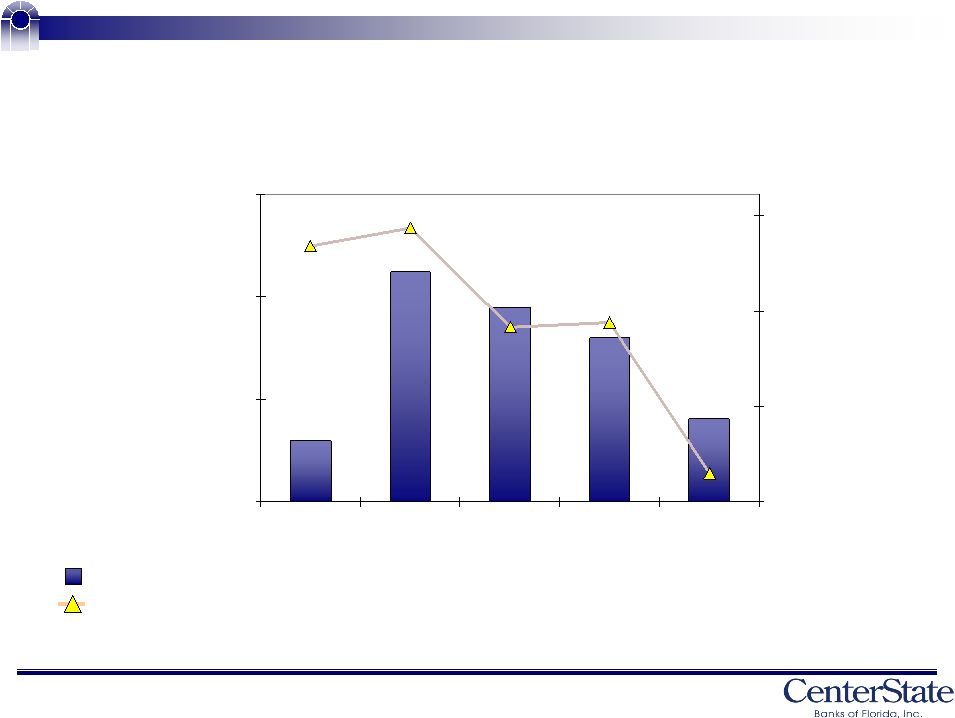
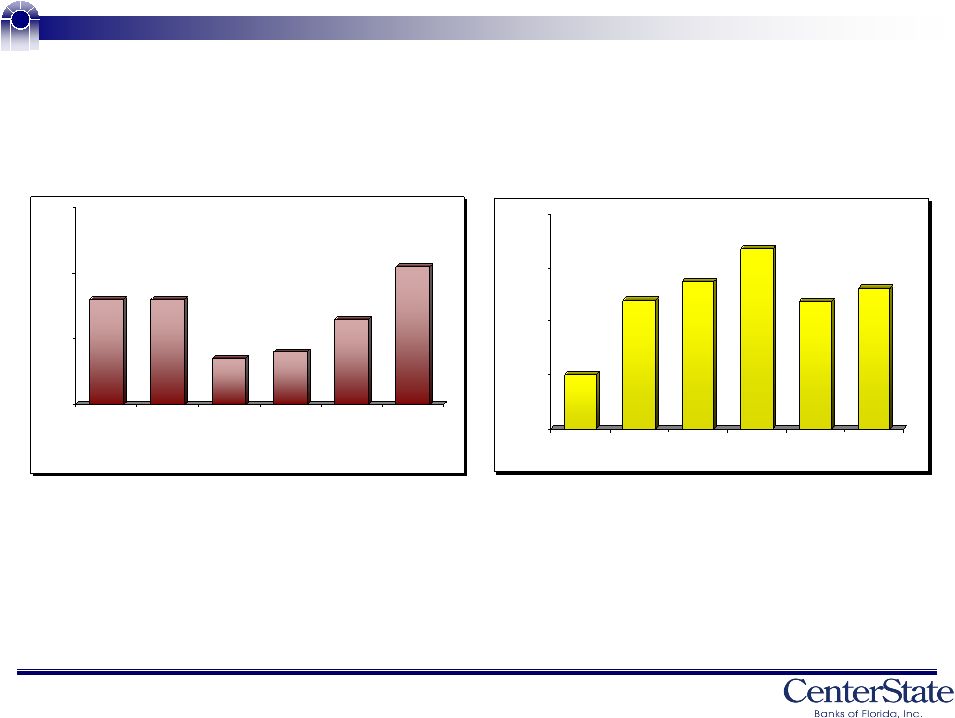
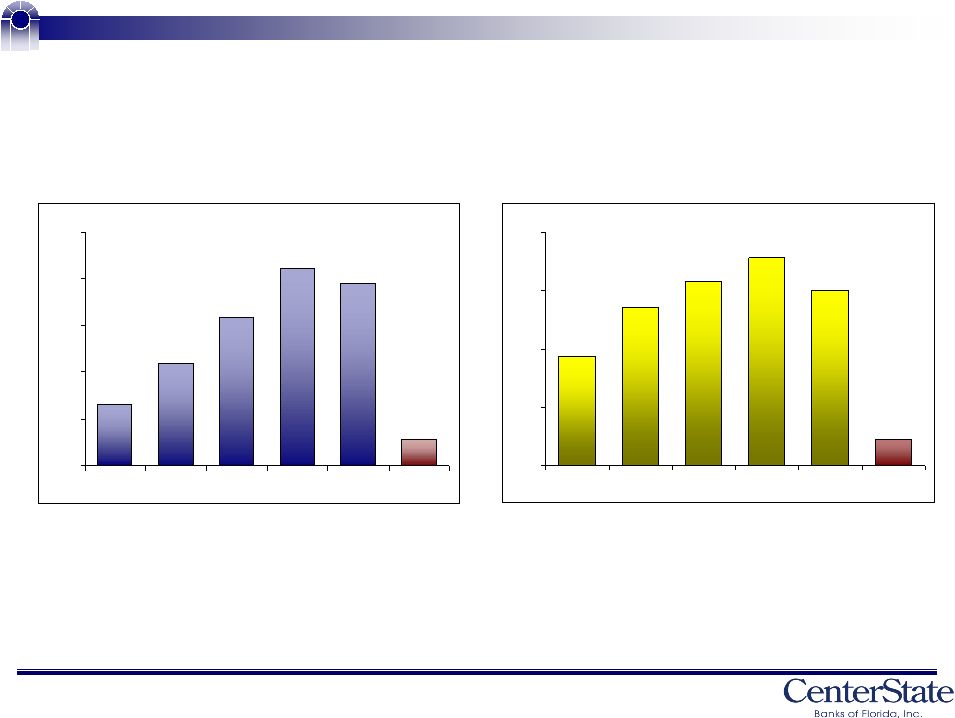 16 Financial Performance 0.00 0.21 0.42 0.63 0.84 2003 2004 2005 2006 2007 1Q 08 Earnings Per Share ($) 2003 – 2007 CAGR of 12.7% 0.39 0.57 0.66 0.75 0.63 0.09 Net Income ($ Millions) 2003 – 2007 CAGR of 31.3% 2.63 4.37 6.33 8.46 7.80 1.11 0.00 2.00 4.00 6.00 8.00 10.00 2003 2004 2005 2006 2007 1Q 08 |
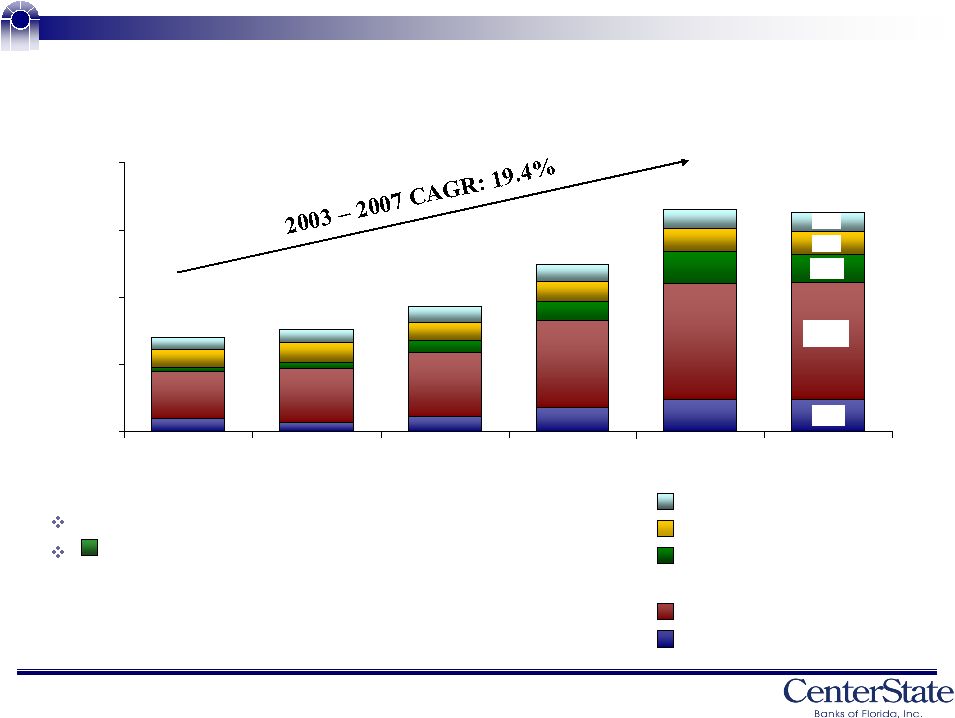 17 Loan Port folio 83% of our portfolio is secured by real estate Construction, Development, and Land loans represent 11% of total portfolio ($ Millions) 100 325 550 775 1,000 2003 2004 2005 2006 2007 1Q 08 834 414 441 517 658 841 389 96 77 210 62 Consumer & Other Commercial Construction, Development, & Land Commercial Real Estate Residential Real Estate |
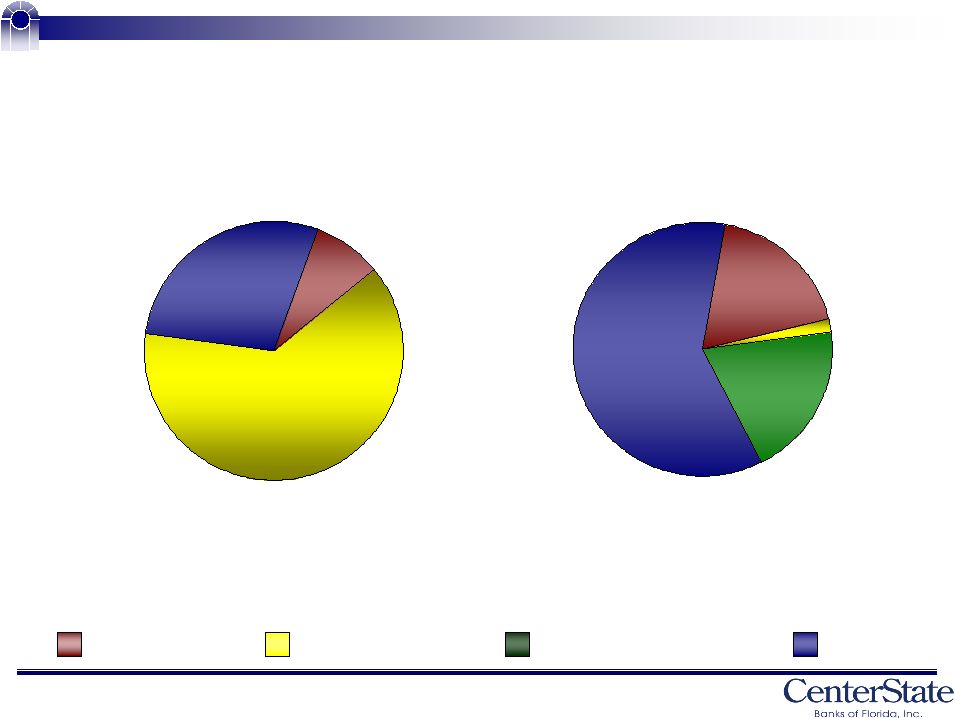
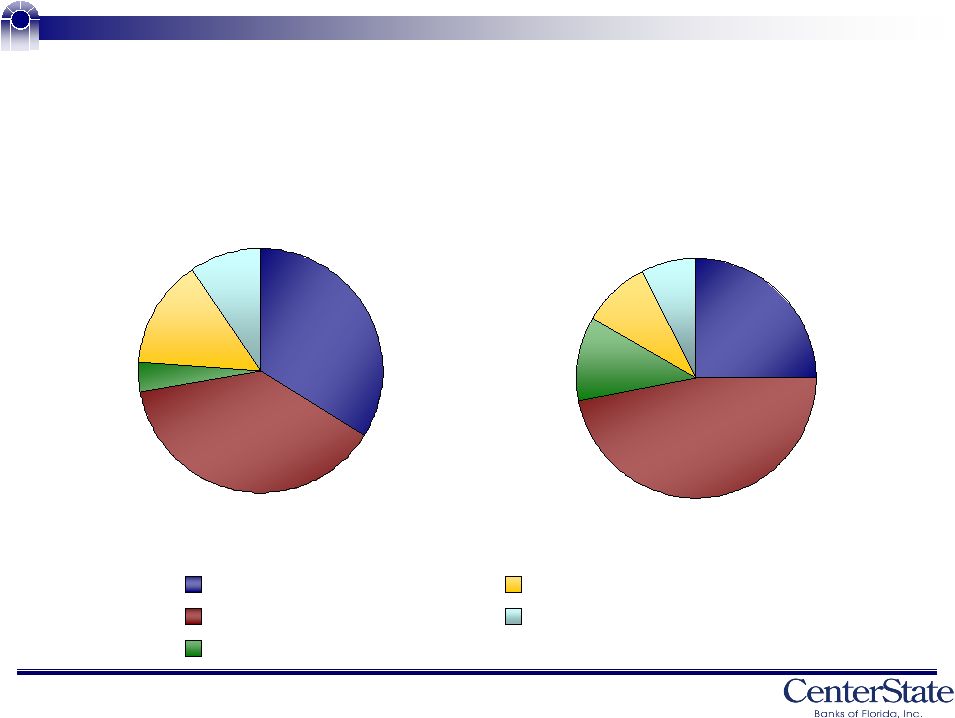 18 11% 9% 7% 25% 47% Loan Mix 4% 14% 10% 34% 38% By Loan Category 12/31/03 3/31/08 Commercial Consumer and all other Residential Real Estate Commercial Real Estate Construction, A&D, and Land |
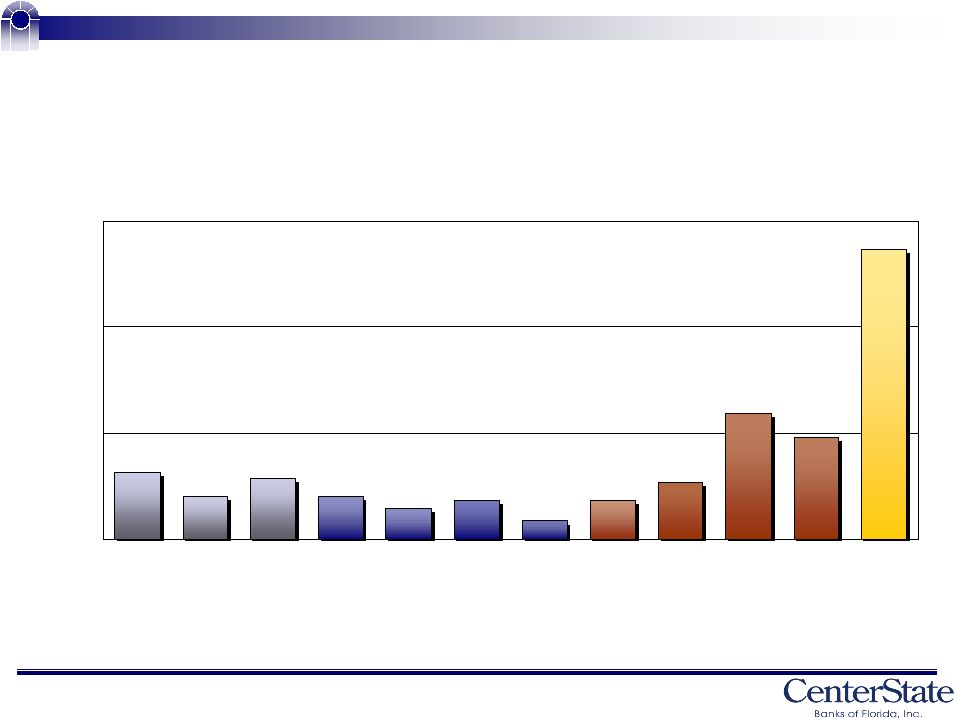 19 Credit Quality NPLs / Loans (%) 1.37 0.48 0.59 0.27 0.18 0.09 0.18 0.14 0.20 0.29 0.20 0.32 0.00 0.50 1.00 1.50 2003 2004 2005 1Q06 2Q06 3Q06 4Q06 1Q07 2Q07 3Q07 4Q07 1Q08 |
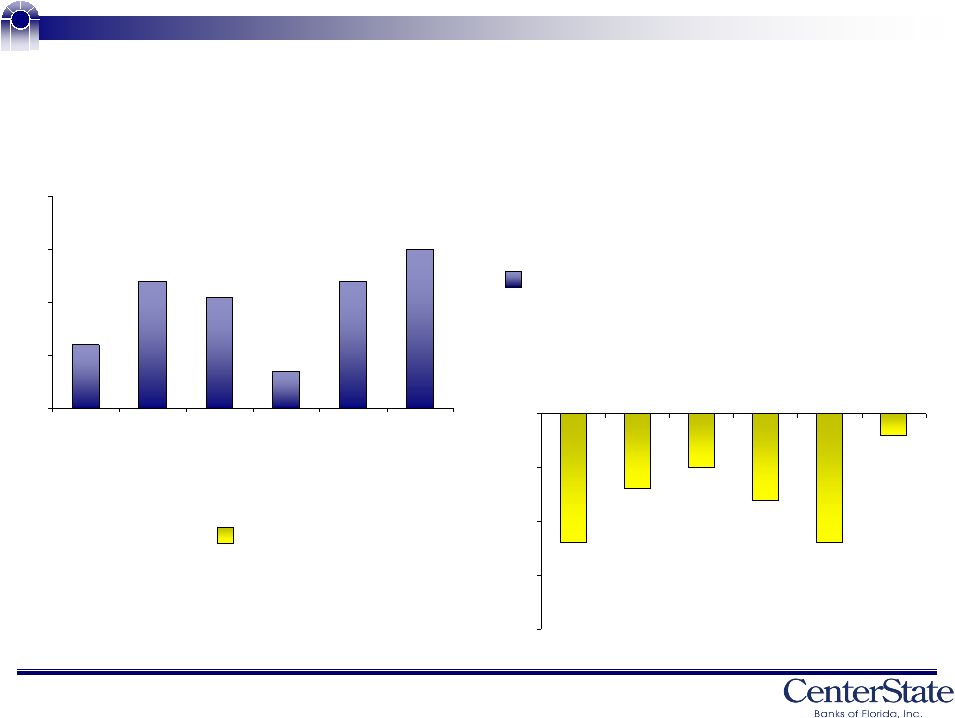 20 Credit Quality ALLL / Loans (%) & Net Charge – Offs / Avg Loans (%) (0.12) (0.07) (0.05) (0.08) (0.12) (0.02) (0.20) (0.15) (0.10) (0.05) 0.00 2003 2004 2005 2006 2007 1Q08 NCOs / Avg Loans ALLL / Loans 1.17 1.29 1.26 1.12 1.29 1.35 1.05 1.15 1.25 1.35 1.45 2003 2004 2005 2006 2007 1Q08 |
 21 28% 63% 9% 12/31/03 60% 20% 18% 2% 3/31/08 US Agencies US Treasuries Munis-Tax Exempt MBS Total $ Value: $94,079,000 Duration: 1.6 yrs (e) Yield: 2.23% Total $ Value: $192,773,000 Duration: 3.9 yrs Yield: 5.07% Investment Mix |
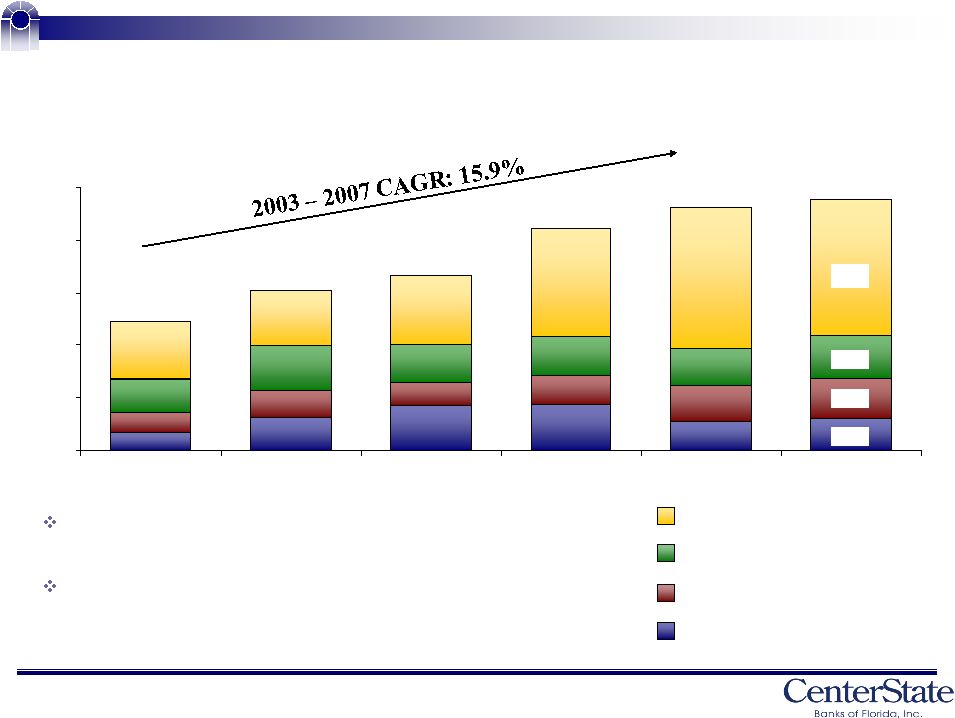 22 50 250 450 650 850 1,050 2003 2004 2005 2006 2007 1Q08 519 165 148 173 538 660 717 893 973 1,005 Deposit Composition Approximately 17% of our deposits are non-interest bearing checking accounts 2003 – 2007 CAGR for non-interest bearing demand of 8% CDS Money Market & Savings Accts. Demand – interest bearing Non – interest bearing deposits |
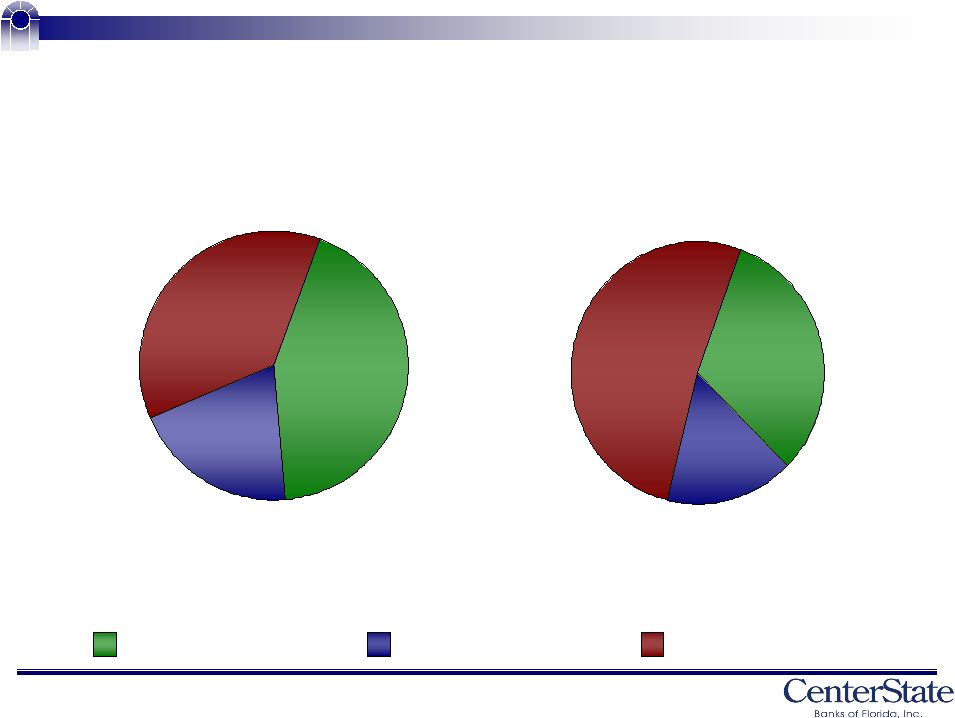 23 37% 43% 20% 12/31/05 Deposit Mix 16% 32% 52% 3/31/08 Checking MM & Savings Certificates of Deposits |
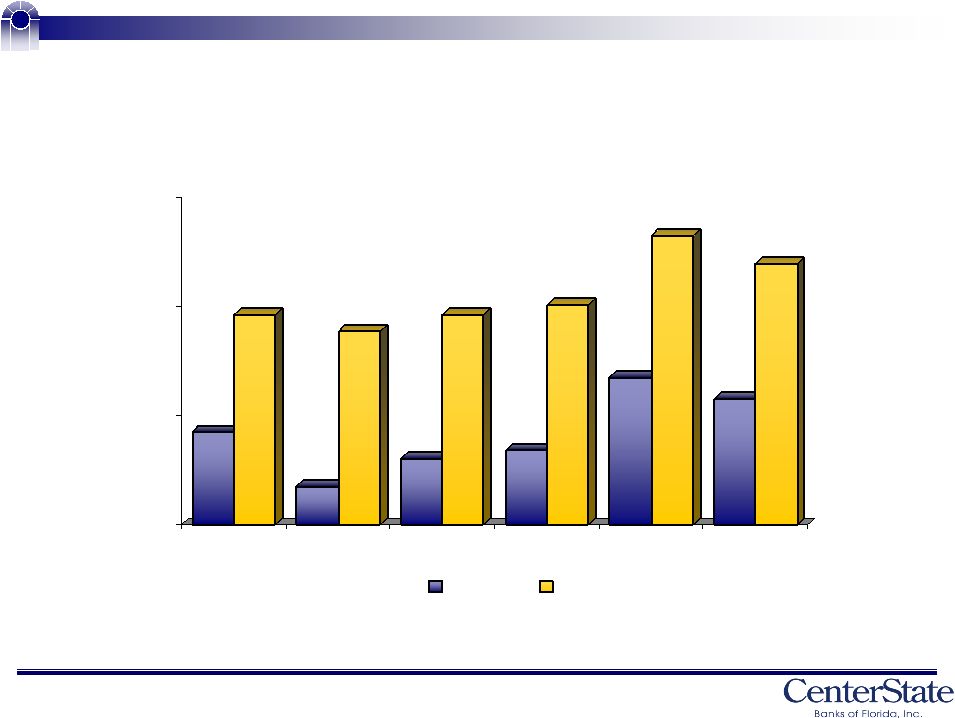 24 Liquidity Loans / Deposits (%) Source: SNL Financial; provided by Stevens, Inc. Peer data for the most recent quarter available. Peer group includes BOFL, BBX, BKUNA, CCBG, SBCF, and TIBB. Most recent quarter available for BKUNA: December 31, 2007. 77 99 67 96 72 99 74 100 87 113 83 108 60 80 100 120 2003 2004 2005 2006 2007 1Q08 CSFL Peers |
 25 Improving Efficiencies Efficiency Ratio (%) 76 76 67 68 73 81 60 70 80 90 2003 2004 2005 2006 2007 1Q08 Branches Opened: 4* 2 1 3 3 0 *Freedom branches; 2 of the freedom branches were closed in 2006. Deposits per Branch ($ Millions) 21.5 26.4 27.6 29.8 26.3 27.2 18.0 21.5 25.0 28.5 32.0 2003 2004 2005 2006 2007 1Q08 |
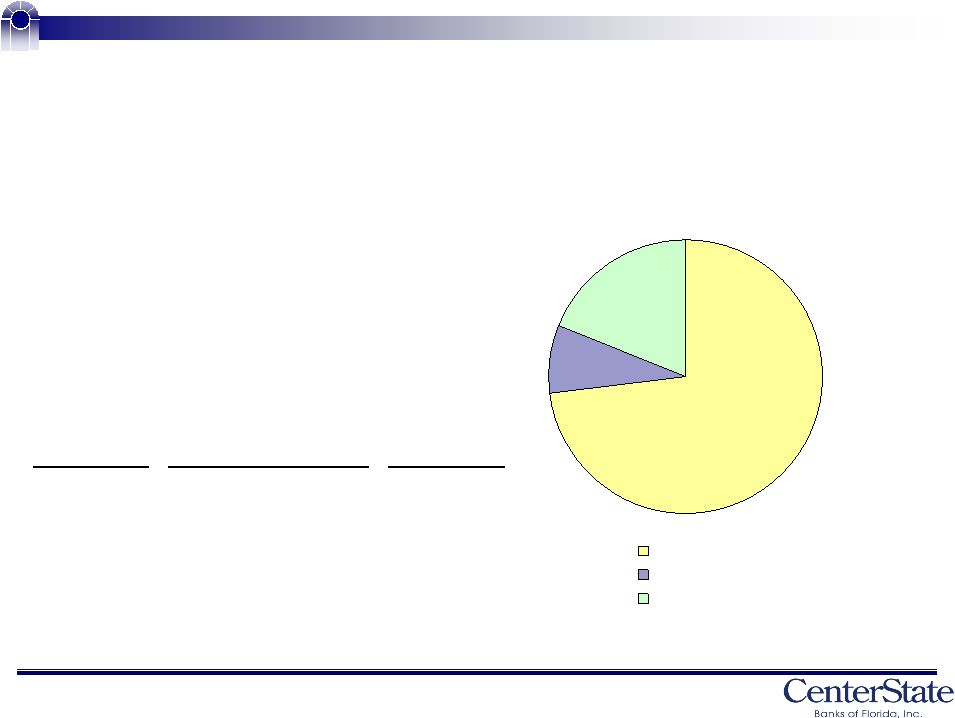 26 Branches – Average Deposits $5,898 Less than 3 year 7 $24,031 3 thru 5 years 3 $32,598 5 yrs and older 27 Avg Deposits by Location @ 3/31/08 No. of Years Open No. of Branch Locations Total Number of Branches: 37 Average Deposits per branch: $26,822 73% 8% 19% 5 yrs and older 3 thru 5 years Less than 3 years |
 27 Investment Highlights |
 28 S&P 500 Nasdaq Bank Time Horizon CSFL Index Index YTD 5/08/08 15.0 % (4.8) % (5.5) % 3-Year (25.8) 6.0 (17.2) 5-Year 30.5 55.9 17.0 Investment Highlights Market Capitalization (5/8/08): $173 million Institutional Ownership: Approximately 13 % Insider Ownership: Approximately 22 # of Registered Shareholders: 1,054* Free Float Shares: Approximately 9.7 million shares Price Performance *As of December 31, 2007; As reported by Transfer Agent. 3 and 5 year price performance as of March 31, 2008. |
 29 Building Shareholder Value Dedicated Employees Sustainable Earnings Growth Credit Quality Growth Markets Vision Focus Nothing special – just a candid straight-forward culture, realistic about our business |
 CenterState Banks of Florida, Inc. NASDAQ: CSFL February 2007 |