 CenterState Banks of Florida, Inc. Investor Conference Presentation May 2009 Exhibit 99.1 |
 2 CSFL This presentation contains forward-looking statements, as defined by Federal Securities Laws, relating to present or future trends or factors affecting the operations, markets and products of CenterState Banks of Florida, Inc. (CSFL). These statements are provided to assist in the understanding of future financial performance. Any such statements are based on current expectations and involve a number of risks and uncertainties. For a discussion of factors that may cause such forward- looking statements to differ materially from actual results, please refer to CSFL’s most recent Form 10Q and Form 10K filed with the Securities Exchange Commission. CSFL undertakes no obligation to release revisions to these forward- looking statements or reflect events or circumstances after the date of this presentation. Forward Looking Statement |
 3 CSFL Franchise Overview |
 4 CSFL Corporate Profile Headquartered in Davenport, Florida (Greater Orlando/Tampa Area) Nasdaq Symbol: CSFL Company formed: June 2000 4 Subsidiary Banks; 38 branch banking offices – 10 Counties throughout Central Florida 181 1,312 902 $ 1,802 Equity: Deposits: Loans: Assets: Mar. 31, 2009 Highlights ($ millions) 1989 1992 1989 1989 Date Established 199 Hillsborough 5 Valrico State Bank 942 Polk, Marion 16 CenterState Bank of Florida 379 Pasco, Hernando, Citrus, Lake, Sumter 11 CenterState Bank, N.A. $282 Osceola, Orange 6 CenterState Bank Central FL Asset Size ($ millions) Counties of Operation No. of Offices Subsidiary Banks approx. 9.5 million shares approx. 24% approx. 18% $ 149.9 million Free Float Shares: Insider Ownership: Institutional Ownership: Market Cap (4/30/09): Market Data |
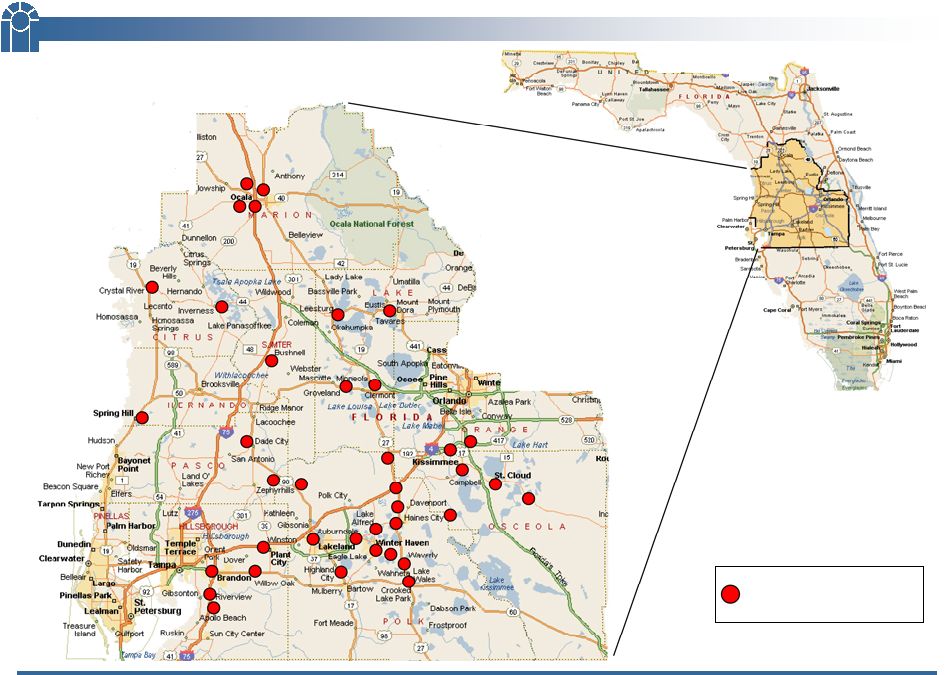 5 CSFL CSFL Branch Branch Footprint |
 6 CSFL Deposits Market Deposits Institution ($000) Share Branches per Branch Bank of America Corp. (NC) $10,014,244 20.59 % 113 $88,622 Wells Fargo & Co. (CA) 9,927,397 20.41 115 86,325 SunTrust Banks Inc. (GA) 8,678,353 17.84 149 58,244 Colonial BancGroup Inc. (AL) 3,026,090 6.22 52 58,194 Regions Financial Corp. (AL) 2,554,984 5.25 91 28,077 CenterState Banks of Florida (FL) 2.36 37 31,080 Fifth Third Bancorp (OH) 914,879 1.88 27 33,884 BB&T Corp. (NC) 814,594 1.67 22 37,027 South Financial Group Inc. (SC) 775,904 1.60 18 43,106 Villages Bancorp Inc. (FL) 729,902 1.50 10 72,990 6 8 1 2 3 4 5 7 9 10 Rank 1,149,966 Strong Market Share Combined Counties of Operation Source: SNL Financial. Deposit data as of 6/30/08. Market share data for Citrus, Hernando, Hillsborough, Lake, Marion, Osceola, Pasco, Polk and Sumter Counties, Florida. Pro forma for recent acquisition of Ocala National Bank and 3 branch closings in 2009. Excludes Orange County in which CSFL has $14.2 million in deposits and 1 branch. |
 7 CSFL Market Demographics 6 of our 10 counties rank in the top 15 fastest growing counties in Florida Source: SNL Financial. Population deposit weighted by county as of 6/30/08. Southeast includes AL, AR,FL, GA, KY,LA, MS, NC, SC, TN, VA and WV. CSFL Counties 2008 – 2013 Population Growth (%) % Osceola 31.5 Lake 21.9 Pasco 21.3 Hernando 19.7 Marion 18.0 Polk 14.8 Citrus 13.7 Hillsborough 12.8 Orange 14.2 Sumter 34.5 10.0 Peer Group % 19.7 CenterState Banks of Florida, Inc.. 6.3 United States 8.5 Southeast % 11.6 Florida 2008 – 2013 Projected Population Growth (%) Peer Group includes the following banks: BOFL, BBX, BKUNA, BCBF, CCBG, CBKS, FDTR, FLRB, GFLB, SBCF, SAMB, and TIBB. |
 8 CSFL Business Strategy Maintain local decision making Emphasize relationship banking Develop a network of profitable banks in high-growth markets in Central Florida Disciplined approach to loan and deposit growth Leverage our investment in our branch network |
 9 CSFL Correspondent Banking Department Management lift out (16 employees) Physical operations – Birmingham, Alabama Three primary business lines 1. Bond Sales 2. Correspondent bank checking accounts; deposits (fed funds purchased) 3. Safekeeping, bond accounting, and asset/liability consulting services Customer base – small to medium size financial institutions primarily located in Florida, Alabama, and Georgia. |
 10 CSFL Loan Portfolio & Credit Quality |
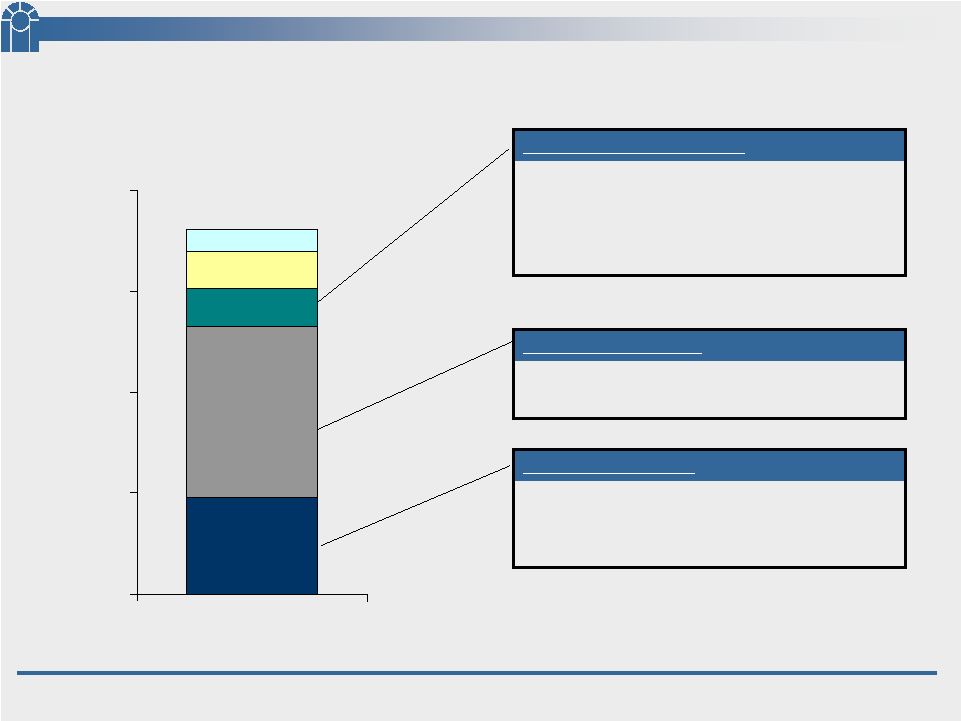
 11 CSFL 240 424 93 91 54 0 250 500 750 1,000 2004 2005 2006 2007 2008 3/31/09 Loan Portfolio 84% of our portfolio is secured by real estate Construction, A&D, and Land loans represent 10% of total portfolio Largest ten relationships represent about 6% of our portfolio About 3% of our portfolio is unsecured ($ Millions) 902 441 517 658 841 892 Consumer & Other Commercial Construction, A&D, & Land Commercial Real Estate Residential Real Estate |
 12 CSFL Loan Portfolio All other land 29% A&D, developed lots 34% Commercial construction 22% Single family home construction 14% Construction, A&D, and Land Second mortgages 3% Lines of credit 22% First mortgages 75% Residential Real Estate Non-owner occupied 49% Owner occupied 51% Commercial Real Estate ($ Millions) 424 93 91 54 240 0 250 500 750 1,000 3/31/2009 |
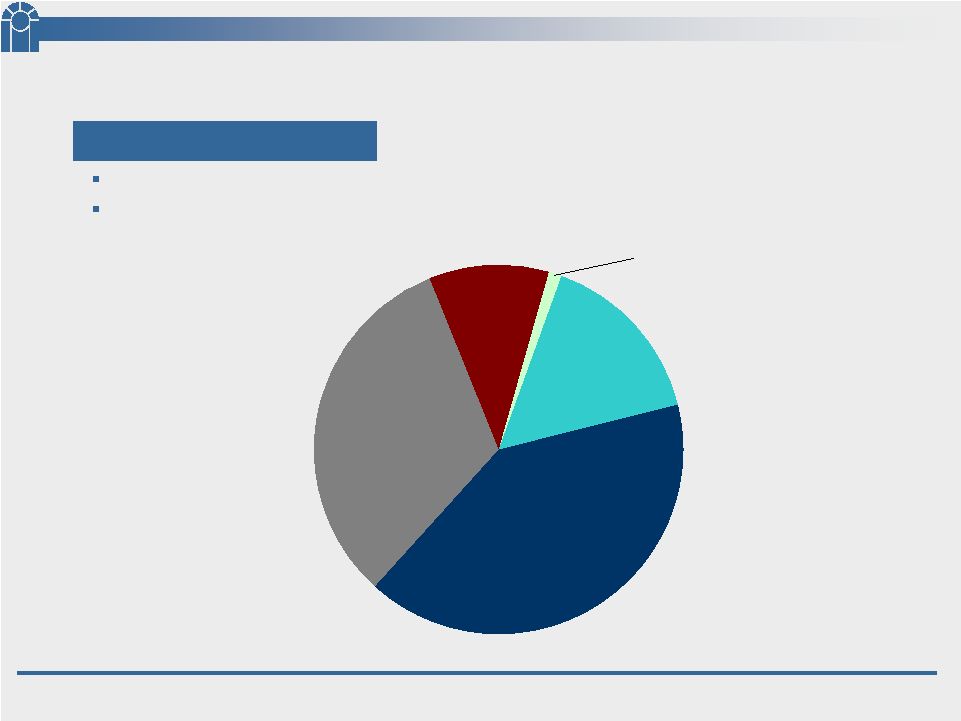 13 CSFL As of March 31, 2009 $22,123,000 2.45% of Total Loans 32% 11% 16% 40% Residential real estate $3,437K (25 loans) Commercial real estate $8,955K (18 loans) Construction, A&D, and Land $7,172K (16 loans) Commercial $2,334K (12 loans) Consumer and other $225K (10 loans) Non-Performing Loans |
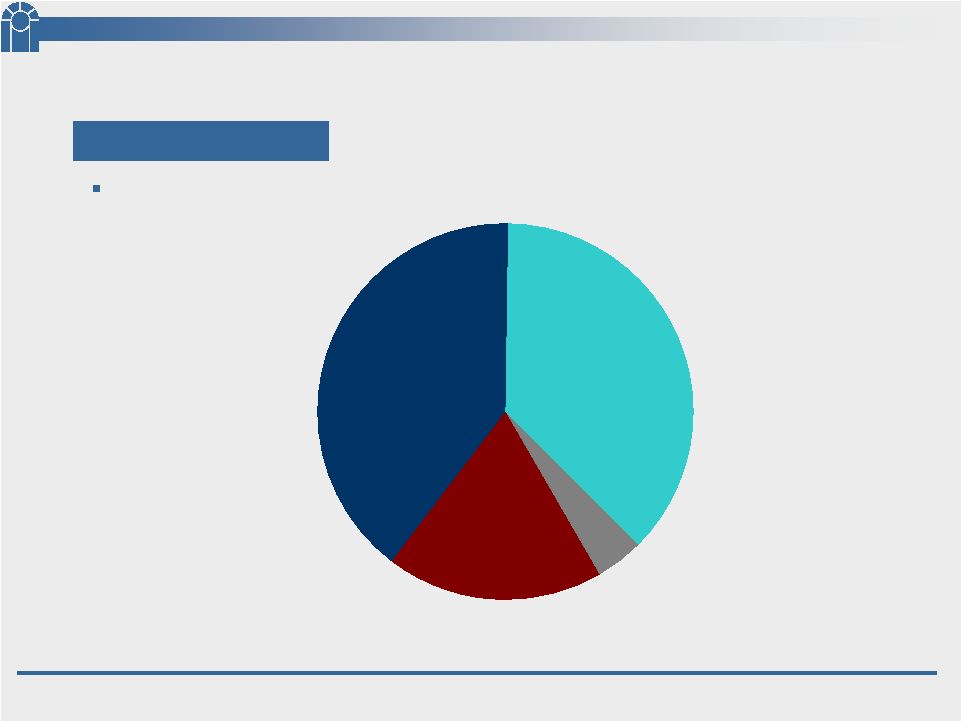 14 CSFL 40% 37% 19% 4% As of March 31, 2009 Single family homes (24) $2,205K Commercial RE property (11) $4,430K Mobile homes w/ land (7) $492K $11,903,000 Building lots, unimproved land, & other $4,776K Repossessed Real Estate |
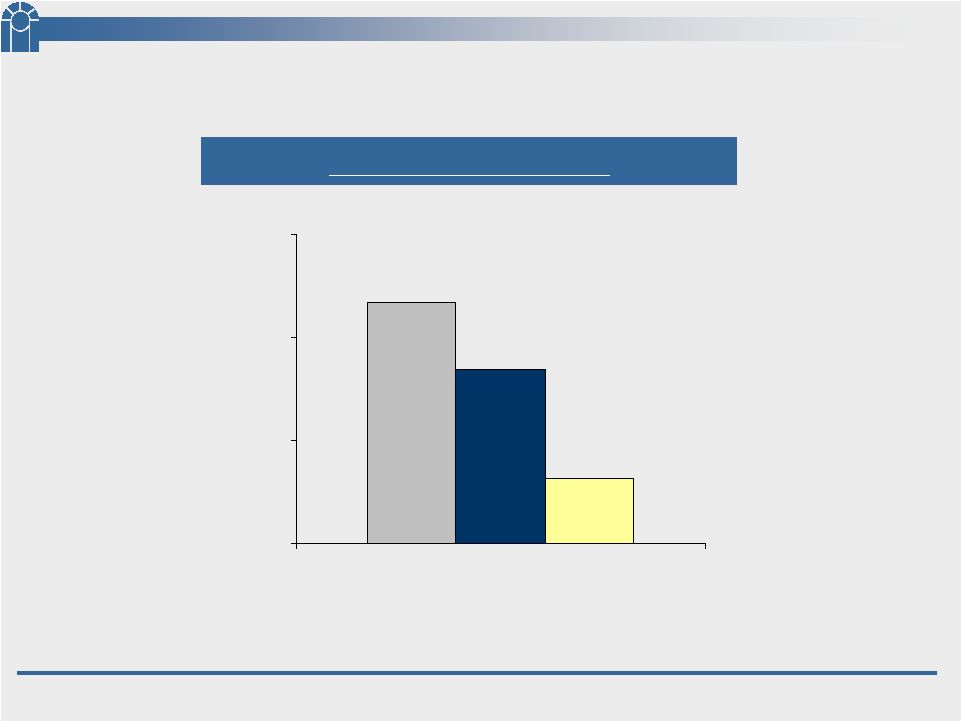 15 CSFL Source: SNL Financial Data for 3/31/09 or MRQ available. Peer Group consists of the followings banks: BKUNA, BBX, CCBG, SBCF, GFLB, TIBB, BOFL, FLRB, BCBF, SAMB, and CBKS. 7.02% 1.91% 5.06% 0.00% 3.00% 6.00% 9.00% March 31, 2009 Peer Group Mean CSFL Peer Group Median As a % of Total Assets Non-Performing Assets |
 16 CSFL Credit Quality 0.07 0.05 0.08 0.12 0.47 0.18 0.00 0.10 0.20 0.30 0.40 0.50 2004 2005 2006 2007 2008 Q1 '09 Net Charge-Offs / Avg Loans 1.29 1.26 1.12 1.29 1.49 1.49 1.00 1.25 1.50 1.75 Allowance for Loan Losses / Loans 12/31/04 12/31/05 12/31/06 12/31/07 12/31/08 3/31/09 |
 17 CSFL CRE Concentrations Category A 100% 65% 0% 50% 100% 150% Regulatory Guidelines CSFL 300% 164% 0% 100% 200% 300% 400% Regulatory Guidelines CSFL Category B Category A includes acquisition and development loans, commercial construction loans, residential construction spec loans, and vacant land loans. 1. Category B includes all loans included in category A plus commercial real estate loans non owner occupied and commercial loans not secured by real estate or unsecured to real estate developers or REITs. 2. 1 2 |
 18 CSFL Financial Performance |
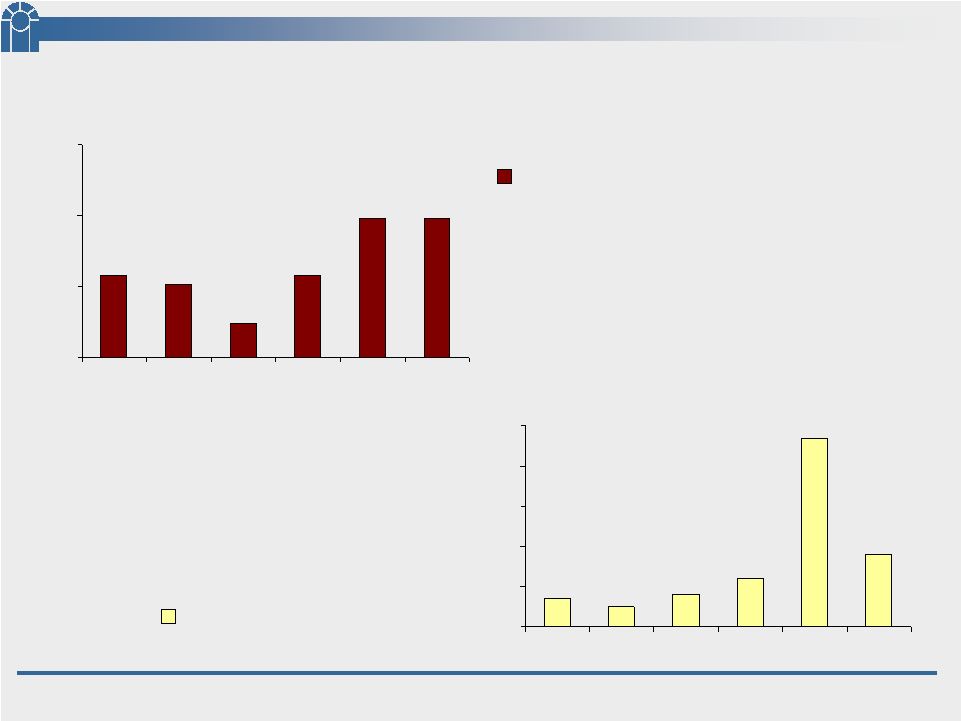
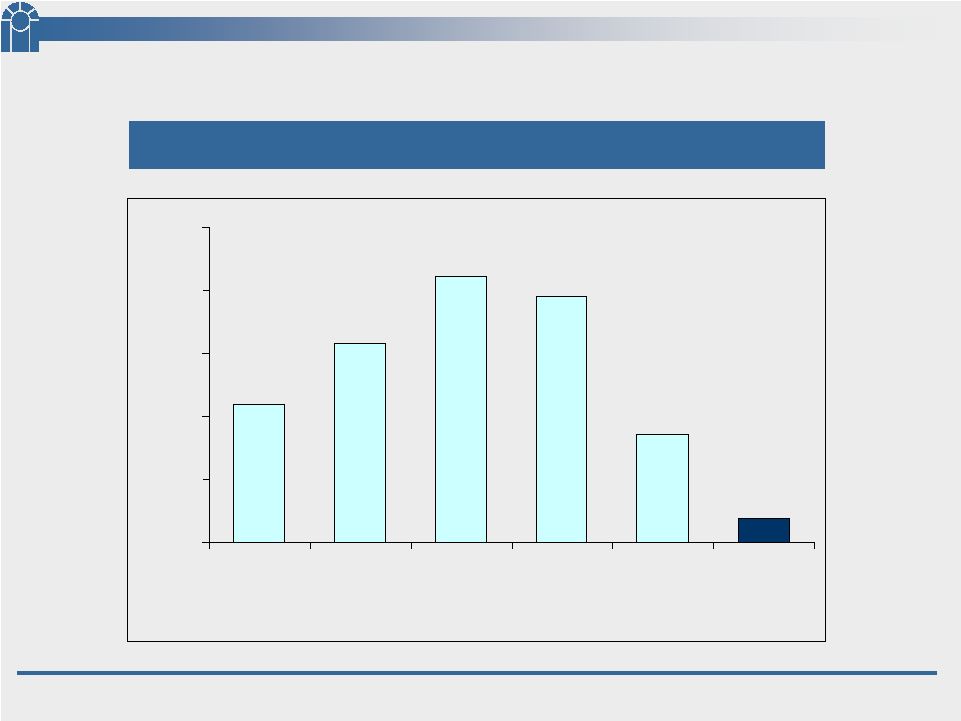 19 CSFL Earnings Performance 4.37 6.33 8.46 7.80 3.42 0.77 0.00 2.00 4.00 6.00 8.00 10.00 2004 2005 2006 2007 2008 1Q'09 Net Income – 5 Years $0.03 $0.26 $0.63 $0.75 $0.66 $0.57 EPS ($ Millions) |
 20 CSFL Earnings Performance (continued) 470 998 $772 $81 $761 $1,111 0 500 1,000 1,500 2,000 Q1'08 Q2'08 Q3'08 Q4'08 1Q'09 Net Income - 5 Quarters $0.03 ($0.01) $0.06 $0.12 $0.09 EPS ($ Thousands) $1,468 |
 21 CSFL New Segment – Correspondent Banking Division 40 --- Other income 2,557 1,412 Bond sales commission (1,722) (842) Compensation expense $1,243 $331 NET INCOME $0.10 $0.03 EPS effect (382) (165) Other expenses (428) (117) Income tax provision $1,178 1Q’09 Net Interest Income Effect on Net Income $43 4Q’08 (4Q 2008 forward, $ Thousands) |
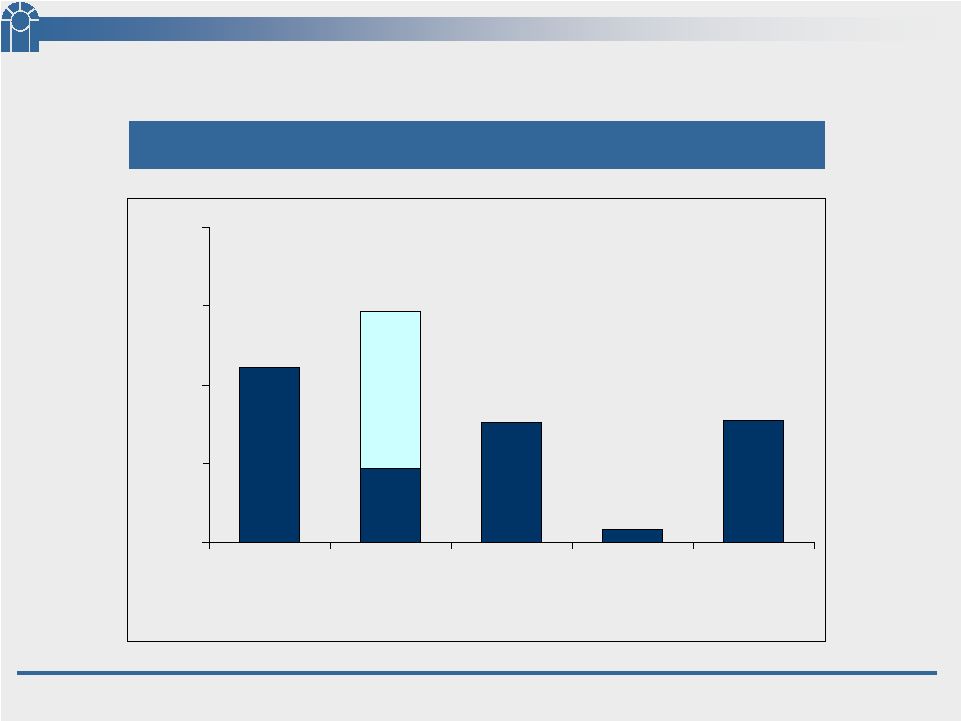
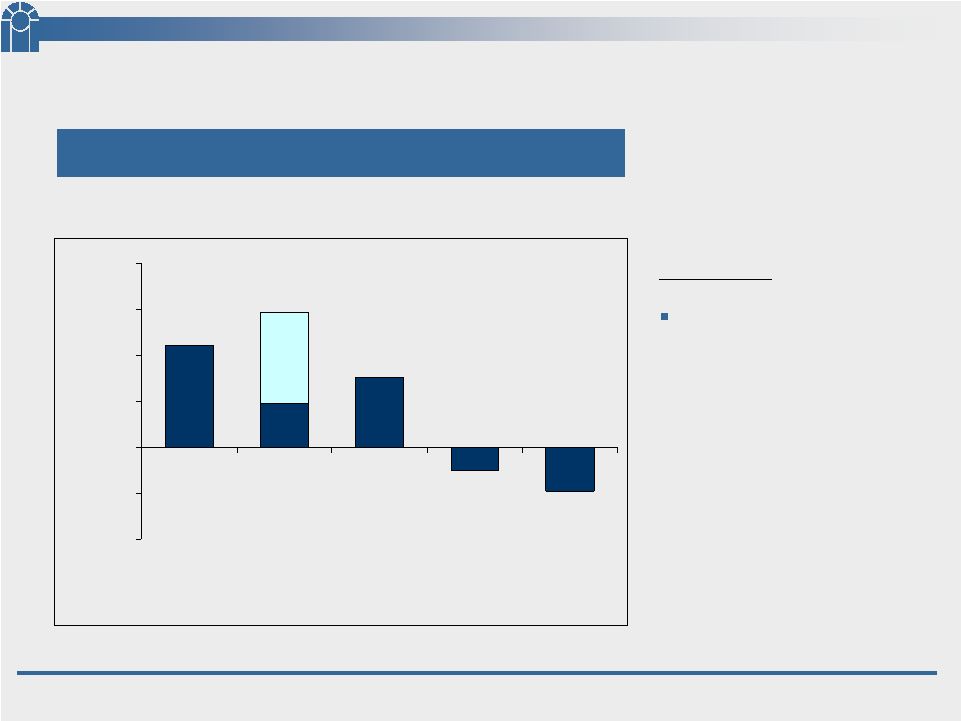 22 CSFL 998 470 ($471) ($250) $761 $1,111 ($1,000) ($500) $0 $500 $1,000 $1,500 $2,000 Q1'08 Q2'08 Q3'08 Q4'08 1Q'09 Earnings Performance Net Income - 5 Quarters ($0.07) ($0.03) $0.06 $0.12 $0.09 EPS ($ Thousands) Excludes: Correspondent Banking Division (4Q’08 & 1Q’09) $1,468 |
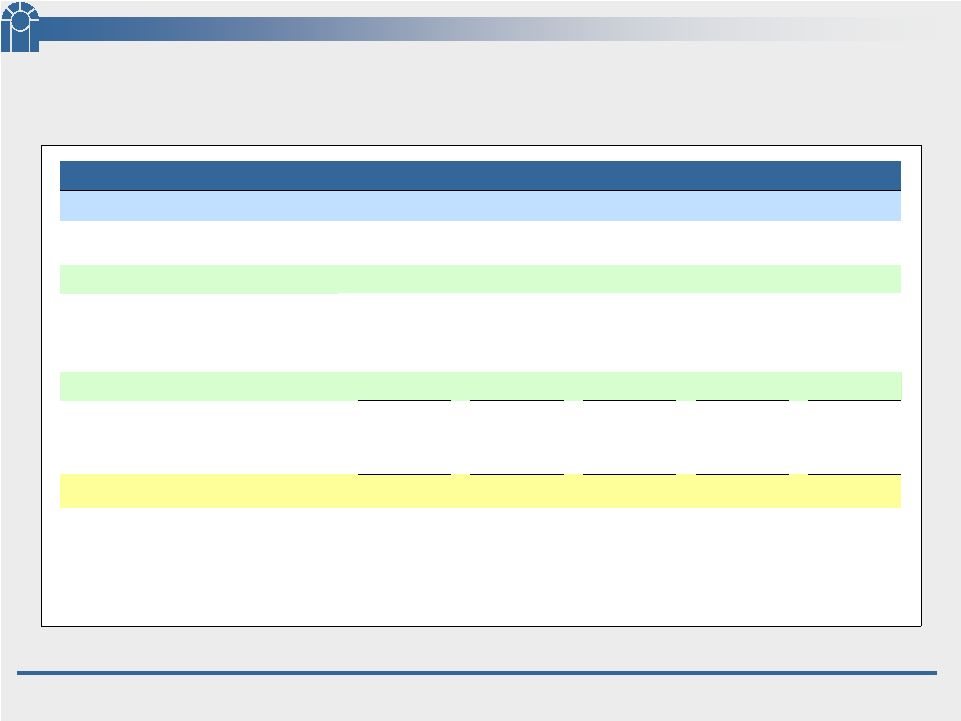 23 CSFL Proforma Net Income: Core Bank – Components $0.08 $0.14 $0.17 $0.12 $0.12 EPS $1,436 ($0.07) ($471) (162) (633) (861) (10,736) ---- 2,353 (1,703) $1,348,128 3.15% $10,314 Q1 ’09 (9,904) (9,263) (9,421) (9,335) Non interest expense 3.65% 3.88% 3.75% 3.61% Net Interest Margin¹ $1,111,191 $1,079,124 $1,092,428 $1,109,136 Avg. Interest Earnings Assets¹ (354) (245) (714) (493) Income tax expense (604) 1,006 2,182 1,604 Income (loss) before income tax $1,874 $2,095 $1,490 $1,530 Net Income ($0.03) $0.06 $0.12 $0.09 EPS ($250) $761 $1,468 $1,111 NET INCOME (LOSS) (445) (350) (139) (72) Foreclosure related expenses ---- ---- 1,483 ---- Non recurring items 2,360 2,007 1,744 1,801 Non interest income (2,637) (1,764) (1,515) (604) Provision for loan losses $10,022 $10,376 $10,030 $9,814 Net Interest Income Q4 ’08 Q3 ‘08 Q2 ‘08 Q1 ’08 Quarter to Date ($ in thousands, except per share data) 1 Excludes Correspondent Banking. 2 Excludes, non recurring items, Correspondent Banking, and credit related costs. 2 1 1 |
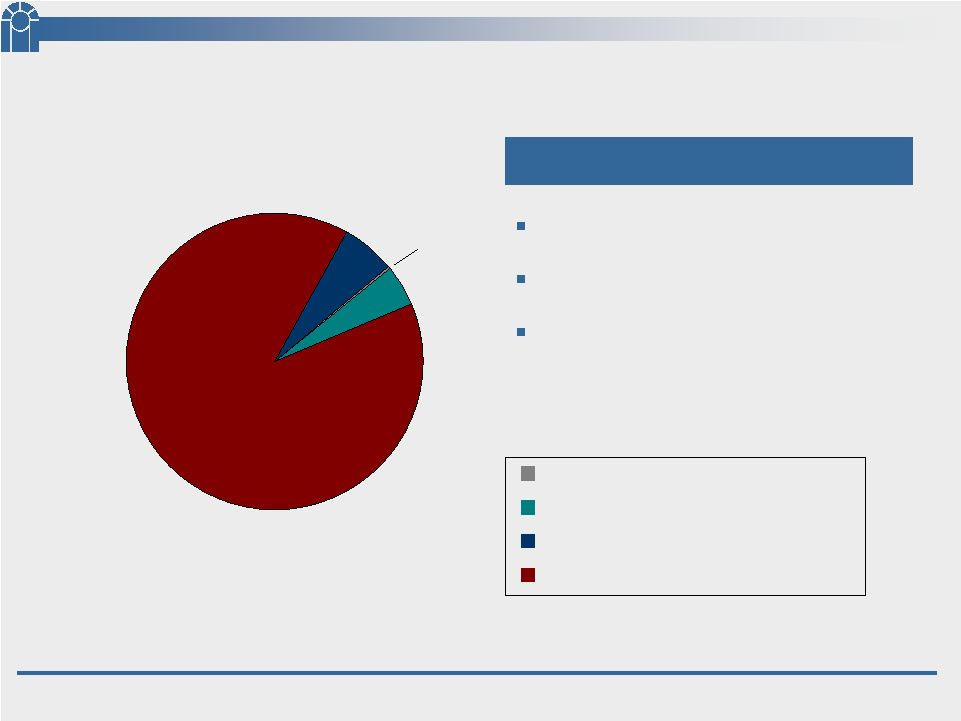 24 CSFL US Treasuries US Agencies Municipals Mortgage Backed Securities Dollar Value: $617,790,000 Duration: 3.6 yrs Yield (TE): 4.42% Investment Mix 6% 5% 89% < 1% Total Portfolio |
 25 CSFL Deposits |
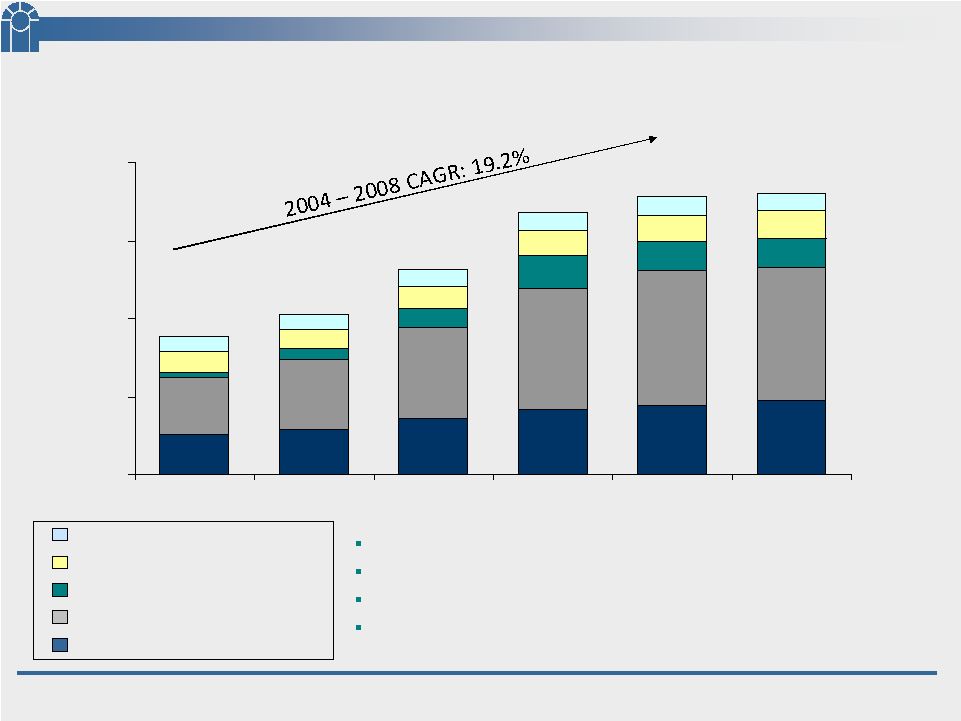
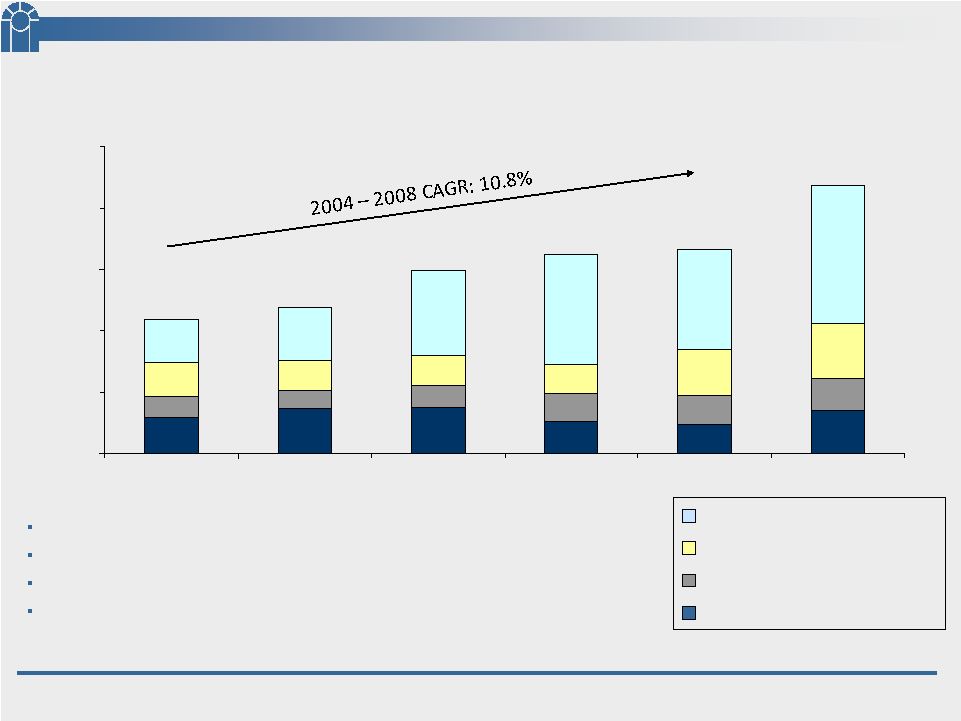 26 CSFL 210 160 262 680 0 300 600 900 1,200 1,500 2004 2005 2006 2007 2008 3/31/09 660 717 893 973 994 1,312 Deposit Composition Approximately 16% of our deposits are non-interest bearing checking accounts Approximately 52% of our deposits are time deposits Top ten relationships are approximately 13% of total deposits Approximately 68,500 total accounts – $19,000 average balance per account CDS Money Market & Savings Accts. Demand – interest bearing Non – interest bearing deposits ($ Millions) |
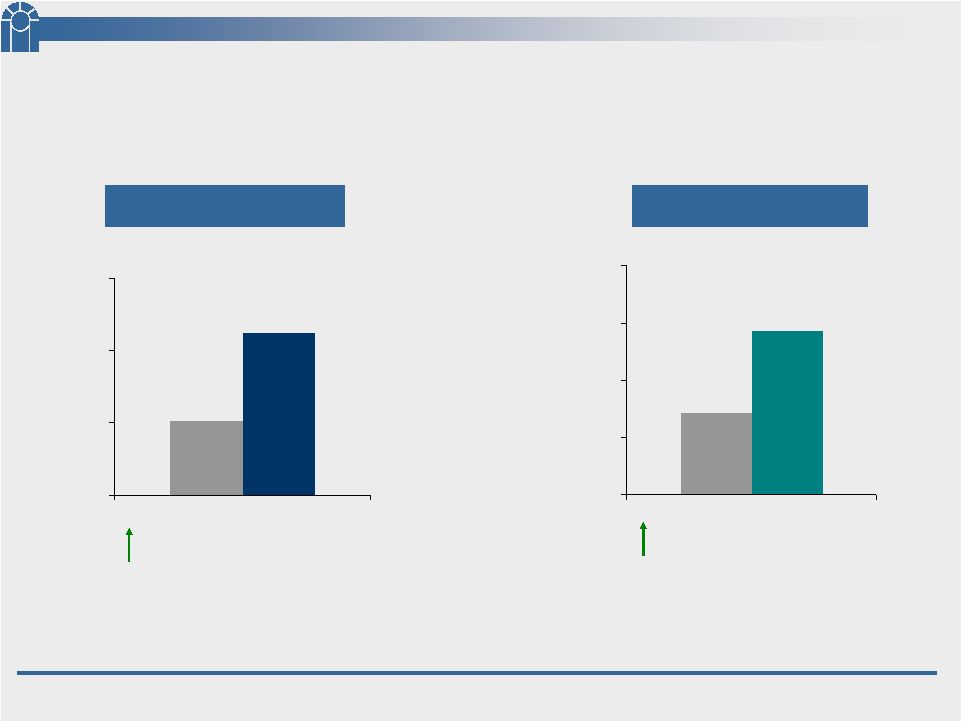 27 CSFL Deposits – March 31, 2008 vs. 2009 $ Dollars $1,005 $1,312 $750 $1,000 $1,250 $1,500 ($ Millions) $306.6 million or 30.5% 3/31/08 3/31/09 54,203 68,680 40,000 50,000 60,000 70,000 80,000 No. of Accounts 14,477 accts or 26.7% 3/31/08 3/31/09 vs. |
 28 CSFL Ocala Acquisition 10,852 5,344 1,637 2,637 1,234 # of accounts 134,849 CDs 15,657 Money Market & Savings Total Checking – interest bearing Demand – non interest bearing As of March 31, 2009 $170,955 11,787 8,662 $ ’000s |
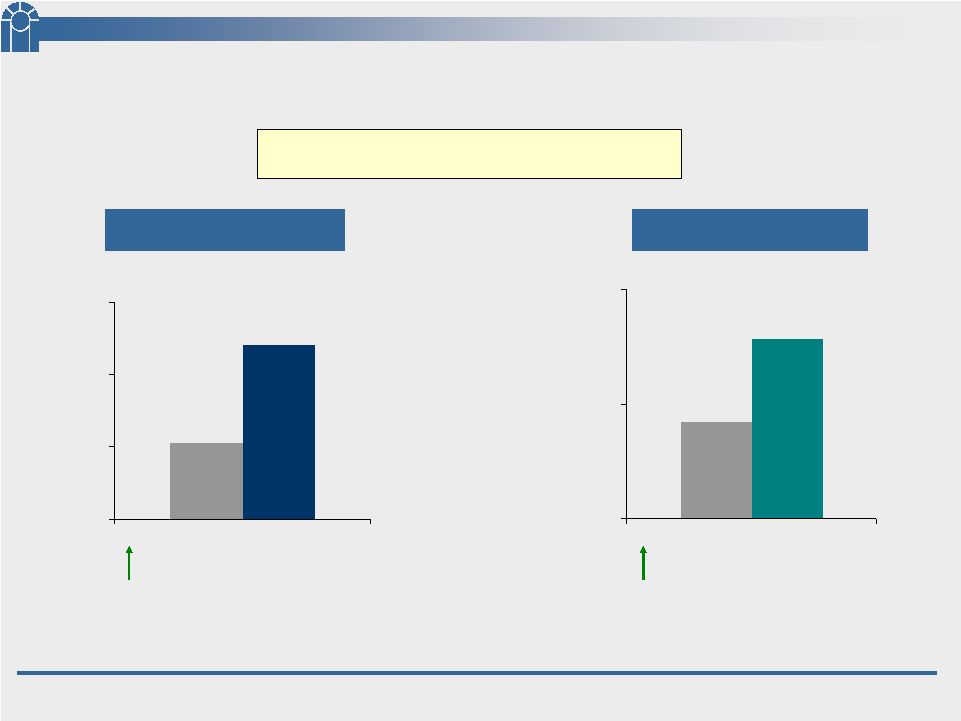 29 CSFL Deposits – March 31, 2008 vs. 2009 $ Dollars $1,005 $1,141 $900 $1,000 $1,100 $1,200 ($ Millions) $135.6 million or 13.5% 3/31/08 3/31/09 54,203 57,828 50,000 55,000 60,000 No. of Accounts 3,625 accts or 6.7% 3/31/08 3/31/09 vs. Excluding Ocala |
 30 CSFL Deposits Excluding Ocala $595.9 47,243 $544.8 10,585 3/31/09 $109.7 / 22.6% 5,599 / 13.4% $25.9 / 5.0% (1,974) / (15.7%) Increase (Decrease) 6 Non-CDs $ # of accounts CDs $ # of accounts ($ millions) $486.2 41,644 $518.9 12,559 3/31/08 |
 31 CSFL Checking Accounts Excluding Ocala $349.7 36,541 3/31/09 $28.8 / 9.0% 5,320 / 17.0% Increase (Decrease) 6 $ # of accounts ($ millions) $320.9 31,221 3/31/08 |
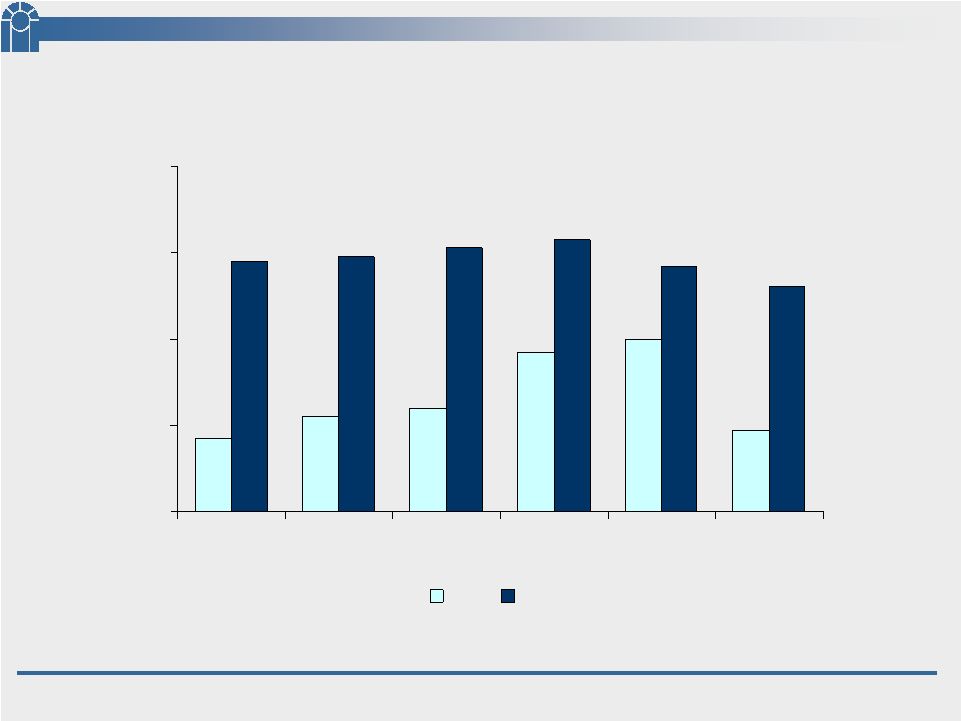 32 CSFL Liquidity Loans / Deposits (%) Source: SNL Financial Data for 3/31/09 or MRQ available. 67 72 74 87 90 69 108 109 111 113 107 102 50 70 90 110 130 2004 2005 2006 2007 2008 3/31/09 CSFL Peers Peer Group includes the following banks: BOFL, BBX, BKUNA, BCBF, CCBG, CBKS, FDTR, FLRB, GFLB, SBCF, SAMB, and TIBB. |
 33 CSFL Capital |
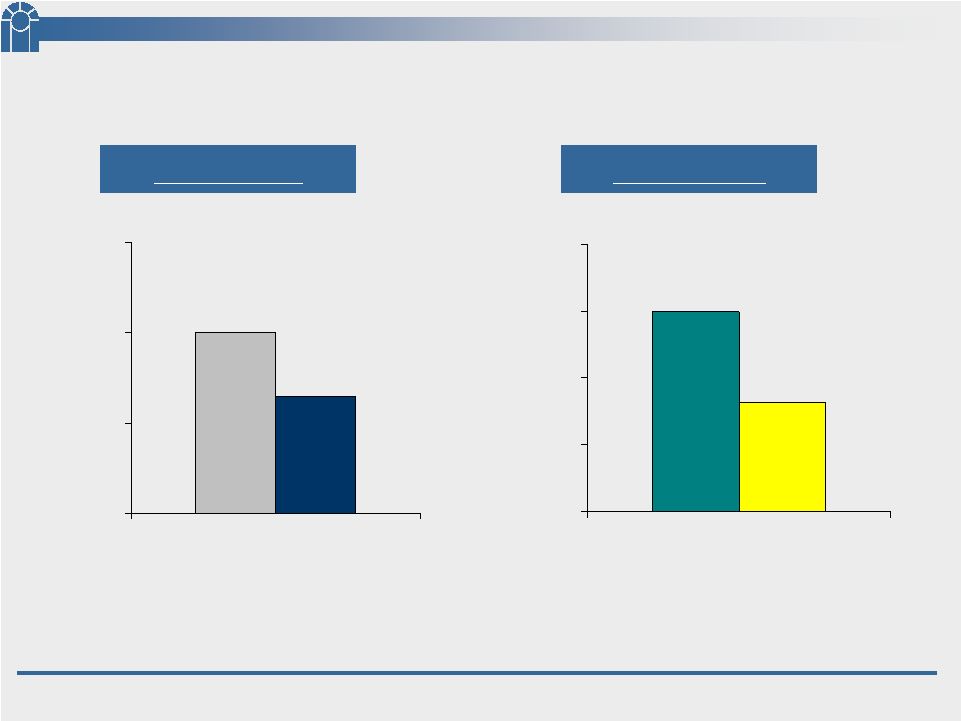
 34 CSFL Tier 1 Capital to Average Assets 9.50% 5.00% 0.00% 3.00% 6.00% 9.00% 12.00% At 3/31/09 CSFL Well Capitalized Our Tier 1 capital is more than the amount needed to be considered “well capitalized” by federal banking regulatory guidelines. $72 million excess Tier 1 Capital Our capital position compares favorably to our peer group. Peer Comparison (at 3/31/09) 9.50% 7.65% 7.88% 6.00% 7.00% 8.00% 9.00% 10.00% Peer Group Peer Group Mean Median CSFL Source: SNL Financial Data for 3/31/09 or MRQ available. Peer Group consists of the following banks: BOFL, BBX, BKUNA, BCBF, CCBG, CBKS, FDTR, FLRB, GFLB, SBCF, SAMB, and TIBB. |
 35 CSFL Troubled Asset Relief Program (TARP) $27.8 million Attractively priced capital Did not need the capital Could use it to support growth of our deposits and loans either organically or through acquisition In these uncertain times – we felt it prudent to accumulate excess capital |
 36 CSFL 8.4% 9.5% Tier 1 capital to average assets 11.7% 13.0% Proforma - w/o TARP 14.0% Tier 1 capital to risk weighted assets 15.3% Total capital to risk weighted assets 3/31/09 Regulatory Capital |
 37 CSFL In Summary |
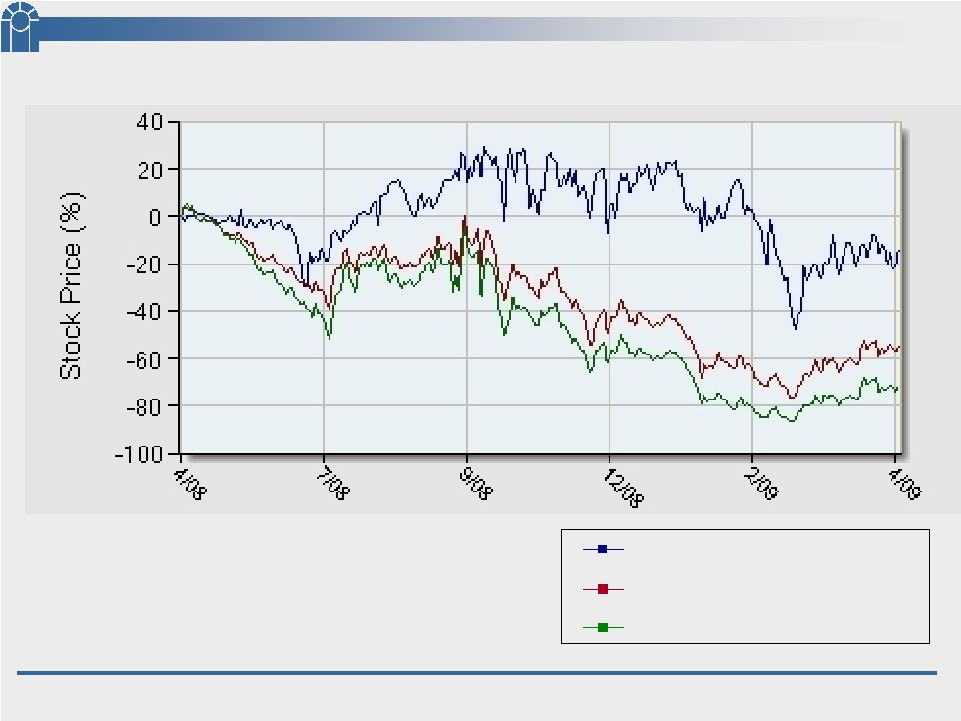 38 CSFL 52 Week Stock Price Performance Source: SNL Financial SNL Bank : Includes all Major Exchange (NYSE, NYSE-Alt, NASDAQ) Banks in SNL's coverage universe. SNL Southeast Bank : Includes all Major Exchange (NYSE, NYSE-Alt, NASDAQ) Banks in SNL's coverage universe headquartered in AL, AR, FL, GA, MS, NC, SC, TN, VA, WV. CSFL (-14.48%) SNL Bank (-54.99%) SNL Southeast Bank (-72.13%) |
 39 CSFL In Summary… De-Centralized Credit Quality Correspondent Banking Earnings Vision |
 CenterState Banks of Florida, Inc. Investor Conference Presentation May 2009 |