|
Exhibit 99.1 
|
Exhibit 99.1
Investor Presentation
March 7, 2012
Forward Looking Statement
This presentation contains forward-looking statements, as defined by Federal
Securities Laws, relating to present or future trends or factors affecting the operations, markets and products of CenterState Banks, Inc. (CSFL). These statements are provided to assist in the understanding of future financial performance. Any such statements are based on current expectations and involve a number of risks and uncertainties. For a discussion of factors that may cause such forward-looking statements to differ materially from actual results, please refer to CSFL’s most recent Form 10-Q and Form 10-K filed with the Securities Exchange Commission.
CSFL undertakes no obligation to release revisions to these forward-looking statements or reflect events or circumstances after the date of this presentation.
Table of Contents
Corporate Overview 4—5
Opportunistic Through the Crisis 6—11
Credit Quality & the Florida Economy 12—16
Profitability Metrics 17
Summary 18
Appendix 19—25
Corporate Overview
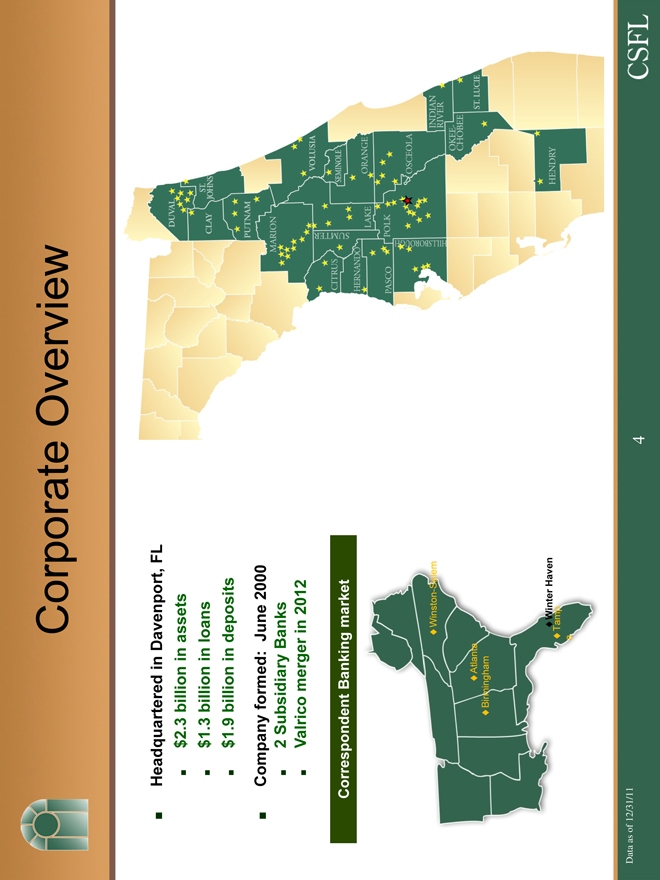
Headquartered in Davenport, FL
$2.3 billion in assets
$1.3 billion in loans
$1.9 billion in deposits
Company formed: June 2000
Valrico merger in 2012
Correspondent Banking market
Winston-Salem
Atlanta
Birmingham
Winter Haven
Tampa
Data as of 12/31/11
Conservative Balance Sheet
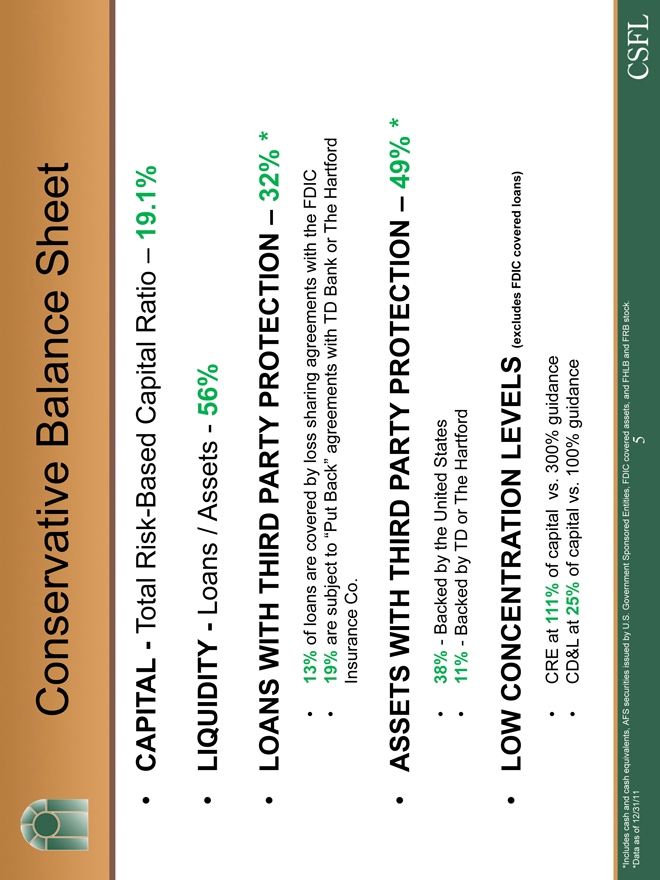
CAPITAL—Total Risk-Based Capital Ratio – 19.1%
LIQUIDITY—Loans / Assets—56%
LOANS WITH THIRD PARTY PROTECTION – 32% *
13% of loans are covered by loss sharing agreements with the FDIC
19% are subject to “Put Back” agreements with TD Bank or The Hartford
Insurance Co.
ASSETS WITH THIRD PARTY PROTECTION – 49% *
38%—Backed by the United States
11%—Backed by TD or The Hartford
LOW CONCENTRATION LEVELS (excludes FDIC covered loans)
CRE at 111% of capital vs. 300% guidance
CD&L at 25% of capital vs. 100% guidance
*Includes cash and cash equivalents, AFS securities issued by U.S. Government Sponsored Entities, FDIC covered assets, and FHLB and FRB stock.
*Data as of 12/31/11
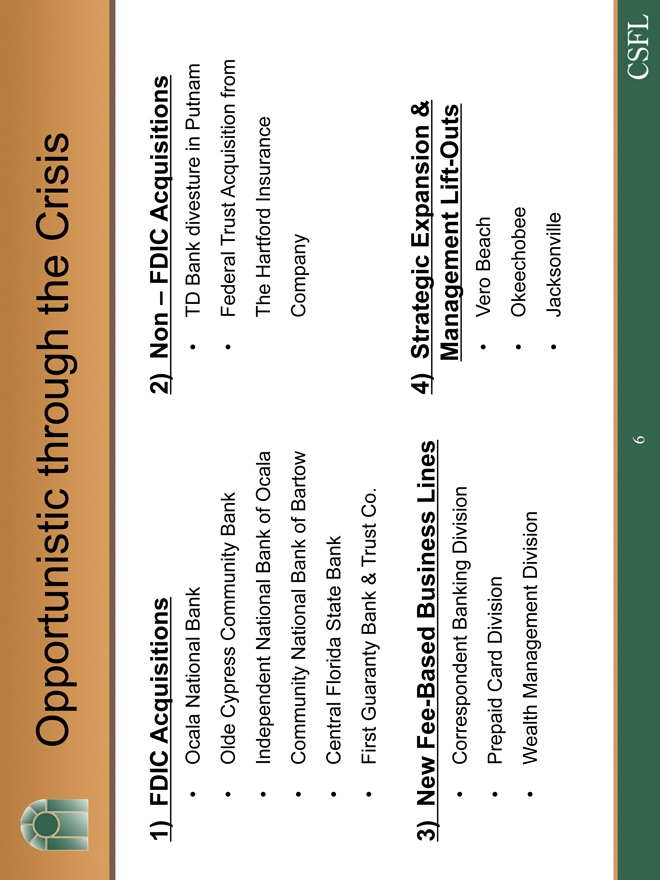
Opportunistic through the Crisis
1) FDIC Acquisitions
Ocala National Bank
Olde Cypress Community Bank
Independent National Bank of Ocala
Community National Bank of Bartow
Central Florida State Bank
First Guaranty Bank & Trust Co.
2) New Fee-Based Business Lines
Correspondent Banking Division
Prepaid Card Division
Wealth Management Division
3) Non – FDIC Acquisitions
TD Bank divesture in Putnam
Federal Trust Acquisition from The Hartford Insurance
Company
47) Strategic Expansion & Management Lift-Outs
Vero Beach
Okeechobee
Jacksonville
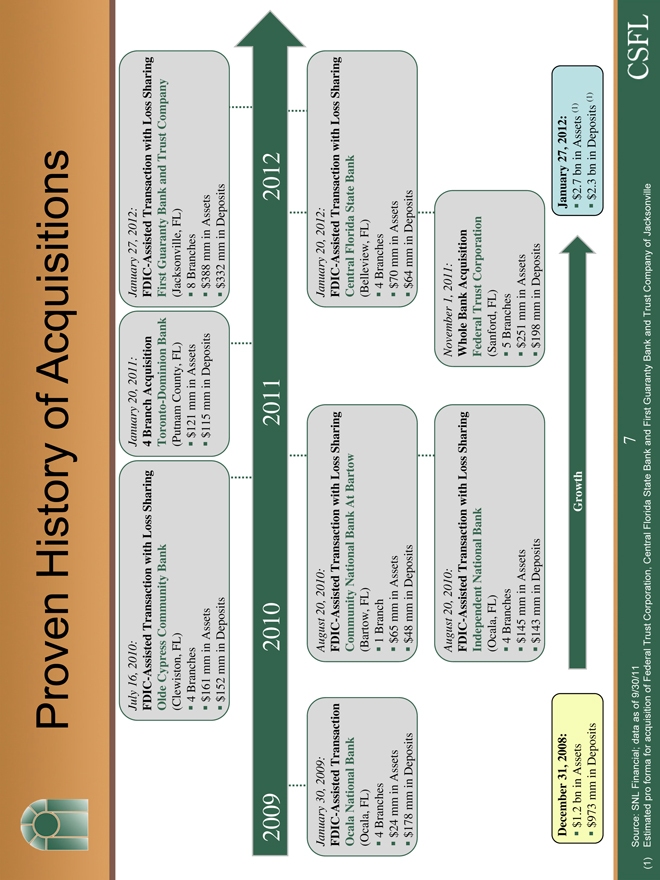
Proven History of Acquisitions
July 16, 2010:
FDIC-Assisted Transaction with Loss Sharing Olde Cypress Community Bank
(Clewiston, FL) 4 Branches $161 mm in Assets $152 mm in Deposits
January 20, 2011:
4 | | Branch Acquisition Toronto-Dominion Bank |
(Putnam County, FL) $121 mm in Assets $115 mm in Deposits
January 27, 2012:
FDIC-Assisted Transaction with Loss Sharing First Guaranty Bank and Trust Company
(Jacksonville, FL) 8 Branches $388 mm in Assets $332 mm in Deposits
2009 2010 2011 2012
January 30, 2009:
FDIC-Assisted Transaction Ocala National Bank
(Ocala, FL) 4 Branches $24 mm in Assets $178 mm in Deposits
August 20, 2010:
FDIC-Assisted Transaction with Loss Sharing Community National Bank At Bartow
(Bartow, FL) 1 Branch $65 mm in Assets $48 mm in Deposits
January 20, 2012:
FDIC-Assisted Transaction with Loss Sharing Central Florida State Bank
(Belleview, FL) 4 Branches $70 mm in Assets $64 mm in Deposits
August 20, 2010:
FDIC-Assisted Transaction with Loss Sharing Independent National Bank
(Ocala, FL)
4 | | Branches $145 mm in Assets $143 mm in Deposits |
November 1, 2011:
Whole Bank Acquisition Federal Trust Corporation
(Sanford, FL)
5 | | Branches $251 mm in Assets $198 mm in Deposits |
January 27, 2012:
$2.7 bn in Assets (1) $2.3 bn in Deposits (1)
December 31, 2008:
$1.2 bn in Assets $973 mm in Deposits
Growth
Source: SNL Financial; data as of 9/30/11 7
(1) Estimated pro forma for acquisition of Federal Trust Corporation, Central Florida State Bank and First Guaranty Bank and Trust Company of Jacksonville
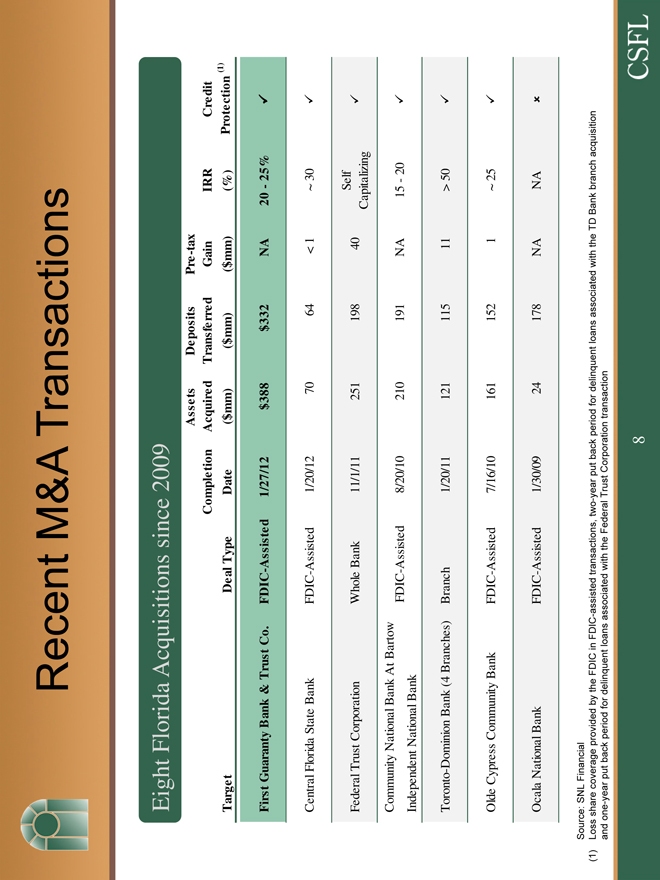
Recent M&A Transactions
Eight Florida Acquisitions since 2009
Assets Deposits Pre -tax
Completion Acquired Transferred Gain IRR Credit
Target Deal Type Date ($mm) ($mm) ($mm) (%) Protection (1)
First Guaranty Bank & Trust Co. FDIC-Assisted 1/27/12 $388 $332 NA 20—25%
Central Florida State Bank FDIC-Assisted 1/20/12 70 64 < 1 ~ 30
Self
Federal Trust Corporation Whole Bank 11/1/11 251 198 40
Capitalizing
Community National Bank At Bartow
FDIC-Assisted 8/20/10 210 191 NA 15—20
Independent National Bank
-Toronto Dominion Bank (4 Branches) Branch 1/20/11 121 115 11 > 50
Olde Cypress Community Bank FDIC-Assisted 7/16/10 161 152 1 ~ 25
Ocala National Bank FDIC-Assisted 1/30/09 24 178 NA NA
Source: SNL Financial
(1) Loss share coverage provided by the FDIC in FDIC-assisted transactions, two-year put back period for delinquent loans associated with the TD Bank branch acquisition and one-year put back period for delinquent loans associated with the Federal Trust Corporation transaction
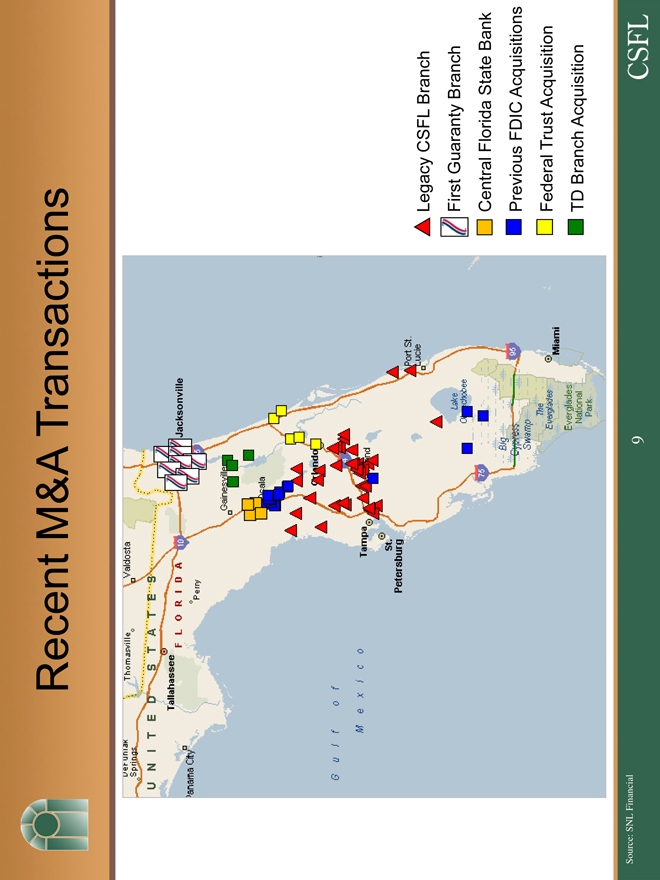
Recent M&A Transactions
Legacy CSFL Branch
First Guaranty Branch Central Florida State Bank
Previous FDIC Acquisitions
Federal Trust Acquisition TD Branch Acquisition
Source: SNL Financial 9
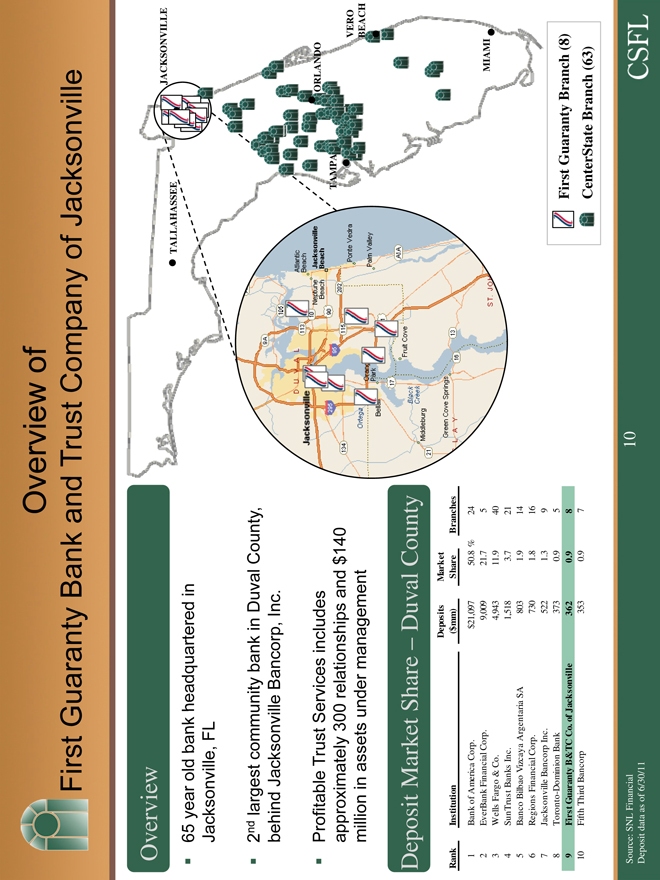
Overview of
First Guaranty Bank and Trust Company of Jacksonville
Rank Institution ($mm) Share Branches
1 Bank of America Corp. $21,097 50.8 % 24
2 EverBank Financial Corp. 9,009 21.7 5
3 Wells Fargo & Co. 4,943 11.9 40
4 SunTrust Banks Inc. 1,518 3.7 21
5 Banco Bilbao Vizcaya Argentaria SA 803 1.9 14
6 Regions Financial Corp. 730 1.8 16
7 Jacksonville Bancorp Inc. 522 1.3 9
8 Toronto-Dominion Bank 373 0.9 5
9 First Guaranty B&TC Co. of Jacksonville 362 0.9 8
10 Fifth Third Bancorp 353 0.9 7
Overview
65 year old bank headquartered in Jacksonville, FL
2nd largest community bank in Duval County, behind Jacksonville Bancorp, Inc.
Profitable Trust Services includes approximately 300 relationships and $140 million in assets under management
JACKSONVILLE TALLAHASSEE
ORLANDO TAMPA
VERO BEACH MIAMI
First Guaranty Branch (8)
CenterState Branch (63)
Source: SNL Financial Deposit data as of 6/30/11
Deposit Market Share — Duval County
Deposits Market
10
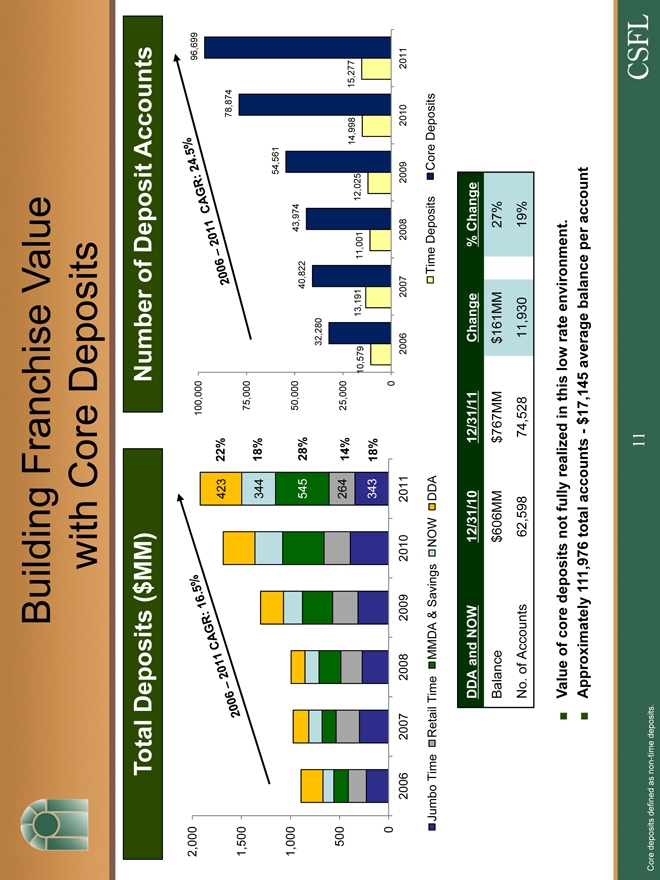
Building Franchise Value with Core Deposits
Total Deposits ($MM)
Number of Deposit Accounts
2,000
423 22%
1,500
344 18%
1,000
545 28%
500 264 14%
343 18%
0
2006 2007 2008 2009 2010 2011
100,000 96,699
78,874
75,000
54,561
50,000 43,974
40,822
32,280
25,000
14,998 15,277
10,579 13,191 11,001 12,025
0
2006 2007 2008 2009 2010 2011
Jumbo Time Retail Time MMDA & Savings NOW DDA Time Deposits Core Deposits
DDA and NOW 12/31/10 12/31/11 Change % Change
Balance $606MM $767MM $161MM 27%
No. of Accounts 62,598 74,528 11,930 19%
Value of core deposits not fully realized in this low rate environment.
Approximately 111,976 total accounts—$17,145 average balance per account
Core deposits defined as non-time deposits.
2006 – 2011 CAGR: 16.5%
2006 – 2011 CAGR: 24.5%
11
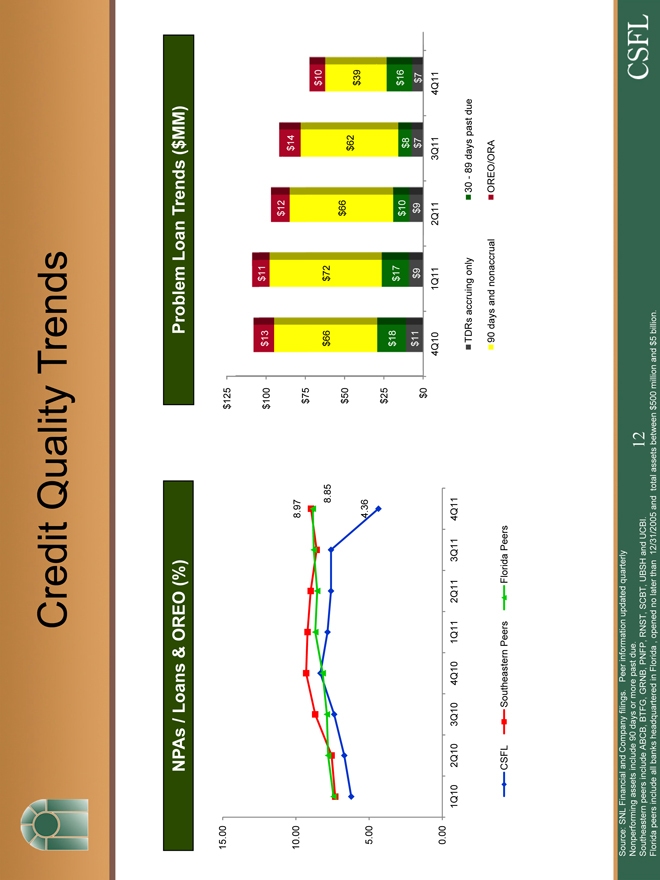
Credit Quality Trends
NPAs / Loans & OREO (%)
15.00
10.00 8.97
8.85
5.00 4.36
0.00
1Q10 2Q10 3Q10 4Q10 1Q11 2Q11 3Q11 4Q11
Problem Loan Trends ($MM)
$125
$100 $13 $11
$12
$14
$75
$10
$66 $72
$50 $66 $62
$39
$25
$18 $17
$10 $8 $16
$0 $11 $9 $9 $7 $7
4Q10 1Q11 2Q11 3Q11 4Q11
TDRs accruing only 30—89 days past due
90 days and nonaccrual OREO/ORA
Source: SNL Financial and Company filings. Peer information updated quarterly
Nonperforming assets include 90 days or more past due.
Southeastern peers include ABCB, BTFG, GRNB, PNFP, RNST, SCBT, UBSH and UCBI.
Florida peers include all banks headquartered in Florida , opened no later than 12/31/2005 and total assets between $500 million and $5 billion.
CSFL Southeastern Peers Florida Peers
12
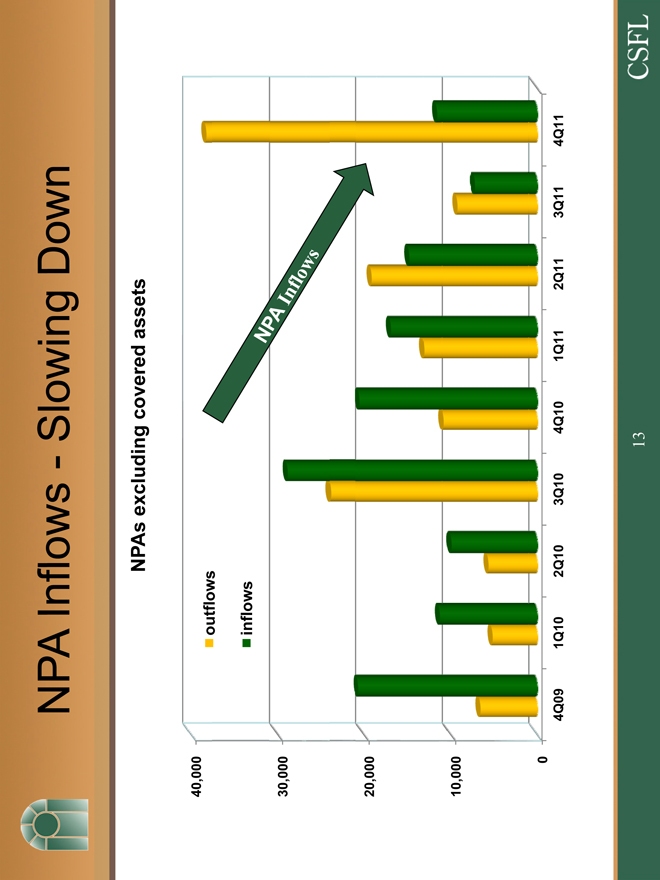
NPA Inflows—Slowing Down
NPAs excluding covered assets
40,000
outflows
inflows
30,000
20,000
10,000
0
4Q09 1Q10 2Q10 3Q10 4Q10 1Q11 2Q11 3Q11 4Q11
NPA Inflows
13
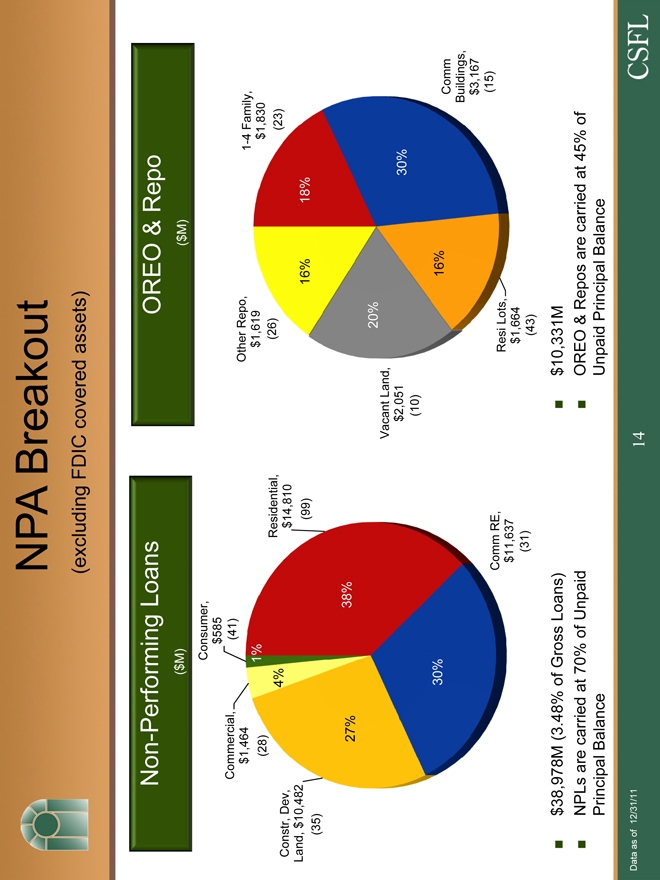
NPA Breakout
(excluding FDIC covered assets)
$38,978M (3.48% of Gross Loans) $10,331M
NPLs are carried at 70% of Unpaid OREO & Repos are carried at 45% of
Principal Balance Unpaid Principal Balance
Data as of 12/31/11
Non-Performing Loans
($M)
OREO & Repo
($M)
Consumer, $585 Commercial, (41) $1,464
Constr, Dev, 4% Residential, Land, $10,482 $14,810
27% 38%
30%
Comm RE, $11,637 (31)
Other Repo, 1-4 Family, $1,619 $1,830 (26) (23)
16% 18%
Vacant Land, 20%
$2,051 30% (10) 16%
Comm Buildings,
$3,167
Resi Lots,
$1,664 (43)
14
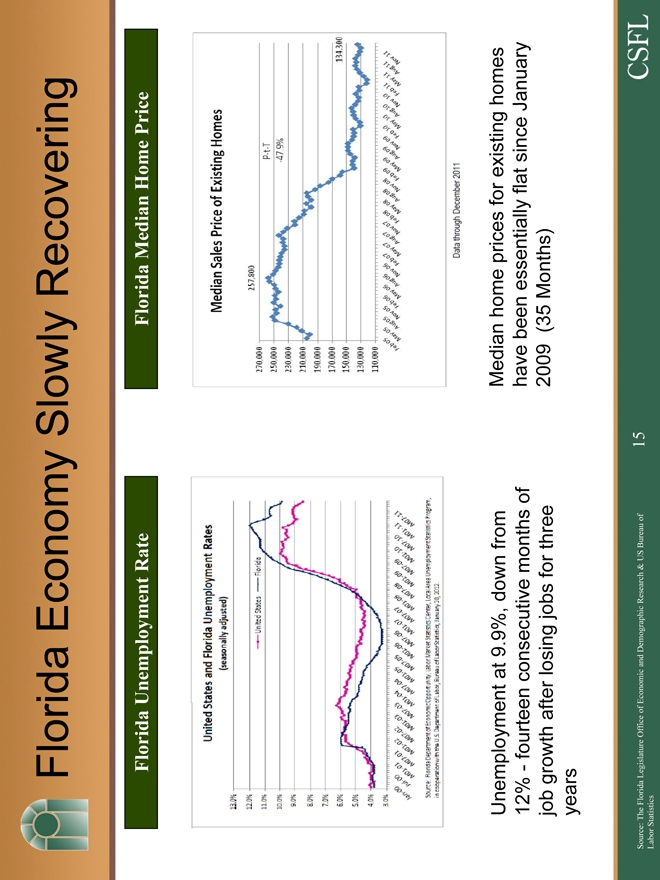
Florida Economy Slowly Recovering
Florida Unemployment Rate
Florida Median Home Price
Unemployment at 9.9%, down from 12%—fourteen consecutive months of job growth after losing jobs for three years
Median home prices for existing homes have been essentially flat since January 2009 (35 Months)
Source: The Florida Legislature Office of Economic and Demographic Research & US Bureau of Labor Statistics
15
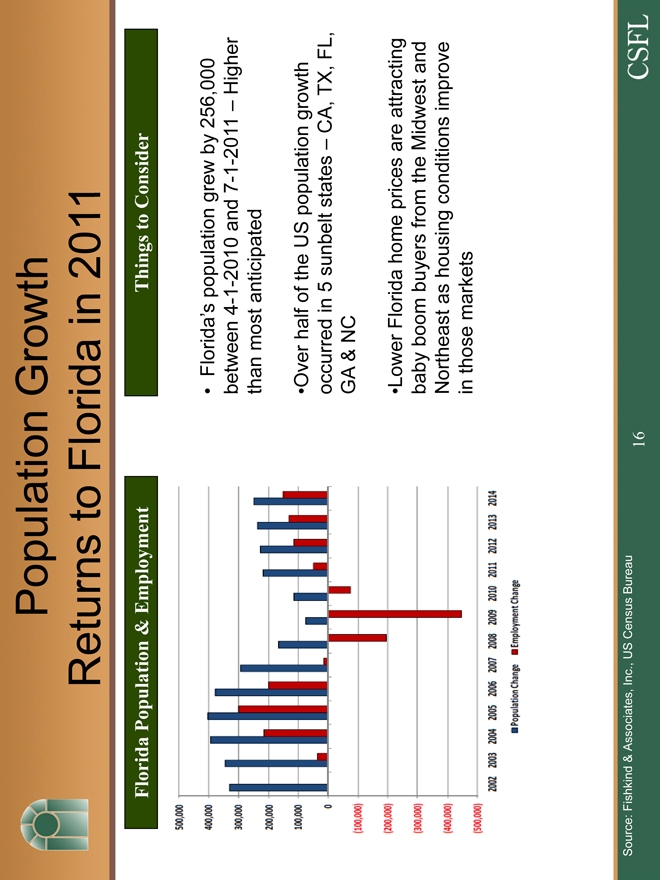
Population Growth Returns to Florida in 2011
Source: Fishkind & Associates, Inc., US Census Bureau
16
Florida Population & Employment
Things to Consider
• Florida ‘s population grew by 256,000 between 4-1-2010 and 7-1-2011 – Higher than most anticipated
•Over half of the US population growth occurred in 5 sunbelt states – CA, TX, FL, GA & NC
•Lower Florida home prices are attracting baby boom buyers from the Midwest and Northeast as housing conditions improve in those markets
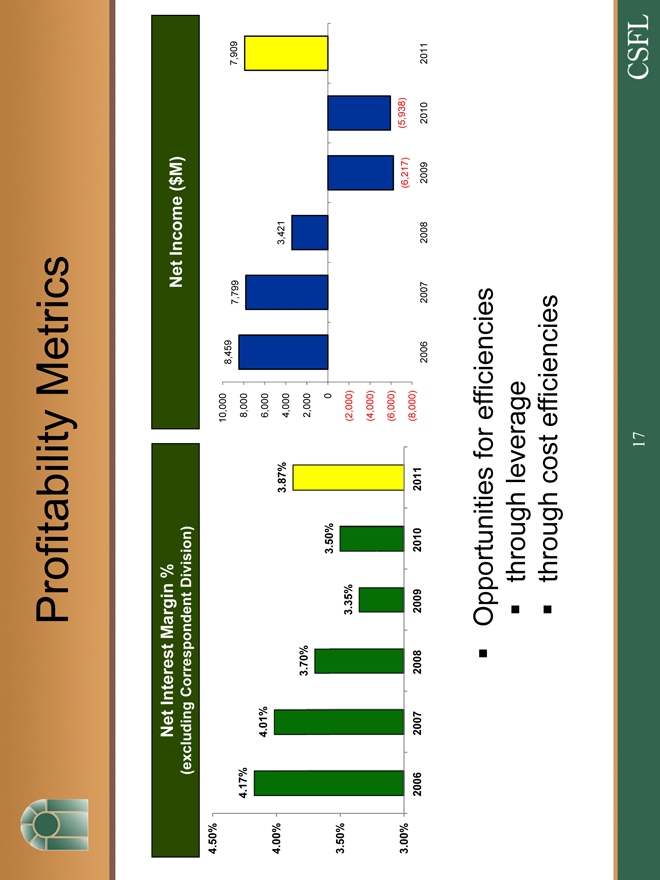
Profitability y Metrics
Opportunities for efficiencies
through leverage
through cost efficiencies
Net Interest Margin %
(excluding Correspondent Division)
Net Income ($M)
4.50%
4.17%
4.01%
4.00% 3.87%
3.70%
3.50%
3.50%
3.35%
3.00%
2006 2007 2008 2009 2010 2011
10,000 8,459
7,799 7,909
8,000
6,000
4,000 3,421
2,000
0
(2,000)
(4,000)
(6,000)
(6,217) (5,938)
(8,000)
2006 2007 2008 2009 2010 2011
17
Summary
Lifetime local bankers with common lineage and vision
Nearly all of the recent growth is guaranteed by the United States Government or a major financial institution
Senior management added in anticipation of growth
Focus on efficiencies in 2012
A consolidator of banks
18
Appendix
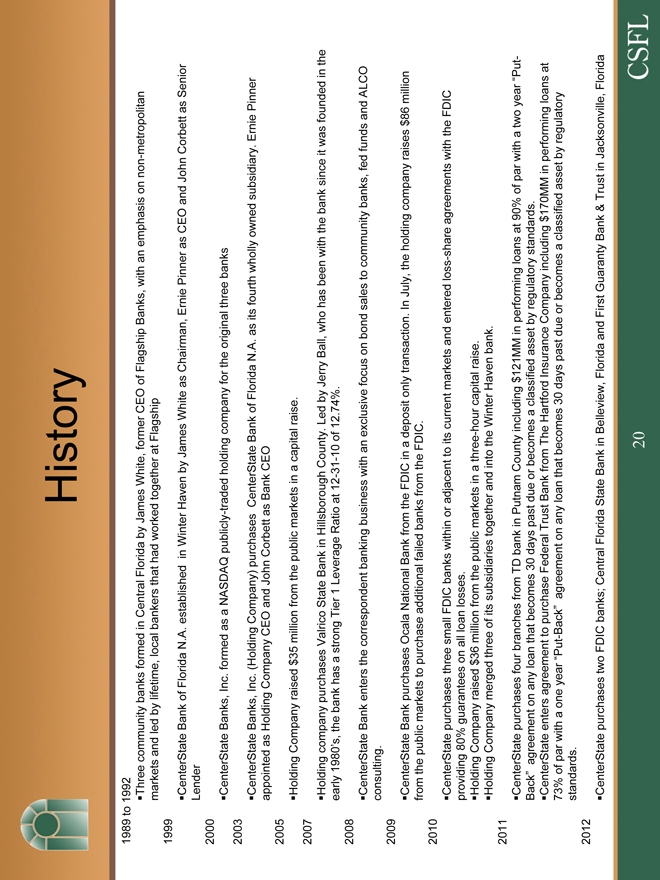
History
1989 to 1992
Three community banks formed in Central Florida by James White, former CEO of Flagship Banks, with an emphasis on non-metropolitan markets and led by lifetime, local bankers that had worked together at Flagship
1999
CenterState Bank of Florida N.A. established in Winter Haven by James White as Chairman, Ernie Pinner as CEO and John Corbett as Senior Lender
2000
CenterState Banks, Inc. formed as a NASDAQ publicly-traded holding company for the original three banks
2003
CenterState Banks, Inc. (Holding Company) purchases CenterState Bank of Florida N.A. as its fourth wholly owned subsidiary. Ernie Pinner appointed as Holding Company CEO and John Corbett as Bank CEO
2005
Holding Company raised $35 million from the public markets in a capital raise.
2007
Holding company purchases Valrico State Bank in Hillsborough County. Led by Jerry Ball, who has been with the bank since it was founded in the early 1980’s, the bank has a strong Tier 1 Leverage Ratio at 12-31-10 of 12.74%.
2008
CenterState Bank enters the correspondent banking business with an exclusive focus on bond sales to community banks, fed funds and ALCO consulting.
2009
CenterState Bank purchases Ocala National Bank from the FDIC in a deposit only transaction. In July, the holding company raises $86 million from the public markets to purchase additional failed banks from the FDIC.
2010
CenterState purchases three small FDIC banks within or adjacent to its current markets and entered loss-share agreements with the FDIC providing 80% guarantees on all loan losses.
Holding Company raised $36 million from the public markets in a three-hour capital raise. Holding Company merged three of its subsidiaries together and into the Winter Haven bank.
2011
CenterState purchases four branches from TD bank in Putnam County including $121MM in performing loans at 90% of par with a two year “Put-Back” agreement on any loan that becomes 30 days past due or becomes a classified asset by regulatory standards.
CenterState enters agreement to purchase Federal Trust Bank from The Hartford Insurance Company including $170MM in performing loans at 73% of par with a one year “Put-Back” agreement on any loan that becomes 30 days past due or becomes a classified asset by regulatory standards.
2012
CenterState purchases two FDIC banks; Central Florida State Bank in Belleview, Florida and First Guaranty Bank & Trust in Jacksonville, Florida
20
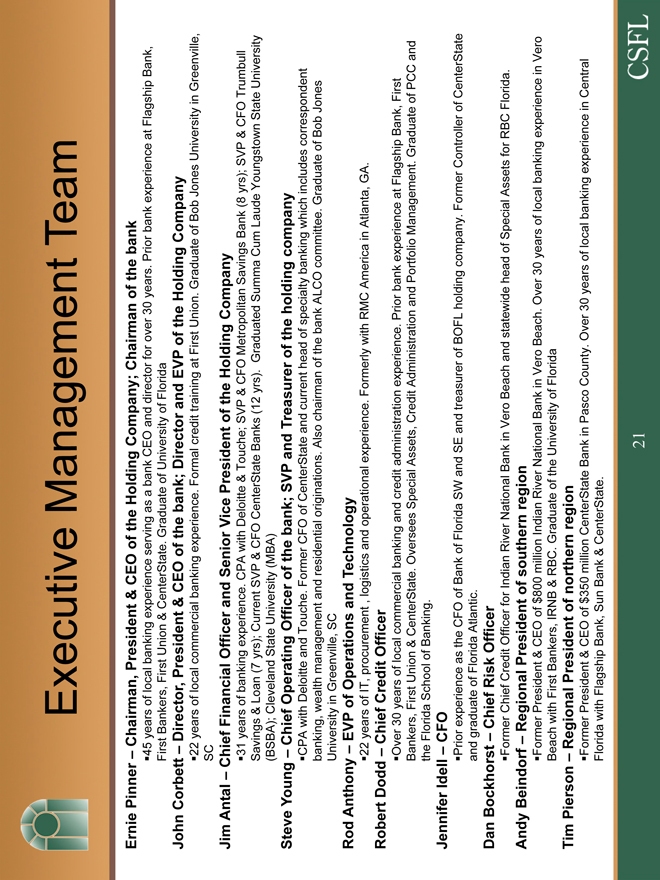
Executive Management Team
Ernie Pinner – Chairman, President & CEO of the Holding Company; Chairman of the bank
45 years of local banking experience serving as a bank CEO and director for over 30 years. Prior bank experience at Flagship Bank,
First Bankers, First Union & CenterState. Graduate of University of Florida
John Corbett – Director, President & CEO of the bank; Director and EVP of the Holding Company
22 years of local commercial banking experience. Formal credit training at First Union. Graduate of Bob Jones University in Greenville, SC
Jim Antal – Chief Financial Officer and Senior Vice President of the Holding Company
31 years of banking experience. CPA with Deloitte & Touche; SVP & CFO Metropolitan Savings Bank (8 yrs); SVP & CFO Trumbull
Savings & Loan (7 yrs); Current SVP & CFO CenterState Banks (12 yrs). Graduated Summa Cum Laude Youngstown State University
(BSBA); Cleveland State University (MBA)
Steve Young – Chief Operating Officer of the bank; SVP and Treasurer of the holding company
CPA with Deloitte and Touche. Former CFO of CenterState and current head of specialty banking which includes correspondent banking, wealth management and residential originations. Also chairman of the bank ALCO committee. Graduate of Bob Jones
University in Greenville, SC
Rod Anthony – EVP of Operations and Technology
22 years of IT, procurement , logistics and operational experience. Formerly with RMC America in Atlanta, GA.
Robert Dodd – Chief Credit Officer
Over 30 years of local commercial banking and credit administration experience. Prior bank experience at Flagship Bank, First
Bankers, First Union & CenterState. Oversees Special Assets, Credit Administration and Portfolio Management. Graduate of PCC and the Florida School of Banking.
Jennifer Idell – CFO
Prior experience as the CFO of Bank of Florida SW and SE and treasurer of BOFL holding company. Former Controller of CenterState and graduate of Florida Atlantic.
Dan Bockhorst – Chief Risk Officer
Former Chief Credit Officer for Indian River National Bank in Vero Beach and statewide head of Special Assets for RBC Florida.
Andy Beindorf – Regional President of southern region
Former President & CEO of $800 million Indian River National Bank in Vero Beach. Over 30 years of local banking experience in Vero Beach with First Bankers, IRNB & RBC. Graduate of the University of Florida
Tim Pierson – Regional President of northern region
Former President & CEO of $350 million CenterState Bank in Pasco County. Over 30 years of local banking experience in Central Florida with Flagship Bank, Sun Bank & CenterState.
21
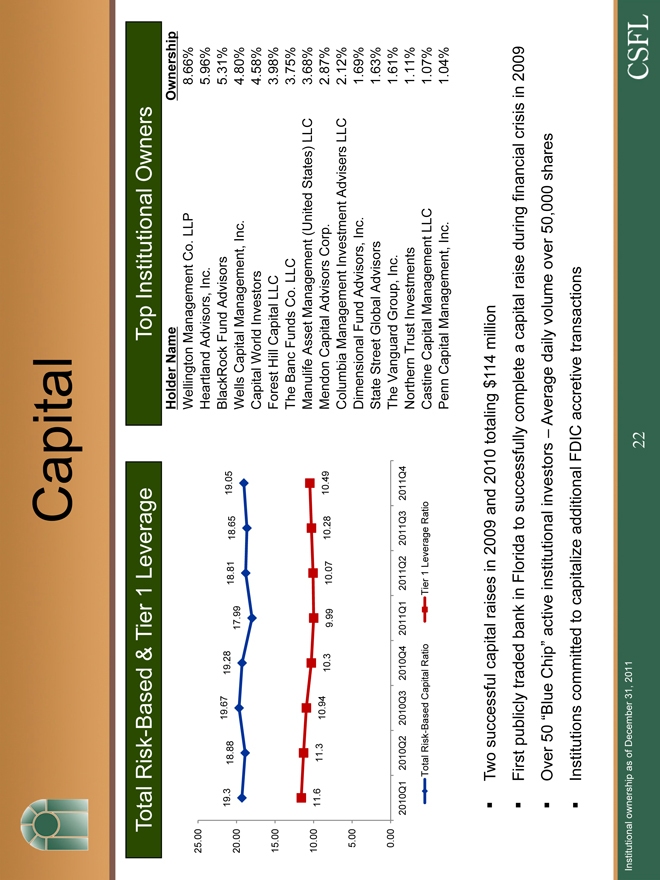
Capital
Total Risk-Based & Tier 1 Leverage Top Institutional Owners
Holder Name Ownership
Wellington Management Co. LLP 8.66%
25.00 Heartland Advisors, Inc. 5.96%
19.3 18.88 19.67 19.28 18.81 18.65 19.05 BlackRock Fund Advisors 5.31%
20.00 17.99 Wells Capital Management, Inc. 4.80%
Capital World Investors 4.58%
15.00 Forest Hill Capital LLC 3.98%
The Banc Funds Co. LLC 3.75%
Manulife Asset Management (United States) LLC 3.68%
10.00 11.6 11.3 10.94 10.3 9.99 10.07 10.28 10.49 Mendon Capital Advisors Corp. 2.87%
Columbia Management Investment Advisers LLC 2.12%
5.00 Dimensional Fund Advisors, Inc. 1.69%
State Street Global Advisors 1.63%
0.00 The Vanguard Group, Inc. 1.61%
2010Q1 2010Q2 2010Q3 2010Q4 2011Q1 2011Q2 2011Q3 2011Q4 Northern Trust Investments 1.11%
Total Risk-Based Capital Ratio Tier 1 Leverage Ratio Castine Capital Management LLC 1.07%
Penn Capital Management, Inc. 1.04%
Two successful capital raises in 2009 and 2010 totaling $114 million
First publicly traded bank in Florida to successfully complete a capital raise during financial crisis in 2009
Over 50 “Blue Chip” active institutional investors – Average daily volume over 50,000 shares
Institutions committed to capitalize additional FDIC accretive transactions
Institutional ownership as of December 31, 2011
22
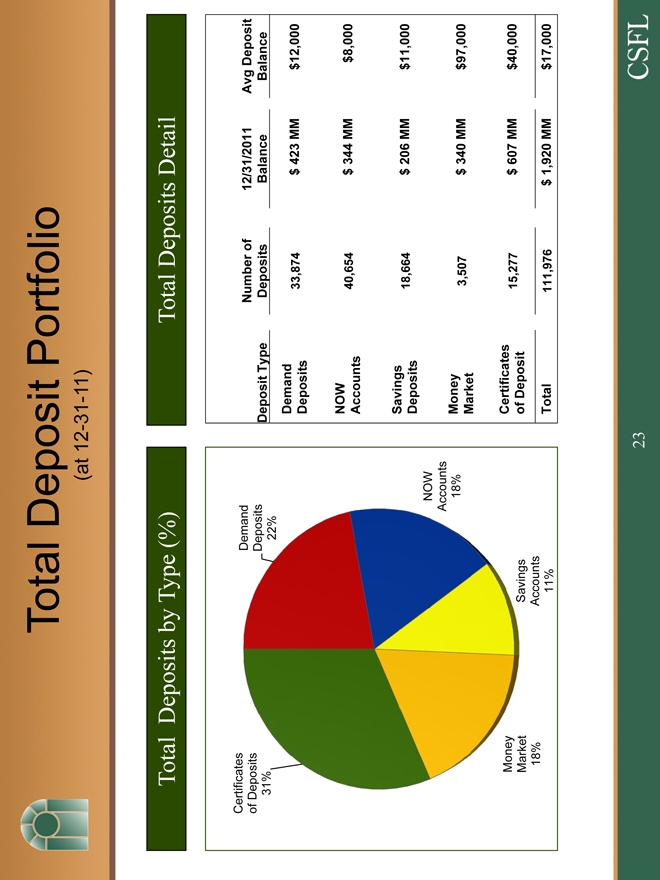
Total Deposit Portfolio
(at 12-31-11)
Total Deposits by Type (%)
Total Deposits Detail
Certificates Demand
of Deposits Deposits
31% 22%
NOW
Accounts
18%
Money
Market Savings
18% Accounts
11%
Number of 12/31/2011 Avg Deposit
Deposit Type Deposits Balance Balance
Demand
Deposits 33,874 $ 423 MM $12,000
NOW
Accounts 40,654 $ 344 MM $8,000
Savings
Deposits 18,664 $ 206 MM $11,000
Money
Market 3,507 $ 340 MM $97,000
Certificates
of Deposit 15,277 $ 607 MM $40,000
Total 111,976 $ 1,920 MM $17,000
23
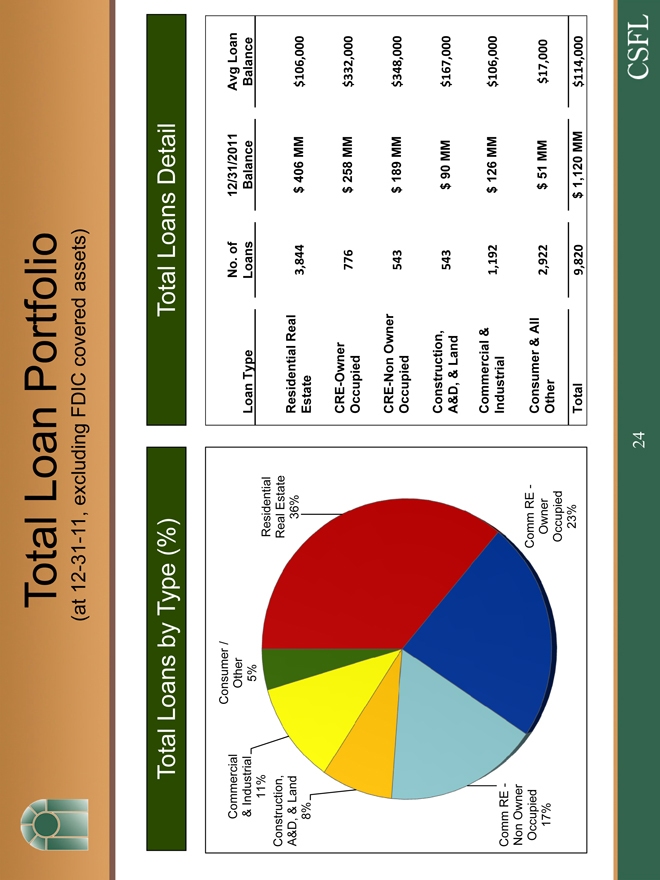
Total Loan Portfolio
(at 12-31-11, excluding FDIC covered assets)
Total Loans by Type (%)
Total Loans Detail
Consumer /
Commercial Other
& Industrial 5%
11% Residential
Construction, Real Estate
A&D, & Land 36%
8%
Comm RE—
Non Owner
Occupied Comm RE -
17% Owner
Occupied
23%
No. of 12/31/2011 Avg Loan
Loan Type Loans Balance Balance
Residential Real
Estate 3,844 $ 406 MM $106,000
CRE-Owner
Occupied 776 $ 258 MM $332,000
CRE-Non Owner
Occupied 543 $ 189 MM $348,000
Construction,
A&D, & Land 543 $ 90 MM $167,000
Commercial &
Industrial 1,192 $ 126 MM $106,000
Consumer & All
Other 2,922 $ 51 MM $17,000
Total 9,820 $ 1,120 MM $114,000
24
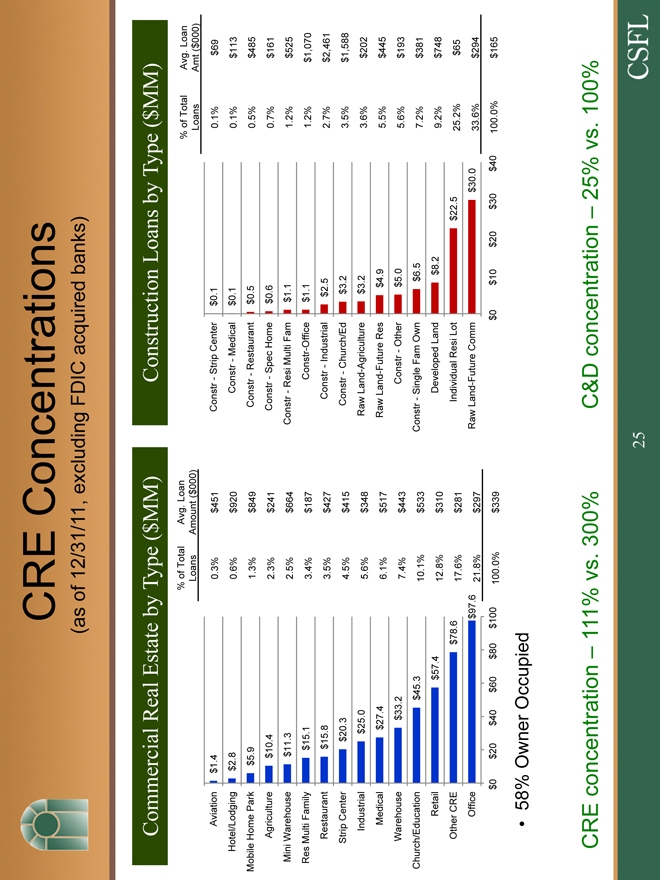
CRE Concentrations
(as of 12/31/11, excluding FDIC acquired banks)
Commercial Real Estate by Type ($MM)
% of Total Avg. Loan
Loans Amount ($000)
Aviation $1.4 0.3% $451
Hotel/Lodging $2.8 0.6% $920
Mobile Home Park $5.9 1.3% $849
Agriculture $10.4 2.3% $241
Mini Warehouse $11.3 2.5% $664
Res Multi Family $15.1 3.4% $187
Restaurant $15.8 3.5% $427
Strip Center $20.3 4.5% $415
Industrial $25.0 5.6% $348
Medical $27.4 6.1% $517
Warehouse $33.2 7.4% $443
Church/Education $45.3 10.1% $533
Retail $57.4 12.8% $310
Other CRE $78.6 17.6% $281
Office $97.6 21.8% $297
$0 $20 $40 $60 $80 $100 100.0% $339
Construction Loans by Type ($MM)
% of Total Avg. Loan
Loans Amt ($000)
Constr—Strip Center $0.1 0.1% $69
Constr—Medical $0.1 0.1% $113
Constr—Restaurant $0.5 0.5% $485
Constr—Spec Home $0.6 0.7% $161
Constr—Resi Multi Fam $1.1 1.2% $525
Constr-Office $1.1 1.2% $1,070
Constr—Industrial $2.5 2.7% $2,461
Constr—Church/Ed $3.2 3.5% $1,588
Raw Land-Agriculture $3.2 3.6% $202
Raw Land-Future Res $4.9 5.5% $445
Constr—Other $5.0 5.6% $193
Constr—Single Fam Own $6.5 7.2% $381
Developed Land $8.2 9.2% $748
Individual Resi Lot $22.5 25.2% $65
Raw Land-Future Comm $30.0 33.6% $294
$0 $10 $20 $30 $40 100.0% $165
58% Owner Occupied
CRE concentration – 111% vs. 300%
C&D concentration – 25% vs. 100%
25